Impact of Geopolitical and International Trade Dynamics on Corporate Vulnerability and Insolvency Risk: A Graph-Based Approach


Abstract

1. Introduction
1.1. Structural Characteristics of the Global Economic Network, Transmission of Dependencies, and Mechanisms of Bankruptcy Propagation
1.2. Business Network and Corporate Bankruptcies
2. Objective
3. Theoretical Framework
4. Methodology
4.1. Research Design
4.2. Data Sources and Variables
4.3. Descriptive Analysis
4.3.1. Descriptive Analysis of Export Data
4.3.2. Descriptive Analysis of Bankruptcies
4.3.3. Descriptive Analysis of Insolvency Resolution Time
4.4. Data Processing
- Missing data removal. First, records with incomplete or null data were removed, thus ensuring the integrity of the dataset. A manual verification was subsequently performed to identify errors or inconsistencies in the values.
- Standardization of country names. To ensure consistency in handling international data, country names were normalized using the ISO-3 code, thereby avoiding duplications or discrepancies due to spelling variations or alternative names.
- Temporal organization of the data. The data from each set were organized chronologically, ensuring that the information for the selected years (2013–2024 for trade and 2015–2023 for bankruptcies) was correctly temporally aligned. This structuring is essential for conducting an accurate longitudinal analysis.
4.5. Models and Techniques for the Integration of Trade and Financial Data
4.5.1. Network Establishment
- Nodes represent individual countries.
- Directed edges indicate export relationships between countries.
- The weight of each edge reflects the annual export volume.
4.5.2. Topological Analysis
4.5.3. Community Detection: Louvain Algorithm
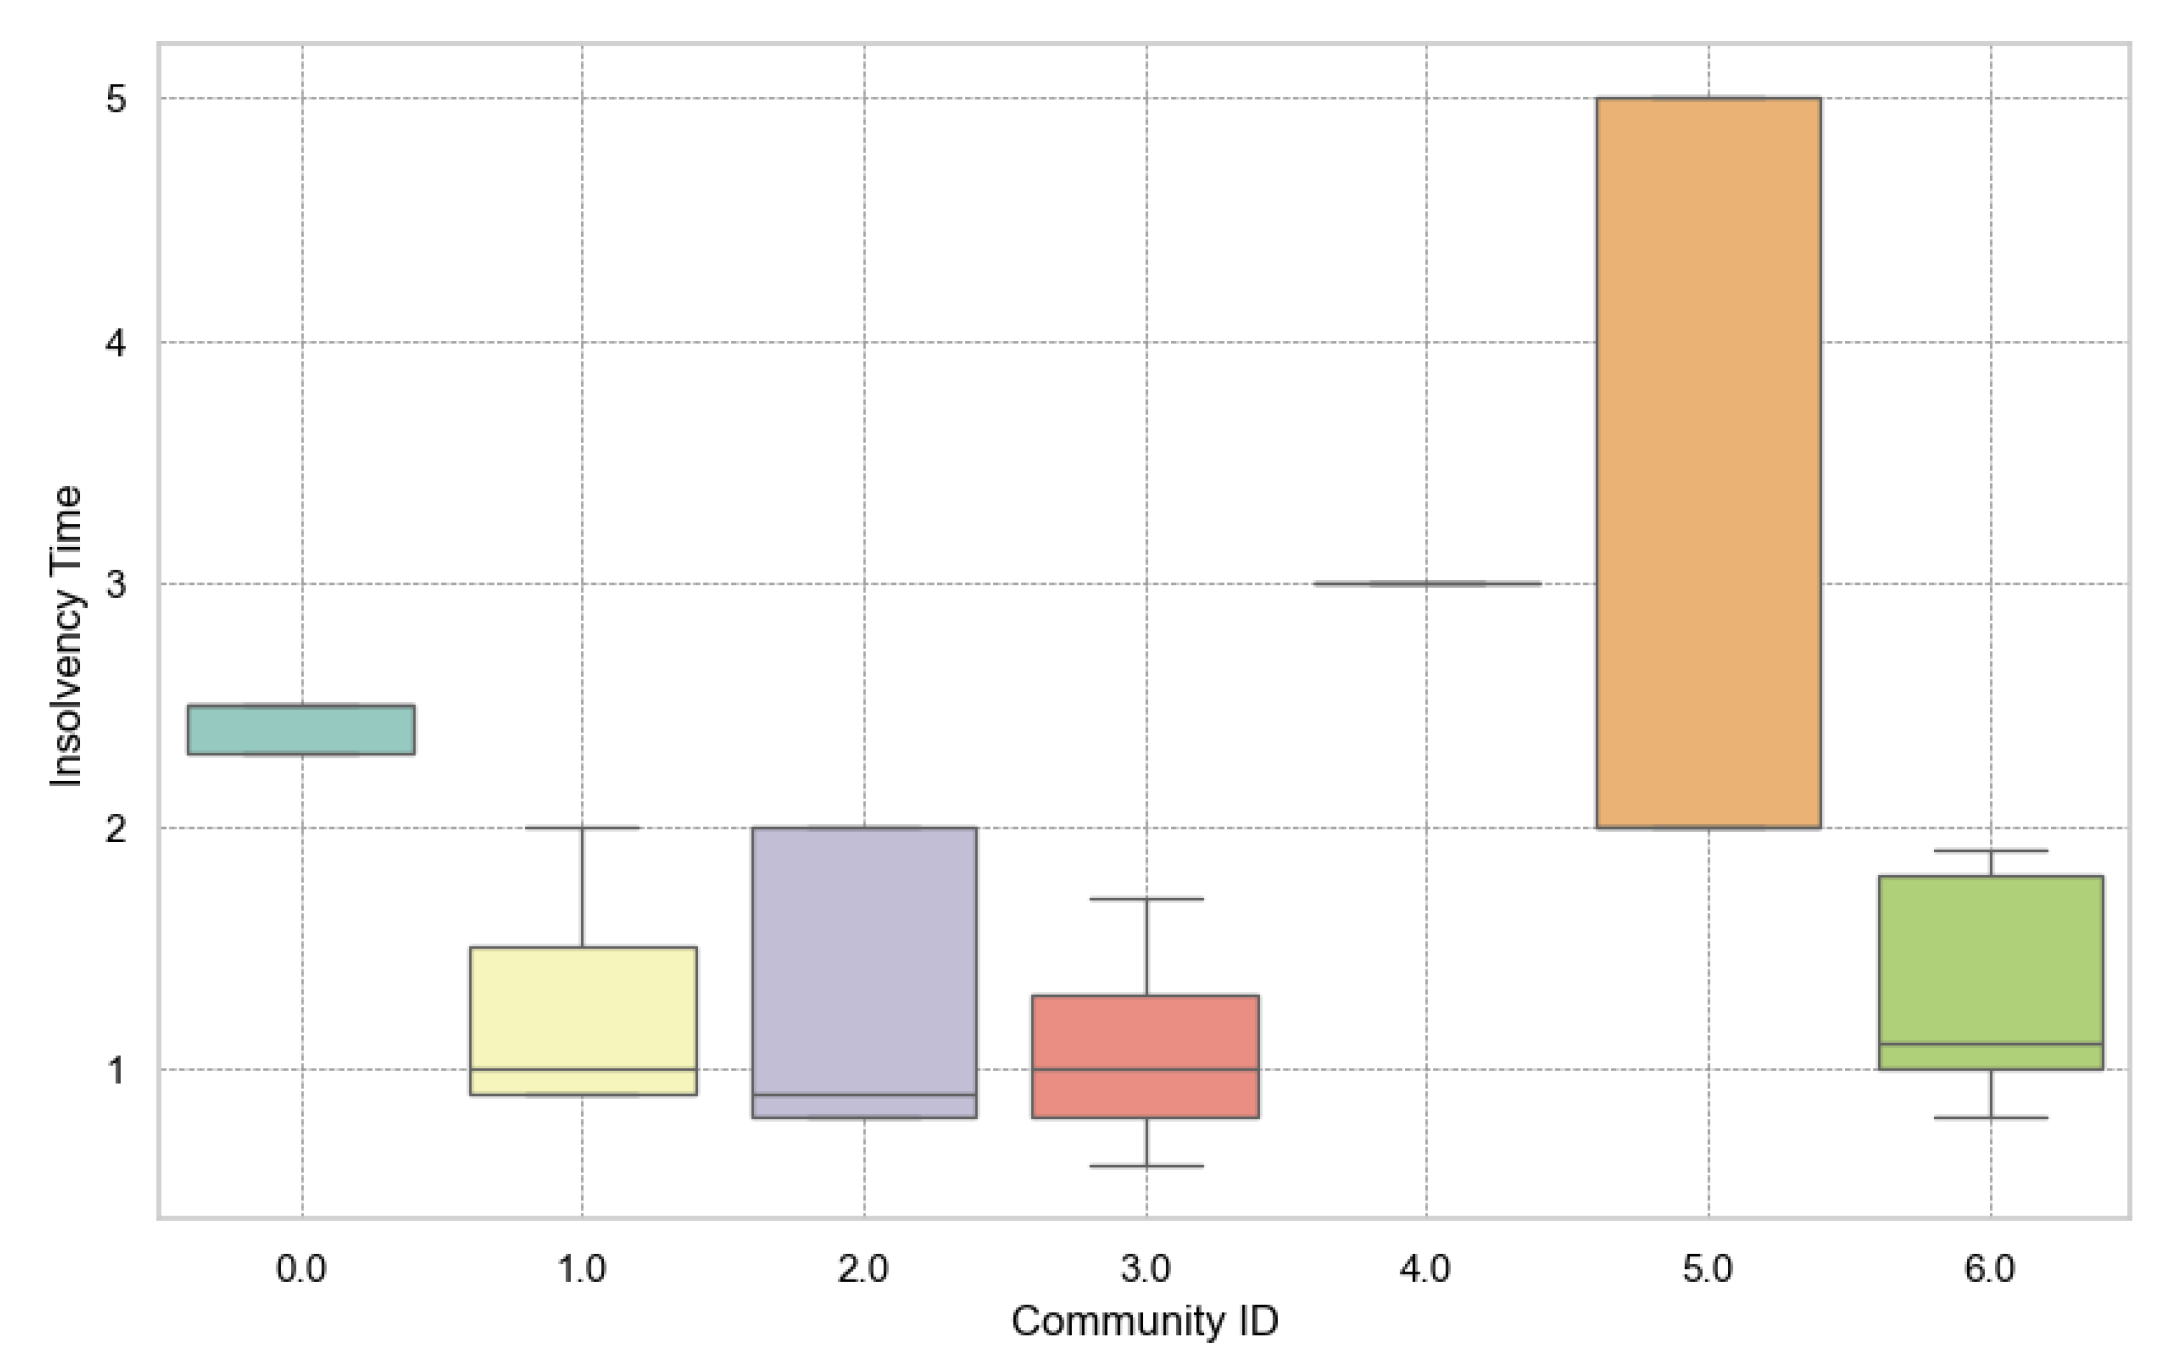
4.5.4. Community Analysis and Bankruptcy Resolution Times
4.5.5. Modeling the Trade–Insolvency Relationship
- OLS regression: used to explore linear relationships between centrality indicators and the number of bankruptcies.
- Nonlinear models: Since trade influence may not be strictly linear, advanced methods are employed:
- -
- Random forest: captures complex interactions and nonlinear relationships.
- -
- Artificial neural networks (ANNs): models intricate patterns that may emerge from the interaction of multiple centrality metrics.
- denotes the value of the economic variable of interest (such as the number of business bankruptcies) for country i;
- is the mean of the variable across all countries;
- are spatial weights representing the degree of geographical or economic connection between countries i and j (e.g., neighborhood relationships or trade intensity);
- n is the total number of countries included in the analysis.
5. Results
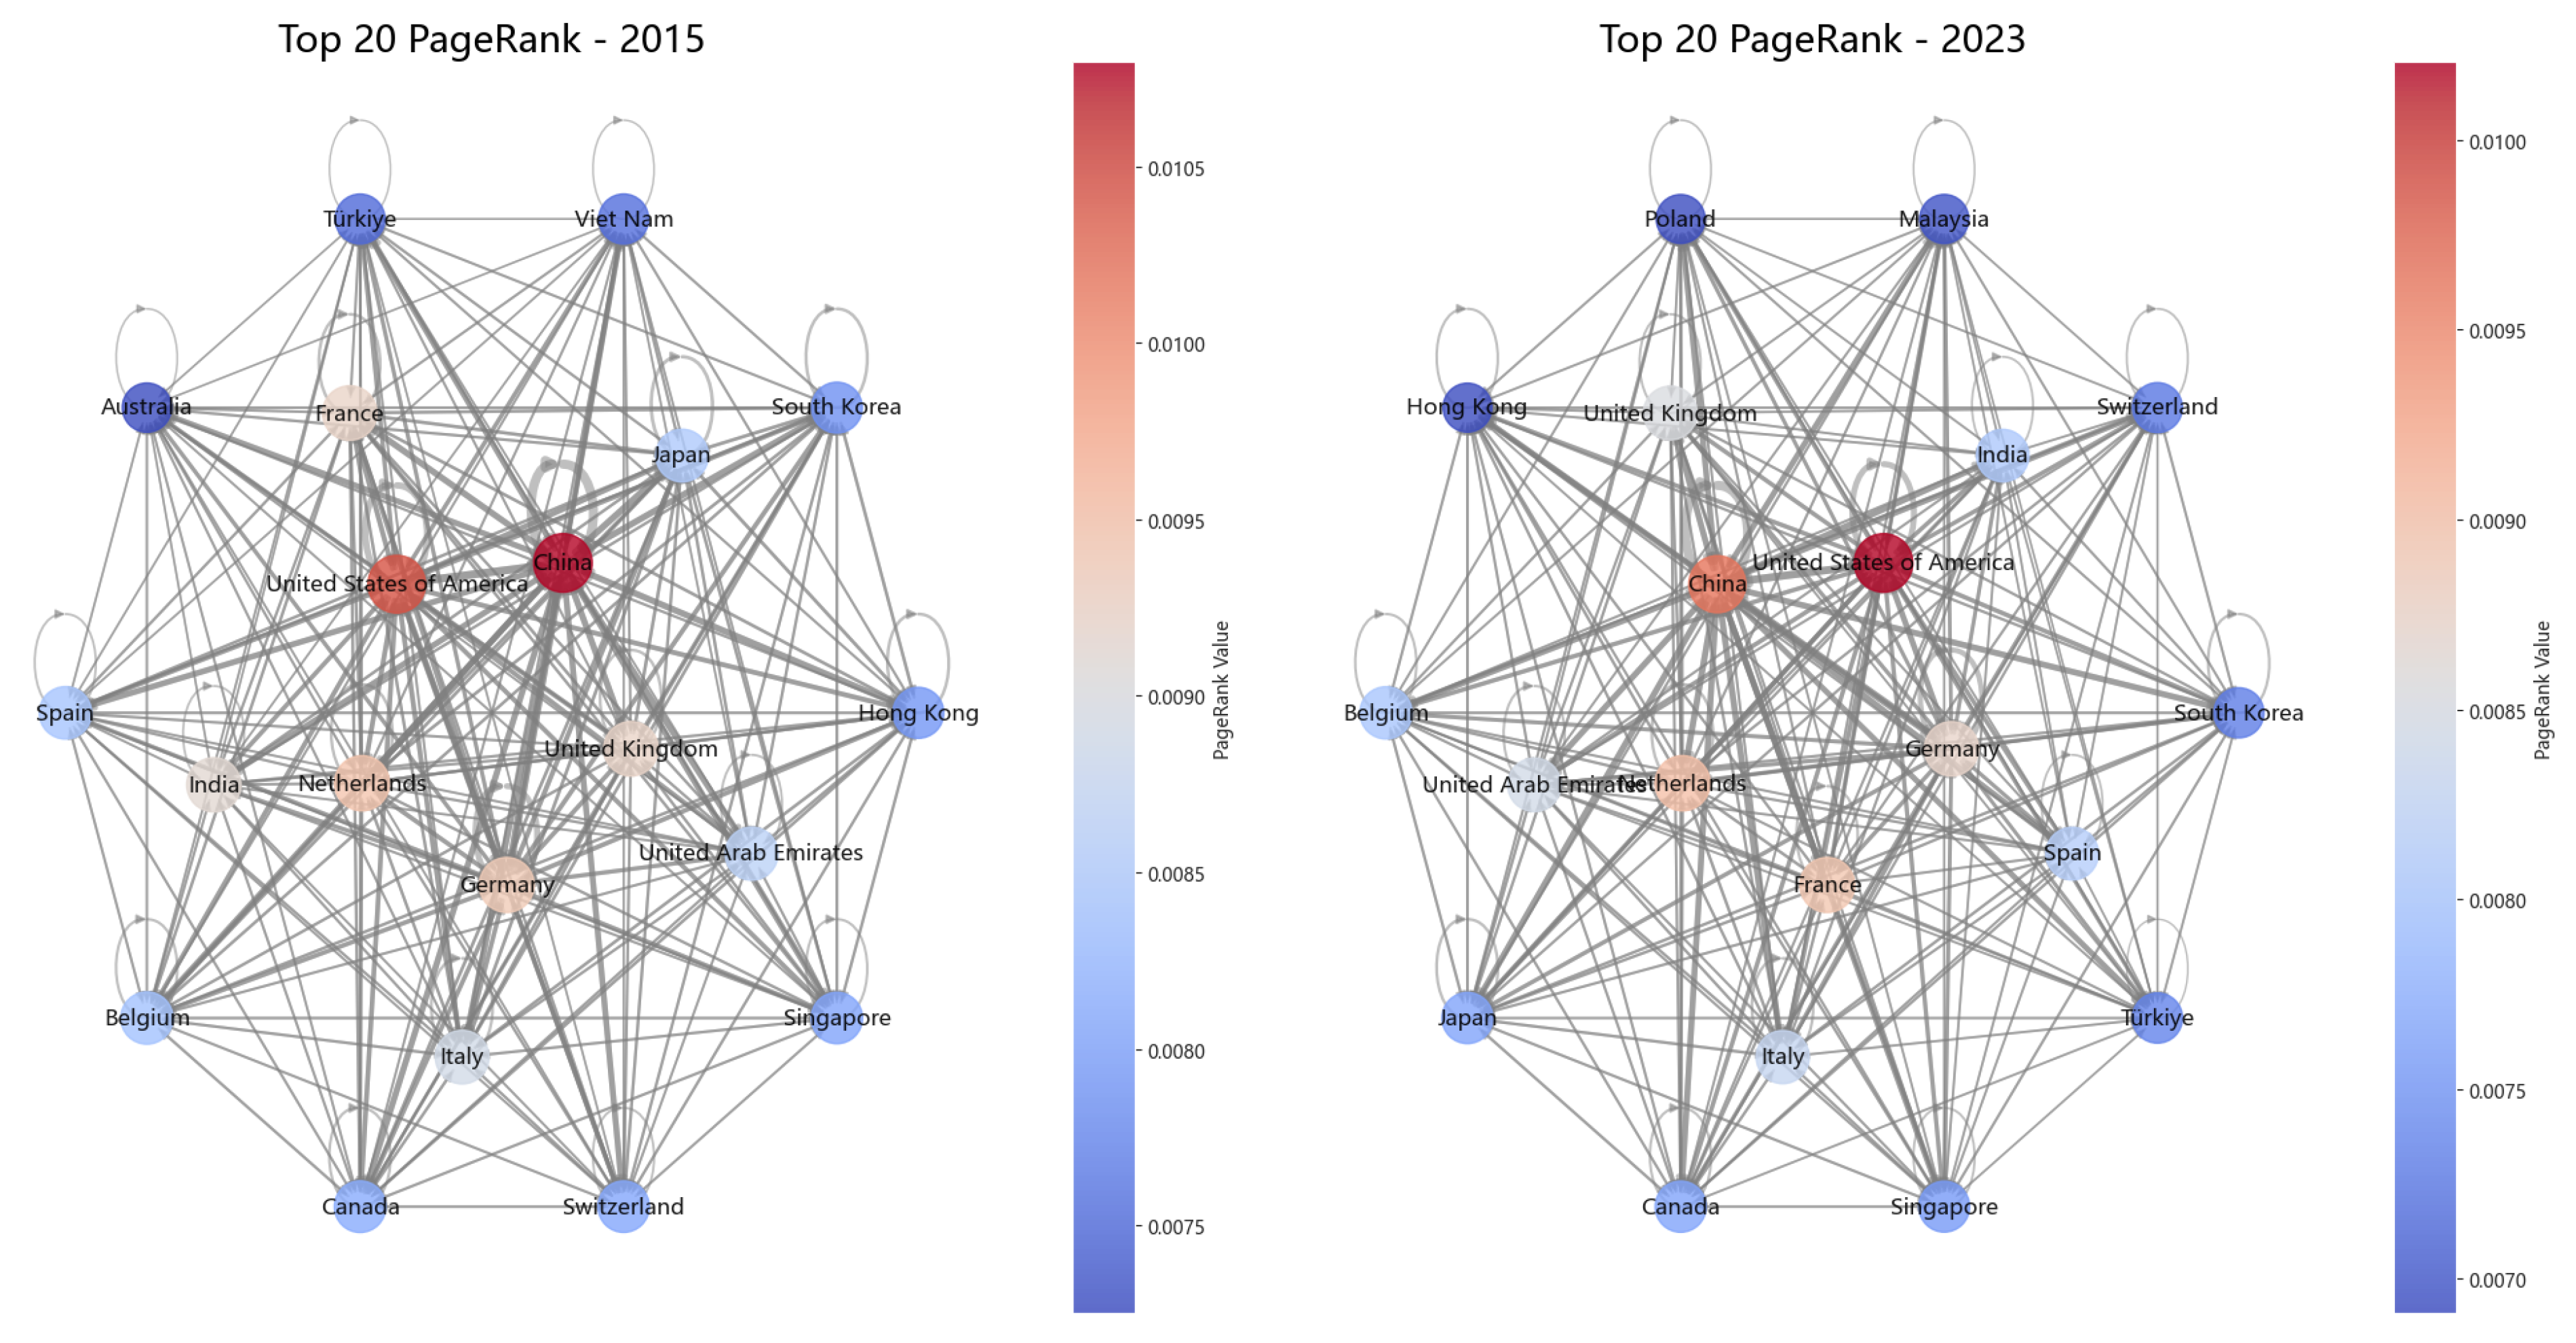
5.1. The Evolution of the Global Trade Network (2015–2023)
The Evolution of the Trade Position Between China and the United States
5.2. The Manifestation of the “Deglobalization” Trend in the Trade Network
5.2.1. Brexit: A Setback in European Integration
5.2.2. The COVID-19 Pandemic: A Temporary but Symmetric Disruption
5.2.3. The War Between Russia and Ukraine: Reconfiguration of the Trade Network
5.3. Analysis of Country Centrality in the Global Trade Network (2023)
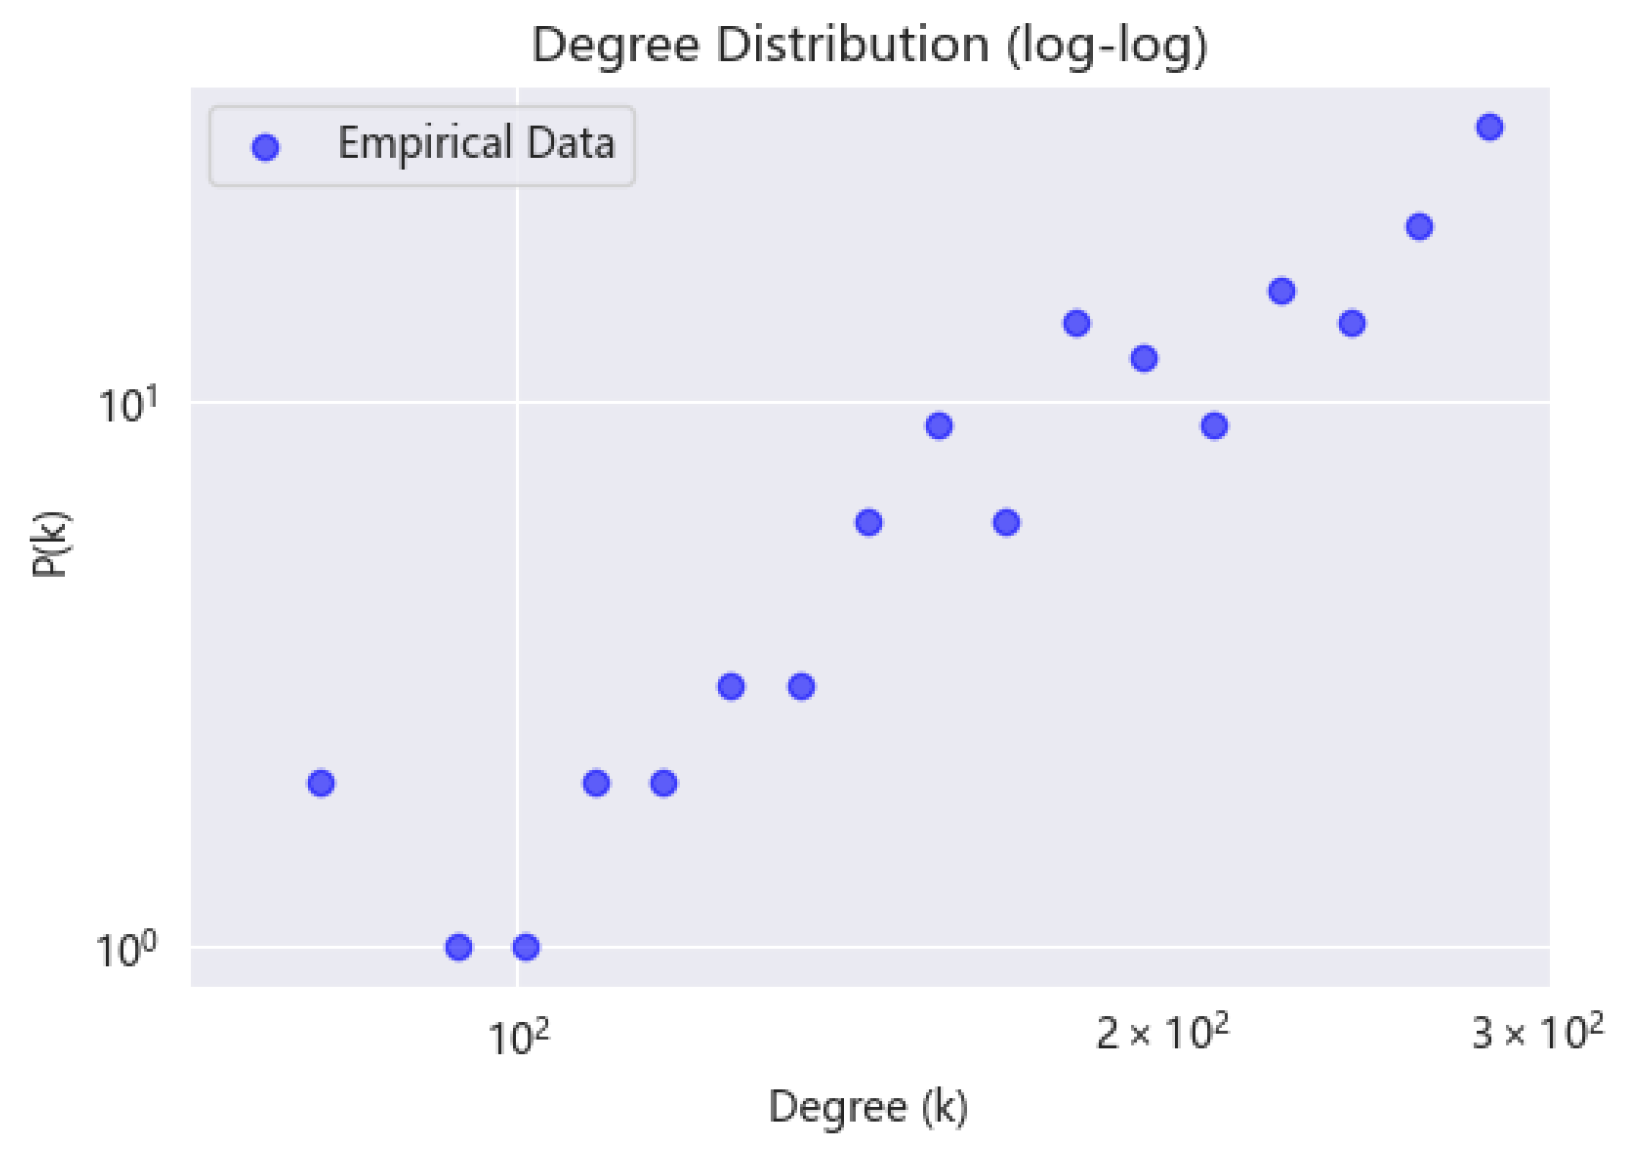
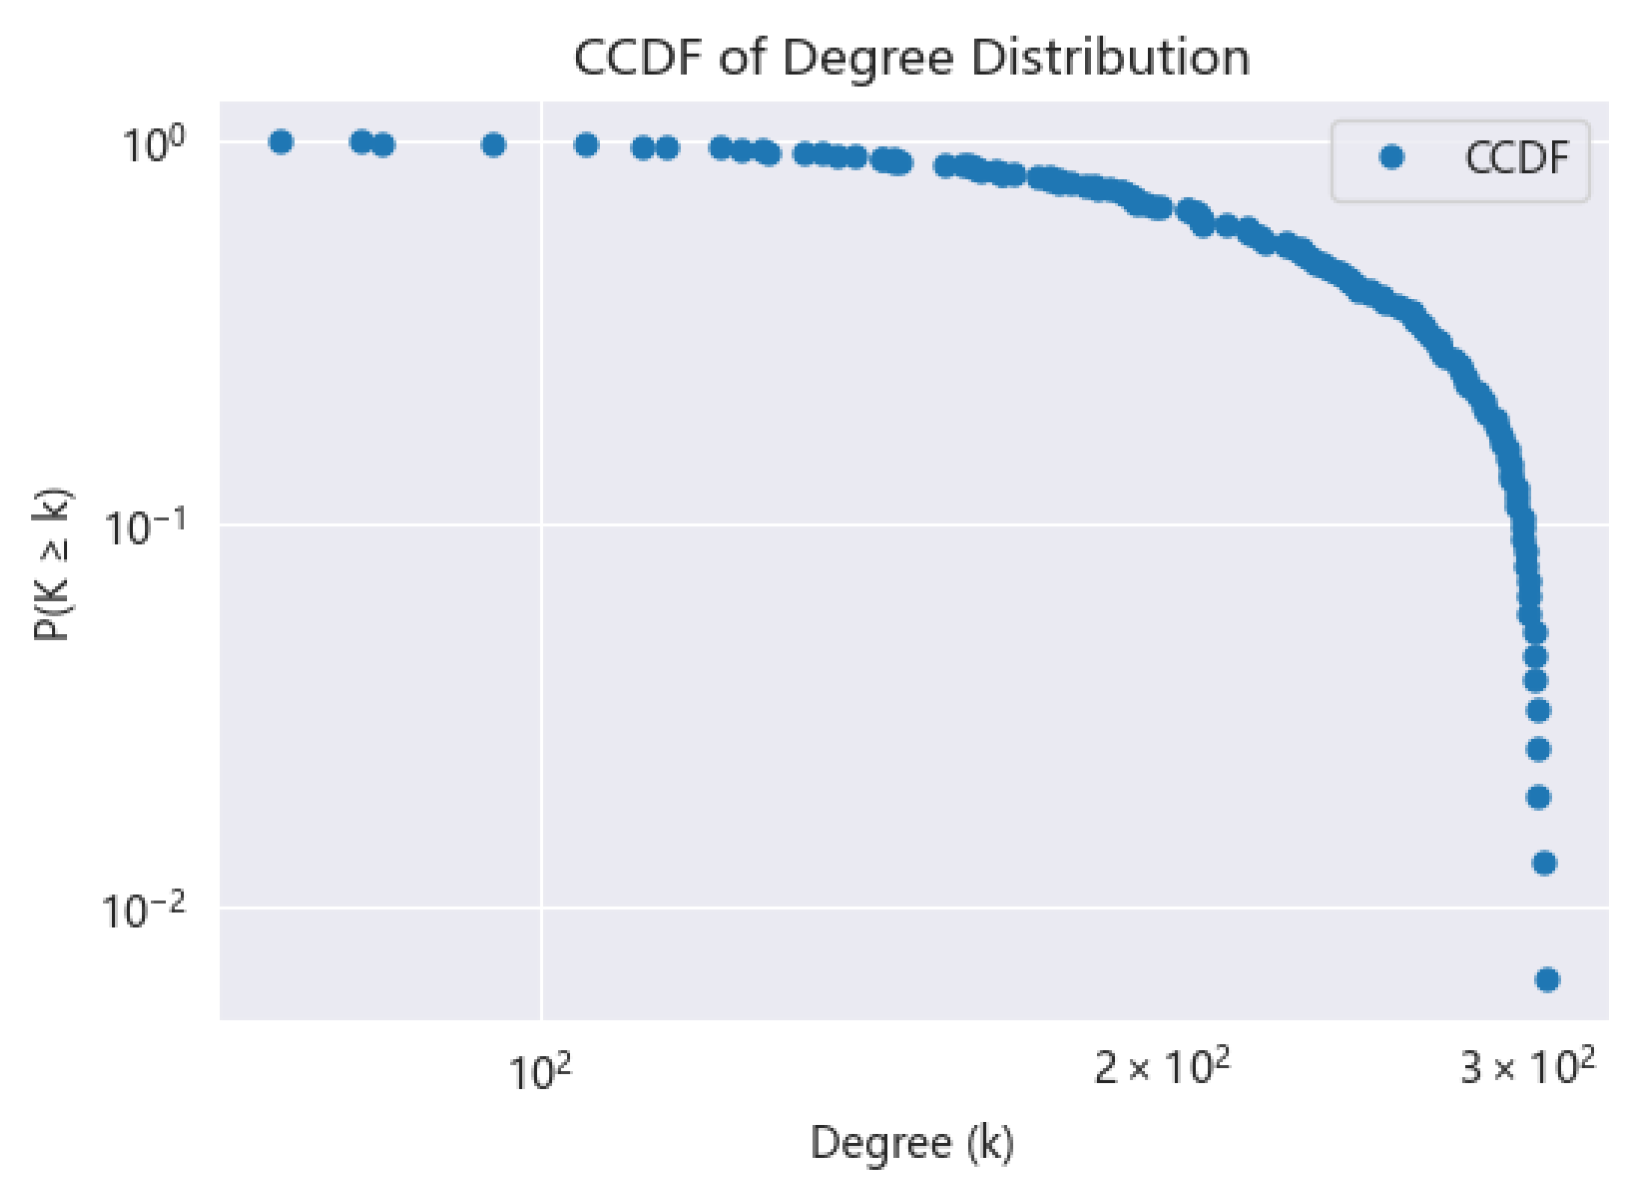
5.4. Structural Properties of the Global Trade Network in 2023
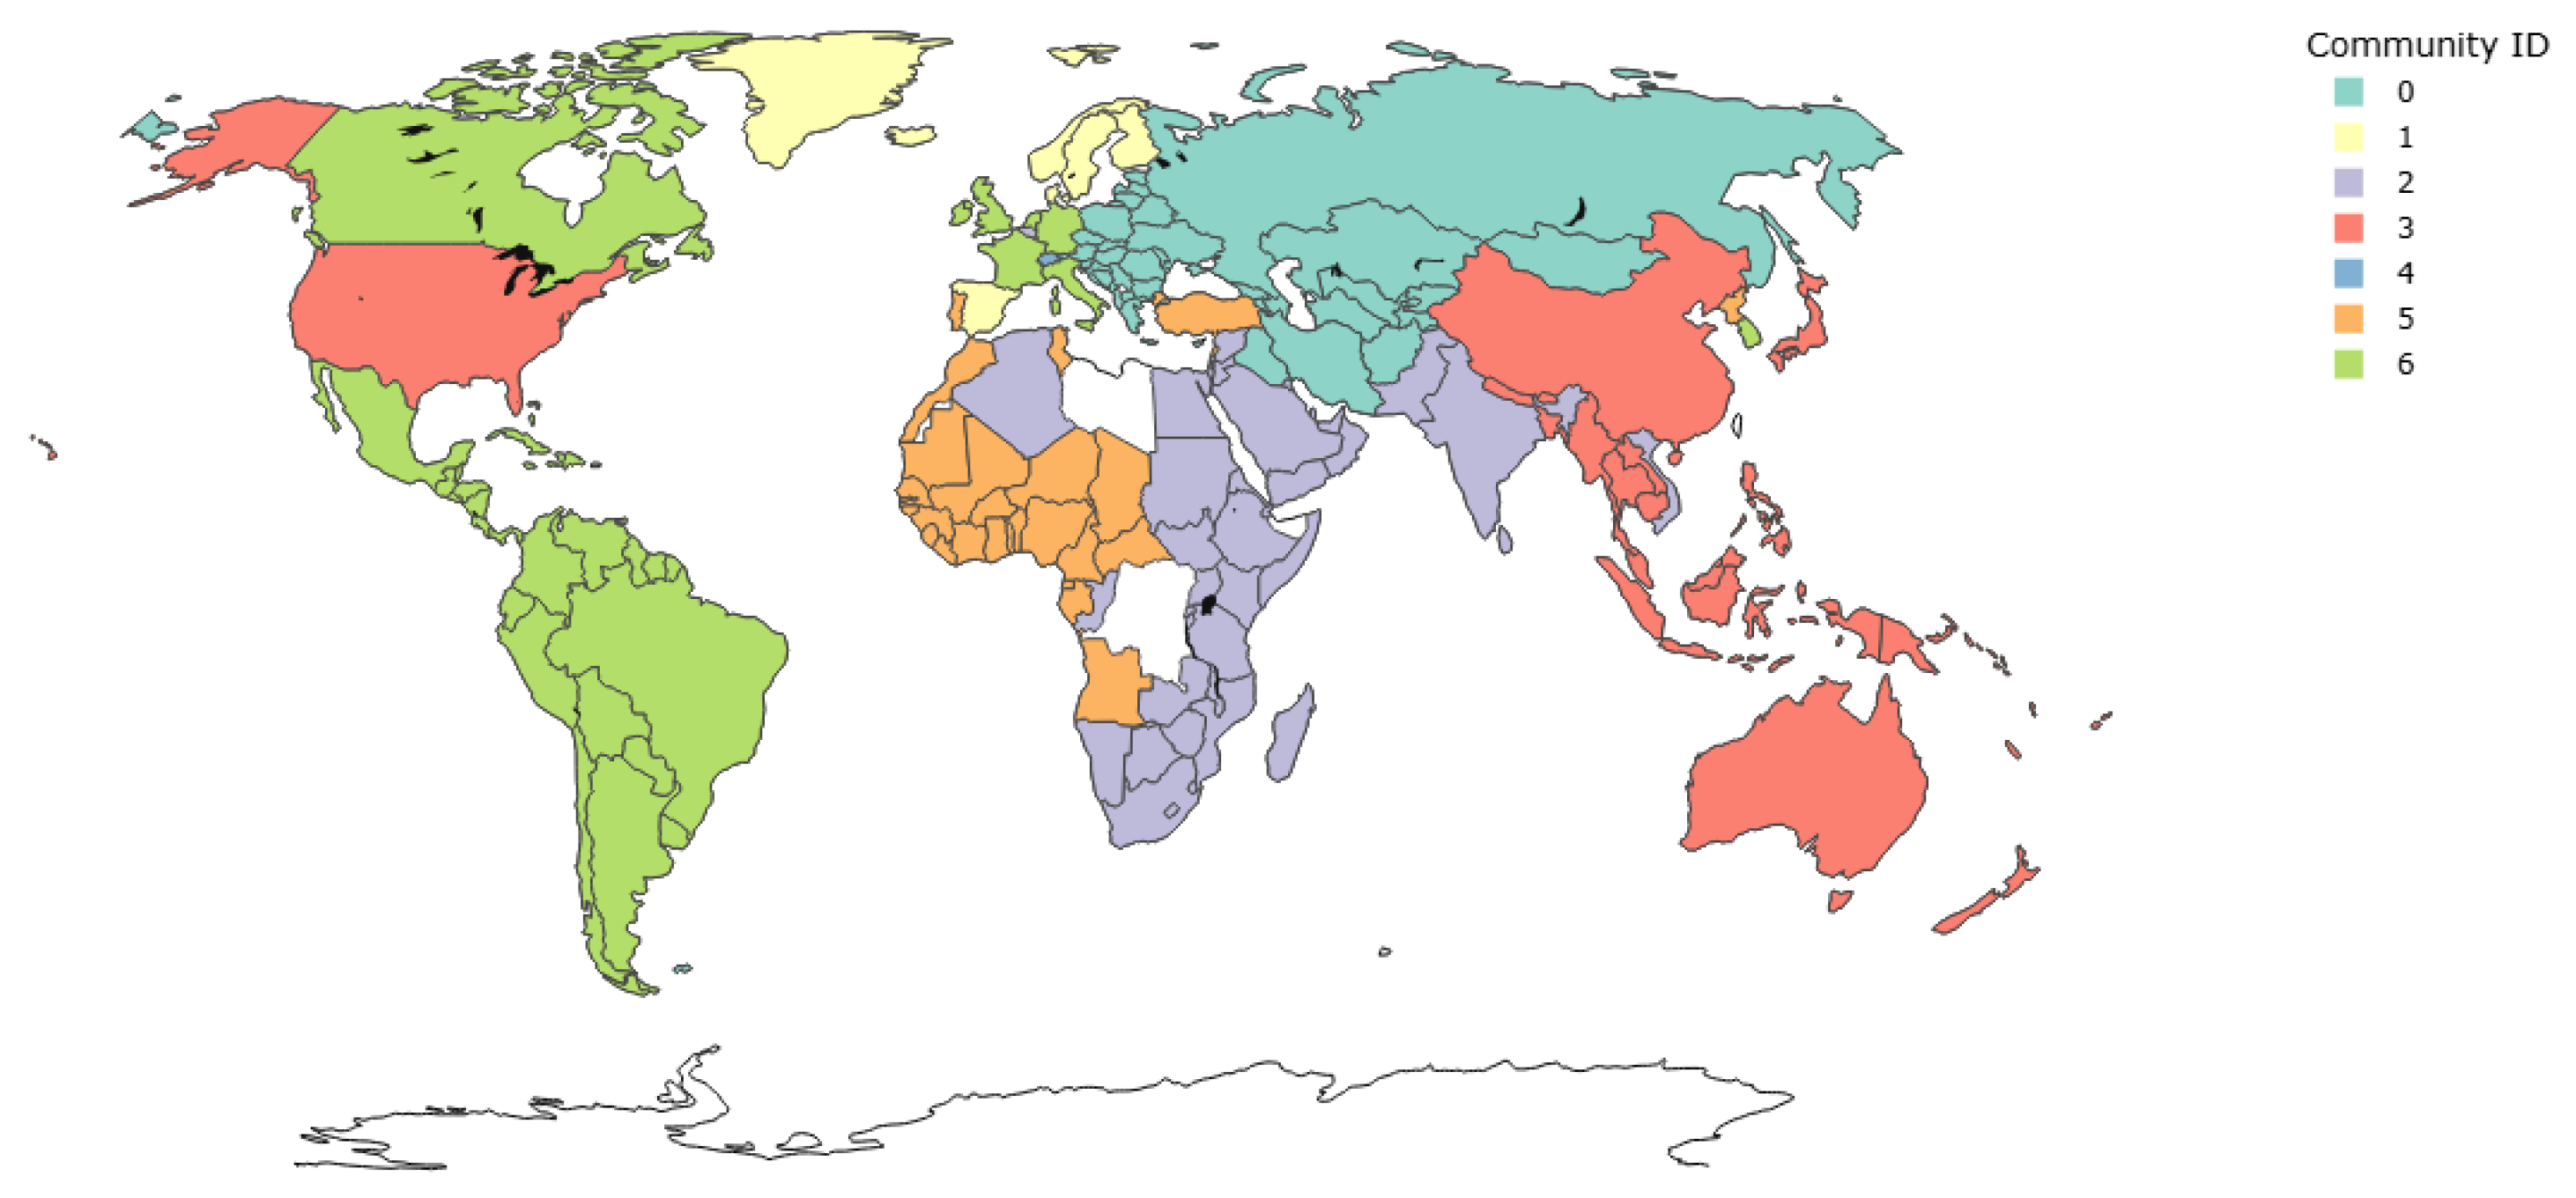
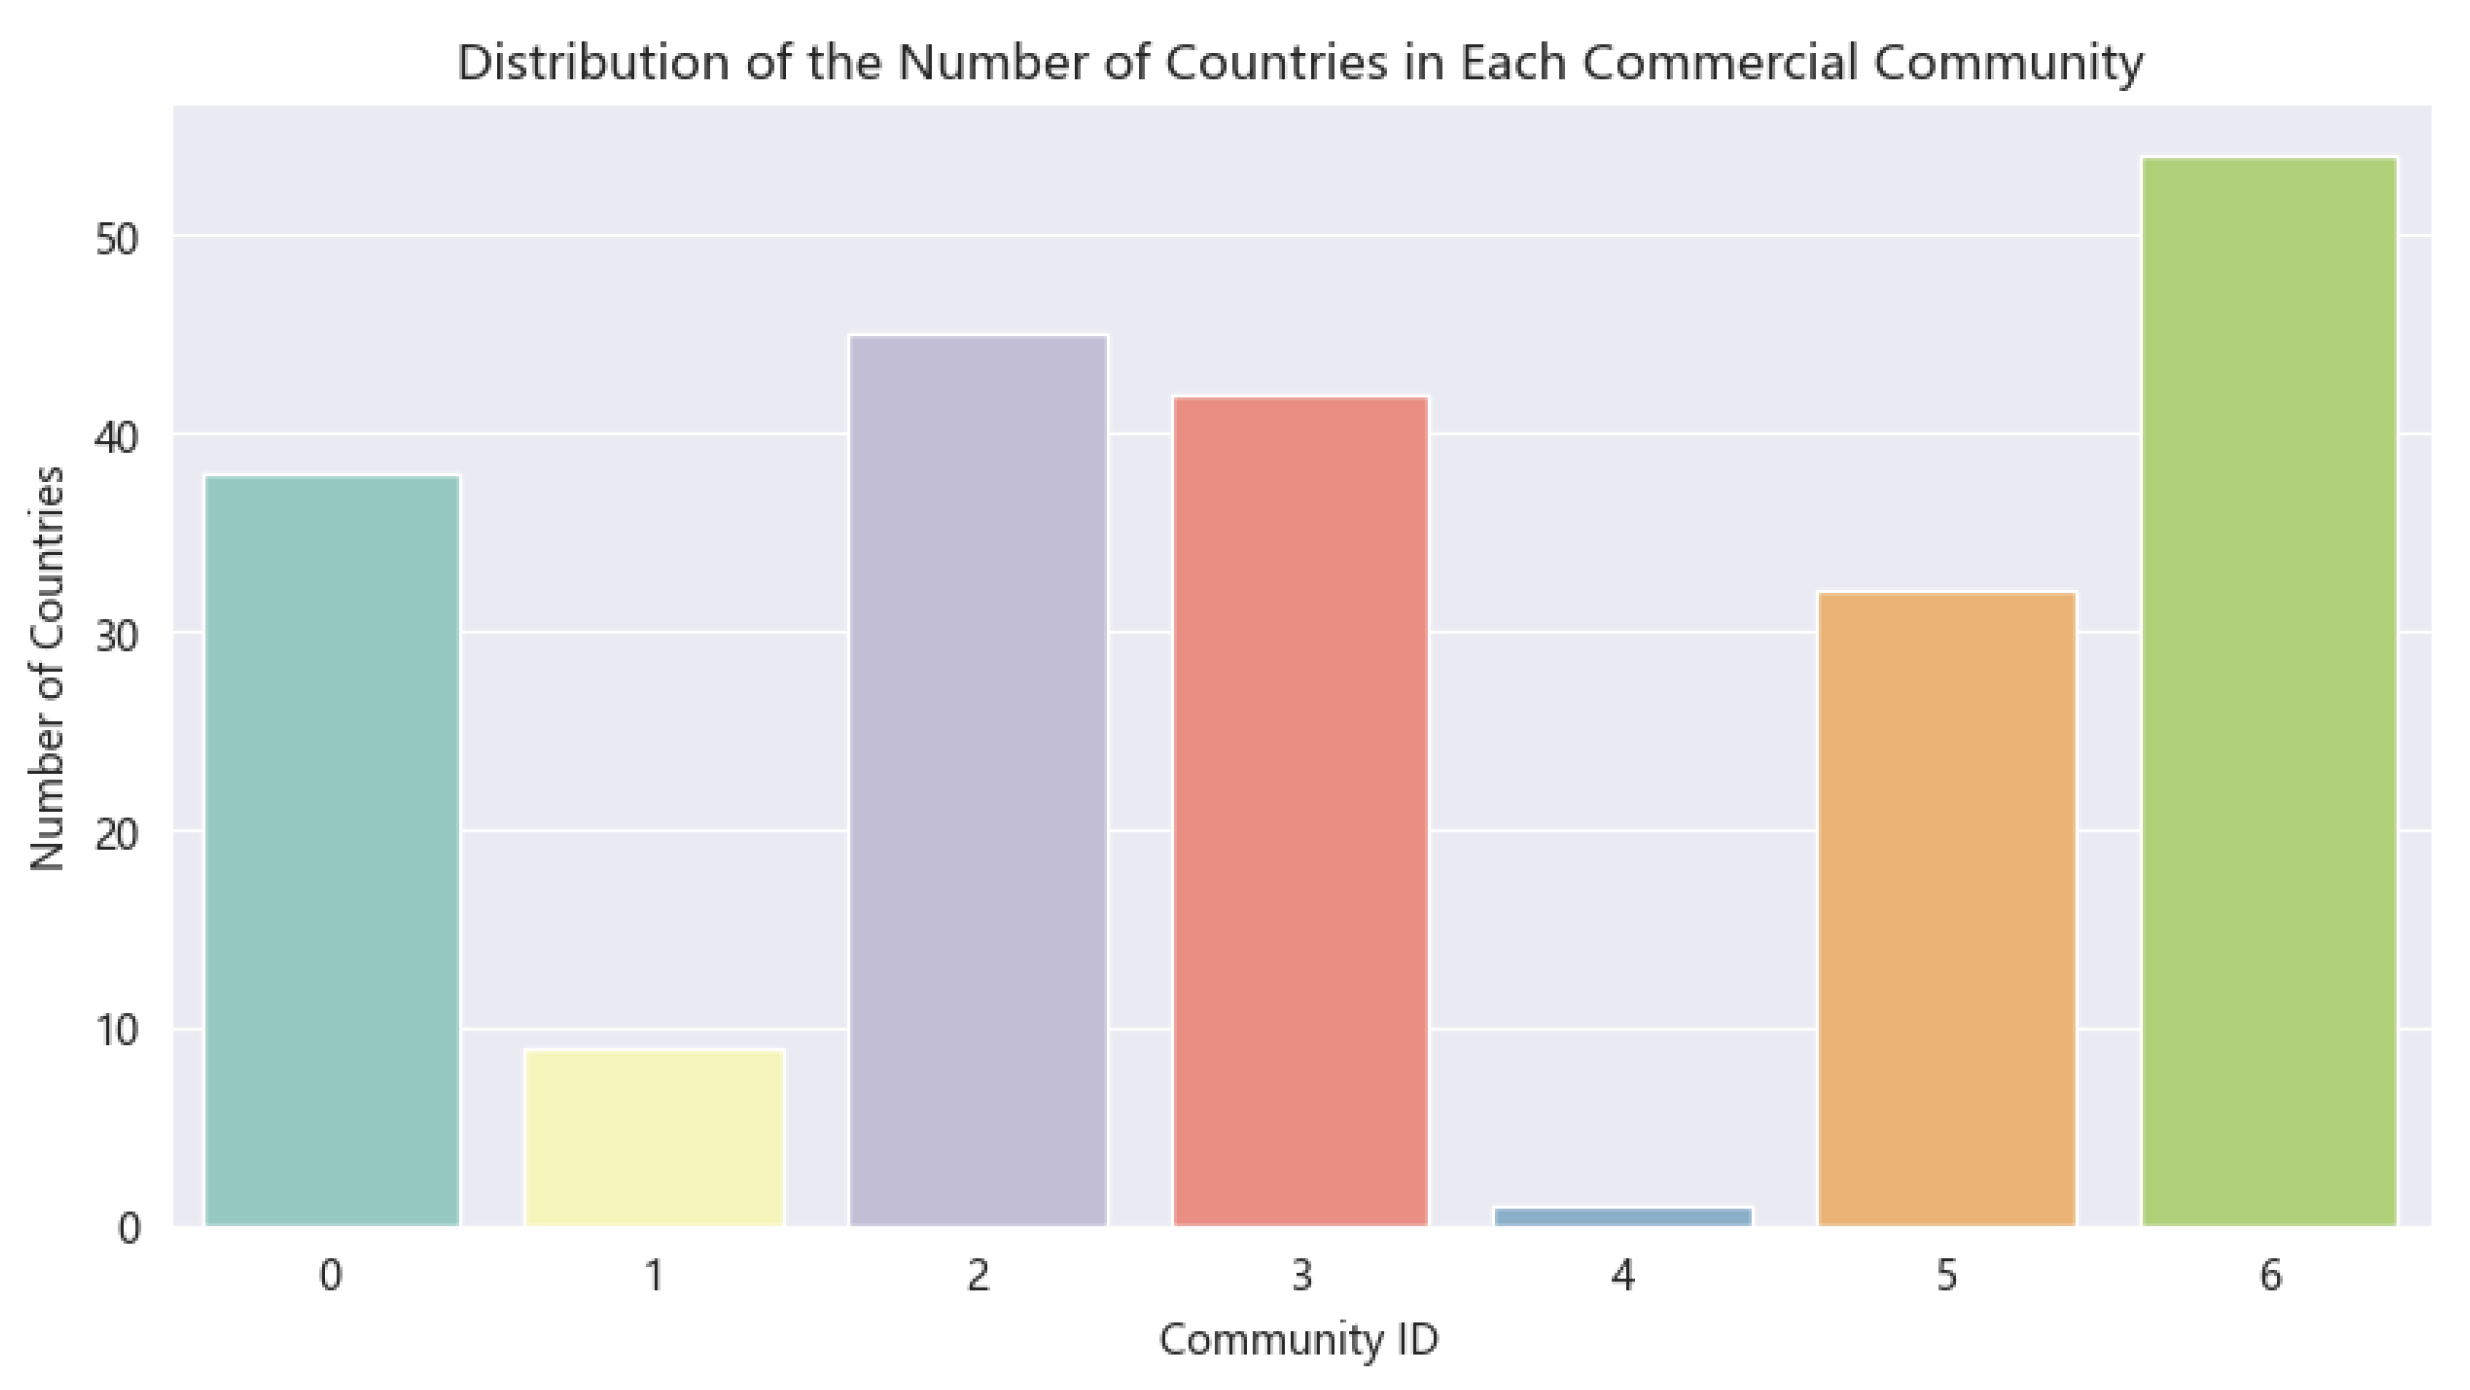
5.5. Identification of Commercial Communities
5.5.1. Communities in Transition: Hybrid Institutions and Limited Efficiency (Community 0—Post-Socialist and Transitional States)
5.5.2. Moderate Efficiency but Internal Heterogeneity (Community 2—India, Southern Africa, Some Arab Countries)
5.5.3. Systemically Low Efficiency: Fragile or Dysfunctional Institutions (Community 5—West Africa, Central Africa, North Korea, etc.)
5.5.4. Atypical Case of High Institutional Quality but Low Relative Efficiency (Community 4—Switzerland)
5.5.5. High Efficiency and Institutional Stability (Communities 1, 3, and 6—Developed and Advanced Emerging Countries)
5.6. Statistical Models
5.6.1. Linear Regression Analysis
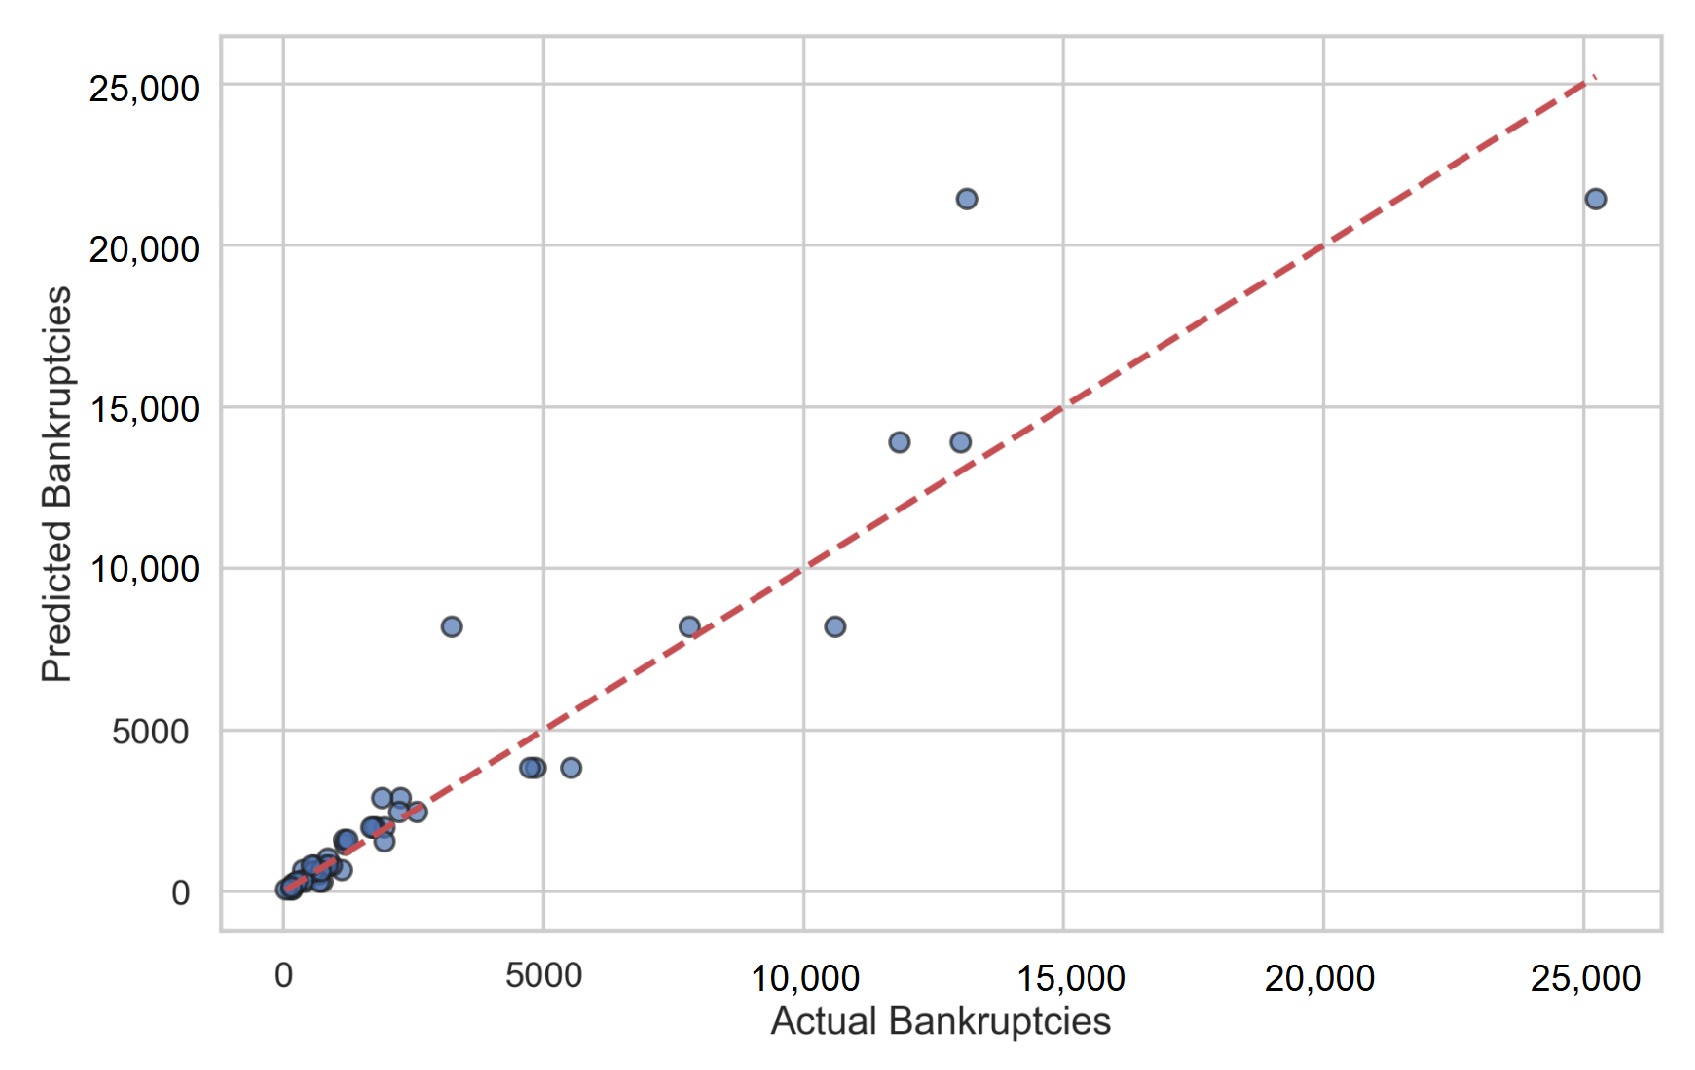
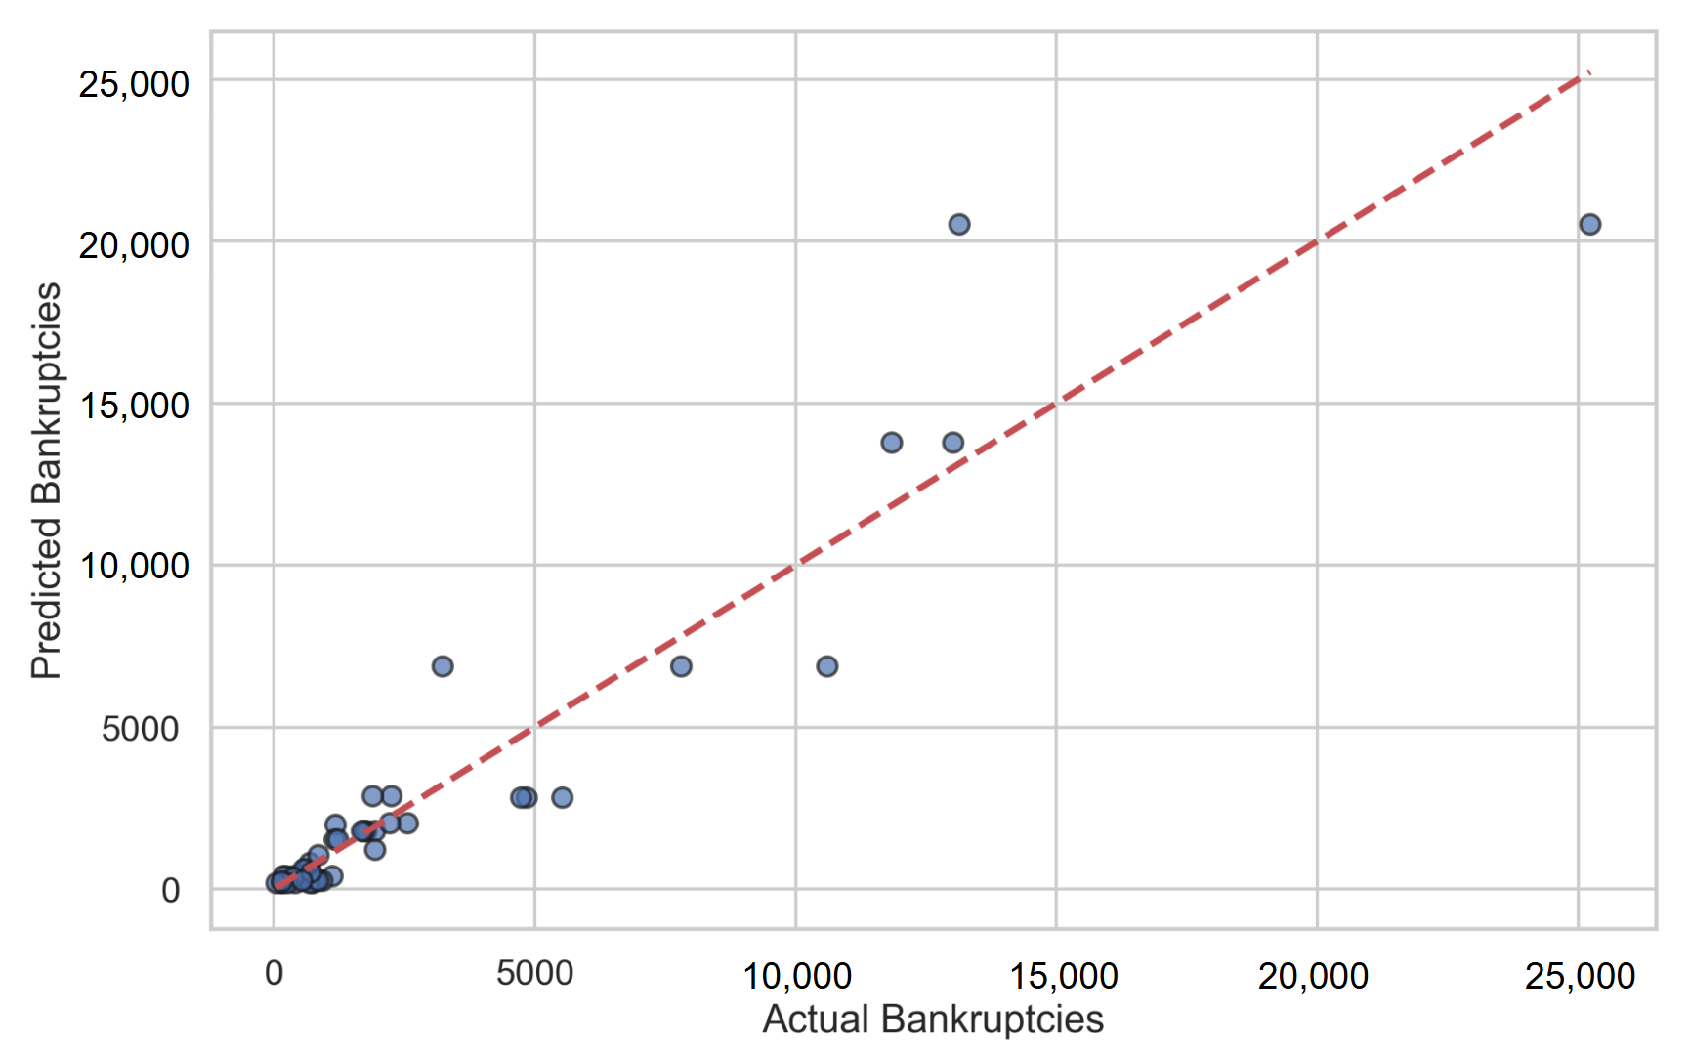
5.6.2. Model Comparison: Random Forest vs. Neural Network
5.6.3. Moran’s Index
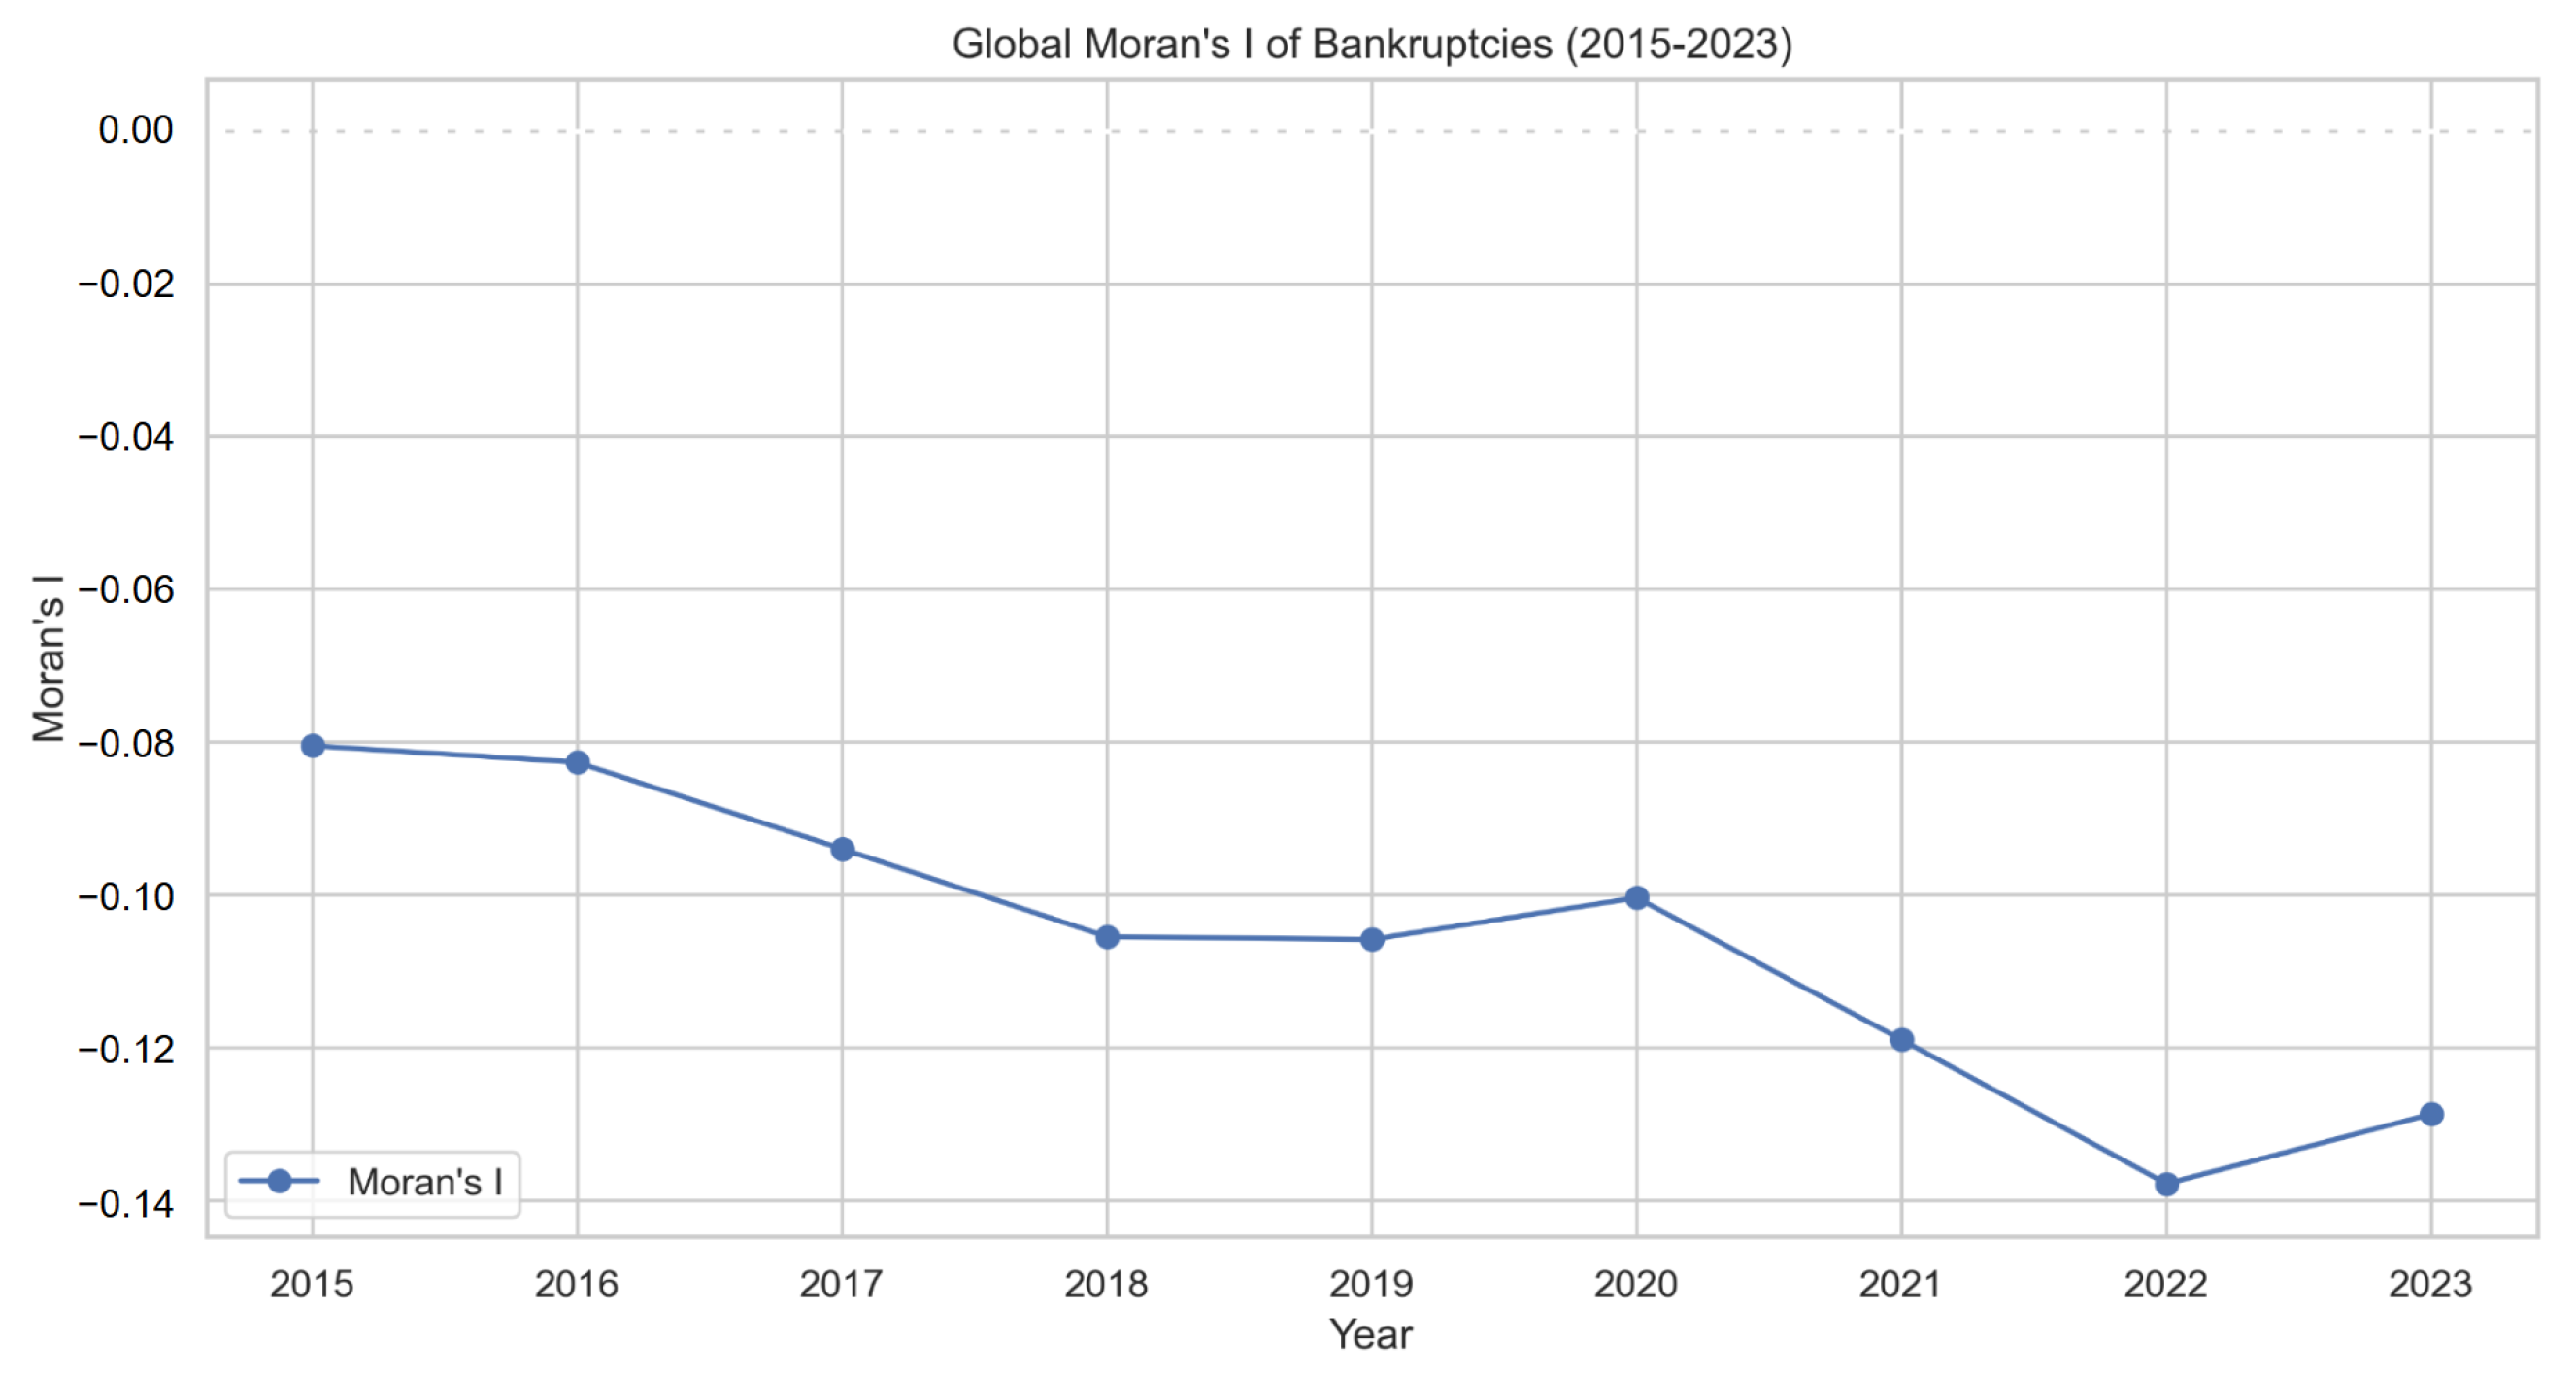
Global Moran’s I Analysis
Local Moran’s I Analysis
6. Conclusions
Author Contributions
Funding
Institutional Review Board Statement
Informed Consent Statement
Data Availability Statement
Acknowledgments
Conflicts of Interest
Appendix A. Moran’s Index

| Year | Moran’s I | p-Value | z-Score |
|---|---|---|---|
| 2015 | −0.0659 | 0.348 | −0.4771 |
| 2016 | −0.0681 | 0.335 | −0.4948 |
| 2017 | −0.0785 | 0.214 | −0.7843 |
| 2018 | −0.0889 | 0.121 | −1.0102 |
| 2019 | −0.0890 | 0.145 | −0.9818 |
| 2020 | −0.0837 | 0.194 | −0.7926 |
| 2021 | −0.0968 | 0.088 | −1.1241 |
| 2022 | −0.1131 | 0.020 | −1.5710 |
| 2023 | −0.1084 | 0.036 | −1.4767 |
| Region | Country | 2015 | 2016 | 2017 | 2018 | 2019 | 2020 | 2021 | 2022 | 2023 |
|---|---|---|---|---|---|---|---|---|---|---|
| East Asia & Pacific | Australia | 0.1108 | 0.1197 | 0.1349 | 0.1508 | 0.1492 | 0.1468 | 0.1587 | 0.1610 | 0.1522 |
| New Zealand | 0.0530 | 0.0487 | 0.0522 | 0.0590 | 0.0603 | 0.0526 | 0.0214 | −0.0050 | 0.0214 | |
| Japan | 0.0384 | 0.0363 | 0.0410 | 0.0473 | 0.0489 | 0.0449 | 0.0239 | 0.0109 | 0.0289 | |
| Taiwan | 0.0158 | 0.0147 | 0.0149 | 0.0024 | −0.0188 | −0.0033 | −0.0053 | −0.0049 | 0.0068 | |
| China | −0.0356 | −0.0602 | −0.2392 | −0.5475 | −0.6327 | −0.6535 | −0.5404 | −0.5614 | −0.4935 | |
| Europe & Central Asia | Finland | 0.1481 | 0.1482 | 0.1631 | 0.1790 | 0.1772 | 0.1603 | 0.1707 | 0.1864 | 0.1893 |
| Belgium | 0.1149 | 0.1166 | 0.1238 | 0.1410 | 0.1376 | 0.1357 | 0.1466 | 0.1413 | 0.1456 | |
| Denmark | 0.0508 | 0.0436 | 0.0469 | 0.0523 | 0.0518 | 0.0476 | 0.0208 | 0.0028 | 0.0222 | |
| Turkey | 0.0413 | 0.0375 | 0.0365 | 0.0452 | 0.0458 | 0.0347 | 0.0166 | 0.0031 | 0.0062 | |
| Sweden | 0.0409 | 0.0385 | 0.0431 | 0.0482 | 0.0499 | 0.0451 | 0.0237 | 0.0112 | 0.0286 | |
| Lithuania | 0.0177 | 0.0161 | 0.0201 | 0.0257 | 0.0294 | 0.0402 | 0.0120 | −0.0202 | −0.0070 | |
| Netherlands | 0.0176 | 0.0163 | 0.0210 | 0.0261 | 0.0295 | 0.0394 | 0.0120 | −0.0216 | −0.0064 | |
| Luxembourg | 0.0168 | 0.0153 | 0.0194 | 0.0223 | 0.0243 | 0.0291 | 0.0124 | −0.0065 | 0.0007 | |
| United Kingdom | 0.0111 | 0.0116 | 0.0155 | 0.0222 | 0.0276 | 0.0350 | 0.0172 | 0.0001 | 0.0003 | |
| Iceland | 0.0023 | 0.0016 | 0.0061 | 0.0118 | 0.0157 | 0.0298 | −0.0015 | −0.0429 | −0.0273 | |
| Germany | 0.0005 | 0.0017 | 0.0047 | 0.0122 | 0.0186 | 0.0269 | 0.0107 | −0.0093 | −0.0076 | |
| Italy | −0.0050 | −0.0040 | −0.0028 | 0.0001 | 0.0015 | 0.0139 | 0.0007 | −0.0048 | −0.0053 | |
| Spain | −0.0477 | −0.0433 | −0.0466 | −0.0564 | −0.0561 | −0.0547 | −0.0189 | −0.0036 | −0.0254 | |
| France | −0.0571 | −0.0490 | −0.0468 | −0.0459 | −0.0412 | 0.0009 | 0.0006 | −0.0128 | −0.0318 | |
| Norway | −0.0975 | −0.0971 | −0.1082 | −0.1239 | −0.1297 | −0.1291 | −0.1123 | −0.0836 | −0.0933 | |
| Switzerland | −0.4717 | −0.4915 | −0.5680 | −0.6246 | −0.6073 | −0.6045 | −0.8756 | −1.0434 | −0.8960 | |
| Latin America & Caribbean | Puerto Rico | −0.0960 | −0.0972 | −0.1141 | −0.1321 | −0.1401 | −0.1389 | −0.1217 | −0.0947 | −0.1077 |
| North America | Canada | −0.0009 | −0.0004 | 0.0040 | 0.0093 | 0.0133 | 0.0284 | −0.0014 | −0.0477 | −0.0347 |
| United States | −0.8123 | −0.8662 | −0.9535 | −1.0029 | −1.0376 | −1.1459 | −1.0081 | −0.7621 | −0.8127 | |
| Sub−Saharan Africa | South Africa | −0.1183 | −0.1128 | −0.0982 | −0.0744 | −0.0661 | −0.0511 | −0.0424 | −0.0275 | −0.0603 |
References
- Kose, M.A.; Mulabdic, A. Global trade has nearly flatlined. Populism is taking a toll on growth. Voices (World Bank) 2024, 22, 1–2. [Google Scholar]
- Bandyopadhyay, A.; Rajib, P. The impact of Sino–US trade war on price discovery of soybean: A double-edged sword? J. Futur. Mark. 2023, 43, 858–879. [Google Scholar] [CrossRef]
- Heiets, I.; Xie, Y. The impact of the COVID-19 pandemic on the aviation industry. J. Aviat. 2021, 5, 111–126. [Google Scholar] [CrossRef]
- Atems, B.; Yimga, J. Quantifying the impact of the COVID-19 pandemic on US airline stock prices. J. Air Transp. Manag. 2021, 97, 102141. [Google Scholar] [CrossRef]
- Boata, A.; Kuhanathan, A.; Lemerle, M.; Lebard, P. The Corporate Battlefield: Global Insolvencies in Times of War Economics. 2025. Available online: https://www.allianz.com/en/economic_research/insights/publications/specials_fmo/250318-global-insolvencies.html (accessed on 24 May 2025).
- Itakura, K. Evaluating the impact of the US–China trade war. Asian Econ. Policy Rev. 2020, 15, 77–93. [Google Scholar] [CrossRef]
- Vortherms, S.A.; Zhang, J.J. Political risk and firm exit: Evidence from the US–China Trade War. Rev. Int. Political Econ. 2024, 31, 1814–1839. [Google Scholar] [CrossRef]
- Kuhanathan, A.; Boata, A.; Lemerle, M. Global Insolvency Outlook: From Normalization to Catch Up. 2024. Available online: https://www.allianz.com/content/dam/onemarketing/azcom/Allianz_com/economic-research/publications/specials/en/2024/october/15-10-2024-Global-insolvencies-AZ.pdf (accessed on 15 May 2025).
- Arndt, C.; Diao, X.; Dorosh, P.; Pauw, K.; Thurlow, J. The Ukraine war and rising commodity prices: Implications for developing countries. Glob. Food Secur. 2023, 36, 100680. [Google Scholar] [CrossRef] [PubMed]
- Yuan, X.; Ge, C.; Liu, Y.; Li, N.; Wang, Y. Evolution of global crude oil trade network structure and resilience. Sustainability 2022, 14, 16059. [Google Scholar] [CrossRef]
- Papadopoulos, G.D.; Magafas, L.; Demertzis, K.; Antoniou, I. Analyzing global geopolitical stability in terms of world trade network analysis. Information 2023, 14, 442. [Google Scholar] [CrossRef]
- Goto, H.; Takayasu, H.; Takayasu, M. Estimating risk propagation between interacting firms on inter-firm complex network. PLoS ONE 2017, 12, e0185712. [Google Scholar] [CrossRef]
- Serrano, A.; Oliva, R.; Kraiselburd, S. Risk propagation through payment distortion in supply chains. J. Oper. Manag. 2018, 58–59, 1–14. [Google Scholar] [CrossRef]
- Kim, S.; Yun, J. Analysis of risk propagation using the world trade network. J. Korean Phys. Soc. 2022, 81, 697–706. [Google Scholar] [CrossRef] [PubMed]
- Hoang, V.P.; Piccardi, C.; Tajoli, L. Reshaping the structure of the World Trade Network: A pivotal role for China? Appl. Netw. Sci. 2023, 8, 35. [Google Scholar] [CrossRef]
- Antonietti, R.; Falbo, P.; Fontini, F.; Grassi, R.; Rizzini, G. The world trade network: Country centrality and the COVID-19 pandemic. Appl. Netw. Sci. 2022, 7, 18. [Google Scholar] [CrossRef] [PubMed]
- Ioannidis, E.; Dadakas, D.; Angelidis, G. Shock Propagation and the Geometry of International Trade: The US–China Trade Bipolarity in the Light of Network Science. Mathematics 2025, 13, 838. [Google Scholar] [CrossRef]
- Korniyenko, M.Y.; Pinat, M.; Dew, B. Assessing the Fragility of Global Trade: The Impact of Localized Supply Shocks Using Network Analysis; International Monetary Fund: Washington, DC, USA, 2017. [Google Scholar]
- Kilfoyle, M. Ukraine: What’s the Global Economic Impact of Russia’s Invasion? Economics Observatory 2023. Available online: https://www.economicsobservatory.com/ukraine-whats-the-global-economic-impact-of-russias-invasion (accessed on 4 October 2024).
- Yastrebova, O. Nonpayments, bankruptcy and government support in Russian agriculture. Comp. Econ. Stud. 2005, 47, 167–180. [Google Scholar] [CrossRef]
- Mourougane, A.; Sargsyan, G. Turbulent Times for SMEs; OECD Statistics: Paris, France, 2023. [Google Scholar]
- Iyoha, E.; Malesky, E.; Wen, J.; Wu, S.J.; Feng, B. Exports in Disguise?: Trade Rerouting During the US-China Trade War; Harvard Business School: Boston, MA, USA, 2024. [Google Scholar]
- East, I.M.F.M.; Dept., C.A. United Arab Emirates: 2022 Article IV Consultation—Press Release; and Staff Report. IMF Staff Ctry. Rep. 2023, 2023, A001. [Google Scholar] [CrossRef]
- Spital, T.; van Aerssen, K.F. The impact of Brexit on UK trade and labour markets. Econ. Bull. Artic. 2023, 3, 45–57. [Google Scholar]
- Mofid, K.; Blennerhassett, A.; Coleman, G. Polska Express: All Aboard the Polish Logistics Freight Train, 2024. Setting the Polish Logistics Property Market in a Western European Context. Available online: https://www.savills.co.jp/research_articles/167577/367889-1 (accessed on 4 January 2025).
- Feenstra, R.C.; Lipsey, R.E.; Deng, H.; Ma, A.; Mo, H. World Trade Flows: 1962–2000. 2005. Available online: https://www.nber.org/papers/w11040 (accessed on 4 January 2025).
- Gaulier, G.; Zignago, S. BACI: International Trade Database at the Product-Level (the 1994–2007 Version). 2010. Available online: https://ideas.repec.org/p/cii/cepidt/2010-23.html (accessed on 1 May 2011).
- International Trade Centre (ITC). Trade Map: Trade Statistics for International Business Development. 2025. Available online: https://www.trademap.org/ (accessed on 3 May 2025).
- Trading Economics. Trading Economics: Global Economic Data, Forecasts, Charts and News. 2025. Available online: https://tradingeconomics.com/ (accessed on 7 April 2025).
- Statista. Statista: Statistics, Market Data and Forecasts. 2025. Available online: https://www.statista.com/ (accessed on 3 June 2025).
- World Bank. World Bank: International Development, Poverty, & Sustainability. 2025. Available online: https://www.worldbank.org/ (accessed on 17 February 2025).
- Becker, B.; Josephson, J. Insolvency resolution and the missing high-yield bond markets. Rev. Financ. Stud. 2016, 29, 2814–2849. [Google Scholar] [CrossRef]
- Kornejew, M.; Lian, C.; Ma, Y.; Ottonello, P.; Perez, D.J. Bankruptcy Resolution and Credit Cycles; Technical Report; National Bureau of Economic Research: Cambridge, MA, USA, 2024. [Google Scholar]
- Novikov, Y.A.; Yakoviyk, I.V. International Economic Sanctions. Part 2. Sanctions Policy of the European Union Towards Russia: Problems of Implementation. Theory Prac. Juris. 2024, 26, 109. [Google Scholar]
- Davtyan, V.S.; Tufetulov, A.M.; Rodnyansky, D.V.; Khairullin, I.A.; Margamov, A.R.; Valeeva, Y.S. Development of Economic Cooperation Between Russia and China in the Condition of New Geopolitical Threats and Challenges. China Rep. 2024, 60, 322–338. [Google Scholar] [CrossRef]
- Clauset, A.; Shalizi, C.R.; Newman, M.E.J. Power-law distributions in empirical data. SIAM Rev. 2009, 51, 661–703. [Google Scholar] [CrossRef]
- Newman, M.E. Mixing patterns in networks. Phys. Rev. E 2003, 67, 026126. [Google Scholar] [CrossRef]
- Litvak, N.; van der Hofstad, R. Uncovering disassortativity in large scale-free networks. Phys. Rev. E 2012, 85, 066114. [Google Scholar] [CrossRef] [PubMed]
- So, M.K.; Mak, A.S.; Chan, J.N.; Chu, A.M. Standardized local assortativity in networks and systemic risk in financial markets. PLoS ONE 2023, 18, e0292327. [Google Scholar] [CrossRef] [PubMed]
- Fagiolo, G. The international-trade network: Gravity equations and topological properties. J. Econ. Interact. Coord. 2010, 5, 1–25. [Google Scholar] [CrossRef]
- Natural Earth. Admin 0—Countries (1:110 m) Shapefile. 2025. Available online: https://www.naturalearthdata.com/downloads/110m-cultural-vectors/110m-admin-0-countries/ (accessed on 15 March 2025).
| Category | Description |
|---|---|
| International trade data | |
| Source | Trademap (accessed on 13 January 2025) (https://www.trademap.org/) |
| Variables | Annual export volume between country pairs |
| Period | 2013–2024 |
| Countries | The 200 countries with the highest annual trade volume |
| Frequency | Consolidated annual data |
| Product type | Exclusively export product data |
| Justification for using export data |
|
| Business bankruptcy data | |
| Source | Trading Economics (https://tradingeconomics.com/) |
| Statista (https://www.statista.com/) for complementary data from China | |
| Variables | Annual average number of business bankruptcies in 27 countries |
| Period | 2015–2023 |
| Justification for country selection |
|
| Insolvency resolution time data | |
| Source | World Bank (https://databank.worldbank.org/metadataglossary/jobs/series/IC.ISV.DURS (accessed on 13 January 2025)) |
| Variable | Time to resolve insolvency (IC.ISV.DURS) |
| Definition | Number of years from the court filing for insolvency to the resolution of distressed assets. |
| Period | 2003–2018 |
| Countries | 266 countries and territories |
| Frequency | Annual (reported per country year, but mostly unchanged over time) |
| Processing | Multi-year average calculated for each country to reflect structural characteristics |
| Justification for using annual average | The values exhibit minimal variation over time for most countries, allowing the use of a cross-year mean as a stable institutional indicator. |
| Unit | Years |
| Year | Count | Mean (k USD) | Median (k USD) | Std Dev (k USD) | Max (k USD) | 25% (k USD) | 75% (k USD) |
|---|---|---|---|---|---|---|---|
| 2001 | 274 | 155.62 | 0.00 | 1359.35 | 20798.64 | 0.00 | 1.06 |
| 2002 | 475 | 216.74 | 0.00 | 1823.80 | 26,931.13 | 0.00 | 5.59 |
| 2003 | 507 | 194.12 | 0.17 | 1659.88 | 24,974.29 | 0.00 | 4.62 |
| 2004 | 1027 | 148.09 | 0.03 | 1659.71 | 39,886.65 | 0.00 | 2.96 |
| 2005 | 1191 | 133.21 | 0.04 | 1829.88 | 55,412.88 | 0.00 | 1.93 |
| 2006 | 1553 | 190.46 | 0.02 | 2347.66 | 61,385.24 | 0.00 | 1.68 |
| 2007 | 1675 | 133.14 | 0.03 | 1696.88 | 60,163.16 | 0.00 | 1.67 |
| 2008 | 2010 | 248.96 | 0.01 | 3011.68 | 83,477.84 | 0.00 | 1.37 |
| 2009 | 2087 | 158.88 | 0.03 | 1898.67 | 56,583.10 | 0.00 | 1.36 |
| 2010 | 2794 | 450.90 | 0.05 | 7987.69 | 397,067.52 | 0.00 | 3.09 |
| 2011 | 3490 | 449.87 | 0.02 | 9282.30 | 516,992.62 | 0.00 | 1.84 |
| 2012 | 31,970 | 1072.45 | 0.50 | 20,641.64 | 2,048,782.20 | 0.00 | 24.73 |
| 2013 | 31,855 | 1106.02 | 0.55 | 21,533.50 | 2,209,007.30 | 0.00 | 25.67 |
| 2014 | 31,550 | 1114.49 | 0.59 | 22,203.91 | 2,342,292.70 | 0.00 | 27.23 |
| 2015 | 32,044 | 952.69 | 0.56 | 20,208.45 | 2,281,855.92 | 0.00 | 23.23 |
| 2016 | 31,494 | 931.23 | 0.54 | 19,564.46 | 2,118,980.58 | 0.00 | 21.98 |
| 2017 | 32,030 | 1016.98 | 0.61 | 20,946.74 | 2,271,796.14 | 0.00 | 23.89 |
| 2018 | 31,351 | 1142.34 | 0.68 | 23,091.75 | 2,494,230.20 | 0.00 | 27.21 |
| 2019 | 31,208 | 1119.22 | 0.71 | 22,746.11 | 2,498,334.25 | 0.00 | 27.47 |
| 2020 | 30,763 | 1056.37 | 0.67 | 22,056.36 | 2,588,402.39 | 0.00 | 25.39 |
| 2021 | 24,679 | 1670.00 | 3.57 | 31,083.41 | 3,361,814.26 | 0.15 | 68.66 |
| 2022 | 23,787 | 1892.01 | 4.09 | 34,356.81 | 3,593,601.45 | 0.17 | 80.29 |
| 2023 | 23,274 | 1861.93 | 4.43 | 33,449.91 | 3,388,716.31 | 0.19 | 82.63 |
| Country | 2015 | 2023 | % Change |
|---|---|---|---|
| Poland | 0.0065 | 0.0069 | +6.79% |
| Malaysia | 0.0071 | 0.0070 | −2.37% |
| United Arab Emirates | 0.0087 | 0.0084 | −2.58% |
| United States of America | 0.0105 | 0.0102 | −2.26% |
| Spain | 0.0084 | 0.0081 | −3.30% |
| France | 0.0092 | 0.0089 | −3.14% |
| Belgium | 0.0084 | 0.0080 | −4.31% |
| Netherlands | 0.0094 | 0.0090 | −4.67% |
| Canada | 0.0081 | 0.0076 | −5.87% |
| Singapore | 0.0080 | 0.0075 | −6.08% |
| South Korea | 0.0078 | 0.0073 | −6.83% |
| Italy | 0.0089 | 0.0083 | −6.63% |
| Germany | 0.0094 | 0.0087 | −6.95% |
| United Kingdom | 0.0092 | 0.0085 | −7.37% |
| Switzerland | 0.0081 | 0.0073 | −9.91% |
| Japan | 0.0085 | 0.0076 | −10.18% |
| Hong Kong | 0.0079 | 0.0069 | −12.21% |
| India | 0.0091 | 0.0081 | −11.63% |
| China | 0.0108 | 0.0097 | −10.48% |
| Australia | 0.0073 | 0.0067 | −8.05% |
| Country | PageRank | Degree Centrality | Betweenness Centrality | Closeness Centrality | Eigenvector Centrality | Conclusion |
|---|---|---|---|---|---|---|
| China | High | High | Medium | High | High | Core of global trade; maximum influence; highly integrated into the supply chain. |
| United States | High | High | Medium | High | High | Global trade center, with numerous trading partners and a diverse market. |
| Germany | Medium–high | Medium–high | High | Medium–high | Medium–high | Industrial export powerhouse in Europe, with influence concentrated in major economies. |
| Netherlands | Medium–high | High | Low | Medium | Medium | Key logistical hub in Europe, highly connected, heavily reliant on port trade. |
| Iceland | Medium | Low | Very high | Medium | Medium | Acts as a bridge in specific industries (energy, fishing); small but strategic. |
| Singapore | Medium–high | Medium–high | Medium–high | Medium | High | Global trade center, highly connected with major economies, key part of the supply chain. |
| United Arab Emirates | Medium | Medium | Medium | Medium | High | Dependent on international markets, highly connected, strongly influenced by the global economy. |
| Indicator | Value | Conclusion |
|---|---|---|
| Power law index () | 1.94 | The degree distribution follows a power law |
| Power law vs. exponential comparison (D) | −65.396 | The D statistic indicates that the power law is more suitable |
| p-value for distribution comparison | 0 | Null p-value, supporting the power law hypothesis |
| Average path length in the real network () | 1.261 | Short path length, indicating an efficient network for propagation |
| Clustering coefficient in the real network () | 0.845 | High clustering coefficient, indicating a dense local structure |
| Average path length in the random network () | 1.265 | Similar to the real network, meeting the small-world condition |
| Clustering coefficient in the random network () | 0.762 | Lower than the real network, confirming the small-world property |
| Assortativity coefficient (r) | −0.222 | Negative assortativity, indicating that high-degree and low-degree nodes tend to connect, which may affect risk propagation |
| Commun. ID | Representative Countries | Description |
|---|---|---|
| 0 | Belarus, Czech Republic, Special categories, Croatia, Armenia, Russia, Afghanistan, Slovakia, Tajikistan, Turkmenistan… | Trade community centered in Europe, including Belarus, Czech Republic, and Croatia, with strong ties to the EU, excelling in manufacturing and regional trade. |
| 1 | Sweden, Andorra, Denmark, Spain, European Union, Norway, Finland, Faroe Islands, Iceland, Greenland… | Includes North America and some European countries such as the USA, Canada, and the UK, representing developed economies with diversified and stable markets. |
| 2 | South Africa, Mozambique, India, Seychelles, Egypt, Zimbabwe, Madagascar, Bahrain, Mauritius, Eritrea… | Eastern and Southern Asia community, including China, Japan, and South Korea, characterized by a strong manufacturing supply chain and export-oriented economies. |
| 3 | Timor-Leste, Lao People’s Democratic Republic, New Caledonia, Marshall Islands, Fiji, Nepal, Vanuatu, Myanmar, Papua New Guinea, Bangladesh… | Composed of Middle Eastern and North African countries, such as the UAE and Saudi Arabia, where trade is primarily driven by energy exports. |
| 4 | Switzerland | Switzerland as an independent community due to its economic model based on the financial sector, pharmaceuticals, and high-end manufacturing, with a unique trade system. |
| 5 | Chad, North Korea, Total, Central African Republic, Mauritania, Equatorial Guinea, Gibraltar, Togo, Ghana, Sao Tome and Principe… | South American community with countries such as Brazil, Argentina, and Chile, whose trade is based on the export of raw materials and agricultural products with strong regional ties. |
| 6 | Anguilla, South Korea, Bolivarian Republic of Venezuela, Dominica, Uruguay, Argentina, Guyana, Mexico, Guatemala, Bahamas… | Includes Australia and several countries from Southern Asia and Africa, with economies dependent on the export of minerals and resources, and connections with Asia and Western markets. |
| Variable | VIF |
|---|---|
| Const | 1.000 |
| PageRank | 1.088 |
| Degree | 3.148 |
| Betweenness | 1.026 |
| Closeness | 4.133 |
| Variable | Coefficient | Std. Error | t-Value | p-Value |
|---|---|---|---|---|
| Intercept | 6.7569 | 0.090 | 75.36 | 0.000 |
| PageRank () | −0.2802 | 0.094 | −2.995 | 0.003 |
| Degree () | −0.6815 | 0.159 | −4.284 | 0.000 |
| Betweenness () | −0.0957 | 0.091 | −1.054 | 0.293 |
| Closeness () | 0.1520 | 0.182 | 0.834 | 0.405 |
| Eigenvector () | 0.8218 | 0.160 | 5.131 | 0.000 |
| Observations: 248 | Adjusted : 0.152 | |||
| F-statistic: 9.873 | Prob (F-statistic): | |||
| Metric/Feature | Random Forest | Neural Network |
|---|---|---|
| Mean Absolute Error (MAE) | ||
| Mean Squared Error (MSE) | ||
| R-squared () | 0.8805 | 0.8766 |
| PageRank (importance) | 0.490 | 0.262 |
| Eigenvector (importance) | 0.391 | 0.235 |
| Degree (importance) | 0.069 | 0.164 |
| Closeness (importance) | 0.049 | 0.171 |
| Betweenness (importance) | 0.000 | 0.168 |
Disclaimer/Publisher’s Note: The statements, opinions and data contained in all publications are solely those of the individual author(s) and contributor(s) and not of MDPI and/or the editor(s). MDPI and/or the editor(s) disclaim responsibility for any injury to people or property resulting from any ideas, methods, instructions or products referred to in the content. |
© 2025 by the authors. Licensee MDPI, Basel, Switzerland. This article is an open access article distributed under the terms and conditions of the Creative Commons Attribution (CC BY) license (https://creativecommons.org/licenses/by/4.0/).
Share and Cite
Zhang, Y.; Sánchez Arnau, E.; Sánchez Pérez, E.A. Impact of Geopolitical and International Trade Dynamics on Corporate Vulnerability and Insolvency Risk: A Graph-Based Approach. Information 2025, 16, 525. https://doi.org/10.3390/info16070525
Zhang Y, Sánchez Arnau E, Sánchez Pérez EA. Impact of Geopolitical and International Trade Dynamics on Corporate Vulnerability and Insolvency Risk: A Graph-Based Approach. Information. 2025; 16(7):525. https://doi.org/10.3390/info16070525
Chicago/Turabian StyleZhang, Yu, Elena Sánchez Arnau, and Enrique A. Sánchez Pérez. 2025. "Impact of Geopolitical and International Trade Dynamics on Corporate Vulnerability and Insolvency Risk: A Graph-Based Approach" Information 16, no. 7: 525. https://doi.org/10.3390/info16070525
APA StyleZhang, Y., Sánchez Arnau, E., & Sánchez Pérez, E. A. (2025). Impact of Geopolitical and International Trade Dynamics on Corporate Vulnerability and Insolvency Risk: A Graph-Based Approach. Information, 16(7), 525. https://doi.org/10.3390/info16070525