
GIT-CXR: End-to-End Transformer for Chest X-Ray Report Generation


Abstract
1. Introduction
- We propose an end-to-end transformer approach for the generation of medical reports from chest X-ray images, demonstrating the validity of simpler architectures.
- To the best of our knowledge, we are the first to show the effectiveness of curriculum learning for the task of automated radiology report generation using transformers.
- We show the capacities of our setups by obtaining state-of-the-art results, over the largest benchmark of chest radiography, MIMIC-CXR-JPG, for both clinical accuracy metrics as well as natural language generation metrics, attesting to both the factual completeness as well as the accuracy of our generated reports.
2. Related Work
2.1. Transformers in Image Captioning
2.2. Radiology Report Generation
2.3. Curriculum Learning
3. Method
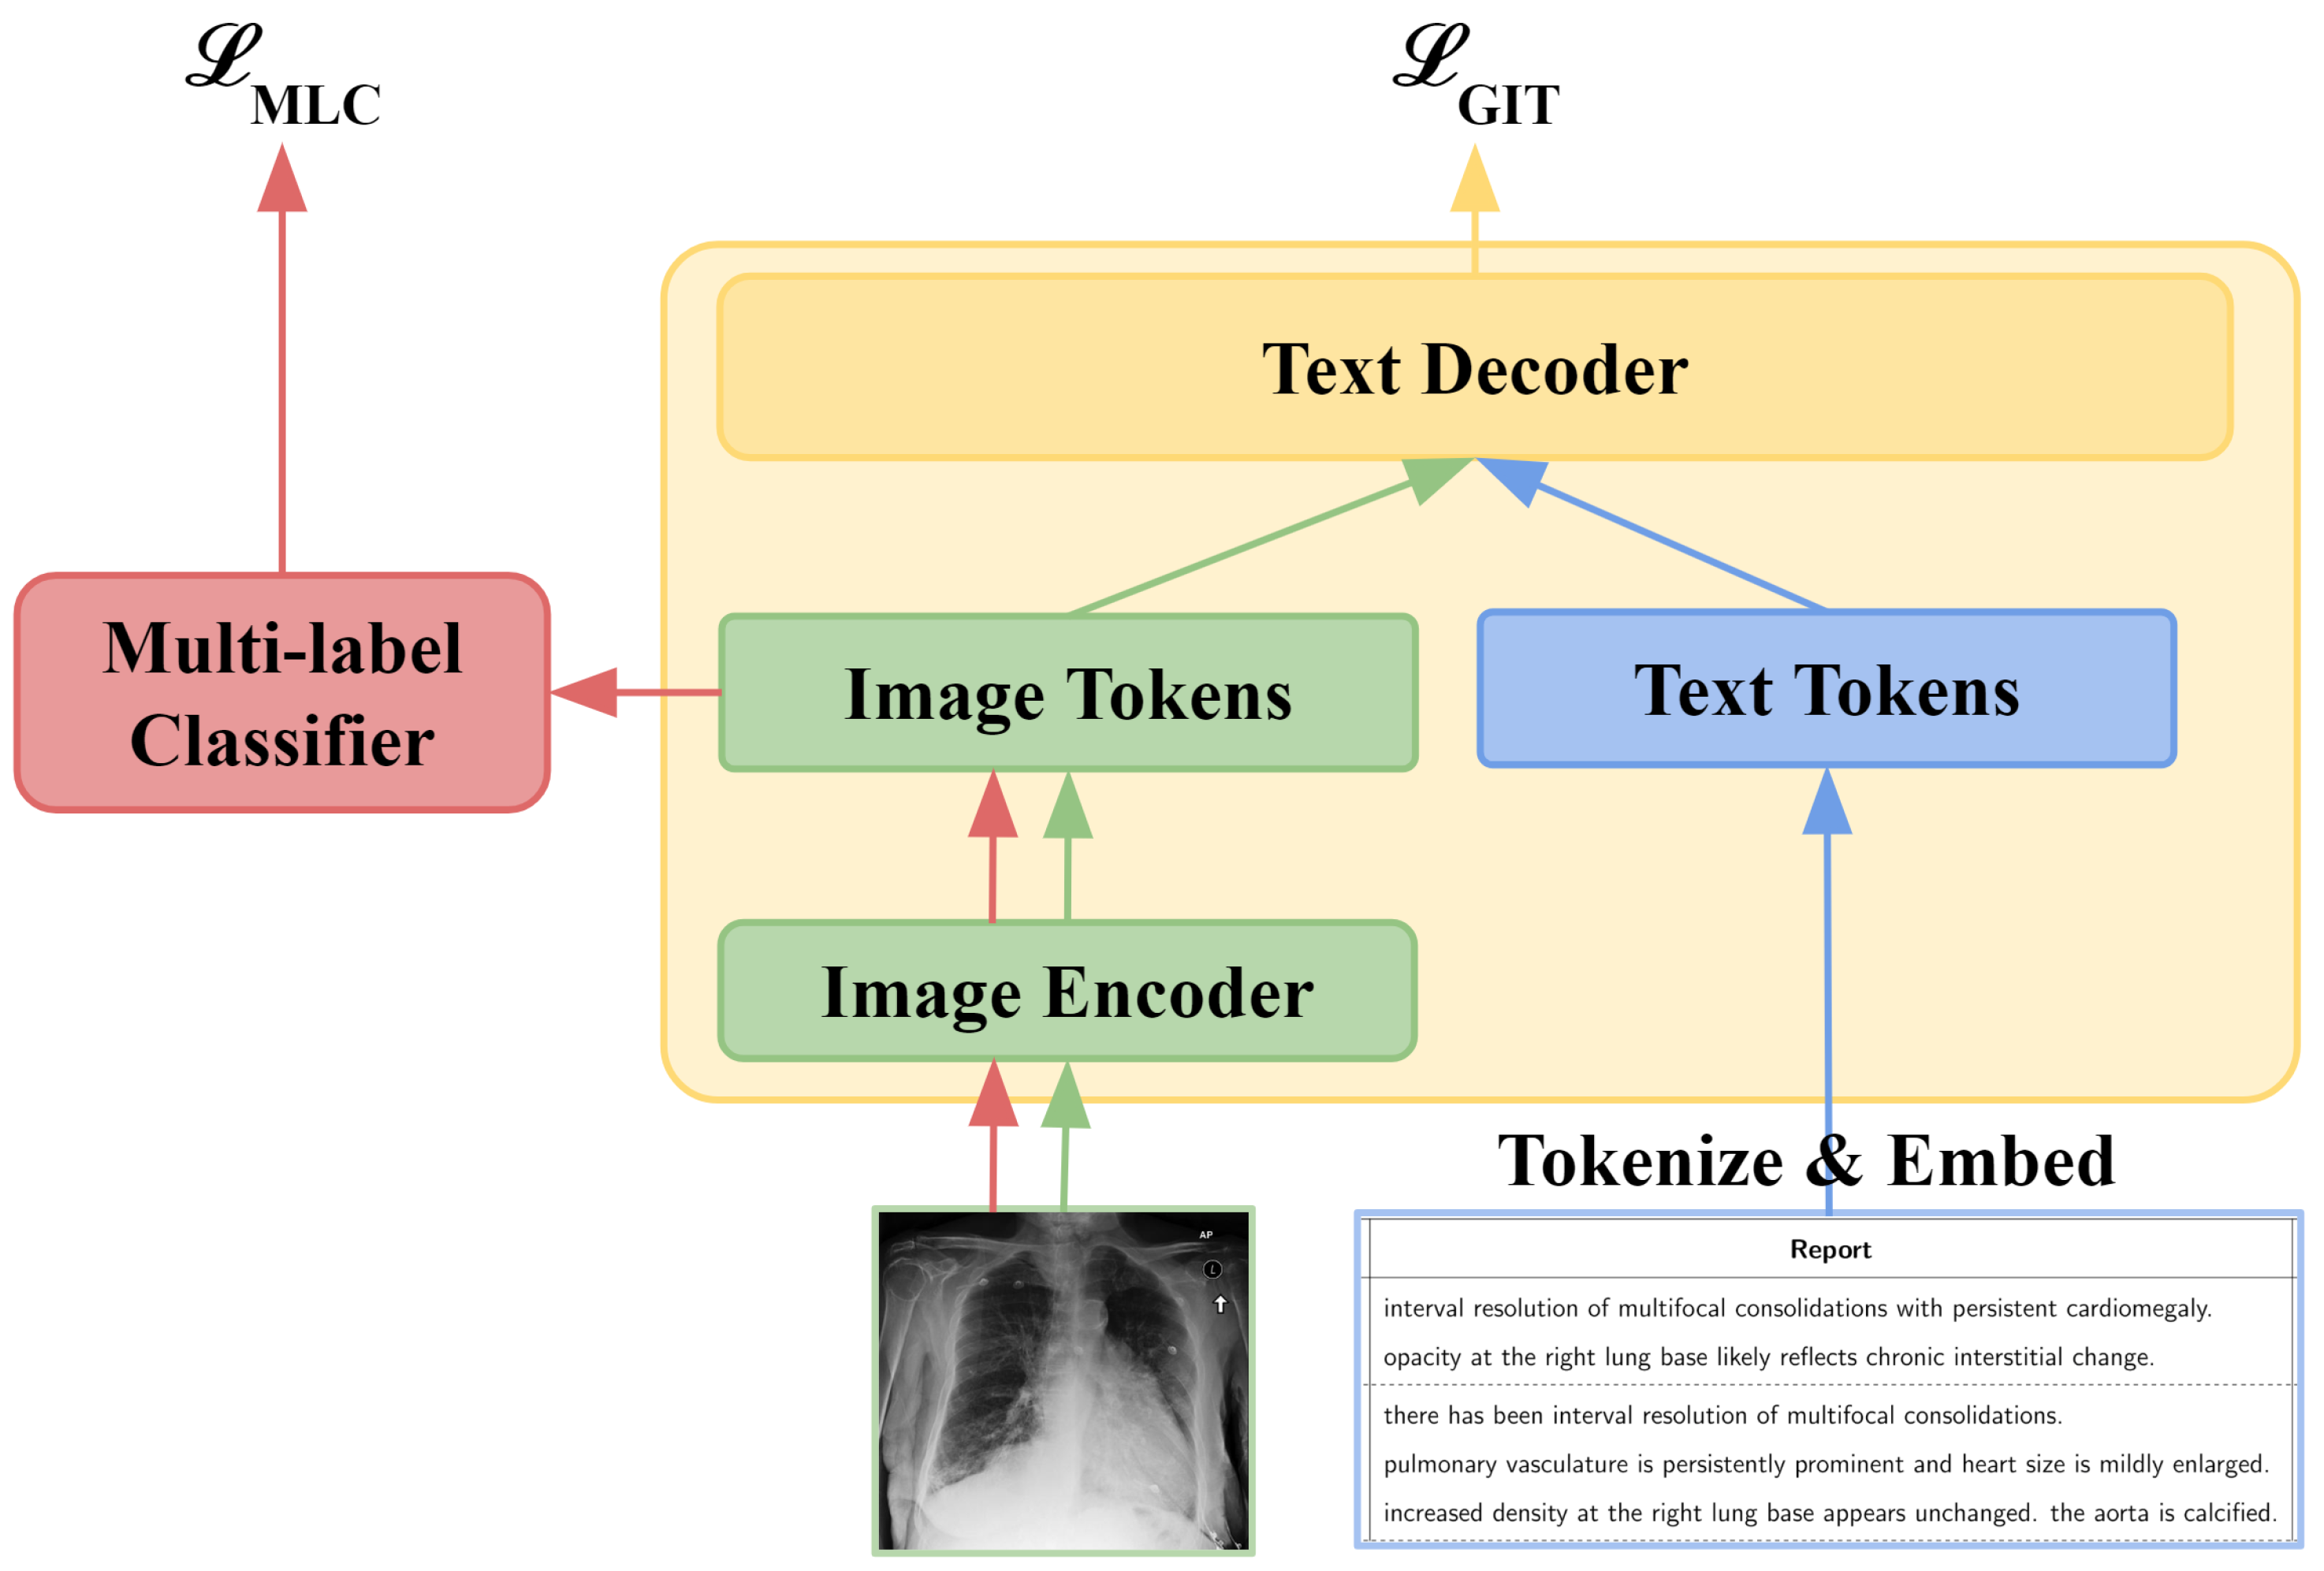
3.1. GIT-CXR (SV)
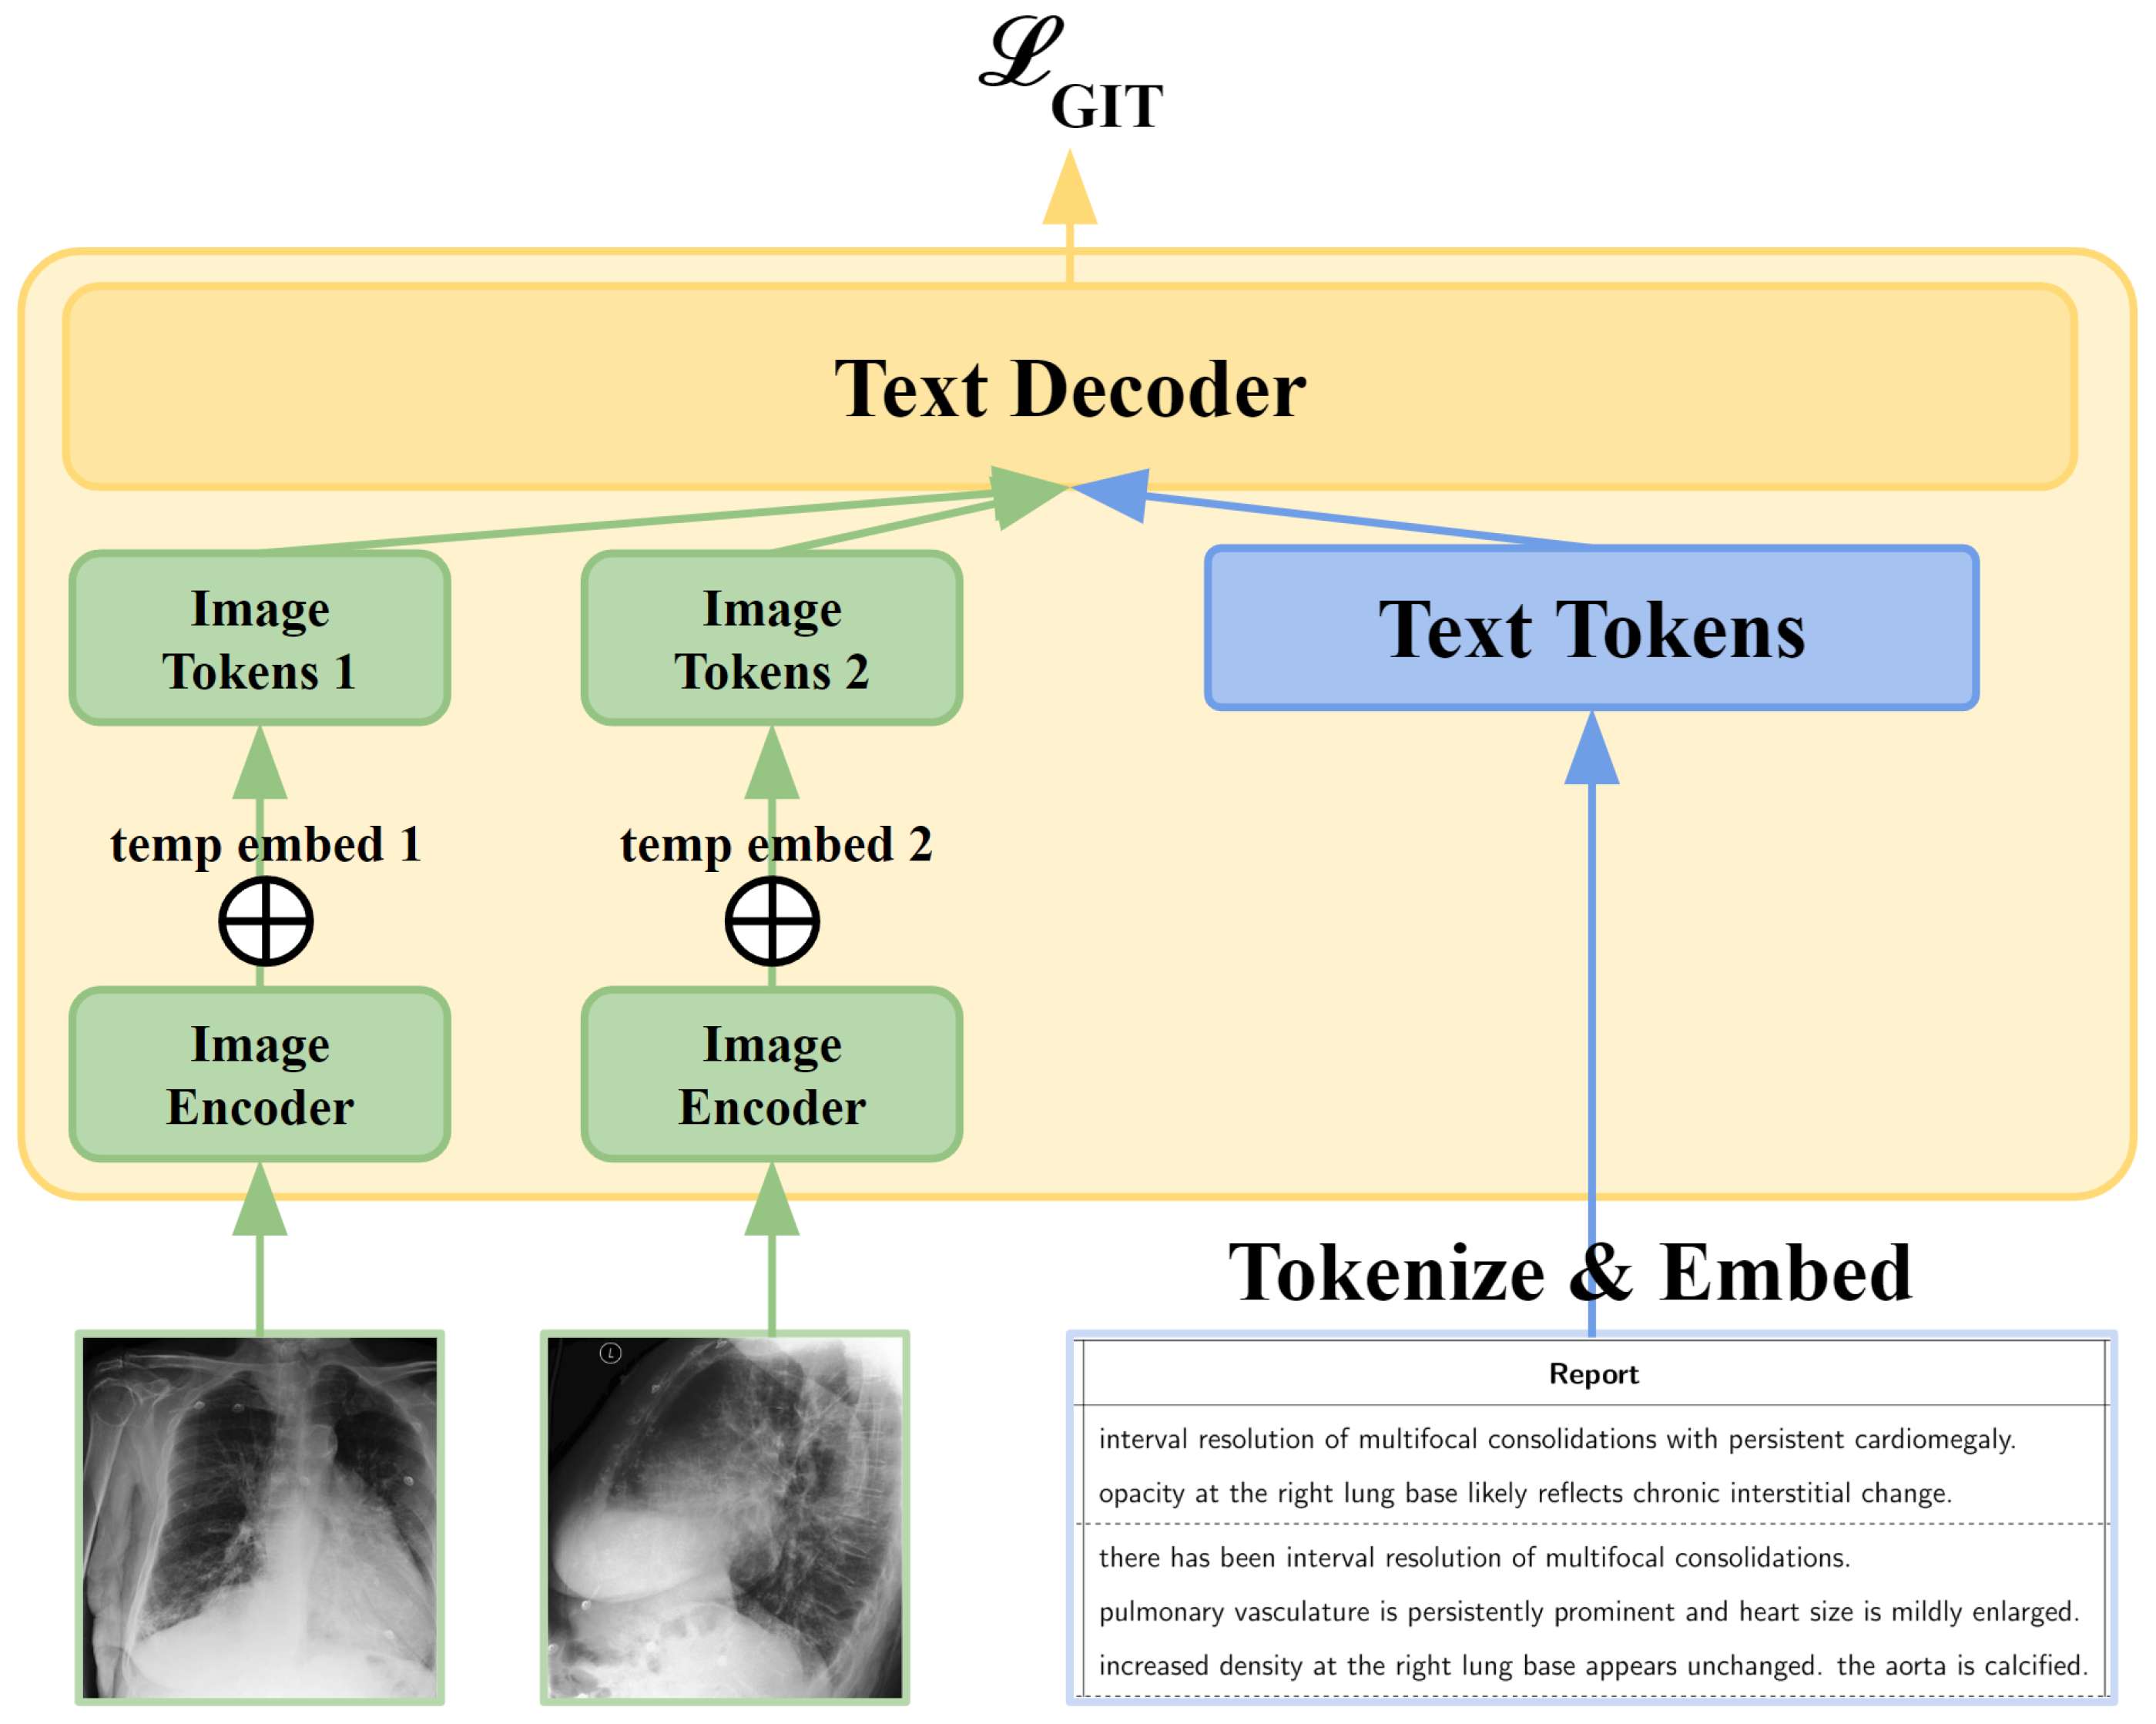
3.2. GIT-CXR (MV)
3.3. Context
3.4. GIT-CXR-CLS
3.5. Curriculum Learning
4. Experiments
4.1. Dataset
4.1.1. Studies
4.1.2. Generation of Reports
4.1.3. Images
4.1.4. Labels
4.2. Evaluation Metrics
4.3. Experimental Setup
5. Results and Discussion
5.1. Ablation Study
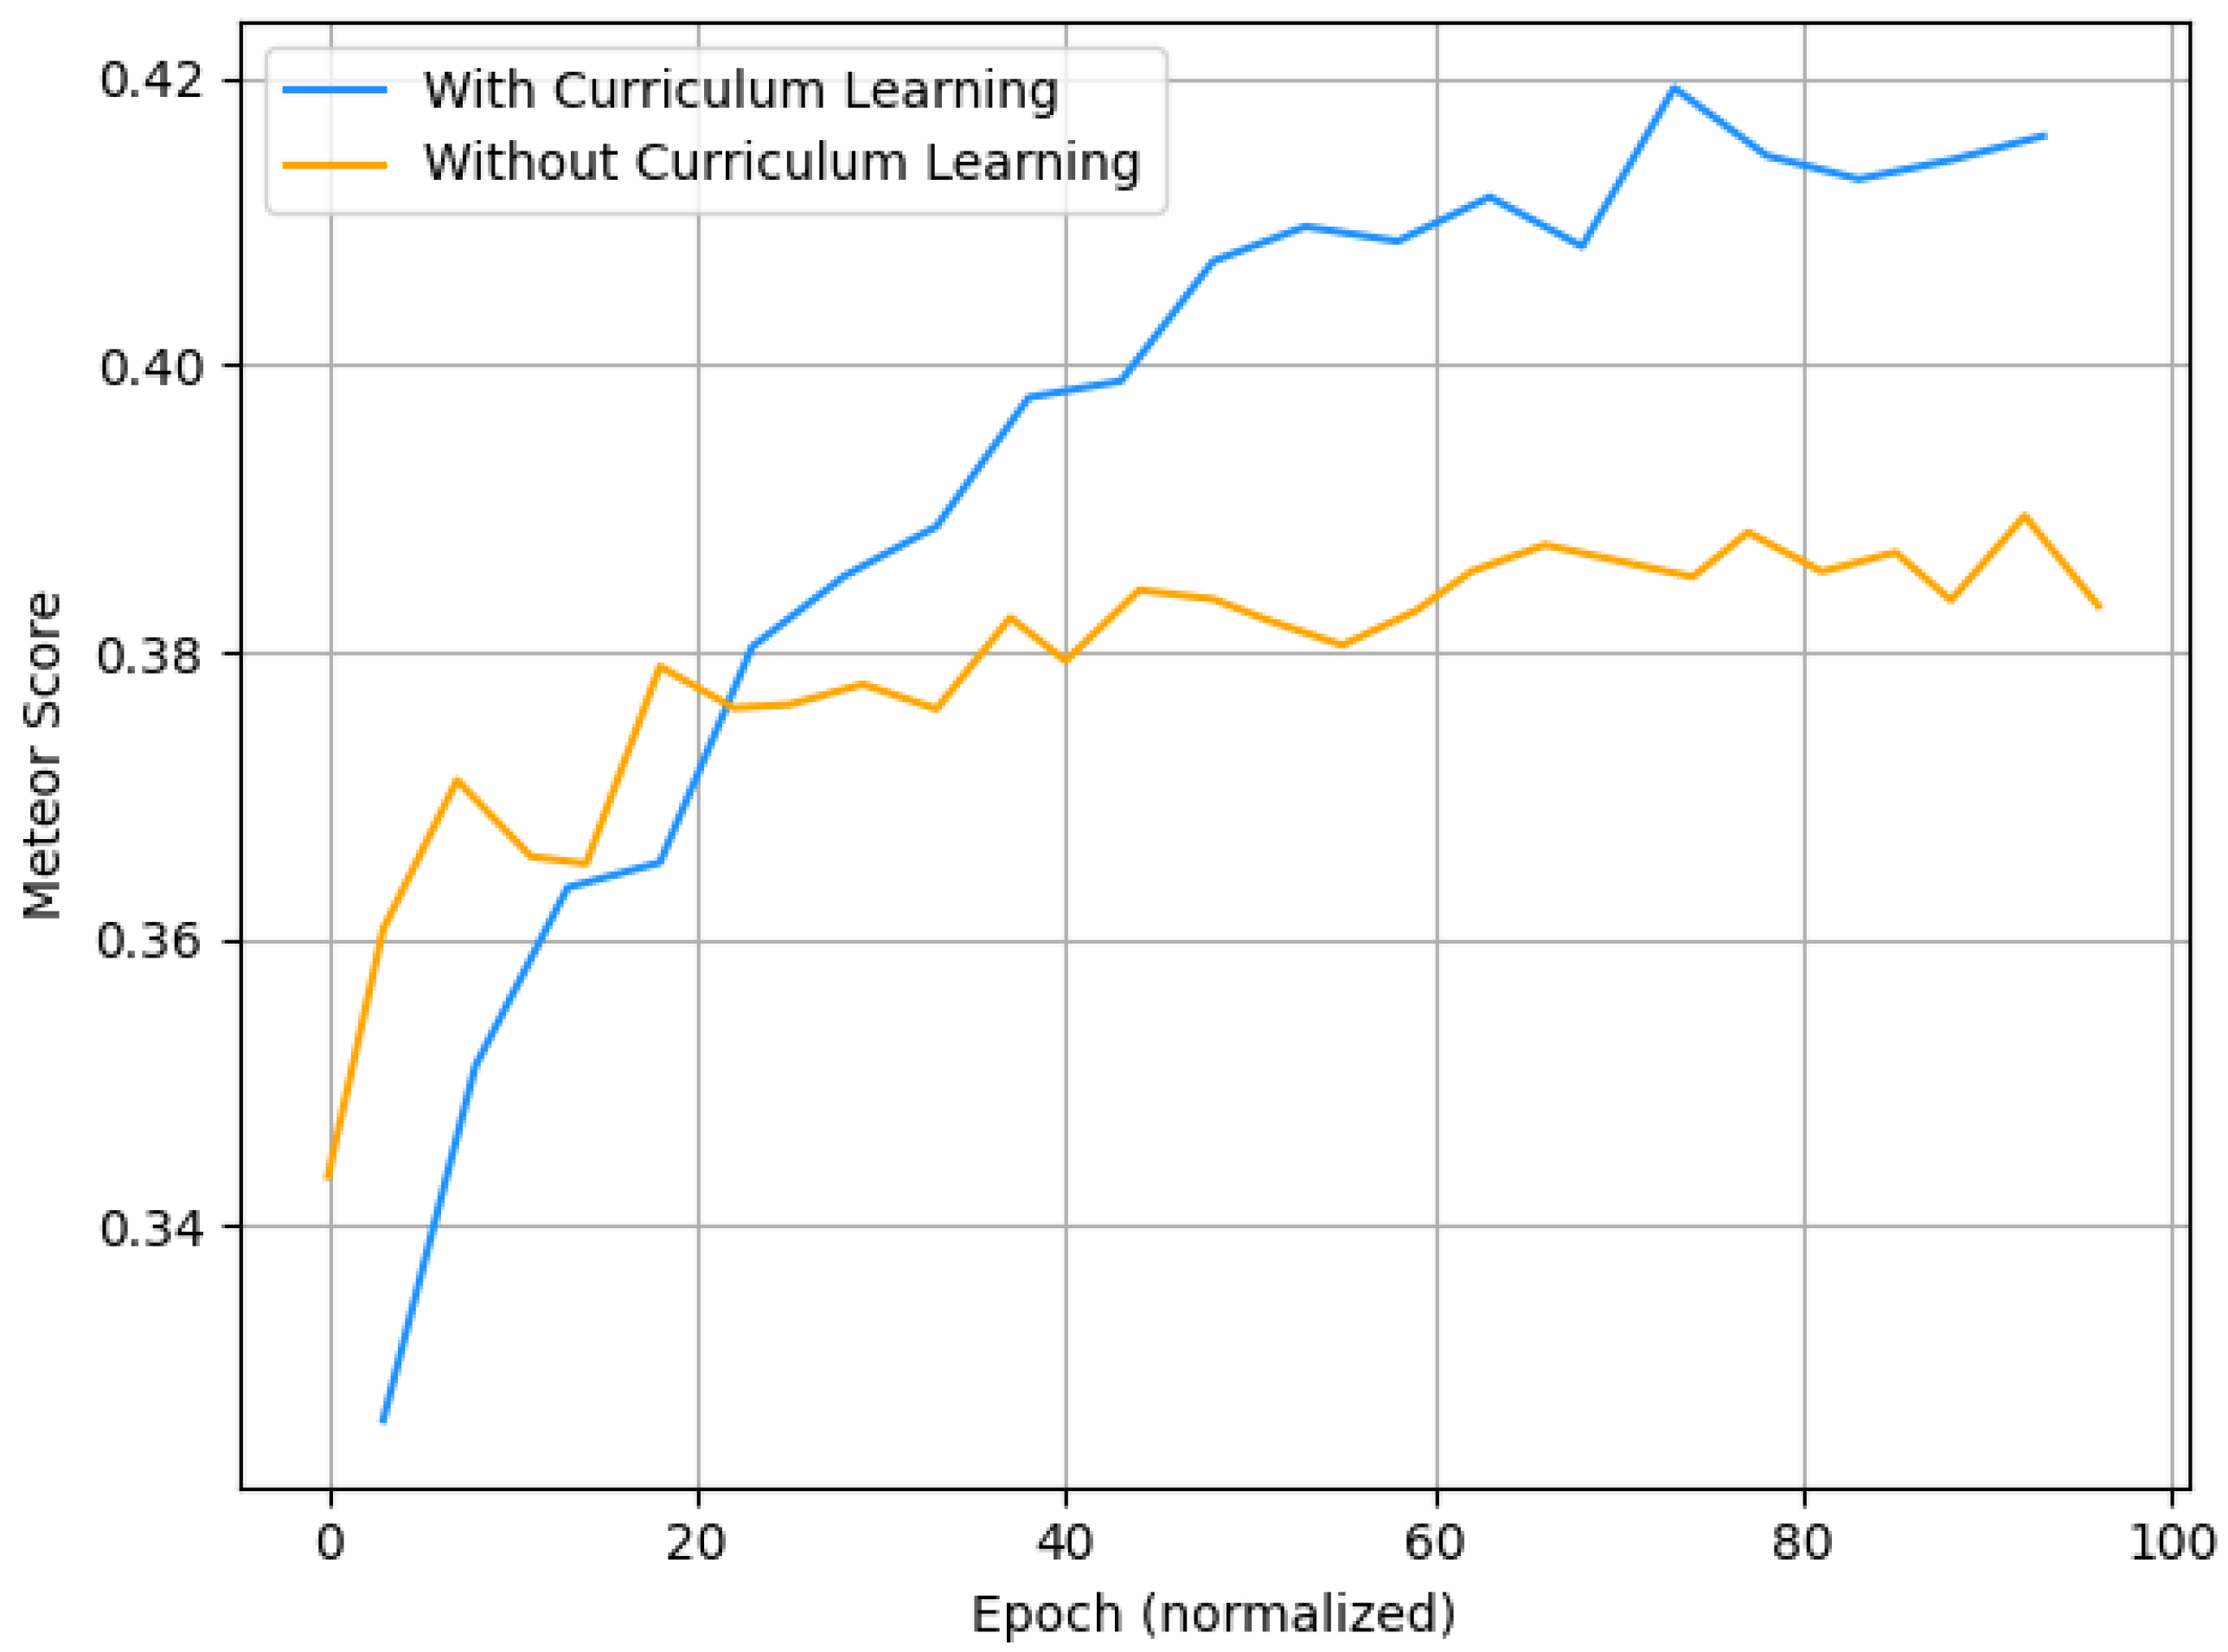
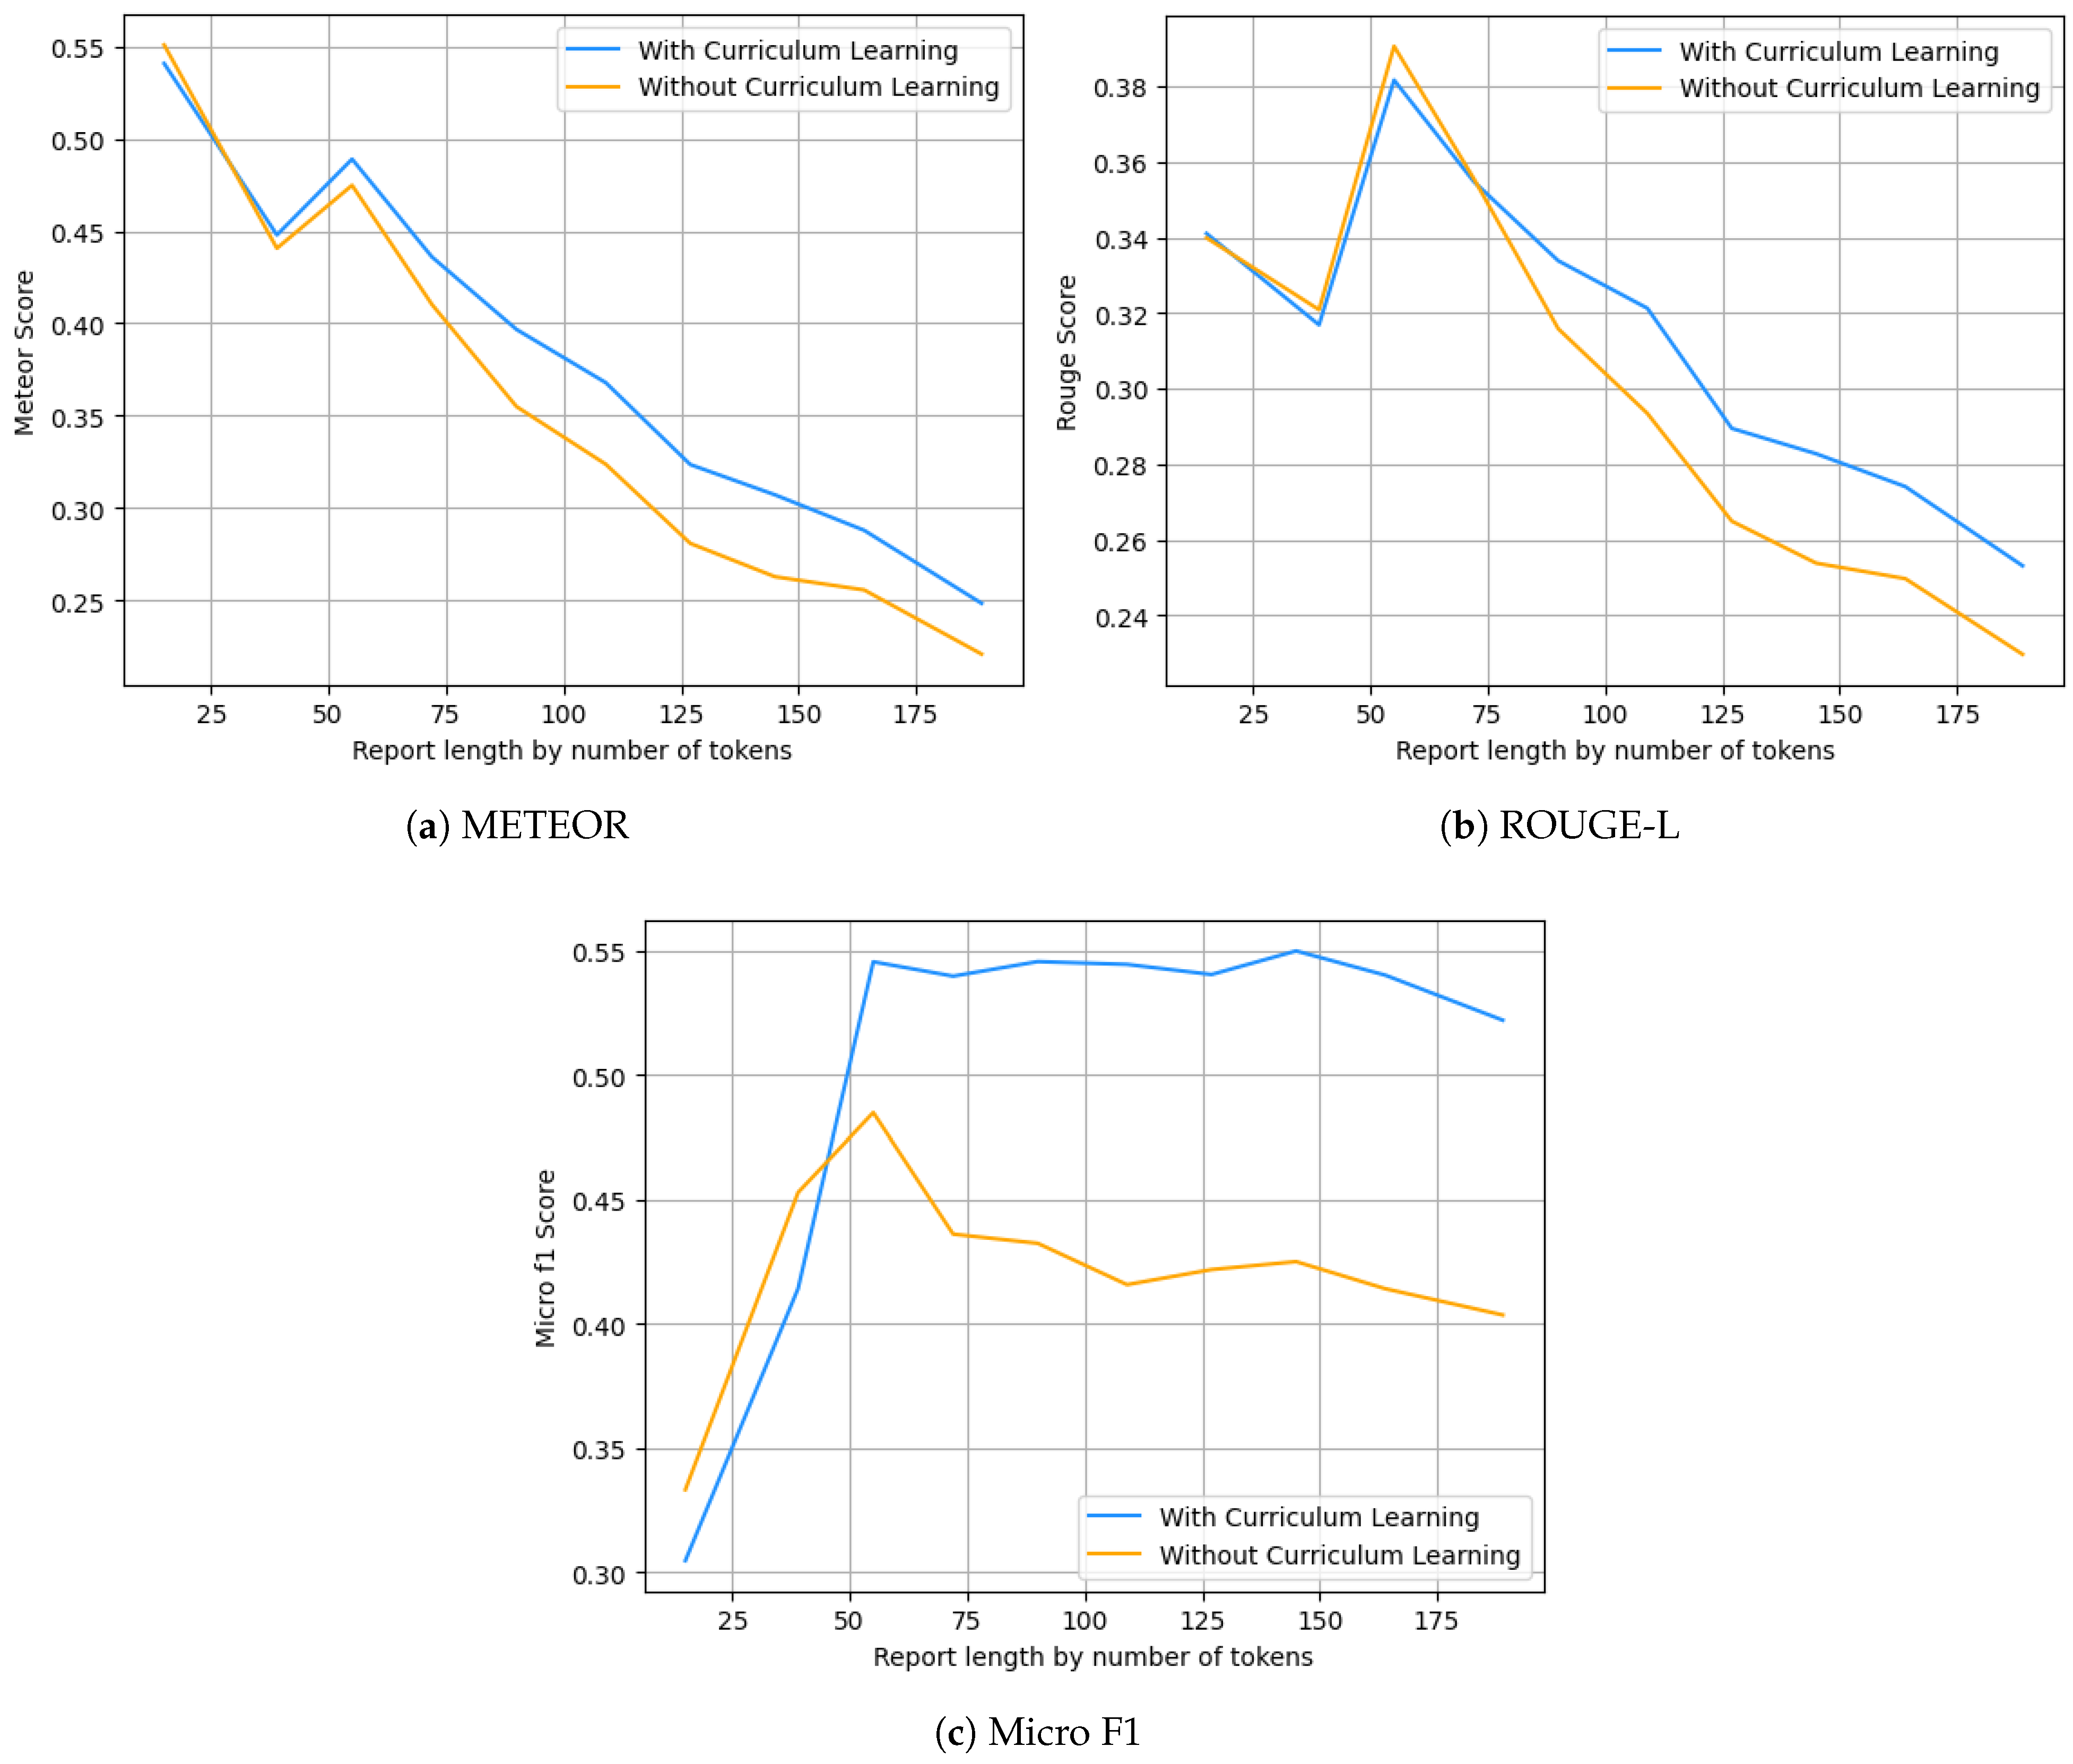
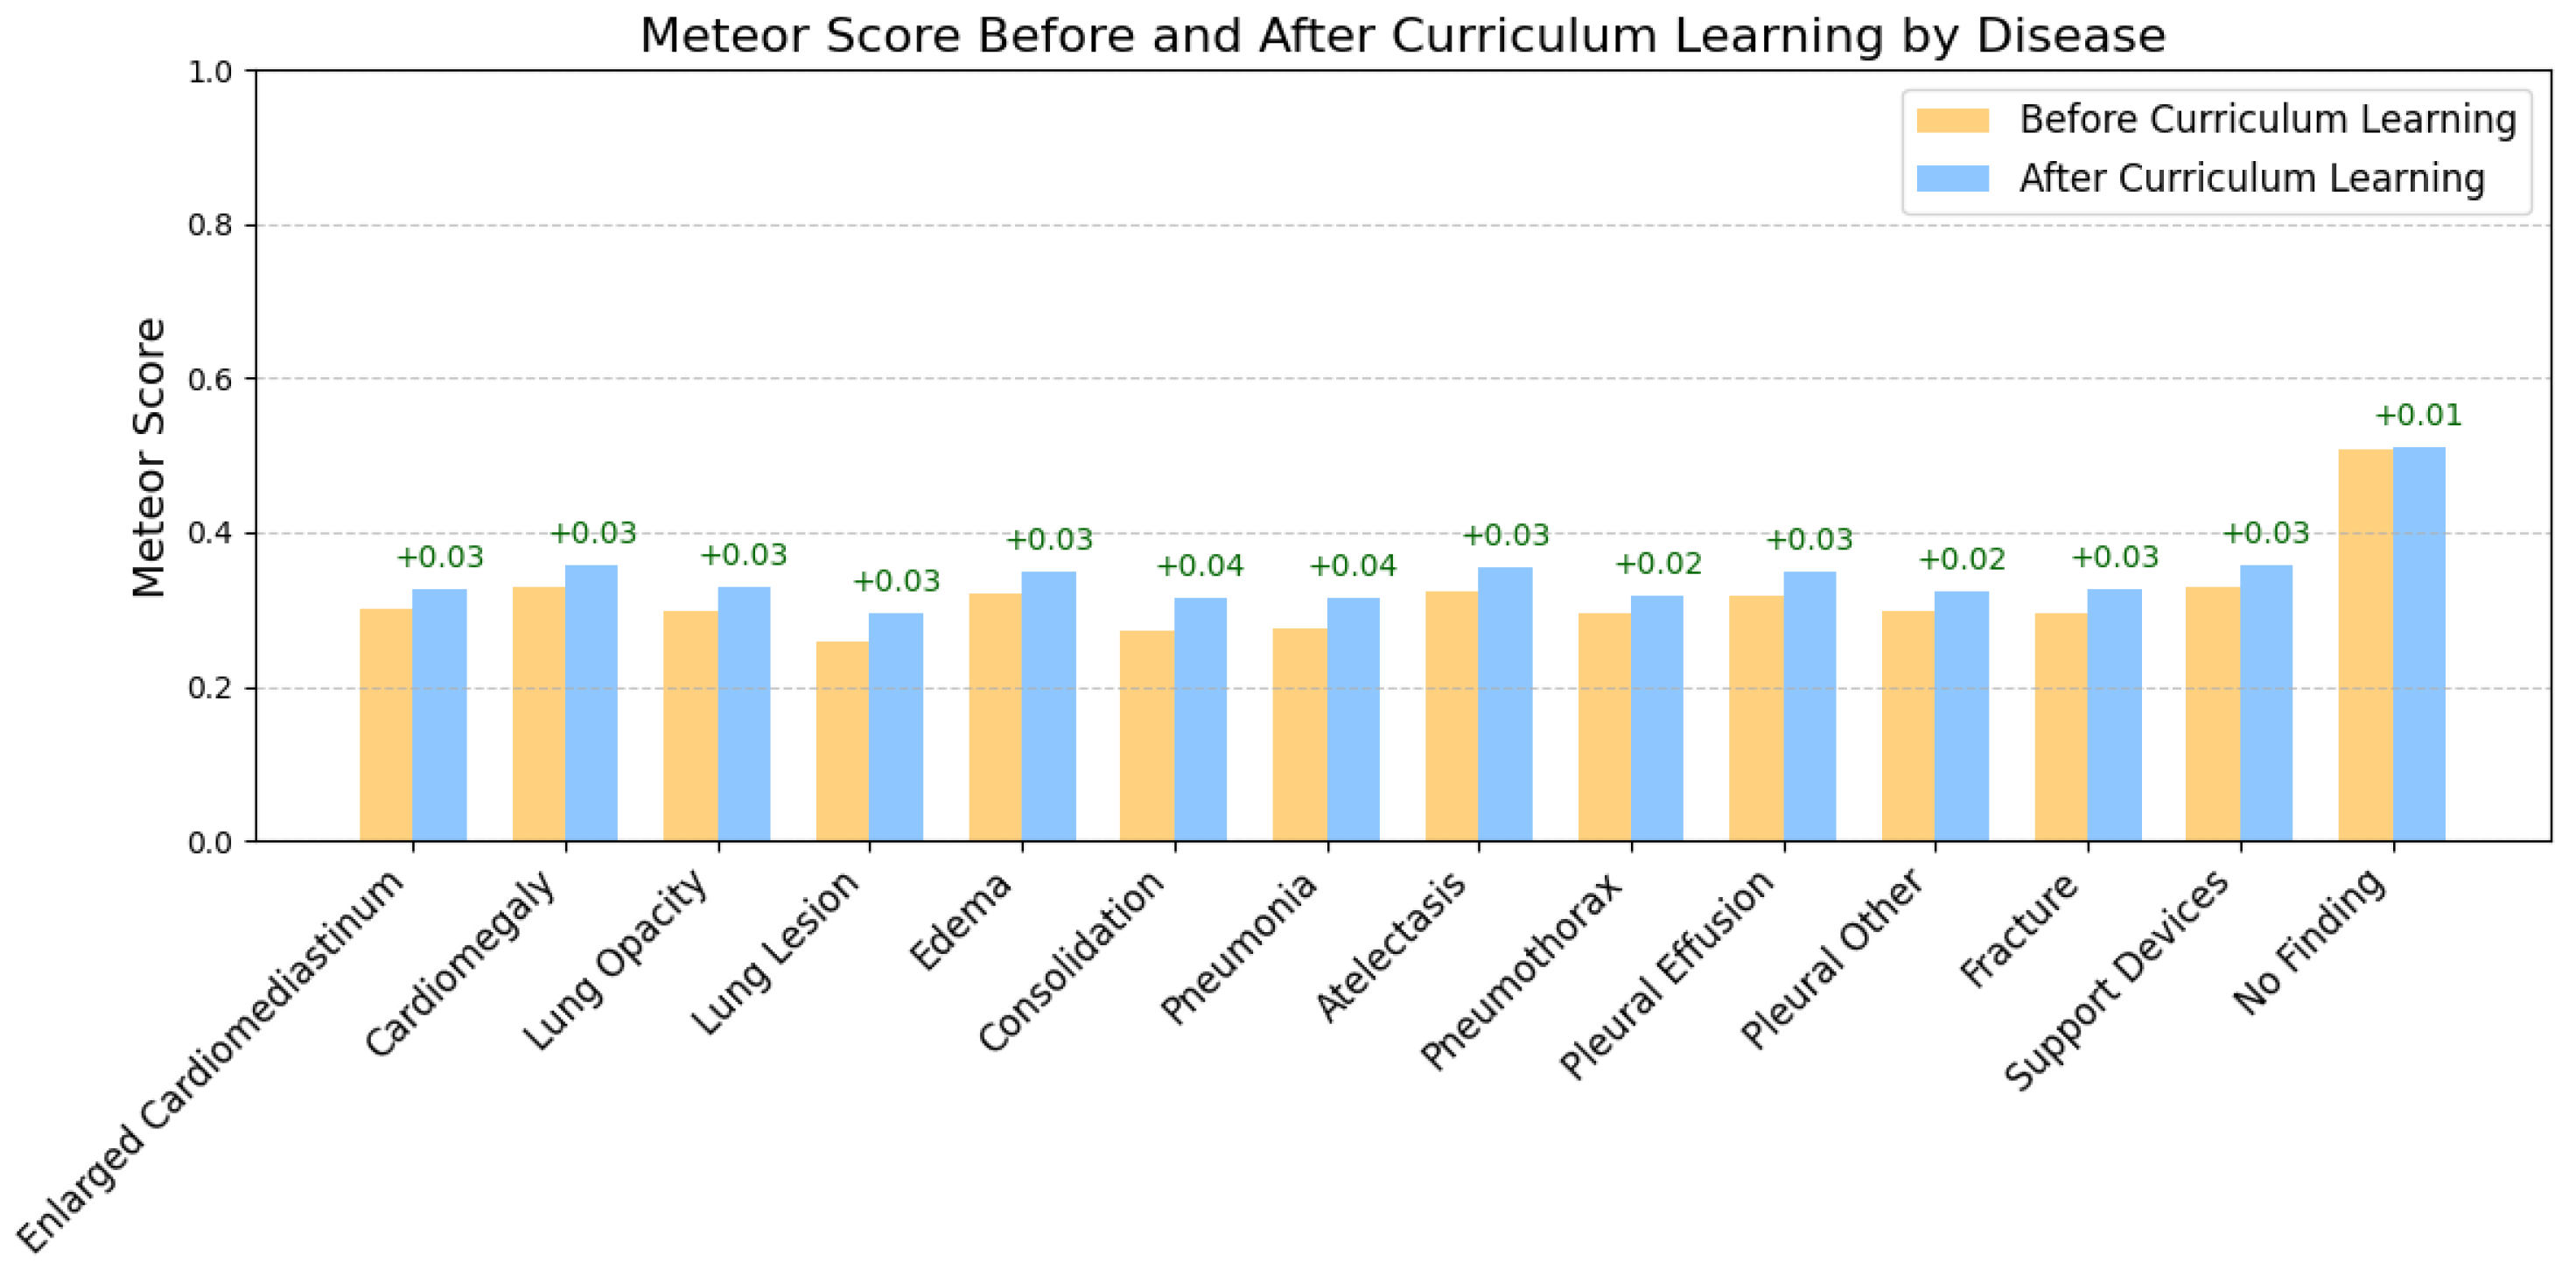
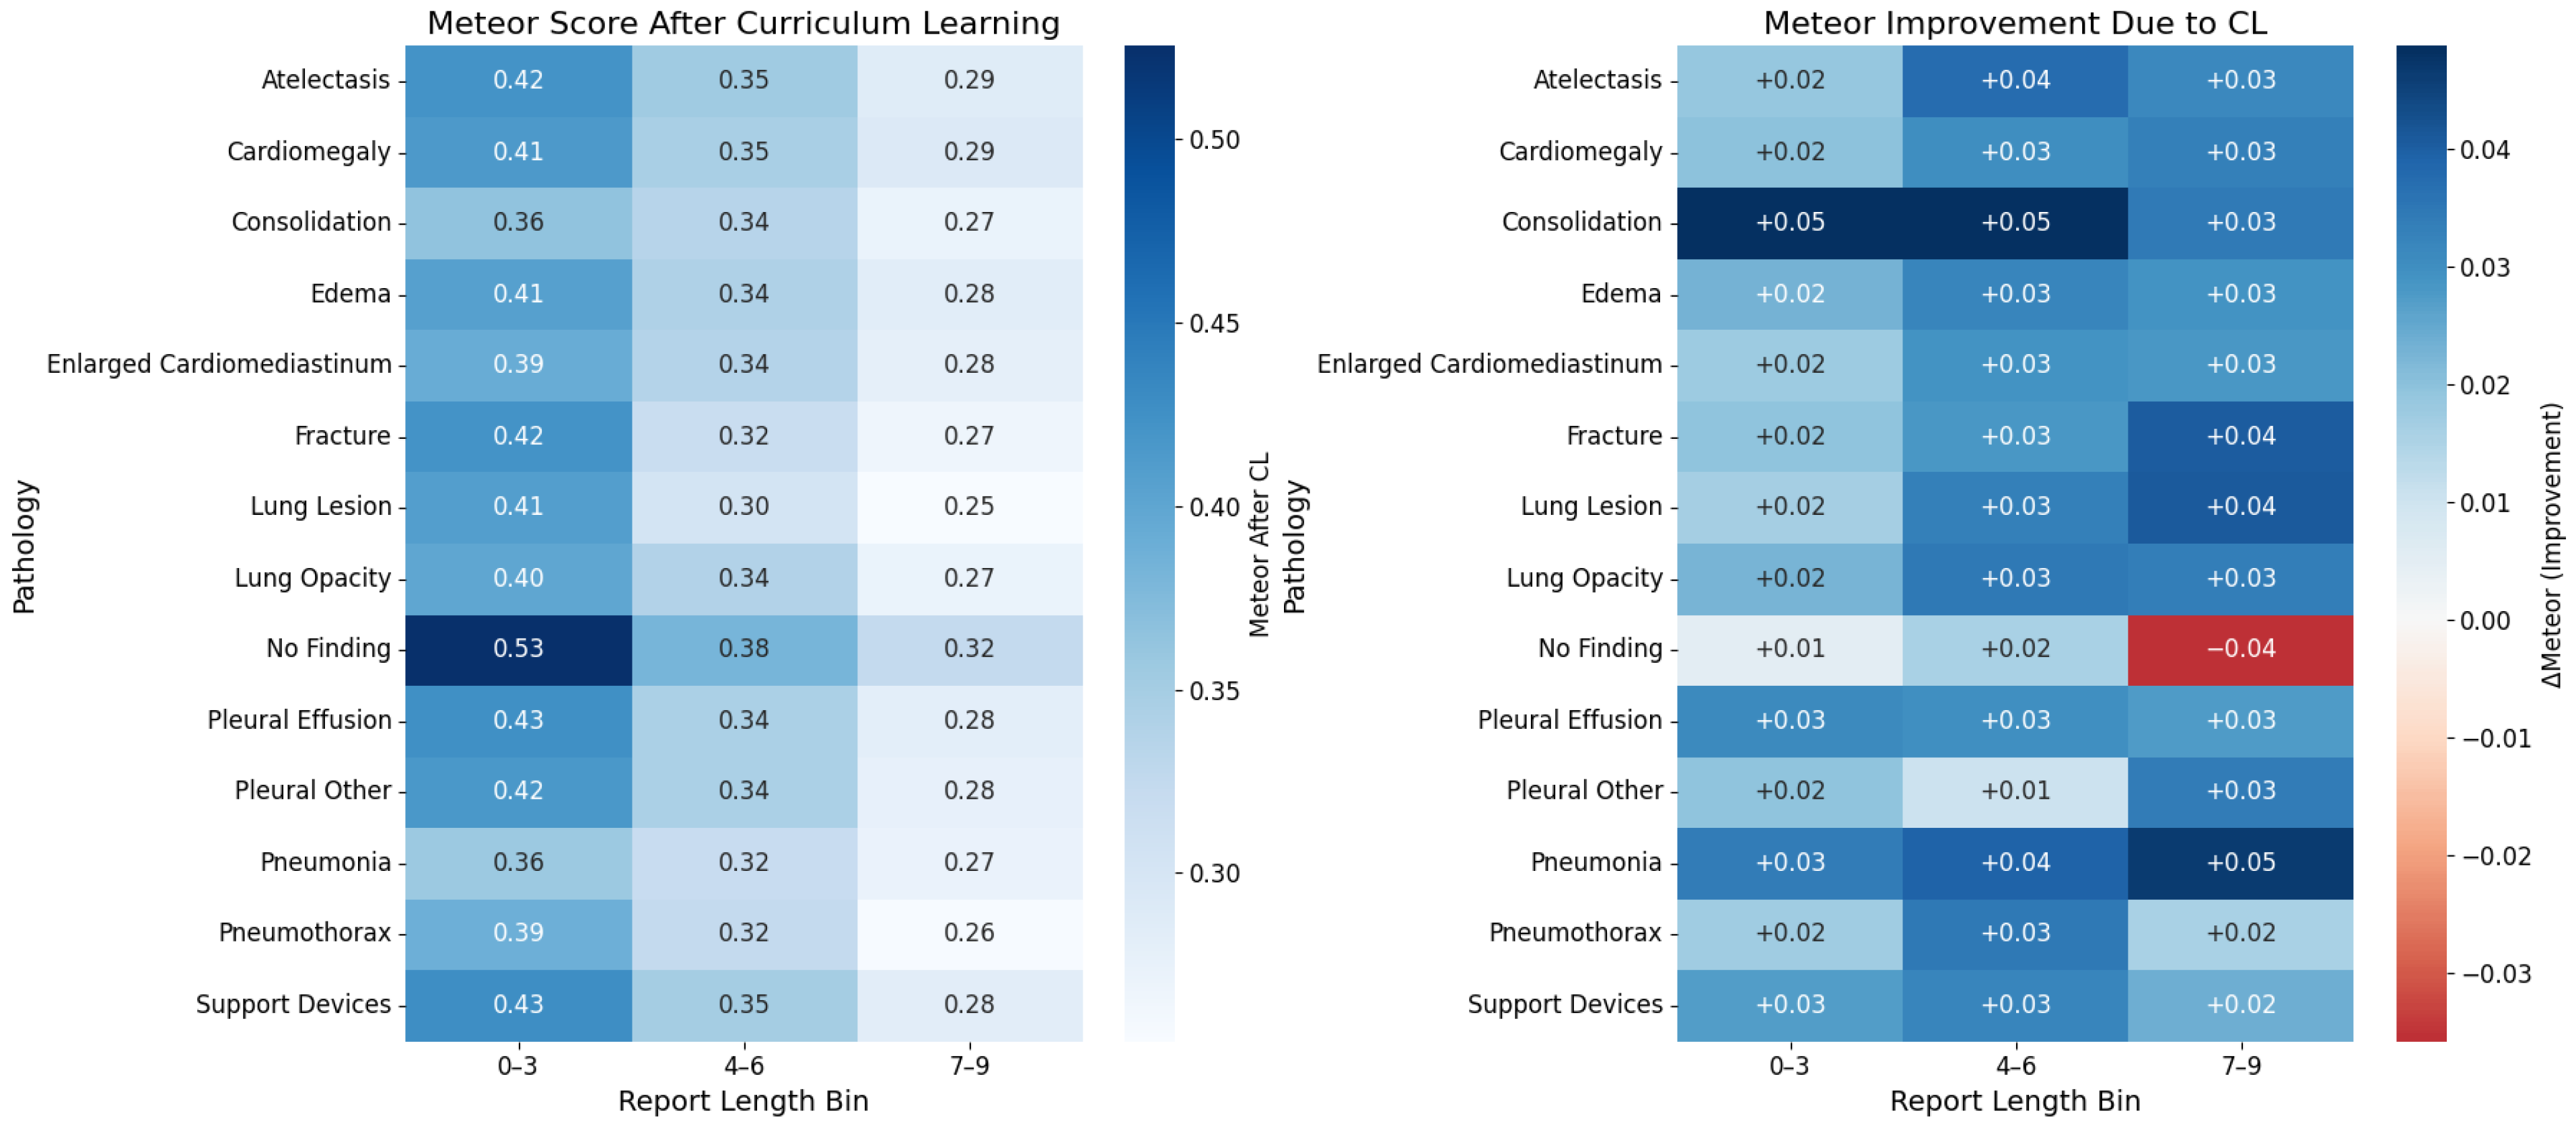
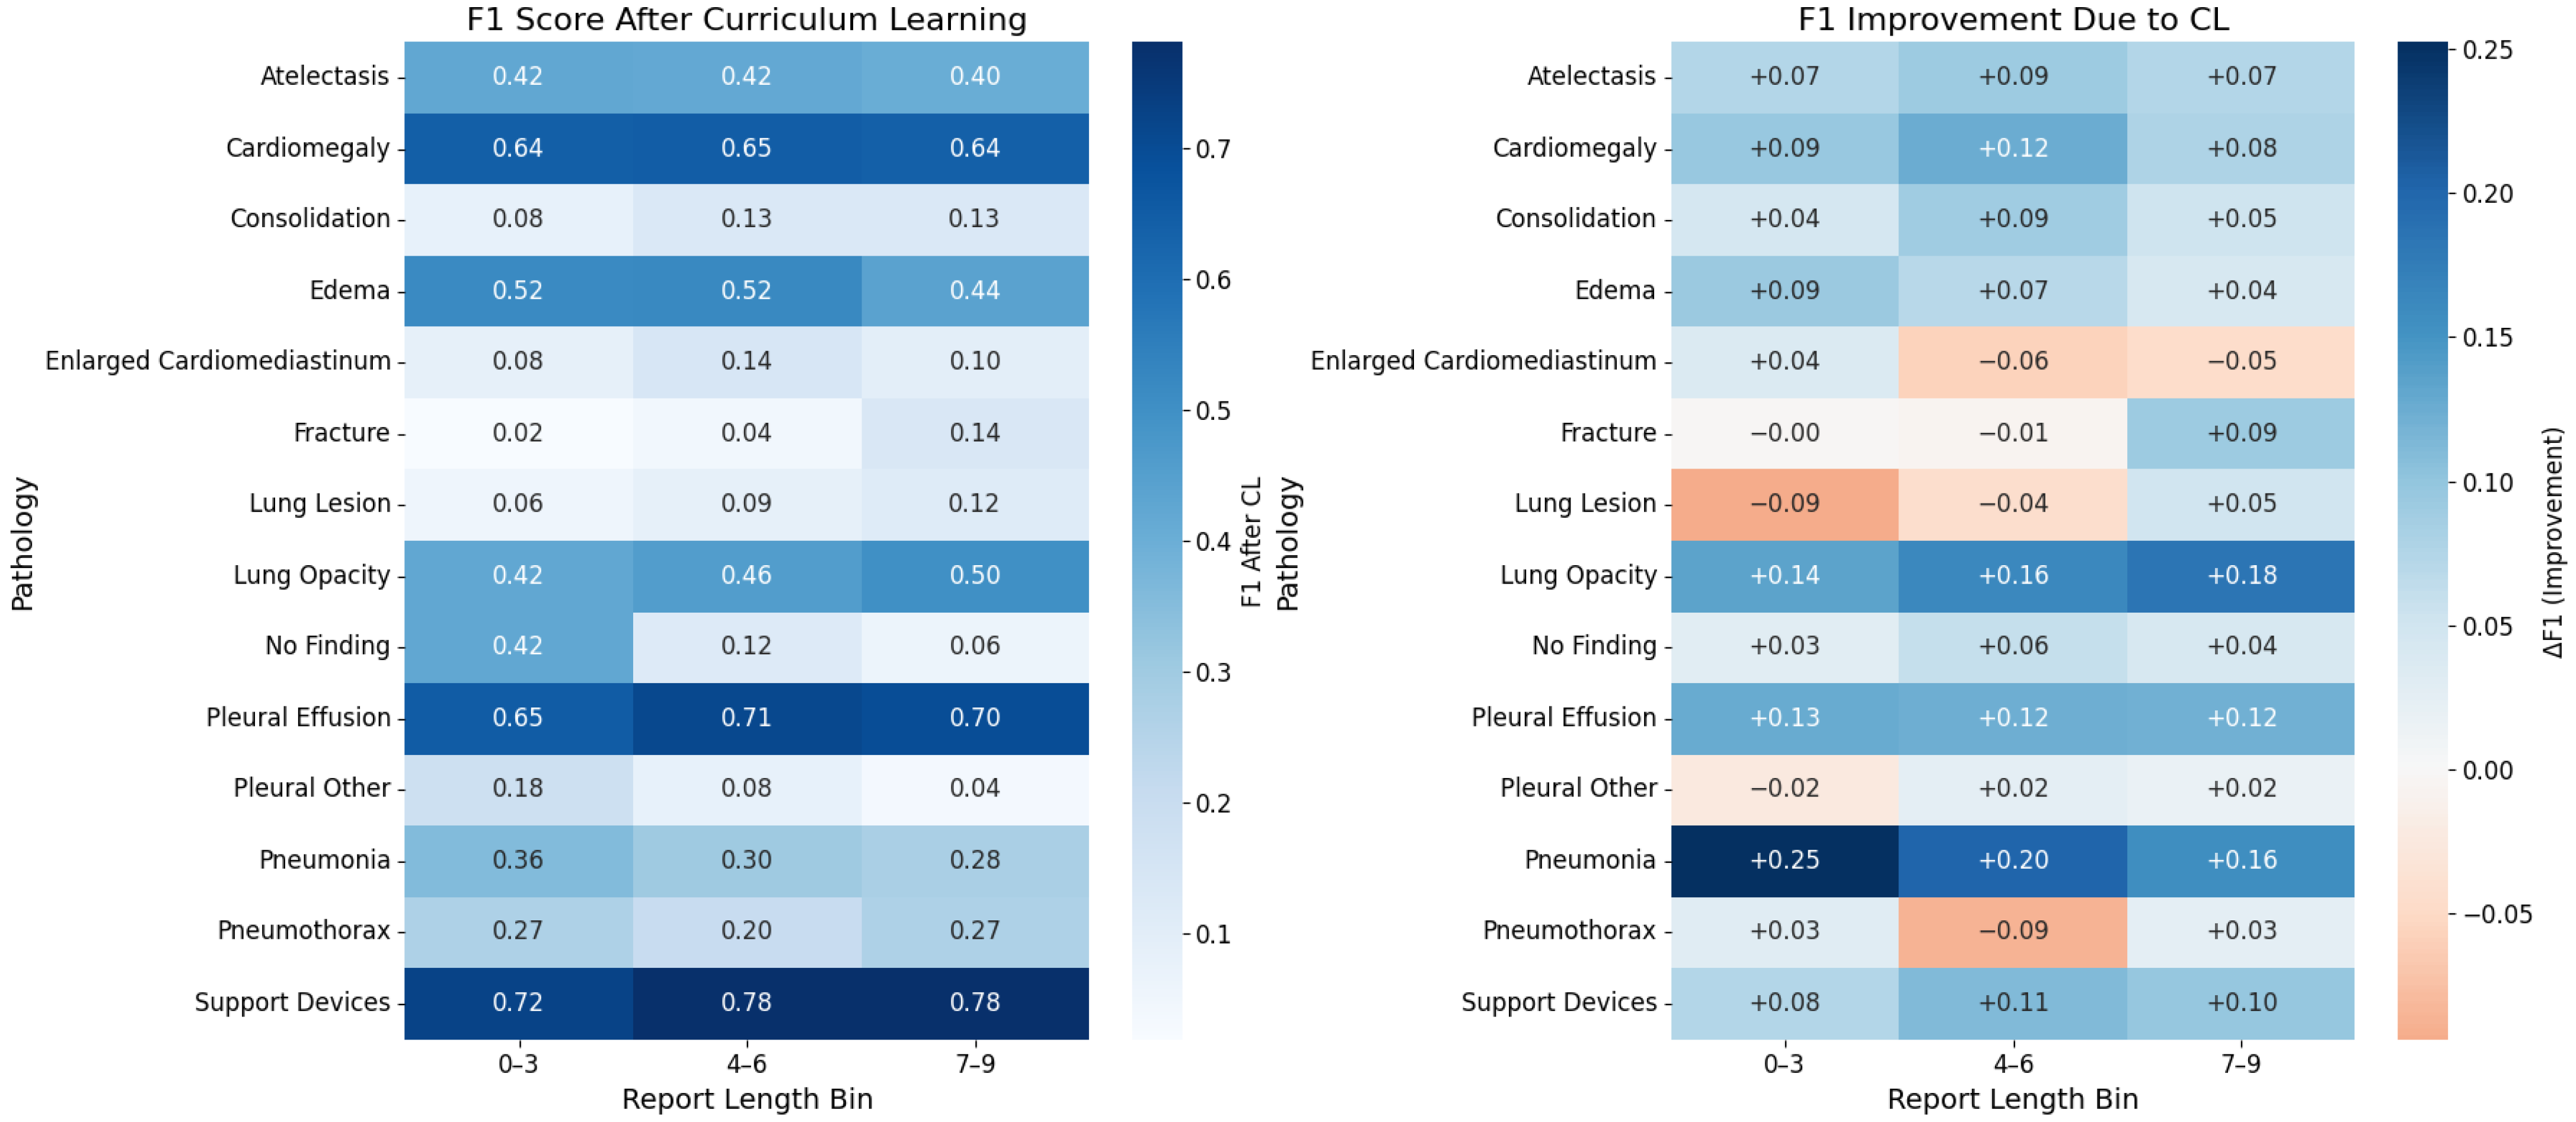
Curriculum Learning Impact
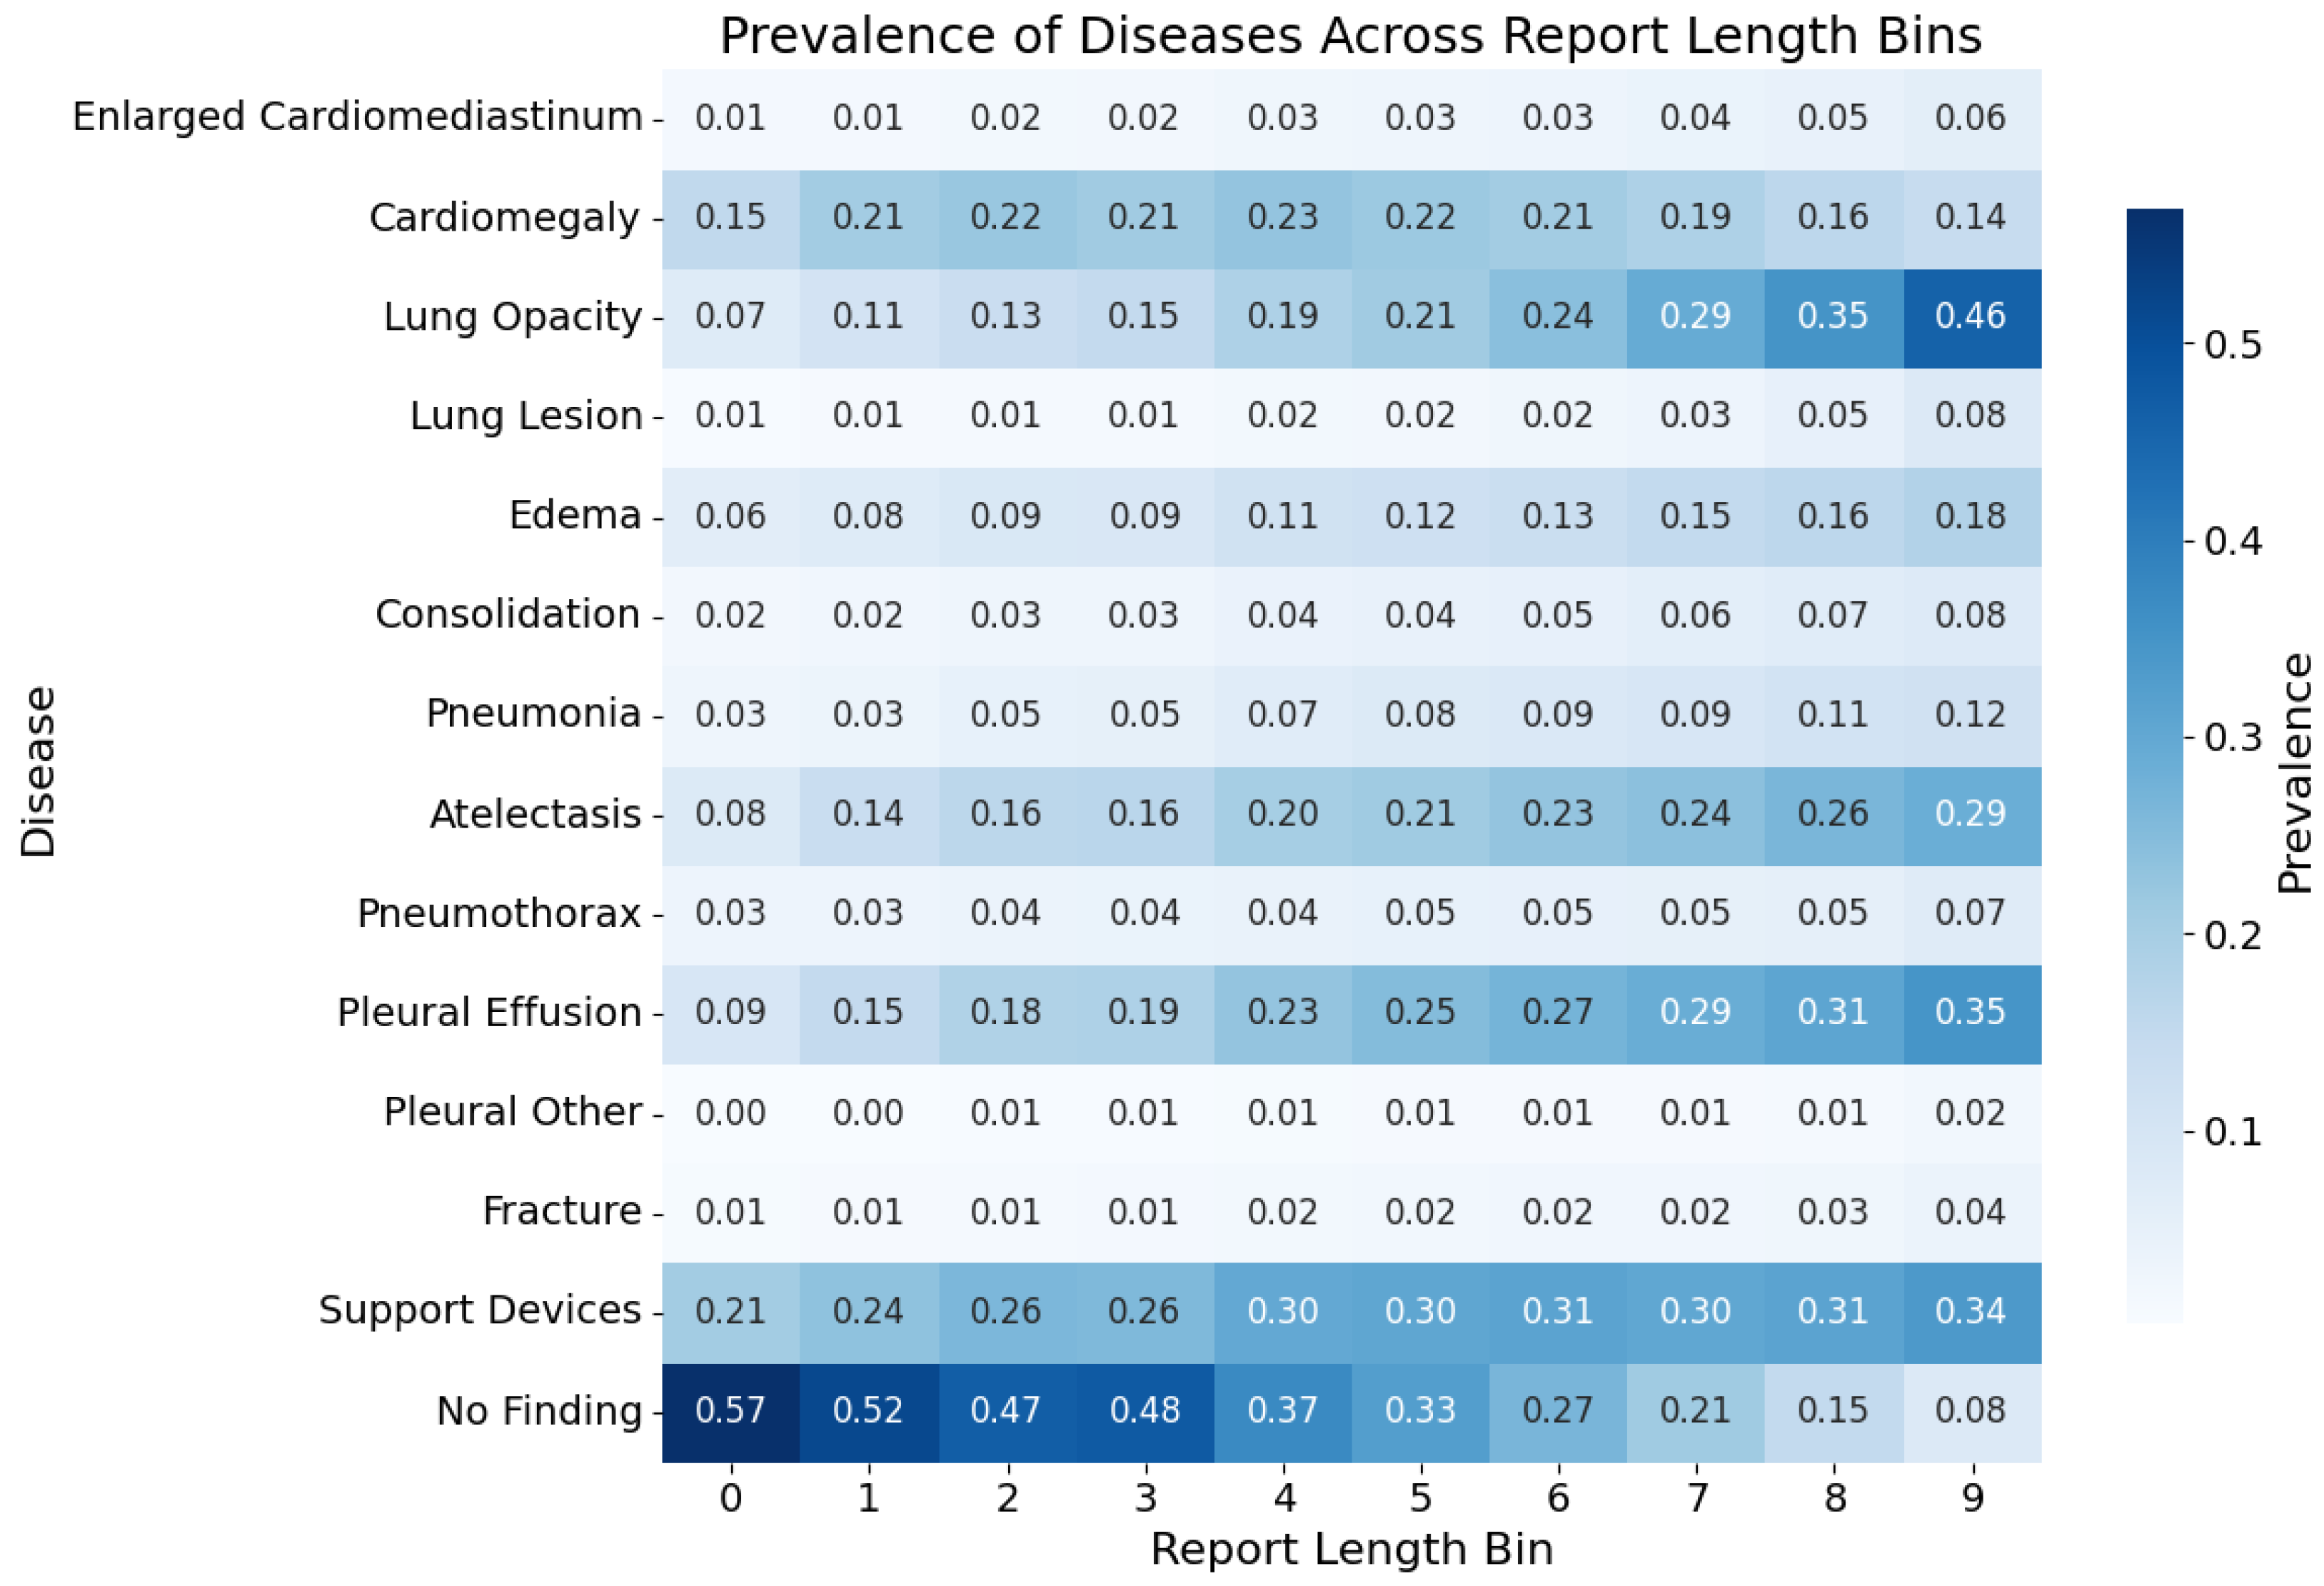
5.2. Labels Analysis

| Category | F1 | P | R | Support |
|---|---|---|---|---|
| Enlarged Cardiomediastinum | 230 | |||
| Cardiomegaly | 1168 | |||
| Lung Opacity | 1131 | |||
| Lung Lesion | 178 | |||
| Edema | 695 | |||
| Consolidation | 187 | |||
| Pneumonia | 213 | |||
| Atelectasis | 890 | |||
| Pneumothorax | 71 | |||
| Pleural Effusion | 1116 | |||
| Pleural Other | 114 | |||
| Fracture | 161 | |||
| Support Devices | 1327 | |||
| No Finding | 193 | |||
| MACRO_AVG | ||||
| MICRO_AVG |
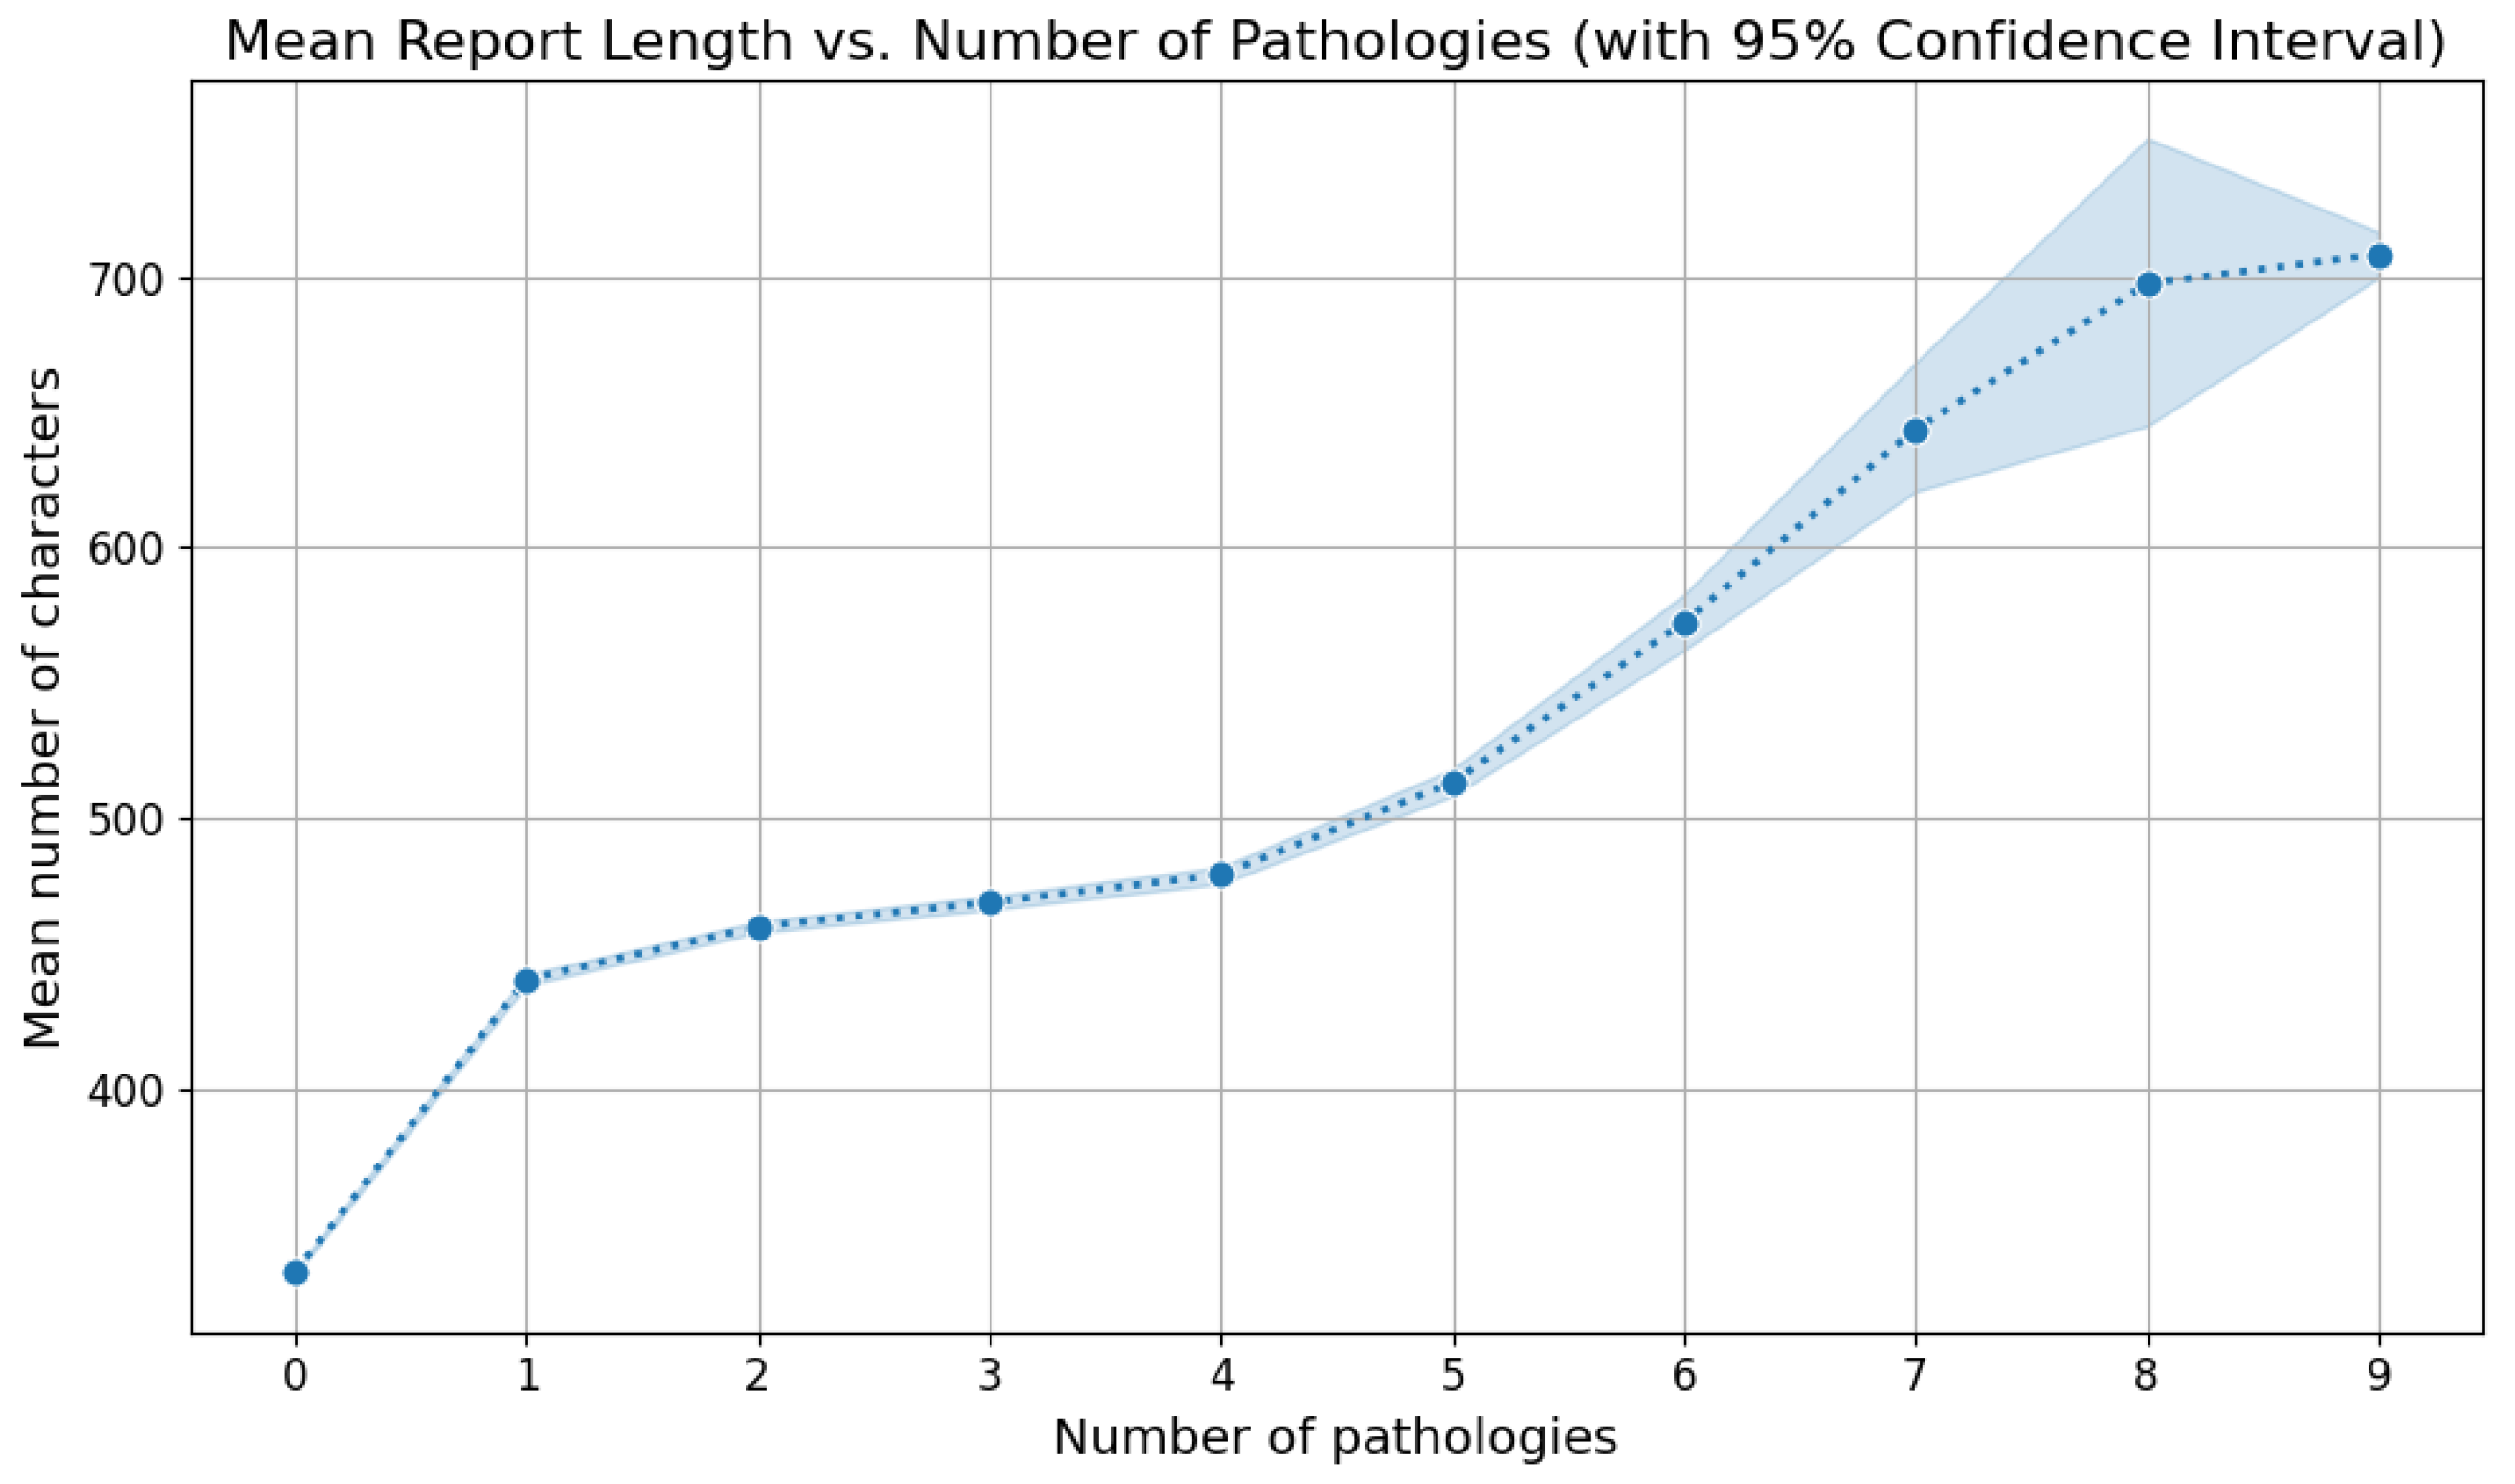
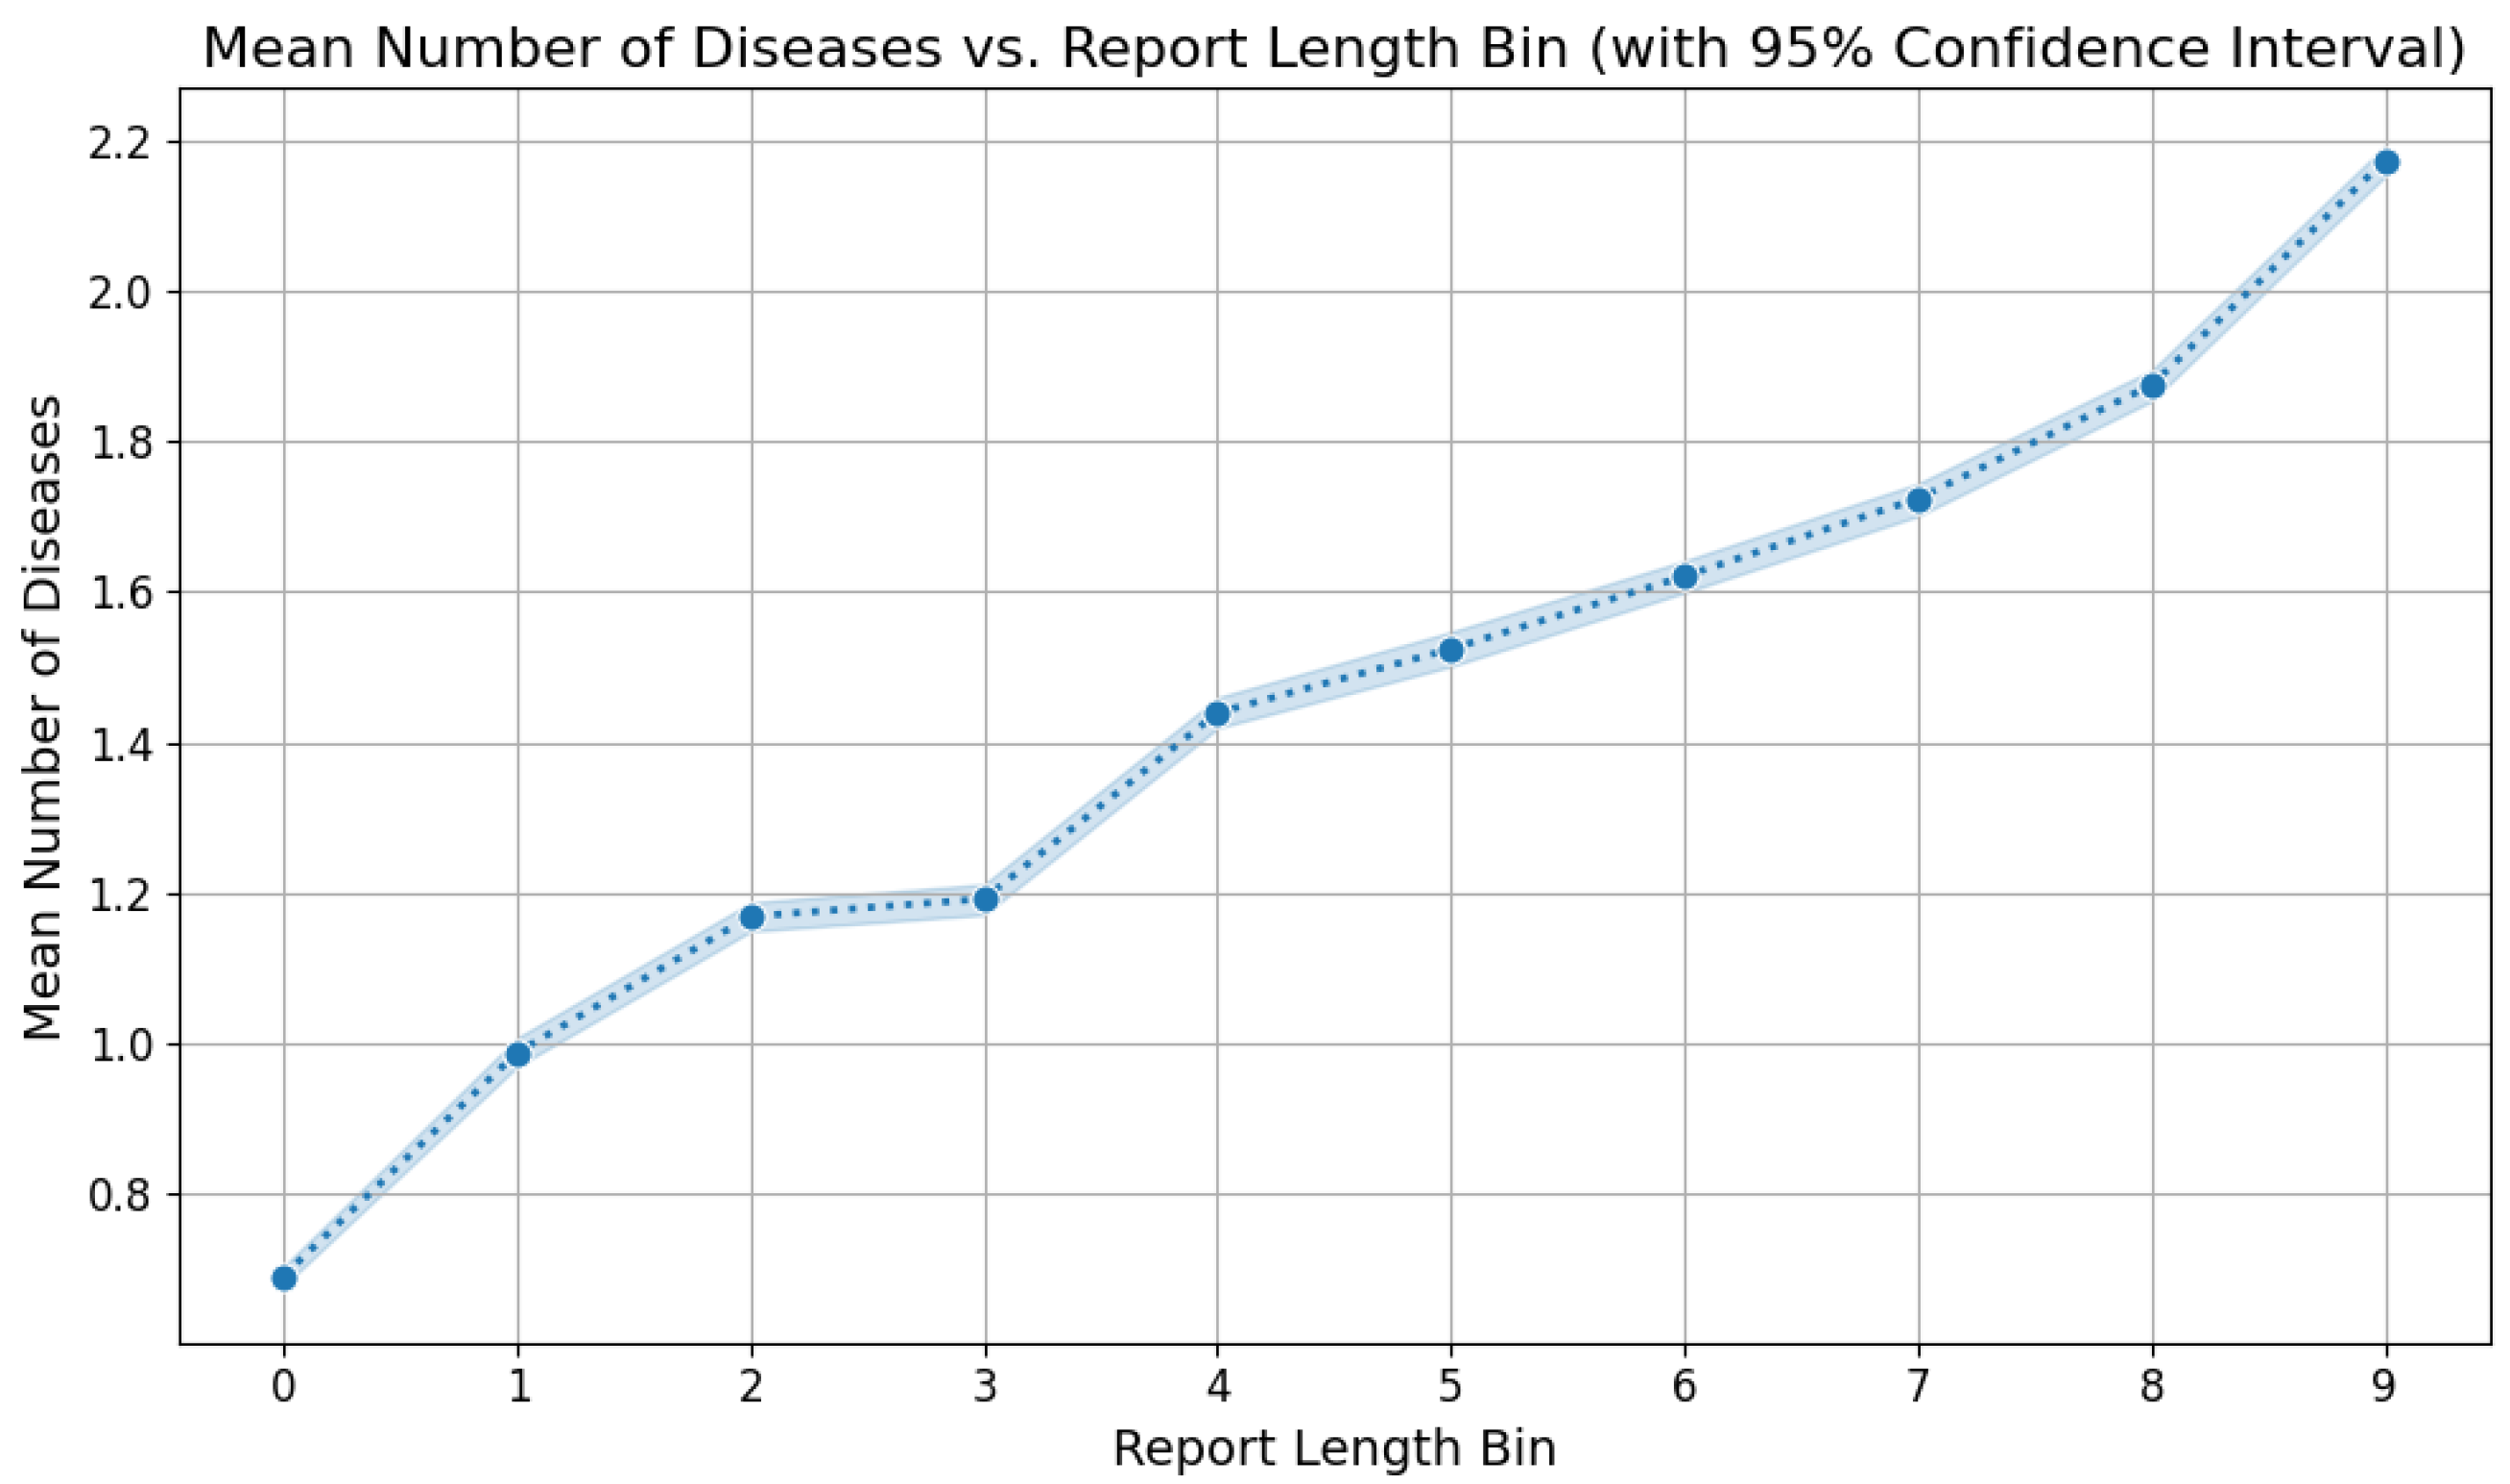
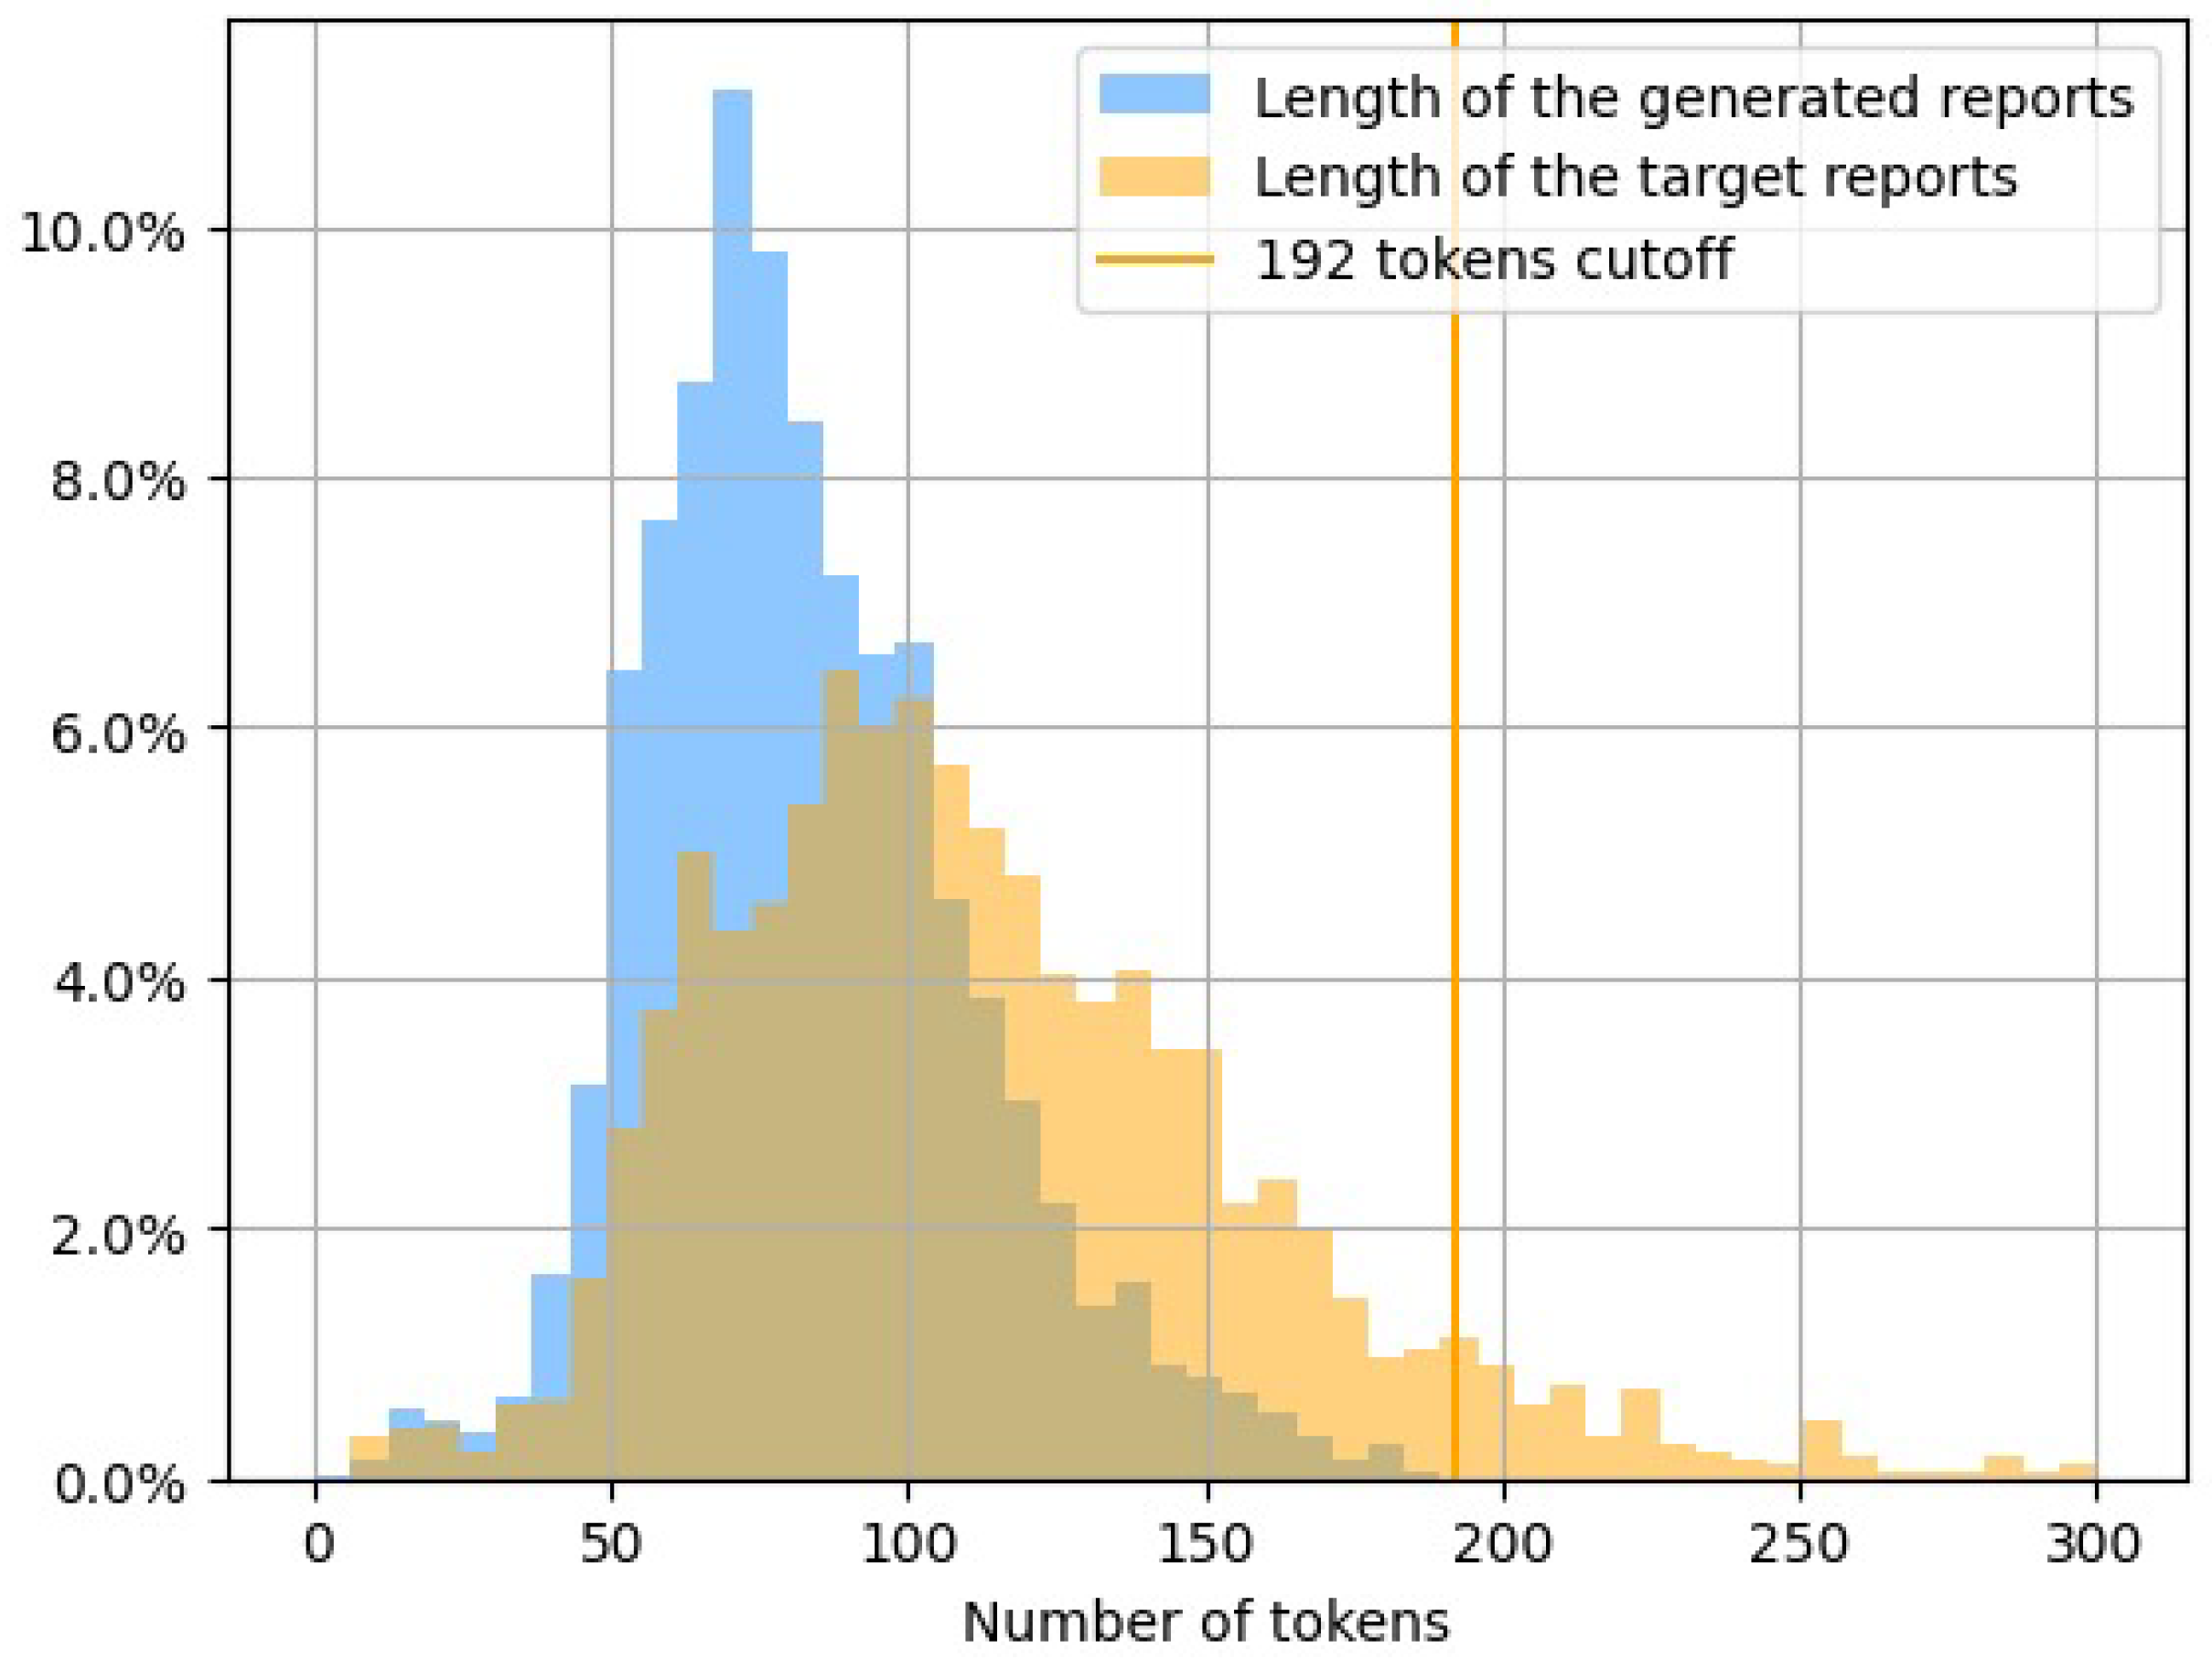
5.3. Reports Analysis
6. Conclusions
7. Limitations
Author Contributions
Funding
Institutional Review Board Statement
Informed Consent Statement
Data Availability Statement
Conflicts of Interest
Abbreviations
| AP | Anterior–Posterior (regarding the viewpoint of a chest X-ray image) |
| CL | Curriculum Learning |
| CNN | Convolutional Neural Network |
| GIT | Generative Image-to-text Transformer |
| LAT | Lateral (regarding the viewpoint of a chest X-ray image) |
| LL | Left Lateral (regarding the viewpoint of a chest X-ray image) |
| LSTM | Long Short-Term Memory |
| NLG | Natural Language Generation |
| NLP | Natural Language Processing |
| PA | Posterior–Anterior (regarding the viewpoint of a chest X-ray image) |
| RNN | Recurrent Neural Network |
References
- Jing, B.; Xie, P.; Xing, E. On the automatic generation of medical imaging reports. arXiv 2017, arXiv:1711.08195. [Google Scholar]
- Li, Y.; Liang, X.; Hu, Z.; Xing, E.P. Hybrid retrieval-generation reinforced agent for medical image report generation. Adv. Neural Inf. Process. Syst. 2018, 31, 1537–1547. [Google Scholar]
- Delrue, L.; Gosselin, R.; Ilsen, B.; Van Landeghem, A.; de Mey, J.; Duyck, P. Difficulties in the interpretation of chest radiography. In Comparative Interpretation of CT and Standard Radiography of the Chest; Springer: Berlin/Heidelberg, Germany, 2011; pp. 27–49. [Google Scholar]
- Cao, Y.; Cui, L.; Zhang, L.; Yu, F.; Li, Z.; Xu, Y. MMTN: Multi-modal memory transformer network for image-report consistent medical report generation. In Proceedings of the AAAI Conference on Artificial Intelligence, Washington, DC, USA, 7–14 February 2023; Volume 37, pp. 277–285. [Google Scholar]
- Wang, J.; Yang, Z.; Hu, X.; Li, L.; Lin, K.; Gan, Z.; Liu, Z.; Liu, C.; Wang, L. Git: A generative image-to-text transformer for vision and language. arXiv 2022, arXiv:2205.14100. [Google Scholar]
- Tanida, T.; Müller, P.; Kaissis, G.; Rueckert, D. Interactive and explainable region-guided radiology report generation. In Proceedings of the IEEE/CVF Conference on Computer Vision and Pattern Recognition, Vancouver, BC, Canada, 17–24 June 2023; pp. 7433–7442. [Google Scholar]
- Bu, S.; Li, T.; Yang, Y.; Dai, Z. Instance-level Expert Knowledge and Aggregate Discriminative Attention for Radiology Report Generation. In Proceedings of the IEEE/CVF Conference on Computer Vision and Pattern Recognition, Seattle, WA, USA, 16–22 June 2024; pp. 14194–14204. [Google Scholar]
- Zhao, G.; Zhao, Z.; Gong, W.; Li, F. Radiology report generation with medical knowledge and multilevel image-report alignment: A new method and its verification. Artif. Intell. Med. 2023, 146, 102714. [Google Scholar] [CrossRef]
- Johnson, A.E.; Pollard, T.J.; Greenbaum, N.R.; Lungren, M.P.; Deng, C.y.; Peng, Y.; Lu, Z.; Mark, R.G.; Berkowitz, S.J.; Horng, S. MIMIC-CXR-JPG, a large publicly available database of labeled chest radiographs. arXiv 2019, arXiv:1901.07042. [Google Scholar]
- Banerjee, S.; Lavie, A. METEOR: An automatic metric for MT evaluation with improved correlation with human judgments. In Proceedings of the ACL Workshop on Intrinsic and Extrinsic Evaluation Measures for Machine Translation and/or Summarization, Ann Arbor, MI, USA, 29 June 2005; pp. 65–72. [Google Scholar]
- Papineni, K.; Roukos, S.; Ward, T.; Zhu, W.J. Bleu: A method for automatic evaluation of machine translation. In Proceedings of the 40th Annual Meeting of the Association for Computational Linguistics, Philadelphia, PA, USA, 6–12 July 2002; pp. 311–318. [Google Scholar]
- Lin, C.Y. Rouge: A package for automatic evaluation of summaries. In Text Summarization Branches Out; Association for Computational Linguistics: Barcelona, Spain, 2004; pp. 74–81. [Google Scholar]
- Cornia, M.; Stefanini, M.; Baraldi, L.; Cucchiara, R. Meshed-memory transformer for image captioning. In Proceedings of the IEEE/CVF Conference on Computer Vision and Pattern Recognition, Seattle, WA, USA, 13–19 June 2020; pp. 10578–10587. [Google Scholar]
- Nguyen, V.Q.; Suganuma, M.; Okatani, T. Grit: Faster and better image captioning transformer using dual visual features. In Proceedings of the European Conference on Computer Vision, Tel Aviv, Israel, 23–27 October 2022; pp. 167–184. [Google Scholar]
- Zhang, X.; Sun, X.; Luo, Y.; Ji, J.; Zhou, Y.; Wu, Y.; Huang, F.; Ji, R. Rstnet: Captioning with adaptive attention on visual and non-visual words. In Proceedings of the IEEE/CVF Conference on Computer Vision and Pattern Recognition, Nashville, TN, USA, 20–25 June 2021; pp. 15465–15474. [Google Scholar]
- Yuan, L.; Chen, D.; Chen, Y.L.; Codella, N.; Dai, X.; Gao, J.; Hu, H.; Huang, X.; Li, B.; Li, C.; et al. Florence: A new foundation model for computer vision. arXiv 2021, arXiv:2111.11432. [Google Scholar]
- Vinyals, O.; Toshev, A.; Bengio, S.; Erhan, D. Show and tell: A neural image caption generator. In Proceedings of the IEEE Conference on Computer Vision and Pattern Recognition, Boston, MA, USA, 7–12 June 2015; pp. 3156–3164. [Google Scholar]
- Xu, K.; Ba, J.; Kiros, R.; Cho, K.; Courville, A.; Salakhudinov, R.; Zemel, R.; Bengio, Y. Show, attend and tell: Neural image caption generation with visual attention. In Proceedings of the International Conference on Machine Learning, Lille, France, 7–9 July 2015; pp. 2048–2057. [Google Scholar]
- Li, C.Y.; Liang, X.; Hu, Z.; Xing, E.P. Knowledge-driven encode, retrieve, paraphrase for medical image report generation. In Proceedings of the AAAI Conference on Artificial Intelligence, Honolulu, HI, USA, 27 January–1 February 2019; Volume 33, pp. 6666–6673. [Google Scholar]
- Srinivasan, P.; Thapar, D.; Bhavsar, A.; Nigam, A. Hierarchical X-ray report generation via pathology tags and multi head attention. In Proceedings of the Asian Conference on Computer Vision, Kyoto, Japan, 30 November–4 December 2020. [Google Scholar]
- Yin, C.; Qian, B.; Wei, J.; Li, X.; Zhang, X.; Li, Y.; Zheng, Q. Automatic generation of medical imaging diagnostic report with hierarchical recurrent neural network. In Proceedings of the 2019 IEEE International Conference on Data Mining (ICDM), Beijing, China, 8–11 November 2019; pp. 728–737. [Google Scholar]
- Hochreiter, S.; Schmidhuber, J. Long short-term memory. Neural Comput. 1997, 9, 1735–1780. [Google Scholar] [CrossRef]
- Vaswani, A.; Shazeer, N.; Parmar, N.; Uszkoreit, J.; Jones, L.; Gomez, A.N.; Kaiser, Ł.; Polosukhin, I. Attention is all you need. Adv. Neural Inf. Process. Syst. 2017, 30, 5998–6008. [Google Scholar]
- Miura, Y.; Zhang, Y.; Tsai, E.B.; Langlotz, C.P.; Jurafsky, D. Improving factual completeness and consistency of image-to-text radiology report generation. arXiv 2020, arXiv:2010.10042. [Google Scholar]
- Lovelace, J.; Mortazavi, B. Learning to generate clinically coherent chest X-ray reports. In Proceedings of the Findings of the Association for Computational Linguistics: EMNLP 2020, Online, 16–20 November 2020; pp. 1235–1243. [Google Scholar]
- Nguyen, H.T.; Nie, D.; Badamdorj, T.; Liu, Y.; Zhu, Y.; Truong, J.; Cheng, L. Automated generation of accurate & fluent medical X-ray reports. arXiv 2021, arXiv:2108.12126. [Google Scholar]
- Chen, Z.; Song, Y.; Chang, T.H.; Wan, X. Generating Radiology Reports via Memory-driven Transformer. In Proceedings of the 2020 Conference on Empirical Methods in Natural Language Processing (EMNLP), Online, 16–20 November 2020; pp. 1439–1449. [Google Scholar]
- Wang, Z.; Han, H.; Wang, L.; Li, X.; Zhou, L. Automated radiographic report generation purely on transformer: A multicriteria supervised approach. IEEE Trans. Med Imaging 2022, 41, 2803–2813. [Google Scholar] [CrossRef] [PubMed]
- Nicolson, A.; Dowling, J.; Koopman, B. Improving chest X-ray report generation by leveraging warm starting. Artif. Intell. Med. 2023, 144, 102633. [Google Scholar] [CrossRef] [PubMed]
- Bengio, Y.; Louradour, J.; Collobert, R.; Weston, J. Curriculum learning. In Proceedings of the 26th Annual International Conference on Machine Learning, Montreal, QC, Canada, 14–18 June 2009; pp. 41–48. [Google Scholar]
- Subramanian, S.; Rajeswar, S.; Dutil, F.; Pal, C.; Courville, A. Adversarial generation of natural language. In Proceedings of the 2nd Workshop on Representation Learning for NLP, Vancouver, BC, Canada, 3 August 2017; pp. 241–251. [Google Scholar]
- Spitkovsky, V.I.; Alshawi, H.; Jurafsky, D. Baby Steps: How “Less is More” in unsupervised dependency parsing. In NIPS: Grammar Induction, Representation of Language and Language Learning; Neural Information Processing Systems Foundation: San Diego, CA, USA, 2009; pp. 1–10. [Google Scholar]
- Chang, E.; Yeh, H.S.; Demberg, V. Does the order of training samples matter? improving neural data-to-text generation with curriculum learning. arXiv 2021, arXiv:2102.03554. [Google Scholar]
- Lotter, W.; Sorensen, G.; Cox, D. A multi-scale CNN and curriculum learning strategy for mammogram classification. In Proceedings of the Deep Learning in Medical Image Analysis and Multimodal Learning for Clinical Decision Support: Third International Workshop, DLMIA 2017, and 7th International Workshop, ML-CDS 2017, Held in Conjunction with MICCAI 2017, Québec City, QC, Canada, 14 September 2017; Proceedings 3. Springer: Berlin/Heidelberg, Germany, 2017; pp. 169–177. [Google Scholar]
- Jiménez-Sánchez, A.; Mateus, D.; Kirchhoff, S.; Kirchhoff, C.; Biberthaler, P.; Navab, N.; Ballester, M.A.G.; Piella, G. Curriculum learning for improved femur fracture classification: Scheduling data with prior knowledge and uncertainty. Med. Image Anal. 2022, 75, 102273. [Google Scholar] [CrossRef]
- Oksuz, I.; Ruijsink, B.; Puyol-Antón, E.; Clough, J.R.; Cruz, G.; Bustin, A.; Prieto, C.; Botnar, R.; Rueckert, D.; Schnabel, J.A.; et al. Automatic CNN-based detection of cardiac MR motion artefacts using k-space data augmentation and curriculum learning. Med. Image Anal. 2019, 55, 136–147. [Google Scholar] [CrossRef]
- Wei, J.; Suriawinata, A.; Ren, B.; Liu, X.; Lisovsky, M.; Vaickus, L.; Brown, C.; Baker, M.; Nasir-Moin, M.; Tomita, N.; et al. Learn like a pathologist: Curriculum learning by annotator agreement for histopathology image classification. In Proceedings of the IEEE/CVF Winter Conference on Applications of Computer Vision, Virtual, 5–9 January 2021; pp. 2473–2483. [Google Scholar]
- Alsharid, M.; El-Bouri, R.; Sharma, H.; Drukker, L.; Papageorghiou, A.T.; Noble, J.A. A curriculum learning based approach to captioning ultrasound images. In Proceedings of the Medical Ultrasound, and Preterm, Perinatal and Paediatric Image Analysis: First International Workshop, ASMUS 2020, and 5th International Workshop, PIPPI 2020, Held in Conjunction with MICCAI 2020, Lima, Peru, 4–8 October 2020; Proceedings 1. Springer: Berlin/Heidelberg, Germany, 2020; pp. 75–84. [Google Scholar]
- Sparck Jones, K. A statistical interpretation of term specificity and its application in retrieval. J. Doc. 1972, 28, 11–21. [Google Scholar] [CrossRef]
- Liu, F.; Ge, S.; Zou, Y.; Wu, X. Competence-based multimodal curriculum learning for medical report generation. arXiv 2022, arXiv:2206.14579. [Google Scholar]
- Smit, A.; Jain, S.; Rajpurkar, P.; Pareek, A.; Ng, A.Y.; Lungren, M.P. CheXbert: Combining automatic labelers and expert annotations for accurate radiology report labeling using BERT. arXiv 2020, arXiv:2004.09167. [Google Scholar]
- Johnson, A.E.; Pollard, T.J.; Berkowitz, S.J.; Greenbaum, N.R.; Lungren, M.P.; Deng, C.y.; Mark, R.G.; Horng, S. MIMIC-CXR, a de-identified publicly available database of chest radiographs with free-text reports. Sci. Data 2019, 6, 317. [Google Scholar] [CrossRef]
- Irvin, J.; Rajpurkar, P.; Ko, M.; Yu, Y.; Ciurea-Ilcus, S.; Chute, C.; Marklund, H.; Haghgoo, B.; Ball, R.; Shpanskaya, K.; et al. Chexpert: A large chest radiograph dataset with uncertainty labels and expert comparison. In Proceedings of the AAAI Conference on Artificial Intelligence, Honolulu, HI, USA, 27 January–1 February 2019; Voume 33, pp. 590–597. [Google Scholar]
- Endo, M.; Krishnan, R.; Krishna, V.; Ng, A.Y.; Rajpurkar, P. Retrieval-based chest x-ray report generation using a pre-trained contrastive language-image model. In Proceedings of the Machine Learning for Health, Virtual, 6–7 August 2021; pp. 209–219. [Google Scholar]
- Devlin, J.; Chang, M.W.; Lee, K.; Toutanova, K. Bert: Pre-training of deep bidirectional transformers for language understanding. arXiv 2018, arXiv:1810.04805. [Google Scholar]
- Boag, W.; Hsu, T.M.H.; McDermott, M.; Berner, G.; Alesentzer, E.; Szolovits, P. Baselines for chest X-ray report generation. In Proceedings of the Machine Learning for Health Workshop, Virtual, 11 December 2020; pp. 126–140. [Google Scholar]
- Demner-Fushman, D.; Kohli, M.D.; Rosenman, M.B.; Shooshan, S.E.; Rodriguez, L.; Antani, S.; Thoma, G.R.; McDonald, C.J. Preparing a collection of radiology examinations for distribution and retrieval. J. Am. Med. Inform. Assoc. 2016, 23, 304–310. [Google Scholar] [CrossRef]


| Model | BL1 | BL2 | BL3 | BL4 | RGL | M | F1MA | F1MI | F1MI5 | F1EX |
|---|---|---|---|---|---|---|---|---|---|---|
| GIT-CXR (MV+C+CL) | 0.286 | 0.215 | 0.168 | 0.369 | 0.348 | 0.534 | 0.565 | 0.458 | ||
| GIT-CXR (SV+C+CL) | 0.359 | 0.327 | 0.505 | |||||||
| ARR TR [28] | − | − | − | − | − | |||||
| RGRG [6] | − | − | 0.447 | |||||||
| EKAGen [7] | 0.419 | − | − | − | ||||||
| CvT-212Distil [29] | − | − | − | |||||||
| R2GEN [27] | − | − | − | |||||||
| AGA (MV+T+I) [26] † | 0.495 | 0.360 | 0.278 | 0.224 | 0.390 | − | − | − | − | |
| LOVE [25] † | 0.318 | − | − | |||||||
| MMTN [4] † | − | − | − | − | ||||||
| CXR-RePaiR [44] † | − | − | − | − | − | − | − | − | ||
| TR [24] † | − | − | − | − | − | − | − | 0.567 | − |
| Model | BL1 | BL2 | BL3 | BL4 | RGL | M | F1MA | F1MI | F1MI5 | F1EX |
|---|---|---|---|---|---|---|---|---|---|---|
| GIT-CXR-CLS (MV+C+CL) | ||||||||||
| GIT-CXR-CLS (SV+C+CL) | ||||||||||
| GIT-CXR (MV+C+CL) | 0.403 | 0.286 | 0.215 | 0.168 | 0.312 | 0.369 | 0.348 | 0.534 | 0.565 | 0.458 |
| GIT-CXR (SV+C+CL) | 0.393 | 0.278 | 0.208 | 0.162 | 0.359 | 0.327 | 0.505 | 0.538 | 0.428 | |
| GIT-CXR-CLS (MV+C) | ||||||||||
| GIT-CXR-CLS (SV+C) | ||||||||||
| GIT-CXR (MV+C) | 0.311 | |||||||||
| GIT-CXR (SV+C) | ||||||||||
| GIT-CXR (MV) | ||||||||||
| GIT-CXR (SV) |
| Report | BL1-4 | RG-L | M | |
|---|---|---|---|---|
| Context | _ year old male with history of metastatic melanoma, now with recurrent seizures and lethargy, comes here to evaluate for pneumonia. | |||
| Target | Impression: No acute cardiopulmonary process. Findings: Frontal and lateral radiographs of the chest redemonstrate a round calcified pulmonary nodule in the posterior right lung base, unchanged from multiple priors and consistent with prior granulomatous disease. A known enlarged right hilar lymph node seen on ct of _ likely accounts for the increased opacity at the right hilum. A known right mediastinal lymph node conglomerate accounts for the fullness at the right paratracheal region. No pleural effusion, pneumothorax or focal consolidation is present. The patient is status post median sternotomy and cabg with wires intact. The cardiac silhouette is normal in size. The mediastinal and hilar contours are unchanged from the preceding radiograph. | |||
| Generated | Impression: No acute cardiopulmonary process. Findings: Frontal and lateral radiographs of the chest show no focal consolidation, pleural effusion or pneumothorax. The cardiomediastinal and hilar contours are normal. The patient is status post median sternotomy with intact wires. | 0.165 0.135 0.117 0.106 | ||
| Context | post procedure, to assess for pneumothorax. | |||
| Target | Impression: Findings: In comparison with the study of _, there is no evidence of pneumothorax. continued low lung volumes with substantial mass in the right paratracheal region. | |||
| Generated | Impression:Findings: In comparison with the study of _, there is little overall change. Again there are low lung volumes with mild atelectatic changes at the bases. no evidence of acute focal pneumonia or vascular congestion. | 0.571 0.501 0.455 0.412 | ||
| Context | picc. | |||
| Target | Impression: _ Left picc tip appears to terminate in the distal left brachiocephalic vein. _ Mild pulmonary vascular congestion. _ Interval improvement in aeration of the lung bases with residual streaky opacity likely reflective of atelectasis. Interval resolution of the left pleural effusion. Findings: Left picc tip is seen terminating in the region of the distal left brachiocephalic vein. Tracheostomy tube is in unchanged standard position. the heart is moderately enlarged. marked calcification of the aortic knob is again present. Mild pulmonary vascular congestion is similar. Bibasilar streaky airspace opacities are minimally improved. Previously noted left pleural effusion appears to have resolved. No pneumothorax is identified. Percutaneous gastrostomy tube is seen in the left upper quadrant. | |||
| Generated | Impression:Findings: There has been interval removal of a right sided picc. The right sided picc line has been removed. Tracheostomy tube and central venous catheter are again seen. There is a moderate cardiomegaly. There is hazy opacification of the right lung base which is stable. There is no overt pulmonary edema. | 0.148 0.068 0.029 0.000 |
Disclaimer/Publisher’s Note: The statements, opinions and data contained in all publications are solely those of the individual author(s) and contributor(s) and not of MDPI and/or the editor(s). MDPI and/or the editor(s) disclaim responsibility for any injury to people or property resulting from any ideas, methods, instructions or products referred to in the content. |
© 2025 by the authors. Licensee MDPI, Basel, Switzerland. This article is an open access article distributed under the terms and conditions of the Creative Commons Attribution (CC BY) license (https://creativecommons.org/licenses/by/4.0/).
Share and Cite
Sîrbu, I.; Sîrbu, I.-R.; Bogojeska, J.; Rebedea, T. GIT-CXR: End-to-End Transformer for Chest X-Ray Report Generation. Information 2025, 16, 524. https://doi.org/10.3390/info16070524
Sîrbu I, Sîrbu I-R, Bogojeska J, Rebedea T. GIT-CXR: End-to-End Transformer for Chest X-Ray Report Generation. Information. 2025; 16(7):524. https://doi.org/10.3390/info16070524
Chicago/Turabian StyleSîrbu, Iustin, Iulia-Renata Sîrbu, Jasmina Bogojeska, and Traian Rebedea. 2025. "GIT-CXR: End-to-End Transformer for Chest X-Ray Report Generation" Information 16, no. 7: 524. https://doi.org/10.3390/info16070524
APA StyleSîrbu, I., Sîrbu, I.-R., Bogojeska, J., & Rebedea, T. (2025). GIT-CXR: End-to-End Transformer for Chest X-Ray Report Generation. Information, 16(7), 524. https://doi.org/10.3390/info16070524