Article

Psychometric Properties and Validation of the Chinese Adaption of the Affinity for Technology Interaction (ATI) Scale

by
Denise Sogemeier
*,†,
Ina Marie Koniakowsky
,
Sebastian Hergeth
,
Frederik Naujoks
and
Andreas Keinath
BMW Group, 80937 Munich, Germany
*
Author to whom correspondence should be addressed.
These authors contributed equally to this work.
Information 2025, 16(6), 500; https://doi.org/10.3390/info16060500
Submission received: 20 February 2025 / Revised: 9 June 2025 / Accepted: 13 June 2025 / Published: 16 June 2025

Abstract

The Affinity for Technology Interaction (ATI) scale has been widely used to assess the tendency to engage in technology. To enhance the scale’s applicability and facilitate cross-cultural research, it is essential to provide translations of the scale. A Chinese translation is still missing. Additionally, a validation is necessary as culture can affect the psychometrics of questionnaires, bearing the danger of applying inadequate measures. The aims of the present study are therefore providing a Chinese translation of the ATI scale and presenting non-parametric and parametric psychometric analyses of the translated version to examine the underlying factor structure. In contrast to the original scale, analyses of the Chinese version suggest a two-dimensional structure with one dimension describing a passive interest in technology and another describing an active engagement with technology. The findings enable researchers to use the scale in Chinese-speaking populations and thereby advancing the understanding of human-technology interaction across different cultures.

1. Introduction

As technology continues to advance and permeate our lives, the ability to effectively interact with technological systems and devices becomes increasingly crucial [1]. This holds particularly true in the automotive industry, where the integration of advanced technologies, such as autonomous driving, connected car systems, and intelligent user interfaces, has revolutionized the driving experience [2]. A widely recognized concept that captures the relationship between humans and technology is the individual affinity for technological systems and devices. Edison and Geissler [3] define this affinity as a positive attitude towards technology in general. Franke et al. [1] elaborate on this concept, defining it as an individual’s personal disposition to actively engage in interactions with technical systems or, conversely, to avoid intensive interaction with new systems. According to these definitions, technology affinity encompasses two perspectives: a strong interest in technology and an active engagement with technological systems. For instance, an individual may have a strong interest in cars, watch races on TV, or appreciate the aesthetics of vintage cars. However, this interest does not necessarily indicate active engagement with cars as technological systems. On the other hand, another individual might engage with the technical details of the vehicle, including its performance, engine, aerodynamics, and repair, and drive cars professionally. This illustrates that interest and active engagement not necessarily go hand in hand.
Technology affinity can thus be seen as a key personal resource shaping human–technology interaction. To assess this personal resource, Franke et al. [1] developed the Affinity for Technology Interaction (ATI) scale to foster the understanding of how humans adapt to technology. While other scales, such as the TA-EG [4], focus on attitudes towards technology, the ATI scale expands on interaction style, i.e., seeking or avoiding interaction with technical systems. Thus, the ATI scale encompasses both perspectives of technology affinity. Moreover, the ATI scale is highly economical and can therefore be readily incorporated into technological research study designs [1]. Furthermore, it has been demonstrated to be a reliable and valid measure in its application multiple studies comprising a total of over 1500 participants [5,6]. The scale comprises nine items, with three items being reverse-coded, which participants answer on a 6-point scale. Generally, individuals with higher ATI scores are more inclined to explore new technologies and adeptly handle problems and malfunctions. The ATI scale was initially developed in German and English and is currently available as translations in Italian, Spanish, Romanian, Dutch, Persian, French, Finnish, Korean, Turkish and Portuguese. Franke et al. [1] consider the ATI scale to be an “economical unidimensional scale” (p. 456). In the context of cross-cultural research, the validation of translated scales holds significant importance, particularly when the scales are intended to assess universally applicable constructs [7]. However, psychometric properties have only been investigated for three of the translated scales, i.e., the Finnish, Korean and Persian versions. Heilala et al. [6] provided psychometric properties of the Finnish translation and demonstrated unidimensionality, and so did Ghasemi et al. [8] for the Persian version. The Korean translation however does not support unidimensionality [9]. A psychometric analysis of the Korean translation suggests two underlying factors. The authors assume that this is due to a mistranslation of a sentence that has a different connotation in the Korean culture compared to English-speaking culture. In general, findings in cross-cultural research suggest that culture can affect psychometrics of questionnaires [10]. Consequently, it is crucial to thoroughly examine and evaluate psychometric properties of newly translated scales in order to ensure their validity and reliability across different cultural contexts.
In order to understand user diversity, it is of utmost importance to have valid cross-cultural assessment tools. Research has shown that users from different countries may perceive and evaluate technical systems and products differently due to their distinct cultural backgrounds and diverse experiences [11]. Users from specific cultures may have varying levels of access to technology, thereby making them more inclined towards technology compared to others. In particular, China has emerged as a global technological leader with a greater integration of technology into daily life for its citizens compared to Europe [12]. This discrepancy in technology affinity may consequently elucidate observed differences in ratings. Therefore, it is crucial to have a valid scale in multiple languages that assesses technology affinity.
This research paper provides two valuable contributions to the scientific field. First, it provides a Chinese translation of the ATI scale using a forward–backward translation, thereby establishing a standard for both academic and industry professionals in the future. Second, as the dimensionality of the ATI scale differs across cultures [9], we present an initial psychometric analysis to investigate the reliability, validity and dimensionality of the Chinese ATI scale. The Chinese translation provided in this research paper enhances the accessibility of a uniformly translated ATI scale, promoting the congruence of important cross-cultural studies. Furthermore, the initial assessment of the psychometric properties of the Chinese ATI scale offers a preliminary understanding of its transferability in the Chinese context, facilitating its application and further investigation in future practice and research.

2. Method

2.1. Translation Protocol

The English version of the ATI scale was translated into Chinese (Mandarin) using the forward–backward translation approach [13]. Therefore, two independent native speakers translated the English ATI scale into Chinese. The two versions were then merged into a final version after agreement between the two translators. Subsequently, the Chinese version was translated back into English by a third Chinese speaker and checked for consistency with the original version. The back translated English version and the original version showed a substantial level of congruence indicating a successful translation process. The original English version and the Chinese translation can be found in Table 1.

2.2. Data Collection and Participants

Data was collected as part of a driving simulator study (n = 52) and a focus group study (n = 50) in Beijing, resulting in a final sample of N = 102 (41 female, 61 male). Inclusion criteria were that participants had to be at least 18 years old and be native Chinese speakers and had no cognitive or psychiatric impairments. After giving informed written consent, participants provided demographic information and subsequently completed the Chinese version of the ATI questionnaire. The age of the sample ranged from 21 to 53 years (M = 34.76, SD = 6.55).

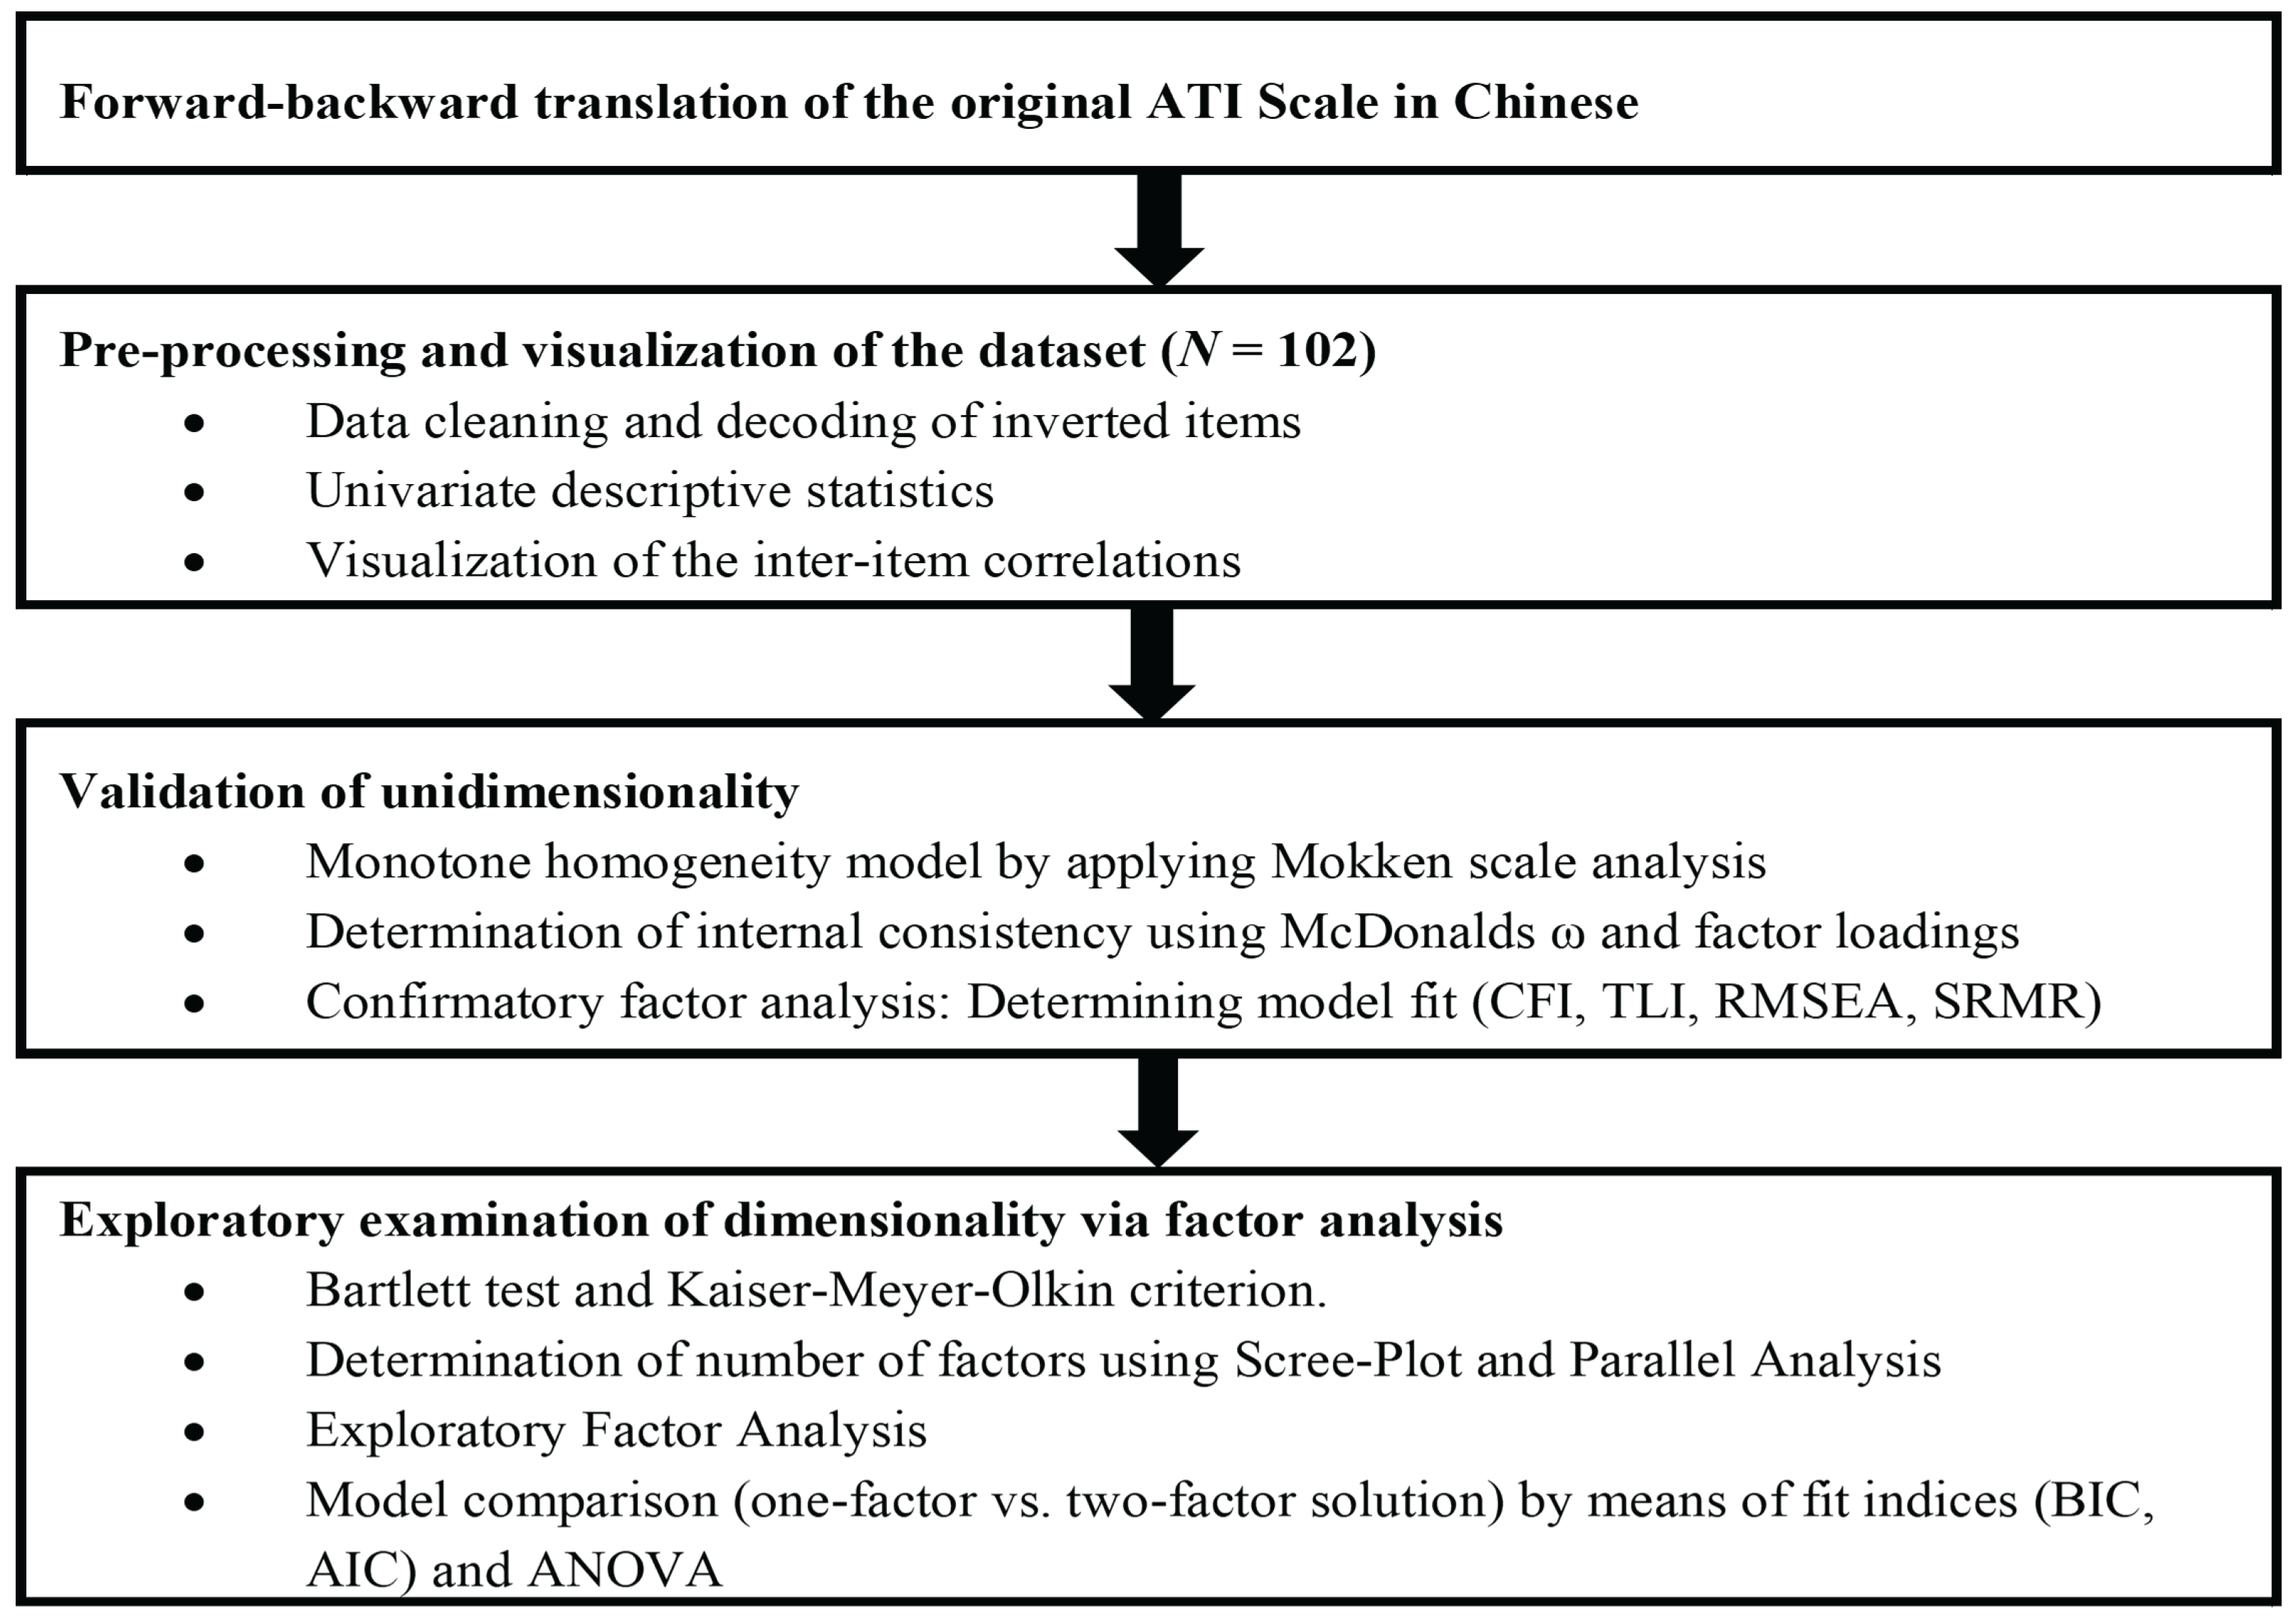
2.3. Analysis of Psychometric Data

The translated ATI scale was analyzed regarding its construct validity, providing insights into both its structural validity following the approach used by Heilala et al. [6] and Lezhnina and Kismihók [14] to analyze the Finnish and English ATI scales, albeit slightly reduced. Furthermore, the cross-cultural validity of the questionnaire was analyzed, which reveals to what degree the theoretical constructs from one culture are transferable to another culture [15]. We used R Studio (2022.07.2) and the R packages psych (Version 2.3.3), corrplot (0.92), dplyr (Version 1.1.1), EGAnet (Version 2.0.4), and lavaan (Version 0.6-17) for all statistical analyses. Figure 1 outlines the procedure.

2.3.1. Non-Parametric Analysis: Mokken Scale Analysis

Taking into account the small sample size and the non-parametric data structure, a monotone homogeneity model was utilized by applying Mokken scale analysis (MSA) to the data. Monotone homogeneity models base on the assumption of unidimensionality, which means that all items are measuring the same latent variable. If the model is not applicable to the data, this argues against the assumption of unidimensionality for the data. We assessed the homogeneity of item sets by employing scalability coefficients (Hij) for each item pair, each item (Hj), and the entire scale (H). This assessment involved calculating the ratio of covariance between respective items. To identify potentially unscalable items, we utilized the Automated Item Selection Algorithm (AISP). This algorithm partitions items based on a selected cutoff value (c). The AISP is an iterative process, designed to choose items that positively covary with each other, possess Hj > c, and maximize the overall H-value of the scale with other selected items [16]. For this study, we set the cutoff to c = 0.3 [17].

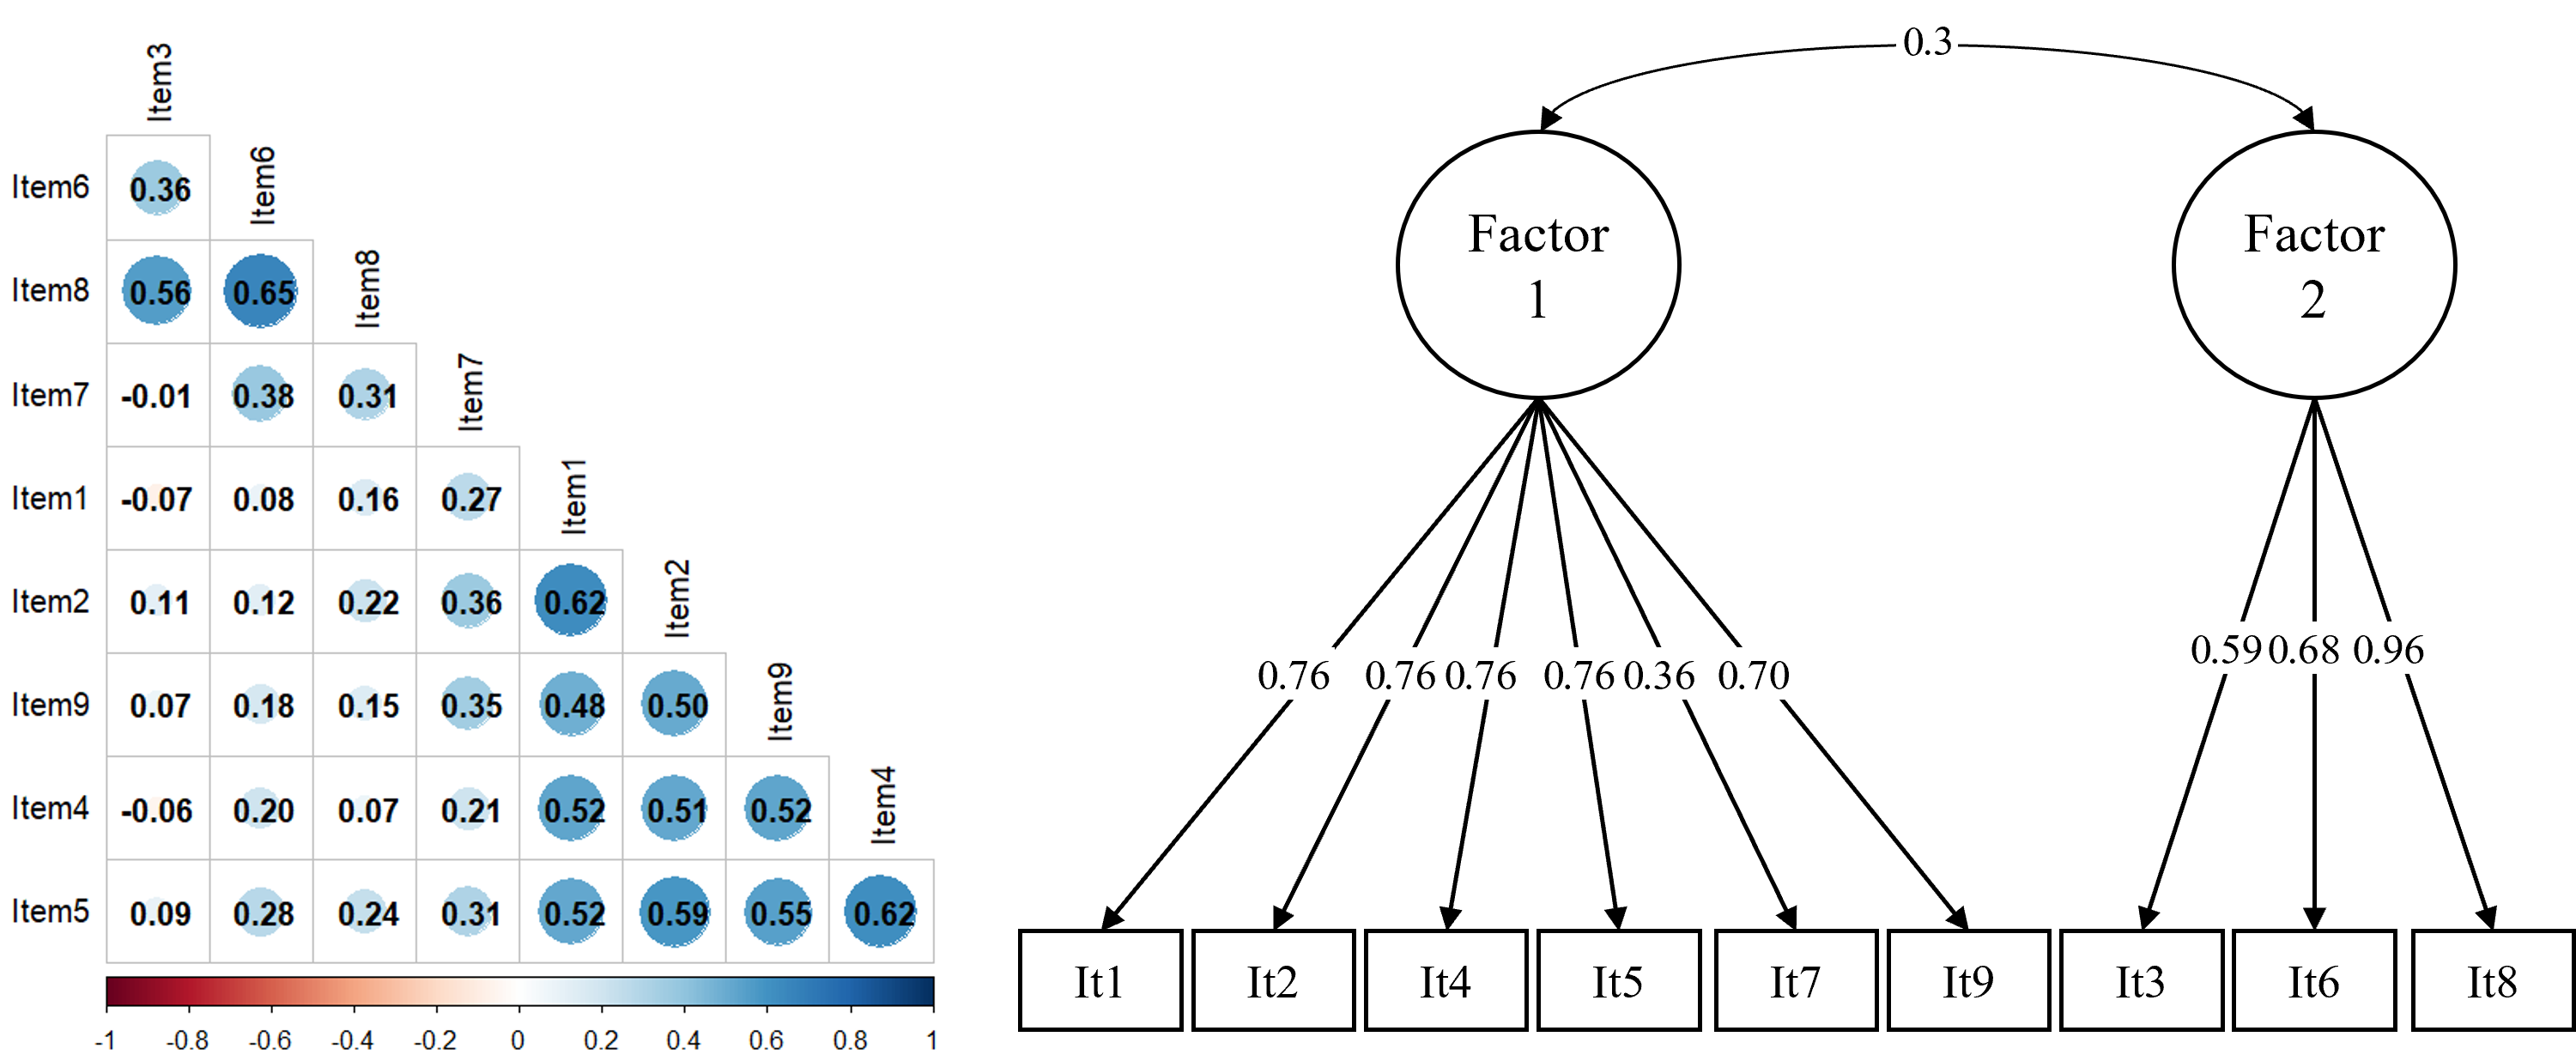
2.3.2. Parametric Analysis: Factor Analysis

Further, a confirmatory factor analysis (CFA) was conducted to test for the proposed unidimensionality of the ATI scale. The CFA imposes more stringent requirements on the data, i.e., (quasi-) interval scaling, multivariate normality. A good fit of the model is assumed when Comparative Fit Index (CFI) > 0.9, Tucker–Lewis Index (TLI) > 0.9, root mean squared error of approximation (RMSEA) < 0.08 and standardized root mean squared residual (SRMR) < 0.08 [17]. We also considered the significance of item loadings. In instances of an alternative factor structure, we conducted an exploratory factor analysis (EFA) to reveal the underlying factor structure. The parallel analysis was used to determine the number of factors and the exploratory graph analysis visualized the loadings of the items on the respective factors [18,19]. We subsequently compared the originally proposed model and the exploratorily determined model by using an analysis of variance (ANOVA) making decisions based on the Information Criteria (BIC, AIC). The overall significance level was set at α = 0.05.

3. Results

In the first step, data was analyzed descriptively (Table 2, Figure 2). The relationship between the items was visualized by means of a Kendall correlation matrix (Figure 3). The inter-item correlations varied between weak (r = −0.07) and strong (r = 0.65), indicated by the size and color of the dots. The non-parametric MSA showed a scalability coefficient Hij between −0.15 (negative relationship) and 0.9 (positive relationship) for each item pair. For each individual item, the coefficient Hj ranged between 0.18 and 0.39. The test scalability coefficient with H = 0.32 was considered weak [20]. In addition, the AISP indicates a two-factor solution for the chosen cutoff value of c = 0.3, with one scale comprising items 1, 2, 4, 5, 7, and 9 and another one comprising items 3, 6, and 8. Therefore, the results of the MSA did not meet the requirements of a monotone homogeneity model, i.e., unidimensionality could not be assumed. McDonald’s Omega can be considered good at ω = 0.81. The subsequent CFA revealed that a single-factor model is not a suitable fit for the present Chinese data (CFI = 0.672, TLI = 0.562, RMSEA = 0.200, SRMR = 0.144) with item 3 showing a non-significant loading on the factor. In summary both, the results of the MSA and the CFA argue against the unidimensionality of the ATI scale for the Chinese data.
Therefore, in a next step, we conducted an EFA to determine the underlying factor structure exploratively. Bartlett’s test of sphericity was significant, χ 2 (36) = 353.2, p < 0.001, and the Kaiser–Meyer–Olkin measure of sampling adequacy indicated strong relationships among variables (KMO = 0.76). Thus, the factor analytic model analysis could be proceeded. Regarding the number of extracted factors, the Kaiser–Guttman criterion, the Scree Test and the parallel analysis indicated the extraction of two factors (see Figure 4). An EFA with Promax rotation was conducted since we expected the factors to be correlated (RMSEA = 0.097, TLI = 0.889). The underlying factor structure is visualized in Figure 3. The two-factor solution yielded a total variance explained of 52 % , with Factor 1 explaining 32 % and Factor 2 explaining 20% of variance. When descriptively compared to the fit indices of the one-factor solution, the subsequent CFA indicated that a two-factor model provides a mostly acceptable and more suitable fit for the data (CFI = 0.926, TLI = 0.898, RMSEA = 0.096, SRMR = 0.078). The internal consistency of the two-factor model was considered good for Factor 1 at ω = 0.84 and acceptable for Factor 2 at ω = 0.79. Finally, the single-factor and the two-factor models were compared by means of fit indices and an ANOVA. The comparison between both models showed that the two-factor model fits the data significantly better than the single-factor model: χ 2 (1) = 86.3, p < 0.001 (AICsingle factor = 2457, AICtwo factor = 2373, BICsingle factor = 2504, BICtwo factor = 2423).

4. Discussion

The ATI scale is a psychometric tool used to quantify an individual’s inclination towards actively engaging with technical systems or, conversely, avoiding intensive interaction with new technological systems [1]. This study had two primary objectives. The first was to provide a Chinese translation of the scale, which was achieved following a forward–backward translation process. The second objective was to provide a first validation of the scale. Consequently, a psychometric analysis was conducted as part of the initial assessment of the Chinese ATI scale. Furthermore, the scale’s internal structure, including its dimensionality and the functioning of individual items, was evaluated.
Unidimensionality is considered a beneficial characteristic of a psychometric scale because it facilitates clear and straightforward assessment and tends to be easier to interpret compared to a multidimensional scale. Previous studies have shown that the original scale is unidimensional. Our results, however, support a two-dimensional structure for the translated version. The non-parametric MSA and the factor analysis indicate that a two-dimensional model fitted the data better than a unidimensional model. The comparison of the two models by means of fit indices and an ANOVA showed a significantly better fit to the data for the two-factor model, indicating a more reliable assessment of the construct compared to the single-factor approach. However, this should be understood as a relative assertion rather than an absolute claim, as a re-validation of the Chinese ATI scale with a larger sample is necessary. In the following, we will discuss two different interpretations of the factor structure.
The first interpretation distinguishes between active engagement with technology and passive interest in it. The first dimension comprises item 1, item 2, item 4, item 5, item 7, and item 9, which use phrases like “[…] occupy myself […]” (item 1), “[…] testing the functions […]” (item 2), “[…] try it out intensively” (item 4), “[…] enjoy spending time […]” (item 5), “[…] try to understand […]” (item 7) and “…] try to make full use of […]” (item 9). These items can be summarized as describing an affinity for actively engaging and interacting with technology. This dimension reflects a proactive approach to technology, where individuals not only use technological systems but also seek to understand and explore their functionalities in depth. In contrast, the second dimension comprises the three reverse coded items, i.e., item 3, item 6, and item 8 which use phrases like “I predominantly deal with […]” (item 3), “It is enough for me that a technical system works […]” (item 6) and “[…] to know the basic functions […]” (item 8). These items rather describe an interest or disinterest in technology, reflecting a more passive position, where individuals may engage with technology out of necessity rather than enthusiasm. These findings align with the definitions of technology affinity, which also distinguish between a rather an active engagement and passive interest [1,3]. The distinction between these two dimensions is crucial for understanding how individuals relate to technology in different contexts and cultures. Moreover, this two-dimensional structure provides significant implications for the design and implementation of technology. Understanding that some users prefer active engagement while others may lean towards a more passive interaction can guide the development of user interfaces and experiences tailored to these varying preferences. For instance, technology designed for actively engaged users might include more interactive features, comprehensive tutorials, and opportunities for exploration. Conversely, systems designed for rather passive users may emphasize simplicity and ease of use. In summary, the content-based interpretation of the two-factor scale reveals important insights into how individuals interact with technology, highlighting the spectrum from active engagement to passive interest. This understanding can guide future research and practical applications in technology design, ensuring that diverse user needs are effectively addressed.
The second interpretation of the dimensions is methodological. The only items that demonstrated a discrepancy regarding unidimensionality were the reverse-coded items, which may be attributed to a common method bias. Psychometric analyses of other translations of the ATI scale showed similar indications: the Finnish translation for example also found a second dimension comprising the reverse-coded items, item 7 and item 5. The existing literature raised awareness of the fact that reverse-coded items can hinder unidimensional structures and that they can also affect response patterns. Dalal and Carter [21] showed that mixed scales, i.e., mixing reverse- and non-reverse-coded items, may be less reliable and have more measurement error. Descriptive results from our data indicate that the participants’ response behavior exhibited a higher range and dispersion for the reverse-coded items compared to the non-reverse-coded items (see Table 2, Figure 2). Reverse-coded items may be more difficult to understand, which may lead to incorrect responses [22]. Consequently, reverse-coded items can generate an artificial factor [23]. Further, the authors of the original ATI scale already proposed that the reverse-coded item 3 does not differentiate well between high- and low-ATI participants and potentially does not fit the intended single dimension. A technology-savvy individual is likely to work in a technical field where they have to interact with technical systems. As a result, they would score highly on this item without necessarily belonging to the low-ATI group. One potential solution would be to design a balanced ATI scale—where the number of reverse- and non-reverse-coded items is equal—to mitigate these issues related to response patterns. Implementing a balanced ATI scale could help address these challenges, as unbalanced scales are often more susceptible to misresponse [24].
Our results further highlight challenges that occur during a cross-cultural transfer of assessment tools. When translating items into a different language, it can be challenging to maintain equivalence in meaning of items. According to Koniakowsky et al. [10], the psychometrics of a questionnaire are affected by context and culture. Therefore, it is not reasonable to assume that adapting a questionnaire from another context and culture will result in objective, reliable and valid measurements. For the Korean version of the ATI scale, Kim et al. [9] found similar structural indications with item 6 and item 8 loading on a separate factor. Both items begin with the phrase “It is enough for me […]” which, when translated into Korean, has a different connotation than in English-speaking cultures. In English, the phrase indicates contentment or satisfaction whereas in Korean it can be translated into “I have done well so far, so I do not need to tray anymore”, or “I have worked hard up until now, so I do not need to put in any more effort” (p. 7, [9]). The translation does not semantically represent the English meaning of satisfaction. Similar issues can occur when translating items into the Chinese language and should be considered when using the scale. Nonetheless, the forward–backward translation approach resulted in a uniformly translated Chinese ATI scale, establishing a standard for both researchers and practitioners. This minimizes the likelihood of additional issues that may arise when researchers integrate a translation process into their work, which could result in varying translations and subsequently hinder cross-cultural research.
It is essential to have a valid ATI scale in multiple languages to investigate and compare technology affinity across cultures. In particular, a Chinese version is highly important, as technology and its usage are key factors driving China’s rapid growth and development [25,26]. With the rise of its high-tech industry, China emerged as the main partner for high-tech product imports in the EU in 2023 [27]. In the rapidly growing field of artificial intelligence, China has closed the quality gap by being the leader in publications and patents [28]. This highlights the importance of providing a translation and an initial validation of the Chinese ATI scale to assess technology affinity for this crucial player in the market.
Our study comes with limitations and the results must be regarded in light of these. We collected data from N = 102 participants which can be considered an acceptable yet relatively small sample to conduct such analyses with. For the factor analysis, recommendations regarding the person-to-variable ratio range from 3:1–6:1 [29] to 10:1 [30] or even 20:1 [31]. On the other hand, there is also literature stating that a sample size of N = 50 can be adequate for conducting exploratory factor analyses [32]. According to Mundfrom et al. [33] the minimum sample size for factor analyses is recommended to be between N = 60 and N = 90, which was successfully achieved. This recommendation for a two-factor solution is based on the levels of communality, which ranged from 0.2 to 0.9, and the variables-to-factors ratio of 9 variables to 2 factors in the current sample. These parameters are utilized to calculate the congruence coefficients, which assess the agreement between the population and sample solutions. A sample size within this range is considered to yield a “good” agreement, indicated by a coefficient of congruence between 0.92 and 0.98. While the sample size of our study is deemed acceptable, it remains relatively small. For conducting an MSA, the recommended sample size varies from N = 50 [34] to N = 1000 [35]. Although the sample size of our study can be considered inadequate for conducting an MSA, the results obtained are in alignment with the factor analyses in terms of dimensionality and exact factor structure. Consequently, we posit that these findings serve to enhance the overall robustness of our analysis. Due to the constraints imposed by the limited sample size, the results of this study should be interpreted with caution and regarded as preliminary findings. Given the importance of cross-cultural research and China’s emergence as a global technological leader, it is crucial to investigate the psychometric properties of the ATI scale translated into Chinese. Thus, the preliminary findings from the conducted factor analysis provide an essential basis for further validation with a larger sample. A next step in the validation process involves assessing construct validity by evaluating the scale’s correlation with similar and lack of correlation with dissimilar scales. Franke et al. [1] used several validated scales to explore construct validity of the original scale. To contribute to enhancing construct validity of the Chinese version, we recommend adopting a similar approach.

5. Conclusions

Given the widespread integration of technical systems in our daily lives, it becomes imperative to develop a comprehensive understanding of the dynamics between humans and technology. In this regard, the ATI scale serves as a valuable tool. By providing a Chinese translation of the scale, we expand its applicability and facilitate cross-cultural research. The scale can be used in studies comparing different user groups and their interaction with technology. This is particularly relevant in the global automotive domain. By validating the scale, we offer an initial assessment of the ATI scale accounting for the different factor structure in the Chinese version. However, given the relatively small sample size, the results of the factor analysis must be interpreted with caution. Nevertheless, the preliminary findings indicate an initial direction which can be seen as an important first step in the validation of the Chinese ATI scale. To draw more definitive conclusions, further investigations of the psychometric properties, particularly a re-validation with a larger sample, are necessary. By providing a translated ATI scale in Chinese, we eliminate the need for practitioners and researchers to translate it themselves. By establishing this standard, the likelihood of issues arising from varying translations can be minimized, thereby facilitating cross-cultural research. Furthermore, the application of this scale can aid in comprehending and explaining results, as well as promoting a more user-centered design for future products.

Author Contributions

Conceptualization, D.S. and I.M.K.; methodology, D.S. and I.M.K.; formal analysis, D.S. and I.M.K.; data curation; D.S.; writing—original draft preparation, D.S. and I.M.K.; writing—review and editing, D.S., I.M.K. and S.H.; visualization, I.M.K.; supervision, F.N. and A.K. All authors have read and agreed to the published version of the manuscript.

Funding

This research received no external funding.

Institutional Review Board Statement

This study did not need ethical approval.

Informed Consent Statement

Informed consent was obtained from all subjects involved in the study.

Data Availability Statement

The data presented in this study are not available due to privacy reasons.

Acknowledgments

The research was supported by the BMW Group. We would also like to thank Sarukan Segar, Tobias Hekele and Laura Di Santo for their valuable support in this research project.

Conflicts of Interest

Authors Denise Sogemeier, Ina Koniakowsky, Sebastian Hergeth, Frederik Naujoks and Andreas Keinath were employed by the company BMW Group. All authors declare that the research was conducted in the absence of any commercial or financial relationships that could be construed as a potential conflict of interest.

References

  1. Franke, T.; Attig, C.; Wessel, D. A personal resource for technology interaction: Development and validation of the affinity for technology interaction (ATI) scale. Int. J.-Hum.-Comput. Interact. 2019, 35, 456–467. [Google Scholar] [CrossRef]
  2. Sonko, S.; Daudu, C.D.; Osasona, F.; Monebi, A.M.; Etukudoh, E.A.; Atadoga, A. The evolution of embedded systems in automotive industry: A global review. World J. Adv. Res. Rev. 2024, 21, 096–104. [Google Scholar] [CrossRef]
  3. Edison, S.W.; Geissler, G.L. Measuring attitudes towards general technology: Antecedents, hypotheses and scale development. J. Targeting, Meas. Anal. Mark. 2003, 12, 137–156. [Google Scholar] [CrossRef]
  4. Karrer, K.; Glaser, C.; Clemens, C.; Bruder, C. Technikaffinität erfassen–der Fragebogen TA-EG. Mensch Mittelpunkt Tech. Syst. 2009, 8, 196–201. [Google Scholar]
  5. Wessel, D.; Attig, C.; Franke, T. ATI-S—An Ultra-Short Scale for Assessing Affinity for Technology Interaction in User Studies. In Proceedings of the Mensch Und Computer 2019 (MuC ’19), New York, NY, USA, 8–11 September 2019; pp. 147–154. [Google Scholar] [CrossRef]
  6. Heilala, V.; Kelly, R.; Saarela, M.; Jääskelä, P.; Kärkkäinen, T. The Finnish version of the affinity for technology interaction (ATI) scale: Psychometric properties and an examination of gender differences. Int. J.-Hum.-Comput. Interact. 2023, 39, 874–892. [Google Scholar] [CrossRef]
  7. Cacioppo, J.T.; Petty, R.E.; Feinstein, J.A.; Jarvis, W.B.G. Dispositional differences in cognitive motivation: The life and times of individuals varying in need for cognition. Psychol. Bull. 1996, 119, 197. [Google Scholar] [CrossRef]
  8. Ghasemi, F.; Nourian, S.; Babamiri, M. The psychometric properties of the Persian version of the affinity for technology interaction (ATI) scale. J. Health Saf. Work. 2023, 12, 784–799. [Google Scholar]
  9. Kim, T.; Park, S.; Jeong, M. Reliability and Validity Analysis of the Korean Version of the Affinity for Technology Interaction Scale. Healthcare 2023, 11, 1951. [Google Scholar] [CrossRef]
  10. Koniakowsky, I.; Loew, A.; Forster, Y.; Naujoks, F.; Keinath, A. Context and Culture affect the Psychometrics of Questionnaires evaluating Speech-based Assistants. In Proceedings of the 13th International Conference on Automotive User Interfaces and Interactive Vehicular Applications, Leeds, UK, 9–14 September 2021; pp. 115–118. [Google Scholar]
  11. Sogemeier, D.; Forster, Y.; Naujoks, F.; Krems, J.F.; Keinath, A. Cross-Cultural Differences: Is a Weighting Scheme for the User Experience Questionnaire Worth Considering? In Proceedings of the 15th International Conference on Automotive User Interfaces and Interactive Vehicular Applications, Ingolstadt, Germany, 18–22 September 2023; pp. 48–52. [Google Scholar]
  12. Ghiretti, F. Technological Competition: Can the EU Compete with China? JSTOR: New York, NY, USA, 2022. [Google Scholar]
  13. Beaton, D.E.; Bombardier, C.; Guillemin, F.; Ferraz, M.B. Guidelines for the process of cross-cultural adaptation of self-report measures. Spine 2000, 25, 3186–3191. [Google Scholar] [CrossRef]
  14. Lezhnina, O.; Kismihók, G. A multi-method psychometric assessment of the affinity for technology interaction (ATI) scale. Comput. Hum. Behav. Rep. 2020, 1, 100004. [Google Scholar] [CrossRef]
  15. De Klerk, S. Assessment of structural and cross-cultural validity of the Disabilities of the Arm, Shoulder and Hand questionnaire: A scoping review. Hand Therapy 2023, 28, 3–15. [Google Scholar] [CrossRef] [PubMed]
  16. Hemker, B.T.; Sijtsma, K.; Molenaar, I.W. Selection of unidimensional scales from a multidimensional item bank in the polytomous Mokken I RT model. Appl. Psychol. Meas. 1995, 19, 337–352. [Google Scholar] [CrossRef]
  17. Hu, L.t.; Bentler, P.M. Cutoff criteria for fit indexes in covariance structure analysis: Conventional criteria versus new alternatives. Struct. Equ. Model. Multidiscip. J. 1999, 6, 1–55. [Google Scholar] [CrossRef]
  18. Golino, H.; Moulder, R.; Shi, D.; Christensen, A.P.; Garrido, L.E.; Nieto, M.D.; Nesselroade, J.; Sadana, R.; Thiyagarajan, J.A.; Boker, S.M. Entropy fit indices: New fit measures for assessing the structure and dimensionality of multiple latent variables. Multivar. Behav. Res. 2021, 56, 874–902. [Google Scholar] [CrossRef]
  19. Massara, G.P.; Di Matteo, T.; Aste, T. Network filtering for big data: Triangulated maximally filtered graph. J. Complex Netw. 2016, 5, 161–178. [Google Scholar] [CrossRef]
  20. Mokken, R.J. A Theory and Procedure of Scale Analysis: With Applications in Political Research; Mouton The Hague: The Hague, The Netherlands, 1970. [Google Scholar]
  21. Dalal, D.K.; Carter, N.T. Negatively worded items negatively impact survey research. In More Statistical and Methodological Myths and Urban Legends; Routledge: Abingdon, UK, 2014; pp. 112–132. [Google Scholar]
  22. Kam, C.C.S. Why do regular and reversed items load on separate factors? Response difficulty vs. item extremity. Educ. Psychol. Meas. 2023, 83, 1085–1112. [Google Scholar] [CrossRef]
  23. Pätzold, A. Adaptive Human Machine Interfaces in a Vehicle Cockpit: Indication, Impacts and Implications. Ph.D. Thesis, Chemnitz University of Technology, Chemnitz, Germany, 2021. [Google Scholar]
  24. Weijters, B.; Baumgartner, H. Misresponse to reversed and negated items in surveys: A review. J. Mark. Res. 2012, 49, 737–747. [Google Scholar] [CrossRef]
  25. Ahmad, N.; Youjin, L.; Žiković, S.; Belyaeva, Z. The effects of technological innovation on sustainable development and environmental degradation: Evidence from China. Technol. Soc. 2023, 72, 102184. [Google Scholar] [CrossRef]
  26. Guo, J.; Lai, X.; Lu, C.; Cao, S. What has caused China’s economic growth? Econ. Syst. 2022, 46, 100982. [Google Scholar] [CrossRef]
  27. International Trade and Production of High-Tech Products. Available online: https://ec.europa.eu/eurostat/statistics-explained/index.php?title=International_trade_and_production_of_high-tech_products#:~:text=Sold%20production%20of%20high%2Dtech%20products%20increased%20from%20%E2%82%AC271,States%20for%20high%2Dtech%20exports (accessed on 10 April 2025).
  28. Maslej, N.; Fattorini, L.; Perrault, R.; Gil, Y.; Parli, V.; Kariuki, N.; Capstick, E.; Reuel, A.; Brynjolfsson, E.; Etchemendy, J.; et al. Artificial Intelligence Index Report 2025: Trends and Insights; Stanford Institute for Human-Centered Artificial Intelligence. Stanford University: Stanford, CA, USA, 2025. [Google Scholar]
  29. Cattell, R. The Scientific Use of Factor Analysis in Behavioral and Life Sciences; Springer Science & Business Media: Berlin/Heidelberg, Germany, 2012. [Google Scholar]
  30. Hair, J.; Anderson, R.; Babin, B.; Black, W. Multivariate Data Analysis Pearson New International Edition; Pearson Deutschland: Munich, Germany, 2013; p. 740. [Google Scholar]
  31. Kline, R.B. Response to leslie hayduk’s review of principles and practice of structural equation modeling. Can. Stud. Popul. Arch. 2018, 45, 188–195. [Google Scholar] [CrossRef]
  32. de Winter, J.C.; Dodou, D.; Wieringa, P.A. Exploratory factor analysis with small sample sizes. Multivar. Behav. Res. 2009, 44, 147–181. [Google Scholar] [CrossRef] [PubMed]
  33. Mundfrom, D.J.; Shaw, D.G.; Ke, T.L. Minimum sample size recommendations for conducting factor analyses. Int. J. Test. 2005, 5, 159–168. [Google Scholar] [CrossRef]
  34. Straat, J.H.; van der Ark, L.A.; Sijtsma, K. Minimum sample size requirements for Mokken scale analysis. Educ. Psychol. Meas. 2014, 74, 809–822. [Google Scholar] [CrossRef]
  35. Watson, R.; Egberink, I.J.; Kirke, L.; Tendeiro, J.N.; Doyle, F. What are the minimal sample size requirements for Mokken scaling? An empirical example with the Warwick-Edinburgh Mental Well-Being Scale. Health Psychol. Behav. Med. 2018, 6, 203–213. [Google Scholar] [CrossRef]
Figure 1. Overview of the analytical process.
Information 16 00500 g001
Figure 2. Bar plots showing the frequency distribution of each item.
Information 16 00500 g002
Figure 3. (Left) Correlation matrix for all nine items. Kendall correlations rounded to the second decimal are shown. Significant correlations are marked in color. (Right) Plot of the resulting factor structure following the exploratory factor analysis.
Information 16 00500 g003
Figure 4. Scree plot of eigenvalues including the parallel analysis.
Information 16 00500 g004
Table 1. The original version and the Chinese translation of the ATI scale.
ItemEnglish VersionChinese Translation
1I like to occupy myself in greater detail with technical systems.我喜欢深入地研究技术系统。
2I like testing the function of new technical systems.我喜欢测试新技术系统的功能
3I predominantly deal with technical systems because I have to.我使用技术系统主要是因为我不得不这样做。
4When I have a new technical system in front of me, I try it out intensively.当我面前有一个新技术系统时,我会非常想去尝试它
5I enjoy spending time becoming acquainted with a new technical system.我喜欢花时间去熟悉一个新技术系统。
6It is enough for me that a technical system works; I don’t care how or why.我只需要一个能用的技术系统。我不关心它的工作原理
7I try to understand how a technical system exactly works.我会试图理解一个技术系统到底是如何运作的。
8It is enough for me to know the basic functions of a technical system.我只想了解一个技术系统的基本功能。
9I try to make full use of the capabilities of a technical system.我尝试充分利用一个技术系统所有的能力。
Table 2. Overview of descriptive statistics for the nine items.
ItemMeanStandard DeviationRange
15.010.965
25.400.714
34.291.375
45.260.743
55.130.883
63.711.495
74.301.225
83.431.365
95.070.894
Disclaimer/Publisher’s Note: The statements, opinions and data contained in all publications are solely those of the individual author(s) and contributor(s) and not of MDPI and/or the editor(s). MDPI and/or the editor(s) disclaim responsibility for any injury to people or property resulting from any ideas, methods, instructions or products referred to in the content.

