Article

Optimizing IoT Intrusion Detection—A Graph Neural Network Approach with Attribute-Based Graph Construction

by
Tien Ngo
,
Jiao Yin
*,
Yong-Feng Ge
and
Hua Wang
Institute for Sustainable Industries and Liveable Cities, Victoria University, Melbourne, VIC 3011, Australia
*
Author to whom correspondence should be addressed.
Information 2025, 16(6), 499; https://doi.org/10.3390/info16060499
Submission received: 9 April 2025 / Revised: 1 June 2025 / Accepted: 9 June 2025 / Published: 16 June 2025
(This article belongs to the Special Issue Data Privacy Protection in the Internet of Things)

Abstract

:
The inherent complexity and heterogeneity of the Internet of Things (IoT) ecosystem present significant challenges for developing effective intrusion detection systems. While graph deep-learning-based methods have shown promise in cybersecurity applications, existing approaches primarily construct graphs based on physical network connections, which may not effectively capture node representations. This paper proposes a Top-K Similarity Graph Framework (TKSGF) for IoT network intrusion detection. Instead of relying on physical links, the TKSGF constructs graphs based on Top-K attribute similarity, ensuring a more meaningful representation of node relationships. We employ GraphSAGE as the Graph Neural Network (GNN) model to effectively capture node representations while maintaining scalability. Furthermore, we conducted extensive experiments to analyze the impact of graph directionality (directed vs. undirected), different K values, and various GNN architectures and configurations on detection performance. Evaluations on binary and multi-class classification tasks using the NF-ToN IoT and NF-BoT IoT datasets from the Machine-Learning-Based Network Intrusion Detection System (NIDS) benchmark demonstrated that our proposed framework consistently outperformed traditional machine learning methods and existing graph-based approaches, achieving superior classification accuracy and robustness.

1. Introduction

1.1. The Rise of  the IoT

For many years, the use of data collected from the Internet of Things (IoT) through uploading, sharing, and utilizing has significantly transformed how people work, study, and socialize. Given the rapid growth in IoT devices in recent years, it is clear that the IoT represents a promising paradigm to connect smart devices, providing users with seamless and flexible remote monitoring, improved control, and automation. This paradigm has contributed to enhancing productivity across multiple sectors, such as healthcare [1], agriculture [2], and transportation [3]. However, with the exponential growth in interconnected devices globally, the IoT has become a prime target for cyber attackers seeking to exploit its valuable information. The lack of robust security mechanisms in many IoT devices makes them particularly vulnerable to malicious attacks through security flaws, raising concerns about data security and privacy protection. The consequences of these attacks can range from data breaches and privacy violations, to significant losses and damage to critical applications if they remain undetected [4]. This underscores the need for implementing a robust and intelligent IoT cybersecurity intrusion detection system to detect and mitigate attacks on IoT networks.

1.2. Network Intrusion Detection System

While traditional security mechanisms such as firewalls, antivirus software, and Intrusion Detection Systems (IDS) have been used for many years by companies and organizations, they fall short in addressing the unique characteristics of IoT systems. Due to their limited resources and the ability to store heterogeneous data from various sources, the design of IoT devices is more complex than other technologies, such as Radio Frequency (RF). This complexity, however, provides IoT devices with the flexibility to integrate with other technologies or systems. Yet, these characteristics raise questions about the feasibility of implementing a universal intrusion detection solution for IoT systems. A study by Li et al. (2021) highlighted that the sources of cyber threats can vary significantly, ranging from internal dissatisfaction or sabotage, to organized hackers and terrorists [4]. This further complicates the design of a Network Intrusion Detection System (NIDS), as hackers can also leverage Artificial Intelligence (AI) to launch sophisticated attacks aimed at stealing or disrupting data [5]. Effectively detecting such attacks and using them to train models requires substantial time and effort from researchers.
Although Machine Learning (ML)-based IDSs have been utilized in recent decades to address data scarcity and quality issues, these approaches often require large volumes of high-quality data for model training and validation, which is not always available for IoT datasets [6]. Research has shown that collecting fully labeled IoT network traffic datasets, which include a variety of attack scenarios, is challenging and time-consuming [7]. This aligns with the findings of Guerra et al. (2022) [7], who noted the scarcity of fully labeled network traffic datasets. Even with fully labeled datasets, the presence of imbalanced data makes it difficult to achieve effective generalization in ML-based IDSs [8]. As a result, the challenge of processing unbalanced or incompletely labeled datasets has recently received attention from both researchers and practitioners [9,10].
Convolutional Neural Networks (CNNs) are widely recognized for their efficiency in processing time and their strong capability to extract features from raw Euclidean-structured data. However, they are computationally intensive [11], and their performance tends to be highly dependent on the dataset used for training [12]. Other approaches, such as time series networks and Transformer-based models, have also shown promise in IDS development [13,14]. Nevertheless, these models come with their own limitations: time series networks often struggle with scalability [13], while Transformers are associated with high computational cost and limited interpretability [15].
While deep feature learning focuses solely on extracting and learning from individual data attributes, attribute-based Graph Neural Networks (GNNs) are capable of leveraging both node-level features and the structural relationships between entities. This aligns closely with the objectives of our proposed NIDS, which is designed to analyze network traffic by capturing both the characteristics of individual data points and their interactions within the network. In this context, along with sharing the same foundational principles as other deep learning (DL) models, GNNs offer a significant advantage over traditional deep feature mining approaches—as well as over conventional models such as CNNs, time series networks, and Transformers—by incorporating relational information into the learning process. Additionally, the ability to model IoT data as knowledge graphs enables efficient storage and semantic reasoning [16,17], further reinforcing the suitability of GNNs for intrusion detection tasks.

1.3. Graph Neural Networks

Temporal communication patterns, device-specific behaviors, and protocol diversity are key characteristics of IoT network flows and can significantly enhance the detection of anomalous events. By modeling these flows, graph-based learning approaches gain a distinct advantage over traditional methods, as they can more effectively capture the complex interactions and contextual relationships between devices. Leveraging these intrinsic properties is essential for designing NIDS solutions that are both scalable and effective in real-world IoT environments. Recent years have seen GNNs with great potential for addressing IoT challenges related to cyber threat detection. By learning node embeddings and capturing structural information from graph-structured data, GNNs can process complex relationships within network traffic, enabling them to effectively identify abnormal patterns and detect cyber threats that might evade traditional signature-based NIDSs [18]. This capability allows GNNs to offer a comprehensive representation of the system’s state, while effectively addressing the class imbalance commonly found in IoT environments [19]. Moreover, GNNs can be combined with approaches such as federated learning [20] or graph anonymization [21] to ensure user privacy is maintained [22]. A number of GNN architectures have already been successfully applied across various NIDS domains, including the IoT, IIoT, and remote sensing. Additionally, their ability to operate in a decentralized manner [23] further strengthens their suitability for enhancing IoT security. However, significant work remains in areas such as network scalability, robustness to adversarial attacks, integration with existing security infrastructure, and improving explainability and interpretability [24] to fully realize the potential of graph-based systems in real-world applications [25].
There are various types of GNNs used in NIDS applications, each with their own strengths and limitations. The most commonly used is the Graph Convolutional Network (GCN), which employs convolution operations to aggregate node information equally from neighboring nodes, making it suitable for general graph tasks. On the other hand, a Graph Attention Network (GAT) introduces self-attention mechanisms that assign different weights to neighbors during aggregation. However, a GAT can face challenges when applied to large graphs, due to its complexity [26]. GATs have been applied in fields such as healthcare, bioinformatics, and social network analysis. The Graph Sample and Aggregation (GraphSAGE) model is the newest of these three. As its name suggests, GraphSAGE uses a sampling approach for neighbors, combined with multiple aggregation methods for generating node embeddings. This design allows GraphSAGE to scale more efficiently, making it better suited for large, dynamic IoT graphs [27] compared to GCNs and GATs.

1.4. Research Gap and Contributions

Traditional ML- and DL-based IoT NIDS algorithms often rely heavily on a dataset’s feature selection phase, which can be time-consuming and dependent on understanding the dataset from a machine perspective. While graph-based methods are advantageous for this problem, existing works that rely on physical network connections for graph construction have significant limitations. These methods may not effectively capture the authentic relationships between nodes, leading to suboptimal performance. To address this, we propose a novel Top-K Similarity Graph Framework (TKSGF) for IoT network intrusion detection.
The main contributions of this paper are as follows:
  • We introduce TKSGF for IoT network intrusion detection. Our framework achieved superior performance on both binary and multi-class classification tasks using the NF-ToN IoT and NF-BoT IoT datasets, outperforming traditional machine learning methods and existing graph-based approaches.
  • We develop a novel Top-K Attribute Similarity-Based Graph Construction method, rather than the existing physical-network-connection-based method. Our method ensures a more meaningful representation of node relationships and achieved better results compared to physical-link-based methods.
  • We conducted comprehensive experiments to investigate the impact of graph directionality (directed vs. undirected), different K values, and various GNN architectures and configurations on IoT NIDS detection performance. These experiments provided valuable insights and reference points for future research and practical applications in the field.
This paper is divided into five sections. Section 2 describes the related works. Section 3 focuses on the study’s materials and methods. Section 4 contains the presentation and discussion of results, along with suggestions for further study. Finally, Section 5 presents the conclusions.

2. Related Work

2.1. Machine Learning in IoT Cyber Security

Machine learning is a fundamental technique that provides quick and effective solutions to common IoT challenges, such as intrusion detection and anomaly detection. Previous studies have demonstrated that with proper hyperparameter tuning, ML can deliver competitive results in monitoring suspicious events, identifying abnormalities, and detecting malicious activities, thereby contributing to the overall enhancement of IoT security. Moreover, ML plays a crucial role in creating benchmark datasets that can be used to evaluate the performance of IoT security systems using state-of-the-art (SOTA) methods. These benchmark datasets can also be applied alongside deep learning techniques for performance comparisons. In IoT cybersecurity environments, various ML models can be utilized, including Decision Trees (DT), Random Forest (RF), K-Nearest Neighbors (KNN), Naive Bayes (NB), and Extreme Gradient Boosting (XGBoost).
Previous studies have highlighted the significant role of ML in advancing cybersecurity. For instance, Guezzaz et al. (2021) developed a decision tree classifier and enhanced data quality, achieving robust accuracy rates of 99.42% and 98.80% with the NSL-KDD and CICIDS2017 datasets, respectively [28]. Majidian et al. (2024) focused on optimizing the random forest classifier by partitioning the network into controller nodes and grouping them into subdomains, yielding average accuracies of 98.06% and 99.67% on the NSWNB15 and NSLKDD datasets, respectively [29]. Recognizing the importance of data quality for improving detection capabilities, Mohy et al. (2023) [30] proposed three feature selection methods—principal component analysis (PCA), univariate statistical tests, and genetic algorithms (GA)—to select a subset of features that effectively represent the entire dataset. They demonstrated the impact of these methods using K-NN, which resulted in outstanding performance and a significant reduction in prediction times [30]. Mehmood et al. (2018) explored ways to improve the detection rate of Distributed Denial-of-Service (DDoS) attacks by implementing a Naïve Bayes classification algorithm with multiple agents, reporting very fast performance [31]. Alqahtani et al. (2020) applied a genetic-based extreme gradient boosting (GXGBoost) algorithm to a Fisher-score-based feature selection method, significantly reducing the number of required data traffic features, while achieving a high IoT botnet attack detection rate [32]. Stacking different ML models can also enhance overall performance. For example, Douiba et al. (2023) presented an improved IDS by combining gradient boosting (GB) and decision trees (DT), achieving perfect precision and recall for malicious classes such as Password, SQL injection, Uploading, and Vulnerability Scanner on the Edge-IIoT dataset [33]. Despite challenges such as data availability and quality, vulnerability to adversarial attacks, resource constraints, and privacy concerns, ongoing research continues to seek better solutions to enhance IoT security and the resilience of systems.

2.2. Deep Learning in IoT Cyber Security

Most IoT datasets consist of network traffic records, which typically require manual feature engineering in ML to extract relevant data features. In contrast, DL leverages its automatic feature extraction capability to learn complex patterns from raw data, enabling it to achieve competitive results in tasks such as attack detection and device-type identification. Hamidouche et al. (2023) demonstrated that DL can outperform ML in IoT cybersecurity tasks [34]. The study also suggested that DL models can transform unstructured network traffic data into images, showcasing their adaptability to classification problems. DL can be categorized into supervised learning, unsupervised learning, and transfer learning [35], where knowledge from one domain is applied to enhance learning in another.
In supervised learning, Halbouni et al. (2022) combined Convolutional Neural Network (CNN) and Long Short-Term Memory (LSTM) layers to extract both spatial and temporal features, achieving accuracies of 99.64%, 94.53%, and 99.67% for binary classification on the CIC-IDS2017, UNSW-NB, and WSN-DS datasets, respectively [36]. Ullah et al. (2022) introduced a hybrid model by placing recurrent layers after the convolution layer to promote more balanced learning [37]. Their model demonstrated consistent performance in both multi-class and binary classification tasks across multiple datasets, including NSLKDD, BoT-IoT, IoT-NI, IoT-23, MQTT, MQTTset, and IoT-DS2.
In the realm of unsupervised learning, Park et al. (2022) focused on integrating autoencoders with reconstruction error and Wasserstein distance-based generative adversarial networks to tackle the issue of data imbalance [38]. Meanwhile, Alrayes et al. (2024) [39] proposed using a denoising autoencoder for unsupervised learning and feature extraction to detect and prevent intrusion attempts in real time. Their approach achieved impressive F1-scores of 99.8% and 98.9% when tested on the CICIDS 2017 and NSL-KDD datasets, respectively [39].

2.3. Graph Deep Learning in IoT Cyber Security

Graph Deep Learning (GDL), which utilizes GNNs, is a branch of DL focused on learning from graph-structured data, such as modeling network traffic as a graph. This enables GNNs to develop flexible and scalable architectures that can effectively address cyber threats targeting IoT devices and networks. By learning node embeddings and capturing structural patterns in network traffic, GNNs can efficiently identify abnormal behaviors and detect cyber attacks that may elude traditional signature-based NIDSs. Additionally, GNNs offer a comprehensive representation of the system’s state, while effectively handling the class imbalance commonly seen in IoT environments.
Several notable works have successfully integrated GDL into NIDSs using supervised learning. For example, Deng et al. (2022) introduced a novel Flow Topology-based Graph Convolutional Network (FT-GCN) approach that emphasizes traffic flow patterns to address label-limited IoT network intrusion detection [40]. Zhang et al. (2023) combined an enhanced version of a Graph Attention Network (GAT) with a Long Short-Term Memory (LSTM) network to effectively capture both the spatial topology and temporal features of network traffic, showing improvements in both binary and multi-class classification tasks [41]. Hamilton et al. (2017) laid the foundation for GraphSAGE, an inductive framework that utilizes node feature information to efficiently generate node embeddings [42]. Lo et al. (2022) [43] introduced the first E-GraphSAGE, a GNN approach that incorporates both edge features and topological information for IoT network intrusion detection. Their extensive evaluation on four NIDS benchmark datasets highlighted the effectiveness of their model in terms of key classification metrics [43]. Lastly, Xu et al. (2024) presented the first GNN-based method for multi-class classification tasks in NIDSs using an unsupervised approach [44]. Their method efficiently distinguished normal network flows from malicious ones across different attack types, demonstrating strong generalization capabilities and potential for real-world traffic detection applications.

3. Methodology

3.1. Graph Theory Preliminaries

A graph is a mathematical structure used to model pairwise relations between entities. Formally, a graph is defined as G = ( V , E ) , where V = v 1 , v 2 , , v N is the set of vertices (or nodes), and E V × V is the set of edges connecting pairs of nodes.
An alternative representation of a graph is the adjacency matrix A R N × N , where each element A i j denotes the presence or absence of an edge between node v i and node v j . In this study, edges are not determined by physical network topology, but instead by the attribute similarity between nodes, represented by a similarity matrix S R N × N . Each entry S i j quantifies the similarity between nodes v i and v j . Given a top-K similarity K N , the construction method of the adjacency matrix A will be detailed in Section 3.4.

3.2. The Overall Framework

The proposed Top-K Similarity Graph Framework for IoT network intrusion detection, unlike traditional methods that rely on physical network connectivity for graph construction, leverages feature-based similarity to construct more meaningful graph structures. As shown in Figure 1, the framework consists of four main stages: (1) data preprocessing and optional feature extraction, (2) graph construction based on Top-K attribute similarity, (3) node representation learning via Graph Neural Networks, and (4) classification for binary and multi-class intrusion detection tasks.

3.3. Data Preprocessing and Feature Representation

Let the input dataset be represented as D = { ( x i , y i ) } i = 1 N , where x i R d denotes the d-dimensional feature vector of the i-th network flow and y i is the corresponding class label. Prior to graph construction, each x i undergoes standard preprocessing procedures, such as normalization or encoding, to ensure uniformity in feature space.

3.4. Top-K Attribute-Similarity-Based Graph Construction

A graph G = ( V , E ) is constructed where each node v i V corresponds to a feature vector x i . Unlike traditional approaches, we construct edges based on attribute similarity rather than physical topology. To measure the similarity between two nodes, we use cosine similarity, as shown in Equation (1):
S ( x i , x j ) = x i · x j x i x j
For each node v i , we identify its Top-K most similar neighbors, as shown in Equation (2):
N K ( v i ) = Top- K { S ( x i , x j ) } j i
Edges are established between v i and each v j N K ( v i ) , as shown in Equation (3):
( v i , v j ) E if   v j N K ( v i )
After determining the Top-K neighbors for each node v i based on cosine similarity, we establish edges between nodes as described in Equation (3). At this stage, the graph can be constructed as either directed or undirected, depending on the desired relationship between the nodes.
Undirected Graph: In an undirected graph, the connection between nodes is mutual, meaning that if node v i is connected to node v j , then node v j is also connected to node v i . Therefore, the adjacency matrix A for the undirected graph is defined as Equation (4):
A i j = 1 , if v j N K ( v i )   and   i < j 0 , otherwise .
Here, an edge is established between v i and v j if their cosine similarity exceeds a predefined threshold s threshold , with the condition i < j ensuring that the matrix is symmetric, reflecting the bidirectional nature of the relationship.
Directed Graph: In a directed graph, edges have a direction, meaning that if node v i is connected to node v j , this does not imply that v j is connected to v i . The adjacency matrix A for a directed graph is defined as Equation (5):
A i j = 1 , if v j N K ( v i )   and   i j 0 , otherwise .
In this case, an edge is created from v i to v j if the cosine similarity between their feature vectors exceeds the threshold. The condition i j ensures that there are no self-loops (i.e., a node is not connected to itself).
The choice between using a directed or undirected graph depends on the characteristics of the data and the specific task at hand. If the feature relationships are symmetric or bidirectional (e.g., in clustering tasks where the similarity between nodes should be mutual), an undirected graph is typically used. However, if the relationships are asymmetric (e.g., where one feature may be more influential or dominant in determining connections), a directed graph would better reflect these interactions.
This Top-K similarity-based construction allows the graph to represent more meaningful relationships between instances in the IoT dataset, accommodating both directed and undirected configurations for comparative experimentation.

3.5. Node Representation Learning with GraphSAGE

To capture contextual relationships between network flows, we apply GraphSAGE for inductive node embedding. In each layer l, the embedding of node v i is updated by aggregating the embeddings of its neighbors, as shown in Equation (6):
h i ( l ) = σ W ( l ) · AGG ( l ) h i ( l 1 ) h j ( l 1 ) : j N ( v i )
where h i ( l ) is the embedding of node v i in layer l; W ( l ) is the learnable weight matrix; σ ( · ) is an activation function (e.g., ReLU); AGG ( l ) ( · ) is an aggregation function such as mean, LSTM, or max-pooling; and h i ( 0 ) = x i is the initial feature vector. After L layers, the final node representation is denoted as Equation (7):
z i = h i ( L )

3.6. Intrusion Detection via Classification

The learned embeddings are used for intrusion classification. We apply a softmax classifier to predict the class label of each node:
y ^ i = arg max c { 1 , , C } softmax ( W c z i + b c )
where C is the number of classes, and W c , b c are the weights and bias for class c.
The model is trained using the cross-entropy loss function, as in Equation (9):
L CE = 1 N i = 1 N c = 1 C y i , c log p ^ i , c
where y i , c is a binary indicator (1 if sample i belongs to class c, 0 otherwise), and p ^ i , c is the predicted probability for class c computed by the softmax function.
This approach enables scalable and flexible intrusion detection by learning high-quality node embeddings that capture structural and semantic relationships among network flows.

4. Results and Discussion

4.1. Datasets

IoT datasets are generally categorized into real-world, synthetic, or hybrid types, depending on the context in which they are generated. Real-world datasets offer valuable insights into actual attack behaviors and system vulnerabilities, but they are often expensive and time-consuming to collect. In contrast, synthetic datasets are easier to generate but may lack the complexity and variability of real-world scenarios, potentially limiting their generalizability. Hybrid datasets aim to balance these trade-offs by combining real and synthetic data, resulting in more comprehensive and representative datasets that are widely adopted in research.
Developing an effective GNN-based algorithm relies on access to a reliable and comprehensive dataset for training, evaluation, and testing. In the context of NIDSs, the NetFlow format offers valuable IP flow data by capturing detailed network traffic patterns. This structured format not only facilitates the reconstruction of raw graph-based network structures, but also aids in identifying anomalous behaviors. As a result, NetFlow (NF) datasets enhance the ability of researchers to visualize and analyze traffic flows more effectively, thereby supporting more informed experimentation with GNN models [45].
Most NF datasets used in IoT and Industrial IoT (IIoT) environments are hybrid in nature, combining real-world network traffic with simulated attack scenarios to create comprehensive benchmark datasets for NIDSs. These datasets often include various forms of information such as network traffic details, device health indicators, and system logs. Prior research has utilized a range of NF-based IoT datasets for intrusion and anomaly detection tasks, including NF-CSE-CIC-IDS2018, NF-BoT-IoT, NF-ToN-IoT, and updated versions such as NF-CSE-CIC-IDS2018-v2 and NF-BoT-IoT-v2.
In this study, NF-BoT-IoT and NF-ToN-IoT were selected due to their relevance in representing IoT network traffic and their demonstrated reliability and consistent performance in prior research. Both datasets are categorized as medium-to-large-scale, making them well suited for GPU-accelerated experimentation to enhance processing efficiency.
These datasets consist of both binary attack labels and detailed attack type annotations, enabling the evaluation of two distinct classification tasks: (1) binary classification, which determines whether a given network traffic sample is benign or malicious, and (2) multi-class classification, which identifies the specific category of malicious activity. The attack categories represented in the datasets are outlined below:
  • Denial of Service (DoS): Disrupts the normal functioning of a system by overwhelming it with malicious requests or operations.
  • Distributed Denial of Service (DDoS): A coordinated DoS attack executed from multiple sources to flood and incapacitate a target system.
  • Reconnaissance: Involves probing or scanning activities aimed at gathering information about a system’s vulnerabilities prior to launching an attack.
  • Theft: Refers to unauthorized access and extraction of sensitive or personal information, often for illicit distribution or sale.
  • Backdoor: Utilizes hidden entry points to gain unauthorized access to a system, bypassing standard authentication mechanisms.
  • Man-in-the-Middle (MITM): An attack in which the adversary intercepts and potentially alters communications between two parties without their knowledge.
  • Password Attack: Attempts to compromise user credentials in order to gain unauthorized access to protected systems or accounts.
  • Ransomware: Malicious software that encrypts or locks system files, demanding payment from users in exchange for restored access. A notable example is the WannaCry ransomware worm, which propagated globally in 2017, encrypting files on affected systems and demanding payment in Bitcoin for decryption [46]. More information is available at https://attack.mitre.org/software/S0366/, accessed on 8 June 2025.
  • Scanning: Involves automated probing to identify open ports, running services, or system vulnerabilities that may be exploited.
  • Cross-Site Scripting (XSS): Injects malicious scripts into trusted websites or applications to exploit users and compromise system integrity.

4.2. Setup

The experiments were conducted on a single NVIDIA GeForce RTX 3070 GPU with 8GB of memory. PyCharm (2024.1.4 Professional Edition) was used as the primary integrated development environment (IDE), due to its robust support for Python programming, flexibility in coding, and powerful debugging tools. Its compatibility with a wide range of libraries also contributed to its selection. These include NumPy (1.26.4) for numerical operations, Pandas (2.2.3) for data manipulation, FAISS (1.10.0) for efficient similarity search and vector clustering, scikit-learn (1.6.1) for machine learning algorithms, PyTorch (2.1.0+cu118) for building deep neural networks, and Matplotlib (3.10.1) and Seaborn (0.13.2) for data visualization.
The public datasets utilized in this paper are available for access and download from the Machine-Learning-Based NIDS websites (https://staff.itee.uq.edu.au/marius/NIDS_datasets/, accessed on 11 June 2025). A minimum of 60% of each dataset was allocated to the training set, with the remaining data evenly split between the validation and test datasets. Following the approach of Altaf et al. (2023), we adopted various train-to-test ratios [47], selecting 70% of the NF-BoT-IoT data and 60% of the NF-ToN-IoT data for training. The attack distribution of the tested datasets is summarized in Table 1.
For each dataset, categorical labels were numerically encoded into features, while the labels were transformed into binary and multi-class formats as appropriate. Depending on the programming language used, both types of labels were converted into their corresponding formats before being integrated with the encoded categorical features. This process was essential for splitting the dataset into training, evaluation, and test sets. For each set, the features were normalized and integrated with FAISS, and similarity vectors were calculated using a specific k-nearest neighbor approach, yielding distance and indices. Edges were then created between nodes whose similarity distance exceeded a predefined threshold. The similarity graphs were constructed using the normalized features, classification labels, and edges formed previously. Both undirected and directed graphs were generated at this stage. The resulting graphs were saved locally in their respective train, evaluation, and test sets.
The generated graphs were fed into GNN models to begin the training process, where the model parameters were iteratively optimized using graph-structured data. During each epoch, the model produced predictions that were compared to the ground truth labels using the cross-entropy loss function to compute gradients. These gradients were then used to update the model parameters through the Adam optimizer, selected for its adaptive learning rate and proven reliability in deep learning tasks. The model’s performance was continually monitored on a validation set, and training continued until the validation error reached a minimum. This approach helped mitigate overfitting and enhanced the model’s generalization to unseen data.
All fixed hyperparameter settings were adopted from the study of Altaf et al. (2023) [47], specifically, the number of hidden channels is set to 32, and the learning rate is configured as 0.01. For each dataset and classification type, experiments were conducted using different graph types (Directed or Undirected), k-values, and GNN algorithms (GCN, GAT, GraphSAGE), with each experiment repeated at least five times. The exploration of hyperparameter impact followed the methodology of Manoharan et al. [48].

4.3. Evaluation Metrics

For the multi-class classification task, the macro-average method plays a crucial role in assessing the effectiveness of an algorithm [49], and was therefore adopted in this study. Given the imbalanced nature of both the NF-BoT-IoT and NF-ToN-IoT datasets, F1-Score was selected as the primary evaluation metric. This metric is particularly important for evaluating model performance. It has also been widely used in numerous past studies to assess model performance in both binary and multi-class classification tasks [36,50].

4.4. Comparison with Other Works

Table 2 presents a comparison of the study’s final results with other ML and DL techniques from previous research [43,44,51]. The table highlights that our approach surpassed all other methods in terms of overall performance, as indicated in bold.

4.5. Ablation Study

Table 3 presents the results of an ablation study investigating the impact of different similarity metrics—namely, cosine similarity and Euclidean distance—and the role of the similarity threshold in determining the F1-score performance. Cosine similarity evaluates the angle between feature vectors to assess their orientation similarity, while Euclidean distance measures the absolute magnitude of difference between vectors. Given the high dimensional nature of the IoT dataset used in this study, cosine similarity was expected to outperform Euclidean distance, which is known to be sensitive to scale and less robust in high-dimensional spaces.
In line with the findings of Elsharkawi et al. (2025) [52], the similarity threshold was identified as a critical parameter for enhancing classification performance by controlling the formation of edges between nodes. To mitigate the inclusion of noisy or irrelevant connections while retaining informative ones, we combined the use of a Top-K neighbor selection strategy with a similarity threshold criterion. Specifically, FAISS was employed to efficiently retrieve the Top-K most similar neighbors for each node. We retained this mechanism throughout the ablation studies due to its computational efficiency, as replacing it with a brute-force full similarity matrix computation would have significantly degraded performance.
The experimental results confirm that cosine similarity consistently outperformed Euclidean distance in this context. Furthermore, the inclusion of a similarity threshold proved effective in improving the quality of the constructed graph by preserving only semantically meaningful edges. Based on the outcomes of ablation studies 3 and 4 in Table 3, along with common practice, a similarity threshold value of 0.8 (referred to as Sim08) was selected for the proposed approach.

4.6. Binary Classification Results

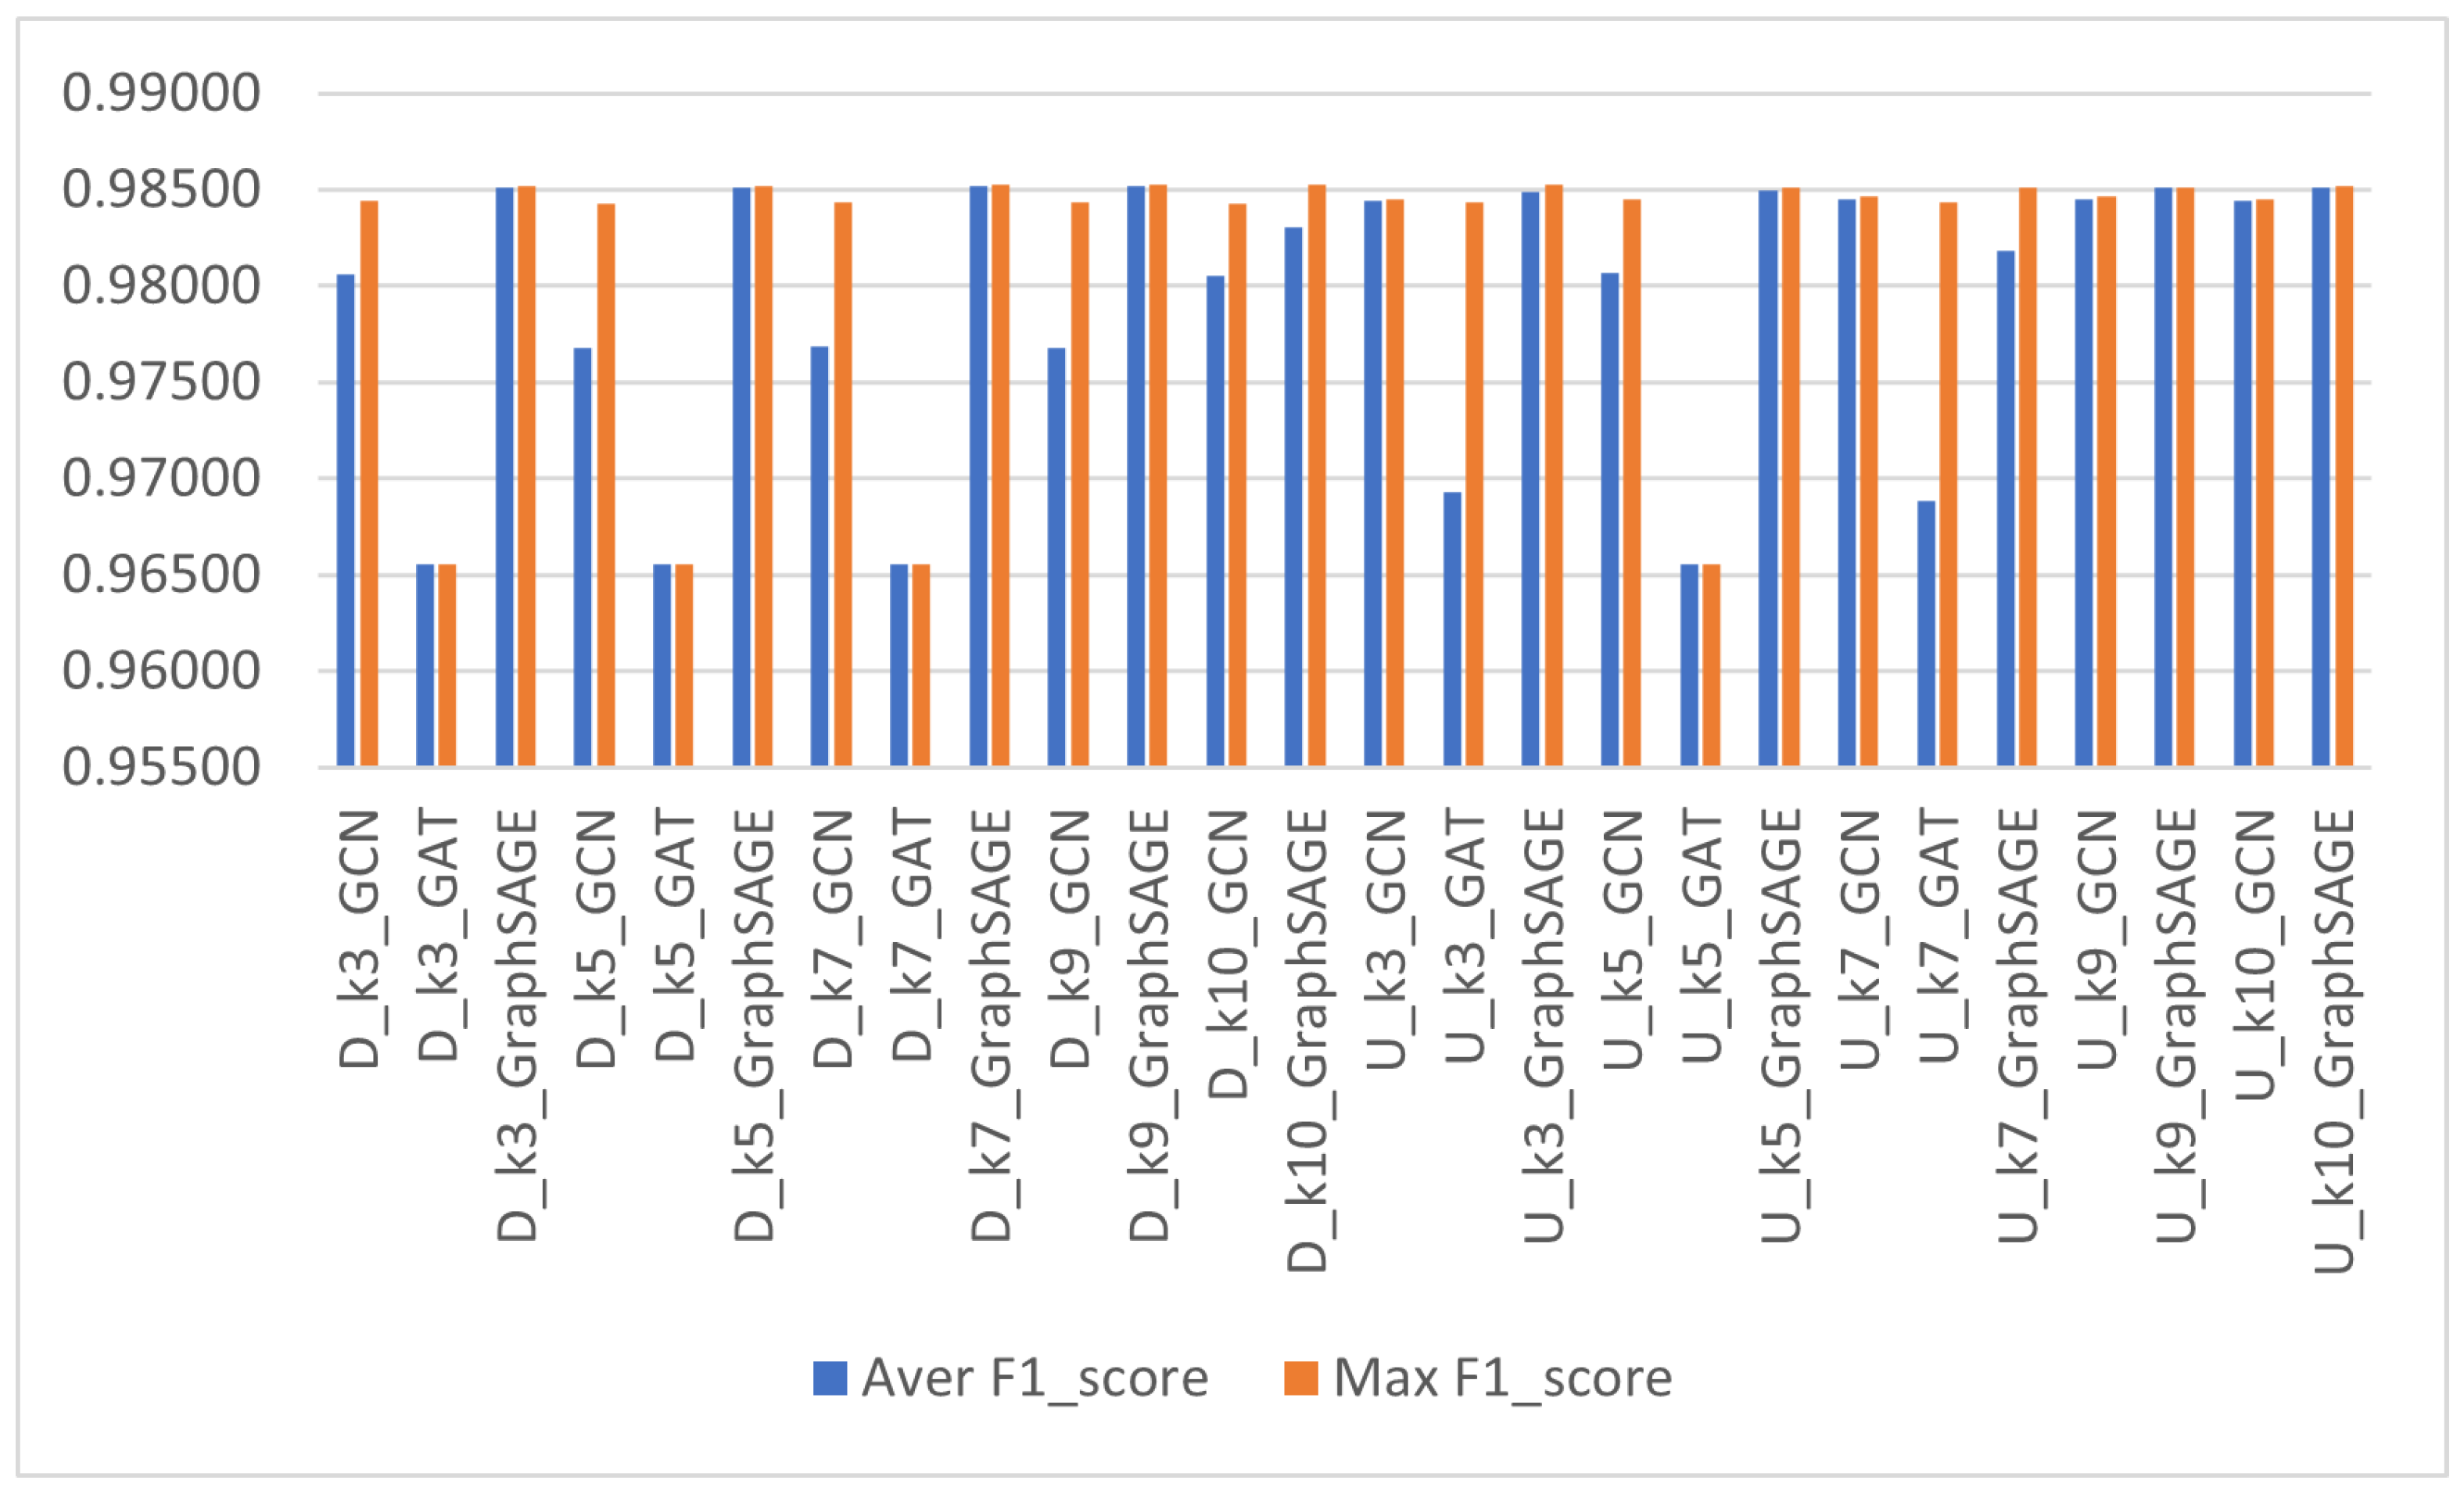
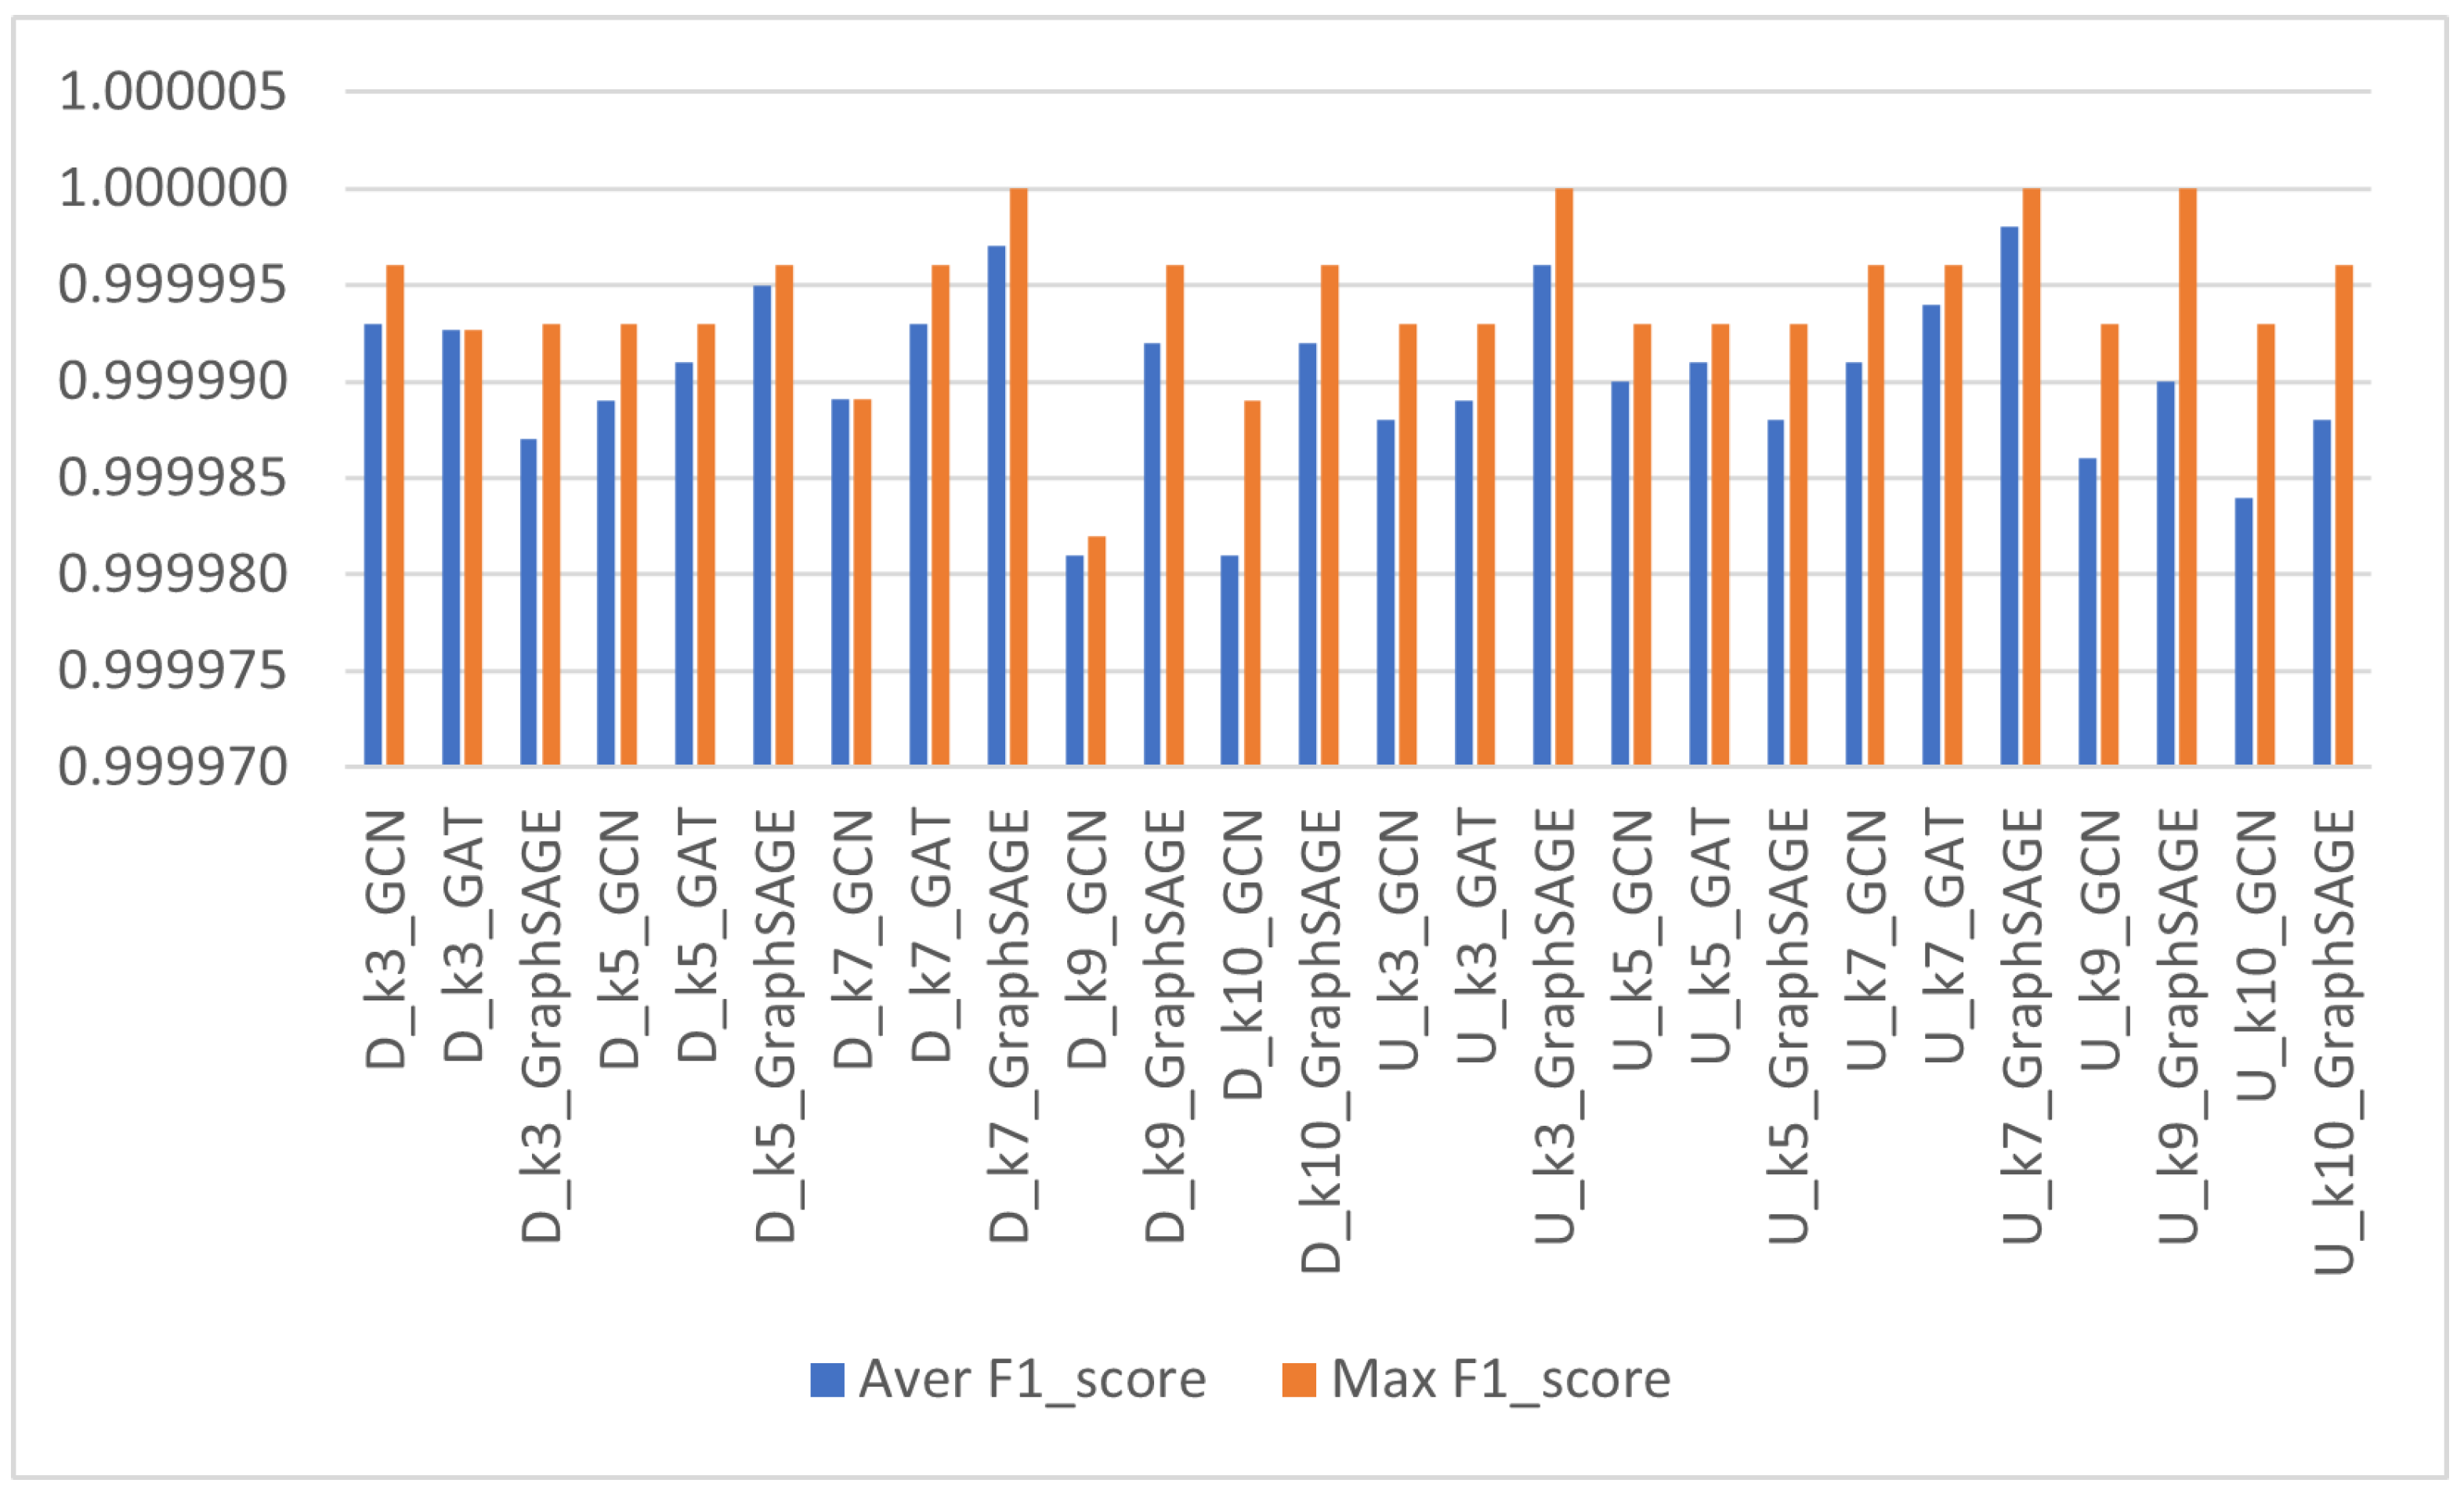
Figure 2 and Figure 3 present a performance comparison of binary classification results for the NF-BoT-IoT and NF-ToN-IoT datasets, respectively. It is evident that GraphSAGE consistently outperformed the other GNN algorithms. Specifically, GraphSAGE achieved the highest binary classification results, with an F1-score of 0.985222 ( D _ k 7 _ G r a p h S A G E ) for the NF-BoT-IoT dataset and 0.999998 ( U _ k 7 _ G r a p h S A G E ) for the NF-ToN-IoT dataset, compared to 0.984507 ( U _ k 7 _ G C N ) for NF-BoT-IoT using the GCN algorithm, and 0.999994 ( U _ k 7 _ G A T ) for NF-ToN-IoT using the GAT algorithm. The binary classification results for the NF-BoT-IoT dataset (Table 4) show that the GAT was the most stable algorithm, as indicated by its small standard deviation. Table 5 demonstrates the consistency in achieving excellent F1-scores across all tested scenarios. For both datasets, binary classification results for the GAT model are not provided for k = 9 and k = 10 , as the processing time for these cases was significantly longer than for the others.

4.7. Multi-Class Classification Results

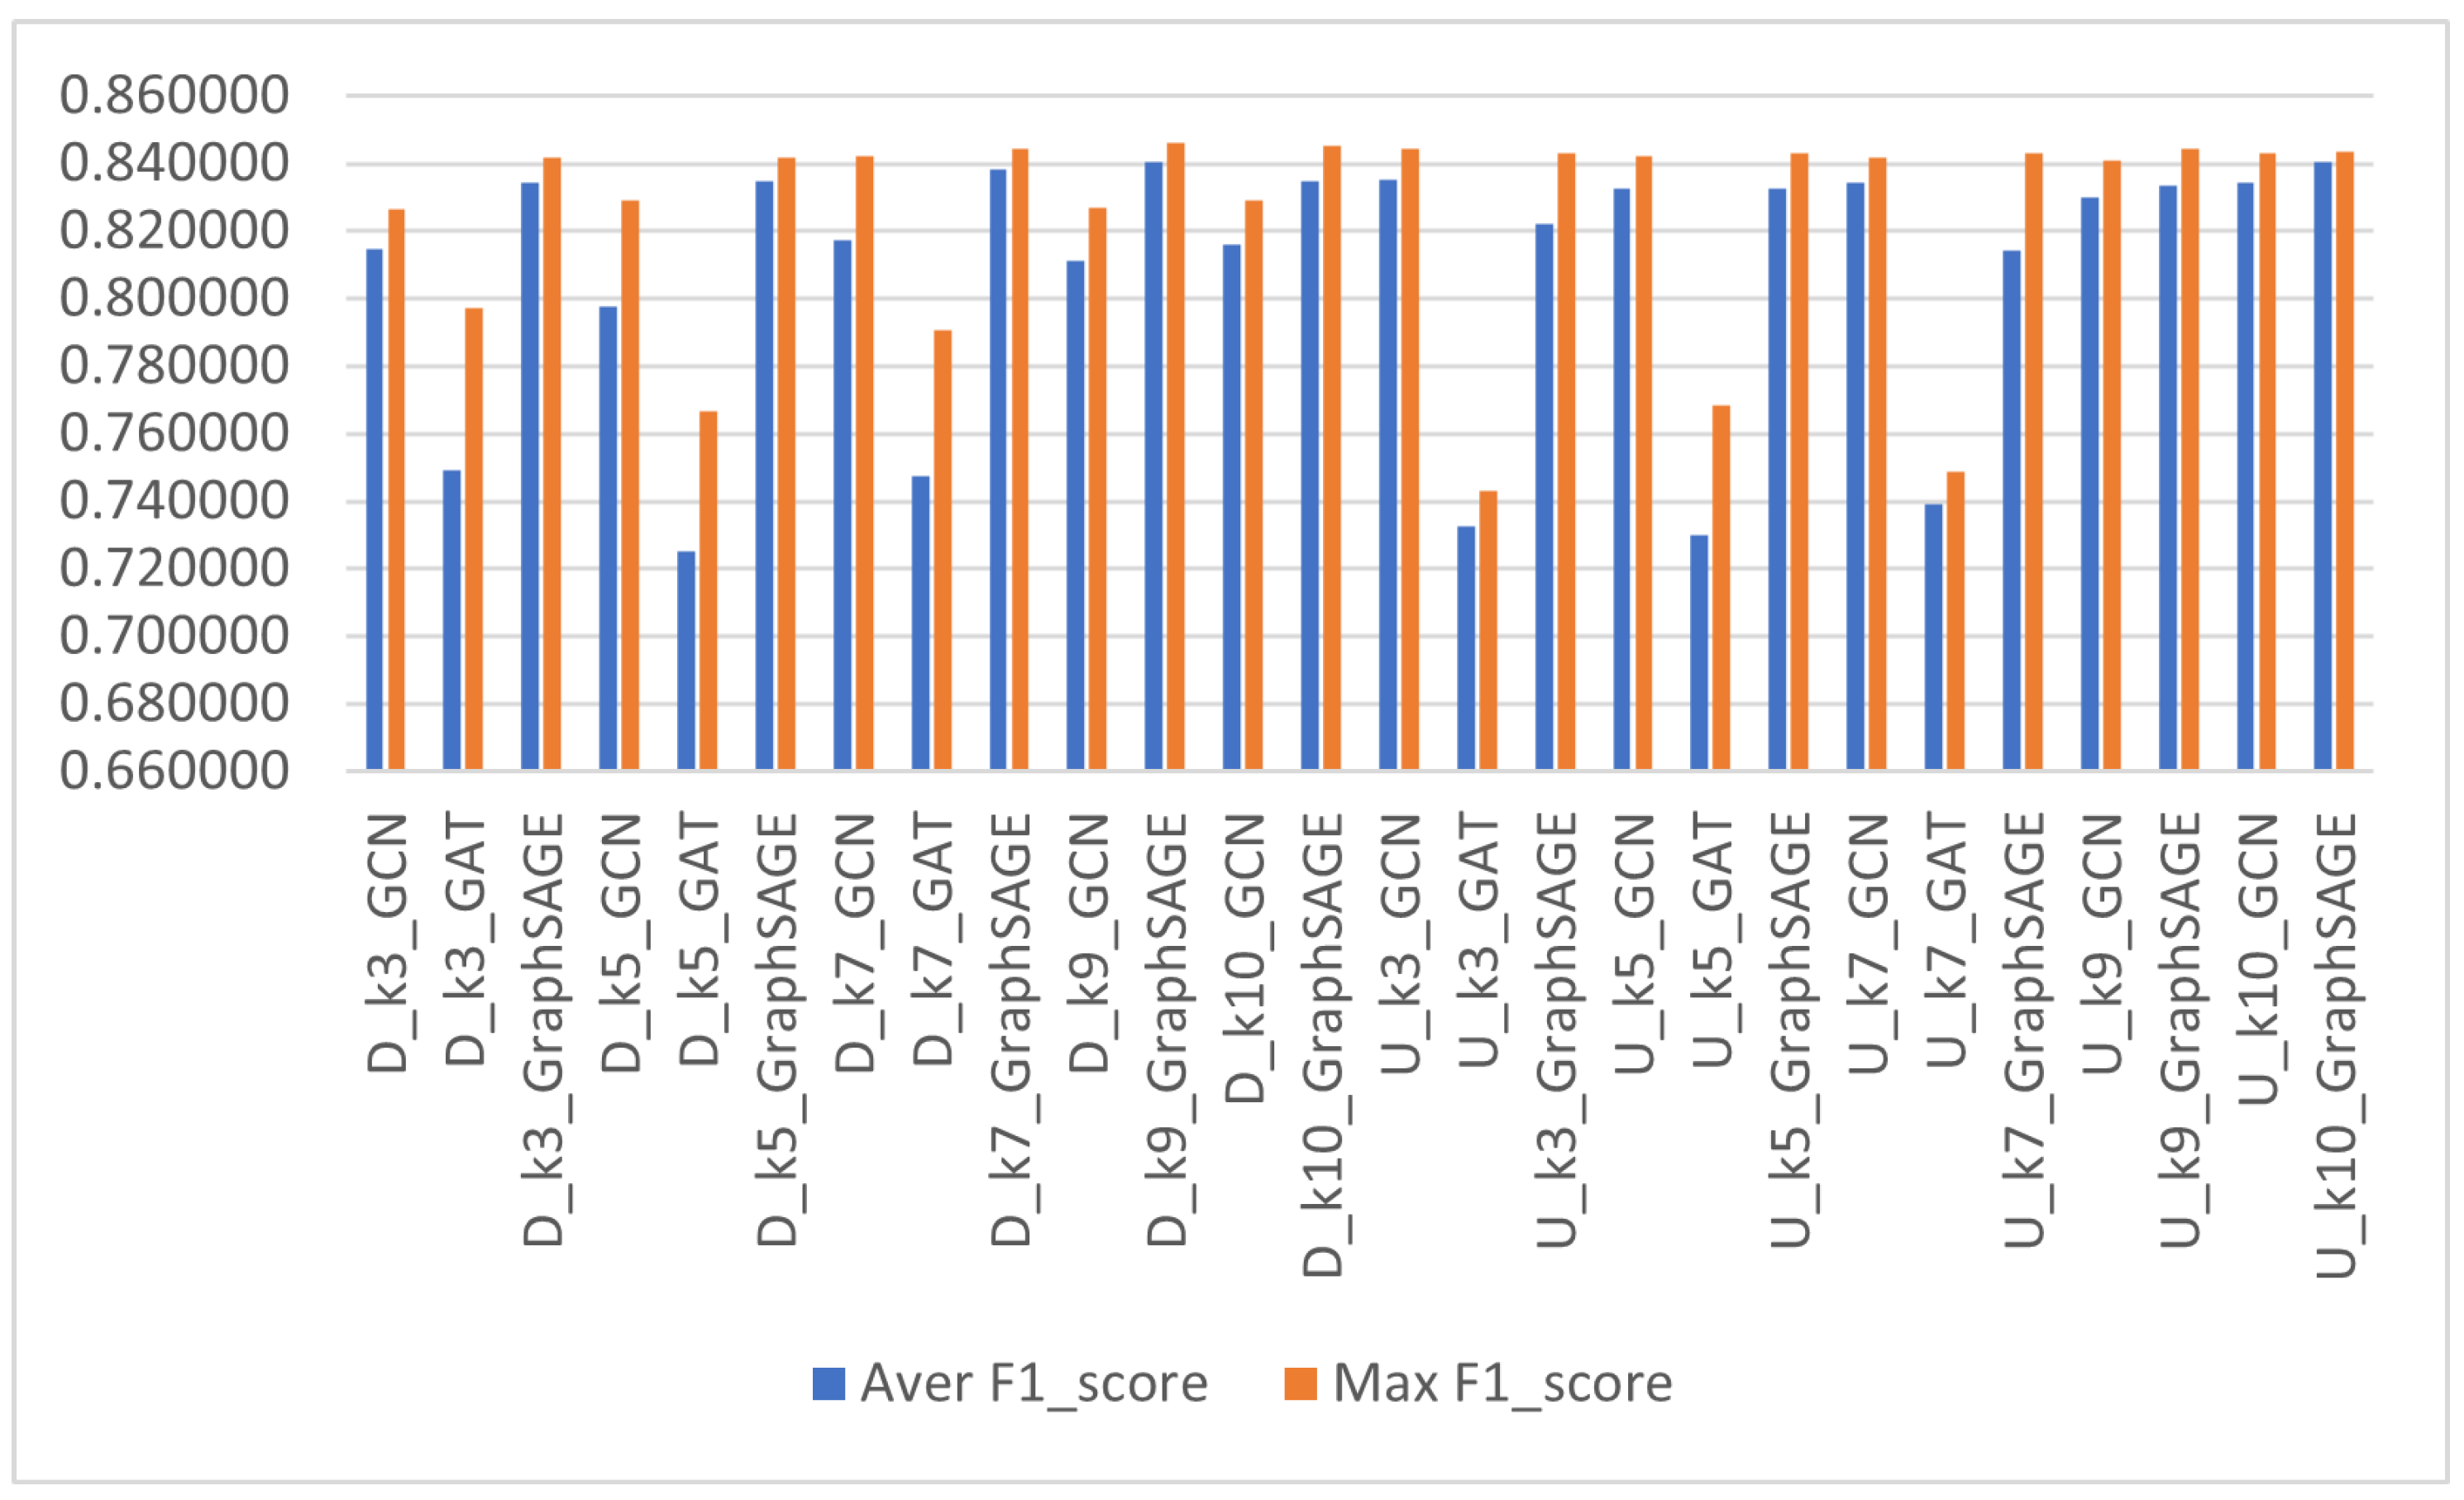
Figure 4 and Figure 5 summarize the performance comparison of multi-class classification results for the NF-BoT-IoT and NF-ToN-IoT datasets, respectively. GraphSAGE once again consistently outperformed the other two GNN algorithms. Specifically, GraphSAGE achieved the best multi-class classification results with an F1-score of 0.840447 ( U _ k 10 _ G r a p h S A G E ) for the NF-BoT-IoT dataset and 0.628374 ( U _ k 5 _ G r a p h S A G E ) for the NF-ToN-IoT dataset, compared to 0.835111 ( U _ k 3 _ G C N ) and 0.619946 ( U _ k 7 _ G C N ) for the NF-BoT-IoT and NF-ToN-IoT datasets, respectively, using the GCN algorithm. Table 6 highlights the notable performance drop for GAT compared to GCN and GraphSAGE. Although the reduction in GAT performance shown in Table 7 is smaller than in Table 6, the results from both tables underscore the limitations of the GAT algorithm when handling large dynamic graphs. This aligns with the theoretical foundation of the GAT model, which struggles to scale effectively with large graphs. As a result, the multi-class classification results for the GAT model with k = 3 , k = 5 , and k = 7 settings are only shown for representative purposes.

4.8. GNN Model Structure Exploration

Building on the findings from the preceding sections, which emphasized the impact of graph type and structural parameters on classification performance and consequently inform model selection and architectural design for IoT cyber threat detection, this section provides an in-depth exploration of the structural characteristics and performance implications of the different GNN models.
For each dataset, we followed the approach of Halbouni et al. (2022) to investigate the impact of batch normalization, dropout, and residual connections on the F1-score performance of each tested GNN model, in both binary and multi-class classifications [36]. This exploration aimed to identify the best-performing variant of the GraphSAGE models, providing valuable insights for future studies to understand the effects of these parameters. Table 8 presents a list of the different GraphSAGE variants, along with the sequence in which their functions were applied.
Table 9 presents the top three GraphSAGE variants for each dataset, using the same hyperparameters that yielded the best results for the corresponding classification tasks. The results show that adding a residual connection and an additional batch normalization layer can improve overall performance, as demonstrated by the GraphSAGE3 variant. It was also observed that smaller datasets may benefit from using a larger k-value ( k = 9 and k = 10 ) compared to k = 7 and k = 5 in order to optimize the F1-score performance. Another key observation from Table 9 is that undirected graphs tended to perform better on multi-class classification tasks, while directed graphs are more effective for binary classification tasks. However, these findings should be further validated with additional datasets for more conclusive results.
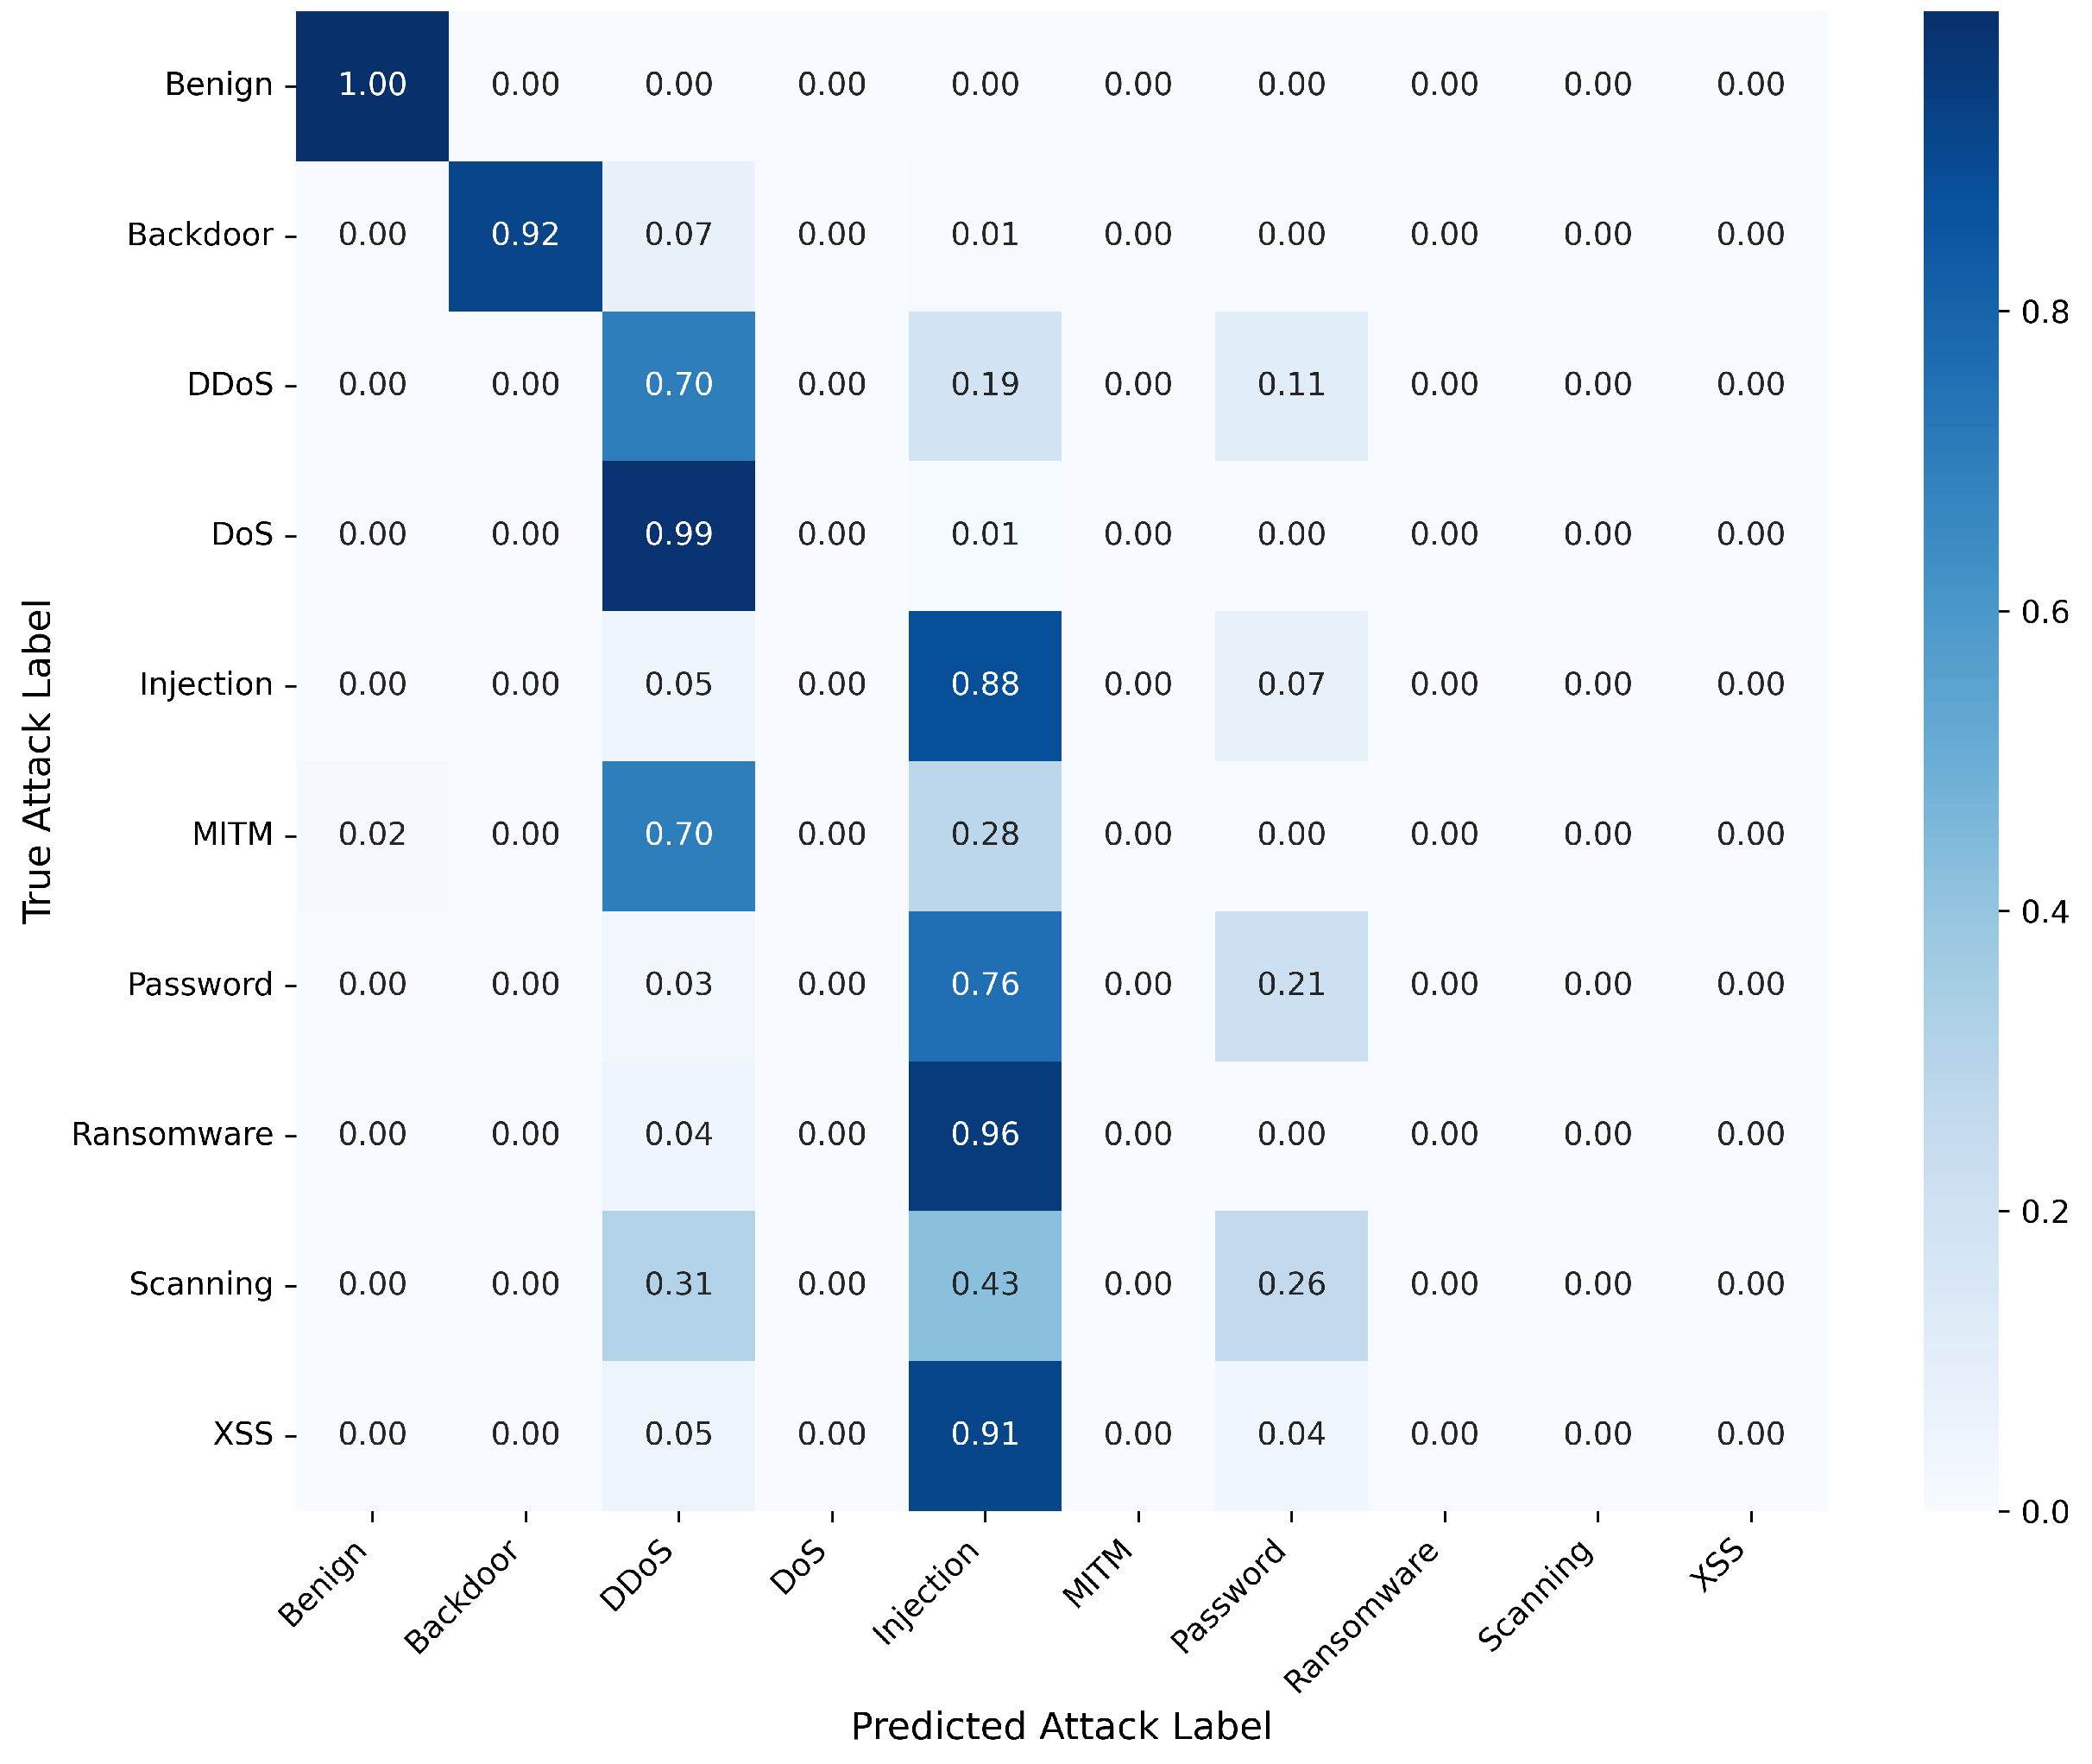
Since there is limited insight into how well the model classified specific types of attacks, we chose to present a multi-class classification confusion matrix comparison between datasets to highlight these details. Figure 6 and Figure 7 show the confusion matrices for the NF-BoT IoT and NF-ToN IoT datasets, respectively, illustrating the performance of the GraphSAGE algorithm in classifying different attack types.
For the NF-BoT IoT dataset, the confusion matrix indicates that the GraphSAGE algorithm performed well in detecting Benign (0.45), DDoS (0.49), DoS (0.46), and Reconnaissance (0.94) attacks, but struggled with identifying Theft (0.01) attacks. Notably, there were misclassifications between Benign and Reconnaissance (0.53), as well as Theft and Reconnaissance (0.90). On the NF-ToN IoT dataset, the algorithm demonstrated high accuracy in classifying Benign (1.00), Backdoor (0.92), DDoS (0.70), and Injection (0.90) attacks. However, it performed poorly in detecting DoS (0), MITM (0), Ransomware (0), Scanning (0), and XSS (0) attacks, with significant confusion between these attack types and others like DoS and DDoS. Specifically, all DoS attacks were classified as DDoS. This issue arose because GraphSAGE does not incorporate edge features when computing new embeddings, making it unable to distinguish between these types of attacks. This highlights an opportunity to explore the application of our proposed framework within the E-GraphSAGE model in future studies.

5. Conclusions

This paper introduced a Top-K Similarity Graph Framework for IoT cyber threat detection, aiming to provide a more meaningful representation of node relationships. Our proposed framework demonstrated superior performance in both binary and multi-class classification tasks using the NF-ToN IoT and NF-BoT IoT datasets, outperforming traditional machine learning methods and existing graph-based approaches. We also explored the effects of graph directionality (directed vs. undirected), varying K values, and different GNN architectures and configurations on IoT NIDS detection performance. The results showed that GraphSAGE consistently yielded the best performance, and further hyperparameter tuning, coupled with batch normalization, dropout, and residual connections, could boost the average F1-Scores to 98.52% and 84.04% for NF-BoT-IoT binary and multi-class classification, as well as nearly 100% and 63.25% for NF-ToN-IoT binary and multi-class classification. However, the framework faced challenges in detecting specific attacks, such as Theft, DOS, MITM, Password, Ransomware, Scanning, and XSS. Despite these limitations, the experiments provided valuable insights and can serve as a foundation for future research and practical applications in the field. Future work could integrate the proposed framework with the E-GraphSAGE model to enhance detection rates for these attacks. The implementation is publicly available at https://github.com/tngo88/TKSGF (accessed on 8 June 2025).

Author Contributions

Conceptualization, J.Y.; Data curation, T.N.; Formal analysis, Y.-F.G.; Investigation, T.N.; Methodology, T.N. and J.Y.; Resources, H.W.; Supervision, J.Y., Y.-F.G. and H.W.; Validation, T.N.; Visualization, T.N.; Writing—original draft, T.N.; Writing—review and editing, J.Y., Y.-F.G. and H.W. All authors have read and agreed to the published version of the manuscript.

Funding

This research received no external funding.

Institutional Review Board Statement

Not applicable.

Informed Consent Statement

Not applicable.

Data Availability Statement

Data is contained within the article.

Conflicts of Interest

The authors have no competing interests to declare that are relevant to the content of this article.

References

  1. Rejeb, A.; Rejeb, K.; Treiblmaier, H.; Appolloni, A.; Alghamdi, S.; Alhasawi, Y.; Iranmanesh, M. The Internet of Things (IoT) in healthcare: Taking stock and moving forward. Internet Things 2023, 22, 100721. [Google Scholar] [CrossRef]
  2. Sinha, B.B.; Dhanalakshmi, R. Recent advancements and challenges of Internet of Things in smart agriculture: A survey. Future Gener. Comput. Syst. 2022, 126, 169–184. [Google Scholar] [CrossRef]
  3. Singh, P.; Elmi, Z.; Meriga, V.K.; Pasha, J.; Dulebenets, M.A. Internet of Things for sustainable railway transportation: Past, present, and future. Clean. Logist. Supply Chain 2022, 4, 100065. [Google Scholar] [CrossRef]
  4. Li, Y.; Liu, Q. A comprehensive review study of cyber-attacks and cyber security; Emerging trends and recent developments. Energy Rep. 2021, 7, 8176–8186. [Google Scholar] [CrossRef]
  5. Manoharan, P.; Hong, W.; Yin, J.; Wang, H.; Zhang, Y.; Ye, W. Optimising Insider Threat Prediction: Exploring BiLSTM Networks and Sequential Features. In Data Science and Engineering; Springer Nature: Cham, Switzerland, 2024; pp. 1–16. [Google Scholar]
  6. Yin, J.; Tang, M.; Cao, J.; You, M.; Wang, H. Cybersecurity applications in software: Data-driven software vulnerability assessment and management. In Emerging Trends in Cybersecurity Applications; Springer: Cham, Switzerland, 2022; pp. 371–389. [Google Scholar]
  7. Guerra, J.L.; Catania, C.; Veas, E. Datasets are not enough: Challenges in labeling network traffic. Comput. Secur. 2022, 120, 102810. [Google Scholar] [CrossRef]
  8. Eid, A.M.; Soudan, B.; Nassif, A.B.; Injadat, M. Comparative study of ML models for IIoT intrusion detection: Impact of data preprocessing and balancing. Neural Comput. Appl. 2024, 36, 6955–6972. [Google Scholar] [CrossRef]
  9. Mbow, M.; Koide, H.; Sakurai, K. An intrusion detection system for imbalanced dataset based on deep learning. In Proceedings of the 2021 Ninth International Symposium on Computing and Networking (CANDAR), Matsue, Japan, 23–26 November 2021; pp. 38–47. [Google Scholar]
  10. Wang, Y.; Li, D.; Li, X.; Yang, M. PC-GAIN: Pseudo-label conditional generative adversarial imputation networks for incomplete data. Neural Netw. 2021, 141, 395–403. [Google Scholar] [CrossRef] [PubMed]
  11. Chen, Y.; Zhang, Y.; Maharjan, S. Deep learning for secure mobile edge computing. arXiv 2017, arXiv:1709.08025. [Google Scholar]
  12. Abdulganiyu, O.H.; Ait Tchakoucht, T.; Saheed, Y.K. A systematic literature review for network intrusion detection system (IDS). Int. J. Inf. Secur. 2023, 22, 1125–1162. [Google Scholar] [CrossRef]
  13. Yu, Y.; Zeng, X.; Xue, X.; Ma, J. LSTM-based intrusion detection system for VANETs: A time series classification approach to false message detection. IEEE Trans. Intell. Transp. Syst. 2022, 23, 23906–23918. [Google Scholar] [CrossRef]
  14. Wu, Z.; Zhang, H.; Wang, P.; Sun, Z. RTIDS: A robust transformer-based approach for intrusion detection system. IEEE Access 2022, 10, 64375–64387. [Google Scholar] [CrossRef]
  15. Kheddar, H. Transformers and large language models for efficient intrusion detection systems: A comprehensive survey. arXiv 2024, arXiv:2408.07583. [Google Scholar] [CrossRef]
  16. Aldwairi, M.; Jarrah, M.; Mahasneh, N.; Al-khateeb, B. Graph-based data management system for efficient information storage, retrieval and processing. Inf. Process. Manag. 2023, 60, 103165. [Google Scholar] [CrossRef]
  17. Liu, M.; Li, X.; Li, J.; Liu, Y.; Zhou, B.; Bao, J. A knowledge graph-based data representation approach for IIoT-enabled cognitive manufacturing. Adv. Eng. Inform. 2022, 51, 101515. [Google Scholar] [CrossRef]
  18. Bilot, T.; El Madhoun, N.; Al Agha, K.; Zouaoui, A. Graph neural networks for intrusion detection: A survey. IEEE Access 2023, 11, 49114–49139. [Google Scholar] [CrossRef]
  19. Juan, X.; Zhou, F.; Wang, W.; Jin, W.; Tang, J.; Wang, X. INS-GNN: Improving graph imbalance learning with self-supervision. Inf. Sci. 2023, 637, 118935. [Google Scholar] [CrossRef]
  20. Wu, C.; Wu, F.; Cao, Y.; Huang, Y.; Xie, X. Fedgnn: Federated graph neural network for privacy-preserving recommendation. arXiv 2021, arXiv:2102.04925. [Google Scholar]
  21. Xu, K.; Li, Y.; Li, Y.; Xu, L.; Li, R.; Dong, Z. Masked graph neural networks for unsupervised anomaly detection in multivariate time series. Sensors 2023, 23, 7552. [Google Scholar] [CrossRef]
  22. Yin, J.; Hong, W.; Wang, H.; Cao, J.; Miao, Y.; Zhang, Y. A compact vulnerability knowledge graph for risk assessment. ACM Trans. Knowl. Discov. Data 2024, 18, 1–17. [Google Scholar] [CrossRef]
  23. Wang, Z.; Eisen, M.; Ribeiro, A. Learning decentralized wireless resource allocations with graph neural networks. IEEE Trans. Signal Process. 2022, 70, 1850–1863. [Google Scholar] [CrossRef]
  24. Munikoti, S.; Agarwal, D.; Das, L.; Halappanavar, M.; Natarajan, B. Challenges and opportunities in deep reinforcement learning with graph neural networks: A comprehensive review of algorithms and applications. IEEE Trans. Neural Netw. Learn. Syst. 2023, 35, 15051–15071. [Google Scholar] [CrossRef]
  25. Yin, J.; Chen, G.; Hong, W.; Cao, J.; Wang, H.; Miao, Y. A heterogeneous graph-based semi-supervised learning framework for access control decision-making. World Wide Web 2024, 27, 35. [Google Scholar] [CrossRef]
  26. Vrahatis, A.G.; Lazaros, K.; Kotsiantis, S. Graph attention networks: A comprehensive review of methods and applications. Future Internet 2024, 16, 318. [Google Scholar] [CrossRef]
  27. Hajibabaee, P.; Malekzadeh, M.; Heidari, M.; Zad, S.; Uzuner, O.; Jones, J.H. An empirical study of the graphsage and word2vec algorithms for graph multiclass classification. In Proceedings of the 2021 IEEE 12th Annual Information Technology, Electronics and Mobile Communication Conference (IEMCON), Vancouver, BC, Canada, 27–30 October 2021; pp. 0515–0522. [Google Scholar]
  28. Guezzaz, A.; Benkirane, S.; Azrour, M.; Khurram, S. A reliable network intrusion detection approach using decision tree with enhanced data quality. Secur. Commun. Netw. 2021, 2021, 1230593. [Google Scholar] [CrossRef]
  29. Majidian, S.Z.; TaghipourEivazi, S.; Arasteh, B.; Ghaffari, A. Optimizing random forests to detect intrusion in the Internet of Things. Comput. Electr. Eng. 2024, 120, 109860. [Google Scholar] [CrossRef]
  30. Mohy-Eddine, M.; Guezzaz, A.; Benkirane, S.; Azrour, M. An efficient network intrusion detection model for IoT security using K-NN classifier and feature selection. Multimed. Tools Appl. 2023, 82, 23615–23633. [Google Scholar] [CrossRef]
  31. Mehmood, A.; Mukherjee, M.; Ahmed, S.H.; Song, H.; Malik, K.M. NBC-MAIDS: Naïve Bayesian classification technique in multi-agent system-enriched IDS for securing IoT against DDoS attacks. J. Supercomput. 2018, 74, 5156–5170. [Google Scholar] [CrossRef]
  32. Alqahtani, M.; Mathkour, H.; Ben Ismail, M.M. IoT botnet attack detection based on optimized extreme gradient boosting and feature selection. Sensors 2020, 20, 6336. [Google Scholar] [CrossRef] [PubMed]
  33. Douiba, M.; Benkirane, S.; Guezzaz, A.; Azrour, M. An improved anomaly detection model for IoT security using decision tree and gradient boosting. J. Supercomput. 2023, 79, 3392–3411. [Google Scholar] [CrossRef]
  34. Hamidouche, M.; Popko, E.; Ouni, B. Enhancing iot security via automatic network traffic analysis: The transition from machine learning to deep learning. In Proceedings of the 13th International Conference on the Internet of Things, Nagoya, Japan, 7–10 November 2023; pp. 105–112. [Google Scholar]
  35. Yin, J.; Tang, M.; Cao, J.; Wang, H. Apply transfer learning to cybersecurity: Predicting exploitability of vulnerabilities by description. Knowl.-Based Syst. 2020, 210, 106529. [Google Scholar] [CrossRef]
  36. Halbouni, A.; Gunawan, T.S.; Habaebi, M.H.; Halbouni, M.; Kartiwi, M.; Ahmad, R. CNN-LSTM: Hybrid deep neural network for network intrusion detection system. IEEE Access 2022, 10, 99837–99849. [Google Scholar] [CrossRef]
  37. Ullah, I.; Mahmoud, Q.H. Design and development of RNN anomaly detection model for IoT networks. IEEE Access 2022, 10, 62722–62750. [Google Scholar] [CrossRef]
  38. Park, C.; Lee, J.; Kim, Y.; Park, J.G.; Kim, H.; Hong, D. An enhanced AI-based network intrusion detection system using generative adversarial networks. IEEE Internet Things J. 2022, 10, 2330–2345. [Google Scholar] [CrossRef]
  39. Alrayes, F.S.; Zakariah, M.; Amin, S.U.; Khan, Z.I.; Helal, M. Intrusion detection in IoT systems using denoising autoencoder. IEEE Access 2024, 12, 122401–122425. [Google Scholar] [CrossRef]
  40. Deng, X.; Zhu, J.; Pei, X.; Zhang, L.; Ling, Z.; Xue, K. Flow topology-based graph convolutional network for intrusion detection in label-limited IoT networks. IEEE Trans. Netw. Serv. Manag. 2022, 20, 684–696. [Google Scholar] [CrossRef]
  41. Zhang, L.; Tan, L.; Shi, H.; Sun, H.; Zhang, W. Malicious Traffic Classification for IoT based on Graph Attention Network and Long Short-Term Memory Network. In Proceedings of the 2023 24st Asia-Pacific Network Operations and Management Symposium (APNOMS), Sejong, Republic of Korea, 6–8 September 2023; pp. 54–59. [Google Scholar]
  42. Hamilton, W.; Ying, Z.; Leskovec, J. Inductive representation learning on large graphs. Adv. Neural Inf. Process. Syst. 2017, 30, 1025–1035. [Google Scholar]
  43. Lo, W.W.; Layeghy, S.; Sarhan, M.; Gallagher, M.; Portmann, M. E-graphsage: A graph neural network based intrusion detection system for iot. In Proceedings of the NOMS 2022-2022 IEEE/IFIP Network Operations and Management Symposium, Budapest, Hungary, 25–29 April 2022; pp. 1–9. [Google Scholar]
  44. Xu, R.; Wu, G.; Wang, W.; Gao, X.; He, A.; Zhang, Z. Applying self-supervised learning to network intrusion detection for network flows with graph neural network. Comput. Netw. 2024, 248, 110495. [Google Scholar] [CrossRef]
  45. Sarhan, M.; Layeghy, S.; Moustafa, N.; Portmann, M. Netflow datasets for machine learning-based network intrusion detection systems. In Proceedings of the Big Data Technologies and Applications: 10th EAI International Conference, BDTA 2020, and 13th EAI International Conference on Wireless Internet, WiCON 2020, Virtual, 11 December 2020; Proceedings 10. Springer: Cham, Switzerland, 2021; pp. 117–135. [Google Scholar]
  46. Mohurle, S.; Patil, M. A brief study of wannacry threat: Ransomware attack 2017. Int. J. Adv. Res. Comput. Sci. 2017, 8, 1938–1940. [Google Scholar]
  47. Altaf, T.; Wang, X.; Ni, W.; Yu, G.; Liu, R.P.; Braun, R. A new concatenated multigraph neural network for IoT intrusion detection. Internet Things 2023, 22, 100818. [Google Scholar] [CrossRef]
  48. Manoharan, P.; Yin, J.; Wang, H.; Zhang, Y.; Ye, W. Insider threat detection using supervised machine learning algorithms. In Telecommunication Systems; Springer: Berlin/Heidelberg, Germany, 2023; pp. 1–17. [Google Scholar]
  49. Beaver, J.M.; Borges-Hink, R.C.; Buckner, M.A. An evaluation of machine learning methods to detect malicious SCADA communications. In Proceedings of the 2013 12th International Conference on Machine Learning and Applications, Miami, FL, USA, 4–7 December 2013; Volume 2, pp. 54–59. [Google Scholar]
  50. Ahmad, Z.; Shahid Khan, A.; Wai Shiang, C.; Abdullah, J.; Ahmad, F. Network intrusion detection system: A systematic study of machine learning and deep learning approaches. Trans. Emerg. Telecommun. Technol. 2021, 32, e4150. [Google Scholar] [CrossRef]
  51. Ngo, T.; Yin, J.; Ge, Y.F.; Zhou, C.; Cao, J. Comparative Study of Machine Learning Algorithms for IoT Cyber Threat Detection in Healthcare Information Systems. In Proceedings of the International Conference on Health Information Science, Hong Kong, China, 8–10 December 2024; Springer: Singapore, 2025; pp. 68–77. [Google Scholar]
  52. Elsharkawi, I.; Sharara, H.; Rafea, A. SViG: A Similarity-thresholded Approach for Vision Graph Neural Networks. IEEE Access 2025, 13, 19379–19387. [Google Scholar] [CrossRef]
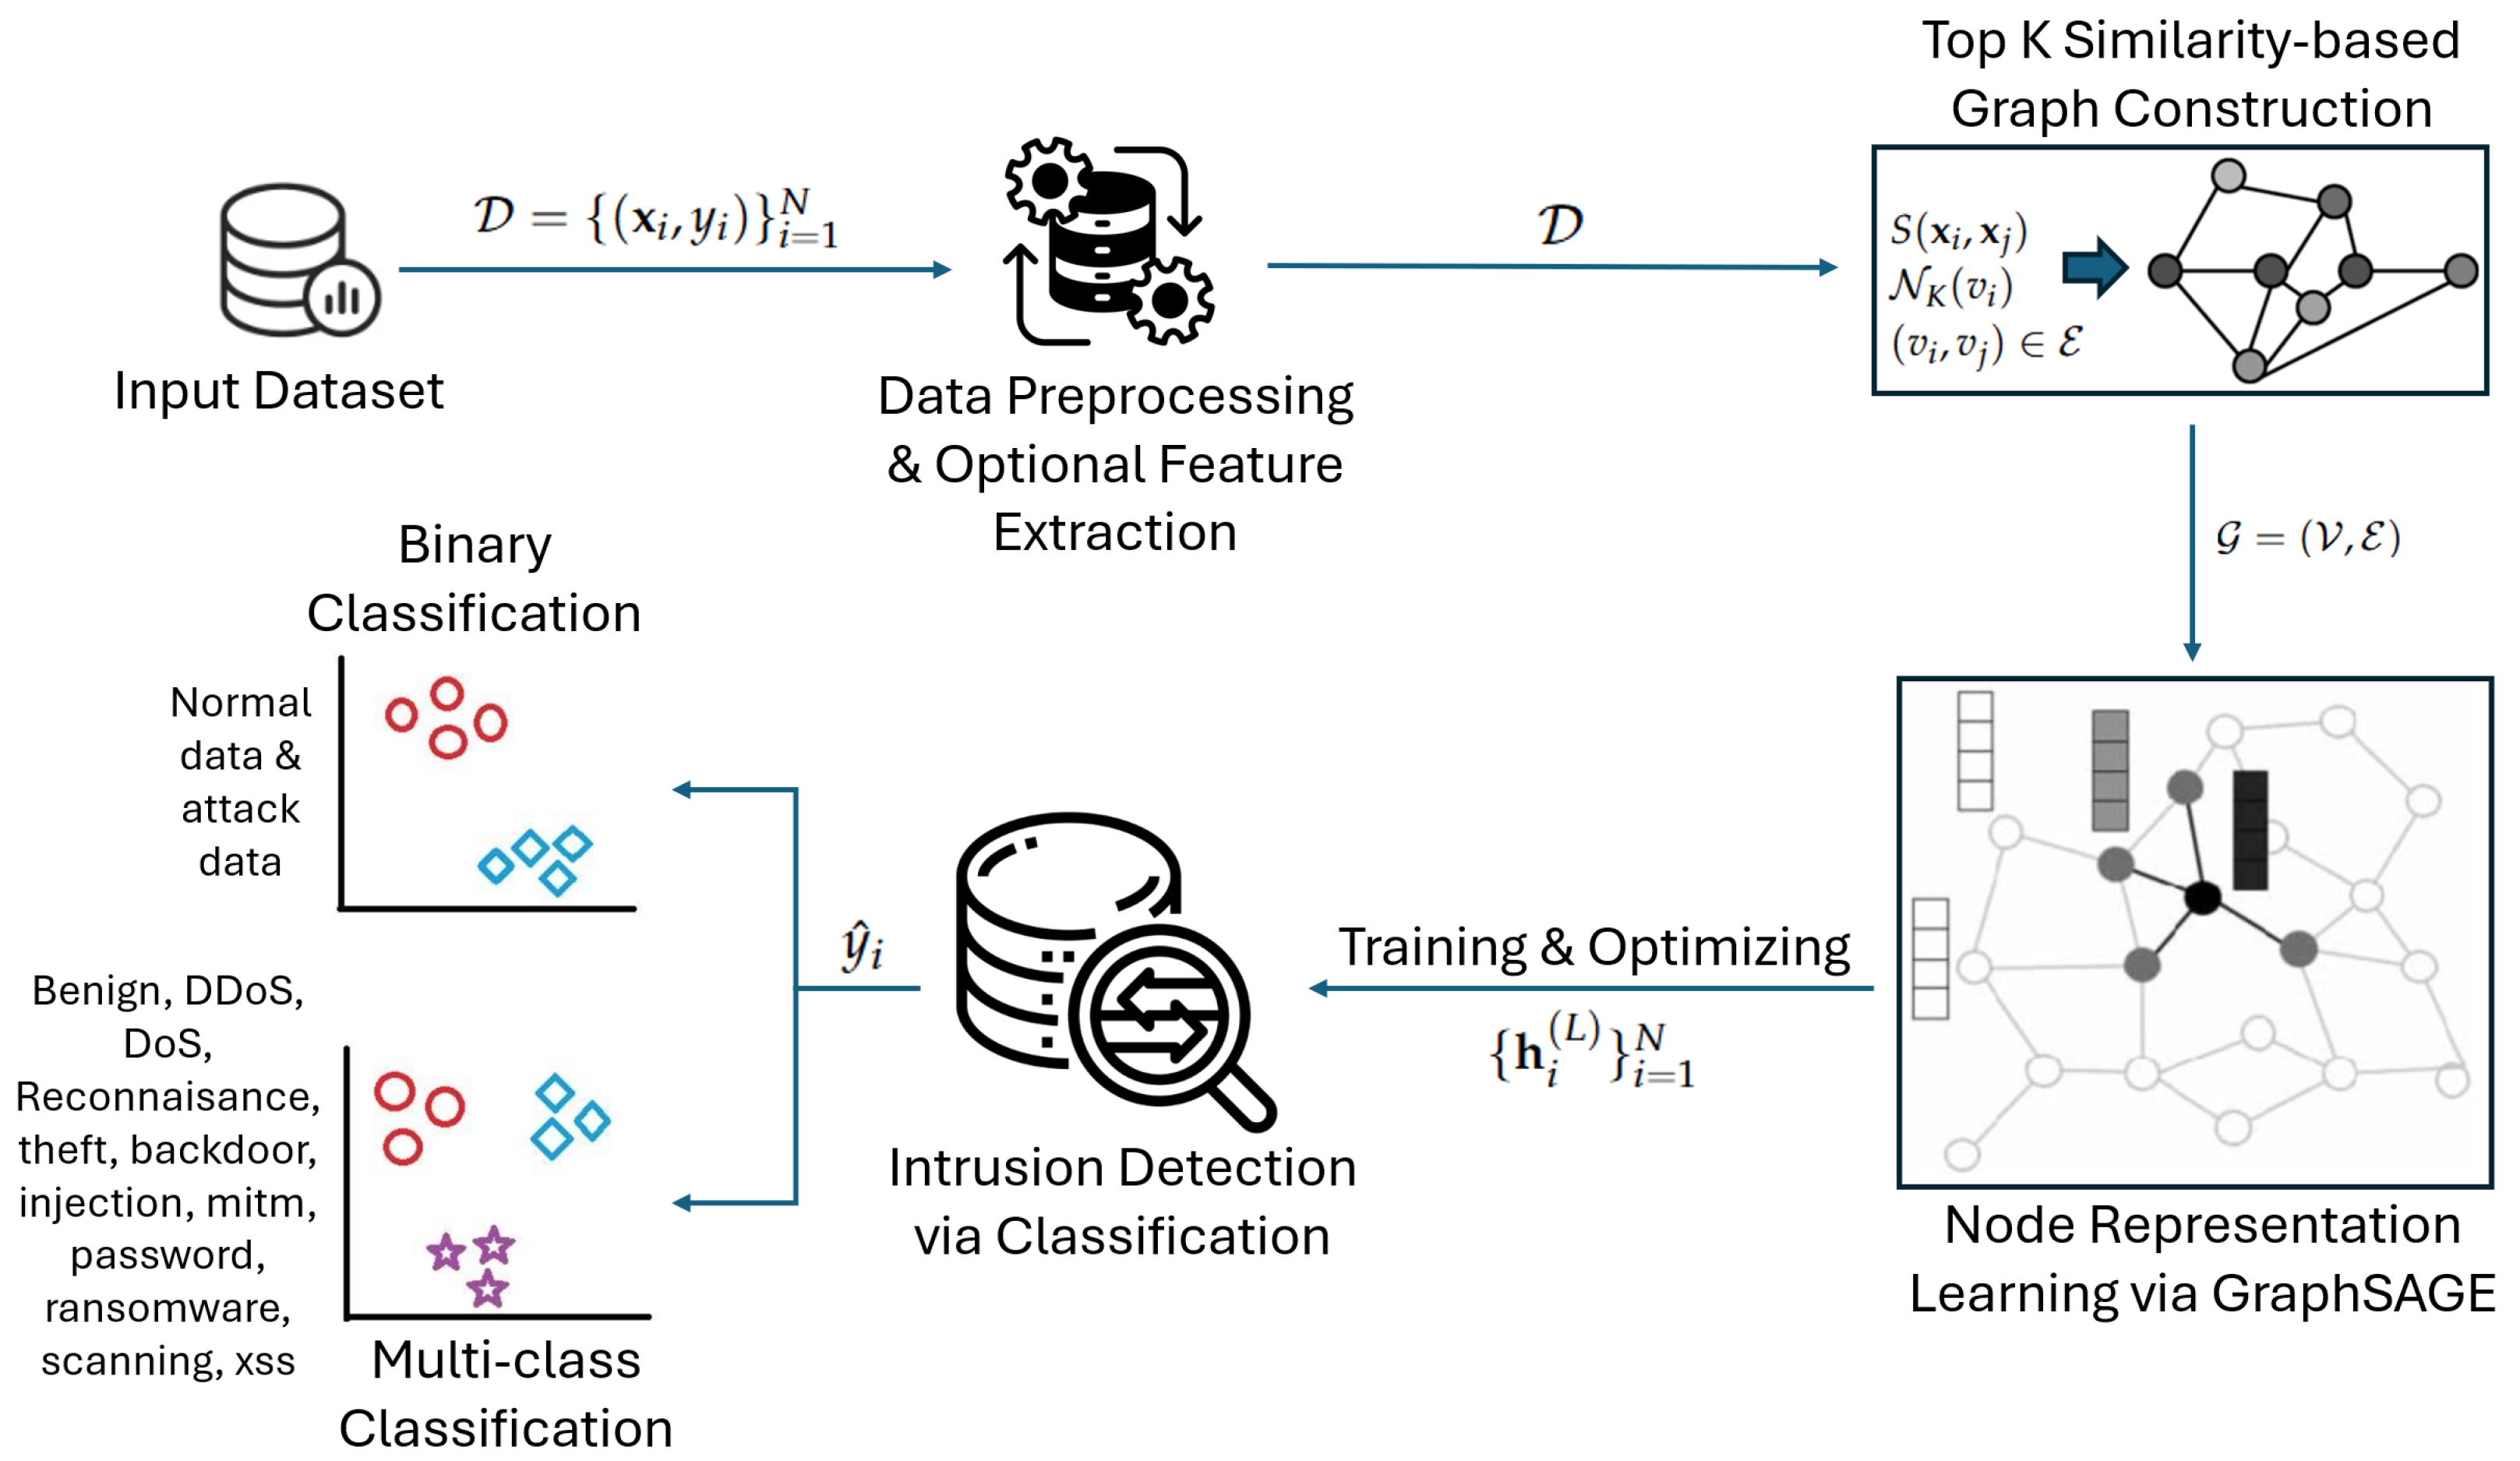
Figure 1. Proposed novel top-K similarity graph framework for IoT network intrusion detection.
Information 16 00499 g001
Figure 2. Binary classification performance results on the NF-BoT-IoT dataset using different GNN configurations. The plot compares directed and undirected graph construction types, values of k for Top-k neighbor selection, along with GNN models such as GCN, GAT, and GraphSAGE. For each configuration, both the average and maximum F1-scores are reported.
Information 16 00499 g002
Figure 3. Binary classification performance results on the NF-ToN-IoT dataset using different GNN configurations. The plot compares directed and undirected graph construction types, values of k for Top-k neighbor selection, along with GNN models such as GCN, GAT, and GraphSAGE. For each configuration, both the average and maximum F1-scores are reported.
Information 16 00499 g003
Figure 4. Multi-class classification performance results on the NF-BoT-IoT dataset using different GNN configurations. The plot compares directed and undirected graph construction types, values of k for Top-k neighbor selection along with GNN models such as GCN, GAT, and GraphSAGE. For each configuration, both the average and maximum F1-scores are reported.
Information 16 00499 g004
Figure 5. Multi-class classification performance results on the NF-ToN-IoT dataset using different GNN configurations. The plot compares directed and undirected graph construction types, values of k for Top-k neighbor selection, along with GNN models such as GCN, GAT, and GraphSAGE. For each configuration, both the average and maximum F1-scores are reported.
Information 16 00499 g005
Figure 6. Confusion matrix for multi-class classification on the NF-BoT-IoT dataset using the GraphSAGE model with an undirected graph structure and k = 10.
Information 16 00499 g006
Figure 7. Confusion matrix for multi-class classification on the NF-ToN-IoT dataset using the GraphSAGE3 model with an undirected graph structure and k = 5.
Information 16 00499 g007
Table 1. Attack distribution in NF-BoT IoT and NF-ToN IoT datasets.
DatasetLabelAttackQuantitiesTrainEvalTestTotal Data
NF-BoT IoT0Benign13,859970120792079600,100
1DDoS56,84439,79185278526
DoS56,83339,78385258525
Reconnaissance470,655329,45970,59870,598
Theft19091336286287
NF-ToN IoT0Benign270,279162,16754,05654,0561,379,274
1Backdoor17,24710,34834493450
DDoS326,345195,80765,26965,269
DoS17,71710,63035433544
Injection468,539281,12393,70893,708
MITM1295777259259
Password156,29993,77931,26031,260
Ransomware142852829
Scanning21,46712,88042934294
XSS99,94459,96619,98919,989
Table 2. Comparison of F1-score results between proposed algorithm and other ML and DL algorithms.
DatasetNF-BoT-IoTNF-BoT-IoTNF-ToN-IoTNF-ToN-IoT
Classification taskBinaryMulti-classBinaryMulti-class
Proposed approach0.98520.84041.00000.6325
Decision Tree0.98480.43300.92190.5460
Random Forest0.98430.80910.92240.5596
Naïve Bayes0.96000.76540.72640.2095
E-GraphSAGE0.97000.81001.00000.6300
Self-supervised Learning0.97670.8270N/AN/A
Graph Isomorphism Network0.96790.82110.74170.6240
Table 3. Ablation study comparing the impact of cosine similarity, Euclidean distance, and similarity thresholds on the average F1-score performance across approximately five trial runs.
DatasetNF-BoT-IoTNF-BoT-IoTNF-ToN-IoTNF-ToN-IoT
Classification TaskBinaryMulti-ClassBinaryMulti-Class
Proposed approachCosine + Sim08 + TopK0.98520.84041.00000.6325
Ablation study 1Euclidean + Sim08 + TopK0.98490.82041.00000.6066
Ablation study 2Cosine + TopK0.98520.83441.00000.6265
Ablation study 3Cosine + Sim06 + TopK0.98490.83751.00000.6280
Ablation study 4Cosine + Sim09 + TopK0.98510.83091.00000.6256
Table 4. Binary classification results of NF-BoT-IoT dataset.
Graph TypekGNN ModelAver F1_ScoreStd_DeviationMax F1_ScoreAver Run Time (sec)No. Runs
Directed3GCN0.9806040.0083930.98442511.565
GAT0.9655900.0000000.9655902.005
GraphSAGE0.9850990.0000750.9851575.616
5GCN0.9767810.0102160.9842867.745
GAT0.9655900.0000000.96559011.865
GraphSAGE0.9851430.0000830.9852266.386
7GCN0.9768470.0102760.98435411.435
GAT0.9655900.0000000.96559012.295
GraphSAGE0.9851960.0000710.9852576.676
9GCN0.9768070.0102400.98432010.905
GraphSAGE0.9852220.0000480.9852988.586
10GCN0.9805310.0083520.98427714.965
GraphSAGE0.9830470.0052380.9852466.236
Undirected3GCN0.9844110.0000640.98448810.535
GAT0.9693340.0083720.9843101.965
GraphSAGE0.9848730.0002810.9852628.396
5GCN0.9806860.0084480.9845378.335
GAT0.9655900.0000000.9655901.485
GraphSAGE0.9849640.0001540.9850946.906
7GCN0.9845070.0001130.98463510.625
GAT0.9688150.0075950.9843101.846
GraphSAGE0.9818010.0079420.9851106.026
9GCN0.9845040.0001150.98462911.155
GraphSAGE0.9850960.0000280.9851278.026
10GCN0.9844070.0000620.98450010.955
GraphSAGE0.9850830.0000770.9851748.066
Table 5. Binary classification results of NF-ToN-IoT dataset.
Graph TypekGNN ModelAver F1_ScoreStd_DeviationMax F1_ScoreAver Run Time (sec)No. Runs
Directed3GCN0.9999930.0000010.99999644.306
GAT0.9999930.0000000.999993322.215
GraphSAGE0.9999870.0000050.99999330.378
5GCN0.9999890.0000020.99999355.026
GAT0.9999910.0000030.999993364.505
GraphSAGE0.9999950.0000030.99999646.298
7GCN0.9999890.0000000.99998975.326
GAT0.9999930.0000040.9999961947.746
GraphSAGE0.9999970.0000041.00000043.756
9GCN0.9999810.0000020.999982103.556
GraphSAGE0.9999920.0000040.99999637.506
10GCN0.9999810.0000050.99998993.415
GraphSAGE0.9999920.0000050.99999635.646
Undirected3GCN0.9999880.0000050.99999336.655
GAT0.9999890.0000030.99999348.705
GraphSAGE0.9999960.0000051.00000042.216
5GCN0.9999900.0000030.99999332.565
GAT0.9999910.0000020.99999348.995
GraphSAGE0.9999880.0000050.99999342.767
7GCN0.9999910.0000040.99999628.885
GAT0.9999940.0000020.99999674.745
GraphSAGE0.9999980.0000021.00000030.736
9GCN0.9999860.0000040.99999324.036
GraphSAGE0.9999900.0000071.00000036.276
10GCN0.9999840.0000050.99999324.365
GraphSAGE0.9999880.0000050.99999625.586
Table 6. Multi-class classification results for NF-BoT-IoT dataset.
Graph TypekGNN ModelAver F1_ScoreStd_DeviationMax F1_ScoreAver Run Time (sec)No. Runs
Directed3GCN0.8148590.0090340.82652016.985
GAT0.7490330.0282070.7971196.155
GraphSAGE0.8344530.0077810.8419526.485
5GCN0.7977050.0561910.82893916.595
GAT0.7252120.0282220.76657285.135
GraphSAGE0.8346930.0051040.8416716.805
7GCN0.8175050.0160560.84214219.505
GAT0.7473540.0275440.79051441.765
GraphSAGE0.8383910.0086800.8442987.546
9GCN0.8113000.0110660.82703220.455
GraphSAGE0.8402630.0094660.8460048.126
10GCN0.8159990.0117750.82896025.415
GraphSAGE0.8347990.0073050.8451579.176
Undirected3GCN0.8351110.0111490.84422010.385
GAT0.7324160.0058470.7428691.065
GraphSAGE0.8220180.0324880.8428496.036
5GCN0.8327700.0085510.84225310.245
GAT0.7298120.0270020.7685433.345
GraphSAGE0.8325450.0090270.8431149.306
7GCN0.8343070.0075480.8419519.275
GAT0.7392410.0090960.7488062.615
GraphSAGE0.8144550.0399320.8428518.486
Undirected9GCN0.8301680.0077890.84097310.805
GraphSAGE0.8333130.0100220.8445399.656
10GCN0.8343660.0095820.84307410.995
GraphSAGE0.8404470.0029940.8436589.096
Table 7. Multi-class classification results for NF-ToN-IoT dataset.
Graph TypekGNN ModelAver F1_ScoreStd_DeviationMax F1_ScoreAver Run Time (sec)No. Runs
Directed3GCN0.6125700.0075040.62462925.465
GAT0.6076640.0046390.611103530.385
GraphSAGE0.6267020.0043110.6289801029.556
5GCN0.6162920.0060240.62270738.525
GAT0.6076550.0046530.611122960.295
GraphSAGE0.6279310.0018480.6291551753.626
7GCN0.6152340.0075170.62325833.516
GAT0.6081060.0067210.6187681114.476
GraphSAGE0.6283220.0008080.629565546.656
9GCN0.6111540.0053900.62056341.065
GraphSAGE0.6271010.0033310.62923365.987
10GCN0.6121570.0045550.61708539.495
GraphSAGE0.6279820.0016860.62925069.146
Undirected3GCN0.6150360.0069420.62253725.105
GAT0.6078490.0080830.620632291.955
GraphSAGE0.6244630.0040150.628668325.658
5GCN0.6146110.0072010.62194127.635
GAT0.6108780.0057520.618631430.335
GraphSAGE0.6283740.0005000.628892703.935
7GCN0.6199460.0018820.62229832.485
GAT0.6074770.0049560.611158490.895
GraphSAGE0.6272240.0023420.6288871189.825
Undirected9GCN0.6120810.0072320.62064829.725
GraphSAGE0.6261420.0062770.62918247.167
10GCN0.6173180.0056950.62225232.575
GraphSAGE0.6273930.0018710.62899756.056
Table 8. List of encoded GraphSAGE variants and the order of their applied functions.
GraphSAGE
Variant
Applied Function
1st Layer Dropout1st Layer BatchNormActivation FunctionResidual2nd Layer Dropout2nd Layer BatchNorm
GraphSAGEN/A1st2ndN/A3rdN/A
GraphSAGE1N/A1st2ndN/A3rd4th
GraphSAGE2N/A1st3rd2nd4th5th
GraphSAGE3N/A1st2nd3rd4th5th
GraphSAGE4N/A2nd3rd1st4th5th
GraphSAGE5N/A2nd1stN/A3rd4th
GraphSAGE6N/A2nd1st3rd4th5th
GraphSAGE7N/A3rd1st2nd4th5th
GraphSAGE8N/A3rd2nd1st4th5th
GraphSAGE9N/AN/A1stN/A2ndN/A
GraphSAGE101stN/A2ndN/A3rdN/A
Table 9. Ranking of best GraphSAGE variants for different classification tasks.
DatasetClassify
Type
Graph TypekRankingGraphSAGE VariantAver F1_ScoreStd_DeviationMax F1_ScoreAver Run Time (sec)No. Runs
NF-BoT-IoTBinaryDirected91GraphSAGE0.9852220.0000480.9852988.586
2GraphSAGE90.9850310.0002120.98526228.565
3GraphSAGE50.9741490.0107560.98519656.015
NF-BoT-IoTMultiUndirected101GraphSAGE0.8404470.0029940.8436589.096
2GraphSAGE90.8358470.0067730.84520233.695
3GraphSAGE10.8222810.0189110.84329348.285
NF-ToN-IoTBinaryDirected71GraphSAGE90.9999990.0000021.000000123.695
2GraphSAGE0.9999970.0000041.00000043.756
3GraphSAGE70.9999920.0000071.000000990.925
NF-ToN-IoTMultiUndirected51GraphSAGE30.6324640.0134790.656238929.905
2GraphSAGE60.6285160.0002150.628872997.195
3GraphSAGE0.6283740.0005000.628892703.935
Disclaimer/Publisher’s Note: The statements, opinions and data contained in all publications are solely those of the individual author(s) and contributor(s) and not of MDPI and/or the editor(s). MDPI and/or the editor(s) disclaim responsibility for any injury to people or property resulting from any ideas, methods, instructions or products referred to in the content.