Article

Enhancing Rare Class Performance in HOI Detection with Re-Splitting and a Fair Test Dataset

by
Gyubin Park
1 and
Afaque Manzoor Soomro
2,*
1
Graduate School of Artificial Intelligence, Ulsan National Institute of Science and Technology, Ulsan 44919, Republic of Korea
2
Department of Mechanical Engineering and Materials Science, James McKelvey School of Engineering, Washington University, St. Louis, MO 63130, USA
*
Author to whom correspondence should be addressed.
Information 2025, 16(6), 474; https://doi.org/10.3390/info16060474
Submission received: 3 March 2025 / Revised: 14 April 2025 / Accepted: 22 April 2025 / Published: 6 June 2025

Abstract

:
In Human–Object Interaction (HOI) detection, class imbalance severely limits the performance of a model on infrequent interaction categories. To overcome this problem, a Re-Splitting algorithm has been developed. This algorithm implements DreamSim-based clustering and performs k-means-based partitioning to restructure the train–test splits. By doing so, the approach balances the rarities and frequent classes of interaction equally, thereby increasing robustness. A Real-World test dataset has also been introduced. This dataset is comparable to a truly independent benchmark. It is designed to address class distribution bias, which is commonly present in traditional test sets. However, as shown in the Experiment and Evaluation subsection, a high level of performance can be achieved for the general case using different few-shot and rare-class training instances. Models trained solely on the re-split dataset show significant improvements in rare-class mAP, particularly for one-stage models. Evaluation on the test dataset from the real world further emphasizes previously overlooked model performance and supports fair structuring of dataset. The methods are validated with extensive experiments using five one-stage and two two-stage models. Our analysis shows that reshaping dataset distributions increases rare-class detection by as much as 8.0 mAP. This study paves the way for balanced training and evaluation leading to the formulation of a general framework for scalable, fair, and generalizable HOI detection.

1. Introduction

Class imbalance is a challenge identified in Human–Object Interaction (HOI) detection, where this imbalance is worse in datasets such as HICO-DET [1] that have under-representation of rare interactions. Standard dataset partitioning methods such as random splitting and frequency-based subsampling are unsuitable for handling the imbalance. This leads to biased assessments of model performance that over-represent instances of common interaction categories. To tackle this problem, we came up with a Re-Splitting algorithm that rearranges the HICO-DET dataset’s train–test splits. It does this by looking at how similar images are to each other, using DreamSim scores to measure their meaning. This guarantees a more proportional distribution of rare and non-rare interaction classes in the training and testing sets, formulating a balanced data partitioning method.
While most methods lean on tricks like data augmentation or tweaking class weights [2,3], our Re-Splitting Algorithm takes a different route—it reorganizes the data in a smart, structured way. K-Means clustering [4] and the Elbow Method [5] are used to create semantically coherent clusters that inform train–test redistribution. By leveraging DreamSim to eliminate the imbalance in feature-level diversity between the training and test sets for both rare and non-rare classes, this re-organization provides a more balanced measure of model performance, as it mitigates overfitting to the more prevalent classes while improving detection of rare interactions. The main goal of this methodology is to promote rare interaction detection without losing stability and global accuracy.
Besides rejigging the data, we also came up with a balanced real-world external test dataset. It is a fresh, unbiased way to see how well models can handle different datasets. Unlike the HICO-DET test set, which reflects the long-tailed distribution, our balanced real-world external test dataset ensures a fairer distribution in terms of the number of annotations across all classes. Since this is an independent benchmark, it provides a better means of assessment as to whether the benefits of the Re-Splitting Algorithm extend to actual real world generalization [6,7]. To validate the effectiveness of the proposed approach, we conduct a comprehensive experimental analysis using five one-stage models and two two-stage models. Training and testing these models on both the original HICO-DET dataset and our Re-Splitting dataset gives us a solid, controlled way to see how they perform. It helps to understand the impact of dataset restructuring on model performance. Finally, we evaluate their performance on the balanced real-world external test dataset to investigate how far balancing HOI dataset improves real-world HOI detection performance.
On top of that, we carefully explored how restructuring the dataset can make HOI detection methods fairer and better at handling real-world scenarios—something we think pushes the field forward. Our results stress the need for dataset-level actions to increase the robustness of models and a more reliable evaluation framework for future work in HOI detection. Our Re-Splitting algorithm introduces a novel approach to HOI detection by leveraging DreamSim-based semantic clustering and k-means partitioning, distinct from traditional data balancing techniques like oversampling or class reweighting (Figure 1). Unlike oversampling, which artificially inflates rare classes, or class reweighting, which adjusts loss functions but often overlooks evaluation biases, our method systematically restructures train–test splits to ensure equitable representation of rare and frequent interactions. This semantic similarity-based clustering addresses biases in both training and evaluation phases, as highlighted in the last part of the Introduction, where we emphasize dataset-level actions for fairer and more generalizable HOI detection. By mitigating the long-tailed distribution in HICO-DET, Re-Splitting enhances rare-class mAP by up to 8.0, as noted in the Abstract, paving the way for a scalable framework that outperforms conventional methods in robustness and fairness (Figure 1).

2. Related Work

2.1. Overview of HOI Detection and the HICO-DET Dataset

HOI detection is a hot topic in computer vision these days. It is all about figuring out how people interact with objects in photos or videos. Through HOI detection, we can gain contextual understanding of relationships between humans and objects. Whereas classical object detection, that can only identify and localize objects. This skill is super important for things like self-driving cars, security cameras, robots that work with people, and even augmented or virtual reality (AR/VR). It helps them all make sense of what is going on between humans and objects [8,9,10]. For example, in autonomous driving, it is critical to differentiate between a pedestrian standing on a road, and a pedestrian ready to cross the road. Additionally, in surveillance tasks, by applying HOI detection, the model may detect suspicious behavior more accurately. The HICO-DET dataset [1] is one of the most commonly used benchmarks for HOI detection [11]. It contains 600 human–object interaction categories derived from 80 object classes, with over 47,000 training images and 33,000 test images. Despite its large-scale coverage, HICO-DET suffers from a significant long-tailed class distribution problem (Figure 2). Here, frequent interaction categories dominate while many interaction classes have only a handful of examples. This issue creates challenges for model training and evaluation, as deep learning models tend to overfit to well-represented interactions while struggling to generalize to rare ones.
In Figure 1, HICO-DET’s class distribution is wildly uneven. Common interactions like “a person riding a boat” have thousands of examples to train on. On the other hand, rare interactions like “a person chasing a cat” may have only a single training sample. This skewed distribution significantly impacts model performance, making it difficult to achieve reliable generalization across all interaction categories [12]. The imbalanced nature of the dataset not only affects model training but also introduces bias in evaluation, as frequent classes disproportionately influence performance metrics.

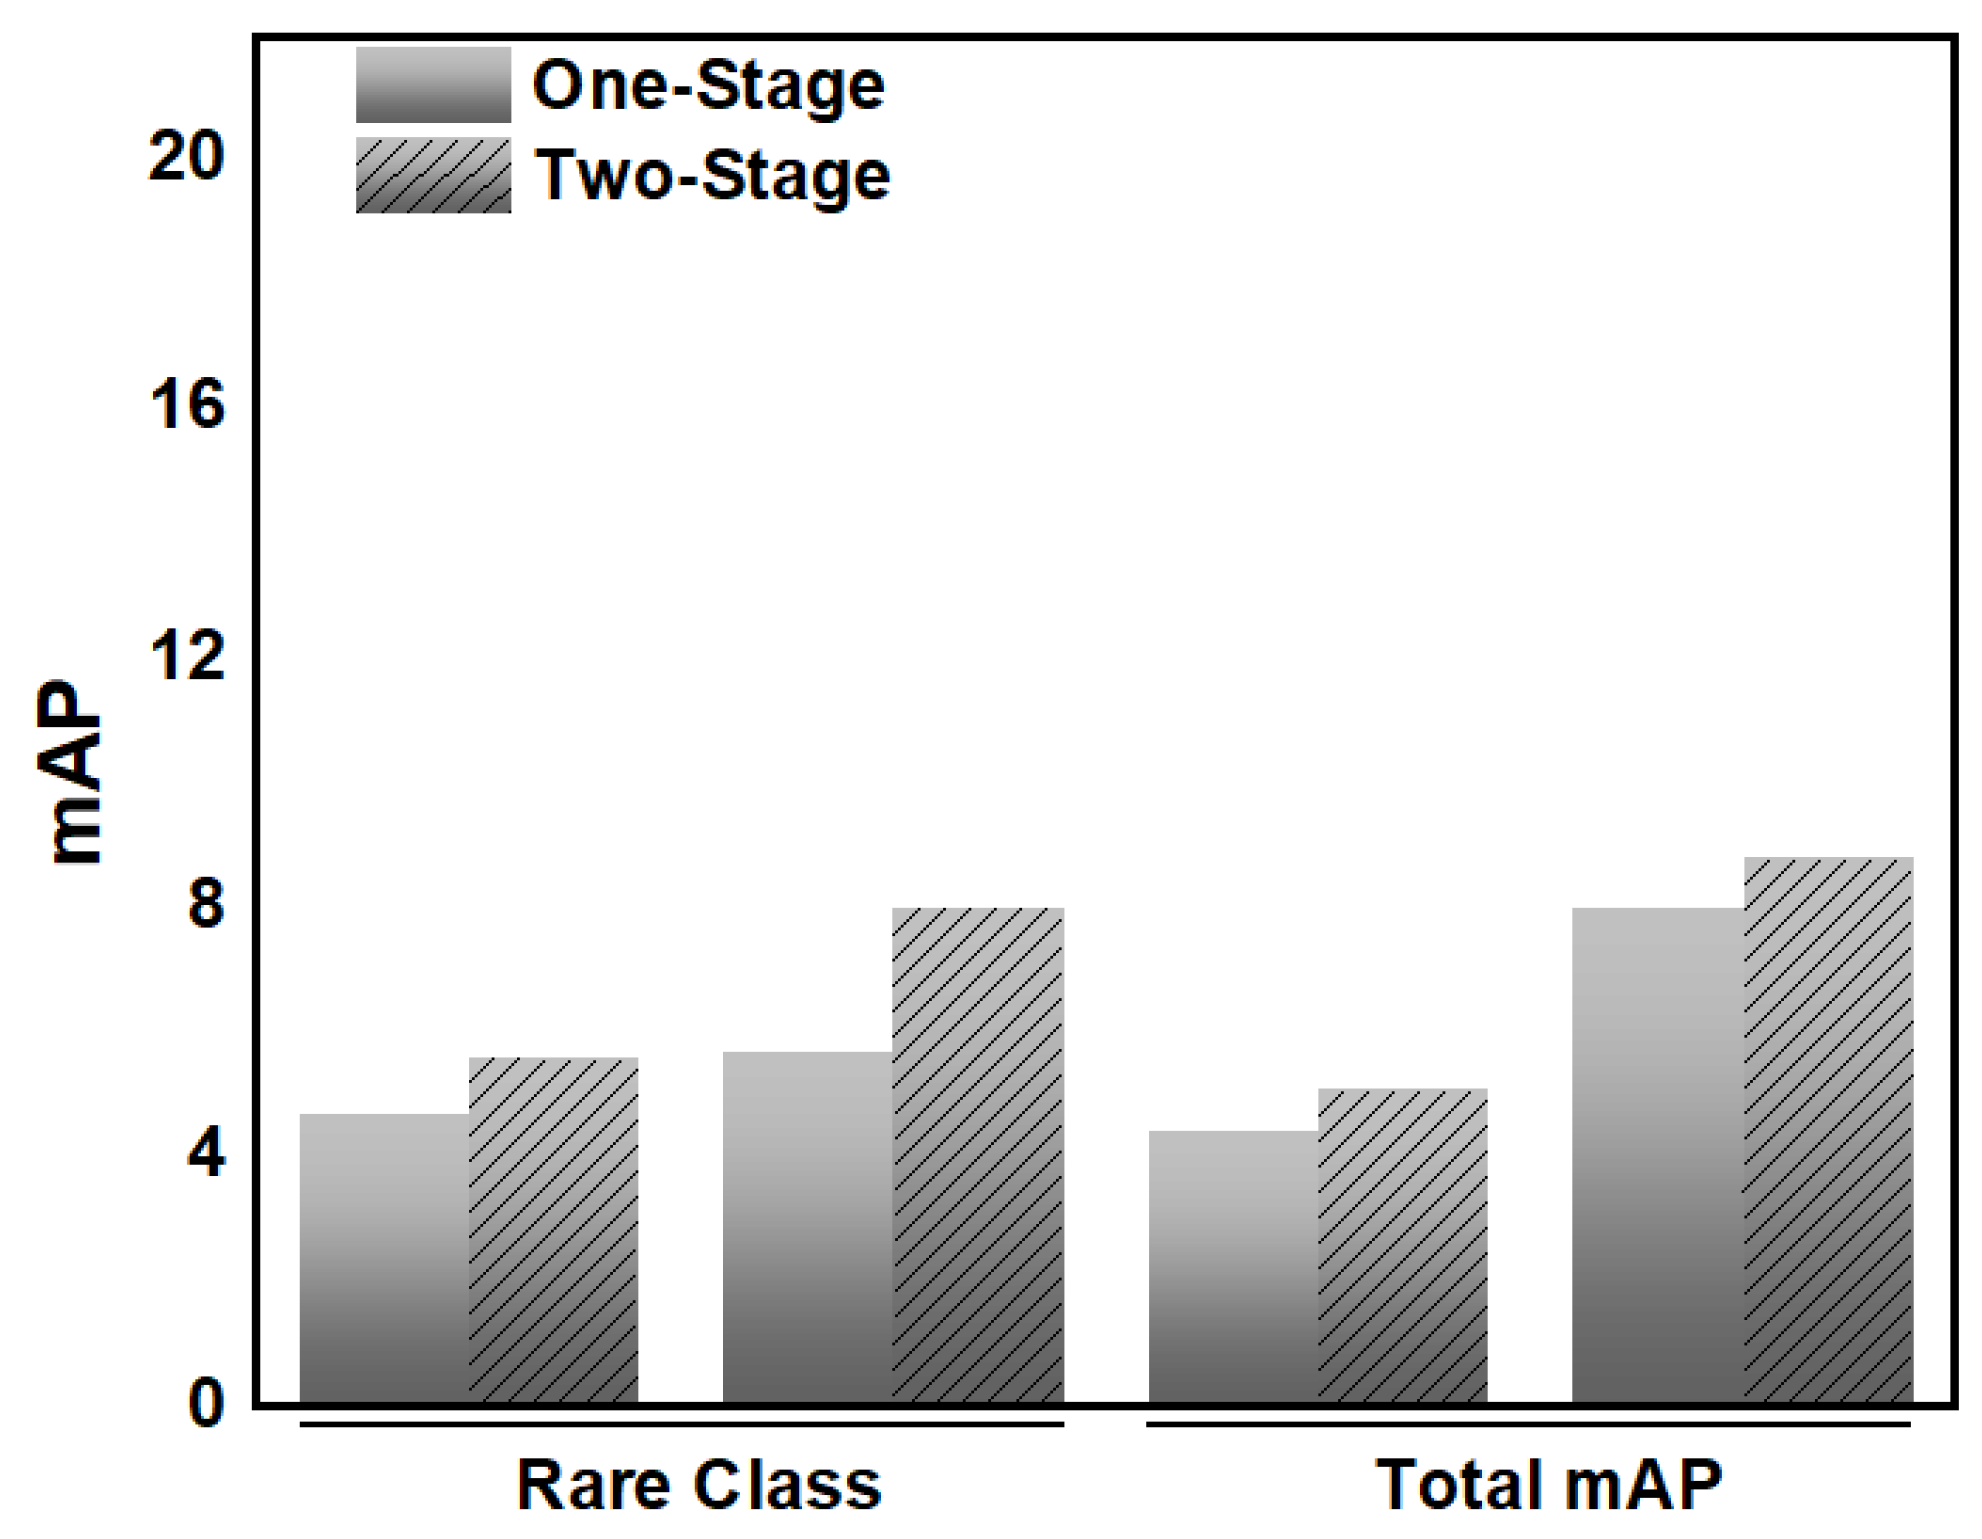
2.2. HOI Detection Models: One-Stage vs. Two-Stage Approaches

Many deep learning models have been created to tackle HOI detection, and they mostly fall into two groups: one-stage and two-stage methods. In the one-stage approach, spotting objects and figuring out how people interact with them happen all at once in a single, smooth system. Representative models include QPIC [13], CDN [3], STIP [14], GEN-VLKT [15], and QPIC + CQL [16]. These provide computational efficiency and can be seen in real-time applications like video surveillance as well as autonomous navigation. One-stage models, on the other hand, are often less successful at detecting rare classes because their loss function is optimized based on general, end-to-end performance rather than taking into consideration class imbalance.
Two-stage models like PViC and SQA take a different tack. They start by spotting objects, then figure out the interactions in a separate step [17,18]. The decoupling of the input embedding and the gesture/interaction recognition model enables more accurate recognition of gesture interactions, especially in intricate HOI detection. On the other hand, two-stage models, while offering good accuracy, are relatively computationally expensive and have a decision speed that hinders their applicability in real-time systems. Furthermore, they have architectural benefits over traditional models. Two-stage models remain sensitive to dataset bias, as they depend on rich data with solid coverage of classes during training. Even though one-stage and two-stage models have made great progress in the HOI detection, they are usually evaluated on dataset splits that ignore class imbalance. This leads to misleading performance metrics. This highlights the importance of more representative datasets construction approaches to more realistic model evaluation [19].

2.3. Existing Approaches to Address Class Imbalance

To mitigate the long-tailed distribution problem in HOI detection, various techniques have been explored in prior studies (Figure 2). One of the most common methods is data augmentation, which artificially increases the number of rare class samples by generating synthetic images or modifying existing ones [20]. However, while data augmentation enhances dataset diversity, it does not necessarily improve the quality of rare class representations and may introduce unrealistic interactions that worsen model learning. Another approach is class re-weighting, where higher loss weights are assigned to rare classes during training [21].
Take focal loss, for example—it is an advanced technique designed to address this issue. It dynamically adjusts the contribution of easy and hard examples during training. Focal loss is effective on the output of object detection task. It can help the model focus on learning rare classes, but focal loss does not solve the underlying issue of training. While it adjusts the loss based on the predicted probability during training to distinguish between hard and easy examples, this mechanism alone cannot address the underlying imbalance in the semantic and visual diversity of the dataset. It will have a lot of bias on datasets due to class and task imbalance. Sampling methods like over-sampling or under-sampling can also be utilized [22]. These methods address class imbalance by generating or including new samples from less frequent classes, or by reducing the number of samples from overrepresented classes, such as through random under-sampling. These methods have a downside, though. Using too many examples (over-sampling) can make the model too focused on the training data, making it less effective at generalizing to new, unseen examples—this is called overfitting. On the other hand, using too few examples (under-sampling) cuts out important data, which lowers the model’s performance. So far, most fixes only tweak things during training and do not tackle unfairness in the dataset when testing. For instance, in HICO-DET, the way data is split for training and testing does not consider how often different actions appear. This creates test sets that do not truly show how well the model works in real life [23]. This highlights the necessity of new dataset balancing strategies that account for both training and evaluation phases.

2.4. Dataset Splitting Strategies and DreamSim-Based Balancing

With the limitations of traditional dataset splits, we attempted to propose more complex data splitting methods. Standard random and stratified sampling methods do not maintain semantic consistency among train–test splits, leading to biased evaluation of performance. Our method taps into image similarity techniques, using DreamSim to balance the dataset and smartly guide how data are divided between training and testing for better results [24]. Moreover, DreamSim is a technique that measures semantic similarity between images—think of it as a way to assess how visually and conceptually alike two pictures are, rather than just counting how often classes appear. This helps create a smarter, more meaningful split. DreamSim-based methods group images that look and mean similar things together before splitting the dataset. This helps make sure both rare and common classes have visually evenly spread images across the training and test sets [25]. K-means clustering have been applied in our studies which show effectiveness in fairness of datasets and robustness in evaluation. These methods limit dataset bias and offer a more equal representation of interaction classes, boosting the model performance by estimating the optimal number of clusters using the Elbow Method.

2.5. The Role of External Test Datasets in HOI Generalization

Apart from imbalance, bias is another challenge. To tackle this problem, previous work has focused on constructing external test datasets for generalization assessment. We generate for it an real world external test dataset, meaning that there is no overlap between the data used for training and the test set which serves as an unbiased indication of how well the model generalizes. The main goal of these datasets is to evaluate whether models trained on existing benchmarks generalize to novel unseen scenarios.
This is especially important in HOI detection because dataset bias can lead to overly high-performance scores that do not hold up in real-world situations. External test datasets have been constructed by different methods for a few studies, including equality class distribution sampling, incorporation of scene diversity, and cross-dataset evaluation protocols [26]. These methods ensure that external benchmarks provide a comprehensive and unbiased evaluation of a model’s generalization capabilities, ultimately improving the reliability of HOI detection research.

3. Materials and Methods

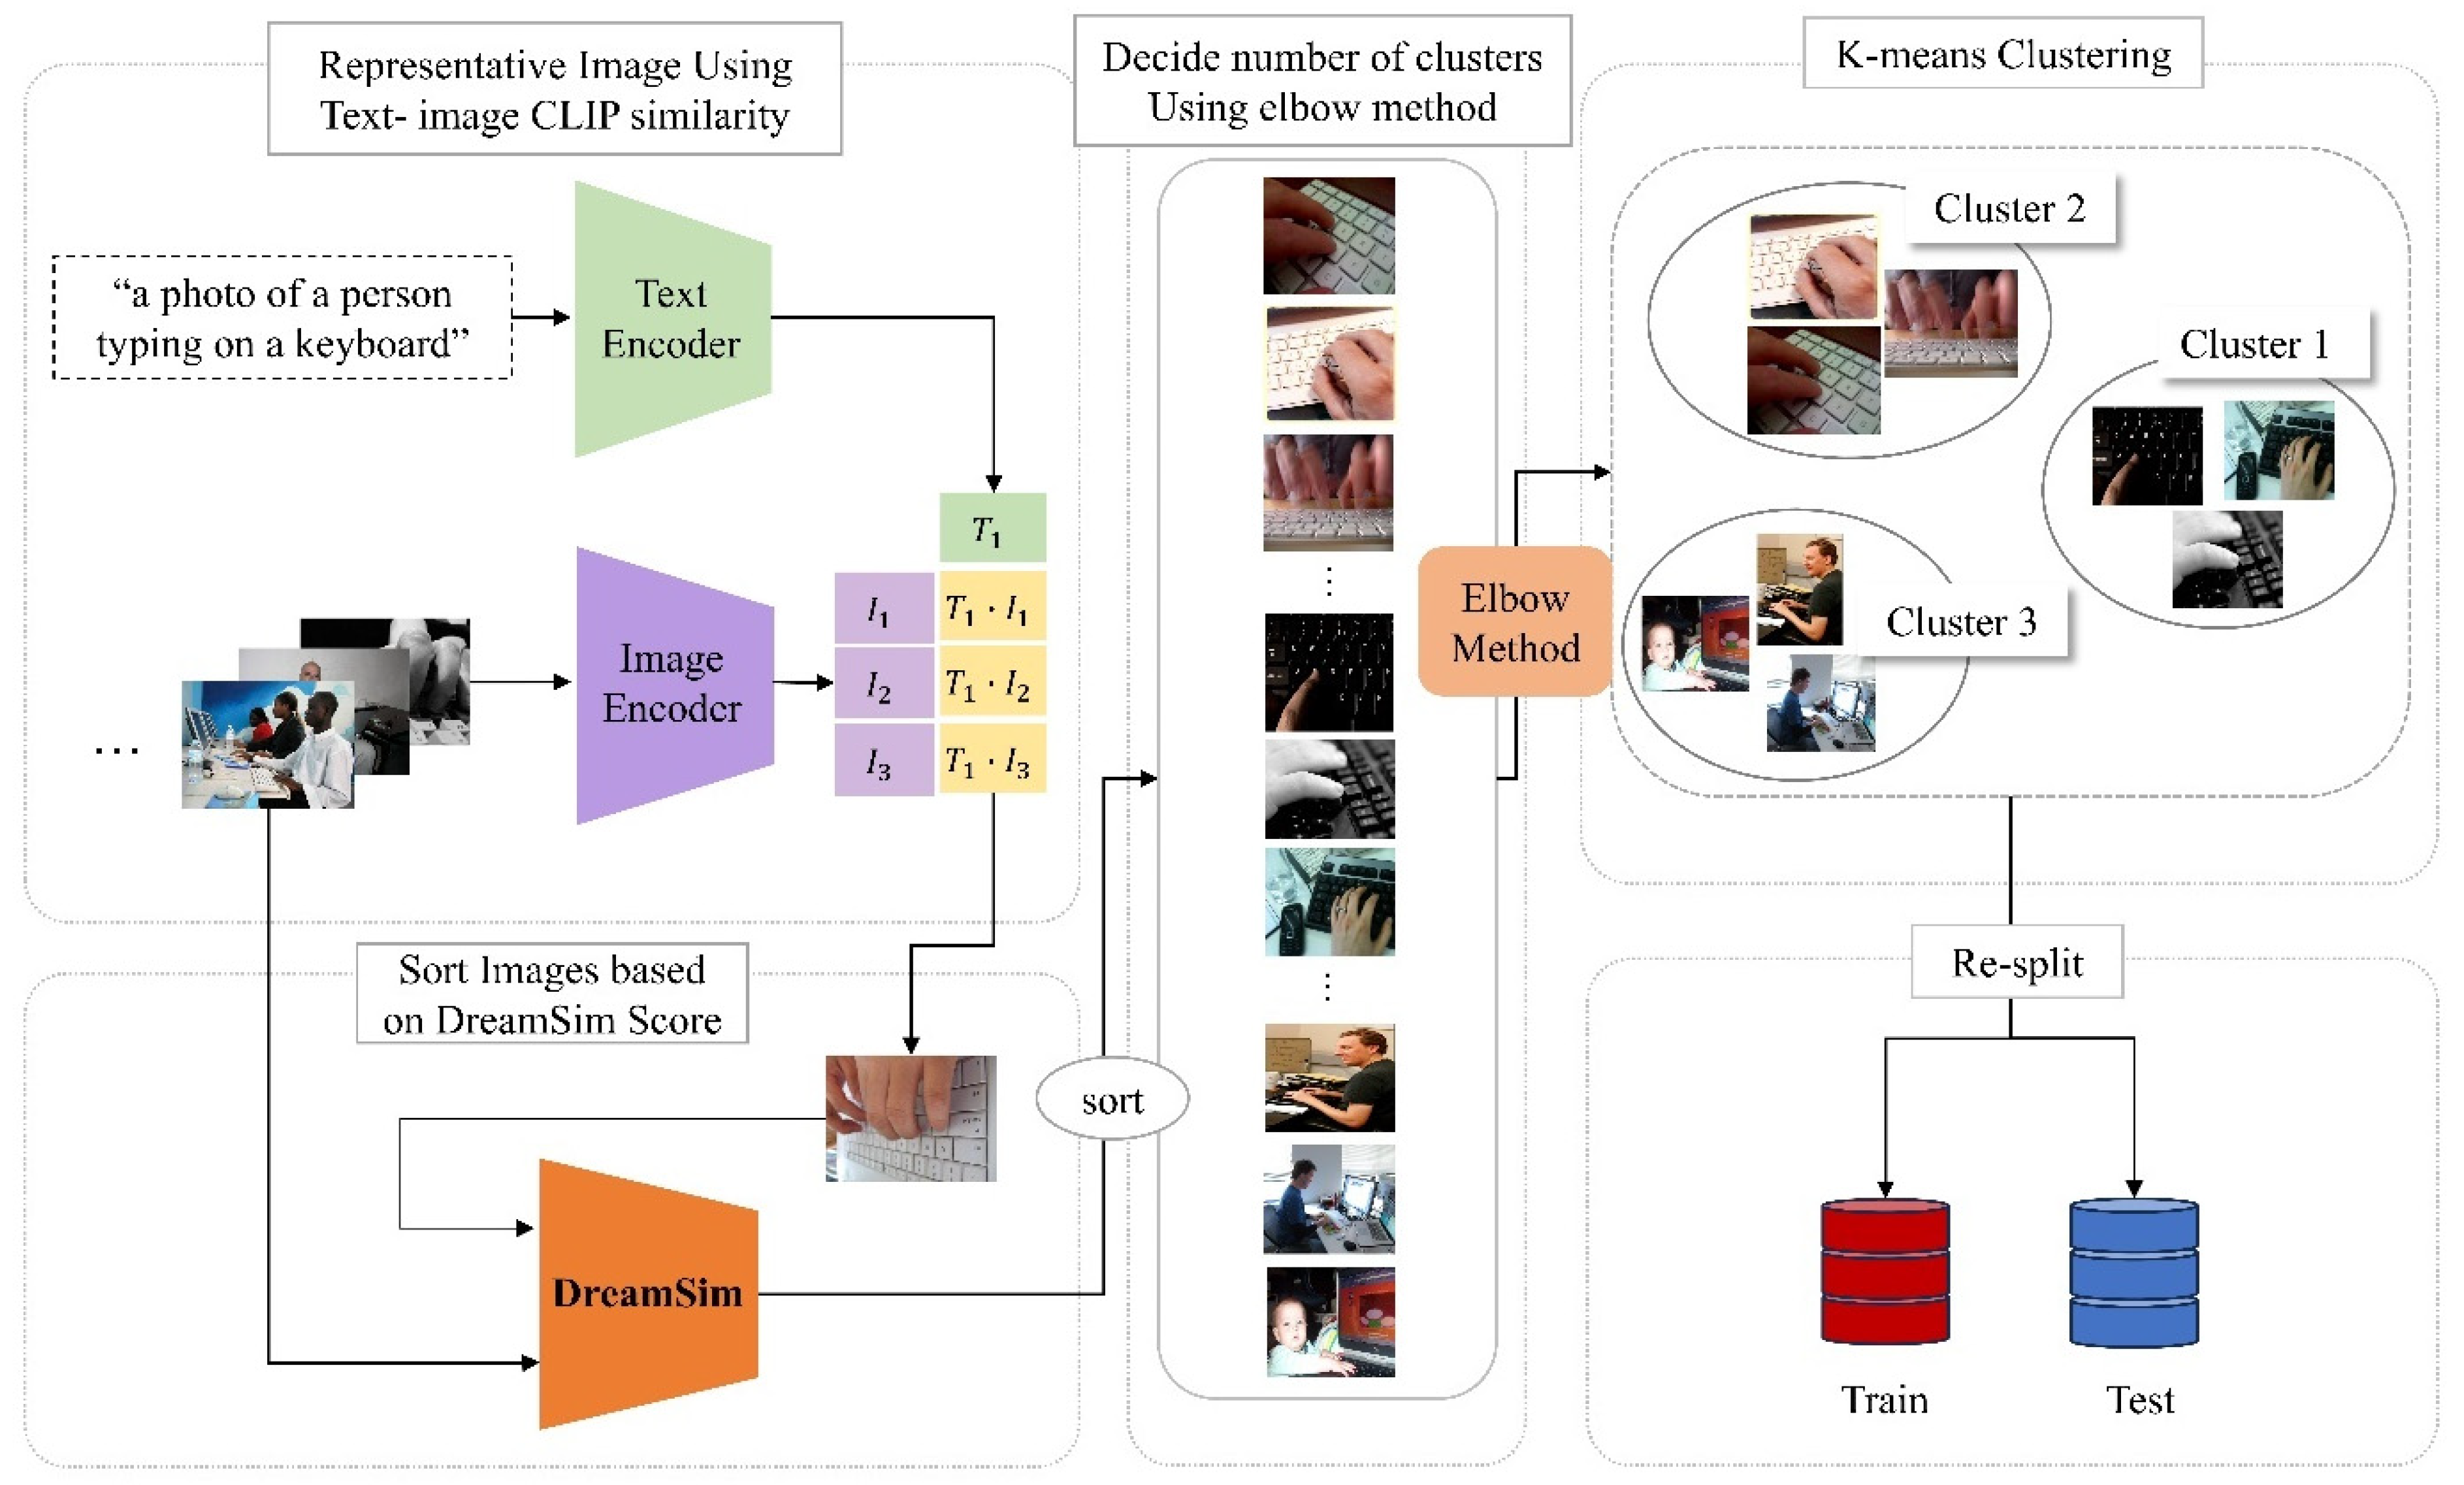
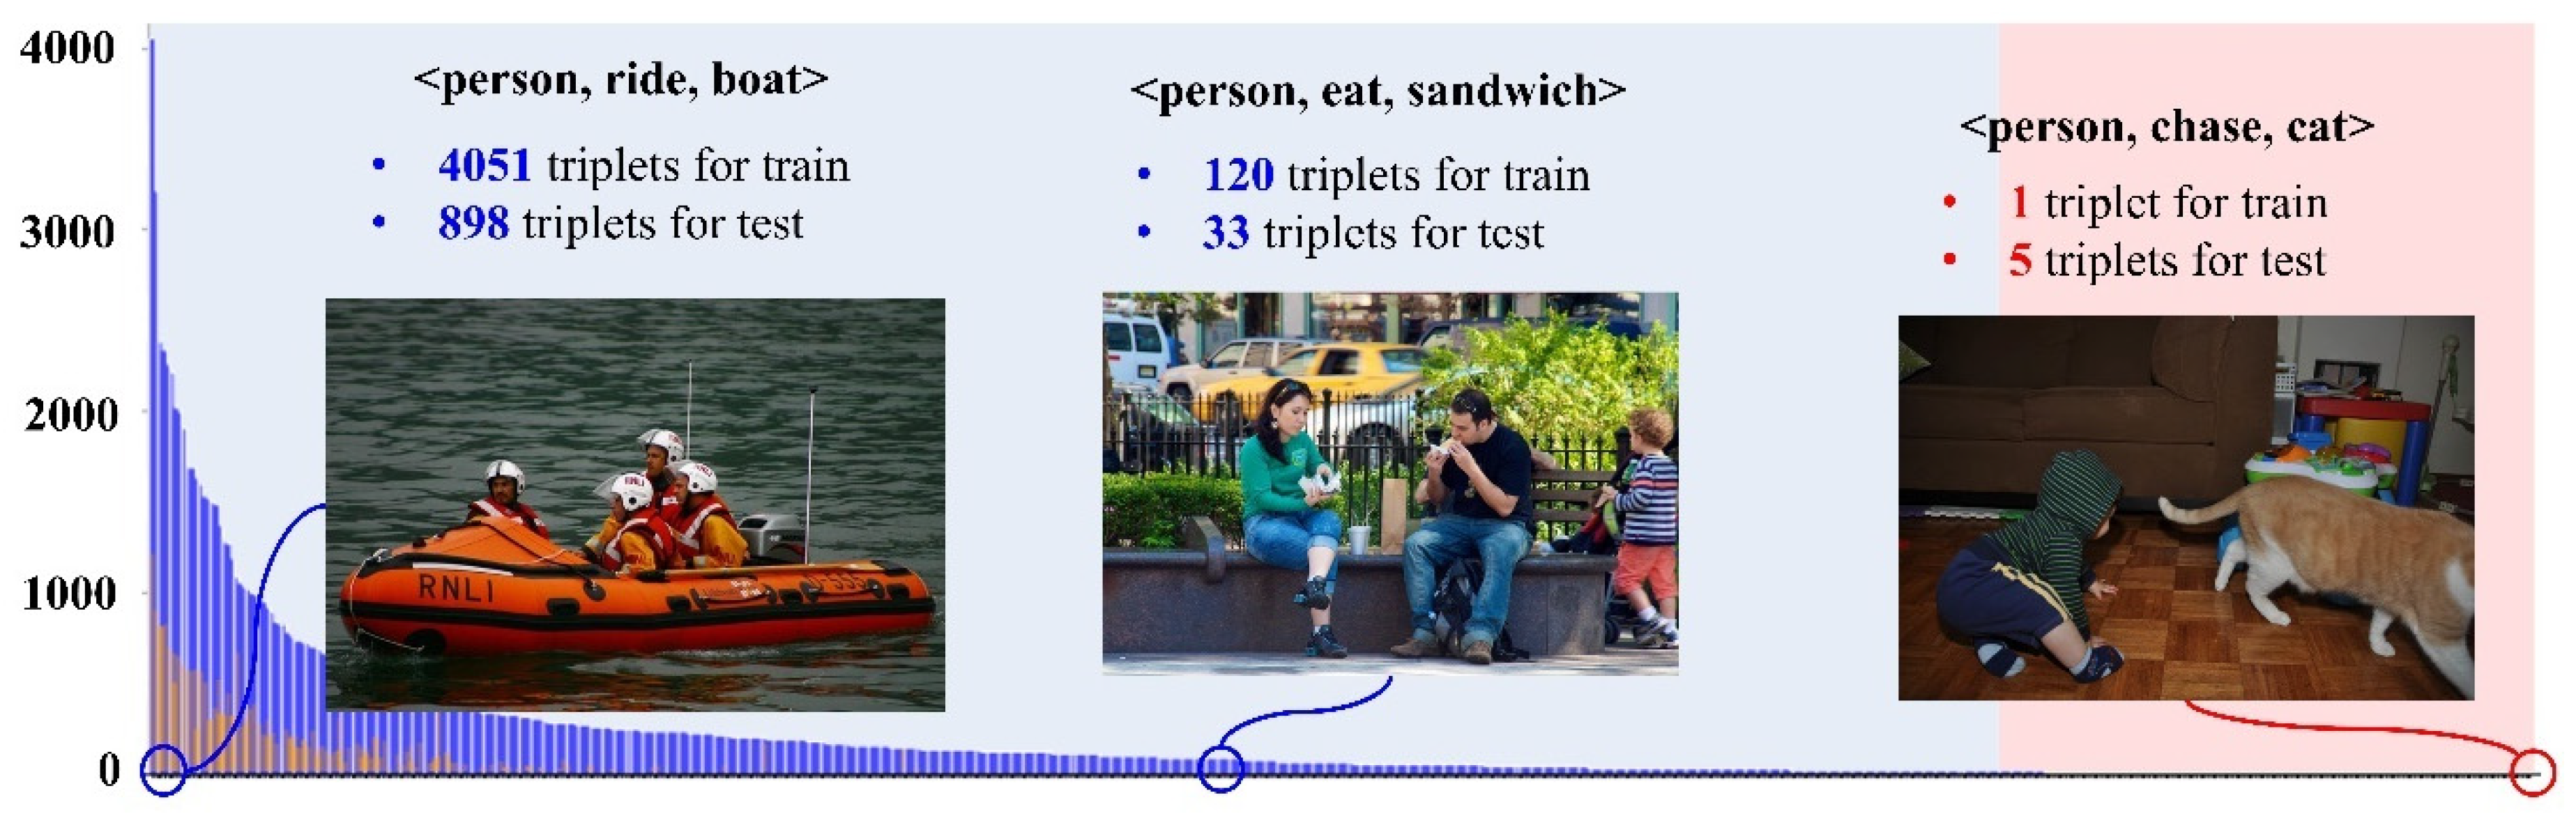
3.1. DreamSim-Based Re-Splitting Strategy for Mitigating Dataset Bias

We are tackling the class imbalance problem in HOI detection datasets. Our solution is a structured re-splitting strategy that evens out feature-level diversity between the training and test sets for both rare and frequent interaction classes. This approach combines CLIP-based representative image selection, DreamSim score computation, optimized clustering using the Elbow Method, and re-splitting of the dataset to create an improved train–test distribution. CLIP is an encoder model based on the transformer architecture and trained using contrastive learning to represent the similarity between images and texts as a score. It is widely used in tasks such as image–text retrieval and classification, and serves as a key component for linking textual and visual semantics. The overall re-splitting process is visualized in Figure 1, illustrating the key steps of dataset restructuring. The process consists of four main components:
i.
Representative Image Selection: Using CLIP-based [27,28] text-image similarity, a representative image is selected for each interaction category to serve as a central reference point for further dataset restructuring.
ii.
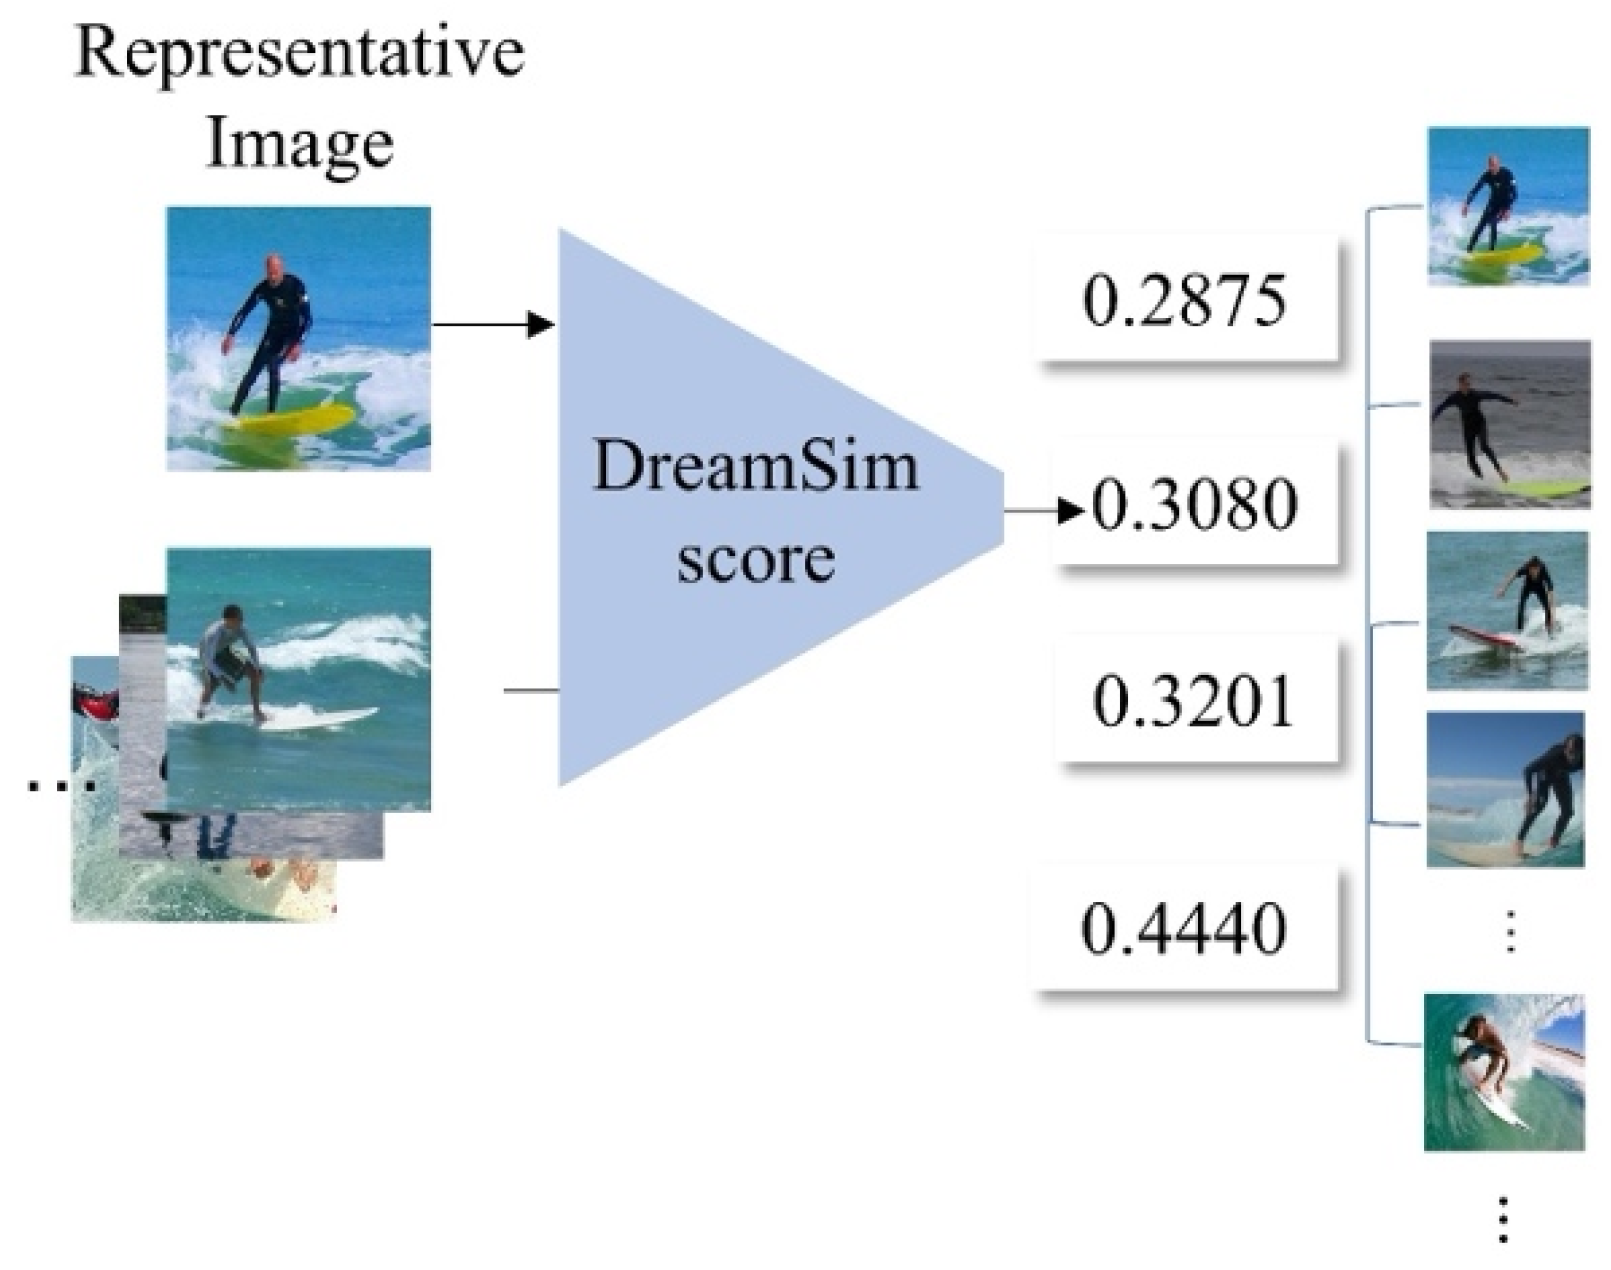
DreamSim Score Computation: Each image in the dataset is assigned a DreamSim score, which quantifies its semantic similarity to the representative image. This ensures that images with similar contextual meanings are grouped together.
iii.
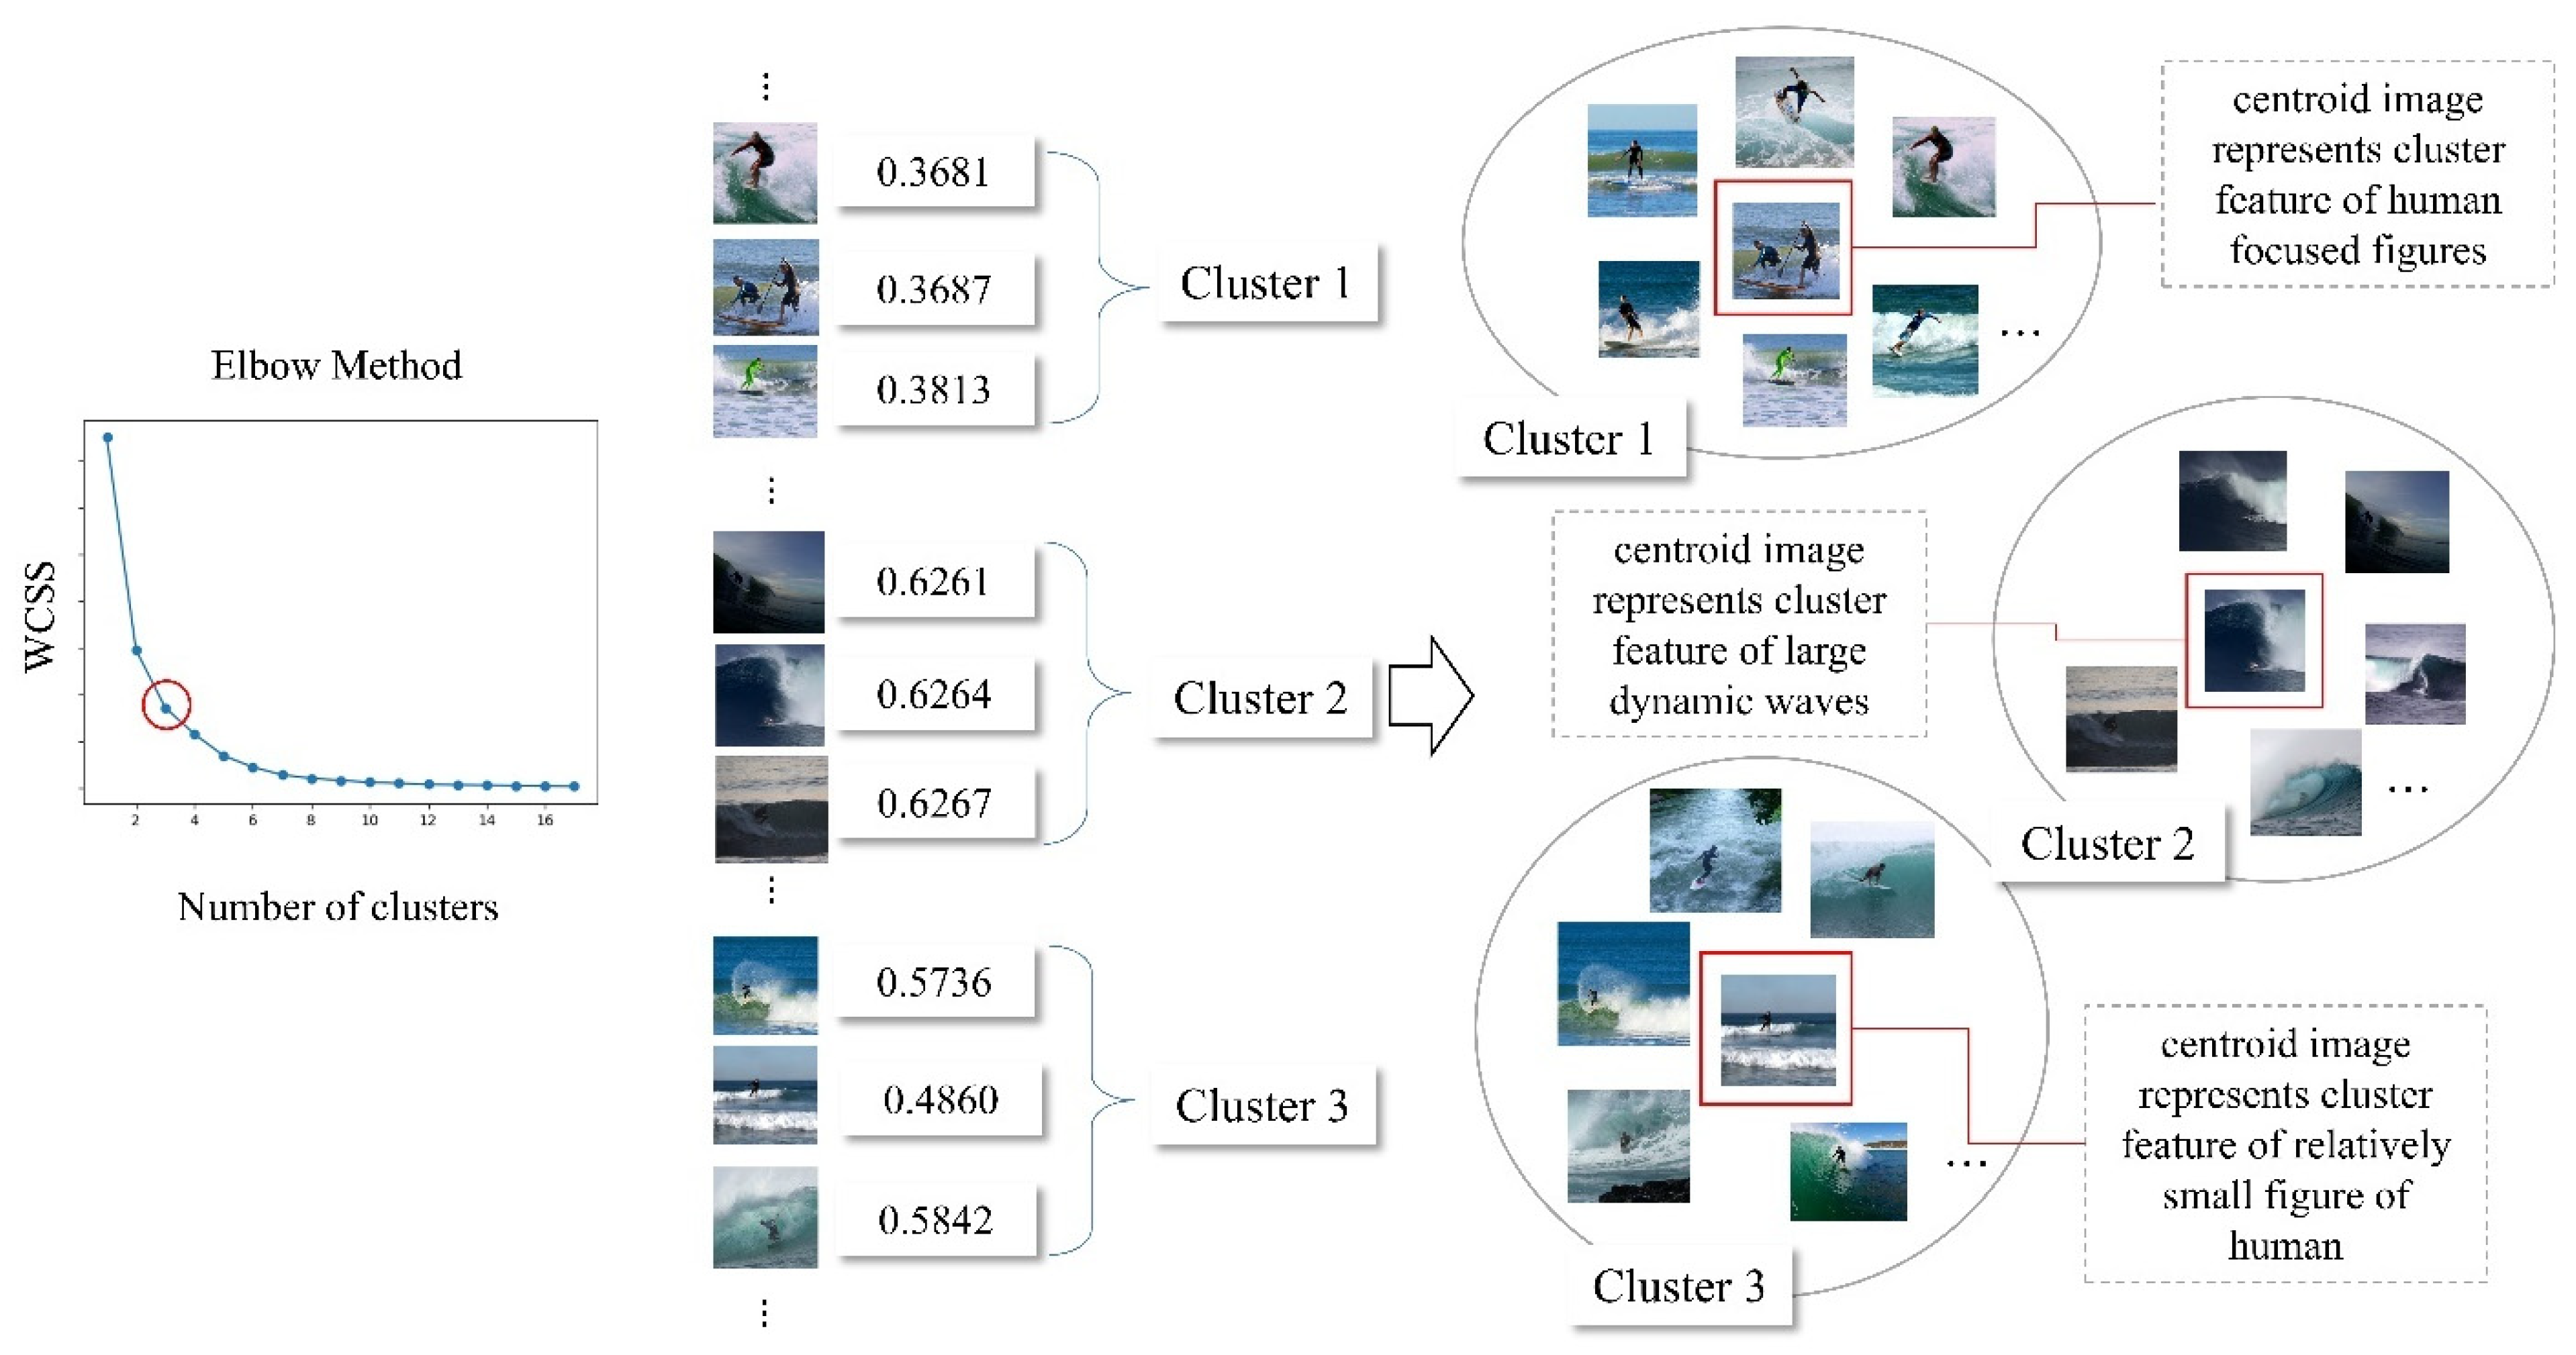
Clustering Optimization with the Elbow Method: To determine the optimal number of clusters for dataset partitioning, we apply the Elbow Method. This helps in minimizing intra-cluster variance and maximizing inter-cluster separation.
iv.
Train–Test Dataset Re-Splitting: Using the determined cluster structure, the dataset is restructured by distributing images into training and test sets in a way that balances the diversity by leveraging the feature-level representation within all interaction classes.
The workflow starts by encoding interaction descriptions using a text encoder. This generates text embeddings. At the same time, an image encoder extracts features from images. The text and image embeddings are aligned in a shared space. Using the CLIP model, similarity scores are calculated between text and image embeddings. For each interaction category, the image with the highest similarity score is selected as the representative image. Next, DreamSim Scores are computed for all images based on their similarity to the representative image. Finally, all images are ranked according to their semantic similarity to the representative image. To optimize the clustering process, the Elbow Method is applied, determining the ideal number of clusters by analyzing variance reduction as the number of clusters increases. The dataset is then segmented using k-means Clustering, grouping similar images into distinct clusters. After clustering, the dataset is re-split into training and testing sets, ensuring a fairer distribution of interaction classes. This mitigates dataset bias, particularly in cases where rare interactions were previously underrepresented in conventional train–test splits.

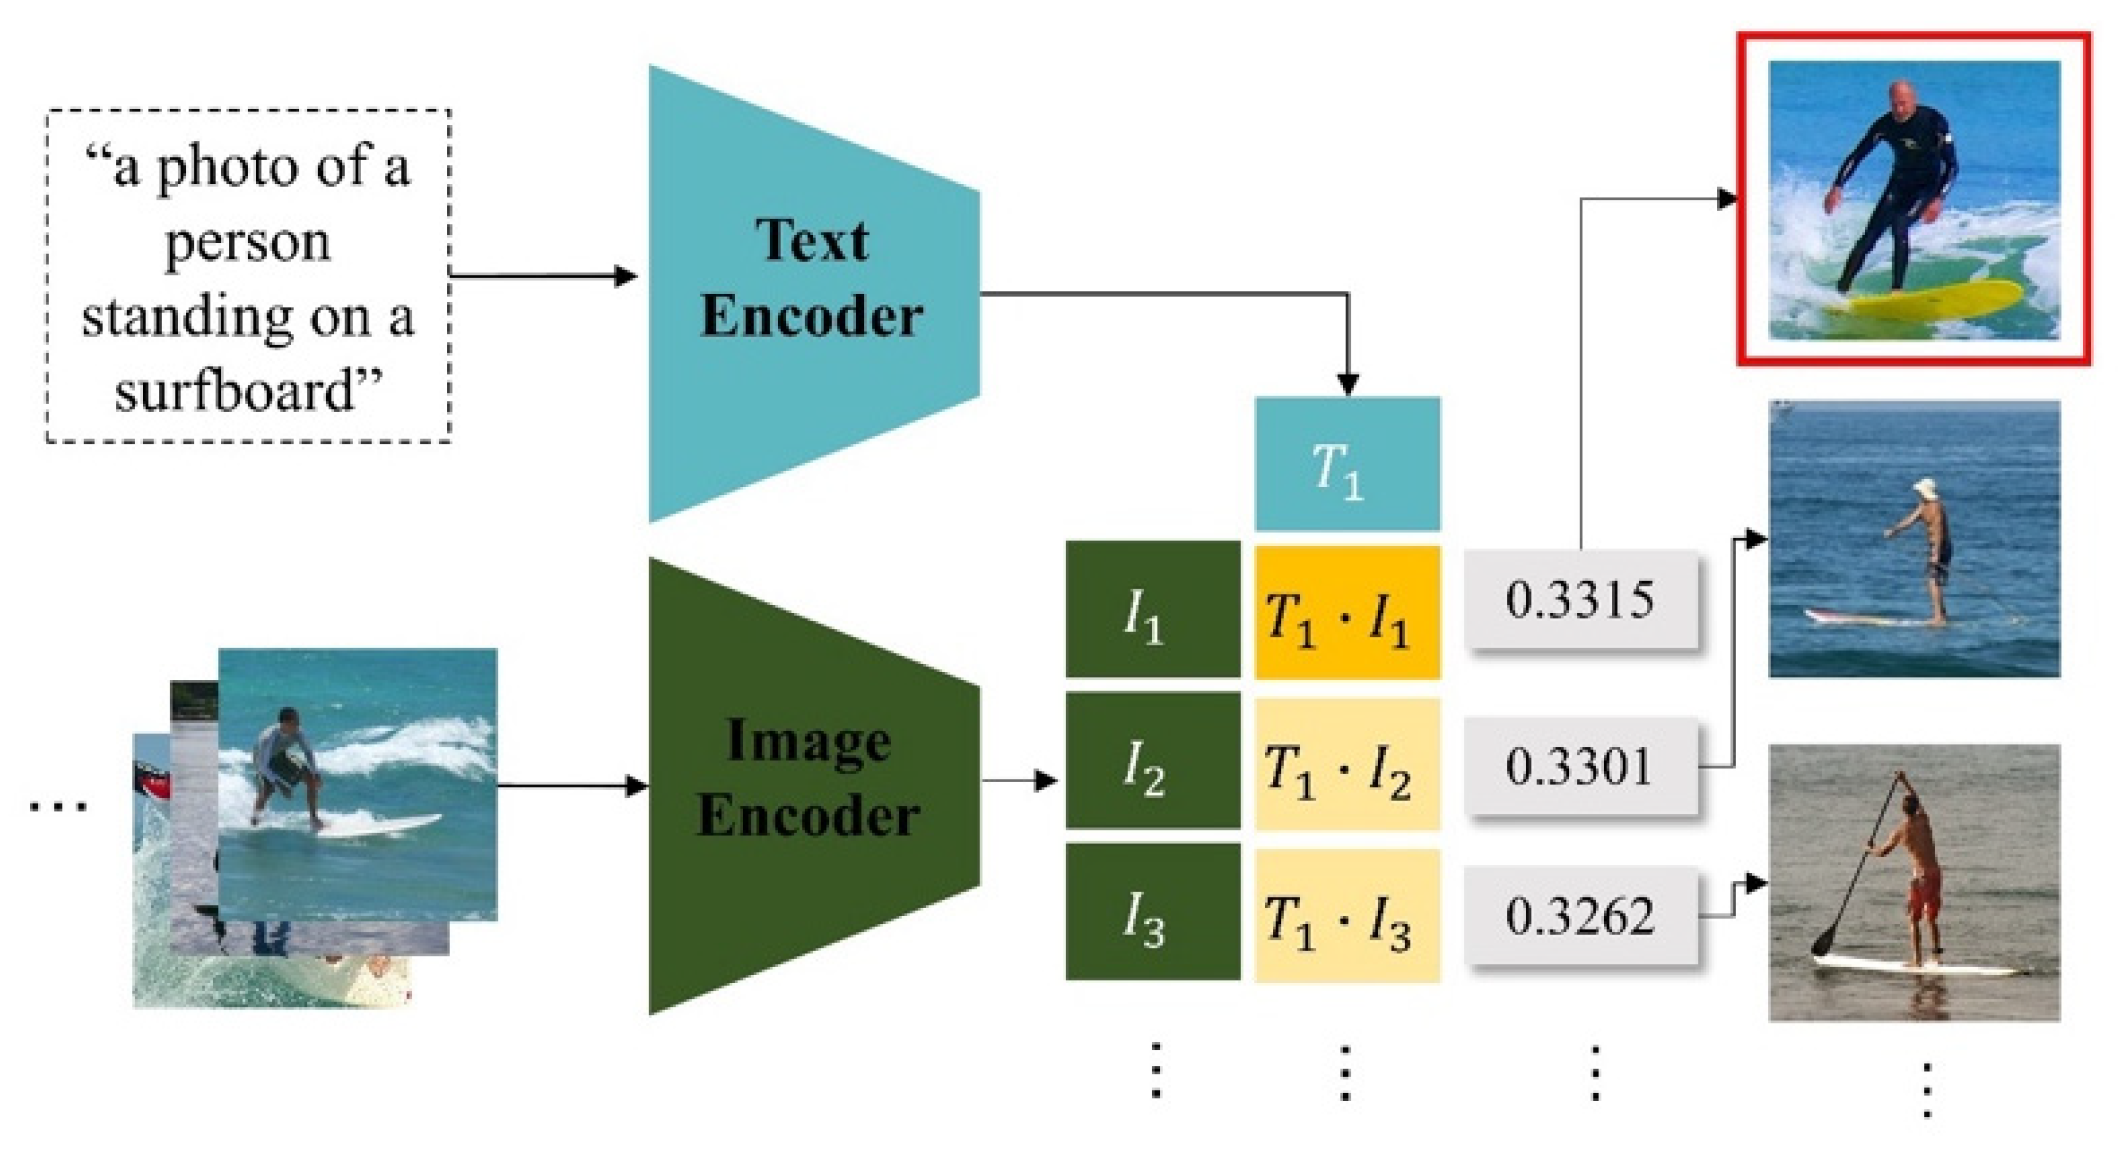
3.2. Representative Image Selection Using CLIP

To effectively cluster images based on semantic similarity, it is crucial to first determine a representative image for each interaction class. In this study, CLIP is employed to accomplish this task. It aligns text and image embeddings, facilitating the selection of the most semantically relevant image corresponding to a given textual description. Unlike traditional pixel-based similarity methods, CLIP captures high-level semantic relationships between images and text. This allows it to select a reference image that best represents both the visual and contextual aspects of the interaction. By leveraging CLIP and DreamSim, we ensure that subsequent clustering and dataset re-splitting are guided by high-level feature distributions rather than arbitrary visual biases.
The workflow of this process is illustrated in Figure 3, using the class “a photo of a person standing on a surfboard” as an example. For each interaction class C i , CLIP computes a similar score S i j between a predefined textual description T i and all images I j within the same class. The representative image I r is then selected as the image with the highest similarity score, as shown in Equation (1):
I r = S i j I j C i arg   m a x
This selected representative image serves as a reference for DreamSim-based similarity calculations, ensuring that the subsequent clustering process is driven by semantic coherence rather than low-level visual attributes. This is particularly vital in HOI detection, where meaningful human–object interactions are often context-dependent and require a deeper semantic understanding beyond raw visual similarities.

3.3. Dreamsim-Based Similarity Scoring and Image Sorting

After selecting a representative image for each class, the DreamSim metric is used to calculate distance scores between the representative image and all other images in the same class.
DreamSim is designed to align closely with human visual perception, making it a robust measure of semantic similarity. Unlike traditional similarity measures, DreamSim considers higher-order contextual meaning, which is particularly important for HOI detection, where interactions convey rich semantic relationships beyond simple visual patterns. To compute the DreamSim distance scores, each image I j in class C i is compared with the representative image I r , producing a numerical score that quantifies the semantic closeness between them. The DreamSim score S i j is defined as follows:
S i j = D r e a m S i m   ( I r ,   I j )
where
  • I r = a r g m a x I j C i C L I P ( T i , I j ) ;
  • T i is the textual description of the interaction class C i ;
  • CLIP ( T i , I j ) computes the similarity between the text and image embeddings;
  • S i j represents the DreamSim score, indicating how distant I j is to the representative image I r .
Lower distance scores indicate stronger alignment with the representative image in terms of interaction context and overall composition. By leveraging DreamSim, this approach ensures that the clustering process is not solely based on pixel-level feature resemblance but also considers the conceptual similarity between images. After computing the distance scores, images are sorted in ascending order based on their DreamSim scores. This structured sorting plays a crucial role in guiding the subsequent clustering process. Instead of distributing images randomly into train and test sets, this method systematically groups visually and contextually related images, ensuring a more meaningful dataset split.
Figure 4 illustrates this DreamSim-based sorting process using the interaction class “a photo of a person standing on a surfboard” as an example. The left section of the figure displays the DreamSim model getting representative image of the class and the remaining images as an input, ranking them based on their similarity to the representative image. The right side of the figure shows how the images are hierarchically structured, preparing them for the next stage, where they will be clustered and redistributed into training and testing datasets. This sorting step is critical for maintaining balanced representation across train and test splits, particularly in rare classes, where data scarcity can lead to biased model training.

3.4. Determining the Optimal Number of Clusters Using the Elbow Method

To create semantically meaningful clusters, the dataset is grouped using clustering. The Elbow Method is used to find the best number of clusters (k). This method helps identify the point where adding more clusters no longer significantly reduces the variance within each cluster. It is commonly used to determine the optimal k value in clustering analysis.
The Within-Cluster Sum of Squares (WCSS) is computed for different values of k, and the results are plotted to observe where the WCSS curve shows an “elbow”, indicating the optimal number of clusters. The WCSS is calculated as follows:
W C S S = i = 1 k x C i x μ i   
where
  • k is the number of clusters;
  • C i represents the set of data points belonging to cluster i ;
  • μ i is the centroid of cluster C i ;
  • x is a data point in cluster C i ;
  • | x μ i | 2 is the squared Euclidean distance between the data point and the cluster centroid.
As illustrated in Figure 5, the elbow point is identified, suggesting that dividing the dataset into three clusters provides an optimal balance between intra-cluster compactness and inter-cluster separability.
Once the number of clusters is determined, the images are grouped using k-means clustering, where each image is assigned to the nearest cluster centroid based on DreamSim scores. The right side of Figure 5 visualizes the resulting clusters for the example class “a photo of a person standing on a surfboard”. The representative images for each cluster illustrate the distinguishing semantic features:
  • Cluster 1: Focuses on human-centered figures with clearly visible people standing on surfboards.
  • Cluster 2: Contains images with large, dynamic waves and minimal human presence.
  • Cluster 3: Includes images where humans appear smaller in the frame, often surrounded by extensive background elements.
The centroid image of each cluster is highlighted to provide an intuitive understanding of how the dataset is structured. These clusters will later be utilized for train–test re-splitting, ensuring that both rare and frequent interaction classes have semantically fairly distributed images across the train–test splits. This clustering process mitigates class imbalance by fully utilizing every interaction instance and preventing certain interaction representations from dominating specific dataset splits while ensuring sufficient diversity within both train and test split. By leveraging the Elbow Method and DreamSim-based clustering, we establish a systematic approach to optimizing dataset partitioning for HOI detection.

3.5. Development of a Balanced Real-World External Dataset for HOI Detection

Generally, the development of HOI detection models heavily relies on the quality and balance of datasets used for training and evaluation. The baseline models trained on existing datasets like HICO-DET suffer from significant class imbalance, since certain interaction categories, such as “a person riding a boat”, are heavily overrepresented while others, such as “a person chasing a cat”, may be represented by only a few annotations. Class imbalance causes the model to favor the majority class during training. This leads to poor generalization on the minority class, reducing the model’s effectiveness in real-world scenarios.
To address this issue, we created a balanced real-world external test dataset. The balanced dataset ensures more equal representation across interaction classes. It also maintains diversity in human poses, object appearances, and environmental contexts, ensuring the ability of measuring generalizability on real-world scenario.

3.5.1. Balanced Dataset Development: Objectives and Scope

Our new dataset development corrects the extreme class imbalance and biased evaluation found in existing datasets while ensuring that all interaction classes are sufficiently annotated, given that most annotated data we utilize are formatted for object localization and do not provide per-pixel precision. Each class requires at least ten annotations to ensure a strong learning signal. The dataset is formatted in the HICO-DET style to maintain compatibility with other datasets. To improve robustness and reflect real-world Human–Object Interaction (HOI) scenarios, the dataset includes diverse human poses, object types, and background environments.
This diversity makes sure that models trained on the dataset can generalize across diverse input situations, making them more reliable in practical conditions [29,30]. To ensure the quality of category labels, we perform an auditing protocol for the annotation process. We check the bounding box annotations to ensure that objects and humans are well localized and that interaction labels are consistent. This methodology is well-defined so that the dataset is reliable enough to obtain a fair basis to test the HOI detection models.

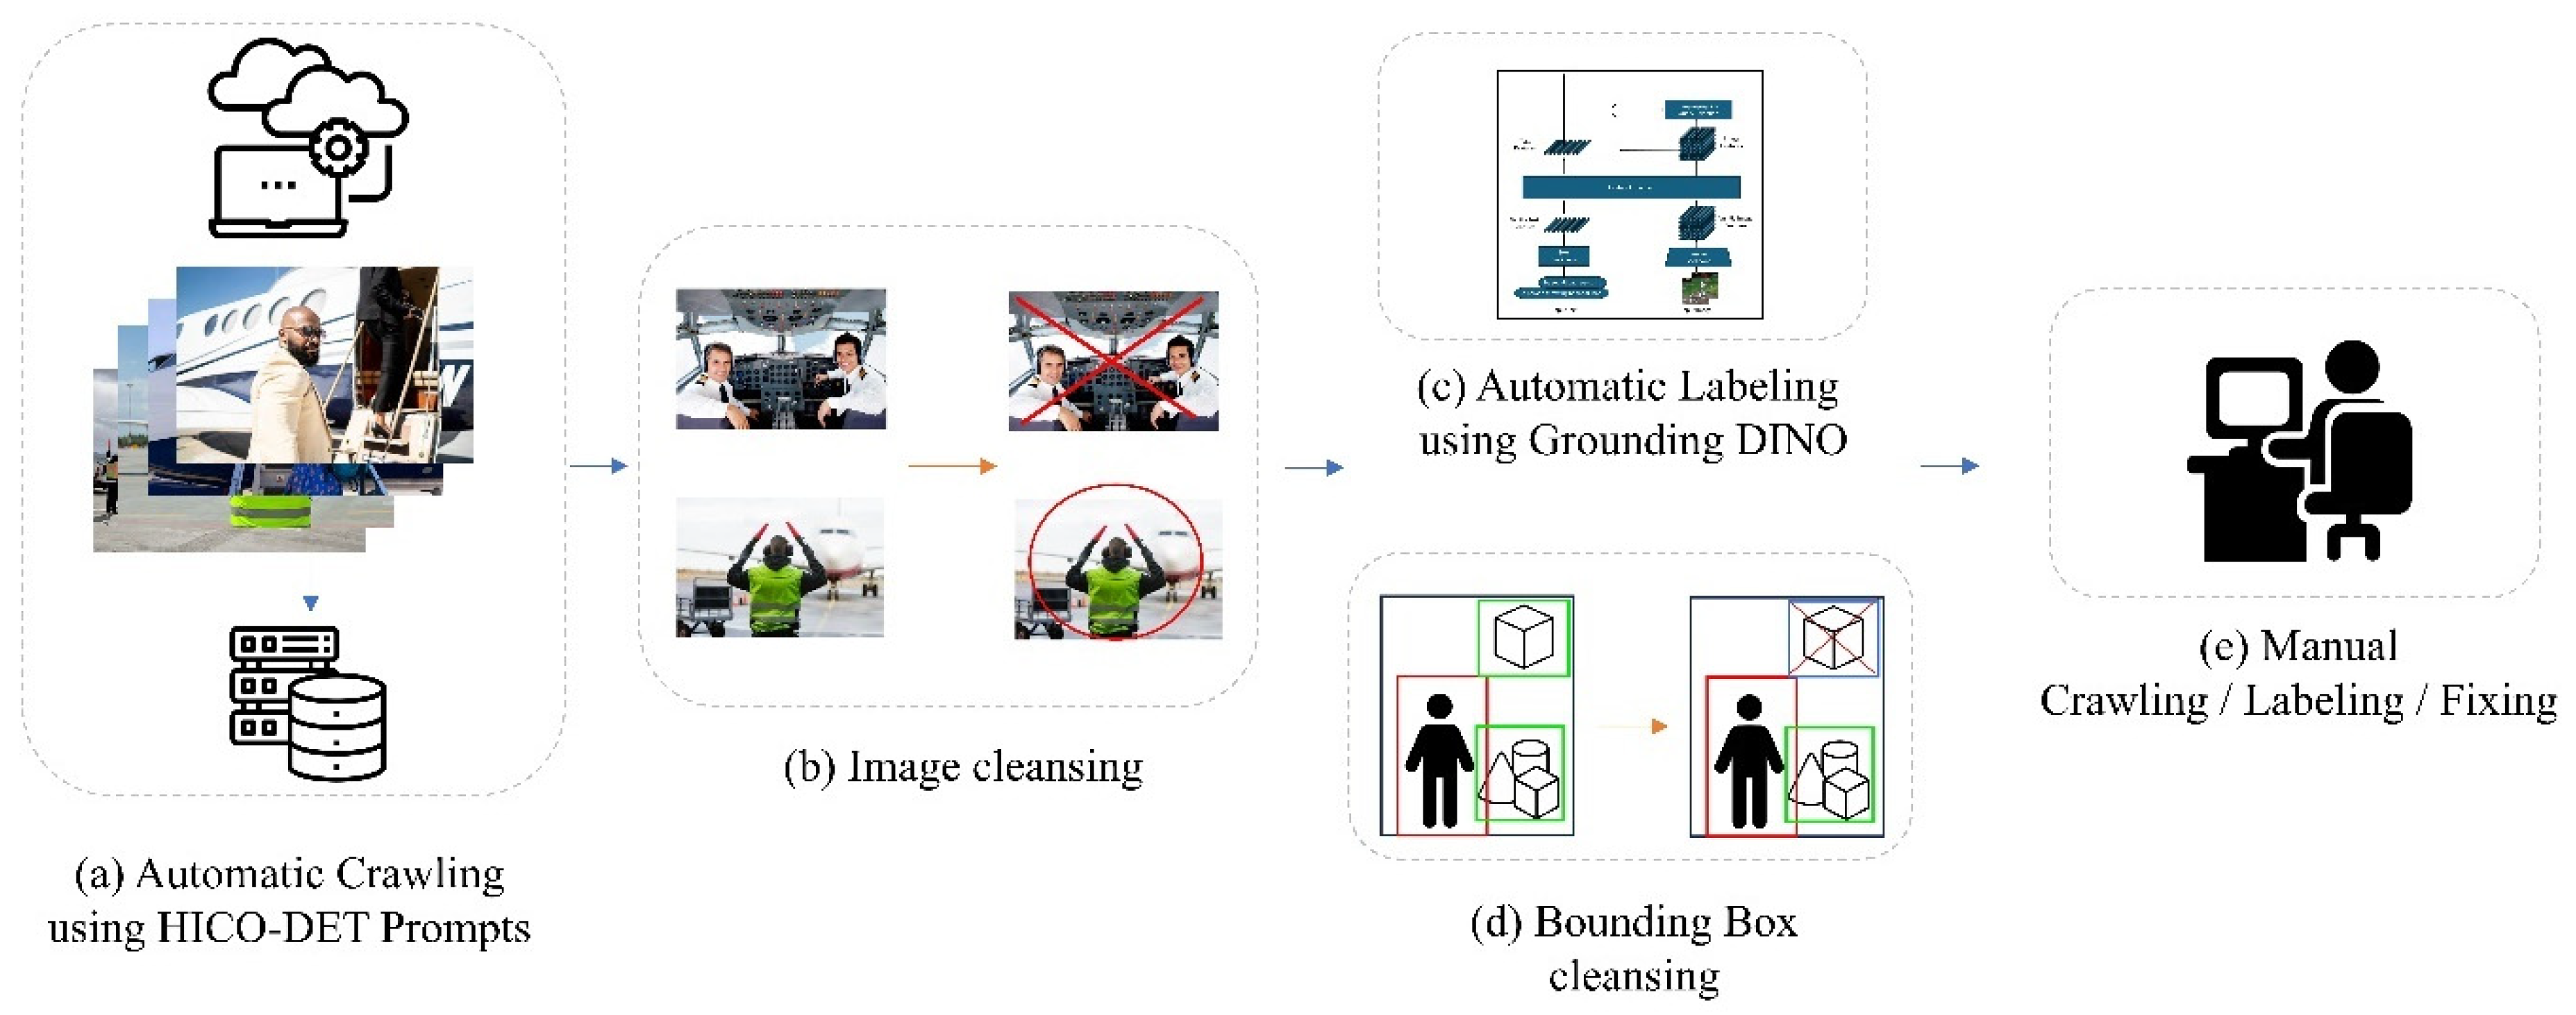
3.5.2. Methodology for Developing a Real-World Test Dataset

A balanced test dataset had to be created for the HOI detection problem, which led to utilizing an ordered methodology consisting of both automated processes and manual efforts for data that are scalable and diverse. The pipeline includes automated image crawling, image cleansing, bounding box validation, and manual refinement through a high-quality dataset with rich annotations. As illustrated in Figure 6, the dataset development process follows a systematic pipeline that begins with automatic image crawling based on HICO-DET prompts [1]. This guarantees that a wide range of images is collected across a variety of interaction types. Further, automatic annotation is applied through the Grounding DINO model that generates basic bounding box labels and interaction assignments. Although some parts are automated in early stages, annotation accuracy requires human oversight. Bounding box cleaning is performed on the dataset to correct misidentified or mislocalized objects. Additionally, no interactions are collected if there are not enough samples, and then additional images are manually shot, and more annotations are obtained until each specific interaction class achieves the target minimum annotation count. The last step is a manual crawl and annotation refinement where experts go over the dataset and fix it where things are inconsistent. This guarantees that interactions are correctly labeled. The bounding boxes match accurately, and the dataset represents real-world interaction scenarios. When this process validation is finalized, the whole dataset remains and used as a benchmark to evaluate the HOI models. This structured workflow results in a dataset that addresses multiple drawbacks of existing benchmarks.

3.5.3. Challenges in Collecting a Balanced Dataset

Particularly for a specific activity class, ensuring you have a balanced dataset is a challenge. The COCO dataset [31] enables us to recognize the one target objects in an image; however, this becomes fundamentally challenging for some categories that naturally contain multiple objects. Take the example of “a person herding sheep”: one image might show dozens of sheep, which can disproportionately increase the number of annotations for that class more than desired. To avoid such overfit, there are curated multiple images for these classes, allowing them to cover multiple contexts and perspectives [32,33,34,35]. Moreover, there are cases in interaction classes where multiple interactions occur within the same image, as many of them naturally co-occur. For example, in the case of “a person sitting at a dining table”, the person interacts with several objects—bowls, utensils, and glasses.
This tricky aspect means that labeling one interaction in an image—like “a person sitting at a table”—often ends up tagging other elements as well, sometimes more than intended for that class. So, this overlap complicates annotation, but it also provides additional variety to the dataset as it collects the diversity of real-life interactions. However, through diligent dataset curation, we can maintain good diversity across the dataset, while ensuring that interaction categories are balanced. The method ensures a statistically balanced dataset that maximizes real-world interaction patterns.

3.5.4. Statistical Improvements in the Balanced Dataset

We construct a new dataset with 5759 images and 10,814 annotations, greatly improving the balance compared to previous datasets. This results in a more balanced number of interaction samples per class, minimizing biases that were present in previous benchmarks. This was reached by implementing a lower bound on the minimum number of annotations per class. Key statistical highlights include:
  • A reduction in the disparity between maximum and minimum annotation counts from 449× in HICO-DET to 15×, representing a 30-fold decrease in imbalance.
  • A substantial decrease in annotation variability, with the standard deviation dropping from 100.68 to 12.22 from HICO-DET to ours, an 8-fold improvement in annotation consistency.
  • A more even distribution of interaction instances, with the number of annotations per class ranging from 6 to 90, averaging 18.16 annotations per class.
This refinement guarantees a more balanced distribution across all interaction classes, while ensuring a more accurate evaluation of generalization capability to under-represented interactions [36,37,38]. Besides number balance, diversity in human poses, object appearances, and backgrounds is also prioritized. It contains various interaction scenarios to increase the ability to evaluate real-world applicability under multifaceted input conditions.

4. Experiment and Evaluation

4.1. Experimental Setup and Training Protocols for Re-Splitting and Real-World Test Dataset Evaluation

Multiple state-of-the-art HOI detection models undergo structured experiments to rigorously assess the impact of the Re-Splitting dataset and the Real-World Test Dataset. These experiments aimed to analyze whether balancing the distribution of the train and test sets might compensate for class imbalance for HICO-DET and improve the reliability of model evaluation. (1) The Re-Splitting strategy can effectively enhance the performance of models, even for the rare interaction categories, and (2) the proposed Real-World Test Dataset serves as a fairer and more unbiased benchmark for the evaluation of HOI detection models. To achieve a complete evaluation, both one-stage and two-stage HOI detection models were evaluated. As the most frequently used models, one-stage models are based on analyzing an input image through a single forward pass, which can be computationally efficient but at the cost of being more sensitive to dataset bias. On the other hand, two-stage models detect object candidates and then reason about HOI, which can increase robustness at the cost of higher computational needs. The models examined in our work include five one-stage models, QPIC, CDN, GEN-VLKT, STIP, QPIC + CQL, and two two-stage models—PViC, SQA.
For testing, we used three datasets. First, the original HICO-DET test set, which still has its class imbalance. Second, our Re-Splitting test set, designed to cut out train–test bias while keeping the dataset’s basic structure. Third, the real-world test dataset, built to counter imbalance and give a clear, fair way to check how models generalize. The overall model performance on these datasets was quantified using Mean mAP as the main evaluation metric. By using HICO-DET, Re-Splitting, and the real-world test dataset, we can compare their result and analyze how training on different train–test splits would impact the performance, especially focusing on rare interaction categories. HICO-DET trained models were performed on original HICO-DET test set and real-world test dataset, and Re-Splitting dataset retrained models were evaluated on the Re-Splitting testing set and real-world test dataset to evaluate the effectiveness of the proposed dataset restructuring. To further evaluate qualitative aspects of dataset diversity, such as consistency across prompts, human pose diversity, object appearance diversity, and scene capture angle diversity, a user study was also conducted. The evaluative components included in this study also provide a structured approach to compare conventional dataset evaluation methods with more balanced and robust alternatives, ensuring that HOI detection models are evaluated in a realistic and unbiased manner.

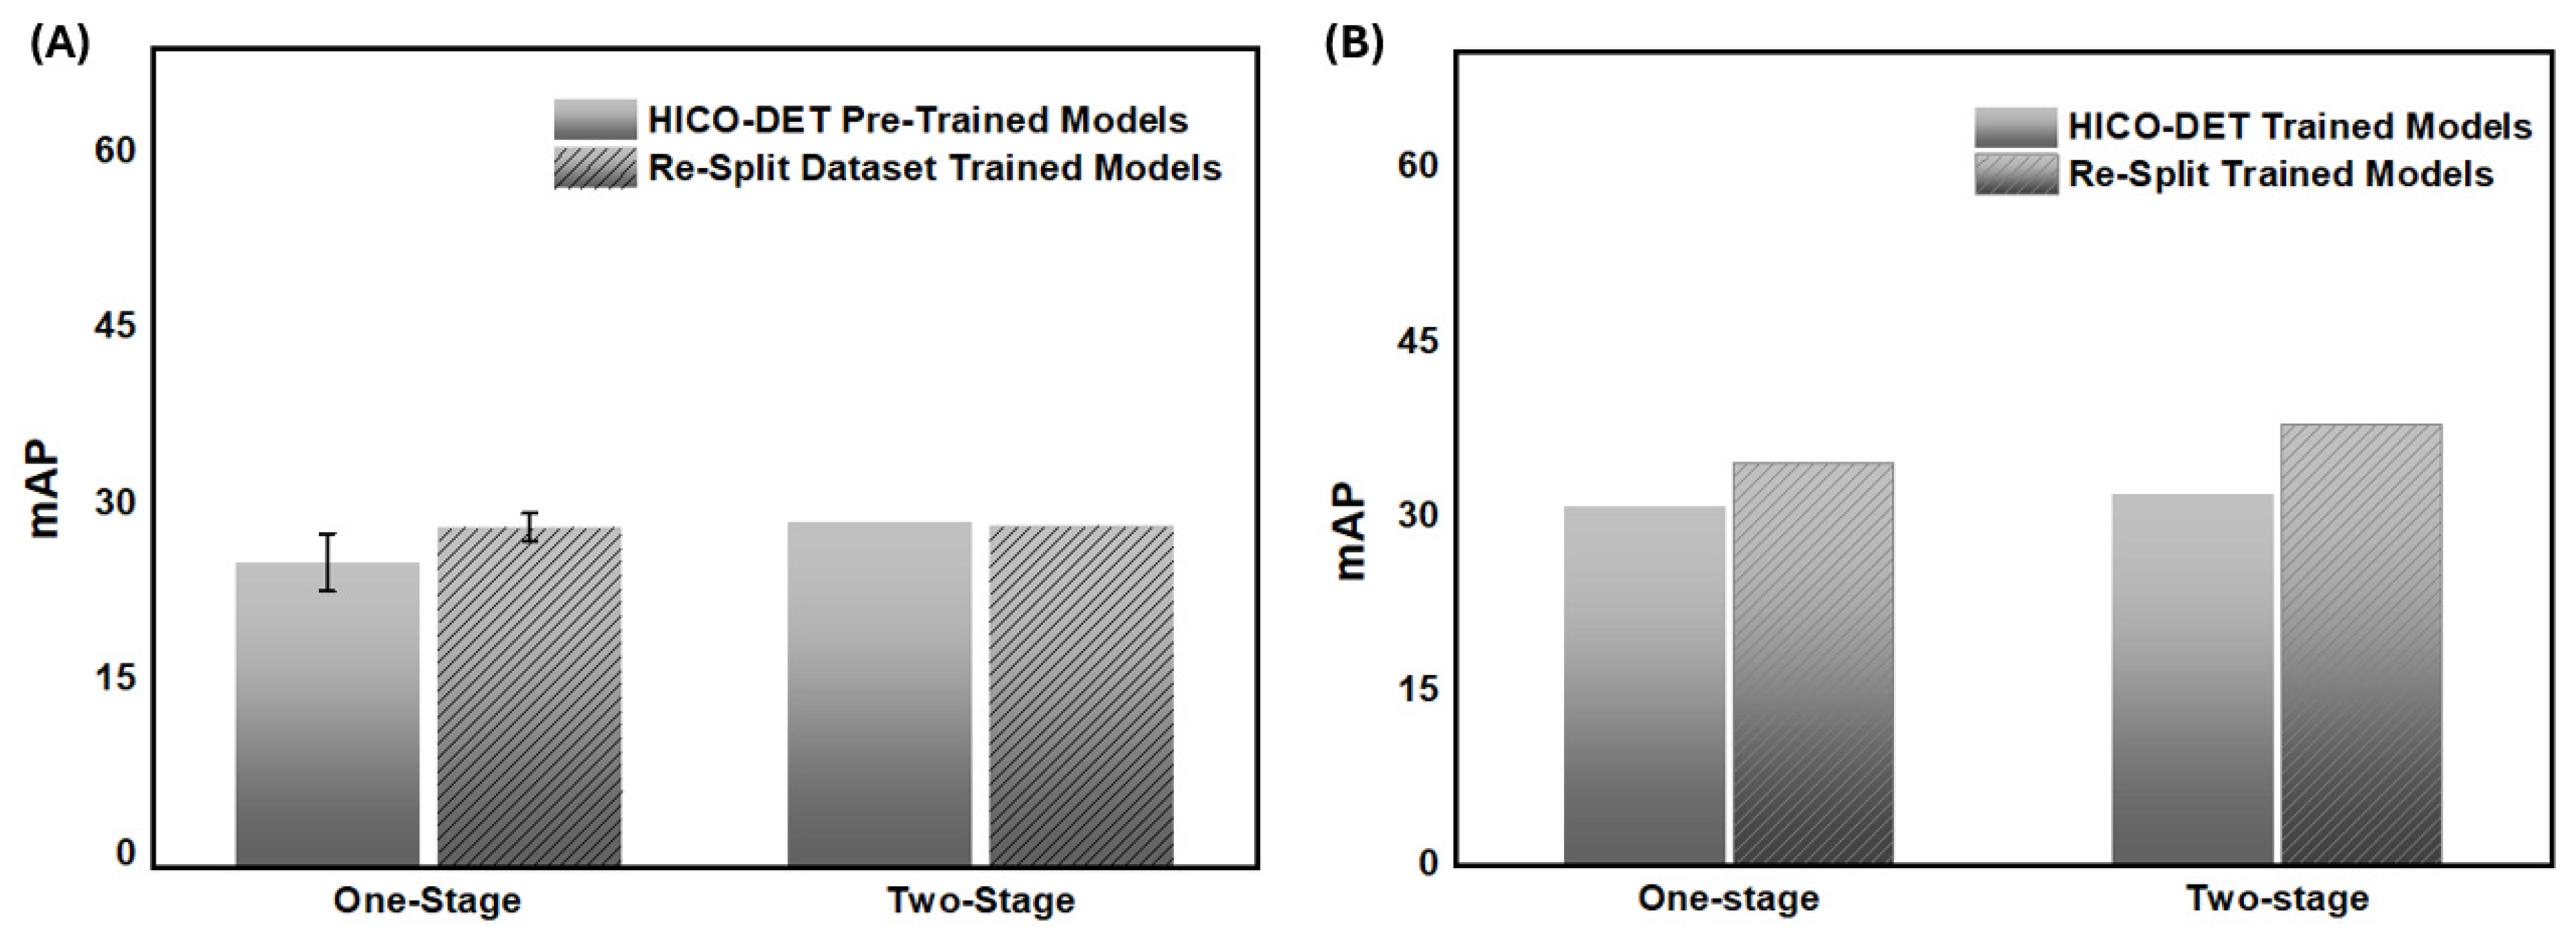
4.2. Performance Evaluation of HOI Detection Models on Re-Splitting and Real-World Test Datasets

We conducted comprehensive evaluations using several state-of-the-art HOI detection models.
These evaluations were used to assess the effectiveness of both the Re-Splitting Dataset and the Real-World Test Dataset. The goal was to demonstrate the benefits of the new dataset structure, especially in addressing class imbalance. We also evaluated how well the models generalize across different groups and interaction categories. The comparison of performances are conducted between models trained on the original HICO-DET dataset and models trained in the Re-Splitting dataset. Table 1 indicates the mAP scores for both training methods over total, rare, and non-rare counts of interaction types. It also tests how much these enrichments reduce bias and how they contribute to fairer, more reliable performance benchmarks on the real-world test dataset.
The analysis covers both one-stage and two-stage HOI detection models. One-stage models that promote computational efficiency by performing single-pass processing across the entire image, albeit at the cost of greater sensitivity to dataset bias. On the other hand, two-stage models like PViC and SQA detect objects prior to human–object interactions inference, which can gain robustness at the expense of remarkably higher computational complexity.
To show how restructuring the dataset impacts performance across different model architectures, we present the results in Table 1. The proposed Re-Splitting dataset helps models perform better, especially on less frequent interaction categories than original HICO-DET dataset. It indicates that the re-splitting dataset is structured in a more balanced manner and mitigates the long-tail data distribution from the original dataset. The performance metrics indicate that models performed more consistently on the real-world test dataset, which can show the efficacy of evaluated models on real-world scenarios compared to synthetic test datasets. The performance gap between frequent and rare interactions was significantly reduced. The new test dataset also provides a more balanced and consistent evaluation framework. This allows for better assessment of the model’s generalization ability across different interaction types.

4.3. User Study on Dataset Diversity and Annotation Quality

In addition, a structured user study was performed to evaluate the qualitative gains added to the real-world test dataset. The most important and careful purpose is to validate that the dataset presents a more diverse and accurate representation of HOI compared to original HICO-DET dataset. To better understand the diversity of datasets, the study focused on four core differences that compose the datasets: (1) object appearance multiformity, (2) camera perspective multiformity, (3) interaction–image alignment, and (4) subject pose multiformity. The user study involved an online survey in which a total of 48 members, comprising computer vision experts as well as general users, were presented with image selection tasks wherein the participants had to select desirable images from a comparative sample set. For each task, two sets of images, one from HICO-DET and one set from the real-world test dataset, were shown, and participants were asked to choose the images from the better dataset in representing a given interaction description. (See Figure 7).
The survey questions were categorized into four evaluation criteria:
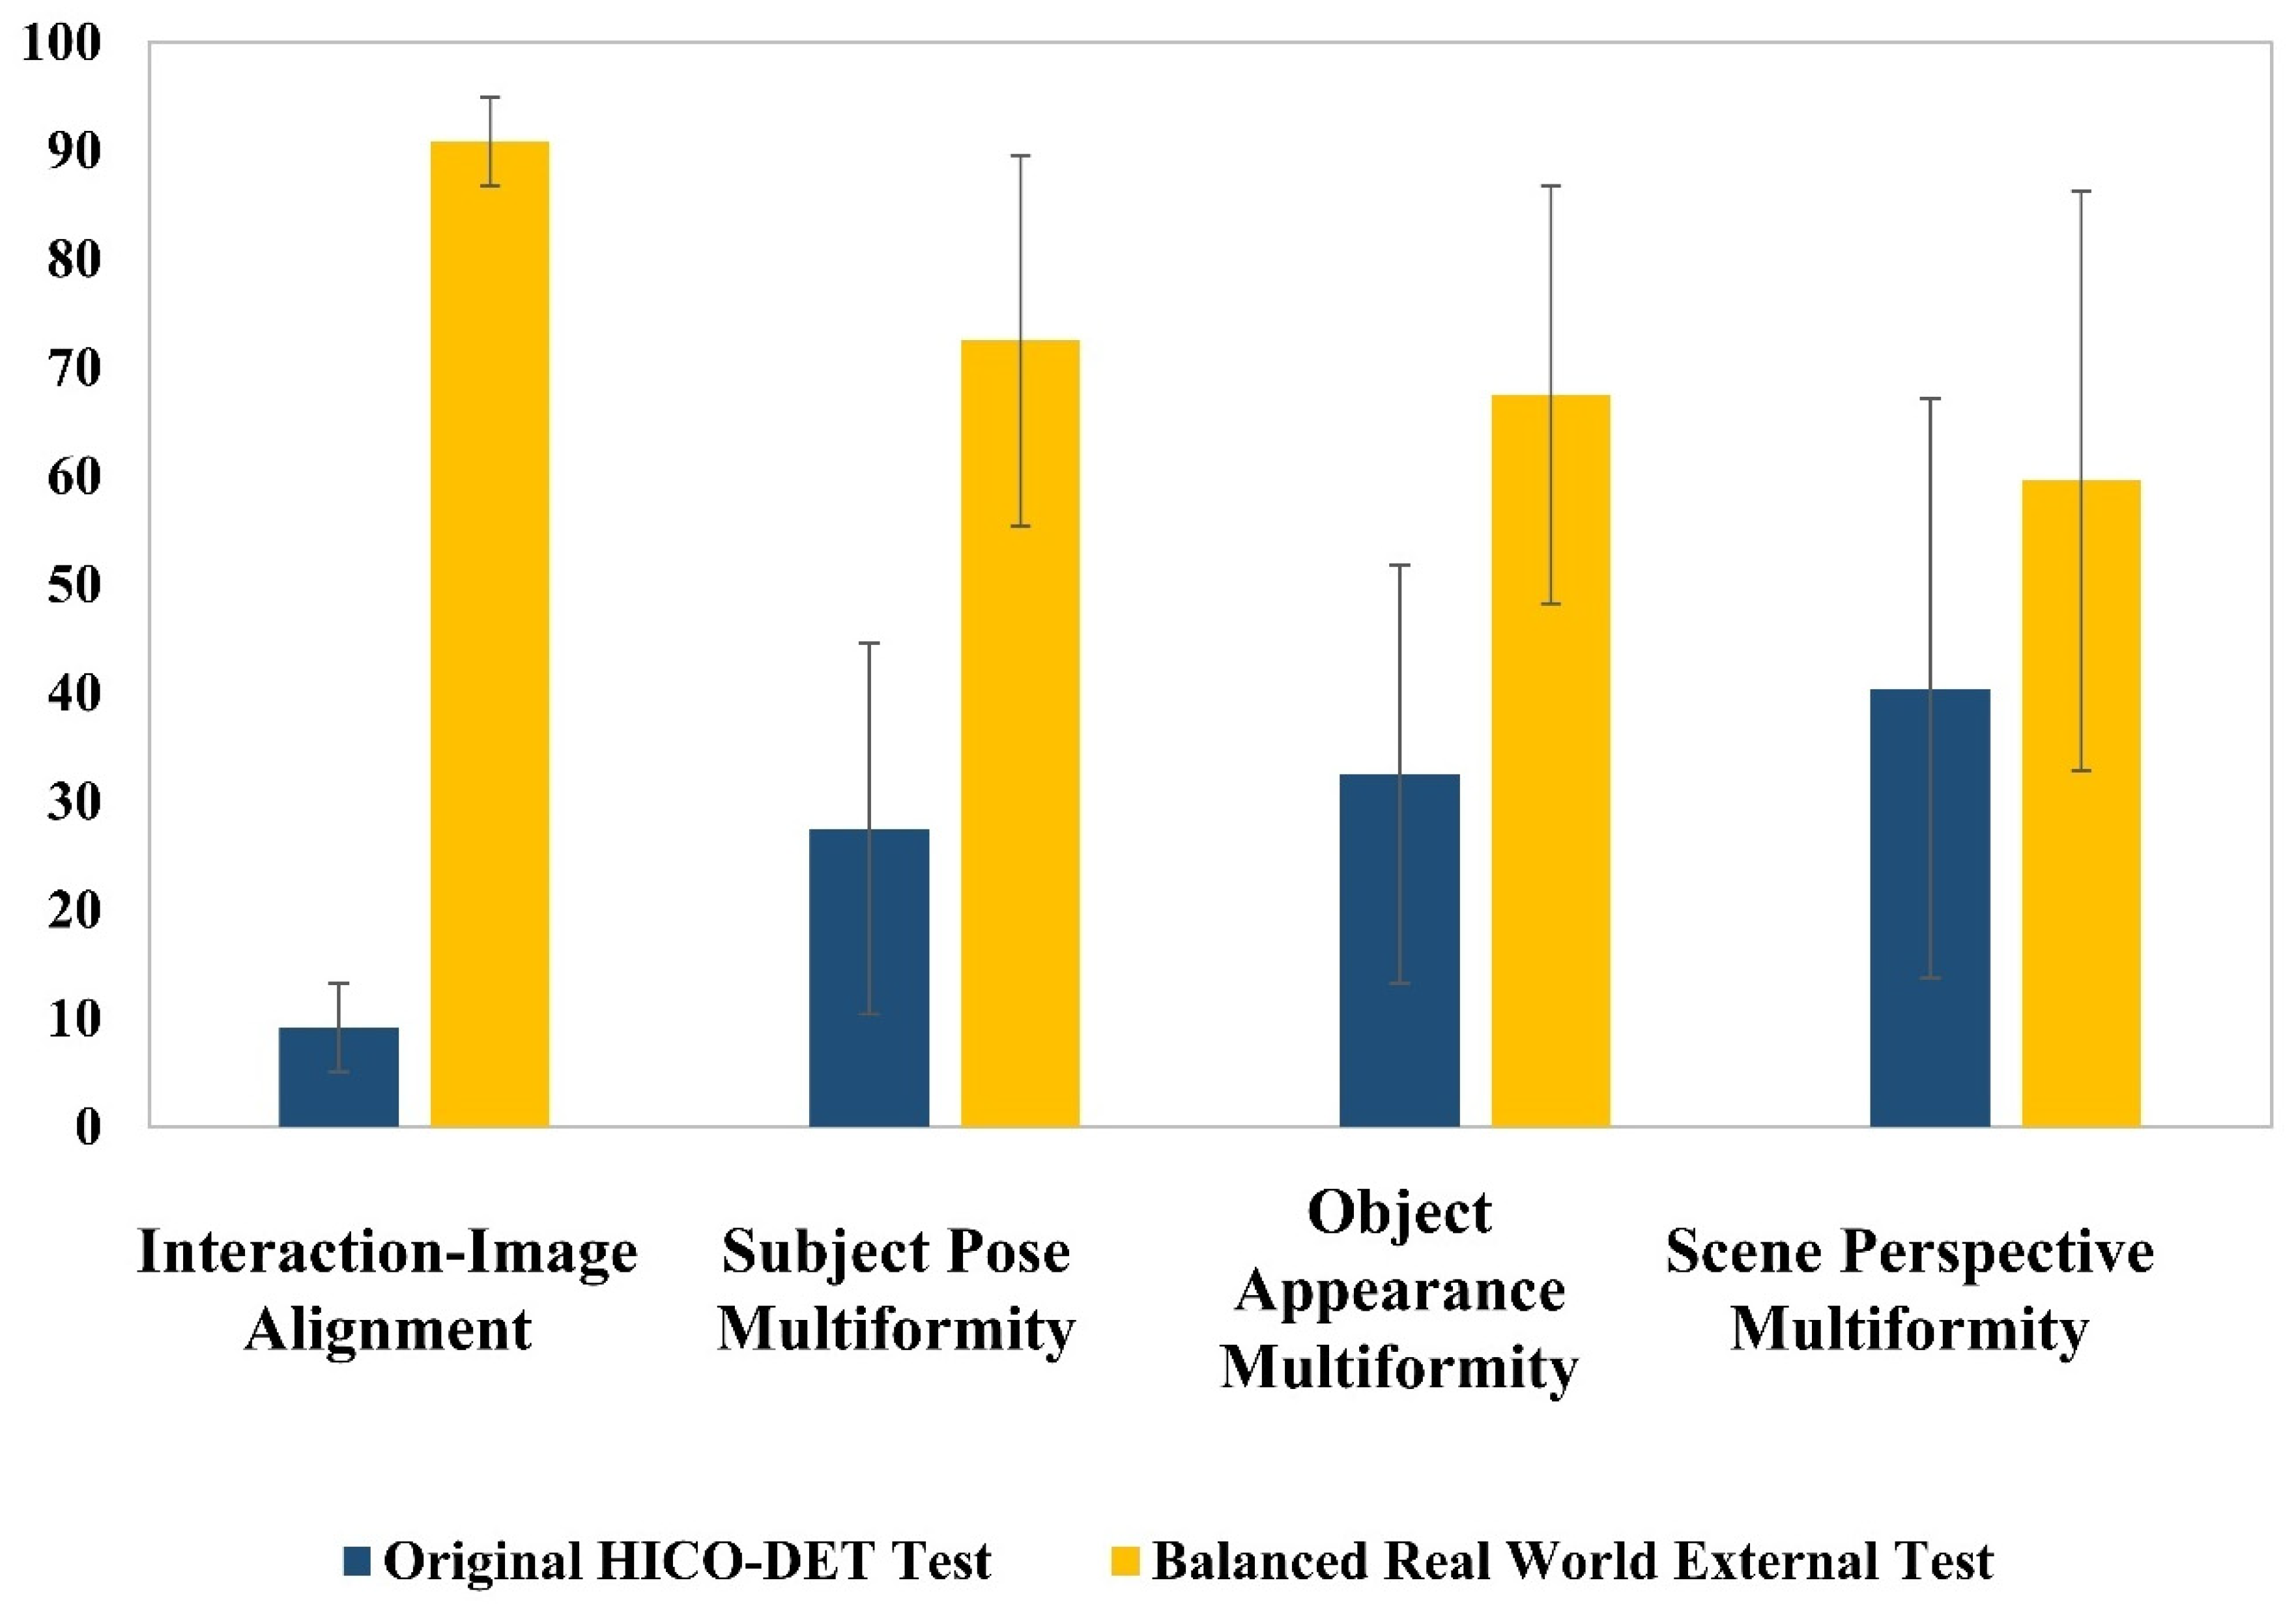
  • Object Appearance Multiformity: Participants assessed whether the dataset contained a wider variety of visual representations for objects (e.g., different appearances of an orange).
  • Camera Perspective Multiformity: Participants determined which dataset exhibited a broader range of camera angles when capturing an interaction.
  • Interaction–Image Alignment: Participants evaluated whether the images in a dataset accurately represented the given interaction prompt.
  • Subject Pose Multiformity: Participants compared the variation in human poses performing the same interaction across datasets.
To quantify the results, responses were aggregated and evaluated using all defined criteria.
The statistical comparison of user preferences is shown in Figure 8, and the results in numbers are in Table 2. The real-world test dataset consistently outperformed HICO-DET on all metrics; it better aligned with interaction descriptions and had more object diversity, a wider range of camera perspective variations, and more diverse subject poses.
  • Interaction–Image Alignment showed the most significant improvement, with the Real-World Test Dataset achieving 90.83% accuracy in aligning with the intended interaction descriptions, compared to 9.17% for HICO-DET.
  • Subject Pose Multiformity was notably higher in the Real-World Test Dataset (72.5%) than in HICO-DET (27.5%), indicating a wider range of human postures for each interaction.
  • Object Appearance Multiformity improved substantially, increasing from 32.5% in HICO-DET to 67.5% in the Real-World Test Dataset, ensuring more varied object representations.
  • Camera Perspective Multiformity was also enhanced, with the Real-World Test Dataset scoring 59.58%, compared to 40.42% in HICO-DET, allowing models to generalize better across different viewpoints.
The results show that the Real-World Test Dataset provides a more complete and unbiased benchmark for evaluating HOI detection models. It also addresses the key limitations found in existing datasets. The new dataset improves upon existing ones by including a broader scope of interaction scenarios and decreasing the biases in the datasets, providing more reliable model evaluation for generalizability to actual world conditions.

5. Discussion

This study demonstrates that restructuring the training dataset through the Re-Splitting approach improve HOI detection performance. Introducing the real-world test dataset further enhances evaluation accuracy, particularly for rare interaction categories. The experimental results confirm that these modifications contribute to a more balanced training process and a fairer evaluation. Therefore, it ultimately enhances model generalization and robustness. The Re-Splitting approach mitigates the long-tailed distribution issue by redistributing train–test splits (Figure 2). Models trained on the Re-Splitting dataset outshine those using the original HICO-DET, especially for rare interactions—see Figure 9. One-stage models jump from 26.1 to 29.1 in rare class mAP. Two-stage models see a smaller increase, from 29.5 to 29.2 (Figure 9A). These findings suggest that Re-Splitting effectively alleviates class imbalance. The improvement benefits one-stage models, which are more susceptible to dataset biases. Beyond training, the impact of the Real-World Test Dataset is evident in evaluation results [39]. Models trained on HICO-DET show a substantial increase in rare class detection when evaluated on the Real-World Test Dataset. One-stage models improve from 26.1 to 30.9 mAP, while two-stage models increase from 29.5 to 32.0 mAP (Figure 9B). The improvements are even more pronounced for models trained on the Re-Splitting dataset, where rare class mAP reaches 34.7 for one-stage models and 38.0 for two-stage models.
These results confirm that the real-world test dataset provides a more representative benchmark compared to the conventional HICO-DET test set. It reduces the bias introduced by imbalanced training distributions. When models trained on HICO-DET are evaluated on the real-world test dataset, rare class mAP increases by 4.7 for one-stage models and 5.7 for two-stage models. For models trained on the Re-Splitting dataset, the rare class mAP improvement is even greater, reaching 5.6 for one-stage models and 8.0 for two-stage models (Figure 10). These findings highlight that combining a balanced training dataset with a fair evaluation benchmark shows the most robust HOI detection models. Our study demonstrates that the Re-Splitting approach and real-world test dataset enhance HOI detection by addressing practical interaction diversity, particularly for rare interactions. Semantic clusters generated using DreamSim and k-means align well with real-world HOI scenarios. They help redistribute the long-tailed HICO-DET dataset, ensuring a balanced distribution of image diversity between the train and test sets across both rare and non-rare classes. This mitigates biases in traditional datasets, as noted in the Introduction, where class imbalance obscures model performance on infrequent interactions. The Discussion highlights that Re-Splitting improves rare class mAP (e.g., one-stage models from 26.1 to 29.1, two-stage from 29.5 to 29.2; see Figure 9A), while the Real-World Test Dataset acts as a robust benchmark to assess the effectiveness of performance-improving strategies (e.g., rare class mAP to 34.7 and 38.0; see Figure 9B). Unlike existing methods, our approach ensures equitable training and evaluation, enhancing model transferability to diverse real-world settings. The results emphasize two key contributions. First, the Re-Splitting approach enhances rare class detection by ensuring a more equitable representation of interactions during training. Second, the Real-World Test Dataset allows for more equitable assessment of model performance. It enables identification of underappreciated model performance that were previously obscured by class imbalance in traditional test sets. Thus, considering both training and evaluation biases, this work lays a solid basis towards learning generalizable HOI detection frameworks with high transferability to real-world settings. Moreover, Figure 10 shows the comparison between one-stage and two-stage models for rare class and total mAP in a bar chart. The two arms of the x-axis are rare-class and total mAP. The mAP values are used to measure the accuracy of these models in object detection and classification. Note that the y-axis ranges from 0 to 20, representing the mAP. The chart distinguishes between the models with two different bar styles. The gray bars with no hatch show the output of the one-stage model, while striped bars indicate cells with the two-stage model (Figure 10). There is a one-step detection model in which object location and classification occur at the same time. Alternatively, more sophisticated two-stage approaches based on region proposal methods first determine the regions as candidate regions of objects in an image. These regions are then classified and refined to produce the final prediction [40], usually leading to higher accuracy. Unlike in the rare class category, the two-stage model outperforms the one-stage by a much larger margin. This shows that the two-stage model has superior capabilities in detecting and identifying infrequent objects. It pose a greater challenge due to class imbalance and a scarce amount of training sample. For rare classes, the mAP scores for the one-stage model are lower than those for the two-stage model, suggesting that it is less able to find less commonly found objects with respect to the two-stage model (Figure 10).
The mAP values shown in the table represent the performance of individual classes. The total mAP indicates overall performance across all 600 human object interaction classes. The two-stage model outperforms the one-stage model, achieving a total mAP of 38. Both models surpass their rare class performance, but the two-stage continues to set overall best performance. These improvements in model performance indicate a clear advantage of the two-stage approach in its ability to generalize to previously unseen classes, leveraging the refinement in its object detection process across diverse data distributions. The one-stage slightly lags but reaches acceptable performance metrics command and could be the preferred model for applications with limited inference time. This observation is consistent with the common knowledge of object detection networks. Two-stage models use region proposal mechanisms to focus on the most relevant parts of an image and apply multiple refinement steps. This results in higher accuracy but comes at the cost of increased computational resources. In contrast, one-stage models have simpler architecture and require fewer resources. However, they often show lower accuracy, especially in detecting rare objects [41,42]. Such a trade-off is important when choosing models for real-world applications, e.g., self-driving vehicles, medical imaging, and human–object interactions. There is a trade-off between accuracy and speed. In general, the bar plot clearly reflects the supremacy of two-stage models in terms of both rare class mAP and total mAP. It indicates their better performance in identifying rare objects and offering overall higher precision in object detection. These results indicate that high accuracy should be the main concern. Two-stage models should be preferred whereas one-stage models may still have a place in scenarios where the speed of the model is a primary factor.

6. Conclusions

The Re-Splitting Dataset and the Real-World Test Dataset are proposed in this study to tackle the problem of data imbalance in HOI detection, which is especially prominent in HICO-DET. Re-Splitting leverages DreamSim-based clustering for train–test distribution restructuring, using k-means based Re-Splitting to reduce unwanted bias towards abundant samples, while ensuring balanced representation of less frequent interaction classes. The Real-World Test Dataset acts as an unbiased evaluation benchmark, reducing the skew present in conventional test sets. Experimental results show that models trained on the Re-Splitting Dataset consistently outperform those trained on the original HICO-DET dataset, especially on rare classes. The infrequent but radical class mAP gains validate our hypothesis that redistributing instances of interaction reduces the bias of the model and enables a fairer learning process. In addition, assessments on the real-world test dataset corroborate these results, uncovering latent performance possibilities that lead to better model generality contentment. This study contributes to the development of a more rigorous and equitable assessment framework. Dataset balancing is most effective for one-stage models, which are highly sensitive to the training data distribution, with significant improvements in rare mAP and overall mAP. If we consider two-stage models still, we can observe a trend of continuous improvements, reinforcing that a fair model comparison should be carried on consistent and balanced test set. Plus, a user study confirmed our Real-World Test Dataset excels in several key area. It is more consistent with prompts, offers diverse human poses and object looks, and captures scenes from varied angles. That makes it a solid benchmark for HOI research. While these models have proven useful, there are still challenges in regard to rare interaction categories and developing better structured datasets. As future work, we will investigate adaptive clustering methods for refining dataset restructuring, enlarging dataset diversity to cover a real-world spectrum of HOI, and broadening evaluation benchmarks for broader human–object interaction modeling outside of HOI. By tackling these issues, this work provides important groundwork for further improving dataset design, model training, and evaluation methods, helping to create fairer and more generalizable HOI detection systems.

Author Contributions

G.P.: conceptualization, formal analysis, original draft, writing—review and editing, and images. A.M.S.: conceptualization, review and editing, resources, and supervision. All authors have read and agreed to the published version of the manuscript.

Funding

No fundings were acquired for this work.

Institutional Review Board Statement

Not applicable.

Informed Consent Statement

Not applicable.

Data Availability Statement

The original contributions presented in this study are included in the article. Further inquiries can be directed to the corresponding author.

Conflicts of Interest

The authors declare no competing conflicts of interest.

References

  1. Chao, Y.-W.; Liu, Y.; Liu, X.; Zeng, H.; Deng, J. Learning to Detect Human-Object Interactions. In Proceedings of the 2018 IEEE Winter Conference on Applications of Computer Vision (WACV), Lake Tahoe, NV, USA, 12–15 March 2018; pp. 381–389. [Google Scholar]
  2. Fang, H.S.; Xie, Y.; Shao, D.; Li, Y.L.; Lu, C. Decaug: Augmenting hoi detection via decomposition. Proc. AAAI Conf. Artif. Intell. 2021, 35, 1300–1308. [Google Scholar] [CrossRef]
  3. Zhang, A.; Liao, Y.; Liu, S.; Lu, M.; Wang, Y.; Gao, C.; Li, X. Mining the Benefits of Two-stage and One-stage HOI Detection. Adv. Neural Inf. Process. Syst. 2021, 21, 17209–17220. [Google Scholar]
  4. Ikotun, A.M.; Ezugwu, A.E.; Abualigah, L.; Abuhaija, B.; Heming, J. K-means clustering algorithms: A comprehensive review, variants analysis, and advances in the era of big data. Inf. Sci. 2023, 622, 178–210. [Google Scholar] [CrossRef]
  5. Schubert, E. Stop using the elbow criterion for k-means and how to choose the number of clusters instead. ACM SIGKDD Explor. Newsl. 2023, 25, 36–42. [Google Scholar] [CrossRef]
  6. Takemoto, K.; Yamada, M.; Sasaki, T.; Akima, H. HICO-DET-SG and V-COCO-SG: New Data Splits to Evaluate Systematic Generalization in Human-Object Interaction Detection. In Proceedings of the NeurIPS 2022 Workshop on Distribution Shifts: Connecting Methods and Applications, New Orleans, LA, USA, 3 December 2022; pp. 1–19. [Google Scholar]
  7. Liu, X.; Li, Y.L.; Lu, C. Highlighting object category immunity for the generalization of human-object interaction detection. Proc. AAAI Conf. Artif. Intell. 2022, 36, 1819–1827. [Google Scholar] [CrossRef]
  8. Tavakoli, H.; Suh, S.; Walunj, S.; Pahlevannejad, P.; Plociennik, C.; Ruskowski, M. Object Detection for Human–Robot Interaction and Worker Assistance Systems. In Artificial Intelligence in Manufacturing: Enabling Intelligent, Flexible and Cost-Effective Production Through AI; Springer Nature: Cham, Switzerland, 2023; pp. 319–332. [Google Scholar]
  9. Achirei, S.D.; Heghea, M.C.; Lupu, R.G.; Manta, V.I. Human activity recognition for assisted living based on scene understanding. Appl. Sci. 2022, 12, 10743. [Google Scholar] [CrossRef]
  10. Tang, S.; Roberts, D.; Golparvar-Fard, M. Human-object interaction recognition for automatic construction site safety inspection. Autom. Constr. 2020, 120, 103356. [Google Scholar] [CrossRef]
  11. Wang, Y.; Xiong, Q.; Lei, Y.; Xue, W.; Liu, Q.; Wei, Z. A Review of Human-Object Interaction Detection. In Proceedings of the 2024 2nd International Conference on Computer, Vision and Intelligent Technology (ICCVIT), Huaibei, China, 24–27 November 2024. [Google Scholar]
  12. Crasto, N. Class Imbalance in Object Detection: An Experimental Diagnosis and Study of Mitigation Strategies. arXiv 2024, arXiv:2403.07113. [Google Scholar]
  13. Tamura, M.; Ohashi, H.; Yoshinaga, T. QPIC: Query-Based Pairwise Human-Object Interaction Detection with Image-Wide Contextual Information. In Proceedings of the IEEE/CVF Conference on Computer Vision and Pattern Recognition, Nashville, TN, USA, 20–25 June 2021; pp. 10405–10414. [Google Scholar] [CrossRef]
  14. Zhang, Y.; Pan, Y.; Yao, T.; Huang, R.; Mei, T.; Chen, C.W. Exploring Structure-aware Transformer over Interaction Proposals for Human-Object Interaction Detection. In Proceedings of the IEEE/CVF Conference on Computer Vision and Pattern Recognition, New Orleans, LA, USA, 18–24 June 2022; pp. 19526–19535. [Google Scholar] [CrossRef]
  15. Liao, Y.; Zhang, A.; Lu, M.; Wang, Y.; Li, X.; Liu, S. GEN-VLKT: Simplify Association and Enhance Interaction Understanding for HOI Detection. In Proceedings of the IEEE/CVF Conference on Computer Vision and Pattern Recognition, New Orleans, LA, USA, 18–24 June 2022; pp. 20091–20100. [Google Scholar] [CrossRef]
  16. Xie, C.; Zeng, F.; Hu, Y.; Liang, S.; Wei, Y. Category Query Learning for Human-Object Interaction Classification. In Proceedings of the IEEE/CVF Conference on Computer Vision and Pattern Recognition, Vancouver, BC, Canada, 17–24 June 2023; pp. 15275–15284. [Google Scholar] [CrossRef]
  17. Zhang, F.Z.; Yuan, Y.; Campbell, D.; Zhong, Z.; Gould, S. Exploring Predicate Visual Context in Detecting of Human-Object Interactions. In Proceedings of the IEEE/CVF International Conference on Computer Vision, Paris, France, 1–6 October 2023; pp. 10377–10387. [Google Scholar] [CrossRef]
  18. Zhang, F.; Sheng, L.; Guo, B.; Chen, R.; Chen, J. SQA: Strong Guidance Query with Self-Selected Attention for Human-Object Interaction Detection. In Proceedings of the ICASSP 2023—2023 IEEE International Conference on Acoustics, Speech and Signal Processing (ICASSP), Rodos, Greece, 4–10 June 2023; pp. 1–5. [Google Scholar]
  19. Paullada, A.; Raji, I.D.; Bender, E.M.; Denton, E.; Hanna, A. Data and its (dis) contents: A survey of dataset development and use in machine learning research. Patterns 2021, 2, 100336. [Google Scholar] [CrossRef]
  20. Mumuni, A.; Mumuni, F. Data augmentation: A comprehensive survey of modern approaches. Array 2022, 16, 100258. [Google Scholar] [CrossRef]
  21. Patil, P.; Boardley, B.; Gardner, J.; Loiselle, E.; Parthipan, D. Reimplementation of Learning to Reweight Examples for Robust Deep Learning. arXiv 2024, arXiv:2405.06859. [Google Scholar]
  22. Ratnasari, A.P. Performance of Random Oversampling, Random Undersampling, and SMOTE-NC Methods in Handling Imbalanced Class in Classification Models. Int. J. Sci. Res. Manag. 2024, 12, 494–501. [Google Scholar] [CrossRef]
  23. Wang, C.; Dong, Q.; Wang, X.; Wang, H.; Sui, Z. Statistical dataset evaluation: Reliability, difficulty, and validity. arXiv 2022, arXiv:2212.09272. [Google Scholar]
  24. Fu, S.; Tamir, N.; Sundaram, S.; Chai, L.; Zhang, R.; Dekel, T.; Isola, P. DreamSim: Learning New Dimensions of Human Visual Similarity using Synthetic Data. arXiv 2023, arXiv:2306.09344. [Google Scholar]
  25. Kambhatla, G.; Nguyen, T.; Choi, E. Quantifying Train-Evaluation overlap with nearest neighbors. In Findings of the Association for Computational Linguistics: ACL 2023; Association for Computational Linguistics: Toronto, ON, Canada, 2023; pp. 2905–2920. [Google Scholar]
  26. Goyal, M.; Mahmoud, Q.H. A Systematic Review of Synthetic Data Generation Techniques Using Generative AI. Electronics 2024, 13, 3509. [Google Scholar] [CrossRef]
  27. Radford, A.; Kim, J.W.; Hallacy, C.; Ramesh, A.; Goh, G.; Agarwal, S.; Sastry, G.; Askell, A.; Mishkin, P.; Clark, J.; et al. Learning transferable visual models from natural language supervision. In Proceedings of the 38th International Conference on Machine Learning, Virtual, 18–24 July 2021; pp. 8748–8763. [Google Scholar]
  28. Lüddecke, T.; Ecker, A. Image segmentation using text and image prompts. In Proceedings of the IEEE/CVF Conference on Computer Vision and Pattern Recognition, New Orleans, LA, USA, 18–24 June 2022; pp. 7086–7096. [Google Scholar]
  29. Gong, Y.; Liu, G.; Xue, Y.; Li, R.; Meng, L. A survey on dataset quality in machine learning. Inf. Softw. Technol. 2023, 162, 107268. [Google Scholar] [CrossRef]
  30. Stolte, M.; Kappenberg, F.; Rahnenführer, J.; Bommert, A. Methods for quantifying dataset similarity: A review, taxonomy and comparison. Stat. Surv. 2024, 18, 163–298. [Google Scholar] [CrossRef]
  31. Lin, T.Y.; Maire, M.; Belongie, S.; Hays, J.; Perona, P.; Ramanan, D.; Dollár, P.; Zitnick, C.L. Microsoft COCO: Common objects in context. In Proceedings of the Computer Vision—ECCV 2014, Zurich, Switzerland, 6–12 September 2014; Volume 8693, pp. 740–755. [Google Scholar] [CrossRef]
  32. Salman, S.; Liu, X. Overfitting mechanism and avoidance in deep neural networks. arXiv 2019, arXiv:1901.06566. [Google Scholar]
  33. Li, H.; Rajbahadur, G.K.; Lin, D.; Bezemer, C.P.; Jiang, Z.M. Keeping deep learning models in check: A history-based approach to mitigate overfitting. IEEE Access 2024, 12, 70676–70689. [Google Scholar] [CrossRef]
  34. Srivastava, N.; Hinton, G.; Krizhevsky, A.; Sutskever, I.; Salakhutdinov, R. Dropout: A simple way to prevent neural networks from overfitting. J. Mach. Learn. Res. 2014, 15, 1929–1958. [Google Scholar]
  35. Rice, L.; Wong, E.; Kolter, Z. Overfitting in adversarially robust deep learning. In Proceedings of the 37th International Conference on Machine Learning, Online, 13–18 July 2020; pp. 8093–8104. [Google Scholar]
  36. Hou, Z.; Yu, B.; Qiao, Y.; Peng, X.; Tao, D. Detecting human-object interaction via fabricated compositional learning. In Proceedings of the IEEE/CVF conference on computer vision and pattern recognition, Nashville, TN, USA, 20–25 June 2021; pp. 14646–14655. [Google Scholar]
  37. Wang, G.; Guo, Y.; Wong, Y.; Kankanhalli, M. Chairs can be stood on: Overcoming object bias in human-object interaction detection. In European Conference on Computer Vision; Springer Nature: Cham, Switzerland, 2022; pp. 654–672. [Google Scholar]
  38. Jin, Y.; Chen, Y.; Wang, L.; Wang, J.; Yu, P.; Liang, L.; Hwang, J.N.; Liu, Z. The overlooked classifier in human-object interaction recognition. arXiv 2022, arXiv:2203.05676. [Google Scholar]
  39. Souza, V.M.; dos Reis, D.M.; Maletzke, A.G.; Batista, G.E. Challenges in benchmarking stream learning algorithms with real-world data. Data Min. Knowl. Discov. 2020, 34, 1805–1858. [Google Scholar] [CrossRef]
  40. Zhu, F.; Xie, Y.; Xie, W.; Jiang, H. Diagnosing human-object interaction detectors. Int. J. Comput. Vis. 2025, 133, 2227–2244. [Google Scholar] [CrossRef]
  41. Zhong, X.; Ding, C.; Hu, Y.; Tao, D. Disentangled Interaction Representation for One-Stage Human-Object Interaction Detection. arXiv 2023, arXiv:2312.01713. [Google Scholar]
  42. Antoun, M.; Asmar, D. Human object interaction detection: Design and survey. Image Vis. Comput. 2023, 130, 104617. [Google Scholar] [CrossRef]
Figure 1. Workflow of the DreamSim-based Re-Splitting process. Illustrating of the Re-Splitting algorithm pipeline: Given a target concept (e.g., “a photo of a person typing on a keyboard”), images are encoded using CLIP (Contrastive Language–Image Pretraining)’s text and image encoders to compute similarity scores. DreamSim is used to further sort images based on visual similarity. The elbow method determines the number of clusters for k-means clustering, grouping similar images. Finally, clusters are re-split into balanced train and test sets to address class imbalance.
Information 16 00474 g001
Figure 2. Impact of long-tailed class distribution in HICO-DET on model learning and evaluation.
Information 16 00474 g002
Figure 3. Representative image selection for class “a photo of a person standing on a surfboard” using CLIP-based similarity scoring.
Information 16 00474 g003
Figure 4. DreamSim-based image sorting for semantic clustering.
Information 16 00474 g004
Figure 5. Elbow Method and k-means clustering for semantic partitioning.
Information 16 00474 g005
Figure 6. Structured pipeline for constructing a real-world test dataset for HOI detection.
Information 16 00474 g006
Figure 7. Example prompts from the user study evaluating dataset diversity in HOI benchmarks.
Information 16 00474 g007
Figure 8. Statistical comparison of user preferences for dataset diversity between HICO-DET and the Real-World Test Dataset.
Information 16 00474 g008
Figure 9. The figure compares mAP performance of one-stage and two-stage models trained on HICO-DET and Re-Split datasets. Panel (A) shows results for pre-trained models, while panel (B) presents results for fully trained models, indicating improved performance with dataset re-splitting.
Information 16 00474 g009
Figure 10. Comparison of one-stage and two-stage models in terms of mAP for rare classes and total mAP. The two-stage model consistently outperforms the one-stage model, especially for rare classes, indicating its better generalization and handling of less frequent object categories.
Information 16 00474 g010
Table 1. Comparison of HOI Detection Model Performance on HICO-DET, Re-Splitting Dataset, and Real-World Test Dataset (mAP scores).
ModelPre-Trained
(Original Test)
Re-Split
(Re-Split Test)
Pre-Trained
(External)
Re-Split
(External)
QPICtotal29.1429.2433.1433.14
rare21.7426.8527.2729.06
non-rare31.3529.7834.9534.54
CDNtotal31.4432.6335.0437.69
rare27.2429.5029.2436.10
non-rare32.6933.3537.3138.59
STIPtotal29.1529.6535.8136.14
rare27.0729.8633.7037.74
non-rare29.7729.6036.9936.30
GEN-VLKTtotal-34.27-39.62
rare29.1129.2833.2837.98
non-rare35.0035.4038.9439.82
QPIC+CQLtotal30.9630.7334.7635.37
rare25.4830.0430.7632.40
non-rare32.6030.8936.4836.82
SQAtotal27.6528.8534.6735.82
rare26.3426.2332.9636.44
non-rare28.0429.4535.8036.20
PViCtotal34.7036.1539.4439.91
rare32.8332.0237.5539.55
non-rare35.2637.3840.0140.01
Table 2. Quantitative results of the user study evaluating dataset diversity.
Original HICO-DET TestBalanced Real World External Test
19.1790.83
227.5072.50
332.5067.50
440.4259.58
Disclaimer/Publisher’s Note: The statements, opinions and data contained in all publications are solely those of the individual author(s) and contributor(s) and not of MDPI and/or the editor(s). MDPI and/or the editor(s) disclaim responsibility for any injury to people or property resulting from any ideas, methods, instructions or products referred to in the content.

