Article

Comparing Classification Algorithms to Recognize Selected Gestures Based on Microsoft Azure Kinect Joint Data

1
School of Business, University of Applied Sciences and Arts Northwestern Switzerland, 4600 Olten, Switzerland
2
Institute for Information Systems, University of Applied Sciences and Arts Northwestern Switzerland, 4600 Olten, Switzerland
*
Author to whom correspondence should be addressed.
Information 2025, 16(5), 421; https://doi.org/10.3390/info16050421
Submission received: 18 March 2025 / Revised: 7 May 2025 / Accepted: 12 May 2025 / Published: 21 May 2025

Abstract

:
This study aims to explore the potential of exergaming (which can be used along with prescriptive medication for children with spinal muscular atrophy) and examine its effects on monitoring and diagnosis. The present study focuses on comparing models trained on joint data for gesture detection, which has not been extensively explored in previous studies. The study investigates three approaches to detect gestures based on 3D Microsoft Azure Kinect joint data. We discuss simple decision rules based on angles and distances to label gestures. In addition, we explore supervised learning methods to increase the accuracy of gesture recognition in gamification. The compared models performed well on the recorded sample data, with the recurrent neural networks outperforming feedforward neural networks and decision trees on the captured motions. The findings suggest that gesture recognition based on joint data can be a valuable tool for monitoring and diagnosing children with spinal muscular atrophy. This study contributes to the growing body of research on the potential of virtual solutions in rehabilitation. The results also highlight the importance of using joint data for gesture recognition and provide insights into the most effective models for this task. The findings of this study can inform the development of more accurate and effective monitoring and diagnostic tools for children with spinal muscular atrophy.

1. Introduction

Current healthcare developments are enhancing traditional methods by applying machine learning and artificial intelligence solutions. Recently, the field of telerehabilitation and monitoring has gained increasing attention [1] because software has become more complex, and hardware has become smaller and more affordable. In this context, not only healthcare suppliers but also software companies recognize the impact virtual aid can provide for patients’ treatment through exergaming, i.e., physical exercises conducted in a video game setting. As a result, there are many digitization approaches in the field of motion tracking, gesture recognition, and measurement of the range of motion (ROM). One company that stands out for its development of hardware and software components for this purpose is Microsoft. The Microsoft Azure Kinect camera and its predecessors have become impactful devices supporting the research of remote and computerized monitoring solutions for patients suffering from diseases involving movement impairments. Subsequently, gamification in the healthcare branch helps to make these computer vision-based solutions attractive.
This study aimed to clarify the current state of research and explore the potential of exergaming for monitoring and diagnostics. Therefore, a comparison of three classification algorithms was performed. The algorithms were a simple decision tree, a feedforward neural network, and a recurrent neural network (RNN). A specific use case at the pharmaceutical company F. Hoffmann-La Roche offered the possibility of using their hardware and laboratory environment. The performance of the algorithms was compared using the classification accuracy of 3D joint data (coordinates of joints of the human body) captured by a Microsoft Azure Kinect device. The training data were captured in a laboratory environment. Special importance was given to capturing correct and incorrect examples of the selected motions. The resulting data were pre-processed to gain valuable insights and construct features and threshold rules. All three algorithms performed well when classifying the selected motions, but the RNN demonstrated the best performance. It not only outperformed the neural network in test accuracy by approximately 10%, but also had advantages when considering more complex tasks in future scenarios. Finally, the accuracy and robustness of the selected algorithms depend on the training data quality; however, the proposed RNN exhibited significant potential for motion tracking and gesture recognition in future healthcare research.
In summary, the contributions of our study are as follows:
  • Careful data-capturing in a laboratory setting considering an exergaming use case;
  • Usage of the most recent hardware and software (Azure Kinect developer kit);
  • Comparison of three standard machine learning approaches for the used data.
The remainder of this paper is structured as follows. Section 2 delves into the concept of virtual training and telerehabilitation, providing a foundational understanding of the subject. Section 3 provides a comprehensive review of the existing literature and highlights gaps in knowledge related to virtual training and telerehabilitation. In Section 4, the research methods and approaches employed are presented, including further details on how data were collected and analyzed. Section 5 describes the specific methods used to capture relevant information. Section 6 presents the outcomes of the classification algorithms used in this study. Section 7 presents a discussion of the results, their implications, and concluding remarks.

2. Virtual Training and Telerehabilitation

Virtual training and telerehabilitation technologies are emerging technologies in the health industry and are thus recognized by technological companies such as Microsoft and Intel and by pharmaceutical giants such as F. Hoffmann-La Roche. The commercial adoption of machine learning techniques for patient monitoring and exercising has increased steadily, as several researchers have found new ways to apply artificial intelligence methods to conventional exercise scenarios [2]. Additionally, improvements in hardware have led to new possibilities for capturing and detecting joints, posture, and motions of patients. Intel’s RealSense and Microsoft’s Azure Kinect sensors have steadily improved the efficiency and accuracy of data capture.
Our research was conducted as part of a feasibility study that aims to improve the monitoring and diagnosis of spinal muscular atrophy (SMA) in children. The application of virtual training solutions could play a key role since SMA is a rare neuromuscular disorder that leads to the loss of motor functions and hence to the loss of body posture control. The ongoing study examines the applicability and effects of an exergaming approach in combination with prescription medicine such as Risdiplam (brand name Evrysdi). Prior controlled clinical trials and feasibility studies have shown improvement in the performance and ROM in stroke survivors or patients with other (rare) diseases such as Parkinson’s disease (PD), multiple sclerosis (MS), and cerebral palsy (CP) [3]. Before advanced approaches, such as those based on machine learning (ML), are investigated in detail for gesture recognition, research should demonstrate significant positive effects of such an approach. Prior research (Galna et al. 2014) [3] showed that reachability and stepping exercises in an exergaming environment improve balance and posture control. Additionally, studies [4] have compared the accuracy and performance of older and newer versions of the aforementioned RealSense and Microsoft Kinect sensors, which increase with each new generation. Next, research has focused on (deep) learning classifying methods by comparing different machine learning approaches [5]. This study clarifies the possibilities of applying classification algorithms in combination with a Microsoft Azure Kinect camera. Hence, the following research questions were considered:
  • RQ1. Which machine learning algorithm classifies postures most accurately on Microsoft Azure Kinect joint data?
  • RQ2. Which algorithms are considered suitable in related research?
  • RQ3. Which conditions must be fulfilled to ensure data capturing accuracy?
The goal of this paper was to compare different machine learning methods, evaluate their performance on the Azure Kinect joint coordinate data, and answer the abovementioned research questions. To achieve this research goal, the research work followed a design science research paradigm. Let us mention that there were limitations regarding data quality, as the diversity of the collected subjects’ data may not satisfy high standards. Furthermore, there are other ML methods that may be considered in future research. As an end-to-end network, the proposed method based on a recurrent neural network provides a generic and holistic solution for joint recognition and classification of distinct types of body movements from consecutive 3D skeleton joint frames.

3. Literature Review

This section reviews related research and addresses aspects of RQ1 and RQ2. First, we explored related studies that addressed the use of virtual methods in practice. Second, the literature was analyzed regarding machine learning methods applied in research and practice. Finally, the suitability of Microsoft Azure Kinect cameras was assessed by comparing the results of studies focusing on the precision and accuracy of the predecessor and similar devices.

3.1. Examples for Virtual Methods in Practice

In this subsection, we discuss the literature on the general aspects of identifying human movements and gestures, such as for physical training (virtual reality training, telerehabilitation, exergaming). In addition, various issues and limitations regarding the application scenario and the used technology are considered.
Kitsunezaki et al. (2013) [6] measured the effectiveness of physical training for patients along with a computer vision approach. This study introduced the timed “up and go test”, the timed “10 m walk test”, and the joint “range of motion” (ROM) measurement. A Kinect camera version 1 (v1) device was used to examine the ROM and joint angles of patients in a real-time measurement process. The authors emphasized the ability of the Kinect v1 model to replace manual measurement of limbs with a vast range of motion. On the other hand, Kitsunezaki et al. [6] described the difficulties associated with tracking and examining lower limbs with a focus on assisted execution. Another flaw mentioned by Kitsunezaki et al. (2013) [6] is the inability to track joints in newborns because the tracking points are too imprecise or do not appear at all. Molchanov et al. (2016) [7] pointed out the challenges of diverse ways people perform motions. Therefore, the authors performed experiments on dynamic hand gestures from continuous depth, color, and stereo-infrared (IR) sensor data streams. The experimental setup was completed in a driving simulator, including a main monitor for driving scenes and a user interface to prompt gestures. The authors aimed at live joint segmentation and classification of motion data, where the stereo-IR sensor played a key role. The proposed gesture recognition system achieved an accuracy of 83.8%. In addition, the results were compared to state-of-the-art benchmarks. Finally, the proposed recurrent neural network was trained on segmented videos (Molchanov et al. 2016) [7].
Alaoui et al. (2020) [8] created and used body postures in a Unity3d game environment. Furthermore, the posture data were collected with a Microsoft Azure Kinect camera. The focus was especially on two body detection methods that both scored 95% accuracy. The player posture in the game environment allowed the user to control the movement of a bird. A layer provided efficient posture detection by creating angles and vectors from tracked body joints. Albert et al. [9] compared two posture detection methods. First, the user recorded each possible posture for three seconds with a threshold for angles and vectors. This led to precise pose recordings; however, it required significant time and was not applicable to different users with different body characteristics. In the second approach, a Bayesian network calculated the probability of a pose belonging to a single flag from a predefined set of flags. The network selected the most probable flag from the list; the initial flag was then calculated from the detected joint angles. Finally, the Bayesian method provided values quicker and was easier to apply to multiple users; however, it lacked accuracy in classifying flags, especially when flags had close values, where a flag was a textual representation of a body part state depending on the computed angles (Alaoui et al. 2020) [8]. According to [10], supplementation with virtual training improved upper body extremity functions. The authors described virtual reality training for stroke survivors who experienced paralysis or weakness on one side of their body due to hemiplegia. The study was based on a randomized controlled trial with 40 participants. Hence, 20 participants were allocated to the experimental group and 20 to the control group. During the study, the control group received conventional occupational therapy, whereas the experimental group received both conventional therapy and virtual reality training. The results showed that stroke survivors who received additional virtual training had significantly increased upper extremity functions. However, this effect might have resulted from a greater total intervention time for the experimental group [10]. Telerehabilitation via a videoconferencing tool using Microsoft Kinect v1 improves balance and postural control. Ortiz-Gutiérrez et al. [11] conducted a study on the applicability of telerehabilitation among patients with multiple sclerosis. The controlled trial included 50 participants, with 25 participants in each control and experimental group. The control group received conventional physiotherapy twice a week, whereas the experimental group received four sessions of the introduced telerehabilitation treatment per week via an Xbox 360 Kinect console. The treatment schedule lasted for 10 weeks in both groups. The results showed balance and postural control improvements in both groups. Computerized dynamic posturography was used to evaluate the postural control and balance of all patients, where the balance regulation was examined using pressure plates before and at the end of the treatment schedule. Finally, the authors demonstrated telerehabilitation as an effective alternative when conventional therapy was inconvenient or not possible (Ortiz-Gutiérrez et al. 2013) [11]. To demonstrate the potential of exergaming for use in healthcare and several diseases accompanied by movement impairment, Galna et al. (2014) [3] examined the effects and applicability of exergaming on patients with PD. The aim of this study was to test a rehabilitation game in terms of dynamic postural control in patients. The software was set up as a multidirectional control game that involved reaching and stepping tasks with increasing complexity. The task was to work as a farmer, driving through the crops and collecting fruits (by reaching) from the fields while avoiding obstacles (by stepping). Nine participants with PD tested the exergaming software for one session (Galna et al. 2014) [3]. Afterwards, the authors assessed the safety, feasibility, and patient acceptance of the gaming approach for health monitoring. According to the questionnaire, seven of the nine participants stated that they would use the game if it improved their balance. Nevertheless, there were also doubts regarding home use since some exercises were too complex and some visual elements were difficult to identify. Further opinions about the approach were collected separately, including concerns about the fictive narrative of the game environment and the pace of the game. Furthermore, some participants preferred solo games over group games. Other participants were more attracted by the idea of real-life tasks than fantasy-based environments. Another preference expressed was the outdoor setting of the gaming tasks in combination with satisfactory audio effects associated with the action performed, e.g., the sound of hitting the ball while playing a golf game.

3.2. Comparison of Machine Learning Algorithms

In this subsection, we review various approaches using machine learning in the context of gesture and motion recognition. In particular, feedforward neural networks, convolutional neural networks, recurrent neural networks, spatiotemporal networks, and LSTM networks were used and compared in the studies discussed, including other methods such as Bayesian filters, other types of filters, and feature-based methods. Specific aspects of the application scenarios, types of data being used, and observed limitations are pointed out.
According to D’Orazio et al. (2014) [12], neural networks can be a valid approach for gesture classification tasks. This study focused on real-time gesture recognition with the goal of proposing a method for human–robot interfaces using low-cost Kinect v1 sensors. According to the “Arm-and-Hand Signals for Ground Forces,” the authors selected ten gestures corresponding to the following signals: Action Right, Advance, Attention, Contact Right, Fire, Increase Speed, Mount, Move Forward, Move Over, and Start Engine. Each gesture was then modeled and trained separately by a neural network (NN), resulting in 10 separate models based on positive examples corresponding to the correct gesture. The remaining gestures were then labeled as negative examples. With the backpropagation algorithm, the ten NNs always delivered a result and put it into a class by majority vote, even if the example did not contain one of the ten selected gestures. The results presented encourage future research on this topic because the number of false positives was always lower than the number of true positives. D’Orazio et al. (2014) [12] particularly mentioned future work to be conducted on the length of gestures that must also be assessed.
Murakami et al. (1991) [13] described how they handled the challenges of gesture recognition in a dynamic process. Each gesture specified a word in the Japanese sign language repertoire. The Japanese sign language alphabet is a collection of static finger postures. The authors proposed a recurrent neural network (RNN) approach to recognize continuous gestures. In the first approach, letter recognition was performed by a neural network using a three-layer architecture with backpropagation. The comparison of recognition results with NN models indicated that the accuracy of a model increased with the number of output alphabet characters. On the other hand, the experiment also demonstrated the deviation between the training and test sets because the accuracy was 21% lower on the test set. In the following experiment, the authors classified words in the Japanese sign language alphabet. They mentioned three problems that needed to be solved: (1) how to process time-series data, (2) how to encode input data to improve the recognition rate, and (3) how to detect delimiters between sign language words.
Positional data were required for gesture recognition. Hence, the authors used the absolute position and the position relative to the source position to determine the hand trajectory. Another challenge was to exclude meaningless movements from each individual word. Without defining delimiters between words, the authors defined starting and ending points for each gesture.
They assumed that each gesture started from a specific posture. Another NN was employed to determine whether a gesture was meant to be a starting posture. If this was the case, the data were sent to the next NN, and the sign language process started. The endpoints were then determined using the history of the classification results [13].
In their paper, Gu et al. (2017) [2] proposed a recurrent neural network approach for joint estimation and tracking facial features in videos. The authors adjusted the parameters in a way that performed best on the training data. The experimental results demonstrated that the proposed RNN-based method outperformed frame-wise and Bayesian filtering models. In addition, the authors emphasized the temporal links between consecutive frames, which increased the estimation accuracy and robustness. Hence, an RNN could serve as an effective alternative when sufficient training data were provided. Moreover, the authors created a large-scale synthetic dataset for head pose estimation that they used to achieve state-of-the-art performance on a benchmark dataset. This study focused on the connection between Bayesian filters and an RNN to recommend RNNs as a generic alternative. After examining the similarities between the two methods, Gu et al. found that RNNs were generally more applicable and easier to handle because manual tuning was avoided, and parameters were learned from the training data. First, they compared convolutional neural networks (CNN) to the Kalman filter (KF) or particle filter (PF) for temporal filtering. Second, they compared a separately trained CNN and a separately trained RNN for temporal filtering. Finally, they examined the results of a CNN with an RNN for temporal filtering, where the two networks were trained together. The training and test datasets were gathered from several databases and split into training and test datasets. The raw data were RGB video files, which were then processed into 3D animations of several (head) motions with random backgrounds. In conclusion, the proposed RNN delivered a generic end-to-end approach for head pose estimation and facial analysis in a dynamic setting. In addition, the results reported by Gu et al. indicated that their approach performed better than Bayesian filters (Gu et al. 2017) [2]. Karpathy et al. (2014) [14] compared spatiotemporal networks and strong feature-based methods to classify video data. The data provided to the algorithm were 2D images and frames, but no joint data. The authors observed significantly increased performance of their CNNs on the UCF-101 action recognition benchmark dataset of realistic action videos. This benchmark comprised 13,320 video clips, which were classified into 101 categories and five types (body motion, human–human interactions, human–object interactions, playing musical instruments, and sports). During their studies, they realized that there was an insufficient number of benchmark datasets. Hence, the authors collected a new Sports-1M dataset, which comprised one million YouTube videos belonging to a taxonomy of 487 sports classes. One specific topic of interest was different temporal connectivity patterns in CNNs, which provided an advantage by including local motion information in videos. The authors compared multiple CNN architectures and several approaches to the use of the time domain. The repurposing of low-level features learned from the Sports-1M dataset on the UCF-101 demonstrated a significantly better performance. Karpathy et al. (2014) [14] particularly mentioned the advantageous shift from feature design to the design of network connectivity and hyperparameter choices for CNNs. The annotation of the Sports-M1 dataset was performed by automatically assigning tags to each video by metadata analysis. Karpathy et al. (2014) [14] emphasized inconsistencies in datasets because videos of a specific tag may contain several diverse kinds of actions, such as interviews, crowds, and sports. Yang et al. (2016) [5] proposed a fully connected recurrent neural network (FC-RNN) to model long-term temporal information in video files. The model preserved generalizability through the properties of the pretrained networks. This was an advantage in fine-scale feature extraction, e.g., classifying guitar and violin playing. A robust boosting model was introduced to optimize the fusion of multiple layers in an FC-RNN. The proposed method outperformed the benchmark datasets UCF-101 and HMDB51, which provided large collections of realistic videos from different sources. Du et al. (2019) [15] proposed a CNN architecture for vision-based hand pose estimation using depth data. The proposed “CrossInfoNet” consisted of two branches, the palm pose estimation and the finger pose estimation subtasks. This CNN shared the benefits of both subtasks. By applying multitask learning, the proposed model generalized better. As the two branches, the palm and finger joint regression subtasks, were separated, there was noise of the finger features in the palm regression and noise of the palm features in the finger regression. In a multitask information-sharing network approach, both “noises” appeared to be beneficial. Hence, Du et al. (2019) [15] applied a cross-connection model to exploit the features. Lee et al. (2020) [16] used the proposed “CrossInfoNet” and an Azure Kinect sensor to create real-time control functions for a tabletop holographic display based on hand gesture recognition. Because the tabletop holographic display requires complete darkness, only the depth data of the Azure Kinect device were available. On the one hand, the authors achieved a high-precision control mechanism for the holographic display. On the other hand, their mechanism failed to recognize gestures performed by extraordinarily small hands. The authors managed to reduce the false-positive rate by allowing a flexible adjustment of the threshold. A future goal is to develop detection and control systems for people with small hands (Lee et al. 2020) [16].
Garcia-Hernando et al. (2018) [17] proposed a combination of visual data collected using an Intel RealSense SR300 RGB-D camera and pose annotation using six magnetic sensors. The aim of this study was to create a dataset of 45 common daily hand actions with hand pose and action annotation in a realistic environment. The sensors were attached to each fingertip and the wrist and did not affect the depth image of the hand pose. During their experiments, they collected data from six right-handed subjects without further instructions on how to perform each of the 45 actions. This led to a realistic display of various speeds and styles of motion data. Each action was then labeled manually. As the main baseline for action recognition, the authors used a recurrent neural network with long–short term memory (LSTM) modules. For the hand pose estimation, they used the same CNN as proposed by Yuan et al. (2016) [18]. In comparison to the state-of-the-art approaches, the created dataset provided egocentric dynamic hand actions and poses that were more realistic and diverse (Garcia-Hernando et al. 2018) [17].

3.3. Validity and Performance of Microsoft Kinect Cameras

In this subsection, we discuss specific aspects of using different versions of Microsoft Kinect cameras in connection with movement and gesture analysis. We also point out the observed research gap.
In their work, Albert et al. (2020) [9] used the 2019 Azure Kinect device launched by Microsoft to investigate the accuracy of gait assessment on a treadmill. For the experiments, five young and healthy subjects walked on a treadmill at three different velocities while recording the data simultaneously. Spatiotemporal gait features were described in this study, which included step length, step time, and step width. The results were compared against the gold standard Vicon 3D camera system, which relies on markers attached to significant body parts. The results showed that the Azure Kinect device achieved higher accuracy than its predecessor. However, there was no recommendation regarding which ML approach could enhance results. Interestingly, the results demonstrated that the predecessor of Kinect v2 performed better when tracking the upper body region. Nevertheless, for spatiotemporal accuracy, the tracking error of Azure Kinect was only 11.5 mm. However, no significant accuracy differences were found between the two cameras for temporal gait parameters (Albert et al. 2020) [9]. Another study considering the range of motion of patients was presented by Gao et al. (2021) [1]. In their paper, the authors particularly emphasized the time-consuming and inefficient way of measuring the range of motion in the manual and traditional way using a goniometer. Hence, working with an Azure Kinect depth camera automates not only the ROM evaluation but also the collection and processing of data. Accordingly, applying a virtual ROM estimation approach reduces the time spent on office work; however, it may also increase accuracy. The other advantages mentioned were the increase in patient comfort, reduced need for medical staff, and time saved by rehabilitation physicians (Gao et al. 2021) [1]. The range of motion measurement results of the Microsoft Kinect version 2 (v2) camera did not differ significantly from marker-based approaches. In their publication about musculoskeletal models driven by Microsoft Kinect v2 Sensor data, Skals et al. (2017) [19] found comparable results for the markerless approach compared to a marker-based approach for the vertical ground reaction force—the force exerted on pressure plates during exercises. Additionally, the ROM results did not differ significantly. However, for lower limbs, the markerless approach resulted in larger standard deviations. The experiments were performed in a standardized way and captured by two Kinect v2 cameras. Skals et al. (2017) [19] emphasized the limitation of their results for upper limb assessment since the model for lower limbs and more complex exercises with higher velocity showed inferior performance. According to Tölgyessy et al. (2021) [20], the most recent version of Microsoft Azure Kinect performed well compared to prior versions. The authors focused on the comparison of the predecessors of Azure Kinect cameras, namely, Kinect v1 and Kinect v2. Their paper aimed to judge the precision (repeatability), accuracy, and depth noise of the reflectivity of 18 different materials, as well as the performance in both indoor and outdoor environments. While performing extensive experiments under different conditions in the outdoor setting, the authors concluded that the Azure Kinect camera performed well in indoor settings but could not always produce reliable results in outdoor settings due to the time-of-flight (ToF) technology used to measure distances. Tölgyessy et al. (2021) [20] confirmed the officially stated values of the standard deviation of ≤17 mm and a distance error of <11 mm in up to 3.5 m distance from the sensor. In addition, they recommended a warmup time for Azure Kinect to provide reliable tracking results. Since the Kinect v2 and Azure Kinect cameras both work on the same ToF measurement principle, both cameras have the highest noise rates in terms of depth accuracy on the sides of the gathered images. They describe the four different field modes of the Azure Kinect camera, each providing different results in the experiments. NFOV (narrow field of view depth mode) unbinned/binned is ideally used for scenes with smaller extents in the x and y dimensions, but larger extents in the z dimension, and WFOV (wide field-of-view depth mode) unbinned/binned is used for large x and y extents but smaller z ranges. In addition, the standard deviations of each camera version were compared. The results showed improvements for all tested distances, ranging from 1.907 mm for Kinect v1 to 0.6132 mm for Azure Kinect at the closest distance, as well as 10.9928 mm for Kinect v1 to 0.9776 mm for Azure Kinect at the farthest distance tested (Tölgyessy et al. 2021) [20]. Another finding by Tölgyessy et al. (2021) [20] is the influence of different material textures on the distance error: fuzzy, porous, or partially transparent textures increase the measuring error. Breedon et al. (2016) [21] reviewed the capabilities of Microsoft Kinect v2 and Kinect v1 cameras as low-cost approaches for objectively assessing clinical outcomes and their utility in clinical trials. They addressed the problem of subjective investigator ratings, which could not sensitively detect small improvements. In addition, inter- and intra-investigator variability was addressed. In this study, different Microsoft Kinect camera approaches were explored as objective measurements and sensitive methods for movement and mobility detection. The primary measures of gait and balance, upper extremity movements, and facial analysis were explored. The authors concluded that exergaming approaches, including low-cost sensor solutions, offer significant value for rehabilitation and drug development. On the one hand, they emphasized the advantage of gross spatial movement data collection with cameras. On the other hand, they pointed out regulatory acceptance, which would require a comprehensive assessment of the validity and clinical relevance of such approaches. Finally, Breedon et al. (2016) [21] provided an outlook for the future use of exergaming technology in pharmaceutical development to better understand treatment effects. In a more recent study by Bertram et al. (2023) [22], the Microsoft Azure Kinect technology was used for clinical measurements of motor functions, such as the quiet stance test to measure static postural control or a stand-up and sit-down test. The obtained results showed good-to-excellent accuracy (0.84 to 0.99) and were compared with those from a clinical reference standard multicamera motion capture system. However, the limitations of the suggested approach were similar to those observed with the predecessor technology. Another recent study (Abdelnour et al. 2024) [23] compared Azure Kinect and Kinect v2 for one specific movement (drop vertical jump) and found the new model not to be a reliable successor of the older camera version. However, another study (Ripic et al. 2022) [24] found that Azure Kinect provided higher accuracy compared to previous studies using Kinect v2 considering data from walking trials.
The current state of knowledge and research shows that sensors and cameras play an emerging role in (tele)rehabilitation and diagnostics, but they have bare potential for clinical trials. Nevertheless, none of the aforementioned studies compared different methods to classify postures or motions of the latest Kinect versions. Many proposed solutions work on a computer vision basis, which is limited in terms of joint tracking accuracy and comes with inconveniences such as background noise. Therefore, in the following sections, we assess which ML methods classify joint data most accurately based on the extracted joint coordinate data. For joint tracking accuracy, the current version of Microsoft Azure Kinect cameras was used, which has been proven to be one of the most accurate skeleton-tracking technologies (Albert et al. 2020) [9].

4. Methodology

Our identified research gap is the lack of studies comparing algorithms based on joint tracking or posture estimation from coordinates, i.e., not only based on computer vision. Our work addresses the topic of classification algorithms and compares several methods regarding performance on joint coordinate data, which are extracted from a Microsoft Azure Kinect camera. Motivated by practical needs, a design science research (DSR) approach was chosen. According to vom Brocke et al. (2020) [25], one of the most established DSR models was created by Peffers et al. (2007) [26]. The process applied in this study consists of multiple steps with several iterations to ensure sufficient robustness to the laid-out findings (see Figure 1).
The DSR process proposed by Peffers et al. [26] consists of six steps: identifying the problem and motivation, defining the objectives of a solution, designing and developing the artifact, demonstrating, evaluating, and communicating. After identifying the research gap, the objectives of a solution were given by the use case described in Section 1. The artifact was then designed in multiple iterations. In our case, several machine learning models such as decision trees, feedforward neural networks, and recurrent neural networks (see Section 6) were implemented for the considered data (see Section 5).
Subsequently, the model was designed and evaluated. Nevertheless, due to the lack of a benchmark dataset featuring 3D joint coordinate data, a general evaluation against other algorithms’ accuracy could not be performed. The following section explains how joint data were captured.

5. Data Capturing and Methods

This section explains the laboratory setup, the process of capturing training and validation data, the pre-processing, and the compared algorithms. The results of the classification algorithms are discussed in the Results section.
As the purpose of this study was to compare three classification algorithms, the captured data were limited to a reasonable amount. Prior research demonstrated that studies with usability characteristics do not necessarily require more than five testers (Nielsen 1989) [27]. For data diversity reasons, joint tracking of five volunteers was performed. Each participant performed two different exercises. All the participants were healthy males of average height and body structure. The physical conditions were not captured further. Additionally, each exercise was performed in a time frame of 20 s, which generated a file of 600 frames for each exercise and person. For the sake of simplicity, the first exercise involved a simple hand closure motion. To determine the applicability of the selected algorithm to more complex motions, the volunteers performed additional squat exercises that were captured separately.

5.1. Microsoft Azure Kinect Camera

We used the Azure Kinect developer kit (DK) (Microsoft, 2022) [28] with advanced artificial intelligence (AI) sensors in our study. It features sophisticated computer vision models and speech models, which were not considered in this study. The camera contains a depth sensor, an RGB camera, a gyroscope, an accelerometer, a spatial microphone array, and an orientation sensor.
As an all-in-one small device, the camera features multiple modes and options, which will not be further discussed here, as the default settings were applied to capture the 3D joint coordinate data. As a whole development environment, the DK consists of a sensor software development kit (SDK), a body tracking SDK for tracking gestures, and body and speech cognitive services. The Azure Kinect Sensor SDK provides access to device configurations and hardware settings. In the depth camera access, there are two view modes available: the wide and narrow fields of view. The depth camera applies the amplitude modulation continuous wave (AMCW) time-of-flight (ToF) principle, where the camera casts modulated illumination in the near-infrared (NIR) spectrum onto the scene. Then, it records the time taken for light to travel from the camera to the scene and back to the device. Body tracking is managed in the Azure Kinect body tracking SDK, which includes a Windows library to track bodies as 3D skeletons. Past research [29] provided valid joint tracking results using Microsoft Kinect cameras. Nevertheless, different camera versions exhibited significant differences in accuracy. With the selected settings, the camera captures 30 frames per second. Tölgyessy et al. (2021) [20] reported standard deviations of less than 1 mm depending on the range and view mode selected for the Azure Kinect camera. The camera-to-subject distance was fixed at 1500 mm during our experiments. Additionally, the camera angle was held constant during the joint capture phase. The camera performance was measured using systematic and random errors. It used an independent 3D coordinate system, where all points were represented in triplets of [X, Y, Z] coordinates, with [0, 0, 0] being the focal point of the camera. All the coordinates captured after the focal point were oriented in a way that the positive X-axis pointed to the right, the positive Y-axis pointed downward, and the positive Z-axis pointed forward.
After capturing a sequence of 20 s, the system provided a JSON and a CSV file containing data for the 600 captured frames. These files included a frame ID, the number of bodies detected, system time, a body ID, a joint ID, position length, orientation, [X, Y, Z] coordinate data for each joint, and the confidence level of the capturing accuracy. Considering the framework of our study, the relevant features considered were the confidence level, joint ID, and the [X, Y, Z] coordinates of the joints. The confidence level served as a knock-out criterion for the training data. Confidence levels of poor accuracy most often occurred when a joint was not in the field of view of the camera.

5.2. Laboratory Setup

As stated in the previous section, the quality of the reference data obtained using a Microsoft Kinect camera is subject to multiple factors [20]. Hence, the data used in this work were captured with great care, e.g., using manual labeling of training data based on feature determinants to avoid any misclassification. Predefined conditions for the laboratory environment were established to maintain valid recording of the joint data. First, a space with the least distorting background was chosen as a laboratory environment to capture data without noise generation. Afterward, five healthy volunteers possessing diverse characteristics in stature, age, and gender were selected randomly. To avoid learning from false data, great care was taken to select healthy volunteers with a normal ROM. Next, to improve the data generalizability, the participants varied in terms of extremity range, size, gender, and age, which improved the variation of the dataset. The camera position, distance, and angle were held constant during data capture. Although one advantage of a device such as Azure Kinect is its mobility, all data were captured in the same office building.

5.3. Data Processing

This section discusses how data were handled and processed. First, the retrieved data were separated into the test, training, and validation datasets for analysis. The total number of data points (from exercises of the mentioned volunteers) for the squat exercise was 4218 and 7620 for the fist motion. This corresponds to 7620/4 = 1905 frames for hand movements, as four joint data points were considered per image, and 4218/6 = 703 frames for squat movements, which were based on 6 joint data points per image.
The algorithm was trained on 70% of the data, and the test data comprised a 30% portion of the total data points. In addition, a sample of 1000 frames was held back as validation data during algorithm training. Beforehand, labels were manually assigned to each frame of the recorded data, separating records into “fist” or “no fist (palm)” and “squat” or “no-squat.” In addition, the following features were created:
  • distance between two joints;
  • angles between joints; and
  • triangular area resulting from three joints.
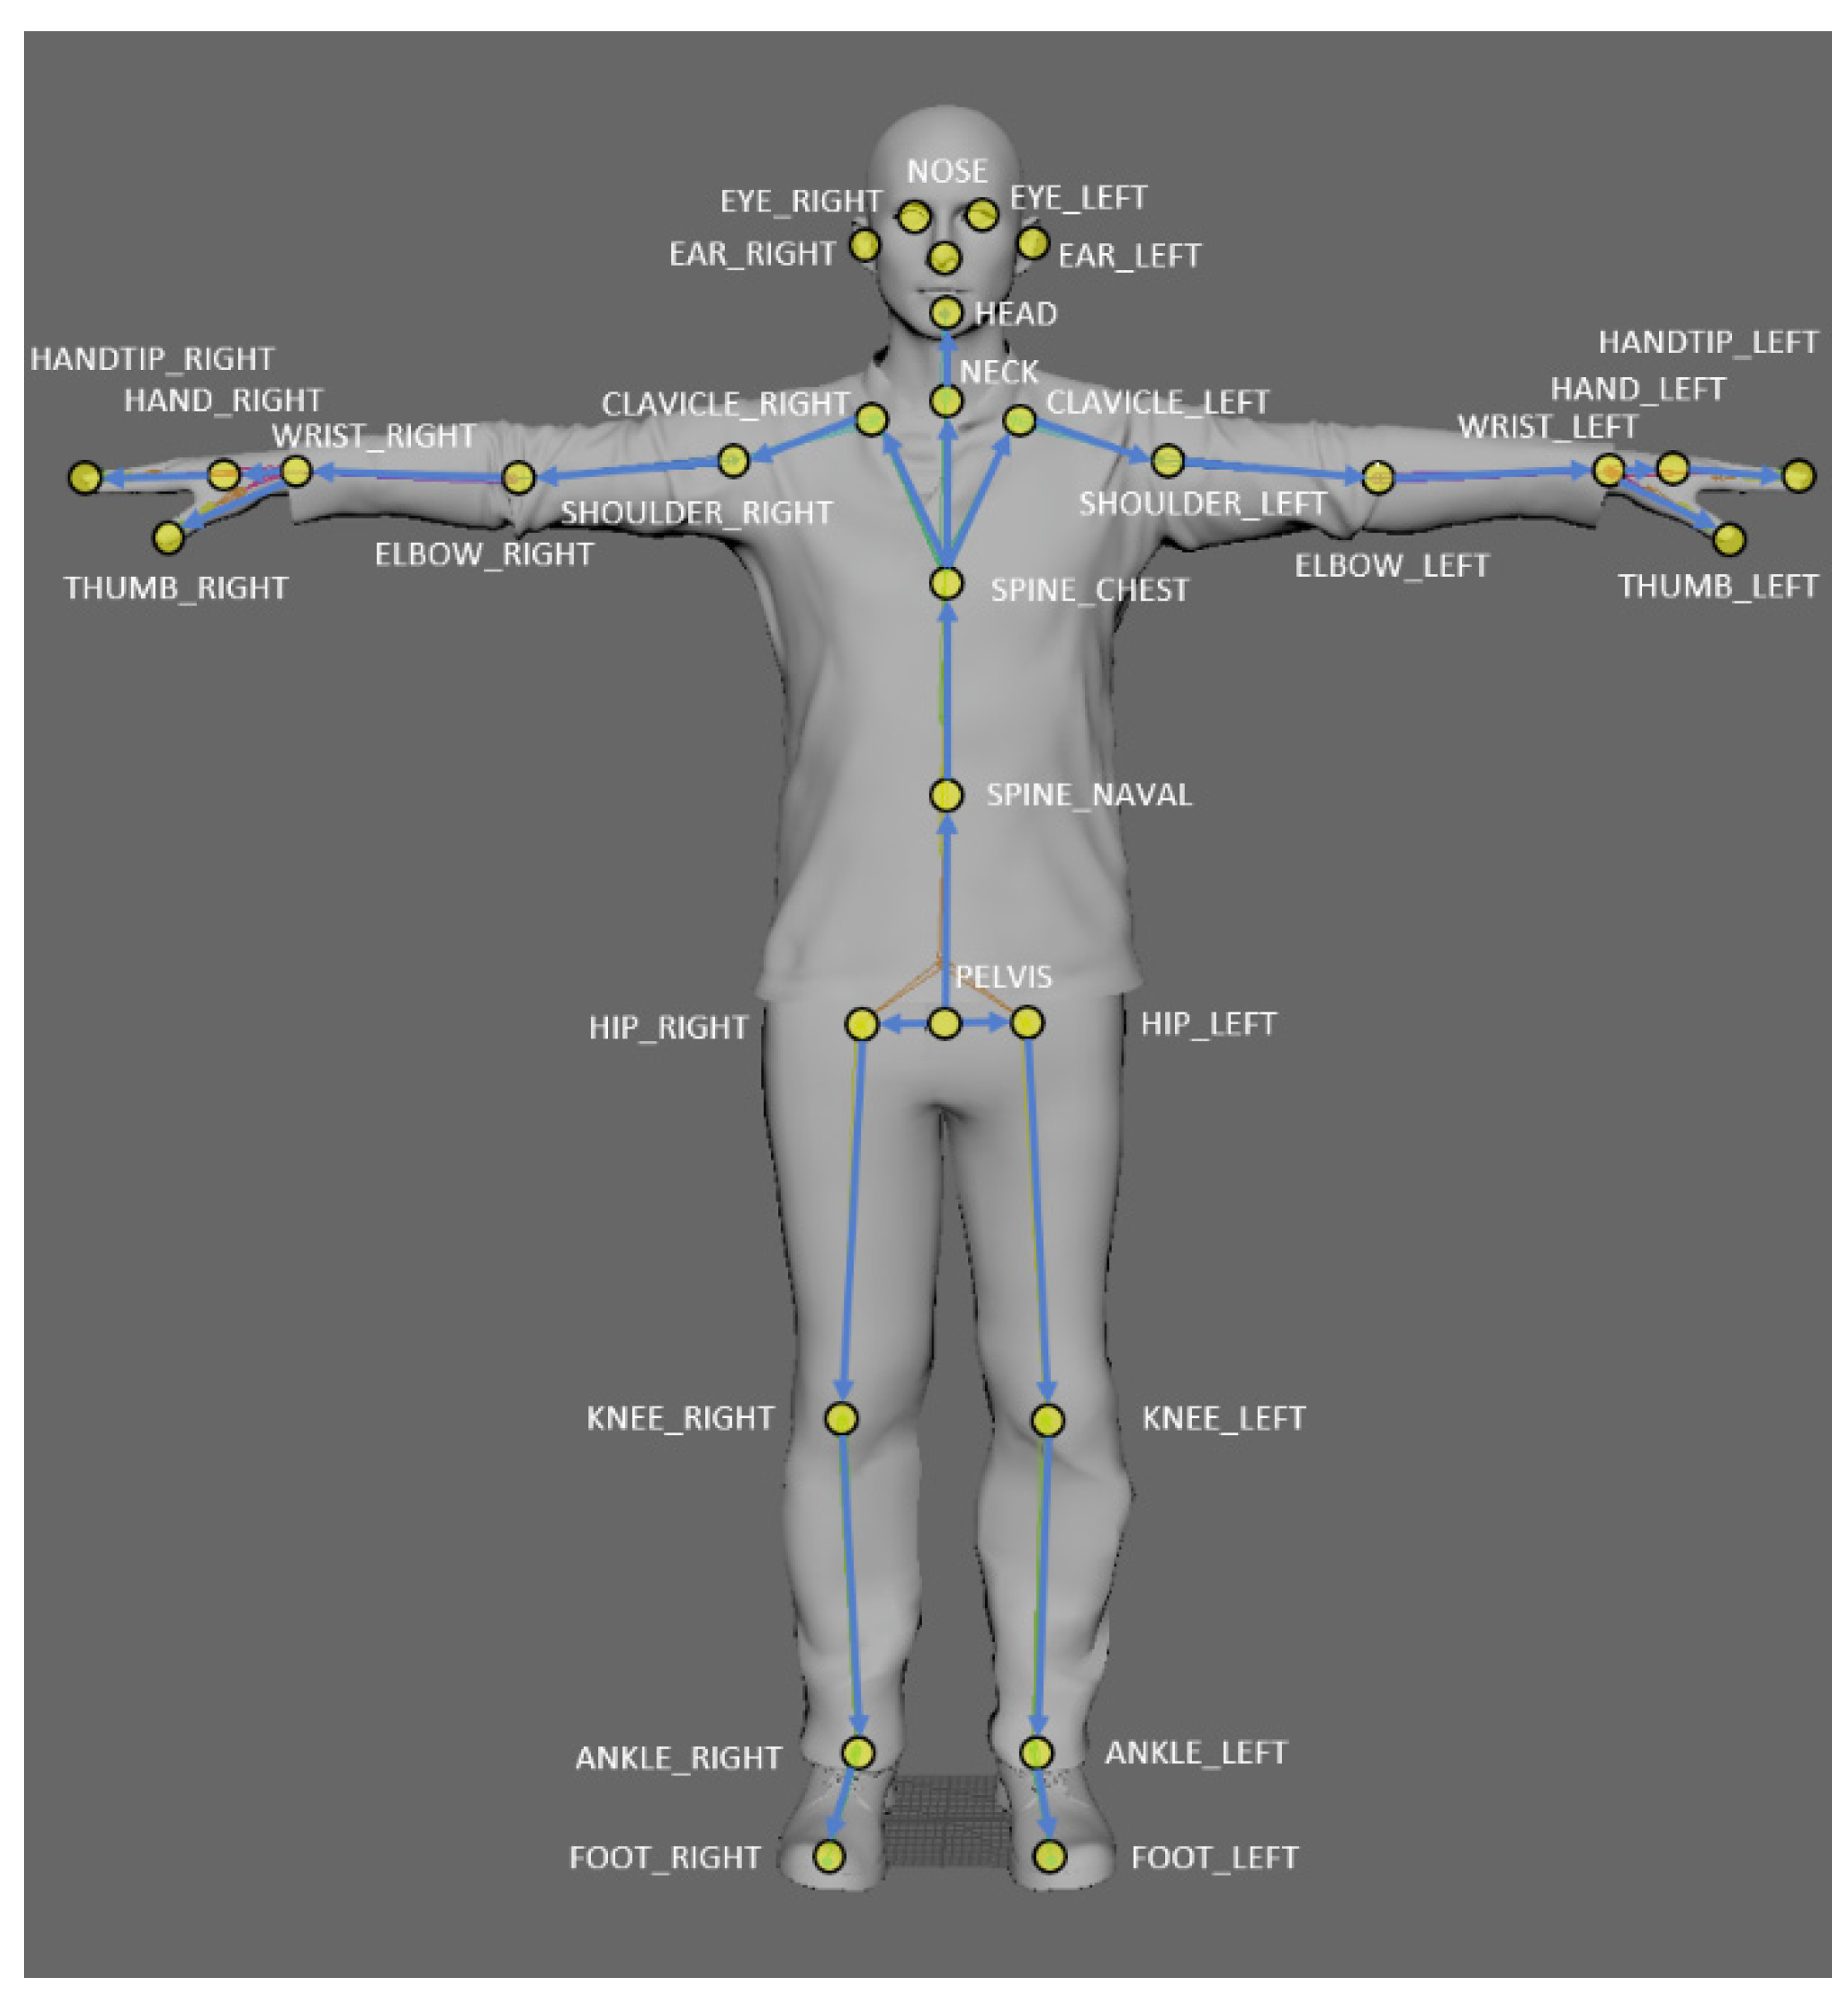
These features are important characteristics for measuring changes in the ROM, flexibility, or the accurate execution of an exercise [1]. The code for calculating these numeric features was programmed in Python 3.8.8, making use of the Pandas library and generic Python functions, and was applied to the data from each frame. Each subject’s recording was processed, labeled, and attached to the overall dataset of recordings, which was then separated into training, testing, and validation data during the analysis of the different algorithms. Labeling of the data was performed manually. Figure 2 shows the names of each joint that Azure assigned to joint IDs. The origin in the coordinate system was joint ID = 0, which was the pelvis for each tracking session.
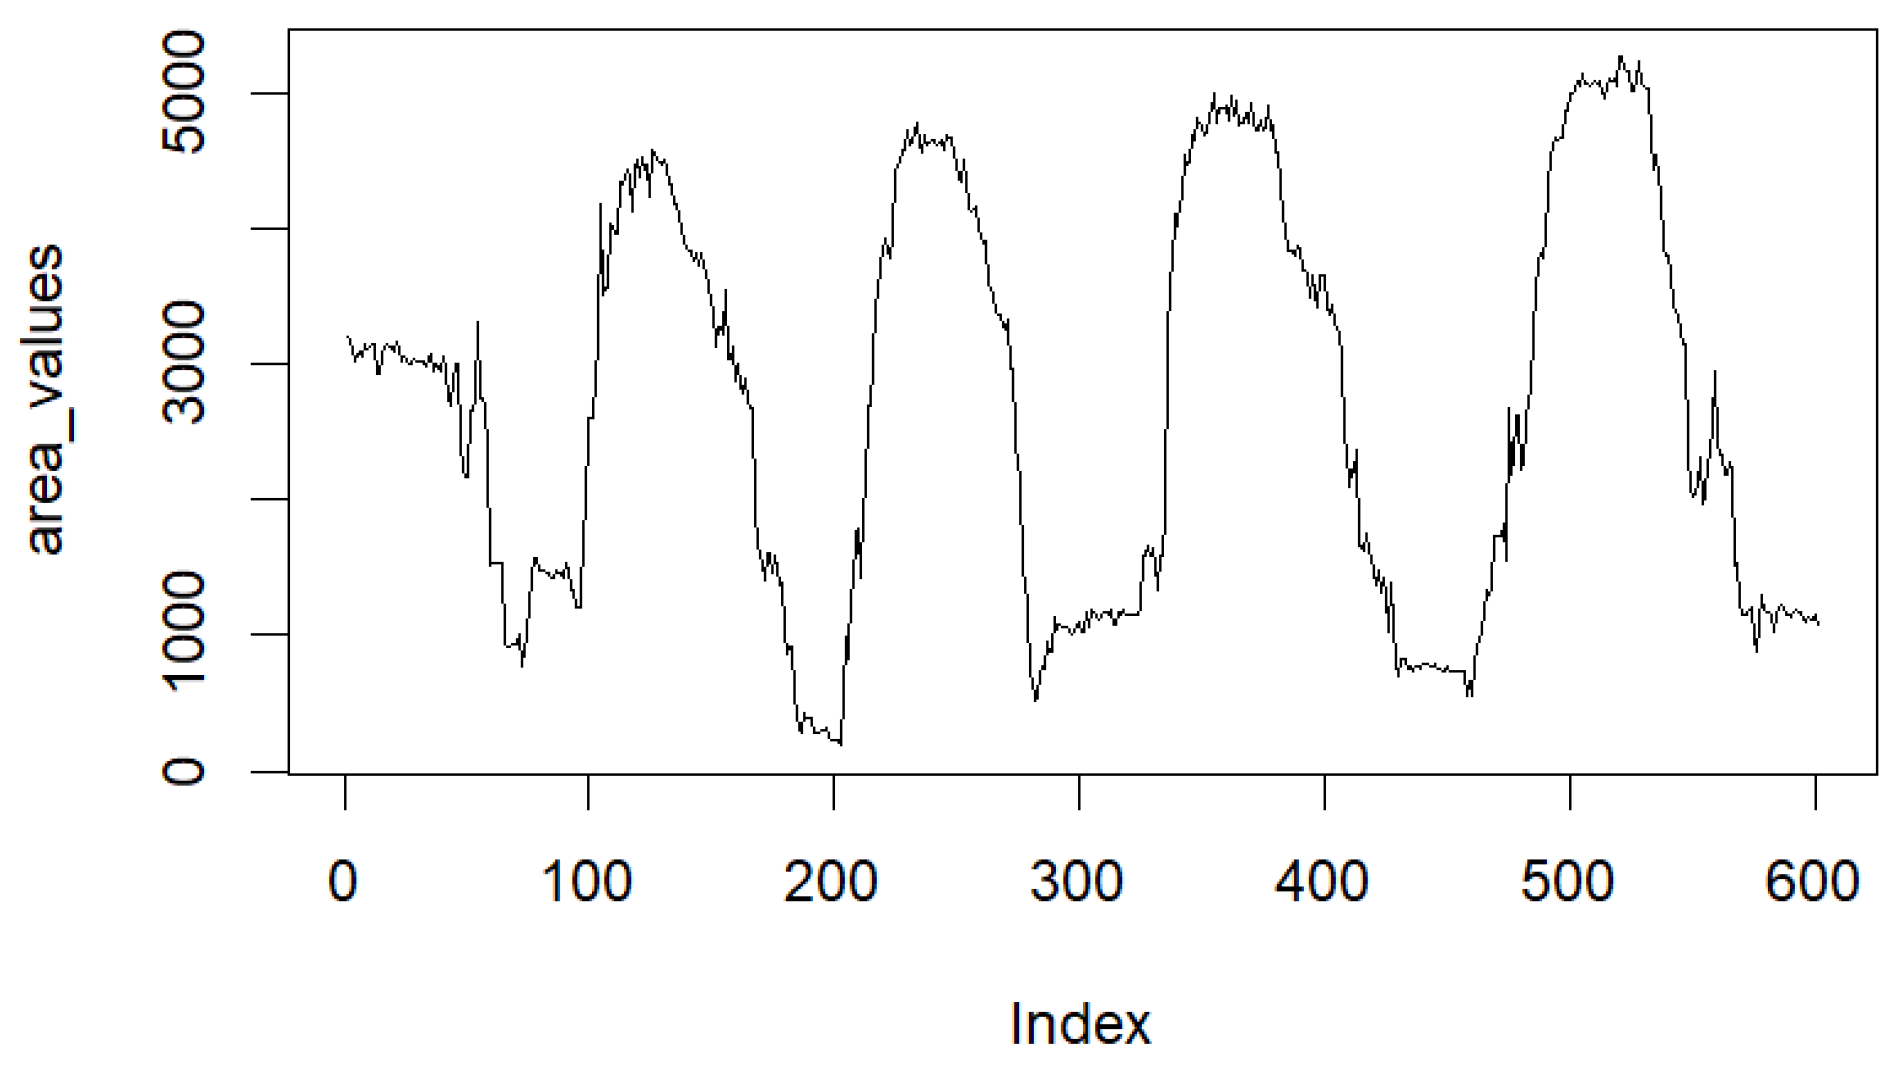
There were two main features that were taken into consideration to define the class labels in a frame-by-frame manner. First, the area feature described the size of the triangle resulting from three joints. Second, there was the distance feature between the hand tip and the wrist. The first experimental object examined was the right hand. The selected joints for the earlier introduced hand closure motion were HANDTIP_RIGHT, THUMB_RIGHT, and WRIST_RIGHT (see Figure 2). Figure 3 displays the frame-by-frame area of the triangle consisting of the HANDTIP_RIGHT, THUMB_RIGHT, and WRIST_RIGHT joint coordinates.
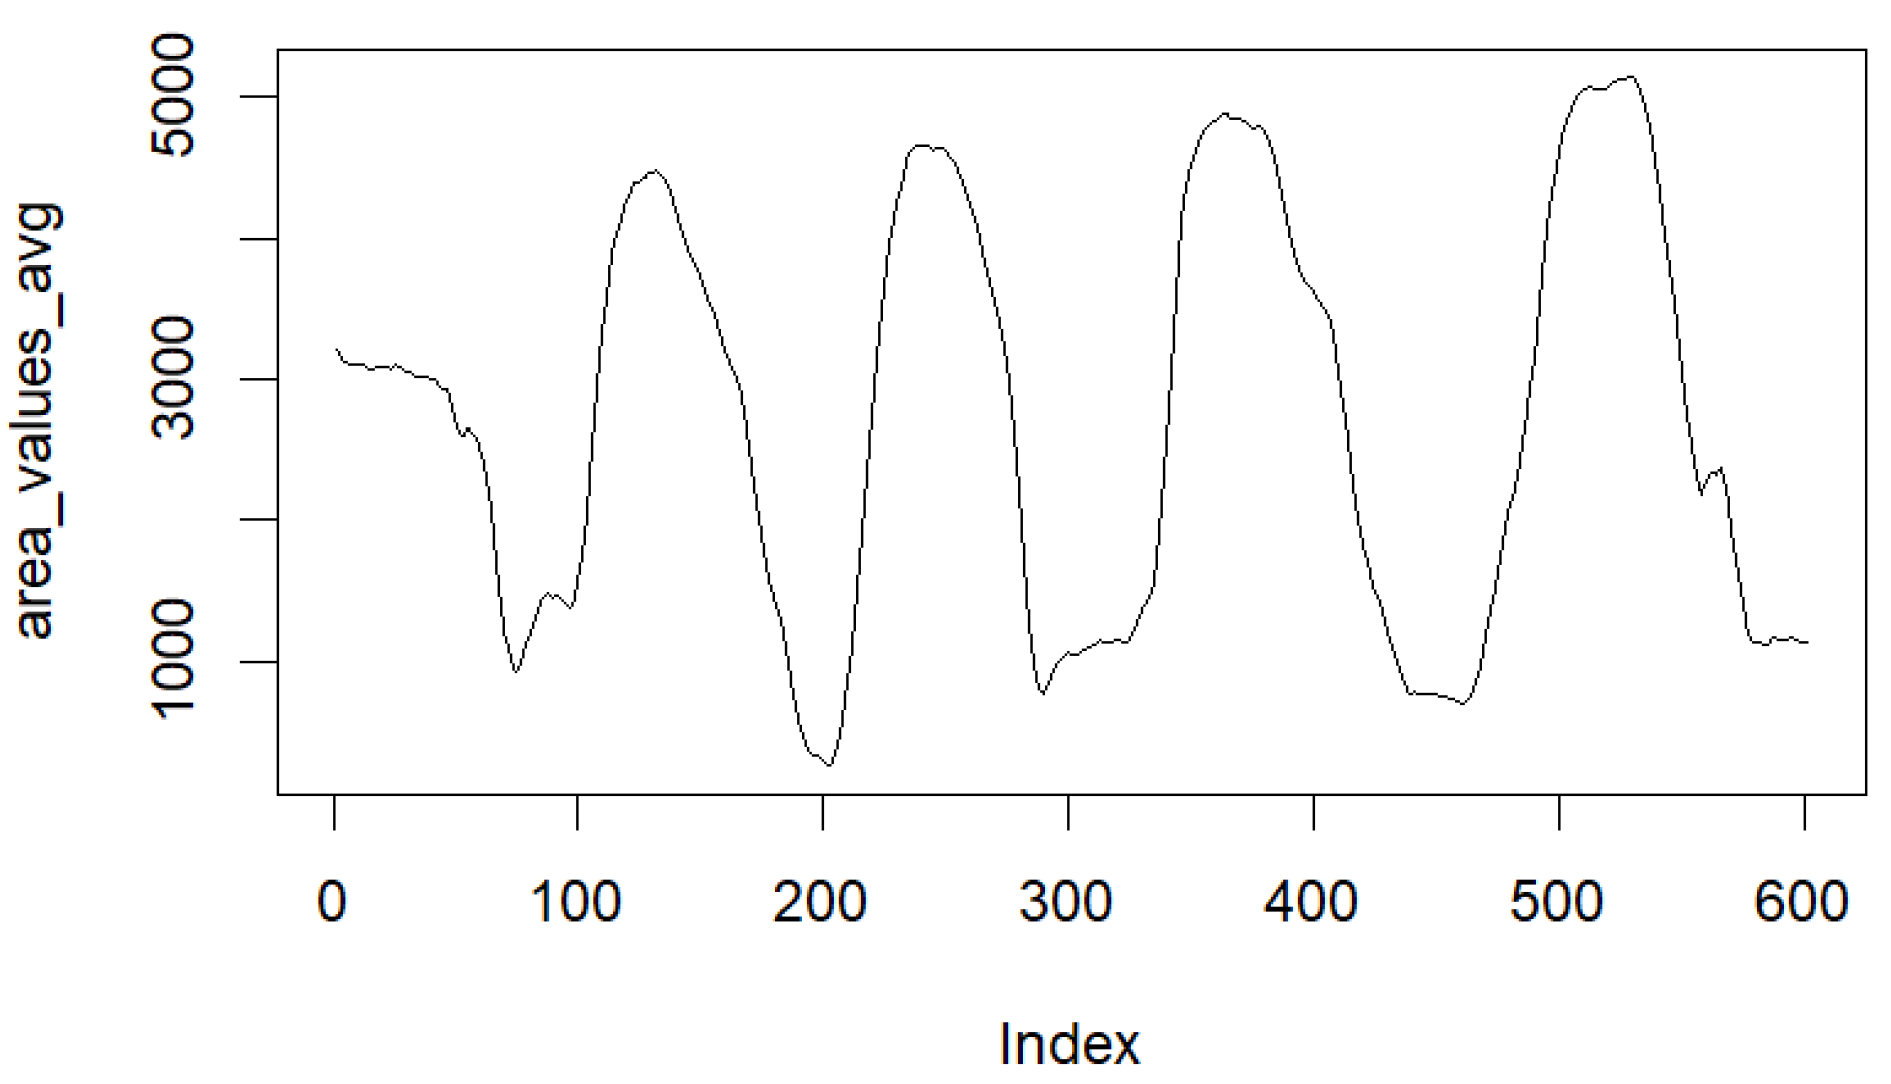
Then, a smoothing function was applied that took the average values of the area of the last ten frames into account to reduce the noise of the area data (see Figure 4).
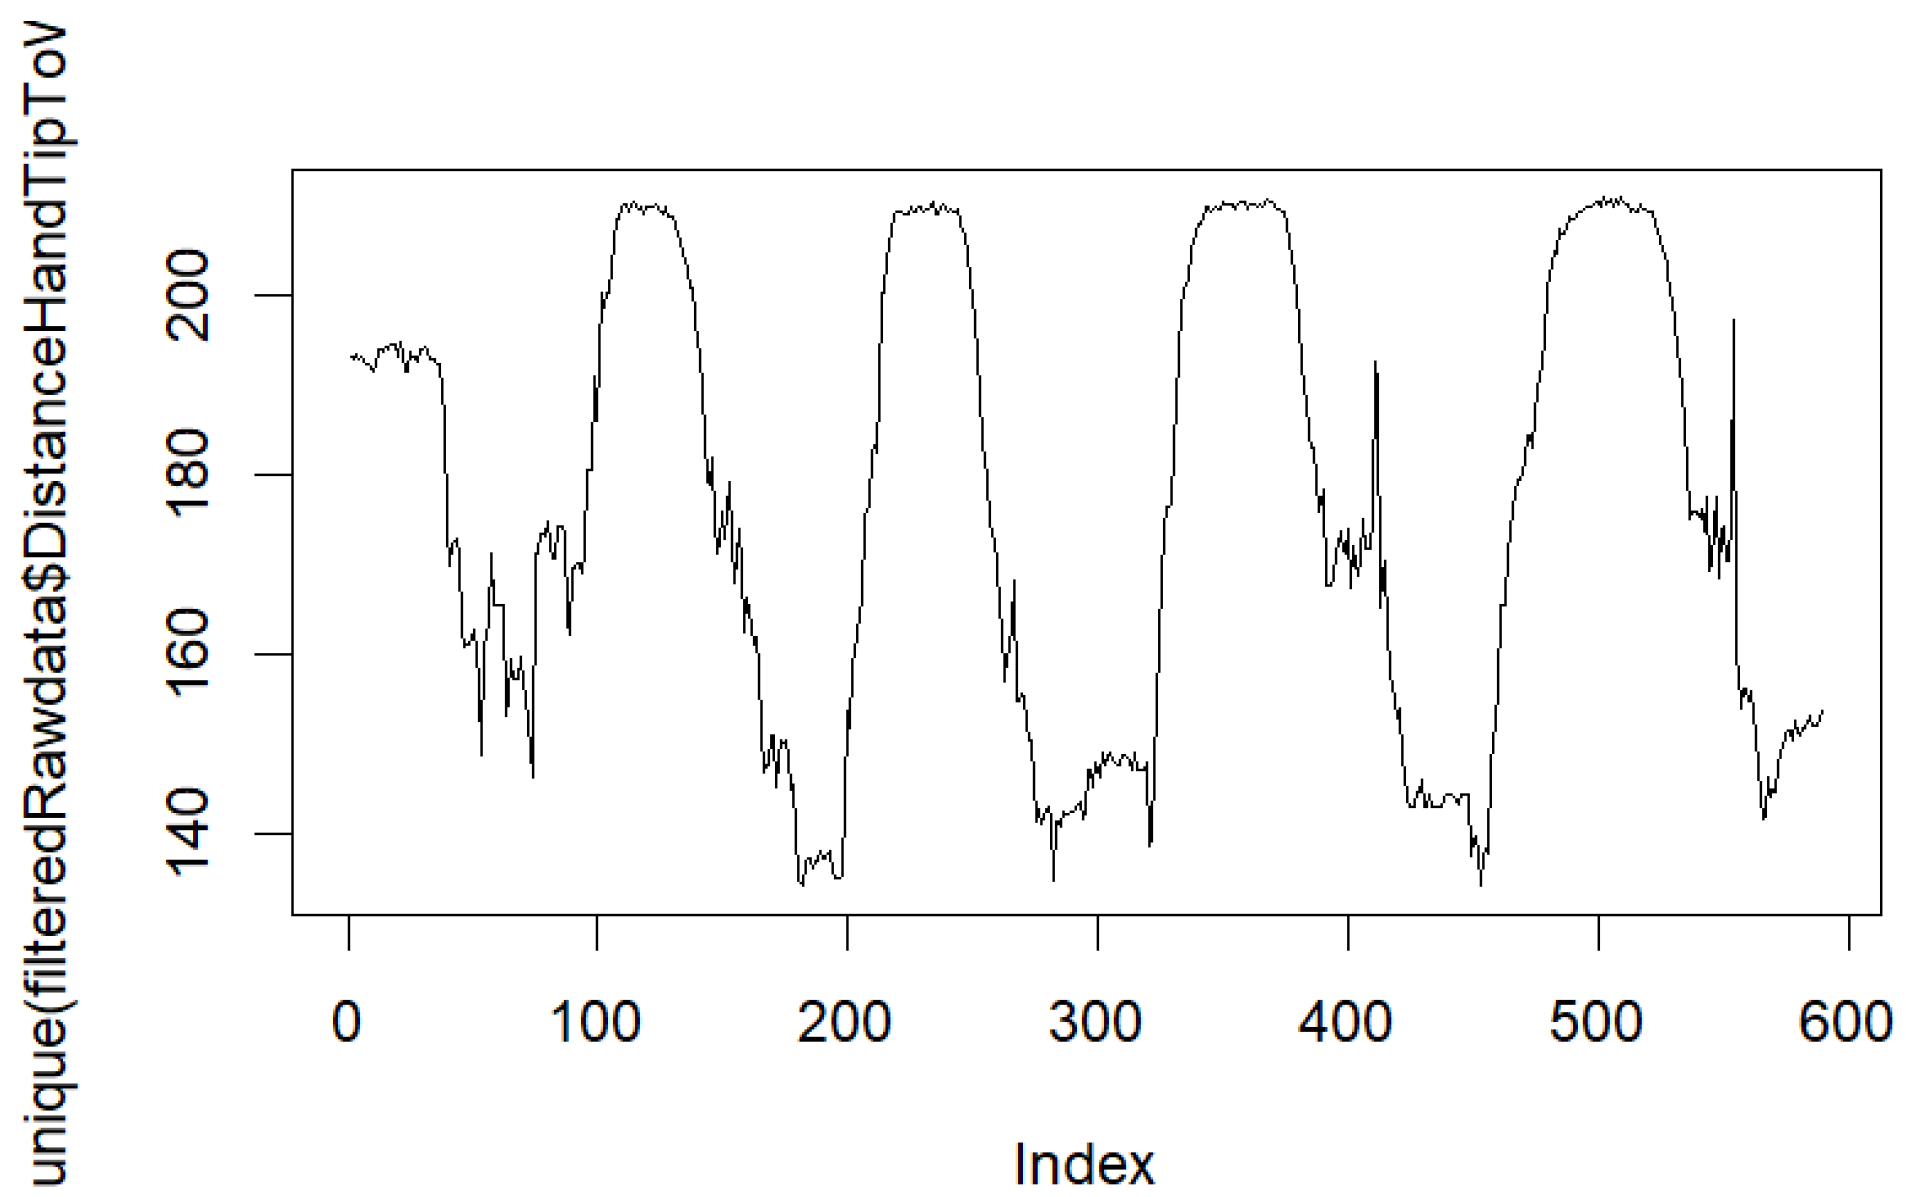
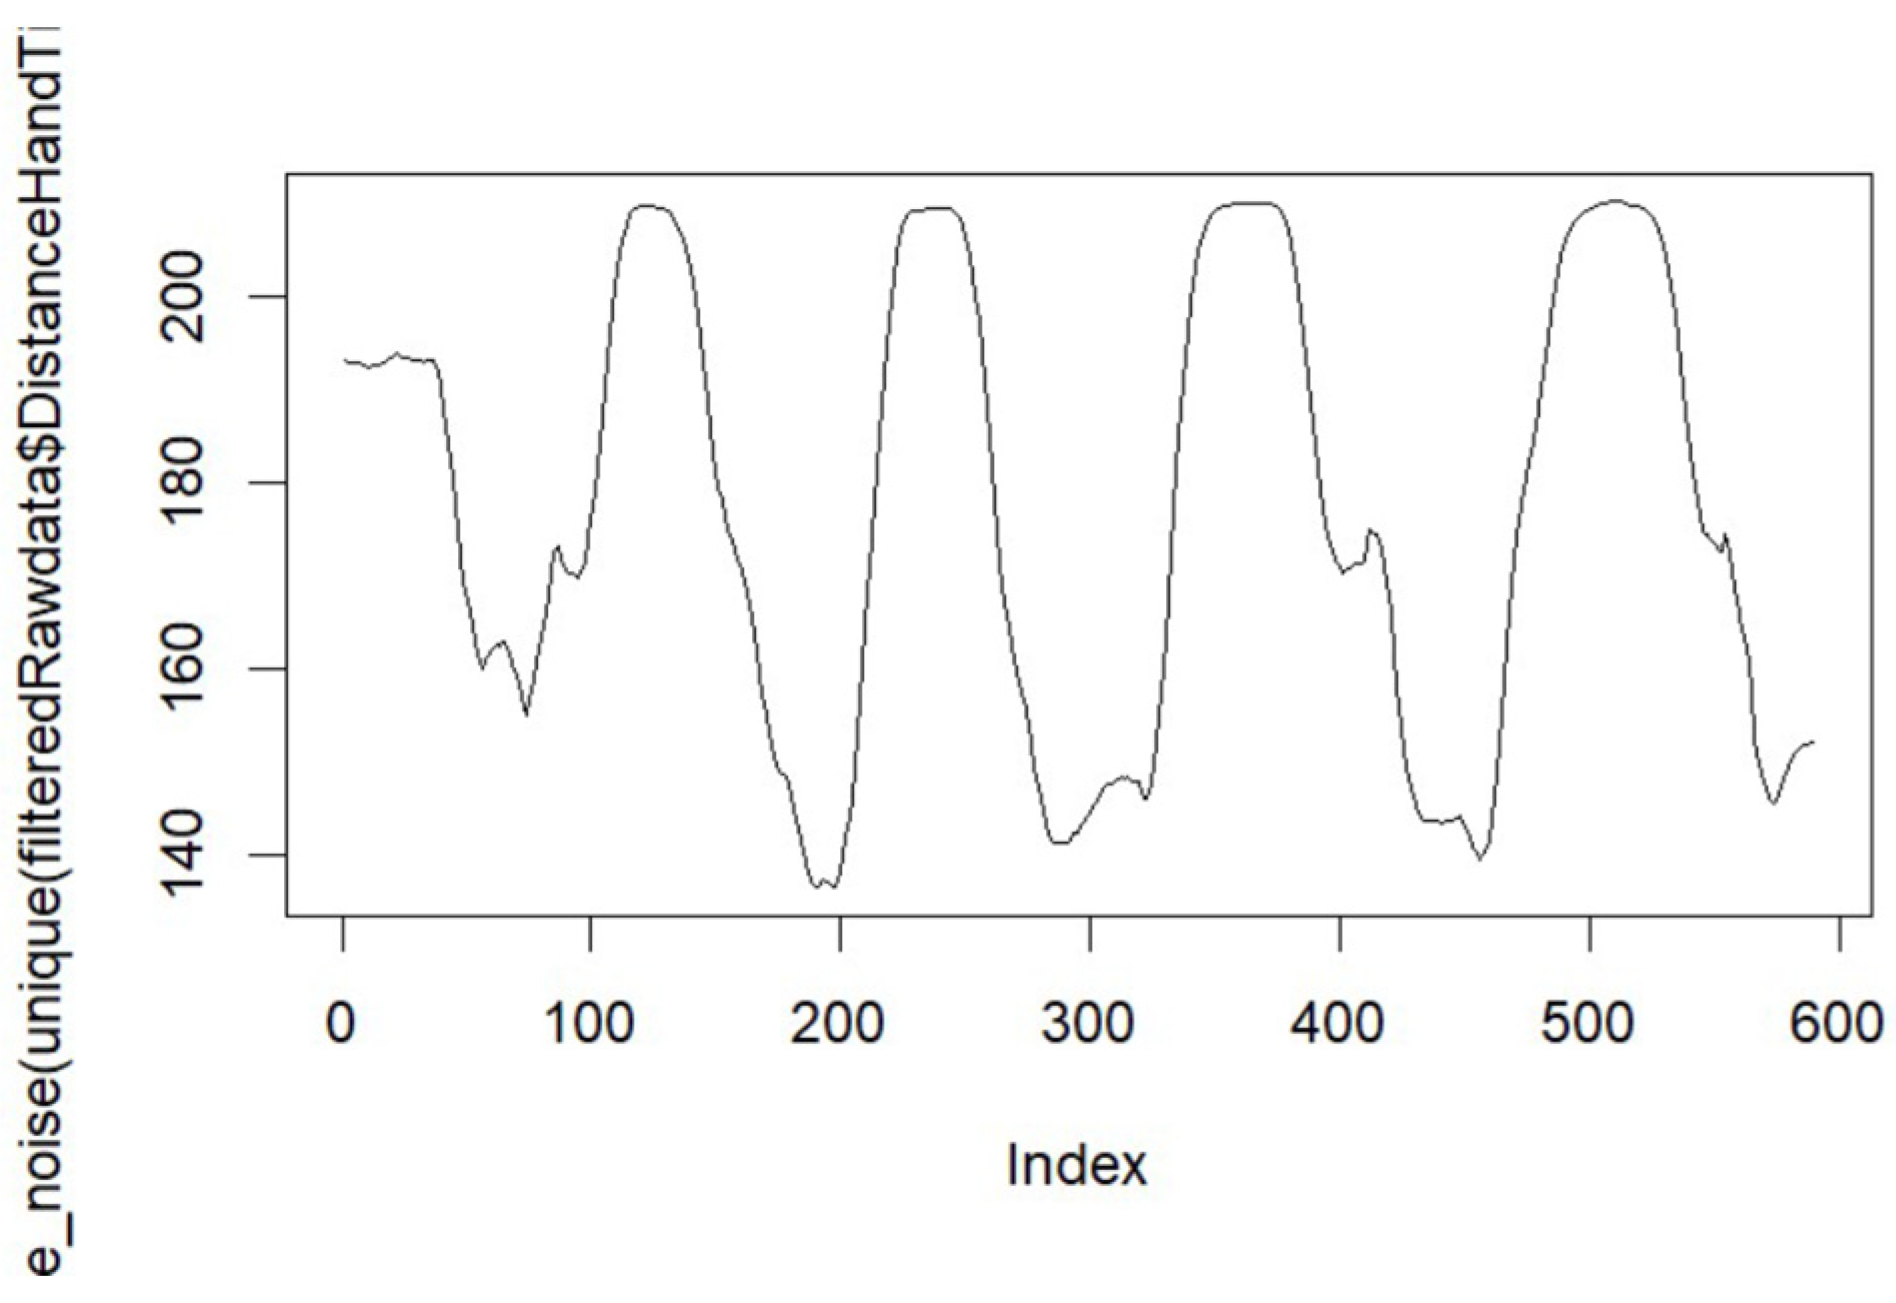
Further, the second selected feature to determine the class label of each frame was the distance between HANDTIP_RIGHT and WRIST_RIGHT, which was minimal for a fist and maximal for the flat palm state. Additional experiments demonstrated that the joint HAND_RIGHT did not show consistent tracking and was often lost during a capture session, which resulted in distorted data. Figure 5 displays the unsmoothed distance data between HANDTIP_RIGHT and WRIST_RIGHT in millimeters.
Similarly to the area feature in Figure 4, a smoothing function was applied in Figure 6 to reduce the noise of the data by taking the average distance of the last ten frames into account.
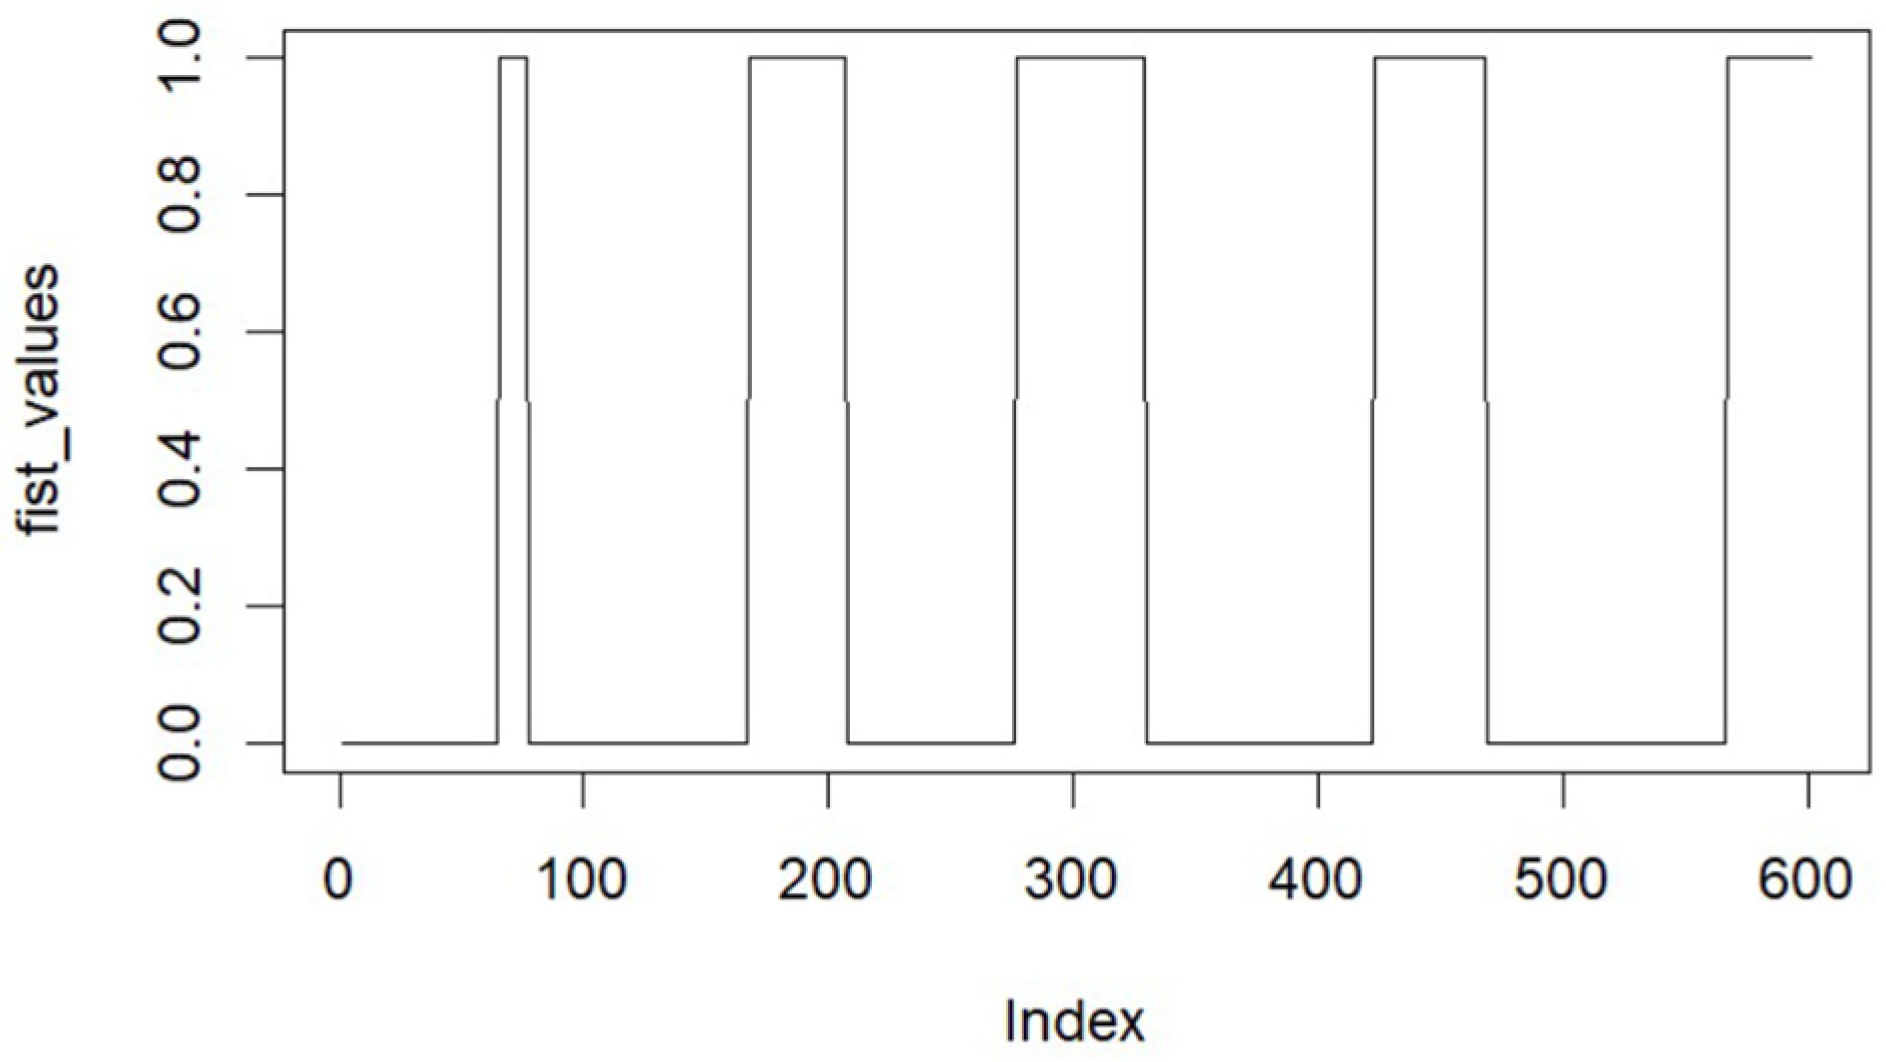
As described previously, both relevant features—area and distance (4 features in total)—were created. Subsequently, binary values were assigned to each frame of the training set by selecting the maximum and minimum values of the area and distance functions, where a fist = 1 and no fist (palm) = 0 (see Figure 7). The designated thresholds were observed in the distance and area feature data.
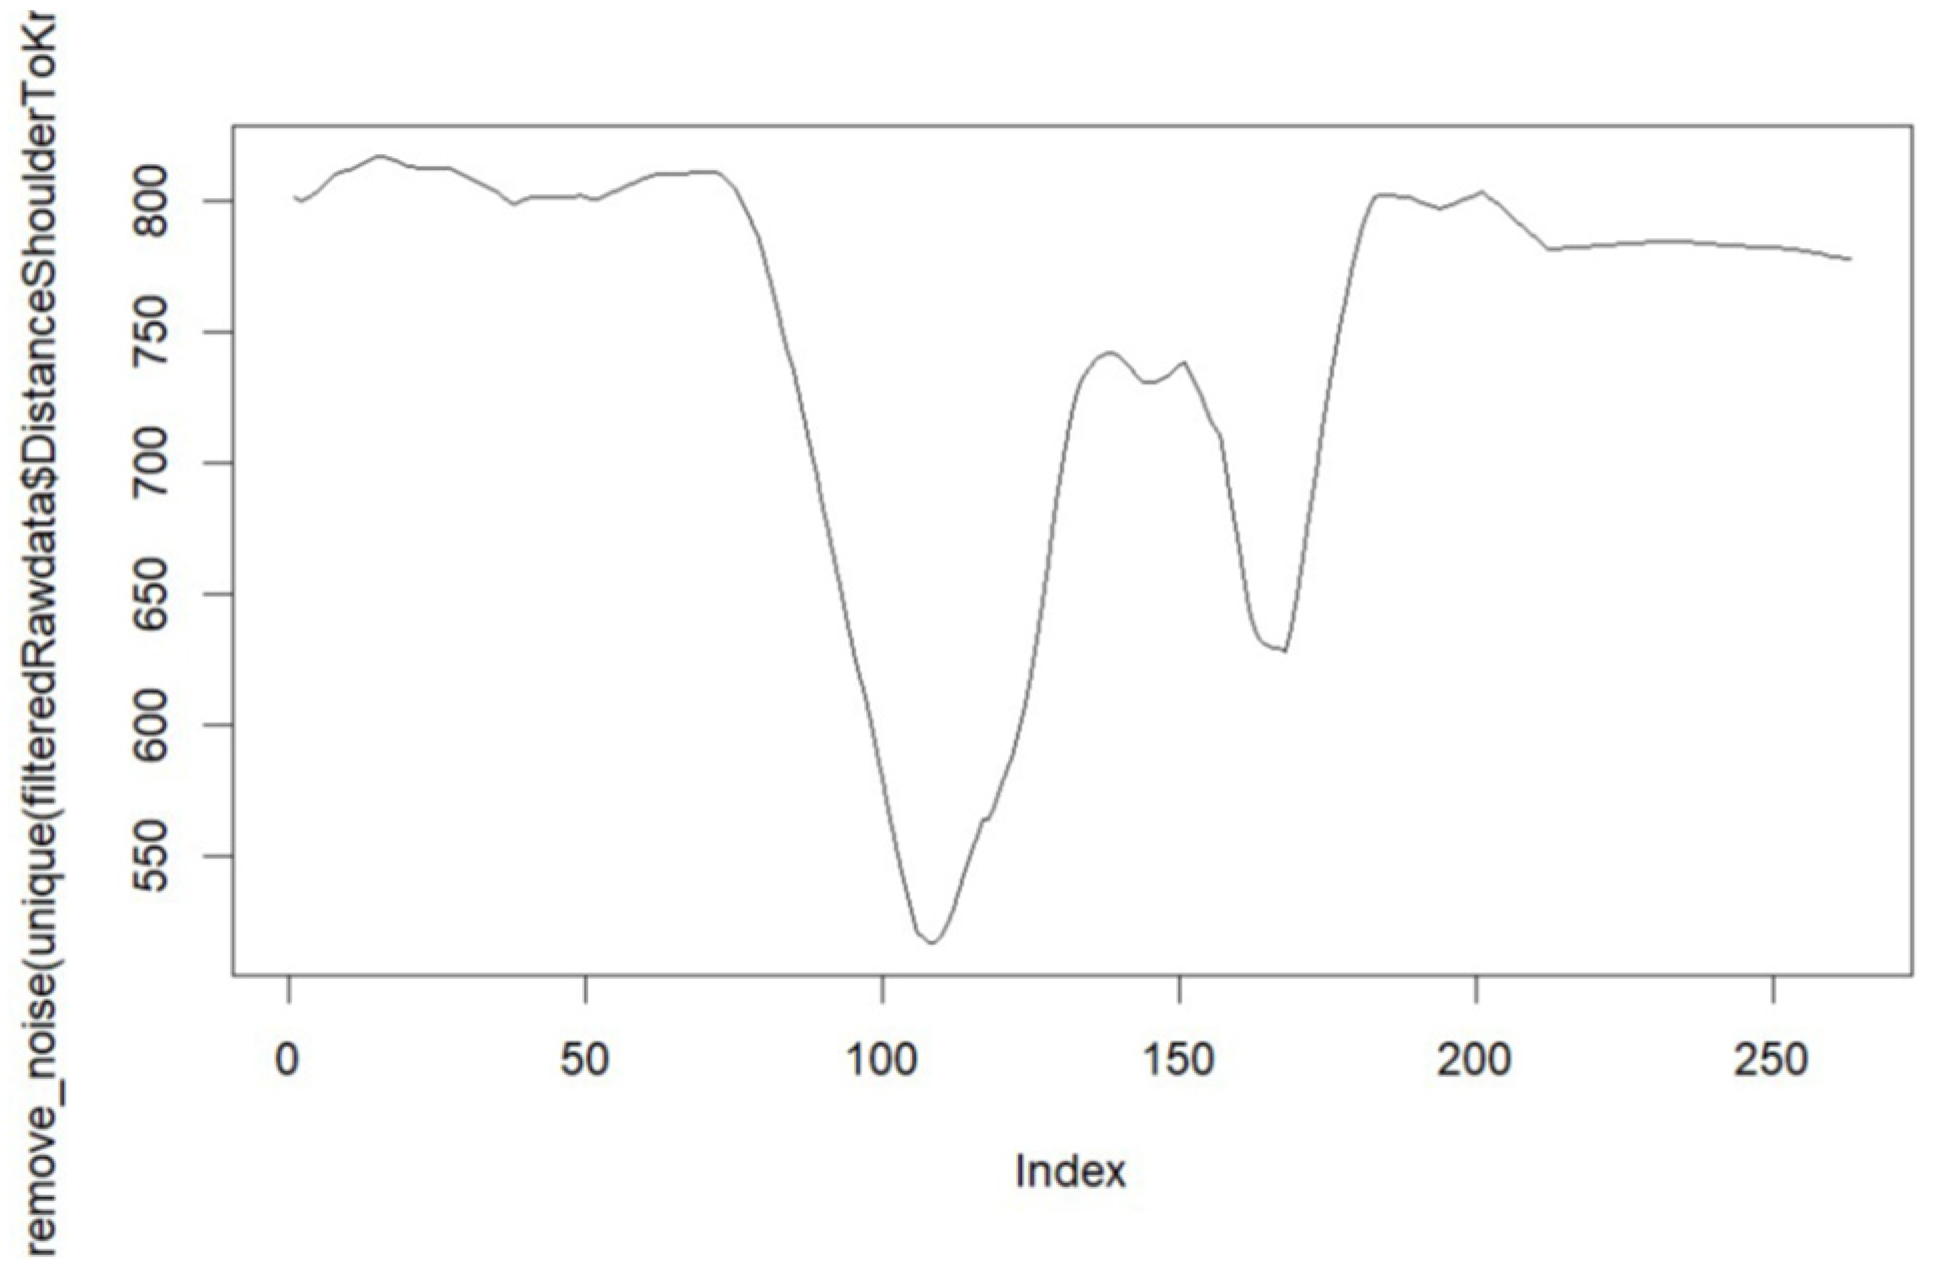
As mentioned above, a more complex motion was selected for the second gesture recognition exercise. The joints HIP_RIGHT, KNEE_RIGHT, and ANKLE_RIGHT, as well as HANDTIP_RIGHT, ELBOW_RIGHT, and SHOULDER_RIGHT determined the execution of a correct squat. For comparability, both hands were always placed on top of the shoulders when executing a correct squat. If not, the squat was to be classified as incorrect. Another determinant to label the squat data was the distance between SHOULDER_RIGHT and KNEE_RIGHT, which was minimal when the deepest position of the squat is reached. As shown in Figure 8, the distance between the right shoulder and the right knee of the participant was approximately 90 cm in the standing position and 50 cm in the deepest position of the squat motion. The manual measurement of the distance was compared to the Kinect results. According to the literature review, there is a slight tolerance between the measurement and the actual value of the displayed distance. Nevertheless, this tolerance did not affect the next steps of this work.
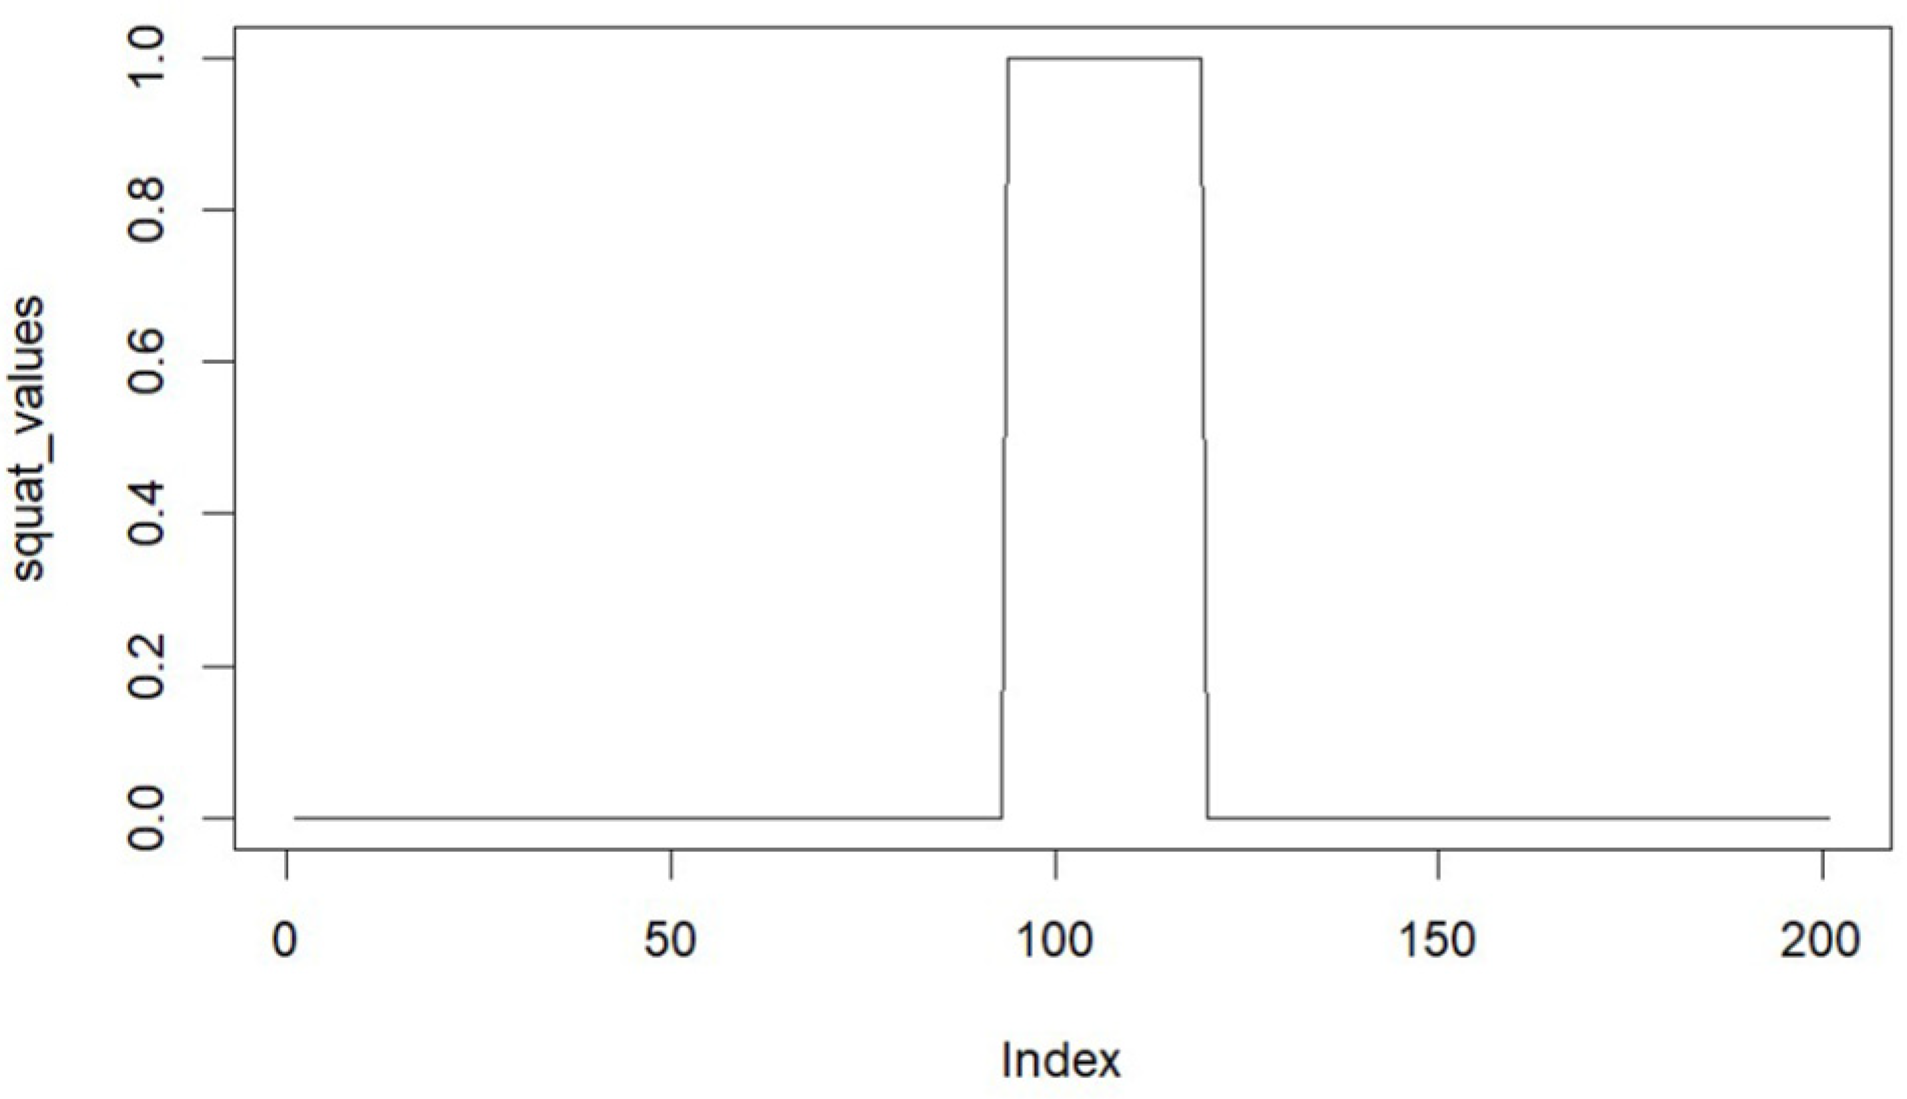
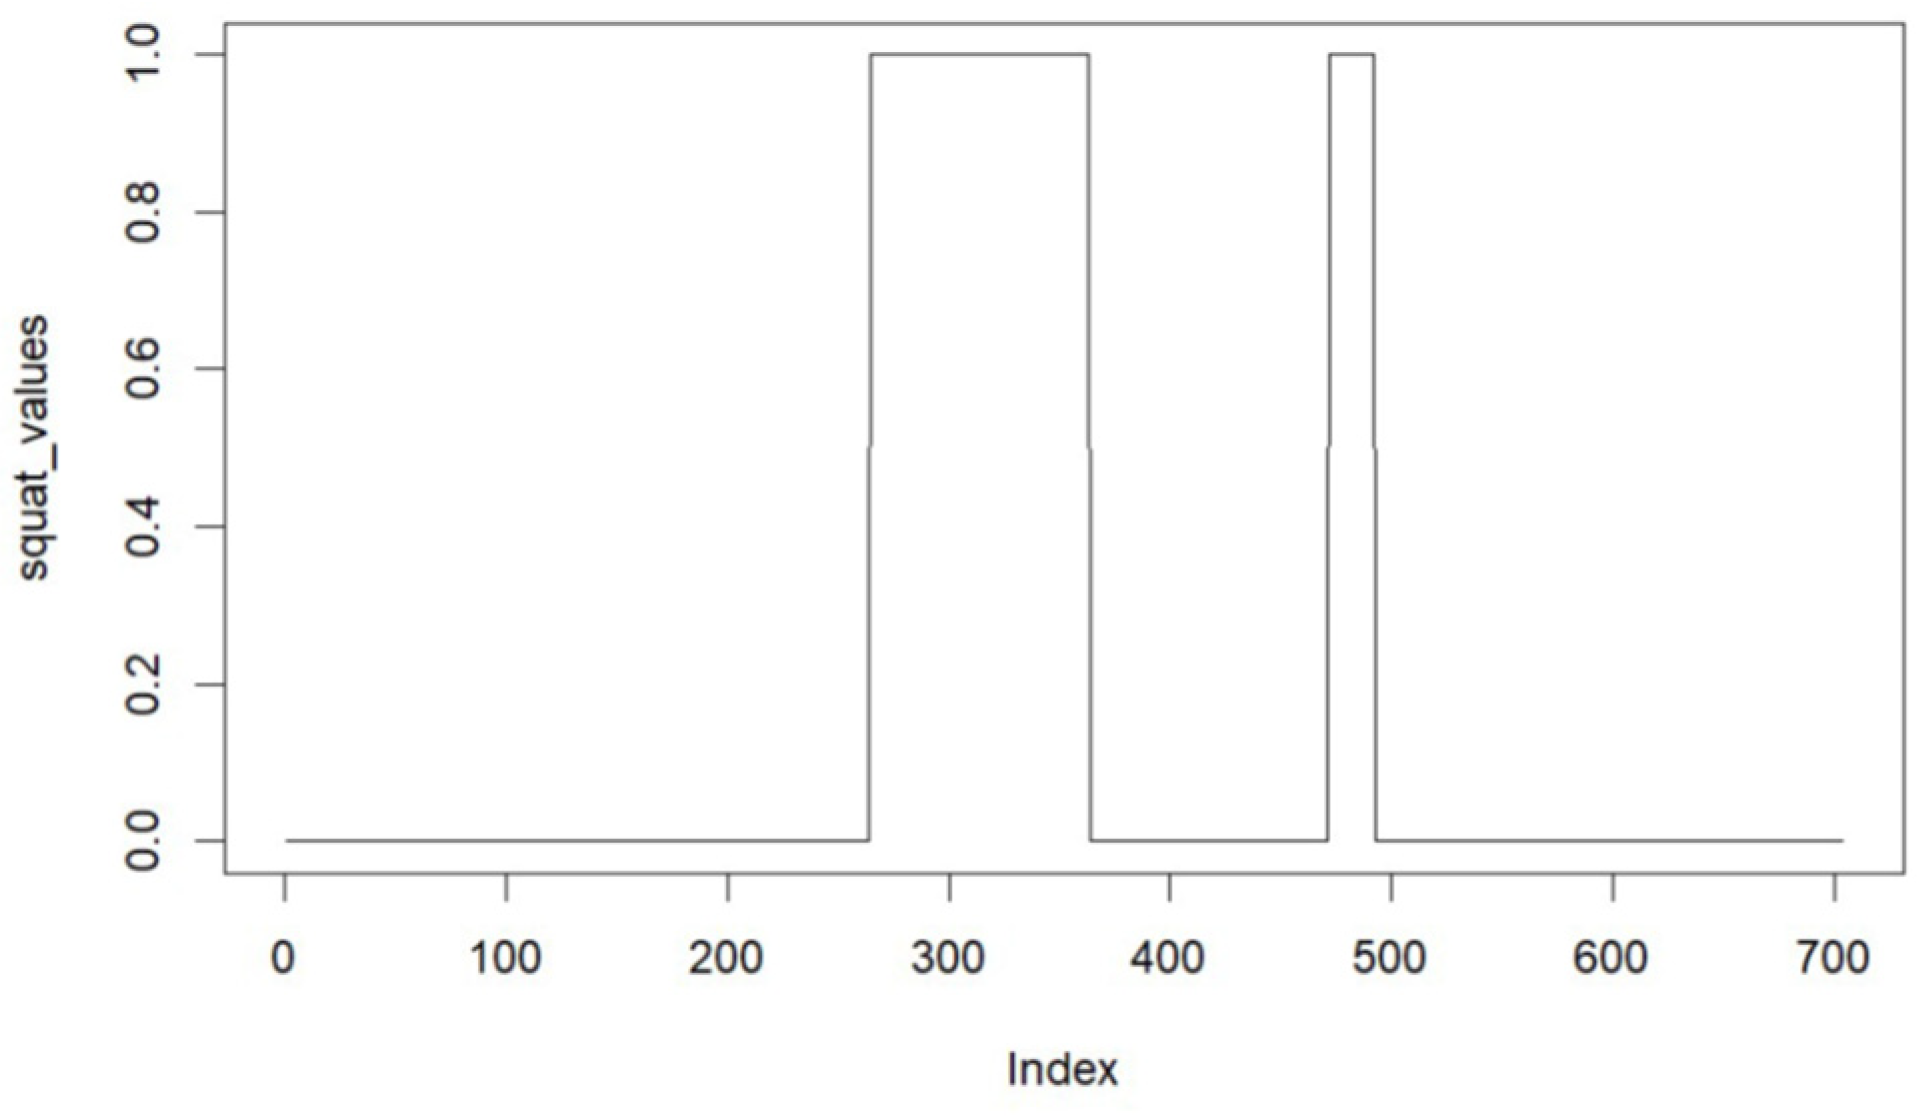
Figure 9 shows the binary labeling of each frame during a six-second recording, where squat = 1 and no squat = 0. The distance between SHOULDER_RIGHT and KNEE_RIGHT was selected as the first determining feature.
Moreover, the distance feature defined the threshold for the label of each frame, where a squat corresponded to 1 when the distance between the knee and the shoulder was less than 60 cm for this participant and no squat corresponded to 0 for a distance greater than or equal to 60 cm. Undoubtedly, this process of data labeling was very specific to each participant and depended on everyone’s body properties. Furthermore, differences in the ROM could be observed when investigating datasets from different participants. Figure 10 shows the distance between SHOULDER_RIGHT and KNEE_RIGHT for data from two different participants. As can be seen, the squat of the second participant was not as deep as that of the first participant, considering the distance between the shoulders and knees. Nonetheless, it was not possible to prove whether the reasons for this difference were different body properties, lack of the ROM, or tracking errors.
Figure 11 shows the resulting squat count when the same selection rules were applied as before. The selected number of frames included two squat motions with different durations spent in the deepest position. The second squat was performed faster than the first one.

6. Results of the Classification Algorithms

This section focuses on the results of the three algorithms and answers.

6.1. Decision Tree

For the first analysis of the data, a simple decision tree was used. The respective confusion matrices for hand and squat movement detection are shown in Table 1. The results demonstrated that the decision tree achieved a prediction accuracy of 99.39% on the hand training set (see Table 2). Surprisingly, the decision tree already predicted all classes correctly for the binary squat dataset. This result changed if more complexity was added to the input data. It appeared that the hand motion classification accuracy was lower because there were so many small data points next to each other that defined the class of the hand gesture.
The decision tree obtained very high precision and recall values, which generally proved the good performance of the method on the selected training data. Additionally, the area under the curve was 0.98 for the hand closure motion and 1 for the squat motion.

6.2. Feedforward Neural Network

In the second approach, 22 features were extracted from the dataset. A validation index was used based on 100 sample frames. A Keras sequential model was used to classify frame by frame as a feedforward neural network (NN). The input layer of the network was of size 22 due to the number of distinct features. As a result of experimentation, the hidden layer contained 64 neurons that balanced the model capacity and computational effort. The output layer had a size of one with the class FIST: TRUE/FALSE. Table 3 presents the confusion matrix of the predicted labels on the test data. As can be seen, the network predicted 425 true negatives, 220 true positives, zero false negatives, and 77 false positives. This resulted in a precision of 0.7407. The recall value was 1 because there were no recorded false-negative predictions. The F1-score was rather high (0.8510). The accuracy for the test data was 89.36%
As shown in Table 3, the first iteration of the classification model tended to predict some false positives for the hand closure motion. The accuracy for the test data was 89.34%, and the loss value was 203.21.
As shown in Table 4, the proposed algorithm obtained an accuracy of 86.26% for the squat motion training data. The results from this test run indicated that the validation loss decreased to almost zero after 20–25 epochs.
Table 5 presents the confusion matrix for squat motions classified by the feedforward NN. There were 864 true-negative, 166 true-positive, 9 false-negative, and 129 false-positive predictions on the test data. These values resulted in a rather low precision of 56.37% and a high recall of 94.86%. The F1-score was rather high, with a value of 0.7072. As observed in the classification of hand motion, the model tended to predict false positives. As a result, the accuracy for the test data was 88.18%.
In addition, the AUC ROC curve value of 0.521 was rather low, which accounted for higher chances of randomly misplaced values for binary classification. To validate these results, k-fold cross-validation was applied, which means that k validation datasets were presented to the NN model. The same NN model was trained during 10-fold cross-validation (CV), but the number of epochs was reduced to 10. The average of the 10 accuracy estimations was 88.17% for the hand motion, which was close to the observed 89.34% during the one-time classification. In addition, the accuracy resulting from 10-fold CV ranged between 84.83% and 91.18%. The resulting accuracy after 10-fold CV for the squat was 85.2%.

6.3. Recurrent Neural Network

As the last model, we applied a recurrent neural network. A Keras sequential model was selected with a parameter max_len = 30, which described the length of frames that were fed back to the algorithm. The max_len value was set to 30 because the camera captured images at 30 frames per second. Consequently, the model considered the input data of all frames in the last second for its prediction. The batch size was set to 32, and the number of epochs, which describes how many times the model looks at the dataset during training, was set to 10. The testing and training split was 70%. As a result, there were 5313 training objects and 2276 test objects. While training the model, 10% of the training data were retained for validation. Apart from this, the input layer used the parameters of the training data and the number of units based on max_len = 10. There was a single hidden layer with 30 nodes. The output layer featured the sigmoid activation function for binary classification and a single output node. The loss function used was the binary cross-entropy function. Coupled with the Adam optimizer and binary accuracy as the accuracy feature, these hyperparameters were used to train the first RNN model. The trained model had a loss of 0.012 and an accuracy of 0.9981. The validation accuracy was 0.9962 with a loss of 0.029 after 10 epochs.
The confusion matrix of the RNN model for hand motion classification (see Table 6) showed 1999 true-negative predictions and only 8 false-negative predictions. Besides 269 true-positive predictions, there were no false-positive predictions (FP) recorded. FP prediction plays a major role in exercising because FP feedback can lead to poor exercise execution or even injury to the patient. Nevertheless, the small number of misclassifications led to a precision of 1 and a recall of 0.9711. Consequently, the F1-score was rather high at 0.9853. The accuracy for the test data was 99.65%.
Specificity or the true-negative rate (TNR) was 1. Finally, the area under the curve (AUC) value was 0.9872, which is rather high; thus, the two groups were almost perfectly separated by their prediction scores. The same experiment was repeated for the squat motion (see Table 7). The RNN was set up in the same manner, with the same loss and activation functions, split between training and test sets, and temporal behavior features. The raw dataset contained 4218 frames. Consequently, there were 2931 observations in the training dataset and 1257 observations in the test dataset. The model was then trained on 10 epochs with the same number of 30 frames fed back to the model as before. As a result, the loss was 0.024, and the accuracy for the training data was 0.9966. In addition, the validation accuracy for the 10% validation split was almost 1 and the loss was almost 0. As shown in the confusion matrix (see Table 7), only one FP and one FN were classified. The precision and recall values were 0.9949. The F1-score was rather high at 0.9949.
The AUC of 0.9996 implies almost perfect separability between classes.

7. Discussion and Conclusions

This section discusses the results of the classification tasks presented in the previous section. The classification accuracy of hand motion on the test data was 91.77% in the decision tree, 89.36% in the NN approach, and 99.65% in the RNN approach. Similarly, the classification accuracy for the squat exercise was 100% for the decision tree, 88.18% for the NN, and 99.84% for the RNN approach. Accuracy of 100% for the decision tree was unexpected but could be explained by the algorithm predicting the majority class of the unevenly distributed dataset. Nevertheless, the decision tree, which followed decision rules similar to those used by humans, appeared to provide high accuracy for frame-by-frame classification. Of course, it was debatable whether this type of algorithm was valid because it classified frame-by-frame into motions that were performed fluently. Fist detection of the hand motion is a relatively simple exercise; however, squat detection turned out to be more complex. The RNN considered spatiotemporal properties; thus, classification improved by considering the motions in the frames before each frame. In this case, the upward and downward motions of the squatting person helped define whether a person was on their way down to a squat or was already standing up again. Additionally, the performance metrics displayed in the tables above prove that the chosen models performed well in classifying the two motions. The evaluation of the described models was not affected by the unbalanced datasets because the area and distance features clearly defined the class label. Nevertheless, it must be mentioned that the models predicted, to some extent, false-positive results. Therefore, while applying the RNN algorithm in practice, skewed training data should have been avoided. Furthermore, additional features should have been included in the labeling of the output data.
The objective of our study was to compare different machine learning algorithms to classify body motions of healthy participants. As shown in the literature review, previous studies usually focused on comparing different Kinect models. Unsurprisingly, the newest version of Kinect has been referred to as the most accurate (Albert et al. 2020) [9], although there are contradictory findings (Abdelnour et al. 2024) [23]. However, these studies did not compare different machine learning approaches for the classification of exercises. Regarding RQ2, recent research focuses on using RNNs and CNNs or a combination of both to classify and assess gestures. On the one hand, the performance metrics demonstrate a good fit of the chosen models to the classification tasks. On the other hand, the good results were also caused by the similarity of test data and training data as both datasets were obtained from the same participants performing the exercises under the same conditions. Further, while capturing the training data for the complex squat exercise, an extensive data analysis was performed. Since the execution of a correct squat depends on many determinants, many properties can be potentially considered. In the limited frame of this work, only some major determinants were considered, including the distance between the knee and the shoulder and the area between the thump, the wrist, and the hand tip. Further possible features for defining a correctly executed squat may include head angles and the horizontal distance between the toes and the knees, among others. RQ1 is answered in Section 6 by suggesting that the RNN is the best-fitting approach for the application presented in this work. Indeed, there may be even more efficient ways to define the thresholds used in Section 6. To prove the robustness of the introduced approaches in Section 6, further work should compare the results of the methods to a gold standard for joint data capturing, such as the VICON system [9]. Besides, there are limitations regarding the significance of the presented findings. First, this work did not apply the proposed method to a benchmark dataset. Hence, the data quality and results depended on the preprocessing described in Section 5. For specifying hyperparameters of the proposed RNN, we conducted intensive experimentation. However, there may be future implementations of the proposed RNN method with adjusted hyperparameters. Another limitation is that only two motions were considered. Thus, future research should consider other types of movements and gestures. Another critical aspect is the capturing of training data, which became more difficult than expected. It is inevitable to define a robust laboratory setup, as described in Section 5, and to adhere to the defined process.
Finally, we answer RQ3 and provide an outlook on gesture detection research and classification based on 3D joint coordinates. As a result of the experiments described in this article, suggestions are given regarding adjustments to further improve the performance and generalizability of the proposed RNN. One shorthand improvement of the proposed methods is to not only classify static gestures such as “squat” or “fist,” but also to consider the movements between states. However, the RNN considers the last 30 frames to classify a frame, which includes previous movements. Another important factor is the validity of the captured sample data, where correctly performed motions must include further physiological restrictions. It is recommended to cross-examine these restrictions with a medical doctor or physiotherapist. This also addresses the selection of thresholds and boundaries for the separation of class labels. Future studies on gesture recognition and motion detection should also address the problem of removing noise and validating recorded data. Further research is needed to validate the accuracy of the proposed models to establish a state-of-the-art home setup for low-budget motion tracker sensors to guarantee high-quality data. Another suggestion for future work is the creation of a benchmark joint dataset. This will enable researchers to harness the simplicity of capturing sample data and guide the focus of research toward creating, tuning, and assessing RNNs and other methods. In addition, this dataset should include not only joint coordinates but also information about the population of tracked individuals. This would allow us to shrink the dataset to a relevant group of patients. Furthermore, with regard to motion selection, many other classes are also possible. To avoid a purely binary frame-by-frame classification, upward and downward motions should also be investigated in future research. This option provides better possibilities for identifying correctly performed motions in front of the camera. Although the machine learning methods employed in this study revealed convincing results, we suggest to explore a broader range of techniques in future studies. In particular, we assume that more complex techniques such as transformer networks could show advantages for more complex classification tasks, e.g., for the analysis of more complex types of movements.

Author Contributions

Conceptualization, M.F.; methodology, M.F.; software, M.F.; validation, M.F. and T.H.; investigation, M.F.; resources, M.F.; data curation, M.F.; writing—original draft preparation, M.F.; writing—review and editing, T.H.; visualization, M.F.; supervision, T.H. All authors have read and agreed to the published version of the manuscript.

Funding

This research did not receive any specific grants from funding agencies in the public, commercial, or not-for-profit sectors.

Institutional Review Board Statement

Not applicable.

Informed Consent Statement

Not applicable. According to Swiss law [Art. 2 of the Federal Act on Research involving Human Beings (Human Research Act, HRA) of 30 September 2011 (Status as of 1 January 2014)], research projects involving anonymized data sets do not require an approval (https://www.bag.admin.ch/bag/en/home/medizin-und-forschung/forschung-am-menschen/bewilligungen-hfg.html#312418006), accessed on 11 May 2025.

Data Availability Statement

Original data is unavailable due to privacy reasons.

Conflicts of Interest

The authors declare no conflict of interest.

References

  1. Gao, Z.; Song, Y.; Zhou, Y.; Xiong, W. Design of joint range of motion measurement based on Kinect. In Proceedings of the 2021 IEEE 5th Information Technology, Networking, Electronic and Automation Control Conference (ITNEC), Xi’an, China, 15–17 October 2021; IEEE: Piscataway, NJ, USA, 2021; Volume 5, pp. 734–738. [Google Scholar]
  2. Gu, J.; Yang, X.; De Mello, S.; Kautz, J. Dynamic facial analysis: From Bayesian filtering to recurrent neural network. In Proceedings of the IEEE Conference on Computer Vision and Pattern Recognition, Honolulu, HI, USA, 21–26 July 2017; pp. 1548–1557. [Google Scholar]
  3. Galna, B.; Jackson, D.; Schofield, G.; McNaney, R.; Webster, M.; Barry, G.; Mhiripiri, D.; Balaam, M.; Olivier, P.; Rochester, L. Retraining function in people with Parkinson’s disease using the Microsoft kinect: Game design and pilot testing. J. NeuroEng. Rehabil. 2014, 11, 60. [Google Scholar] [CrossRef] [PubMed]
  4. Siena, F.L.; Byrom, B.; Watts, P.; Breedon, P. Utilising the Intel RealSense Camera for Measuring Health Outcomes in Clinical Research. J. Med. Syst. 2018, 42, 53. [Google Scholar] [CrossRef] [PubMed]
  5. Yang, X.; Molchanov, P.; Kautz, J. Multilayer and Multimodal Fusion of Deep Neural Networks for Video Classification. In Proceedings of the 24th ACM International Conference on Multimedia, Amsterdam, The Netherlands, 15–19 October 2016. [Google Scholar]
  6. Kitsunezaki, N.; Adachi, E.; Masuda, T.; Mizusawa, J.I. KINECT applications for the physical rehabilitation. In Proceedings of the 2013 IEEE International Symposium on Medical Measurements and Applications (MeMeA), Gatineau, QC, Canada, 4–5 May 2013; IEEE: Piscataway, NJ, USA, 2013; pp. 294–299. [Google Scholar]
  7. Molchanov, P.; Yang, X.; Gupta, S.; Kim, K.; Tyree, S.; Kautz, J. Online detection and classification of dynamic hand gestures with recurrent 3d convolutional neural network. In Proceedings of the IEEE Conference on Computer Vision and Pattern Recognition, Las Vegas, NV, USA, 27–30 June 2016; pp. 4207–4215. [Google Scholar]
  8. Alaoui, H.; Moutacalli, M.T.; Adda, M. AI-enabled high-level layer for posture recognition using the azure kinect in unity3D. In Proceedings of the 2020 IEEE 4th International Conference on Image Processing, Applications and Systems (IPAS), Genova, Italy, 9–11 December 2020; IEEE: Piscataway, NJ, USA, 2020; pp. 155–161. [Google Scholar]
  9. Albert, J.A.; Owolabi, V.; Gebel, A.; Brahms, C.M.; Granacher, U.; Arnrich, B. Evaluation of the Pose Tracking Performance of the Azure Kinect and Kinect v2 for Gait Analysis in Comparison with a Gold Standard: A Pilot Study. Sensors 2020, 20, 5104. [Google Scholar] [CrossRef] [PubMed]
  10. Sin, H.; Lee, G. Additional Virtual Reality Training Using Xbox Kinect in Stroke Survivors with Hemiplegia. Am. J. Phys. Med. Rehabil. 2013, 92, 871–880. [Google Scholar] [CrossRef] [PubMed]
  11. Ortiz-Gutiérrez, R.; Cano-De-La-Cuerda, R.; Galán-Del-Río, F.; Alguacil-Diego, I.M.; Palacios-Ceña, D.; Miangolarra-Page, J.C. A Telerehabilitation Program Improves Postural Control in Multiple Sclerosis Patients: A Spanish Preliminary Study. Int. J. Environ. Res. Public Health 2013, 10, 5697–5710. [Google Scholar] [CrossRef] [PubMed]
  12. D’Orazio, T.; Attolico, C.; Cicirelli, G.; Guaragnella, C. A Neural Network Approach for Human Gesture Recognition with a Kinect Sensor. In Proceedings of the ICPRAM 2014, Angers, France, 6–8 March 2014; pp. 741–746. [Google Scholar]
  13. Murakami, K.; Taguchi, H. Gesture recognition using recurrent neural networks. In Proceedings of the SIGCHI Conference on Human Factors in Computing Systems, New Orleans, LA, USA, 27 April–2 May 1991; pp. 237–242. [Google Scholar]
  14. Karpathy, A.; Toderici, G.; Shetty, S.; Leung, T.; Sukthankar, R.; Fei-Fei, L. Largescale video classification with convolutional neural networks. In Proceedings of the IEEE conference on Computer Vision and Pattern Recognition, Columbus, OH, USA, 23–28 June 2014; pp. 1725–1732. [Google Scholar]
  15. Du, K.; Lin, X.; Sun, Y.; Ma, X. Crossinfonet: Multi-task information sharing based hand pose estimation. In Proceedings of the IEEE/CVF Conference on Computer Vision and Pattern Recognition, Long Beach, CA, USA, 16–20 June 2019; pp. 9896–9905. [Google Scholar]
  16. Lee, C.; Kim, J.; Cho, S.; Kim, J.; Yoo, J.; Kwon, S. Development of real-time hand gesture recognition for tabletop holographic display interaction using azure kinect. Sensors 2020, 20, 4566. [Google Scholar] [CrossRef] [PubMed]
  17. Garcia-Hernando, G.; Yuan, S.; Baek, S.; Kim, T.K. First-person hand action benchmark with rgb-d videos and 3d hand pose annotations. In Proceedings of the IEEE Conference on Computer Vision and Pattern Recognition, Salt Lake City, UT, USA, 18–22 June 2018; pp. 409–419. [Google Scholar]
  18. Yuan, S.; Ye, Q.; Stenger, B.; Jain, S.; Kim, T.K. Bighand2. 2m benchmark: Hand pose dataset and state of the art analysis. In Proceedings of the IEEE Conference on Computer Vision and Pattern Recognition, Honolulu, HI, USA, 21–26 July 2017; pp. 4866–4874. [Google Scholar]
  19. Skals, S.; Rasmussen, K.P.; Bendtsen, K.M.; Yang, J.; Andersen, M.S. A musculoskeletal model driven by dual Microsoft Kinect Sensor data. Multibody Syst. Dyn. 2017, 41, 297–316. [Google Scholar] [CrossRef]
  20. Tölgyessy, M.; Dekan, M.; Chovanec, Ľ.; Hubinský, P. Evaluation of the Azure Kinect and Its Comparison to Kinect V1 and Kinect V2. Sensors 2021, 21, 413. [Google Scholar] [CrossRef] [PubMed]
  21. Breedon, P.; Byrom, B.; Siena, L.; Muehlhausen, W. Enhancing the measurement of clinical outcomes using Microsoft Kinect. In Proceedings of the 2016 International Conference on Interactive Technologies and Games (ITAG), Nottingham, UK, 26–27 October 2016; IEEE: Piscataway, NJ, USA, 2016; pp. 61–69. [Google Scholar]
  22. Bertram, J.; Krüger, T.; Röhling, H.M.; Jelusic, A.; Mansow-Model, S.; Schniepp, R.; Wuehr, M.; Otte, K. Accuracy and repeatability of the Microsoft Azure Kinect for clinical measurement of motor function. PLoS ONE 2023, 18, e0279697. [Google Scholar] [CrossRef] [PubMed]
  23. Abdelnour, P.; Zhao, K.Y.; Babouras, A.; Corban, J.P.A.H.; Karatzas, N.; Fevens, T.; Martineau, P.A. Comparing the drop vertical jump tracking performance of the Azure Kinect to the Kinect V2. Sensors 2024, 24, 3814. [Google Scholar] [CrossRef] [PubMed]
  24. Ripic, Z.; Kuenze, C.; Andersen, M.S.; Theodorakos, I.; Signorile, J.; Eltoukhy, M. Ground reaction force and joint moment estimation during gait using an Azure Kinect-driven musculoskeletal modeling approach. Gait Posture 2022, 95, 49–55. [Google Scholar] [CrossRef] [PubMed]
  25. vom Brocke, J.; Hevner, A.; Maedche, A. Introduction to design science research. In Design Science Research Cases; Springer: Cham, Switzerland, 2020; pp. 1–13. [Google Scholar]
  26. Peffers, K.; Tuunanen, T.; Rothenberger, M.A.; Chatterjee, S. A design science research methodology for information systems research. J. Manag. Inf. Syst. 2007, 24, 45–77. [Google Scholar] [CrossRef]
  27. Nielsen, J. Usability engineering at a discount. In Designing and Using Human-Computer Interfaces and Knowledge Based Systems; Salvendy, G., Smith, M.J., Eds.; Elsevier Science Publishers: Amsterdam, The Netherlands, 1989; pp. 394–401. [Google Scholar]
  28. Microsoft. Azure Kinect DK Documentation. 2022. Available online: https://docs.microsoft.com/en-us/azure/kinect-dk (accessed on 24 May 2022).
  29. Luna-Oliva, L.; Ortiz-Gutiérrez, R.M.; Cano-de la Cuerda, R.; Piédrola, R.M.; Alguacil-Diego, I.M.; Sánchez-Camarero, C.; Martínez Culebras, M.D.C. Kinect Xbox 360 as a therapeutic modality for children with cerebral palsy in a school environment: A preliminary study. NeuroRehabilitation 2013, 33, 513–521. [Google Scholar] [CrossRef]
Figure 1. Applied DSR process model according to Peffers et al. (2007) [26].
Information 16 00421 g001
Figure 2. Microsoft joint hierarchy for 32 joints in 2022 (based on Microsoft Azure Kinect DK documentation, 24 May 2022).
Information 16 00421 g002
Figure 3. Unsmoothed areas of HANDTIP_RIGHT, THUMB_RIGHT, and WRIST_RIGHT.
Information 16 00421 g003
Figure 4. Smoothed areas of HANDTIP_RIGHT, THUMB_RIGHT, and WRIST_RIGHT.
Information 16 00421 g004
Figure 5. Distance between HANDTIP_RIGHT and WRIST_RIGHT in millimeters during a 20 s capture while performing the fist motion.
Information 16 00421 g005
Figure 6. Smoothed view of the distance between HANDTIP_RIGHT and WRIST_RIGHT during a 20 s capture.
Information 16 00421 g006
Figure 7. Manually assigned labels based on the area and distance of the three joints (fist = 1, no fist (palm) = 0).
Information 16 00421 g007
Figure 8. Distance between the right shoulder (SHOULDER_RIGHT) and the right knee (KNEE_RIGHT) in mm during a squat.
Information 16 00421 g008
Figure 9. Squat count labels on feature selection, squat = 1, no squat = 0.
Information 16 00421 g009
Figure 10. Distance between the right shoulder and the right knee during a squat in mm for two squat movements which were executed differently regarding the range of movements.
Information 16 00421 g010
Figure 11. Squat count based on feature selection.
Information 16 00421 g011
Table 1. Confusion matrices for using decision trees and hand and squat movement detection.
HANDActual
Prediction01
020026
18270
SQUATActual
Prediction01
08680
10145
Table 2. Metrics of the decision tree classifier for both exercises.
MotionAccuracy of TrainingAccuracy of TestPrecisionRecall
Hand closure10.990.970.98
Squat1111
Table 3. Confusion matrix for the NN predicting the hand motion.
Actual
Prediction01
04250
177220
Table 4. Performance of the NN for both motions.
MotionClassification AccuracyPrecisionRecallAUC
Hand closure0.890.7410.94
Squat0.860.560.950.52
Table 5. Confusion matrix for the NN predicting the squat motion.
Actual
Prediction01
08849
1129166
Table 6. Confusion matrix for the RNN predicting the hand motion.
Actual
Prediction01
019998
10269
Table 7. Confusion matrix for the RNN predicting the squat motion.
Actual
Prediction01
010601
11195
Disclaimer/Publisher’s Note: The statements, opinions and data contained in all publications are solely those of the individual author(s) and contributor(s) and not of MDPI and/or the editor(s). MDPI and/or the editor(s) disclaim responsibility for any injury to people or property resulting from any ideas, methods, instructions or products referred to in the content.