Article

Investigating Service Robot Acceptance Factors: The Role of Emotional Design, Communication Style, and Gender Groups

School of Design Art, Xiamen University of Technology, Xiamen 361024, China
*
Author to whom correspondence should be addressed.
Information 2025, 16(6), 463; https://doi.org/10.3390/info16060463
Submission received: 13 May 2025 / Revised: 27 May 2025 / Accepted: 28 May 2025 / Published: 30 May 2025
(This article belongs to the Special Issue Artificial Intelligence Methods for Human-Computer Interaction)

Abstract

:
Service robots (SRs) are increasingly deployed in commercial settings, yet the factors influencing their acceptance, particularly emotional design elements, remain understudied. This research investigates SR acceptance factors by integrating the technology acceptance model, the Computers Are Social Actors (CASA) framework, Kansei engineering (KE), and social presence theory (SPT) to examine how design elements influence user responses to SRs. Using structural equation modeling of survey data from 318 shoppers and hotel guests in China, we tested relationships between CASA attributes, emotional perceptions, social presence, and usage intention. The results revealed that communication style produced the strongest effects across all emotional dimensions, with cuteness and coolness directly influencing usage intention, while warmth and novelty operate through social presence mediation. Multi-group analysis identified significant gender differences in response patterns: male users prioritized communication-driven perceptions while female users responded more strongly to coolness attributes. These findings extend our understanding of acceptance factors in service robot adoption, highlighting the critical roles of emotional design, communication style, and gender differences, while suggesting differentiated design approaches for diverse user segments.

1. Introduction

Service robots (SRs) have become common in commercial environments, providing services such as navigation assistance, information consultation, and product retrieval in retail settings [1,2,3]. In the hospitality sector, they perform tasks like room service delivery and event facilitation [4]. Unlike industrial robots that focus on manufacturing tasks, SRs interact directly with end users through perception systems, artificial intelligence, and interactive interfaces [5,6]. Despite technological progress, SRs continue to encounter adoption barriers. A key challenge is that current designs often prioritize functionality over users’ emotional and social needs, resulting in perceptions of SRs as utilitarian tools rather than interactive entities [7,8,9].
This research examines SR design through Kansei engineering (KE), a methodology that translates users’ emotional and sensory responses into design parameters [10]. The analysis incorporates three additional frameworks: the technology acceptance model (TAM) [11], which addresses adoption behavior; the Computers Are Social Actors (CASA) framework [12,13], which examines social interactions with technology; and social presence theory (SPT) [8], which explores psychological connections with technological systems. This integrated approach examines how four emotional design elements—cuteness, coolness, warmth, and novelty—shape user perceptions and intentions in commercial settings [10].
Although SR research has expanded, several gaps remain. First, existing studies tend to examine individual Kansei elements separately rather than analyzing their combined effects on user perceptions [14]. Second, research on personification characteristics has not sufficiently examined how CASA-related attributes (e.g., autonomy, communication style) affect user perceptions through Kansei elements [15]. Third, gender differences in technology acceptance remain underexamined in Kansei design for SRs [7]. Addressing these research questions is crucial for advancing both theoretical understanding of human–robot interaction and practical design guidelines that can improve SR adoption rates in commercial settings [16,17].
This study addresses several aspects of these research questions by examining how multiple Kansei elements collectively shape user experience, with findings that cuteness and coolness directly affect usage intention, while warmth and novelty influence usage intention primarily through social presence; by identifying how CASA attributes affect user perceptions through Kansei elements, with communication style showing consistent effects across emotional dimensions; by analyzing gender differences in user perceptions, where male users’ responses are influenced by communication style and female users respond to coolness attributes; and by developing an integrated approach that combines KE, TAM, CASA, and SPT for analyzing emotional aspects of SR design.
Using structural equation modeling, this research analyzes relationships between CASA elements, Kansei perceptions, social presence, and usage intention. The results indicate that communication style affects all Kansei elements, with gender moderating these relationships. The model explains 48% of the variance in usage intention, with differing patterns observed between male and female users. These findings provide design considerations for developers and businesses seeking to enhance user experience through emotionally responsive SR designs.
The paper is structured as follows: Section 2 reviews literature and presents research hypotheses; Section 3 describes the methodology and data collection; Section 4 presents data analysis results; Section 5 discusses findings and implications; and Section 6 concludes with contributions, limitations, and directions for future research.

2. Literature Review and Hypotheses

This section develops a theoretical framework that connects SR design attributes with emotional experiences and user responses, integrating insights from multiple research traditions. Our conceptual model examines how CASA attributes (utility, autonomy, personification, communication style) influence emotional experiences (cuteness, coolness, warmth, novelty), social presence, and, ultimately, usage intention. Through our research hypotheses, we investigate both the direct pathways and mediating mechanisms that shape SR acceptance.

2.1. SR Overview and Theoretical Framework

SRs are intelligent mechanical devices with environmental perception, decision processing, and emotional interaction capabilities that operate autonomously or semi-autonomously in human environments, providing services such as information consultation, navigation, and reception to end users [18,19]. Their applications in shopping malls and hotels continue to expand, with establishments employing robots for customer inquiries and advice [4].
This study draws on four theoretical frameworks to examine SR acceptance. The TAM is a significant extension of the theory of reasoned action, proposed by Davis [20] to explain computer usage behavior. The model, with perceived usefulness and perceived ease of use as its core constructs, has been widely applied in various technology adoption research [21,22]. Although TAM can explain user acceptance of various technologies, its traditional framework primarily focuses on functional evaluation and fails to fully capture the human-like characteristics exhibited by artificial intelligence applications. These anthropomorphic features often lead users to form emotion-like interpersonal connections with AI systems, beyond the original assessment scope of TAM [22].
To address this limitation, we introduce the CASA theory, which examines how humans apply social rules when interacting with technology [23]. This theory suggests that humans unconsciously apply social response patterns for humans to computer interactions, even when they rationally know that computers lack human characteristics [24]. CASA theory complements TAM’s functional perspective, providing a theoretical foundation for understanding how users view SRs exhibiting human characteristics as social actors.
In addition to CASA theory, this study also integrates KE and SPT as theoretical frameworks. KE is a method that studies emotional responses in user–product interaction processes [25] focusing on translating user emotional needs into specific design parameters [26], which helps identify key elements in SR design that can evoke positive emotional responses. Social penetration theory describes how users establish psychological connections with technology as interactions deepen [8]. These complementary frameworks, together with CASA theory, extend the TAM model to construct a more comprehensive theoretical perspective, organically connecting SR design elements with users’ perceived social presences and their ultimate usage intentions.
Figure 1 presents the proposed dual-pathway research model that integrates CASA attributes, Kansei elements, social presence and usage intention.

2.2. The CASA Theoretical Perspective on SRs

CASA posits that users apply interpersonal social norms when interacting with technologies displaying human-like characteristics, such as natural language or interactive behaviors [23]. When technology exhibits “human cues” through language, interactivity, or by performing traditional human roles, users respond socially [12]. For SRs, these cues manifest in appearance, dialogue capabilities, and service functions, affecting users’ cognitive and emotional responses [23,27]. Blanche et al. note that robots’ human-like characteristics, including appearance, capability, and warmth, shape consumer service value expectations [18].

2.2.1. Utility

Utility represents SRs’ capacity to fulfill users’ functional needs through efficient task completion [28]. In commercial settings, this includes information provision, customer service, and inventory management [29]. Shehawy et al. define robot capability as encompassing physical movement, sensory perception, cognitive functions, communication, and task execution—aspects reflecting utility value [29]. Liu et al. identified a matching effect between service environments and robot capability perceptions; in function-dominant contexts, high-capability robots receive greater acceptance, while hedonic-dominant contexts favor affinity-type robots [30]. Alam et al. found that alignment between robot functionality and service context enhances acceptance through increased user trust [31]. In their study of food delivery robots, Lin et al. demonstrated that functional attributes such as efficiency, convenience, and quality preservation positively influence users’ emotional connections, significantly impacting their intentions for continued use [32]. These findings suggest that utility affects users’ emotional perceptions. Accordingly, we hypothesize the following:
H1a. 
Utility has a significant positive effect on cuteness.
H1b. 
Utility has a significant positive effect on coolness.
H1c. 
Utility has a significant positive effect on warmth.
H1d. 
Utility has a significant positive effect on novelty.

2.2.2. Autonomy

Autonomy refers to SRs’ ability to perceive environments, make decisions, and execute tasks without human intervention [22]. Autonomous robots navigate independently, identify user needs, and provide appropriate services [33]. This capability relies on control systems, interaction accessibility, and environmental perception—indicators of perceived intelligence [22]. Research shows that autonomous robots are more frequently perceived as intelligent social agents, enhancing trust and engagement [6]. In retail and hospitality contexts, autonomous robots provide more flexible and responsive services. In their investigation of food service contexts, Cavusoglu et al. revealed that customers perceive autonomous delivery robots as simultaneously cute and helpful, suggesting that autonomy contributes to both affective responses and utilitarian evaluations [34]. However, autonomy requires calibration; excessive autonomy may cause discomfort while insufficient autonomy reduces satisfaction [6]. These findings indicate that autonomy shapes users’ emotional responses. Based on the above analysis, the following hypotheses are proposed:
H2a. 
Autonomy has a significant positive effect on cuteness.
H2b. 
Autonomy has a significant positive effect on coolness.
H2c. 
Autonomy has a significant positive effect on warmth.
H2d. 
Autonomy has a significant positive effect on novelty.

2.2.3. Personification

Personification involves endowing SRs with human-like qualities in appearance, language, behavior, or emotional expression [7]. This CASA element manifests through physical attributes (humanoid appearance, facial expressions) and behavioral characteristics (natural language, social responses) that reduce perceived differences between humans and machines [7,13]. The inclusion of personification in our framework is essential because it directly affects how users emotionally respond to and evaluate SRs in commercial environments. Evidence from empirical studies demonstrates specific connections between personification and emotional responses. So et al. found that personification features specifically enhanced consumer trust during complex service interactions by creating a familiarity that reduces uncertainty [35]. This connection between personification and emotional comfort suggests potential effects on perceived warmth and cuteness. In their study of luxury hospitality settings, Li et al. demonstrated that personification features in SRs facilitate customer value co-creation by making interactions more intuitive, though careful calibration is necessary to avoid the “uncanny valley effect” [36]. Moliner-Tena et al. observed that humanizing robots creates emotional connections with customers by diminishing psychological distance, which enhances the memorability of service experiences [37]. However, Gong cautions that personification can create unrealistic expectations, leading to cognitive strain [38]. These mechanisms suggest that personification contributes to our research model by specifically shaping the Kansei elements that mediate technology acceptance. Based on the above analysis, the following hypotheses are proposed:
H3a. 
Personification has a significant positive effect on cuteness.
H3b. 
Personification has a significant positive effect on coolness.
H3c. 
Personification has a significant positive effect on warmth.
H3d. 
Personification has a significant positive effect on novelty.

2.2.4. Communication Style

Communication style refers to the conversational approaches that SRs use during interactions. Research demonstrates that natural, emotional communication enhances user experience [7]. Balaji et al. define this as “the ability of SRs to communicate relevant information and engage with customers through voice or touchscreen” [1], while Reimann et al. found that users prefer robots that use conversational styles that proactively convey capabilities [39]. Studies distinguish between socially oriented communication (emphasizing emotional connection) and task-oriented communication (focusing on efficiency), with the former better addressing psychological needs [14]. Two-way communication promotes positive consumer experiences by enabling reciprocal information exchange [11]. Investigations into AI chatbot interactions have revealed that socially oriented communication patterns significantly enhance users’ perceptions of warmth, fostering stronger emotional connections and elevating trust levels [40]. Based on these findings, the following hypotheses are proposed:
H4a. 
Communication Style has a significant positive effect on cuteness.
H4b. 
Communication Style has a significant positive effect on coolness.
H4c. 
Communication Style has a significant positive effect on warmth.
H4d. 
Communication Style has a significant positive effect on novelty.
Having established the relationships between CASA Attributes and users’ emotional perceptions of SRs, we next examine how these Kansei elements affect social presence perceptions and usage intentions. CASA attributes represent the foundational capabilities of SRs, while Kansei elements capture the subjective emotional experiences evoked in users. The following hypotheses explore these emotional dimensions’ influence on user responses.

2.3. The KE Perspective on SRs

KE integrates users’ emotional experiences into design by transforming emotional needs into specific design parameters [41]. In SR design, KE examines how emotional responses like cuteness affect user perception and behavior [42], providing a framework for understanding how subjective emotions influence acceptance.

2.3.1. Cuteness

Cuteness encompasses endearing qualities in SRs’ appearance and behavior that evoke protective instincts and feelings of closeness [43]. Often implemented through “baby schema” design elements like rounded shapes and large eyes [9,20], cute design attracts attention and triggers friendly responses [14]. In their examination of generative AI interfaces, Maeiro et al. demonstrated that anthropomorphic design features significantly strengthen perceived social presence and enhance user engagement, suggesting that incorporating cute elements in robot design may similarly foster more meaningful user–technology relationships [9]. When users perceive robots as cute, they more readily attribute social characteristics to them, developing connections that enhance social presence [44]. Additionally, cute design elements influence behavioral intentions by creating positive affect that translates into approach behaviors [14]. Based on these findings, the following hypotheses are proposed:
H5a. 
Cuteness has a significant positive effect on social presence.
H5b. 
Cuteness has a significant positive effect on usage intention.

2.3.2. Coolness

Coolness refers to uniqueness and high-tech qualities in SR design [15]. Chang (2024) characterizes coolness as popular, extraordinary, and vibrant—qualities that evoke positive user responses affecting attitudes [2]. Guerreiro & Loureiro found that cool brands create enduring user relationships, identifying coolness in intelligent assistants as affecting attachment–aversion dynamics [45]. In commercial settings, Cheng et al. demonstrated that coolness motivates user adoption of innovative technologies [46]. Studies examining robot-mediated dining experiences have identified coolness as a crucial cognitive dimension that operates alongside competence, collectively enhancing emotional value, customer delight, and ultimately fostering loyalty in SR interactions [47]. Based on these findings, the following hypotheses are proposed:
H6a. 
Coolness has a significant positive effect on social presence.
H6b. 
Coolness has a significant positive effect on usage intention.

2.3.3. Warmth

Warmth refers to the friendliness and care conveyed by SRs through behavior, language, or visual design—reflecting judgments about perceived good intentions, helpfulness, sincerity, and credibility [18]. Research shows that entities perceived as warm evoke positive responses, while those lacking warmth trigger negative reactions. Warm robots increase trust, enhance satisfaction, and strengthen presence perceptions [48]. In front-desk environments requiring interpersonal skills [18], humanoid SRs are perceived as friendlier and more trustworthy than self-service machines due to humanized interaction elements [49]. Chan’s comparative investigation of human versus robot service interactions demonstrated that, despite increasing customer adaptation to robotic services, the perceived lack of warmth in robot-delivered service significantly influences customers’ preference for human interactions, particularly in scenarios requiring personal engagement [49]. Warmth influences usage intention both directly and indirectly by enhancing social presence [12]. Based on these findings, the following hypotheses are proposed:
H7a. 
Warmth has a significant positive effect on social presence.
H7b. 
Warmth has a significant positive effect on usage intention.

2.3.4. Novelty

Novelty refers to uniqueness and innovation in SR design that arouses curiosity. Sharma et al. define experiential novelty as the feeling of trying new things, related to curiosity and adventure, noting that people typically respond positively to new technologies when they are perceived as useful and easy to use [50]. Studies examining AI applications in hospitality settings have identified novelty as a multifaceted driver that simultaneously evokes emotional responses and enhances utilitarian perceptions, collectively strengthening users’ behavioral intentions through dual pathways of increased enjoyment and perceived usefulness [51]. Similarly, research into smart retail environments positions novelty as a pivotal external motivator that fundamentally shapes consumer attitudes and serves as a primary catalyst for initial technology engagement [52]. Guerreiro and Loureiro found that “coolness” feelings when interacting with SRs often stem from novel experiences [45]. In retail and hospitality contexts, robots with novelty stimulate user interest and enhance presence [19]. Novel appearance or innovative functions add enjoyment for users [50]. Based on these findings, the following hypotheses are proposed:
H8a. 
Novelty has a significant positive effect on social presence.
H8b. 
Novelty has a significant positive effect on usage intention.

2.4. Social Presence and Usage Intention

2.4.1. The Mediating Role of Social Presence

Social presence refers to the degree users perceive a medium as sociable, warm, sensitive, and personal during interactions [7]. SPT suggests that with SRs, the information transmission form affects users’ perception of the robot as a social actor [8]. This perception establishes emotional connection and trust, serving as a mechanism for conveying interpersonal warmth [53]. Research shows that SR social presence is influenced by CASA attributes, particularly personification elements like personalized expression and socially-oriented communication [7]. High social presence enhances users’ perceived enjoyment and trust through psychological closeness and warm dialogue [53,54]. Recent research on generative AI demonstrates that social presence serves as a core condition that strengthens user engagement and reciprocity, ultimately driving positive behavioral intentions across different user interaction paths [55]. Based on these findings, the following hypothesis is proposed:
H9. 
Social presence has a significant positive effect on usage intention.

2.4.2. Determinants of Usage Intention

Usage intention represents users’ behavioral tendency to use SRs in the future, influenced by factors including price, safety, and privacy [20,56]. For SRs, intention formation is influenced by both functional and emotional factors—especially capability and personification-related warmth [57]. In commercial environments, usage intention relates to value realization; stakeholders must identify key service areas where robots effectively supplement or replace human work [58]. This relationship suggests emotional design elements may influence usage intention through social presence. Investigations into generative AI interfaces have established that social presence functions as a fundamental condition that amplifies user engagement and reciprocal interaction, consequently channeling these positive relational dynamics into stronger behavioral intentions across various user interaction pathways [59]. Based on these findings, the following hypothesis is proposed:
H10. 
Social presence mediates the relationship between Kansei elements and usage intention.

3. Research Methods

This section outlines our research design and data collection approach for examining SR acceptance factors, including measurement development and sampling procedures used to gather data from users with SR experience in retail and hospitality settings.

3.1. Measurement Tools

To assess Kansei elements of SRs in shopping malls and hotels, we developed a structured measurement approach. Building on Huang et al.’s work on cognitive and emotional variables in hospitality contexts, we implemented a mixed-method research design to address the limited availability of established measurement scales for SR perception [28]. Research constructs were selected based on previously validated literature, as shown in Table 1.
The questionnaire utilized a seven-point Likert scale (1 = strongly disagree, 7 = strongly agree) and was organized in two parts. The first part collected demographic information and usage patterns regarding SRs in shopping malls and hotels. The second part focused on questions related to the main research constructs, examining relationships between SR design elements, Kansei perception, presence, and user satisfaction. Items with factor loadings below 0.7 were removed during reliability and validity testing, with specific exclusions detailed in the results section.

3.2. Data Collection

The study surveyed users with experience interacting with SRs in shopping malls and hotels. Shopping mall customers were selected as primary respondents because they interact directly with SRs, provide firsthand feedback, and represent diverse demographics. Hotel SR platform users were also included to enhance data diversity. This sampling strategy aligns with our research objective of evaluating how SR design characteristics influence user acceptance in real commercial deployment contexts. Data collection employed dual channels: offline field recruitment at malls with SRs (via QR code distribution) and online survey distribution through the Credamo platform (https://www.credamo.com). This approach expanded the sample range while maintaining diversity and representativeness. The survey’s purpose was explained to participants, with anonymity emphasized. Data collection was conducted in China from 2 November 2024, to 11 January 2025. The final dataset comprised 318 valid responses, exceeding the minimum threshold recommended for multivariate statistical techniques in behavioral research, ensuring sufficient statistical power for model testing [61,62]. This sample size is appropriate for our research objective of testing the proposed theoretical model with structural equation modeling and examining the relationships between design elements, social presence, and acceptance intentions. Quality control measures included preprocessing procedures to exclude incomplete or inconsistent responses. Survey invitations were distributed through WeChat (version 8.0.59) and Rednote (version v8.84), with 331 invitations sent. After excluding 13 invalid responses, the final sample comprised 318 participants. Table A2 presents the demographic profile of respondents. The sample included 66% females (n = 210) and 34% males (n = 108). Age distribution showed 21.7% aged 0–20 (n = 69), 63.8% aged 21–30 (n = 203), 6.3% aged 31–40 (n = 20), 4.4% aged 41–50 (n = 14), 3.1% aged 51–60 (n = 10), and 0.6% over 60 (n = 2). Regarding occupation, the sample included students (65.4%, n = 208), private enterprise employees (17.0%, n = 54), state-owned enterprise and institutional staff (6.6% each, n = 21 each), civil servants (2.8%, n = 9), and foreign enterprise personnel (1.6%, n = 5). Education levels included bachelor’s degrees (55.0%, n = 175), master’s degrees (27.4%, n = 87), associate’s degrees (10.1%, n = 32), high school/technical/vocational qualifications (4.7%, n = 15), middle school education (1.6%, n = 5), and doctoral degrees (1.3%, n = 4).

3.3. Data Analysis

In this study, SPSS 27 was used for preliminary examination of questionnaire data. For analyzing the research model, partial least squares structural equation modeling (PLS-SEM) was selected, implemented through SmartPLS 4 software. PLS-SEM offers advantages in handling hierarchical constructs and complex path relationships [28]. This method is particularly suitable for predictive research and demonstrates excellent flexibility when dealing with complex research models [4]. Given the complexity and predictive nature of our research model, PLS-SEM was considered the most appropriate analytical approach for examining SR adoption factors in commercial settings. For assessing the measurement model, we adopted the widely accepted thresholds proposed by Fornell and Larcker [63] and Hair et al. [64]—factor loadings > 0.7, average variance extracted (AVE) > 0.5, and composite reliability (CR) > 0.7—in order to ensure adequate reliability and validity, while using HTMT values less than 0.9 to evaluate discriminant validity.

4. Results

This section presents our analysis of SR design elements and their influence on user acceptance, including measurement validation, hypothesis testing through structural equation modeling, and examination of gender differences in response patterns.

4.1. Common Method Bias (CMB)

To address potential common method bias, Harman’s single-factor test, variance inflation factor (VIF) analysis, and construct independence tests were employed. Results from these tests indicated no significant bias and supported data reliability. To detect potential common method bias, the study first adopted Podsakoff et al.’s Harman’s single-factor test method, originally proposed by Harman to identify potential risks of common method variance. Results showed that a single factor explained 43.4% of the variance, below the critical value of 50%, indicating no significant common method bias in this study [46,65]. Second, VIF analysis showed that the VIF values for all constructs were below 3 (e.g., VIF values for utility, autonomy, and social presence were 1.89, 2.12, and 1.76 respectively), indicating no severe multicollinearity [58].
Construct independence tests further verified the discriminant validity of the model. According to the Fornell–Larcker criterion, Table A3 shows that the square roots of each construct (such as 0.851 for cuteness, 0.888 for communication style) are all greater than their correlation coefficients with other constructs, indicating good independence between constructs. Meanwhile, the results of HTMT ratios support this conclusion, with all constructs having HTMT ratios below 0.90 (e.g., the ratio between utility and cuteness is 0.662, and between personification and social presence is 0.529), further verifying the discriminant validity between constructs.
The results of Harman’s single-factor test, VIF analysis, Fornell–Larcker criterion, and HTMT ratios indicate that this study was not significantly affected by common method bias, and all constructs have good independence and reliability, supporting the discriminant validity of the scales and the robustness of the measurement model [46].

4.2. Measurement Model

To evaluate the measurement model fit of the research model, this study tested convergent validity, discriminant validity, and reliability [63]. During data analysis, several items were removed based on exploratory factor analysis results and reliability tests to optimize scale reliability and validity. Specifically, the CL2 item of coolness, the NO1 item of novelty, and the INT3 item of intention to use were not used in the final analysis. The items ultimately retained are shown in Table A3, all of which exhibited good factor loadings and statistical characteristics. This approach is similar to that of Huang et al. [28], who removed items based on statistical standards to optimize their measurement model. This scale reduction approach follows a similar procedure to that of Dvoracek et al. for the hotel guest–robot interaction scale, who similarly emphasized that items with loadings <0.70 need to be removed to ensure scale quality [66]. The following are the specific analysis results:
We assessed convergent validity using factor loading, average variance extracted (AVE), and composite reliability (CR). As presented in Table A3, all measurement items demonstrate strong factor loadings (>0.7), indicating that the measurement items have strong explanatory power. The AVE values of all constructs are higher than 0.5 (ranging from 0.648 to 0.826), meeting the requirements of convergent validity. Although the standardized loadings of PSN1 (0.721) and AT1 (0.779) are near the threshold, they both exceed the retention standard of 0.70, and deleting them did not improve Cronbach’s α or AVE, so this study chose to retain these two items. In addition, the CR values of all constructs are higher than 0.7 (ranging from 0.847 to 0.918), indicating that the model has high internal consistency. Therefore, the convergent validity of the model is supported.
We tested discriminant validity through the Fornell–Larcker criterion and HTMT ratios. According to Table A4, the Fornell–Larcker criterion shows that the square root of AVE for each construct (values on the diagonal) is greater than its correlation coefficients with other constructs. This is consistent with the verification method of Chi et al. in their human–machine interaction trust research, who similarly confirmed the validity of discriminant validity by ensuring the square root of AVE was greater than the correlation coefficients between constructs [67]. For example, the square root of AVE for cuteness is 0.851, which is greater than its correlation coefficients with other constructs (such as utility and personification) at 0.623 and 0.623, respectively. Similarly, the square root of AVE for communication style is 0.888, which is also greater than its correlation coefficients with other constructs (such as a correlation coefficient of 0.466 with autonomy). These results support the discriminant validity of the model.
HTMT ratios further verified discriminant validity, with results showing that all HTMT ratios between constructs in Table A5 are less than 0.90. For example, the HTMT ratio between utility and cuteness is 0.771, and between personification and social presence is 0.529, both below the threshold of 0.90. This indicates that there is sufficient independence between constructs, supporting the discriminant validity of the model.
Reliability was assessed through Cronbach’s α and CR values. As seen in Table A2, Cronbach’s α values for all constructs are greater than 0.7 (ranging from 0.709 to 0.866), indicating that the measurements of each construct have high internal consistency. Additionally, CR values further confirmed the consistency of each construct, with all values greater than 0.7, meeting reliability standards.
Based on the above analysis, both the convergent validity and discriminant validity of the measurement model meet the standards, indicating that these measurement indicators can accurately reflect the core meaning of each construct, while each construct has clear boundaries, with reasonable structural design and effective measurement tools. These findings provide a basis for the subsequent structural model analysis.

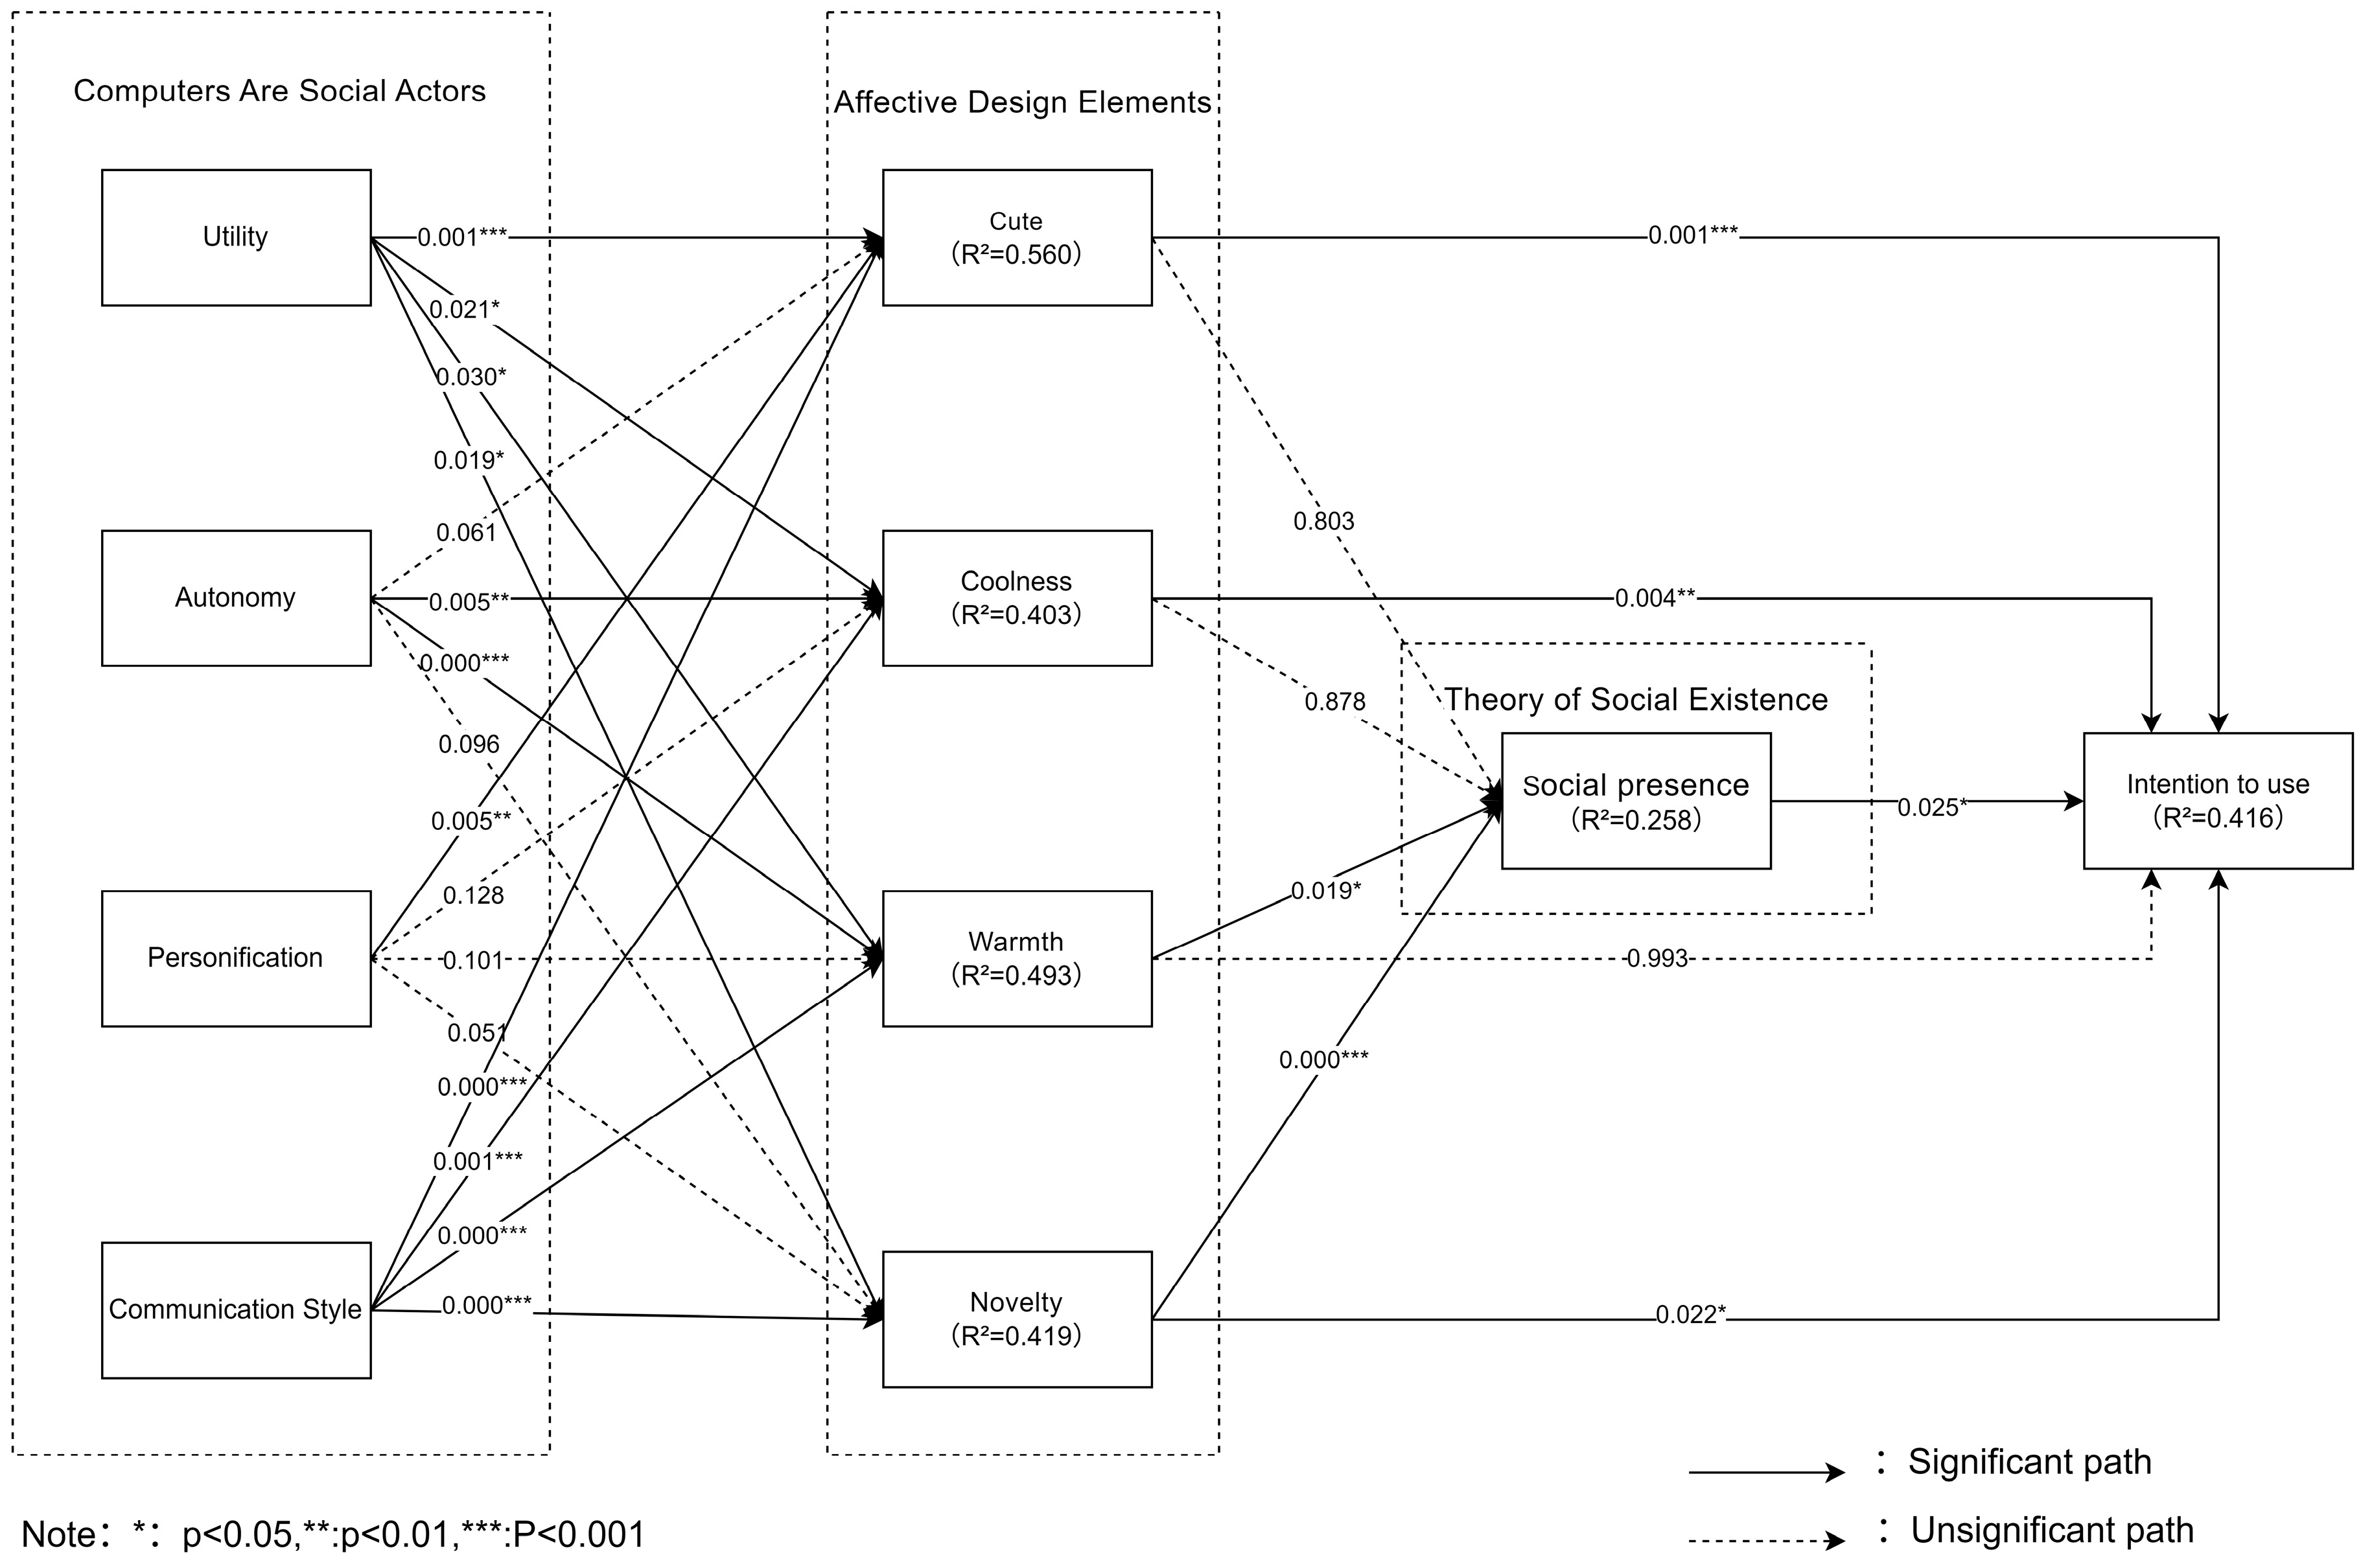
4.3. Structural Model

Structural model analysis explored the relationships between constructs and the direct and indirect impacts of these relationships on usage intention [68]. The test results of path coefficients (β), T-values, and p-values indicated support for the theoretical hypotheses of the model. Chin pointed out that PLS-SEM is particularly suitable for exploratory research and theory development, and can effectively handle relationships between latent variables in complex models [69].
First, utility had significant positive effects on cuteness (β = 0.254, p < 0.001), novelty (β = 0.177, p < 0.05), warmth (β = 0.157, p < 0.05), and coolness (β = 0.187, p < 0.05), indicating that users’ cognitive perceptions of product functionality can drive various emotional experiences [10]. Autonomy significantly influenced warmth (β = 0.299, p < 0.001) and coolness (β = 0.204, p < 0.01), but its effects on cuteness (β = 0.117, p = 0.061) and novelty (β= 0.128, p = 0.096) were not significant. As autonomous features become increasingly common in consumer technologies, users may no longer associate autonomy with uniqueness (novelty) or endearing qualities (cuteness). Instead, autonomy appears to primarily enhance perceptions of capability (coolness) and interpersonal connection (warmth). This pattern suggests that autonomy is primarily interpreted through a social–cognitive lens rather than through appearance-related attributes.
Personification had a significant positive effect on cuteness (β = 0.208, p < 0.01), but its effects on novelty, warmth, and coolness were all non-significant, indicating that personification features mainly strengthen the “cute” attribute rather than other emotional dimensions. This indicates that personification and emotional dimensions serve distinct roles in SR design. Communication style emerged as one of the strongest predictors across all Kansei elements, with medium to large effect sizes for cuteness (β = 0.316, p < 0.001), novelty (β = 0.293, p < 0.001), warmth (β = 0.276, p < 0.001), and coolness (β = 0.260, p < 0.001). These consistent effects across dimensions suggest communication style functions as a key design element for enhancing users’ emotional experience with SRs. These findings align with CASA principles, suggesting that the way in which robots communicate may be even more important than what they communicate in establishing emotional connections with users.
Warmth significantly influenced social presence (β = 0.217, p < 0.05) and novelty (β = 0.310, p < 0.001), while cuteness and coolness showed no significant effect. This suggests that users’ perception of social presence in SRs may be more related to experiences of emotional warmth and uniqueness. This aligns with the cognitive–emotion–intention framework proposed by Huang et al. [28], which suggests that emotional responses mediate between cognitive assessment and behavioral intention, further confirming the key role of emotional factors in the user acceptance process of SRs. Additionally, social presence had a significant effect on usage intention (β = 0.128, p < 0.05), indicating that perceived “sociability” can further enhance users’ behavioral intentions. Similarly, Tung et al. also verified the positive effect of social presence on visitor behavioral intentions in their SRsAM study in museum contexts, further confirming the robustness of this relationship across different service settings [60].
Finally, usage intention was directly and significantly positively influenced by cuteness (β = 0.279, p < 0.001), coolness (β = 0.199, p < 0.01), and novelty (β = 0.177, p < 0.05), with cuteness having the most significant influence, followed by coolness, then novelty, while the direct influence of warmth was not significant (β = −0.001, p = 0.993). This result aligns with Cha and Kim’s findings in restaurant scenarios, where their RAISA model demonstrated that coolness significantly drives customer adoption [70]. This indicates that the cute attributes, coolness, and novelty of SRs jointly drive usage intention, with cuteness playing the most prominent role.
In summary, the structural model results support the hypothesized relationships between constructs and indicate a mediating role of social presence: it transforms users’ emotional experiences into usage intention, thereby strengthening the sense of interaction and connection between users and SRs. Figure 2 depicts the validated structural model with standardized path coefficients and significance levels.

4.4. MGA Multi-Group Analysis

Table 2 reports the multi-group analysis results, highlighting the path differences between male and female respondents. Figure 3 visualizes these multi-group analysis results, illustrating the gender differences in path coefficients across all hypothesized relationships. To explore gender differences in the model, path coefficients between males and females were compared through multi-group analysis, revealing the moderating effect of gender on construct relationships. Chin has pointed out that multi-group analysis is an important method for understanding model relationship differences between different groups, which is particularly suitable for studying the moderating effects of demographic variables such as gender and age [71]. This method is similar to that used by Chi et al. to compare consumers from different cultural backgrounds (USA and China) [4]. Their research showed that cultural dimensions such as uncertainty avoidance, long-term orientation, and power distance have significant moderating effects on the robot acceptance process at both national and individual levels, while the results of this study indicate that gender has similar moderating effects on paths such as communication style, coolness, warmth, and social presence. The analysis results show that gender has significant effects on some paths, especially notable in communication style, coolness, warmth, and social presence. A consolidated overview of all hypothesis-testing outcomes is provided in Table A6.
The effect of communication style on cuteness differed significantly between males (β = 0.485) and females (β = 0.013) (Δβ = 0.472, p < 0.001), indicating that male users are more inclined to enhance their perception of cuteness due to the communication style of SRs. Similarly, the effect of communication style on warmth also differed significantly between the two groups (Δβ = 0.339, p < 0.01), with male users more likely than female users to feel emotional warmth from SRs through communication style. This significant gender difference challenges prevailing assumptions about gender and emotional sensitivity. While traditional gender psychology often associates women with higher emotional responsiveness, our findings reveal that, in human–robot interaction contexts, male users exhibit heightened sensitivity to communication-driven emotional cues. This pattern may reflect gender-differentiated expectations in technological contexts, where males may enter robot interactions with more instrumental expectations but become particularly responsive to unexpected emotional elements. These findings support Geisser’s view on group differences affecting prediction effects, indicating that differentiated strategies should be adopted for different gender groups [72].
Second, the effect of coolness on usage intention differed significantly between males (β = 0.087) and females (β = 0.399) (Δβ = −0.311, p < 0.05), indicating that female users have significantly higher sensitivity to coolness, with this fashionable and trendy attribute having an important influence on their usage decisions. This forms an interesting contrast with male users’ greater concern for communication style and emotional warmth, presenting differentiated tendencies in SRs perception between genders. This finding aligns with Wang et al.’s research results on Gen Z shoppers, which pointed out that female Gen Z consumers rely significantly more on the innovativeness and fashionableness of robots than males [73]. Notably, the effect of warmth on usage intention differed significantly between genders (males: β = 0.137; females: β = −0.275; Δβ = 0.413, p < 0.05). Male users showed a positive relationship between warmth and usage intention, while female users exhibited a negative relationship. This finding reveals differences in responses to warm attributes between different gender groups, possibly related to user expectations and emotional preferences.
Social presence, as a key construct, also demonstrated significant effects in multi-group analysis. The effect of social presence on usage intention differed between males (β = 0.144) and females (β = 0.099) (Δβ = 0.045, p < 0.05), showing that male users are more inclined to enhance their usage intention through social presence. Additionally, data showed that the effect of novelty on usage intention also differed significantly between males (β = 0.187) and females (β = 0.144) (Δβ = 0.043, p < 0.05), indicating that male users respond more positively to novel features.
Notably, the effect of warmth on social presence differed significantly between males (β = 0.193) and females (β = 0.298) (Δβ = −0.105, p < 0.001), showing that female users are more likely to perceive social presence through warm attributes. This result follows a similar pattern to the effect of cuteness on social presence, with the female group (β = 0.149) significantly higher than the male group (β = 0.002), with a significant difference (Δβ = −0.147, p < 0.001). This indicates that female users are more inclined to establish social connections with robots through emotional attributes.
In summary, the multi-group analysis results indicate significant differences in path relationships between different gender groups in the model. Gender differences are particularly striking: male users tend to perceive robots’ emotional traits (such as cuteness and warmth) through communication style and are more concerned with novelty and social presence, while female users show significant sensitivity to robots’ coolness attributes and are more able to perceive social presence through warm attributes.
This gender difference pattern provides important implications for SRs design. These findings support Huang et al.’s SRs user experience theory while providing a more detailed understanding through multi-group analysis, highlighting the importance of developing differentiated strategies for gender differences in SRs design and marketing [28].

5. Discussion

This study examines the relationship between SR design elements and user responses in commercial environments, revealing distinct influence patterns among emotional design dimensions and gender-based differences. The following discussion interprets these findings in relation to existing literature and explores their theoretical and practical implications for SR design.

5.1. Main Model

5.1.1. CASA Attributes

The data indicated associations between SR CASA attributes and users’ emotional responses, consistent with computer-mediated communication principles. Users unconsciously apply social rules when interacting with computers, a phenomenon documented in human–computer interaction literature [27]. Personification was associated with cuteness perceptions but not with warmth perceptions. This selective effect aligns with research on personification, where humanized appearance facilitates certain human response patterns primarily through aesthetic rather than interpersonal channels [18].
Utility was linked to coolness perceptions, reflecting the documented relationship between functional attributes and perceptual qualities. Recent work similarly found connections between coolness and both utilitarian and hedonic values in consumer evaluations [15]. This finding aligns with hospitality studies demonstrating that coolness in SRs simultaneously enhances emotional value and functional perceptions, collectively driving customer loyalty and engagement [47]. The association between autonomy and novelty was not statistically established, contrary to initial expectations. This might reflect changing user expectations as autonomous technologies become mainstream—a pattern of perceptual adaptation documented across various technology contexts [45].
Communication style demonstrated associations with all four Kansei dimensions: cuteness, novelty, warmth, and coolness. This comprehensive effect echoes findings from hospitality robotics research, where interaction qualities like responsiveness and tone significantly shape technology adoption [27]. Investigations into AI chatbot interactions have revealed that socially oriented communication patterns significantly enhance users’ perceptions of warmth, fostering stronger emotional connections and elevating trust levels [40].

5.1.2. Kansei Elements

Different Kansei elements exhibited distinct relationship patterns. Warmth and novelty were associated with social presence, reflecting multi-level cognitive processing where physical responses precede social attributions [27]. Cuteness showed direct association with usage intention, consistent with the behavioral attachment patterns documented in consumer psychology. When products or agents display cute features, they typically evoke caregiving responses and positive intentions [5]. Coolness similarly showed direct links to usage intention, aligning with consumer behavior research where perceived coolness translates to value perceptions and loyalty intentions [2].
The analysis identified two distinct pathways: cuteness and coolness showed direct associations with usage intention, while warmth and novelty operated primarily through social presence. This dual-pathway structure differs from uniform mediation models proposed in previous research [33].

5.1.3. Analysis of Social Presence Mediation Pathways

Social presence showed a modest association with usage intention, contrasting with stronger satisfaction–intention relationships found in similar service contexts [74]. This suggests social presence functions as one factor among several in user response formation. The analysis indicated differential mediation patterns among Kansei elements. Warmth’s relationship with usage intention operated through social presence, while novelty showed both direct and indirect paths. The observed mediation pattern suggests emotional dimensions may operate through different mechanisms, building on prior social presence research [8].
Social presence showed limited mediation for cuteness effects, suggesting alternative pathways. Recent research indicates cute design elements may bypass social presence mechanisms, directly affecting trust formation [43,75]. This suggests emotional design elements may trigger distinct cognitive processes depending on their specific qualities. When social presence is perceived, users may relate to robots as social entities rather than tools, potentially enhancing perceptions of interpersonal qualities [8]. This pattern is further corroborated by social robotics research showing that emotional connections significantly influence users’ continuance intentions, creating critical pathways between robot design features and actual usage behavior [59].

5.2. Gender as a Critical Moderator

Multi-group analysis revealed gender differences in user responses to SRs, providing insights into potential user preference patterns. Male participants showed stronger associations between communication style and emotional perceptions. The communication style–cuteness and communication style–warmth relationships were both stronger for males than females. This pattern differs from some documented gender–emotion relationships, suggesting potential context-specific responses in human–robot interaction. Female participants showed stronger associations between coolness perceptions and usage intentions. This pattern aligns with research in technology exhibition contexts, where female visitors attend more to aesthetic design elements while male visitors prioritize interaction depth [60]. This suggests female users may respond more strongly to design sophistication when forming usage intentions.
Warmth showed stronger links to social presence for female participants, while novelty–social presence associations were somewhat stronger for male participants, though this difference was not statistically significant. These gender-based patterns can be considered in relation to established theoretical frameworks. Male participants’ responsiveness to communication style presents an interesting pattern that may relate to expectation differences. Men may approach robot interactions with primarily task-oriented expectations, potentially experiencing stronger responses when robots display unexpected social capabilities.
Female participants’ responsiveness to coolness relates to segment-specific design preferences. Research indicates different design elements resonate differently with different user groups, with female consumers often showing heightened sensitivity to aesthetic and innovation elements when forming technology perceptions. These patterns suggest potential variations in how users of different genders respond to technology. Social responses to technology may vary based on both design characteristics and user attributes, with male and female users potentially responding to different aspects of robot design: interaction qualities for males and visual aesthetics for females.

5.3. Implications and Suggestions

5.3.1. Theoretical Implications

The results align with previous research across multiple domains while extending theoretical understanding in several ways. Our findings suggest variations in how social response principles manifest across design elements and user segments, extending work on computers as social actors by highlighting contextual and individual differences [23].
Regarding social presence, a key theoretical contribution emerges in the varying mediation patterns observed. While social presence has been established as a mediator in digital interactions [8], our findings reveal that this mediation varies systematically by emotional dimension—with warmth and novelty operating through this pathway, while cuteness and coolness influence acceptance through alternative mechanisms. This dual-pathway acceptance model challenges the uniform mediation models proposed in previous research [34], suggesting emotional dimensions may operate through different mechanisms. This nuanced understanding aligns with established research on human–robot interaction, which demonstrates that both cognitive processes (trust) and affective processes (emotional connection) significantly contribute to users’ continuance intentions through distinct psychological pathways [59].
Examining emotional design elements alongside technology acceptance provides a new perspective on the psychological processes linking design features to user responses. While functional factors remain central in technology acceptance models [76], these findings highlight how different emotional dimensions shape user responses through distinct pathways. The observed gender differences correspond with technology acceptance research [57], extending understanding of gender effects beyond utilitarian evaluations to encompass emotional response pathways.

5.3.2. Design Suggestions

The findings suggest two key design suggestions for SRs, as follows:
First, gender-differentiated communication approaches should be implemented based on user preferences. Male users responded more positively to informational communication styles that provide technical specifications and functional details about products or services. For female users, design sophistication and aesthetic elements appeared more relevant, suggesting that service organizations might explore visual enhancements in robot design, such as projection capabilities or responsive lighting effects.
Second, social presence enhancement features should be incorporated to improve user perceptions. Elements that personalize interactions—including memory systems that reference previous exchanges, contextually aware responses, personalized greeting systems, and appropriate emotional expressions—may fundamentally alter how users categorize robots. These design elements create a sense that the robot recognizes and adapts to individual users, potentially transforming what might be perceived as a mere tool into a social entity. Established research on human–robot interaction corroborates this strategy, showing that anthropomorphic design features strengthen user trust and emotional engagement, ultimately driving continued usage intentions [59]. Such differentiated design approaches addressing varying preferences across customer segments may significantly impact satisfaction and usage patterns [77].

6. Conclusions and Future Works

This research investigated SR acceptance factors in commercial settings, focusing on emotional design elements, communication style, and gender differences. Our findings offer both theoretical contributions and practical implications for SR design and deployment in retail and hospitality contexts.

6.1. Conclusions

This study examined relationships between SR design, emotional responses, and acceptance intentions. Results show emotional design elements follow distinct patterns: cuteness and coolness directly influenced usage intention, while warmth and novelty operated through social presence mediation. Gender analysis revealed males formed emotional connections primarily through communication style, while females responded more to aesthetic and technological attributes.
Our findings extend CASA principles to commercial contexts, demonstrating that social responses to technology vary across design elements and user segments. They connect emotional design with technology acceptance models, revealing parallel pathways to acceptance through different emotional dimensions, while indicating that social presence functions selectively rather than universally as a mediator. For practitioners, these results suggest focusing on communication style for male users’ emotional engagement, while emphasizing technological sophistication for females. Elements conveying warmth and novelty enhance social presence perceptions, potentially transforming user–SR interactions in commercial environments.

6.2. Limitations and Future Research

Our study offers valuable insights while acknowledging certain limitations that suggest avenues for future research. The research context was confined to shopping mall and hotel settings with their characteristic interaction patterns, while our sample consisted primarily of young East Asian adults and students. Furthermore, we focused on specific SR types currently deployed in these commercial environments, which may not represent the full spectrum of available designs.
These limitations suggest several promising research directions. Future studies could explore these relationships across diverse sectors like healthcare or education, conduct cross-cultural research with balanced demographic samples, and compare various robot designs across different deployment scenarios. Researchers should consider contextual variables such as customer density, interaction duration, and service complexity to develop frameworks that enhance SR acceptance across different user segments and operational settings.

Author Contributions

Conceptualization, G.R. and B.Z.; methodology, X.W. and B.Z.; software, G.R.; formal analysis, X.W.; investigation, X.W.; data curation, X.W.; validation, Z.H.; writing—original draft preparation, G.R. and X.W.; writing—review and editing, G.R., Z.H. and B.Z.; funding acquisition, B.Z. All authors have read and agreed to the published version of the manuscript.

Funding

This research was funded by (1) the Youth Fund Project of Humanities and Social Sciences Research of the Ministry of Education (No. 21YJC760101), (2) Fujian Province Social Science Foundation Project (No. FJ2025MGCA042), (3) 2024 Fujian Provincial Lifelong Education Quality Improvement Project (No. ZS24005), (4) Design and Development of Intelligent Individual Police Equipment (No. 2024CXY0409), (5) Key Technologies and Applications of Holographic Intelligent Training System (No. SKHX24007).

Institutional Review Board Statement

The study was conducted according to the guidelines of the Declaration of Helsinki and approved by the Institutional Review Board of School of Design Arts, Xiamen University of Technology (approval number: XMUT-SDA-IRB-2024-10/011, approval date: 11 October 2024.

Informed Consent Statement

Informed consent was obtained from all subjects involved in the study.

Data Availability Statement

All data are contained within the manuscript. Raw data are available from the corresponding author upon request.

Conflicts of Interest

The authors declare no conflict of interest.

Appendix A

Table A1. Theoretical framework of prior SR studies.
StudyContext/SettingMain VariablesTheory
Sharma et al.
[50]
Restaurant SRsNoveltyPLS-SEM
Machine learning (ML)
Perceived enjoyment
Perceived usefulness
Service speed
Repeated experience
Trust
Ruiz-Equihua et al.
[12]
SRsSocial cognitionCASA
Social cognition theory (SCT)
TAM
Psychological ownership
Anthropomorphism
Belanche et al.
[18]
SRsHuman-likenessPLS-SEM
High-velocity learning model (HVL)
Perceived competence
Perceived warmth
Service value expectations
Loyalty intentions
Huang et al.
[28]
Hospitality SRsCutenessStimulus–organism–response framework (S-O-R)
PLS-SEM
Interactivity
Coolness
Courtesy
Utility
Autonomy
Positive affect
Negative affect
Acceptance
Gan et al.
[26]
SRsAesthetics and preference evaluationKE
Affective design theory (ADT)
User perception theory (UPT)
Aesthetic features
Emotional features
Feature mapping relationship
Physical attribute 1
Physical attribute 2
Kansei word 1
Kansei word 2
Design and generation Process
Network training
Image generation
Detailed design
New social robot
Chen et al.
[78]
SRsPerceived privacy riskCommunication privacy management theory (CPMT)
Stimulus–organism–response framework (S-O-R)
PLS-SEM
Fuzzy-set qualitative comparative analysis (FsQCA)
Perceived privacy control
Anthropomorphism
Warmth
Competence
Transparency
Privacy concerns
Choi et al.
[79]
SRsWarmthPLS-SEM
Anthropomorphism theory (AT)
Apology
Explanation
Competence
Recovery efforts
Human–robot collaboration
Satisfaction/intention to use
Coronado et al.
[42]
Social and SRsKansei designCASA
Trust theory
SPT
User emotion
User experience satisfaction
Gao et al.
[3]
Domestic SRsUser acceptanceTAM
SPT
Consumer behavior theory (CBT)
Human–robot interaction
Social presence
Yim et al.
[43]
Humanoid SRsTrustCASA
Trust theory (TT)
SPT
Social presence
User satisfaction
Table A2. Demographic profile of respondents.
DemographicItemSubject (N = 318)
FrequencyPercentage
GenderMale10834%
Female21066%
Age0–20 years6921.70%
21–30 years20363.80%
31–40 years206.30%
41–50 years144.40%
51–60 years103.10%
>60 years20.60%
OccupationCivil servant92.80%
State-owned enterprise216.60%
Private enterprise5417.00%
Public institution216.60%
Foreign company51.60%
Student20865.40%
Education LevelUndergraduate17555.00%
Doctoral41.30%
Junior high school51.60%
Vocational/technical/high school154.70%
Master’s degree8727.40%
Associate’s degree3210.10%
Table A3. Scale reliability and validity.
ConstructItemsMeanSt.Dev.Factor LoadingCronbach’s AlphaCR (rho_a)CR (rho_c)AVE
UtilityUT15.5661.0160.8490.8030.8040.8840.717
UT25.5031.0950.839
UT35.3211.2660.853
AutonomyAT15.2831.1140.7790.7280.7290.8470.648
AT25.3491.1790.789
AT35.2581.2120.845
PersonificationPSN14.6791.4020.7210.7530.80.8580.669
PSN25.0911.1950.835
PSN35.3871.1990.889
CommunicationCS15.161.3440.8620.8660.8730.9180.789
CS25.3931.2660.905
CS35.3771.2470.896
CuteCT15.5571.2030.850.810.8180.8870.724
CT25.5031.1290.823
CT35.5661.1380.879
CoolnessCL15.561.1820.9040.7890.790.9040.826
CL35.5571.1550.914
WarmthWT15.611.1460.8610.7860.7920.8750.7
WT25.6291.160.839
WT35.5161.2120.809
NoveltyNO25.4971.1150.8770.7410.7480.8850.794
NO35.7741.0810.905
Social presenceSP15.781.080.8540.7830.7910.8730.697
SP25.6861.2390.787
SP35.8430.9970.861
Intention to useINT15.7611.0120.8790.7090.7090.8730.774
INT25.4591.1260.881
Table A4. Fornell–Larcker criterion analysis.
Construct12345678910
Personification0.818
Intention to use0.3840.88
Cute0.6230.5830.851
Utility0.5270.5130.6230.847
Novelty0.5430.5480.690.5240.891
Communication0.6690.5510.6570.580.5740.888
Warmth0.5590.5030.690.5730.6620.5820.836
Social presence0.40.3940.3940.3550.4760.3380.4460.835
Autonomy0.5980.4220.5550.6560.4870.4660.5990.4360.805
Coolness0.5080.5360.6670.5310.5940.540.6880.360.5160.909
Note: Diagonal elements are the square root of AVE.
Table A5. HTMT ratio.
Construct12345678910
Personification
Intention to use0.502
Cute0.7720.768
Utility0.6620.6790.771
Novelty0.7020.7530.8860.678
Communication0.7980.7020.7740.6910.708
Warmth0.710.6660.8540.7130.8590.695
Social presence0.5290.5270.4910.4490.6190.4040.569
Autonomy0.8110.5870.7220.8590.660.5870.7930.581
Coolness0.6460.7150.8290.6670.7730.6510.870.4590.679
Table A6. Summary of the results.
HCauseEffectβTpResult
H1aUtilityCute0.2543.3750.001Supported
H1bUtilityNovelty0.1772.3550.019Supported
H1cUtilityWarmth0.1572.1670.03Supported
H1dUtilityCoolness0.1872.310.021Supported
H2aAutonomyCute0.1171.8750.061Not supported
H2bAutonomyNovelty0.1281.6670.096Not supported
H2cAutonomyWarmth0.2994.7540Supported
H2dAutonomyCoolness0.2042.7890.005Supported
H3aPersonificationCute0.2082.8040.005Supported
H3bPersonificationNovelty0.1771.9510.051Not supported
H3cPersonificationWarmth0.1131.6420.101Not supported
H3dPersonificationCoolness0.1141.5230.128Not supported
H4aCommunicationCute0.3164.1910Supported
H4bCommunicationNovelty0.2933.8710Supported
H4cCommunicationWarmth0.2763.6310Supported
H4dCommunicationCoolness0.2603.2750.001Supported
H5aCuteIntention to use0.2793.2550.001Supported
H5bCuteSocial presence0.0230.250.803Not supported
H6aCoolnessIntention to use0.1992.8480.004Supported
H6bCoolnessSocial presence0.0120.1530.878Not supported
H7aWarmthIntention to use−0.0010.0080.993Not supported
H7bWarmthSocial presence0.2172.3390.019Supported
H8aNoveltyIntention to use0.1772.2990.022Supported
H8bNoveltySocial presence0.3103.8830Supported
H9aSocial presenceIntention to use0.1282.2370.025Supported
Note: CV stands for control variable.

References

  1. Balaji, M.S.; Jiang, Y.; Zhang, X. Robots in service: How robot capabilities and personalities drive customer value co-creation and satisfaction. Int. J. Contemp. Hosp. Manag. 2025, 37, 1016–1035. [Google Scholar] [CrossRef]
  2. Chang, S.-T. Influence of robot coolness and affinity on behavioral intention: Examining perceived value as a mediating factor. J. Hosp. Tour. Technol. 2024, 15, 825–841. [Google Scholar] [CrossRef]
  3. Gao, Y.; Chang, Y.; Yang, T.; Yu, Z. Consumer acceptance of social robots in domestic settings: A human-robot interaction perspective. J. Retail. Consum. Serv. 2025, 82, 104075. [Google Scholar] [CrossRef]
  4. Chi, O.H.; Chi, C.G.; Gursoy, D.; Nunkoo, R. Customers’ acceptance of artificially intelligent service robots: The influence of trust and culture. Int. J. Inf. Manag. 2023, 70, 102623. [Google Scholar] [CrossRef]
  5. Blut, M.; Wang, C.; Wünderlich, N.V.; Brock, C. Understanding anthropomorphism in service provision: A meta-analysis of physical robots, chatbots, and other AI. J. Acad. Mark. Sci. 2021, 49, 632–658. [Google Scholar] [CrossRef]
  6. Jörling, M.; Böhm, R.; Paluch, S. Service robots: Drivers of perceived responsibility for service outcomes. J. Serv. Res. 2019, 22, 404–420. [Google Scholar] [CrossRef]
  7. Janson, A. How to leverage anthropomorphism for chatbot service interfaces: The interplay of communication style and personification. Comput. Hum. Behav. 2023, 149, 107954. [Google Scholar] [CrossRef]
  8. Kim, K.J.; Park, E.; Sundar, S.S. Caregiving role in human–robot interaction: A study of the mediating effects of perceived benefit and social presence. Comput. Hum. Behav. 2013, 29, 1799–1806. [Google Scholar] [CrossRef]
  9. Maeiro, J.; Dias, Á.; Pereira, L. Cuteness vs. usefulness: A dual perspective on service robot acceptance in the travel industry. J. Theor. Appl. Electron. Commer. Res. 2025, 20, 48. [Google Scholar] [CrossRef]
  10. Alam, A.; Lwin, M.; Khan, A.; Mubin, O. Impact of robot size and number on human–robot persuasion. Information 2024, 15, 782. [Google Scholar] [CrossRef]
  11. Alma Çallı, B.; Çallı, L.; Sarı Çallı, D.; Çallı, F. The impact of different types of service-robot usage in hotels on guests’ intention to stay. J. Hosp. Tour. Technol. 2023, 14, 53–68. [Google Scholar] [CrossRef]
  12. Ruiz-Equihua, D.; Romero, J.; Loureiro, S.M.C.; Ali, M. Human–robot interactions in the restaurant setting: The role of social cognition, psychological ownership and anthropomorphism. Int. J. Contemp. Hosp. Manag. 2023, 35, 1966–1985. [Google Scholar] [CrossRef]
  13. Kim, J.; Im, I. Anthropomorphic response: Understanding interactions between humans and artificial-intelligence agents. Comput. Hum. Behav. 2023, 139, 107512. [Google Scholar] [CrossRef]
  14. Yu, X.; Xu, Z.; Song, Y.; Liu, X. The cuter, the better? The impact of cuteness on intention to purchase AI voice assistants: A moderated serial-mediation model. Front. Psychol. 2022, 13, 1036848. [Google Scholar] [CrossRef]
  15. Wu, J.-J.; Chang, S.-T.; Lin, Y.-P.; Lin, T.M.Y. Examining how coolness of service robots influences customers’ delight: Mediating role of perceived values. J. Hosp. Tour. Insights 2024, 7, 2624–2642. [Google Scholar] [CrossRef]
  16. Alves-Oliveira, P.; Orr, A.; Björling, E.A.; Cakmak, M. Connecting the dots of social-robot design from interviews with robot creators. Front. Robot. AI 2022, 9, 720799. [Google Scholar] [CrossRef]
  17. Bevilacqua, R.; Felici, E.; Cavallo, F.; Amabili, G.; Maranesi, E. Designing acceptable robots for assisting older adults: A pilot study on the willingness to interact. Int. J. Environ. Res. Public Health 2021, 18, 10686. [Google Scholar] [CrossRef]
  18. Belanche, D.; Casaló, L.V.; Schepers, J.; Flavián, C. Examining the effects of robots’ physical appearance, warmth, and competence in frontline services: The humanness-value-loyalty model. Psychol. Mark. 2021, 38, 2357–2376. [Google Scholar] [CrossRef]
  19. Huang, D.; Chen, Q.; Huang, J.; Kong, S.; Li, Z. Customer-robot interactions: Understanding customer experience with service robots. Int. J. Hosp. Manag. 2021, 99, 103078. [Google Scholar] [CrossRef]
  20. Davis, F.D. Perceived usefulness, perceived ease of use, and user acceptance of information technology. MIS Q. 1989, 13, 319–340. [Google Scholar] [CrossRef]
  21. Marangunić, N.; Granić, A. Technology acceptance model: A literature review from 1986 to 2013. Univ. Access Inf. Soc. 2014, 14, 81–95. [Google Scholar] [CrossRef]
  22. Pal, D.; Babakerkhell, M.D.; Papasratorn, B.; Funilkul, S. Intelligent attributes of voice assistants and users’ love for AI: A SEM-based study. IEEE Access 2023, 11, 60889–60903. [Google Scholar] [CrossRef]
  23. Gu, C.; Zhang, Y.; Zeng, L. Exploring the mechanism of sustained consumer trust in AI chatbots after service failures: A perspective based on attribution and CASA theories. Humanit. Soc. Sci. Commun. 2024, 11, 1400. [Google Scholar] [CrossRef]
  24. Nass, C.; Moon, Y.; Fogg, B.J.; Reeves, B.; Dryer, D.C. Can computer personalities be human personalities? Int. J. Hum.–Comput. Stud. 1995, 43, 223–239. [Google Scholar] [CrossRef]
  25. Nagamachi, M. Kansei engineering and comfort. Int. J. Ind. Ergon. 1997, 19, 79–80. [Google Scholar] [CrossRef]
  26. Gan, Y.; Ji, Y.; Jiang, S.; Liu, X.; Feng, Z.; Li, Y.; Liu, Y. Integrating aesthetic and emotional preferences in social-robot design: An affective-design approach with Kansei engineering and deep convolutional generative adversarial network. Int. J. Ind. Ergon. 2021, 83, 103128. [Google Scholar] [CrossRef]
  27. Song, C.S.; Kim, Y.-K. The role of the human-robot interaction in consumers’ acceptance of humanoid retail service robots. J. Bus. Res. 2022, 146, 329–339. [Google Scholar] [CrossRef]
  28. Huang, D.; Chen, Q.; Huang, S.; Liu, X. Consumer intention to use service robots: A cognitive–affective–conative framework. Int. J. Contemp. Hosp. Manag. 2024, 36, 1275–1298. [Google Scholar] [CrossRef]
  29. Shehawy, Y.M.; Ali Khan, S.M.F.; Khalufi, N.A.M.; Abdullah, R.S. Customer adoption of robot: Synergizing customer acceptance of robot-assisted retail technologies. J. Retail. Consum. Serv. 2025, 82, 104062. [Google Scholar] [CrossRef]
  30. Liu, X.; Yi, X.; Wan, L.C. Friendly or competent? The effects of perception of robot appearance and service context on usage intention. Ann. Tour. Res. 2022, 92, 103324. [Google Scholar] [CrossRef]
  31. Alam, S.; Abdullah, S.; Kokash, H.; Ahmed, S.; Omar, N. Consumer acceptance of retail service robots: Mediating role of pleasure and arousal. J. Decis. Syst. 2024, 33, 1–27. [Google Scholar] [CrossRef]
  32. Lin, B.; Lee, W.; Yang, R.; Lim, E. Examining the effects of values and risks on outdoor food-delivery robot adoption using mixed methods: Different stakeholders’ perspectives. Inf. Technol. Tour. 2025, 27, 157–188. [Google Scholar] [CrossRef]
  33. Lin, G.-Y.; Jhang, C.-C.; Wang, Y.-S. Factors affecting parental intention to use AI-based social robots for children’s ESL learning. Educ. Inf. Technol. 2024, 29, 6059–6086. [Google Scholar] [CrossRef]
  34. Cavusoglu, M.; Collins, G.R.; DeMicco, F.; Cobanoglu, C. Robot acceptance and service quality in food delivery: An expanded TAM-based study. Int. J. Hum.–Comput. Interact. 2025, 41, 1–16. [Google Scholar] [CrossRef]
  35. So, K.K.F.; Kim, H.; Liu, S.Q.; Fang, X.; Wirtz, J. Service robots: The dynamic effects of anthropomorphism and functional perceptions on consumers’ responses. Eur. J. Mark. 2024, 58, 1–32. [Google Scholar] [CrossRef]
  36. Li, Q.; Jiang, S. Perceptual service-robot attributes affecting customer value co-creation intention in luxury-hotel industry. Innov. Mark. 2025, 21, 89–104. [Google Scholar] [CrossRef]
  37. Moliner-Tena, M.Á.; Callarisa-Fiol, L.J.; Sánchez-García, J.; Rodríguez-Artola, R.M. Service robots and memorable customer experience: The influence of perceived anthropomorphism. Futur. Bus. J. 2025, 11, 75. [Google Scholar] [CrossRef]
  38. Gong, T. The dark side of robot anthropomorphism: Cognitive load, stress, and dysfunctional customer behavior. Serv. Ind. J. 2025, 45, 1–29. [Google Scholar] [CrossRef]
  39. Reimann, M.M.; Hindriks, K.V.; Kunneman, F.A.; Oertel, C.; Skantze, G.; Leite, I. What can you say to a robot? Capability communication leads to more natural conversations. arXiv 2025, arXiv:2502.01448. [Google Scholar]
  40. Al-Oraini, B.S. Chatbot dynamics: Trust, social presence and customer satisfaction in AI-driven services. J. Inf. Digit. Technol. 2025, 9, 1–18. [Google Scholar] [CrossRef]
  41. Nagamachi, M. Kansei engineering as an ergonomic consumer-oriented technology for product development. Int. J. Ind. Ergon. 1995, 15, 3–11. [Google Scholar] [CrossRef]
  42. Coronado, E.; Venture, G.; Yamanobe, N. Applying Kansei/affective-engineering methodologies in the design of social and service robots: A systematic review. Int. J. Soc. Robot. 2021, 13, 1161–1171. [Google Scholar] [CrossRef]
  43. Yim, A.; Cui, A.P.; Walsh, M. The role of cuteness on consumer attachment to artificial-intelligence agents. J. Res. Interact. Mark. 2024, 18, 127–141. [Google Scholar] [CrossRef]
  44. Huo, J.; Gong, L.; Xi, Y.; Chen, Y.; Chen, D.; Yang, Q. Mind the voice! The effect of service-robot voice vividness on service-failure tolerance. J. Travel Tour. Mark. 2025, 42, 1–19. [Google Scholar] [CrossRef]
  45. Guerreiro, J.; Loureiro, S.M.C. I am attracted to my cool smart assistant! Analysing attachment–aversion in AI–human relationships. J. Bus. Res. 2023, 161, 113863. [Google Scholar] [CrossRef]
  46. Podsakoff, P.M.; MacKenzie, S.B.; Lee, J.-Y.; Podsakoff, N.P. Common method biases in behavioral research: A critical review of the literature and recommended remedies. J. Appl. Psychol. 2003, 88, 879–903. [Google Scholar] [CrossRef] [PubMed]
  47. Ali, F.; Sesliokuyucu, O.S.; Khan, K.A.; Alotaibi, S.; Wu, C. The impact of robotic gastronomic experiences on customer value, delight and loyalty in service-robot restaurants. Int. J. Hum.-Comput. Interact. 2024, 40, 1–13. [Google Scholar] [CrossRef]
  48. van Pinxteren, M.M.E.; Wetzels, R.W.H.; Rüger, J.; Pluymaekers, M.; Wetzels, M. Trust in humanoid robots: Implications for services marketing. J. Serv. Mark. 2019, 33, 507–518. [Google Scholar] [CrossRef]
  49. Yoganathan, V.; Osburg, V.-S.; Kunz, W.H.; Toporowski, W. Check-in at the robo-desk: Effects of automated social presence on social cognition and service implications. Tour. Manag. 2021, 85, 104309. [Google Scholar] [CrossRef]
  50. Sharma, V.; Kapse, M.; Poulose, J.; Mahajan, Y. Robotic dining delight: Unravelling the key factors driving customer satisfaction in service-robot restaurants using PLS-SEM and ML. Cogent Bus. Manag. 2023, 10, 2281053. [Google Scholar] [CrossRef]
  51. Terrah, A.; Ali, F.; Abbasi, G.A.; Doğan, S.; Cobanoglu, C. Determinants of users’ intentions to use AI-enabled technological innovations in hotels: A hybrid approach using PLS-SEM and fsQCA. Adv. Hosp. Tour. Res. 2024, 12, 200–228. [Google Scholar] [CrossRef]
  52. Jaganathan, M.; Perumal, S.; Shaari, H.; Sulaiman, Y.; Mat, N.K.N. Consumer attitude as a mediator in the adoption of smart-retail technologies in emerging markets. Multidiscip. Rev. 2024, 8, 2025101. [Google Scholar] [CrossRef]
  53. De Cicco, R.; Silva, S.C.; Alparone, F.R. Millennials’ attitude toward chatbots: An experimental study in a social-relationship perspective. Int. J. Retail Distrib. Manag. 2020, 48, 1213–1233. [Google Scholar] [CrossRef]
  54. Čaić, M.; Avelino, J.; Mahr, D.; Odekerken-Schröder, G.; Bernardino, A. Robotic versus human coaches for active aging: An automated-social-presence perspective. Int. J. Soc. Robot. 2020, 12, 867–882. [Google Scholar] [CrossRef]
  55. Zhou, T.; Wu, X. Examining generative-AI user disclosure intention: A perceived-affordance perspective. J. Theor. Appl. Electron. Commer. Res. 2025, 20, 99. [Google Scholar] [CrossRef]
  56. Tai, Y.-H.; Nwachukwu, P.T.T.; LePage, B.A.; Fang, W.-T. Examining customer intentions to purchase intelligent-robotic products and services in Taiwan using the theory of planned behaviour. BMC Psychol. 2024, 12, 351. [Google Scholar] [CrossRef]
  57. Chi, R.; Zhang, J.; Pan, M. The effect of anthropomorphic competence-warmth congruence of service robots on recommendation intention. Curr. Psychol. 2024, 43, 6570–6583. [Google Scholar] [CrossRef]
  58. Kumar, S.; Poudyal, A.; Choudhury, S.; Jha, A. Analysing customer preferences for AI-enabled service-robot physical appearance in the tourism and hospitality industry: Insights and exploration. Tour. Plann. Dev. 2025, 22, 1–18. [Google Scholar]
  59. Yang, Y.; Cho, H.-K.; Kim, M.-Y. Factors affecting the continuance-usage intention of social robots with episodic memory: A stimulus–organism–response perspective. Appl. Sci. 2025, 15, 5334. [Google Scholar] [CrossRef]
  60. Wong, A.; Wong, J. Service-robot acceptance in museums: An empirical study using the service-robot acceptance model (sRAM). J. Serv. Manag. 2024, 38, 619–635. [Google Scholar] [CrossRef]
  61. Stockton, R.; Kerlinger, F.N. Foundations of behavioral research. Am. Educ. Res. J. 1974, 11, 292. [Google Scholar] [CrossRef]
  62. Huang, T.; Wang, G.; Huang, C. What promotes the mobile-payment behavior of the elderly? Humanit. Soc. Sci. Commun. 2024, 11, 163. [Google Scholar]
  63. Fornell, C.; Larcker, D.F. Evaluating structural equation models with unobservable variables and measurement error. J. Mark. Res. 1981, 18, 39–50. [Google Scholar] [CrossRef]
  64. Hair, J.F.; Risher, J.J.; Sarstedt, M.; Ringle, C.M. When to use and how to report the results of PLS-SEM. Eur. Bus. Rev. 2019, 31, 2–24. [Google Scholar]
  65. Kaiser, H.F. The application of electronic computers to factor analysis. Educ. Psychol. Meas. 1960, 20, 141–151. [Google Scholar] [CrossRef]
  66. Fang, S.; Han, X.; Chen, S. Hotel guest-robot interaction experience: A scale development and validation. J. Hosp. Tour. Manag. 2024, 58, 1–10. [Google Scholar] [CrossRef]
  67. Abou Allaban, A.; Wang, M.; Padır, T. A systematic review of robotics research in support of in-home care for older adults. Information 2020, 11, 75. [Google Scholar] [CrossRef]
  68. Stone, M. Cross-validatory choice and assessment of statistical predictions. J. R. Stat. Soc. Ser. B 1974, 36, 111–133. [Google Scholar] [CrossRef]
  69. Lampropoulos, G. Social robots in education: Current trends and future perspectives. Information 2025, 16, 29. [Google Scholar] [CrossRef]
  70. Santiago, J.; Borges-Tiago, M.T.; Tiago, F. Embracing RAISA in restaurants: Exploring customer attitudes toward robot adoption. Technol. Forecast. Soc. Change 2024, 199, 123047. [Google Scholar] [CrossRef]
  71. Wold, H. The partial least squares approach to structural equation modeling. In Handbook of Multivariate Experimental Psychology, 2nd ed.; Nesselroade, J.R., Cattell, R.B., Eds.; Plenum: New York, NY, USA, 1986; pp. 587–634. [Google Scholar]
  72. Geisser, S. A predictive approach to the random-effect model. Biometrika 1974, 61, 101–107. [Google Scholar] [CrossRef]
  73. Osakwe, C.N.; Říha, D.; Elgammal, I.M.Y.; Ramayah, T. Understanding Gen Z shoppers’ interaction with customer-service robots: A cognitive-affective-normative perspective. Int. J. Retail Distrib. Manag. 2024, 52, 103–120. [Google Scholar] [CrossRef]
  74. Lei, C.; Hossain, M.S.; Wong, E. Determinants of repurchase intentions of hospitality services delivered by artificially intelligent service robots. Sustainability 2023, 15, 4914. [Google Scholar] [CrossRef]
  75. Lei, X.; Liu, F. How service robots facilitate user self-disclosure: The roles of personality, animacy, and automated social presence. Int. J. Hum.-Comput. Interact. 2025, 41, 2135–2148. [Google Scholar] [CrossRef]
  76. Li, J.; Hudson, S.; So, K.K.F. Hedonic consumption pathway vs. acquisition-transaction utility pathway: An empirical comparison of Airbnb and hotels. Int. J. Hosp. Manag. 2021, 94, 102844. [Google Scholar] [CrossRef]
  77. Wu, M.; Tse, W.T.S.; Tung, V.W.S. Enhancing intellectual experiences for users: A multidimensional model of humanoid service robots in hospitality and tourism. Int. J. Contemp. Hosp. Manag. 2025, 37, 1–25. [Google Scholar] [CrossRef]
  78. Chen, Y.; Wu, X.; Jia, F.; Yang, J.; Bai, X.; Yu, R. Exploring the impact of social-robot design characteristics on users’ privacy concerns: Evidence from PLS-SEM and FsQCA. Int. J. Hum.-Comput. Interact. 2024, 40, 1–22. [Google Scholar] [CrossRef]
  79. Choi, S.; Mattila, A.S.; Bolton, L.E. To err is human(-oid): How do consumers react to robot service failure and recovery? J. Serv. Res. 2021, 24, 354–371. [Google Scholar] [CrossRef]
Figure 1. The specific structural diagram of the research model.
Information 16 00463 g001
Figure 2. Structural relationships and coefficients among constructs.
Information 16 00463 g002
Figure 3. Multi-group analysis results: Gender moderation effects on path coefficients. Significance levels: *: p < 0.05; ***: p < 0.001.
Information 16 00463 g003
Table 1. Measurement constructs and questionnaire items.
ConstructItemDescriptionSource
UtilityUT1The functions provided by SRs in the shopping malls and hotels are very useful to me.Huang et al. [28]
UT2SRs can efficiently complete their tasks, which increases my satisfaction.
UT3SRs have rich functions that can meet my various needs in shopping malls and hotels.
AutonomyAT1I am impressed by the autonomy shown by SRs when performing tasks.Huang et al. [28]
Jörling et al. [6]
AT2SRs can independently complete tasks without human intervention.
AT3The autonomous decision-making ability of SRs enhances my trust in them.
PersonificationPSN1The appearance design of SRs makes me feel they are more like humans.Chi et al. [57]
PSN2The behaviors and reactions of SRs make me feel they have humanized qualities.
PSN3The humanized characteristics of SRs increase my willingness to interact with them.
Communication StyleCS1The communication method of SRs makes me feel they are friendly and approachable.Janson et al. [7]
CS2The language expression of SRs is clear and easy to understand.
CS3The communication style of SRs makes me feel comfortable and willing to communicate with them.
CutenessCT1The appearance design of SRs makes me think they are cute.Maeiro et al. [9]
CT2The behaviors and sounds of SRs make me feel they have cute qualities.
CT3The cuteness of SRs makes me more willing to interact with them.
CoolnessCL1The high-tech features of SRs make me think they are cool.Wu et al. [15]
CL2The unique functions and design of SRs make me think they are attractive.
CL3The coolness of SRs has generated my interest in them.
WarmthWT1The interaction method of SRs makes me feel they are friendly.Belanche et al. [18]
WT2The good personality of SRs makes me willing to communicate with them.
WT3The harmless characteristics of SRs make me feel at ease.
NoveltyNO1The novel functions of SRs make me think they are interesting.Sharma et al. [50]
NO2The unique design of SRs makes me feel they are different from others.
NO3The novelty of SRs makes me willing to try interacting with them.
Social presenceSP1The presence of SRs enhances my social experience in shopping malls and hotels.De Cicco et al. [53]
SP2Interaction with SRs makes me feel a presence in social activity occasions, just like other customers.
SP3The social presence of SRs makes me more willing to accept their services.
Intention to useINT1You are willing to use SRs again in the future.Wong et al. [60]
INT2You would recommend others to use the SRs.
INT3You think the presence of SRs has influenced your willingness to use it again.
Table 2. MGA results.
HCauseEffectβ (Male)β (Female)Original DifferenceDifference
Δβ (M-F)
H1aUtilityCute0.1680.291−0.122 ***0.443
H1bUtilityNovelty0.1760.213−0.037 ***0.813
H1cUtilityWarmth0.1030.16−0.057 ***0.749
H1dUtilityCoolness0.1640.1210.043 *0.832
H2aAutonomyCute0.0640.294−0.23 ***0.097
H2bAutonomyNovelty0.1280.147−0.018 ***0.912
H2cAutonomyWarmth0.250.414−0.164 ***0.223
H2dAutonomyCoolness0.1380.431−0.293 ***0.055
H3aPersonificationCute0.1710.291−0.119 ***0.447
H3bPersonificationNovelty0.1780.140.039 *0.839
H3cPersonificationWarmth0.0730.19−0.118 ***0.45
H3dPersonificationCoolness0.1090.0810.028 *0.876
H4aCommunicationCute0.4850.013*0.4720.001 ***
H4bCommunicationNovelty0.3460.2130.1330.403
H4cCommunicationWarmth0.4120.0730.3390.04 **
H4dCommunicationCoolness0.3760.0870.2890.106
H5aCuteIntention to use0.2540.368−0.115 ***0.544
H5bCuteSocial presence0.002 **0.149−0.147 ***0.458
H6aCoolnessIntention to use0.0870.399−0.311 ***0.038 *
H6bCoolnessSocial presence0.052−0.098 ***0.150.365
H7aWarmthIntention to use0.137−0.275 ***0.4130.018 *
H7bWarmthSocial presence0.1930.298−0.105 ***0.588
H8aNoveltyIntention to use0.1870.1440.043 *0.799
H8bNoveltySocial presence0.3660.140.2270.196
H9aSocial presenceIntention to use0.1440.0990.045 *0.705
Note: *: p < 0.05; **: p < 0.01; ***: p < 0.001, M and F stand for male and female, respectively.
Disclaimer/Publisher’s Note: The statements, opinions and data contained in all publications are solely those of the individual author(s) and contributor(s) and not of MDPI and/or the editor(s). MDPI and/or the editor(s) disclaim responsibility for any injury to people or property resulting from any ideas, methods, instructions or products referred to in the content.

