

Strategic Information Patterns in Advertising: A Computational Analysis of Industry-Specific Message Strategies Using the FCB Grid Framework

Abstract
1. Introduction
2. Theoretical Background and Related Work
2.1. Message Strategies in Advertising
2.2. The FCB Grid Framework
- Informative (High Involvement, Think): Characterized by rational decision-making for important purchases, this quadrant suggests an “learn–feel–do” sequence where consumers seek information before developing attitudes and making purchase decisions. Products typically positioned in this quadrant include major appliances, insurance, and high-end technology.
- Affective (High Involvement, Feel): Focusing on emotional appeals for important purchases, this quadrant follows a “feel–learn–do” sequence where emotional responses precede cognitive processing. Luxury goods, fashion, and cosmetics often employ strategies aligned with this quadrant.
- Habitual (Low Involvement, Think): Emphasizing routine purchases driven by habit and minimal cognitive processing, this quadrant suggests a “do–learn–feel” sequence where trial often precedes attitude formation. Household staples and convenience goods typically fall into this category.
- Satisfaction (Low Involvement, Feel): Targeting small pleasures and social/ego gratifications, this quadrant follows a “do–feel–learn” sequence where purchase behavior precedes emotional response and cognitive processing. Snack foods, alcohol, and entertainment products often employ strategies aligned with this quadrant.
2.3. Computational Approaches to Advertising Analysis
2.4. Industry-Specific Advertising Patterns
3. Data and Methods
3.1. Data Source and Descriptive Statistics
3.2. The AiSAC System: Technical Architecture and Capabilities
3.3. Topic Modeling for Message Strategy Identification
- Number of topics (k): 5;
- Maximum iterations: 10;
- Random state: 42 (for reproducibility);
- Document-term matrix: Created using CountVectorizer with max_df = 0.95 and min_df = 2.
- Emotional Appeal: Keywords related to emotions, feelings, and psychological states;
- Product Features: Keywords describing product attributes, functions, and benefits;
- Visual Techniques: Keywords related to visual presentation, camera techniques, and aesthetics;
- Setting and Objects: Keywords describing environments, objects, and physical contexts;
- Entertainment and Promotion: Keywords related to entertainment, humor, and promotional elements.
3.4. Analytical Approach
3.4.1. Industry-Specific Message Strategy Distribution Analysis
3.4.2. Temporal Evolution Analysis
3.4.3. Message Complexity Analysis
- Strategy Diversity Index (SDI): Measured using Shannon’s entropy formula applied to the topic probability distribution of each advertisement. Higher entropy values indicate more diverse use of multiple message strategies within a single advertisement.
- Content Density Score (CDS): Calculated as a weighted sum of detected objects, text elements, scene transitions, and audio complexity, normalized to a 0–100 scale. Higher scores indicate greater content density and complexity.
3.4.4. FCB Grid Mapping and Validation
- Think/Feel Dimension: Calculated as the standardized difference between rational appeals (product features + setting and objects) and emotional appeals (emotional appeal + entertainment and promotion), with visual techniques considered neutral. Positive values indicate think-dominant strategies, while negative values indicate feel-dominant strategies.
- Involvement Dimension: Operationalized using a combination of message complexity metrics (SDI and CDS) and advertisement duration, with longer, more complex advertisements indicating higher involvement. Values were standardized to create a continuous involvement scale.
4. Results
4.1. Industry-Specific Message Strategy Distribution
- Food Industry: Demonstrated a balanced approach with a slight preference for entertainment and promotion (26.8%) and setting and objects (24.3%). This industry showed the highest usage of settings and objects among all the industries, often featuring food preparation environments and consumption contexts.
- Services Industry: Exhibited the strongest emphasis on emotional appeal (32.7%), significantly higher than the other industries (p < 0.001). Services advertisements frequently leveraged emotional narratives to establish trust and connection with consumers.
- IT and Telecom Industry: Displayed the highest usage of product features (38.4%) and visual techniques (21.6%) among all the industries. This pattern reflects the industry’s focus on communicating technological capabilities and innovative design elements.
- Household Goods Industry: Showed a relatively balanced distribution with a preference for setting and objects (27.9%) and product features (25.8%). Advertisements in this category frequently demonstrated products within home environments to illustrate practical applications.
- Public Institutions: Exhibited the highest proportion of emotional appeal (30.5%) and entertainment and promotion (24.7%) strategies. These advertisements often employed emotional narratives and entertaining elements to engage citizens and promote public initiatives.
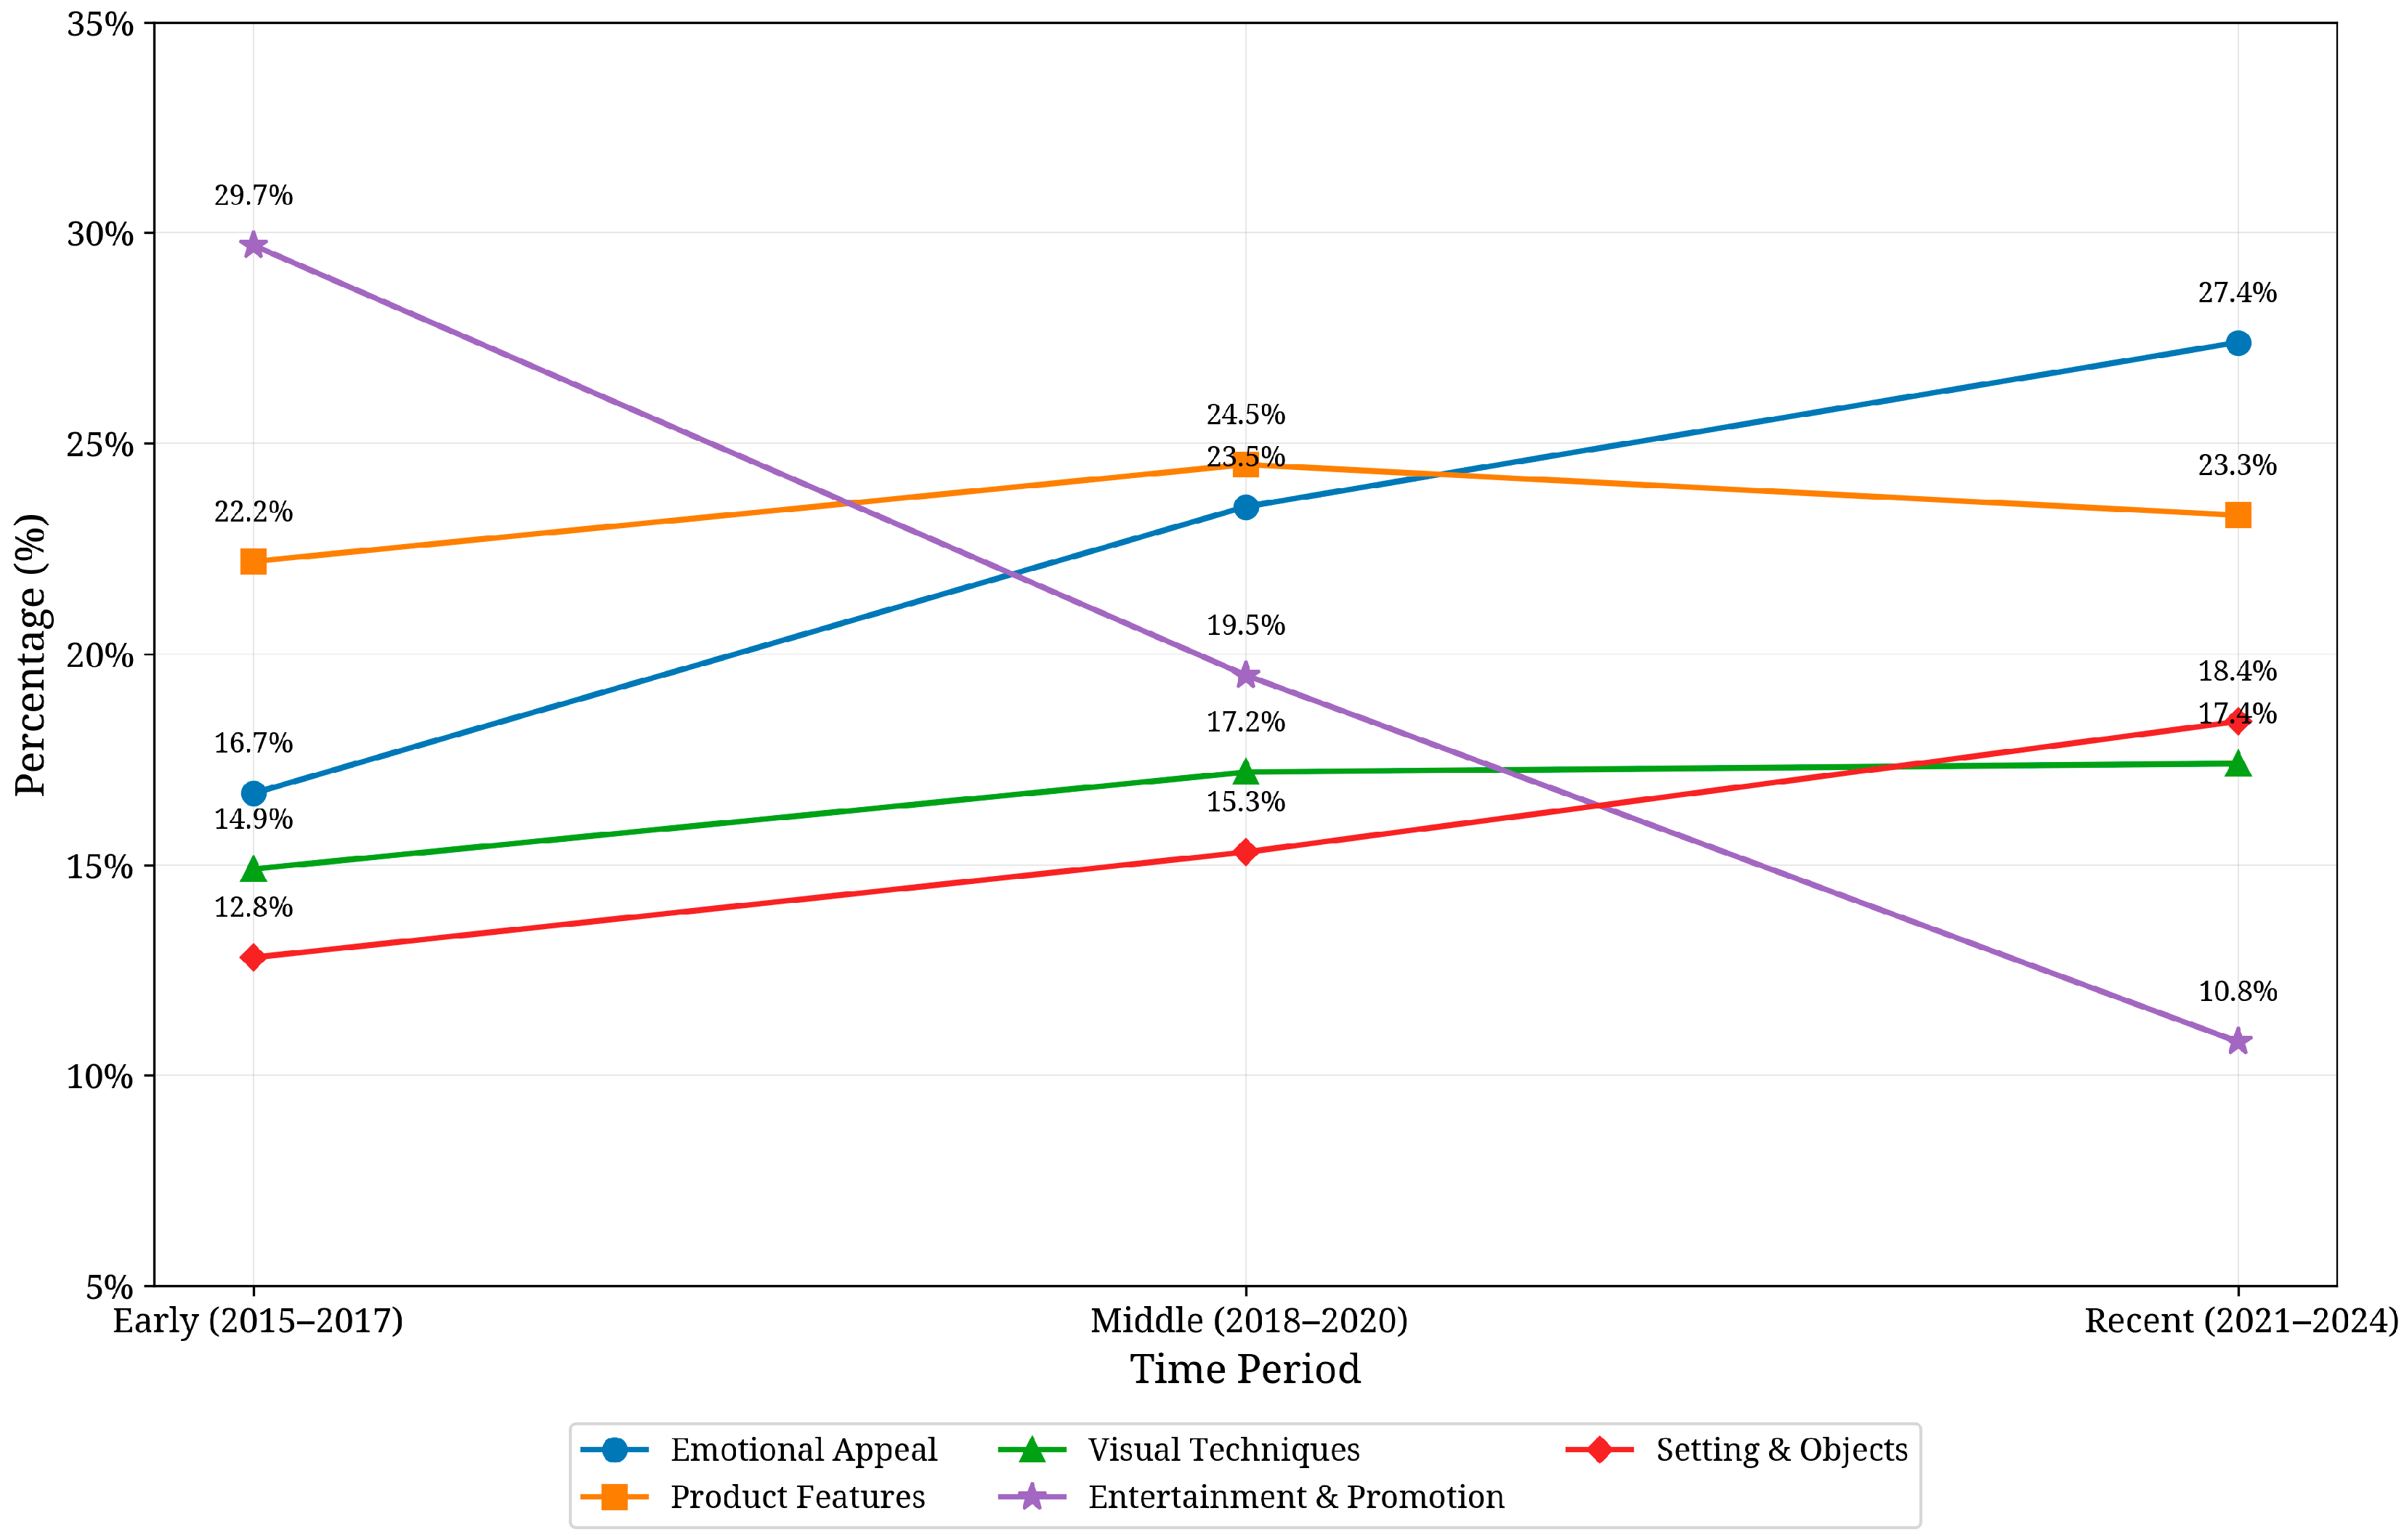
4.2. Temporal Evolution of Message Strategies
- Increase in Emotional Appeal: Emotional appeal strategies increased significantly from 18.7% in 2015–2017 to 27.0% in 2021–2024 (Δ = +44.3%, p < 0.001), representing the largest proportional increase among all strategies. This trend was particularly pronounced in the Services and Public Institutions industries.
- Decline in Entertainment and Promotion: Conversely, entertainment and promotion strategies decreased from 29.7% in 2015–2017 to 10.8% in 2021–2024 (Δ = −63.6%, p < 0.001), representing a substantial shift away from promotion-focused advertising.
- Stability in Product Features: Product features remained relatively stable over time, with a slight increase from 18.3% to 19.8% (Δ = +8.2%, p = 0.042), suggesting the enduring importance of product-focused messaging across industries.
- Growth in Visual Techniques: Visual techniques showed moderate growth from 8.7% to 14.5% (Δ = +66.7%, p < 0.001), reflecting the increasing sophistication of visual storytelling in advertising.
- Moderate Increase in Setting and Objects: Setting and object strategies increased from 24.6% to 27.9% (Δ = +13.4%, p = 0.003), indicating a growing emphasis on contextual presentation of products and services.
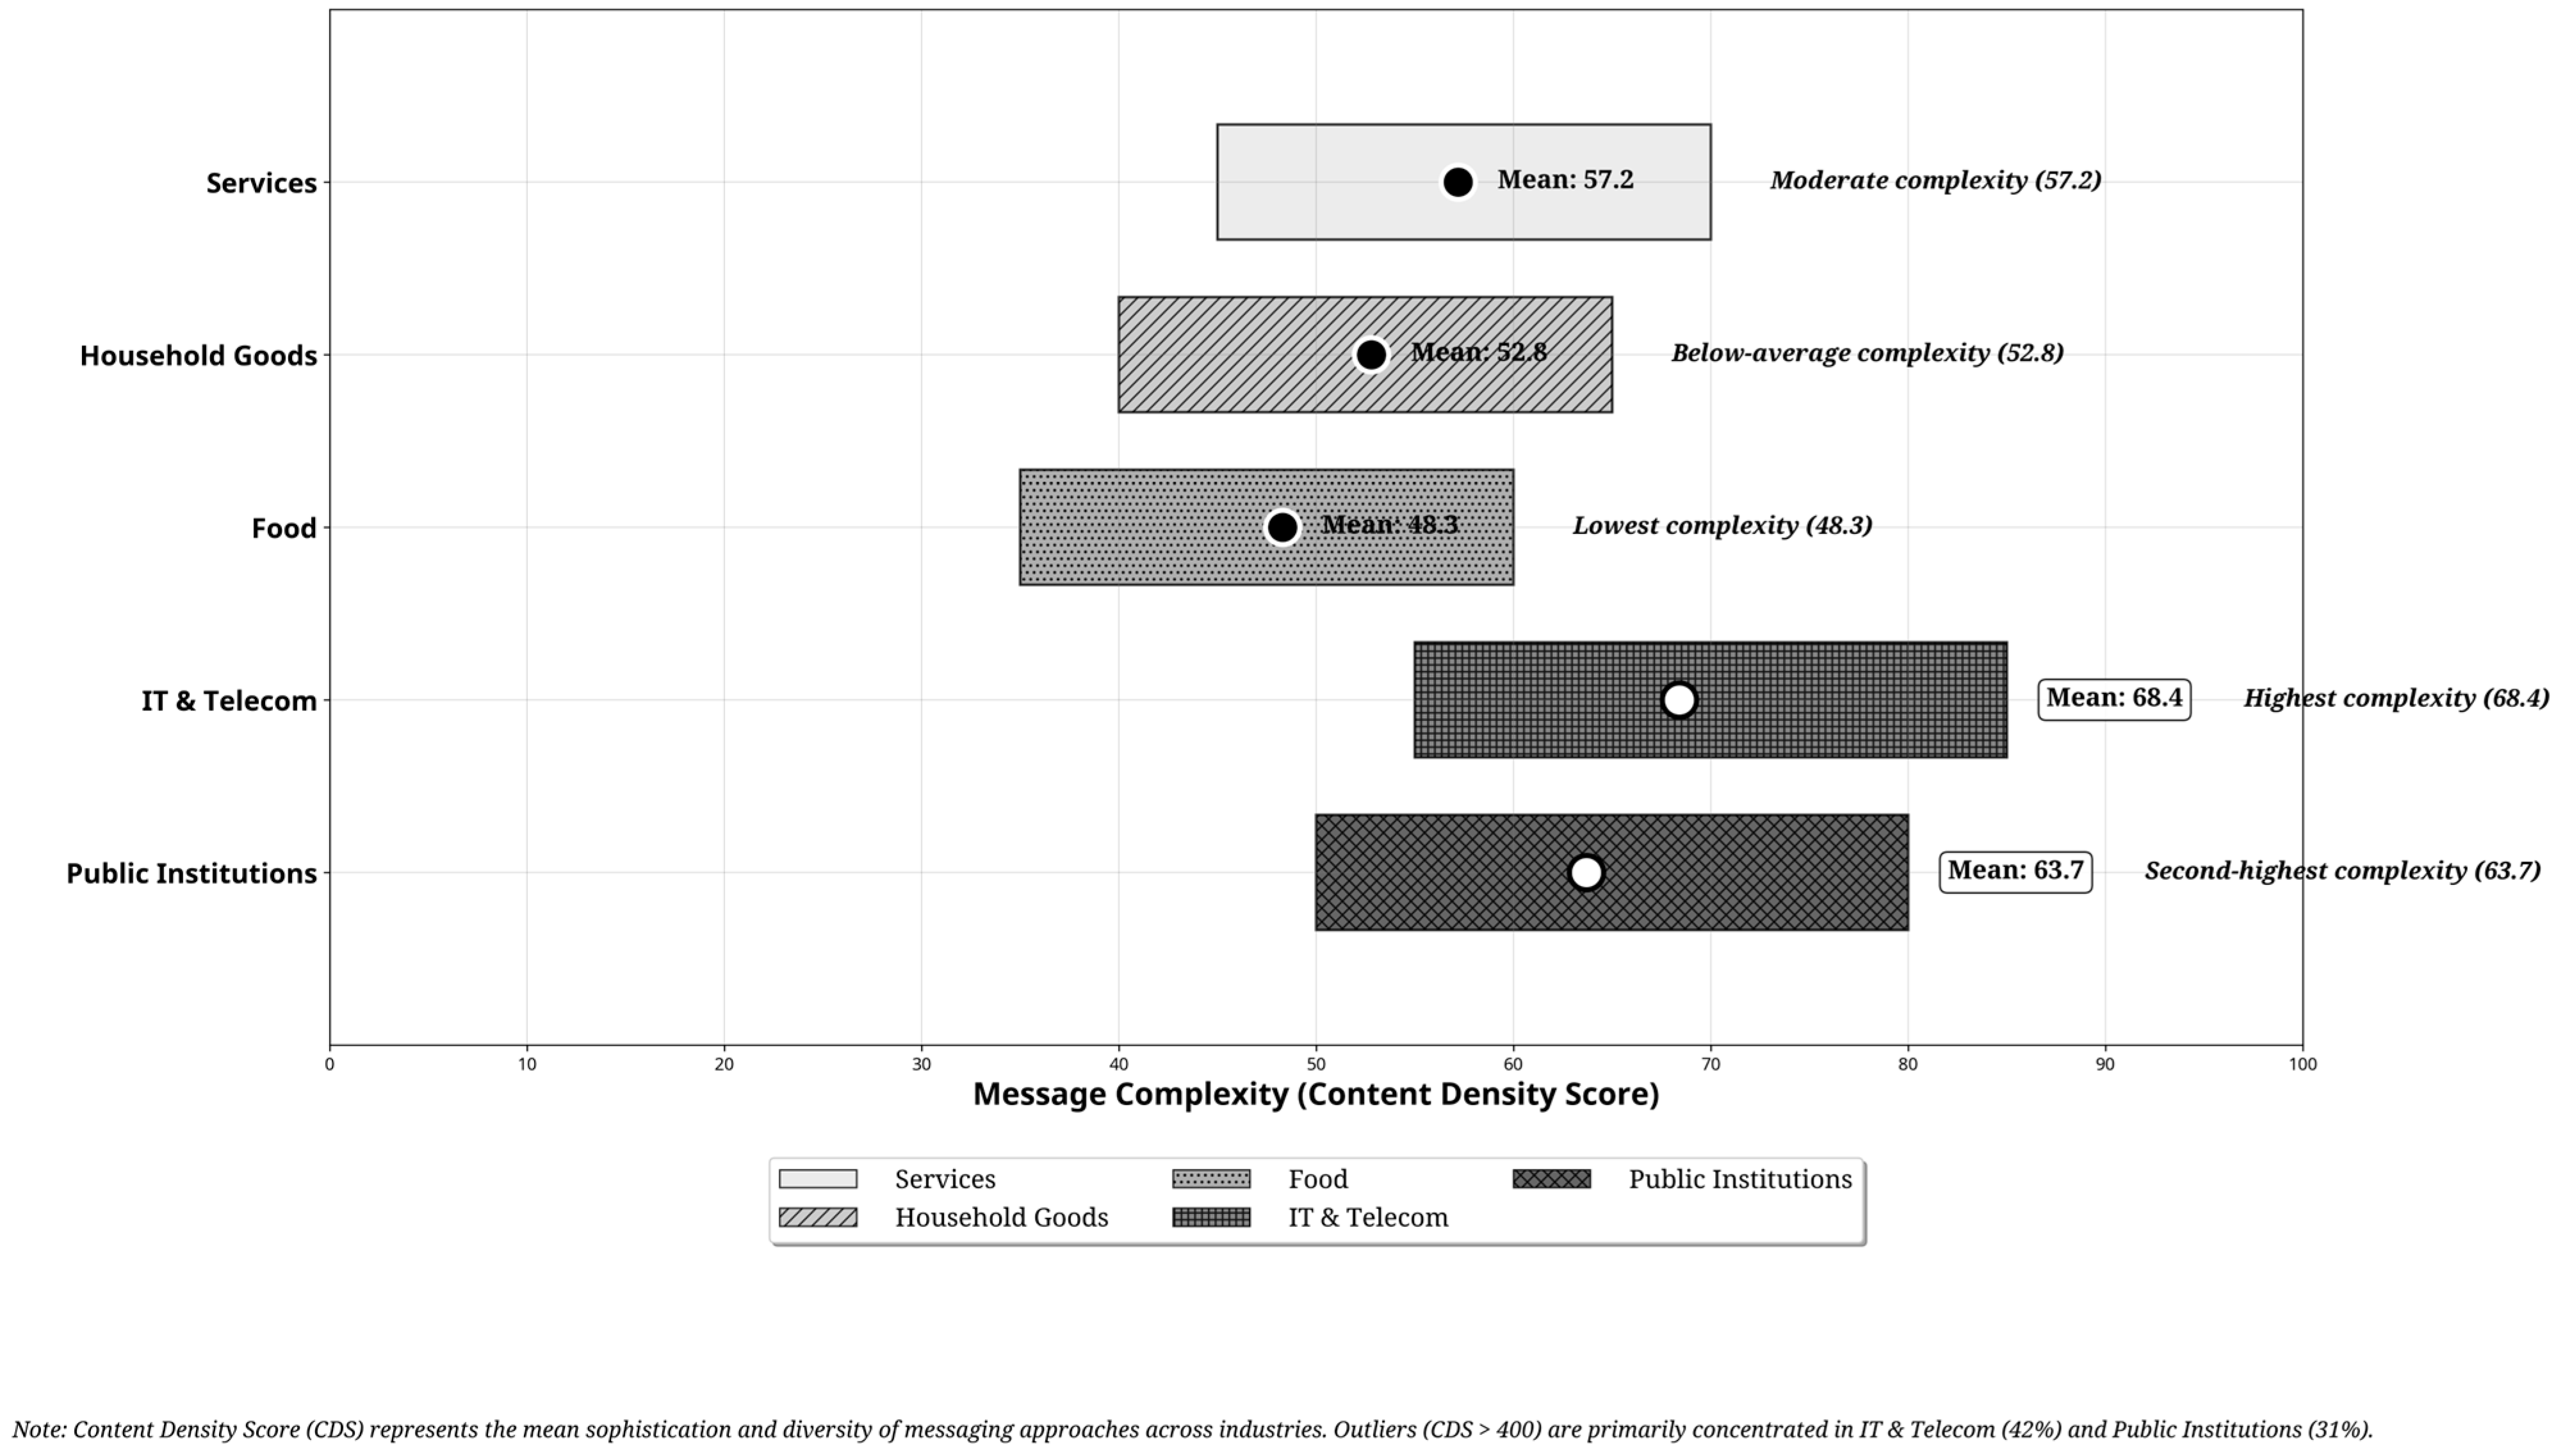
4.3. Message Complexity Analysis
- IT and Telecom: Exhibited the highest mean SDI (0.73) and CDS (68.4), indicating the greatest message complexity among all industries. This finding aligns with the industry’s need to communicate complex technological features and benefits.
- Public Institutions: Demonstrated the second-highest complexity scores (SDI = 0.68, CDS = 63.7), reflecting the multifaceted nature of public service messaging and policy communication.
- Services: Showed moderate complexity (SDI = 0.61, CDS = 57.2), with significant variability within the industry (SD = 0.14 for SDI, SD = 12.8 for CDS).
- Household Goods: Displayed below-average complexity (SDI = 0.54, CDS = 52.8), focusing on more straightforward messaging approaches.
- Food: Exhibited the lowest complexity scores (SDI = 0.47, CDS = 48.3), employing the most focused and streamlined messaging strategies.
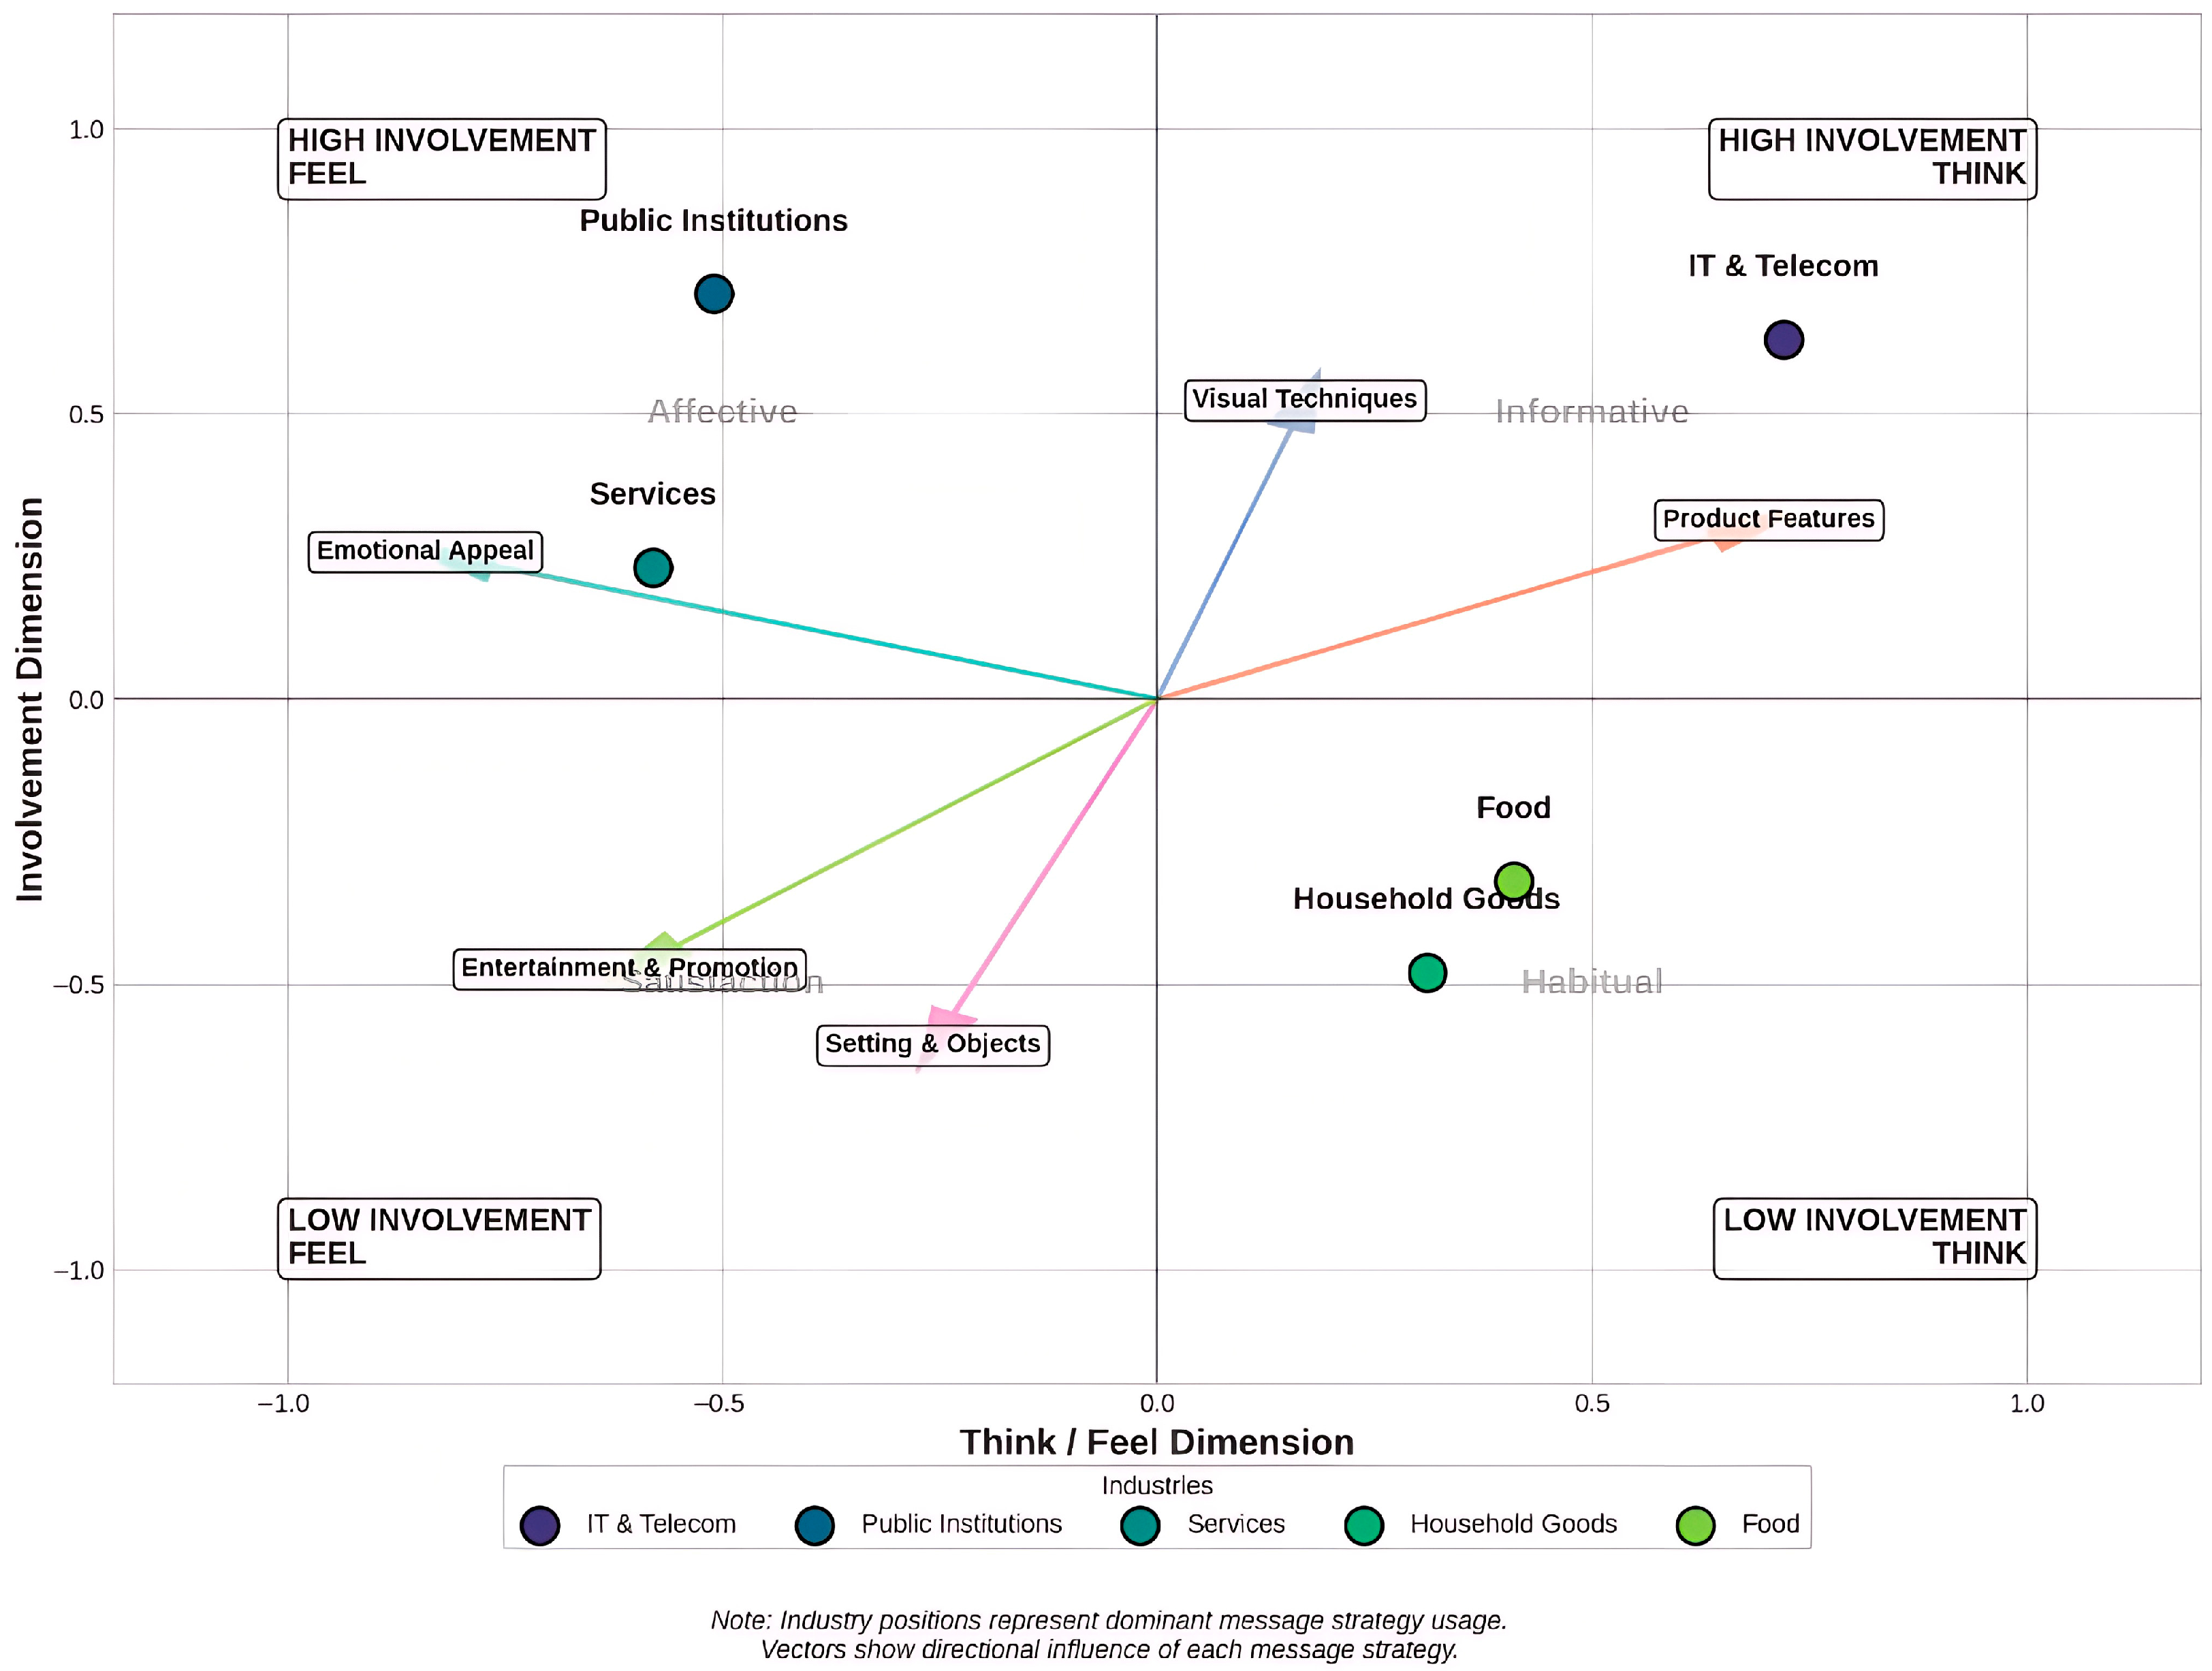
4.4. FCB Grid Mapping and Validation
- Informative Quadrant (High Involvement, Think): IT and Telecom positioned strongly in this quadrant (think score = 0.72, involvement score = 0.63), aligning with theoretical expectations for technology products requiring rational evaluation and significant consumer investment.
- Affective Quadrant (High Involvement, Feel): Public Institutions positioned in this quadrant (think score = −0.51, involvement score = 0.71), reflecting the emotionally engaging yet high-stakes nature of public service communications.
- Habitual Quadrant (Low Involvement, Think): Food (think score = 0.41, involvement score = −0.32) and Household Goods (think score = 0.31, involvement score = −0.48) positioned in this quadrant, consistent with theoretical expectations for routine purchase products.
- Satisfaction Quadrant (Low Involvement, Feel): Services positioned in this quadrant (think score = −0.58, involvement score = 0.23), though with moderate involvement scores, reflecting the experiential yet relatively routine nature of many service purchases.
5. Discussion
5.1. Theoretical Implications
5.2. Methodological Contributions
5.3. Practical Implications
5.4. Limitations and Future Research
6. Conclusions
Funding
Institutional Review Board Statement
Informed Consent Statement
Data Availability Statement
Conflicts of Interest
References
- Blei, D.M.; Ng, A.Y.; Jordan, M.I. Latent Dirichlet allocation. J. Mach. Learn. Res. 2003, 3, 993–1022. [Google Scholar]
- Vaughn, R. How advertising works: A planning model. J. Advert. Res. 1980, 20, 27–33. [Google Scholar] [CrossRef]
- Vaughn, R. How advertising works: A planning model revisited. J. Advert. Res. 1986, 26, 57–66. [Google Scholar] [CrossRef]
- Taylor, R.E. A six-segment message strategy wheel. J. Advert. Res. 1999, 39, 7–17. [Google Scholar] [CrossRef]
- Laskey, H.A.; Day, E.; Crask, M.R. Typology of main message strategies for television commercials. J. Advert. 1989, 18, 36–41. [Google Scholar] [CrossRef]
- Puto, C.P.; Wells, W.D. Informational and transformational advertising: The differential effects of time. In Advances in Consumer Research; Kinnear, T.C., Ed.; Association for Consumer Research: Provo, UT, USA, 1984; Volume 11, pp. 638–643. [Google Scholar]
- Frazer, C.F. Creative strategy: A management perspective. J. Advert. 1983, 12, 36–41. [Google Scholar] [CrossRef]
- Choi, H.; Yoon, H.J.; Paek, H.-J.; Reid, L.N. ‘Thinking and feeling’ products and ‘utilitarian and value-expressive’ appeals in contemporary TV advertising: A content analytic test of functional matching and the FCB model. J. Mark. Commun. 2012, 18, 91–111. [Google Scholar] [CrossRef]
- Ratchford, B.T. New insights about the FCB grid. J. Advert. Res. 1987, 27, 24–38. [Google Scholar] [CrossRef]
- Rossiter, J.R.; Percy, L.; Donovan, R.J. A better advertising planning grid. J. Advert. Res. 1991, 31, 11–21. [Google Scholar] [CrossRef]
- Dyer, T.; Lang, M.; Stice-Lawrence, L. The evolution of 10-K textual disclosure: Evidence from Latent Dirichlet Allocation. J. Account. Econ. 2017, 64, 221–245. [Google Scholar] [CrossRef]
- Wang, X.; Liu, Y.; Fang, T. A social network analysis of research collaboration in information science. J. Inf. Sci. 2015, 41, 62–73. [Google Scholar]
- Hussain, Z.; Jia, J.; Zhang, M. Understanding persuasion in computational advertising. In Proceedings of the 2017 ACM on Multimedia Conference, Mountain View, CA, USA, 23–27 October 2017; pp. 1183–1191. [Google Scholar]
- Ye, Y.; Kovashka, A. ADVISE: Symbolism and external knowledge for decoding advertisements. In Proceedings of the European Conference on Computer Vision, Munich, Germany, 8–14 September 2018; pp. 837–855. [Google Scholar]
- Thomee, B.; Shamma, D.A.; Friedland, G.; Elizalde, B.; Ni, K.; Poland, D.; Borth, D.; Li, L.J. YFCC100M: The new data in multimedia research. Commun. ACM 2016, 59, 64–73. [Google Scholar] [CrossRef]
- Joo, J.; Li, W.; Steen, F.F.; Zhu, S.C. Visual persuasion: Inferring communicative intents of images. In Proceedings of the IEEE Conference on Computer Vision and Pattern Recognition, Columbus, OH, USA, 24–27 June 2014; pp. 216–223. [Google Scholar]
- Abernethy, A.M.; Franke, G.R. The information content of advertising: A meta-analysis. J. Advert. 1996, 25, 1–17. [Google Scholar] [CrossRef]
- Alden, D.L.; Steenkamp, J.B.E.; Batra, R. Brand positioning through advertising in Asia, North America, and Europe: The role of global consumer culture. J. Mark. 1999, 63, 75–87. [Google Scholar] [CrossRef]
- Schwartz, E.M.; Bradlow, E.T.; Fader, P.S. Customer acquisition via display advertising using multi-armed bandit experiments. Mark. Sci. 2017, 36, 500–522. [Google Scholar] [CrossRef]
- Liu, X.; Singh, P.V.; Srinivasan, K. A structured analysis of unstructured big data by leveraging cloud computing. Mark. Sci. 2016, 35, 363–388. [Google Scholar] [CrossRef]
- Ren, S.; He, K.; Girshick, R.; Sun, J. Faster R-CNN: Towards real-time object detection with region proposal networks. In Advances in Neural Information Processing Systems 28 (NIPS 2015); Neural Information Processing Systems Foundation: La Jolla, CA, USA, 2015; pp. 91–99. [Google Scholar]
- Bochkovskiy, A.; Wang, C.Y.; Liao, H.Y.M. YOLOv4: Optimal speed and accuracy of object detection. arXiv 2020, arXiv:2004.10934. [Google Scholar]
- Mimno, D.; Wallach, H.M.; Talley, E.; Leenders, M.; McCallum, A. Optimizing semantic coherence in topic models. In Proceedings of the Conference on Empirical Methods in Natural Language Processing, Edinburgh, UK, 27–31 July 2011; pp. 262–272. [Google Scholar]
- Hauff, C. Predicting the effectiveness of queries and retrieval systems. SIGIR Forum 2010, 44, 88. [Google Scholar] [CrossRef]
- Petty, R.E.; Cacioppo, J.T. The elaboration likelihood model of persuasion. In Advances in Experimental Social Psychology; Berkowitz, L., Ed.; Academic Press: Orlando, FL, USA, 1986; Volume 19, pp. 123–205. [Google Scholar]
- Cheong, H.J.; Cheong, Y. Updating the Foote, Cone & Belding grid: Revisiting the product classifications of the FCB grid for online shopping and contemporary consumers’ decision making. J. Advert. Res. 2021, 61, 12–29. [Google Scholar]
- Youn, K.; Pittman, M.; Haley, E. Using the FCB grid to understand privacy concerns in social media advertising. Int. J. Advert. 2023, 42, 892–915. [Google Scholar] [CrossRef]
- Hsu, C.L.; Lin, J.C.C.; Chiang, H.S. Exploring consumer online purchase and search behavior: An FCB grid-based approach. Electron. Commer. Res. Appl. 2021, 50, 101089. [Google Scholar]
- Barari, M.; Eisend, M. Computational content analysis in advertising research. J. Advert. 2024, 53, 681–699. [Google Scholar] [CrossRef]


| Characteristic | Value |
|---|---|
| Time span | 2015–2024 (10 years) |
| Mean advertisements per year | 5248.7 (SD = 427.3) |
| Peak year | 2019 (6742 advertisements) |
| Industry distribution | |
| Number of industries | 17 |
| Top 5 industries | Food (21.3%), Services (17.8%), IT and Telecom (12.4%), Household Goods (8.7%), Public Institutions (5.2%) |
| Other industries | 34.6% |
| Advertisement characteristics | |
| Mean duration | 27.8 s (SD = 12.4) |
| Mean detected objects per ad | 14.3 (SD = 8.7) |
| Mean detected people per ad | 2.7 (SD = 1.9) |
| Mean text elements per ad | 8.4 (SD = 5.2) |
| Metadata characteristics | |
| Total metadata tags | 583,642 |
| Unique object categories | 1387 |
| Unique place categories | 412 |
| Unique emotion categories | 24 |
| High-definition ratio | 87.3% |
| With complete metadata | 94.2% |
| Emotional Appeal | Product Features | Visual Techniques | Setting and Objects | Entertainment and Promotion |
|---|---|---|---|---|
| love (0.042) | performance (0.038) | color (0.035) | home (0.041) | event (0.047) |
| happiness (0.039) | function (0.036) | angle (0.033) | office (0.037) | discount (0.043) |
| family (0.037) | quality (0.035) | lighting (0.032) | kitchen (0.035) | prize (0.038) |
| trust (0.035) | technology (0.033) | composition (0.030) | outdoor (0.033) | game (0.036) |
| care (0.033) | durability (0.031) | frame (0.029) | furniture (0.031) | humor (0.034) |
| warmth (0.031) | price (0.029) | perspective (0.027) | vehicle (0.029) | music (0.032) |
| joy (0.029) | efficiency (0.027) | contrast (0.026) | device (0.027) | celebrity (0.030) |
| security (0.027) | design (0.026) | movement (0.025) | nature (0.025) | competition (0.028) |
| pride (0.025) | safety (0.024) | texture (0.023) | clothing (0.023) | season (0.026) |
| nostalgia (0.023) | innovation (0.022) | rhythm (0.021) | food (0.021) | limited (0.024) |
| Message Strategy | Function 1 | Function 2 | Function 3 | Function 4 |
|---|---|---|---|---|
| Emotional Appeal | 0.782 | −0.143 | 0.327 | −0.512 |
| Product Features | −0.614 | 0.693 | 0.287 | −0.243 |
| Visual Techniques | 0.127 | 0.574 | −0.731 | 0.352 |
| Setting and Objects | −0.386 | −0.527 | −0.418 | −0.629 |
| Entertainment and Promotion | 0.429 | 0.218 | 0.563 | 0.671 |
Disclaimer/Publisher’s Note: The statements, opinions and data contained in all publications are solely those of the individual author(s) and contributor(s) and not of MDPI and/or the editor(s). MDPI and/or the editor(s) disclaim responsibility for any injury to people or property resulting from any ideas, methods, instructions or products referred to in the content. |
© 2025 by the author. Licensee MDPI, Basel, Switzerland. This article is an open access article distributed under the terms and conditions of the Creative Commons Attribution (CC BY) license (https://creativecommons.org/licenses/by/4.0/).
Share and Cite
Yoo, S.C. Strategic Information Patterns in Advertising: A Computational Analysis of Industry-Specific Message Strategies Using the FCB Grid Framework. Information 2025, 16, 642. https://doi.org/10.3390/info16080642
Yoo SC. Strategic Information Patterns in Advertising: A Computational Analysis of Industry-Specific Message Strategies Using the FCB Grid Framework. Information. 2025; 16(8):642. https://doi.org/10.3390/info16080642
Chicago/Turabian StyleYoo, Seung Chul. 2025. "Strategic Information Patterns in Advertising: A Computational Analysis of Industry-Specific Message Strategies Using the FCB Grid Framework" Information 16, no. 8: 642. https://doi.org/10.3390/info16080642
APA StyleYoo, S. C. (2025). Strategic Information Patterns in Advertising: A Computational Analysis of Industry-Specific Message Strategies Using the FCB Grid Framework. Information, 16(8), 642. https://doi.org/10.3390/info16080642