Article

E-Exam Cheating Detection System for Moodle LMS

1
Department of Software Engineering, Jordan University of Science and Technology, Irbid 22110, Jordan
2
Department of Network Engineering and Security, Jordan University of Science and Technology, Irbid 22110, Jordan
3
Department of Computer Engineering, Faculty of Engineering, The Hashemite University, Zarqa 13133, Jordan
*
Author to whom correspondence should be addressed.
Information 2025, 16(5), 388; https://doi.org/10.3390/info16050388
Submission received: 21 March 2025 / Revised: 28 April 2025 / Accepted: 29 April 2025 / Published: 7 May 2025

Abstract

:
The rapid growth of online education has raised significant concerns about identifying and addressing academic dishonesty in online exams. Although existing solutions aim to prevent and detect such misconduct, they often face limitations that make them impractical for many educational institutions. This paper introduces a novel online education integrity system utilizing well-established statistical methods to identify academic dishonesty. The system has been developed and integrated as an open-source Moodle plug-in. The evaluation involved utilizing an open-source Moodle quiz log database and creating synthetic benchmarks that represented diverse forms of academic dishonesty. The findings indicate that the system accurately identifies instances of academic dishonesty. The anticipated deployment includes institutions that rely on the Moodle Learning Management System (LMS) as their primary platform for administering online exams.

1. Introduction

Over the last few years, the COVID-19 pandemic has triggered a global shift towards working from home and online education, offering new and revolutionary approaches to the academic system [1]. However, one major challenge introduced was the opportunity for academic dishonesty to spread and negatively impact the integrity of the educational process [2].
E-exam integrity is crucial to the quality and rigor of online learning, especially with the increase in enrollment and popularity rates [3]. Students can exploit their new online learning environment using several ways to inflate their academic achievements or their perceived knowledge of their course [2]. Furthermore, studies have shown that the use of online proctoring can negatively impact student well-being, increasing anxiety and stress levels [4,5]. Additionally, discrepancies in performance between proctored and non-proctored assessments have raised concerns about fairness and validity [6]. This study proposes a solution to these issues.
This paper discusses an innovative E-learning integrity system deployed on the Moodle Learning Management System (LMS). The system leverages temporal and spatial information, statistical data, and probability analysis to identify collusion cases in online assessments and anomalies in the evaluation process. Furthermore, it assigns a value of trust to each participant based on the previously mentioned analysis. The system generates a natural, easy-to-understand report of the results visualized by charts and plots.
The importance of this paper lies in detecting dishonesty in academic assessments and providing presumptive reasons for doubt about the actions of individuals detected as such. This should ensure the fairness of the educational system and offer an affordable and scalable solution to the problem at hand.
The remainder of the paper is organized as follows: A brief background is presented in Section 2, followed by a discussion of related work in Section 3. The system design is explained in Section 4. Section 5 outlines the implementation details, followed by output generation in Section 6. Evaluation and results are discussed in Section 7. Finally, conclusions are drawn in Section 8.

2. Background

2.1. E-Learning and Learning Management Systems

The origins of online learning can be traced back to the 1900s when the universities of Pennsylvania and Chicago in the United States first utilized the Postal Service to introduce universal free delivery of educational resources [7]. However, today’s online education has evolved to encompass any form of distance or non-central education, including independent study, computer-based instruction, computer-assisted instruction, video courses, videoconferencing, web-based instruction, and online learning [8].
Thus, with the introduction of the World Wide Web and web-based learning, higher education institutions have experienced unprecedented growth in online learning during the past two decades. This growth has increased exponentially over the past two years, driven by the COVID-19 pandemic, reaching approximately 1.3 billion online learners worldwide [9]. This caused a global shift towards working from home and online education. Approximately 60% of Europe’s student population transitioned to fully online courses, and 30% took a combination of face-to-face and online courses [10]. Furthermore, educators in all types of institutions have recognized that a structural shift in education has occurred, in which online information delivery and learning will be a mainstay of higher education in the future [4].
Therefore, educational institutions should adopt new methods of delivering their courses and assessments to students. An example of such methods is Learning Management Systems (LMSs) [5], such as Blackboard and Moodle, which are web-based technologies developed to enhance the learning process in educational institutions through proper preparation, implementation, and evaluation [11]. The use of Learning Management Systems (LMSs) in the learning process enhances E-learning by providing instructional content regardless of time or location [12], allowing students and teachers to connect online, and facilitating the sharing of course-related knowledge and resources [5].
Moodle (Modular Object-Oriented Dynamic Learning Environment) is a free, open-source Learning Management System written in PHP and distributed under the GNU General Public License. Moodle was the most widely used Learning Management System (LMS) tool among other LMS tools, such as Blackboard and eFront, due to its zero-cost implementation [13]. Moodle adheres to the site’s design philosophy of enabling users to modify and tailor highly customizable sites to suit their specific needs. This is achieved using free plug-ins, which can be easily downloaded and installed through Moodle’s hosted plug-in repository. We have designed and built a software package that enables users to add additional features and functionalities to Moodle, such as new activities, quiz question types, reports, and other system integrations.

2.2. E-Learning Integrity Systems and Cheating Deterrence

Many academics and researchers have studied the control of cheating in online examinations [14], such as the E-exam Cheating Detection System [15] and Optimized Collusion Prevention for Online Exams during Social Distancing [16]. These studies proposed techniques ranging from online proctoring of the participants through a live camera feed for the exam session [17] to offline statistical analysis of their actions and behaviors in the recorded exam session.
Proctorio is a paid E-learning integrity platform designed to detect anomalies in online exams. It uses an automated flagging system to report suspicious behaviors using live proctoring of the examinee’s camera and microphone during the exam session. While this method effectively addresses the cheating issue [18], it employs privacy-invasive techniques that may be detrimental to the average student. Furthermore, it is unrealistic to conduct massive online assessments of a large pool of students due to either pricing that the institution cannot afford or the fact that some online learners lack physical access to a webcam or a stable internet connection to support a live video feed of their session.
One major drawback of E-learning integrity systems and platforms, such as SafeExam Browser and Proctorio, is that participants must install new software to access online assessments. Some participants may need to acquire technical knowledge to complete the process, which complicates their access to the online assessment. Furthermore, some systems require mandatory access rules, such as granting permission to access students’ camera feeds and microphones for the proctoring service, and, in some cases, storing recordings of examinees’ online assessment sessions. Several studies found that these technical issues have increased test anxiety and negatively affected students’ performance [19,20].
Other methods of deterring cheating in online assessments include creating “collusion-proof” exams by reordering the assessment’s questions or creating multiple versions of the assessments with variations of each question. Some instructors prepare tightly time-limited assessments to keep students too busy to attempt to collude. Another method is to put constraints on the navigation options of the exam, such as presenting one question at a time without allowing students to navigate back to previous questions or enforcing a time limit on each question. The methods mentioned above have proven to be highly effective in thwarting online cheating [21]. However, they provide no solution to identity fraud or plagiarism, where a student might ask a colleague or even hire an expert to examine their work on their behalf [21]. If implemented poorly, one significant disadvantage of these methods is that they make the exam inherently more challenging. This could negatively affect students who had no intention of cheating, both scholarly performance-wise and psychologically [22].

2.3. Behavior and Data Analysis of Online Assessment Attempts

Several studies have concluded that applying statistical analysis methods and probabilistic analysis to high-stakes exams can help identify cheating or collusion in online exams [23,24]. These methods are referred to as similarity statistics or probabilistic collusion analysis, which have generally been used to identify whether a pair of students exhibits a comparably higher similarity rate than expected, implying that some form of collusion may have occurred between students. Others have used statistical analysis, specifically regression analysis, to establish a positive correlation between students’ performance in online learning and their engagement with the course [25,26]. Such correlation varied in strength across different courses and institutions, but presented a positive link with students’ academic achievement scores. We discussed these methods in detail in the following section.
While proving their efficacy in detecting collusion and anomalies in online assessments, the example can only demonstrate definite evidence of collusion if they employ additional data to support the assumptions. Such additional data can be classified into temporal data and spatial data [23]. Temporal data include information about similarity in response times or large discrepancies in response times, taking into account the overall response times of the assessment as a whole. Spatial data refer to information related to the relative location of participants during their assessment attempt. Considering all forms of data mentioned above and the findings presented in [27], reasonable assumptions can be made regarding the possibility of collusion between a pair of students in an online assessment.

3. Related Work

Recent approaches to detecting cheating in online exams have leveraged diverse technologies, each with unique strengths and limitations. One widely explored strategy involves deep learning and machine learning models [28], including DNN, SVM, and XGBoost. These models can detect complex behavioral patterns indicative of academic dishonesty; however, they typically require large, labeled datasets and are prone to overfitting.
Gaze analysis methods [29] have been used to monitor off-screen behavior through eye tracking, providing useful insights but necessitating specialized hardware, which hinders scalability. Keystroke dynamics [30] also offer a biometric-based detection approach by analyzing typing rhythms; however, such methods are often perceived as intrusive and susceptible to user variability.
With the rise of generative AI, newer approaches have emerged for detecting AI-generated text, particularly from large language models (LLMs). Najjar et al. [31] propose using explainable machine learning to identify such content, though challenges remain in ensuring generalizability across disciplines and writing styles.
The Q-SID algorithm [32] provides a lightweight statistical mechanism for collusion detection in multiple-choice questions by analyzing response-score distributions; however, it lacks applicability to other formats. Meanwhile, human-in-the-loop AI systems [33] incorporate manual review alongside algorithmic detection, improving reliability but compromising scalability.
Online proctoring tools such as Proctorio [34] integrate live webcam and microphone surveillance but have drawn criticism due to privacy concerns, particularly in underserved regions with limited technical infrastructure. Essay similarity analysis [35] employs natural language processing techniques to compare open-ended responses, providing effective detection of textual overlap, albeit at a high computational cost.
Other solutions focus on engagement-based prediction, such as the MEAP plug-in [36], which uses Moodle logs to identify at-risk students. Although not designed specifically for cheating detection, it provides valuable contextual data for assessing integrity. A foundational method, Bayesian collusion detection [37], identifies improbably similar answer patterns among students in MCQs, especially when rare responses are matched.
Innovations by Kundu et al. [30] extend the keystroke approach to detect unnatural typing sequences associated with AI assistance, thereby reaffirming the relevance of biometric analysis in the era of large language models (LLMs). As explored by Moya [38], blockchain technologies present novel methods for maintaining tamper-proof academic credentials; however, their integration into existing systems poses technical challenges. A broader systematic review of blockchain in education [39] further underscores both the potential and the hurdles in transitioning to decentralized academic ecosystems.
Finally, Nurpeisova et al. (2023) developed a region-specific online proctoring system for Kazakhstan [40], tailored to local exam practices. While promising, such systems often face challenges in international adoption.
A review of recent literature from 2023 to 2025 was conducted, as shown in Table 1, and compared with our proposed Moodle-based solution.
The field spans AI, behavioral analytics, biometric verification, and infrastructure-level innovations. These tools reflect a growing effort to safeguard academic integrity amid digital transformation. However, many face issues related to privacy, usability, or technical requirements. These limitations underscore the value of our proposed work, which combines statistical modeling, Moodle-native integration, and visual reporting into a single solution.
Another key difference between our system and the existing systems is that it achieves greater ethical alignment and operational practicality. It eliminates the need for constant human oversight, additional software installation, or intrusive surveillance, while providing richer data interpretations through integrated visualizations. As such, it fills a critical gap between advanced detection and institutional usability, making it a compelling candidate for widespread deployment.

4. Design and Analysis

The proposed system design is intended to be simple, easy for the course teacher to use, and unintrusive to the exam participants. Hence, the system was built around the Moodle quiz report module, which provides information about the quiz and its attempts after the assessment has ended. Moodle was developed as a LAMP stack application for Linux, Apache, MySQL, and PHP. They are prevalent web application development standards, where Linux serves as the operating system for the web application, MySQL is the database management system, Apache is the web server, and PHP is the scripting language used to generate web pages.
Figure 1 shows a top-level view of the designed system and its key steps. Further details regarding each step will be discussed in the following subsections.

4.1. Design Requirements

Cheating attempts in academic assessments have been established to be more prevalent in online E-learning environments [4]. However, due to the drawbacks of traditional human online proctoring, this paper proposes establishing a credible integrity system for large-scale, high-stakes assessments. To obtain that, the following design requirements must be met:
  • Affordability: The system will be licensed under the GNU General Public License [44], which ensures free use, modification, and sharing of the software.
  • Scalability: The system must also be able to run on any number of examinees and present credible results and conclusions, regardless of the sample size. To obtain that, we employed statistical analysis methods to determine suitable anomaly detection margins for the algorithm based on the sample size.
  • Usability: The system must be user-friendly and provide clear, easy-to-understand results and outcomes. We implemented data visualization techniques, including charts, graphs, and histograms, using the D3.js graphing library. Additionally, we created individual profiles for each examinee and provided a breakdown of the suspicious anomalies that triggered the algorithm.
  • Run on the Moodle framework: The system requires a web server installed with the Moodle LMS framework.
  • Detecting anomalies and suspicious activities during an examinee’s assessment.
  • To detect the occurrence of foul play in an examinee’s attempt, the system must employ data analysis methods on the assessment and student data provided by the Moodle database.

4.2. System Design

The system is designed as a Moodle plug-in installed on a Moodle server, similar to a quiz report plug-in. Quiz reports are a sub-plug-in in the Moodle installation directory’s quiz module. They produce custom quiz reports using data collected during an assessment. The system will first query the Moodle database to fetch the needed data and apply the analysis algorithms. The analysis yields a list of students who took the quiz and their assigned trust level, based on the anomalies they detected. The list is then fed into the visualization algorithms to generate a Moodle report, which contains multiple pages and figures to represent the results in a user-friendly manner.
A detailed discussion of the system stages will be presented in the following sections.

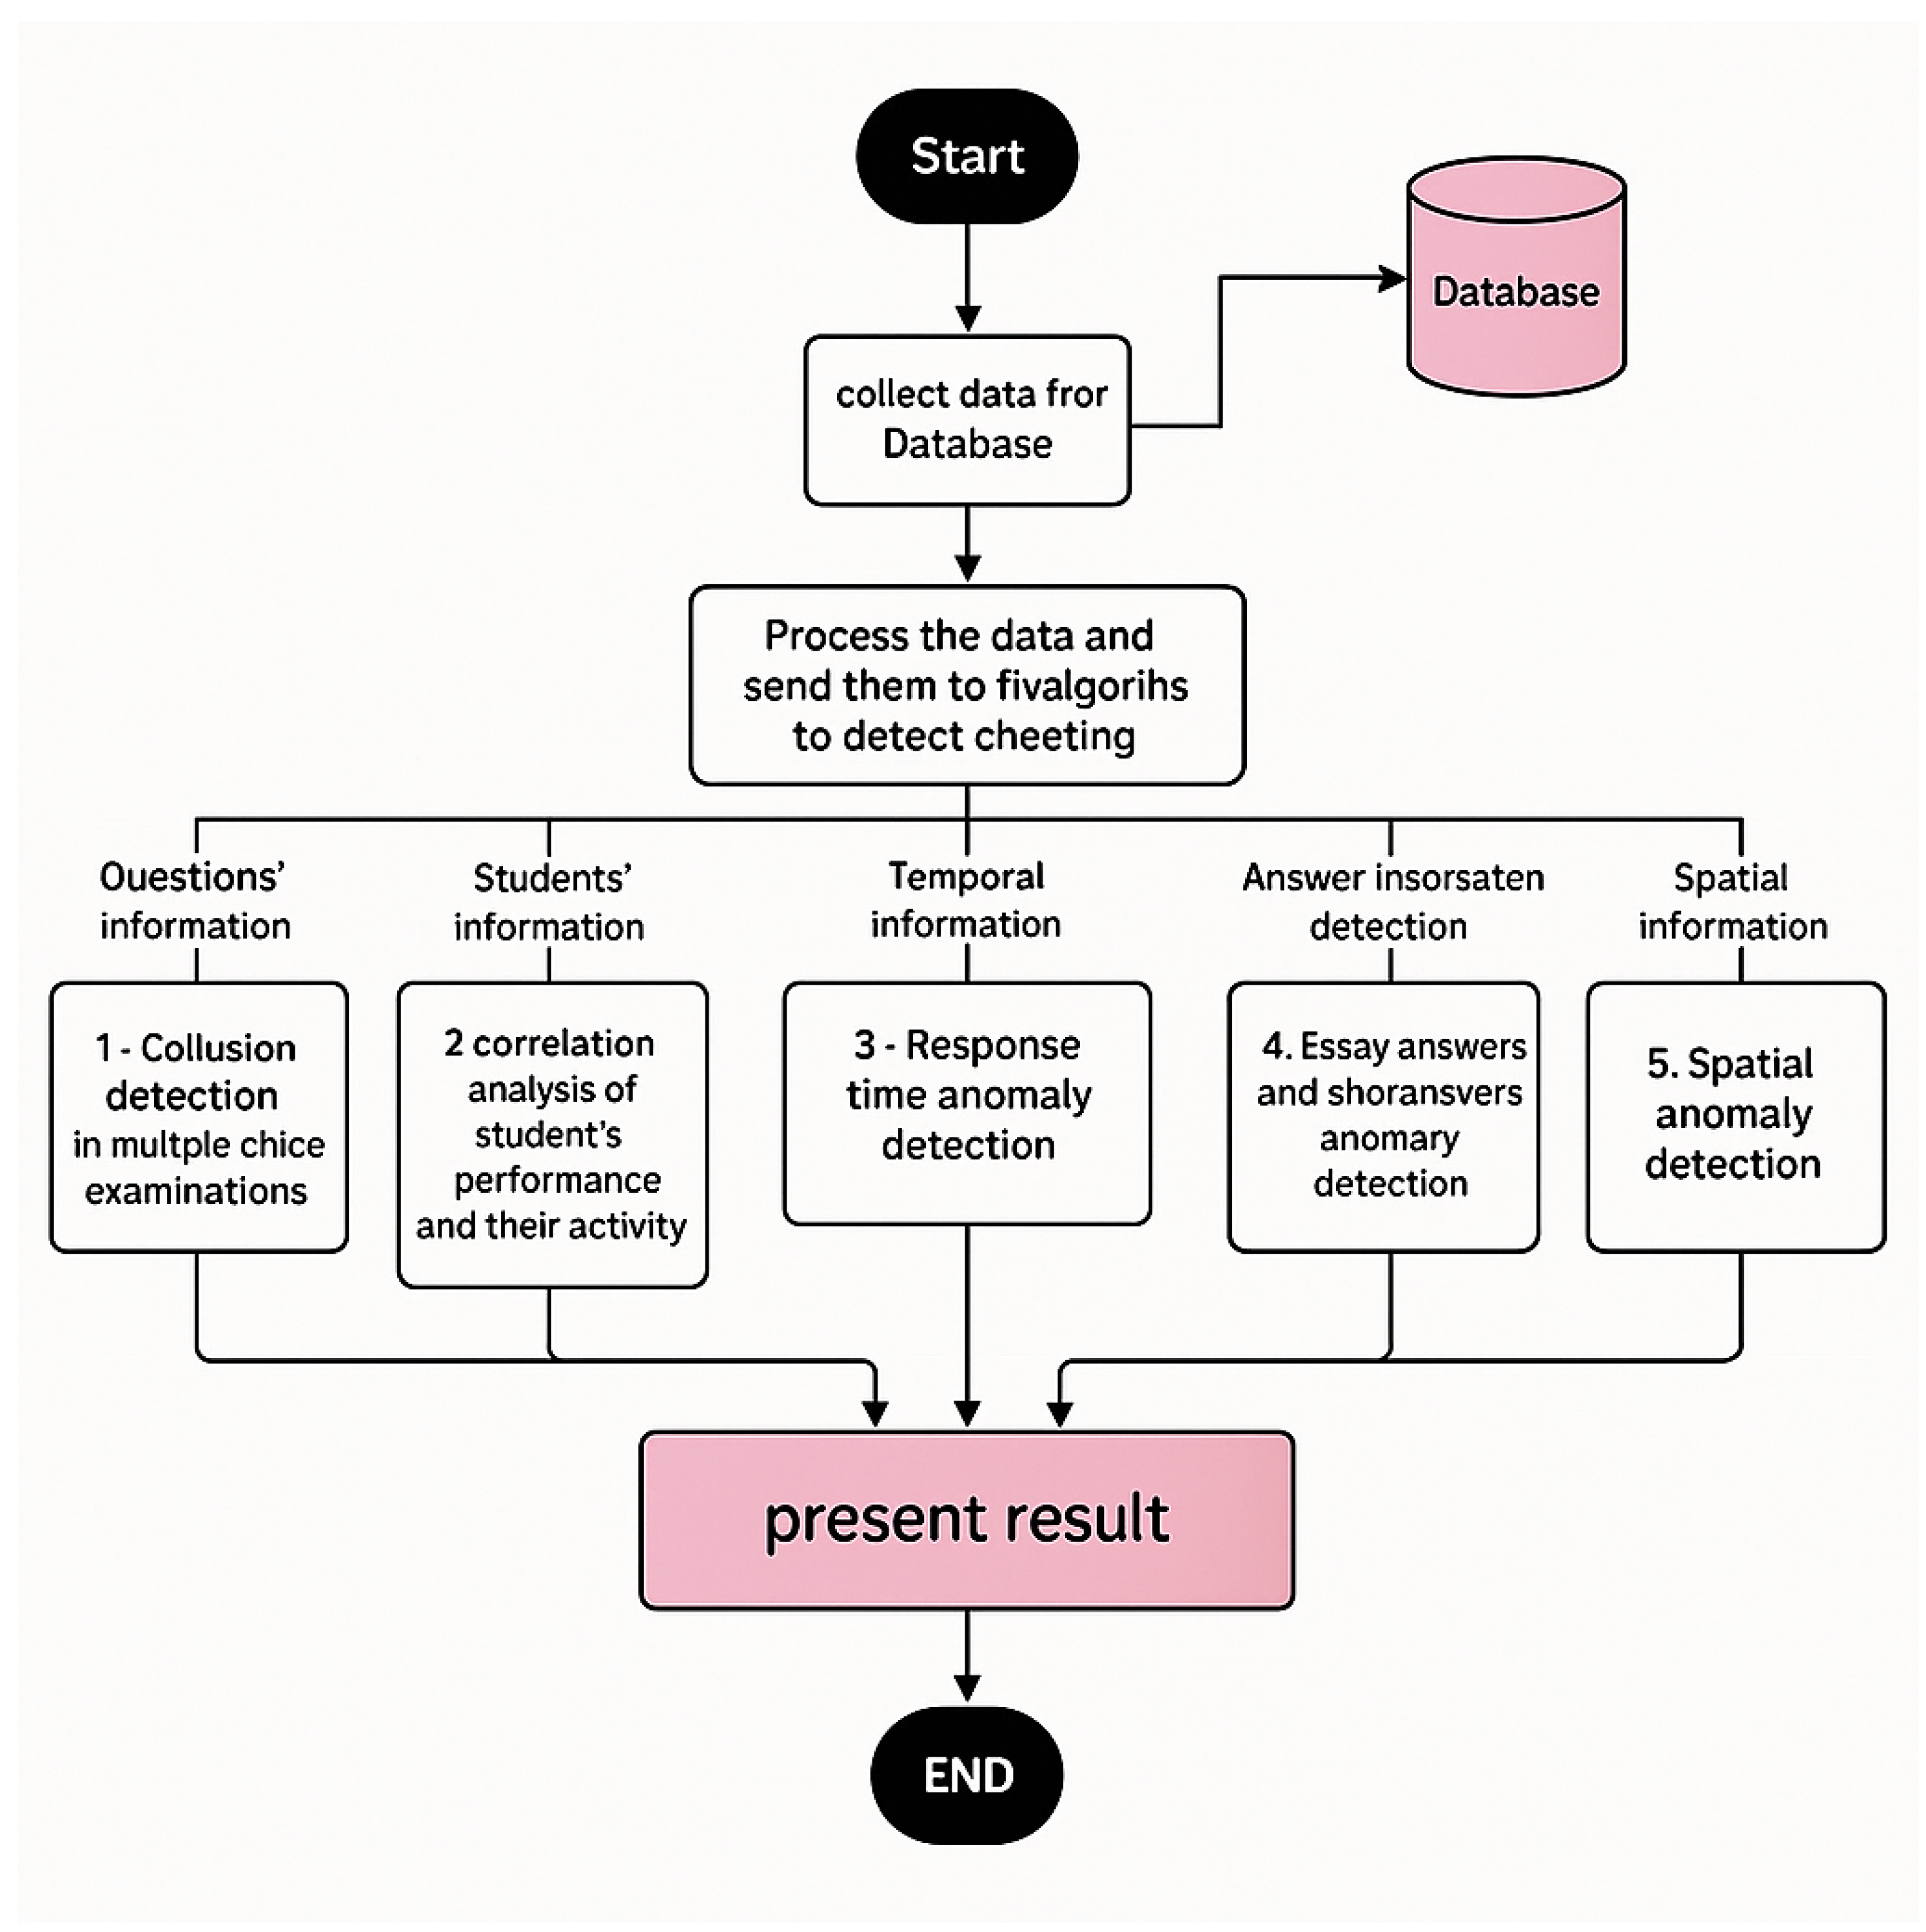
4.2.1. Data Collection

In this stage, the system collects data through queries to the Moodle database system and feeds it into the processing stage. Before delving into the design stages and the algorithm’s operation, this subsection provides a detailed insight into the data required for the analysis. Data include the following:
  • General quiz information and course information:
    These data pertain to the quiz itself, most notably its properties, including the start and finish times of the quiz, the nature of question display ordering (shuffled or ordered), and whether the quiz is in a one-way format. Most importantly, the assigned ID for the quiz is also included.
  • Students’ information:
    This includes data on students who registered for the course associated with the quiz and attempted it. It contains students’ names, IDs, grades, the number of activities each student has participated in during the course, and the IP address from which they attempted the quiz.
  • Spatial information:
    These data are extracted from each student’s IP address and used to determine their location when taking the quiz using the geolocation API.
  • Questions’ information:
    These data pertain to the questions included in the quiz. Each question has distinct properties, including its type (e.g., multiple-choice, short-answer, essay), ID, question text, grade, answer, and options.
  • Temporal information:
    These data pertain to each student’s response time to each question. The quiz’s response times, as well as the start and finish times, are formatted in Unix time.
  • Response information:
    These data pertain to each student’s answer to each question in the attempt, indicating whether the answer was correct, partially correct, or incorrect.

4.2.2. Data Processing: Applying Cheating Detection Algorithms

The proposed system utilizes five algorithms to detect cheating or collusion in online exams, raising a specific flag for each identified anomaly. The system then calculates the trust level as a percentage, indicating the likelihood that a student has committed dishonesty or collusion during an attempt to cheat. Students with a lower rate are more likely to have cheated. Figure 2 demonstrates the structure of the data processing stage, including its algorithms.
The five algorithms used in our system, along with their logic and their flags, are discussed below:
  • Collusion detection in multiple-choice examinations:
    The first algorithm employed in the system involves a Bayesian probability-based analysis of excessive similarity in students’ answers to multiple-choice questions. Each question has four choices: A, B, C, and D. This algorithm was implemented and tested by A. Ercole in 2002 [23] to determine the existence of collusion between pairs of students on an exam. The algorithm is divided into nine steps as follows:
    • Step 1: Generate a list of all possible pairs of students that attempted the quiz. The list size is n n 1 .
    • Step 2: For each pair of students (i, j) in the list, repeat the following steps 3–8:
    • Step 3: Estimate the prior probabilities P q A , P q B , P q C , P q D for each question across all other students responses, excluding the questions that were not answered by both students (i, j). The prior probabilities are expressed as follows:
      P q A = n q A n Q A + n Q B + n Q C + n Q D
      P q B = n q B n Q A + n Q B + n Q C + n Q D
      P q C = n q C n Q A + n Q B + n Q C + n Q D
      P q D = n q D n Q A + n Q B + n Q C + n Q D
      where
      *
      n Q A , n Q B , n Q C , n Q D are the number of students who answered the Q t h question ‘A’, ‘B’, ‘C’, and ‘D’, respectively (always excluding the selected pair).
      *
      P q A , P q B , P q C , P q D are the prior probabilities for the Q t h question being answered ‘A’, ‘B’, ‘C’, and ‘D’, respectively. These probabilities add up to one.
    • Step 4: Calculate the likelihood functions Π ( Ω A ) , Π ( Ω B ) , Π ( Ω C ) and Pi( Ω | D). For each student pair (i, j), we first reorder the question options so that all students have the same order of options, where option ‘A’ is the correct answer and the rest are incorrect. If a multiple-choice question contains a negatively marked option, it is ordered as option ‘D’. This is important for determining the i t h student’s performance on the test. For example, if the i t h candidate is observed ( Ω ) to have answered all questions as ‘A’, then the P i ( Ω | A ) = 1 .
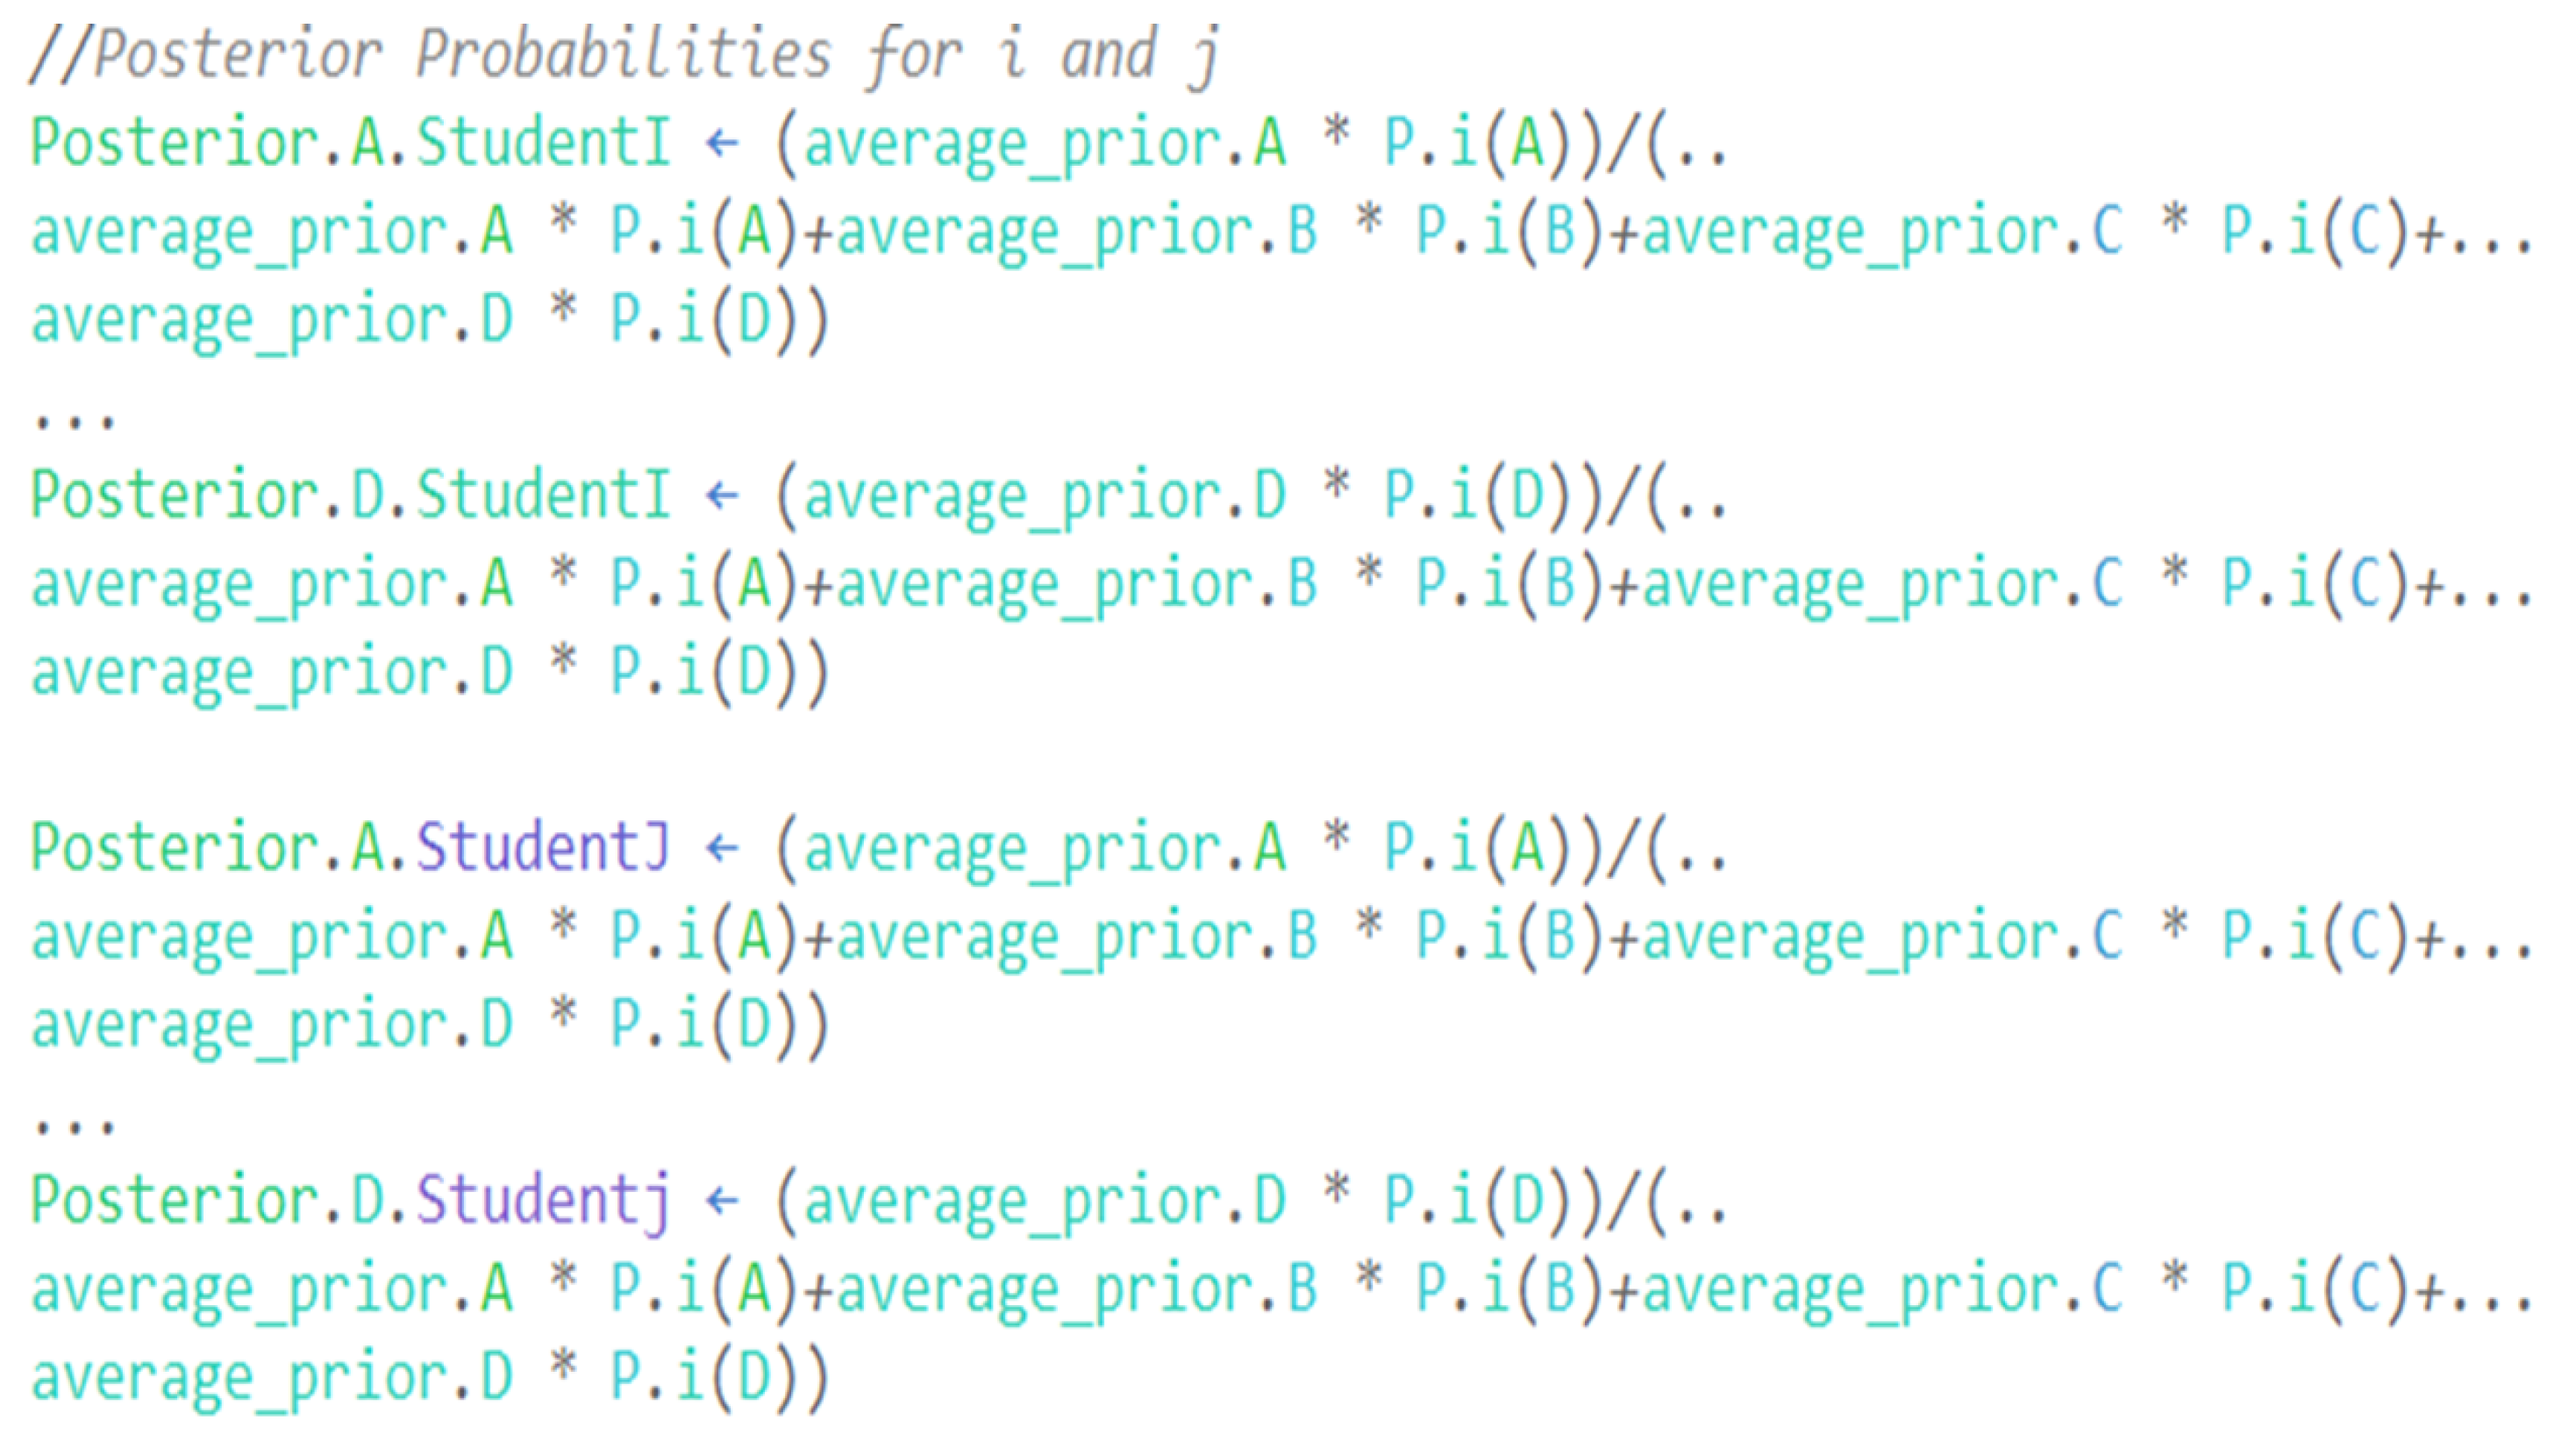
    • Step 5: Calculate the posterior probabilities for the pair (i, j), and their averages over all questions using Bayes’ theorem. Posterior probabilities are expressed as follows:
      P i ( A | Ω ) = P ( Ω | A ) P ( A ) P ( Ω | A ) P ( A ) + P ( Ω | B ) P ( B ) + P ( Ω | C ) P ( C ) + P ( Ω | D ) P ( D )
      P i ( B | Ω ) = P ( Ω | B ) P ( B ) P ( Ω | A ) P ( A ) + P ( Ω | B ) P ( B ) + P ( Ω | C ) P ( C ) + P ( Ω | D ) P ( D )
      P i ( C | Ω ) = P ( Ω | C ) P ( C ) P ( Ω | A ) P ( A ) + P ( Ω | B ) P ( B ) + P ( Ω | C ) P ( C ) + P ( Ω | D ) P ( D )
      P i ( D | Ω ) = P ( Ω | D ) P ( D ) P ( Ω | A ) P ( A ) + P ( Ω | B ) P ( B ) + P ( Ω | C ) P ( C ) + P ( Ω | D ) P ( D )
      where P i ( A | Ω ) , P i ( B | Ω ) , P i ( C | Ω ) and P i ( D | Ω ) The posterior probabilities of a student answering on this examination are ‘A’, ‘B’, ‘C’, and ‘D’, respectively. Based on Bayes’ theorem, this probability calculates the probability of an event occurring given new information (i.e., the student’s likelihood function calculated previously).
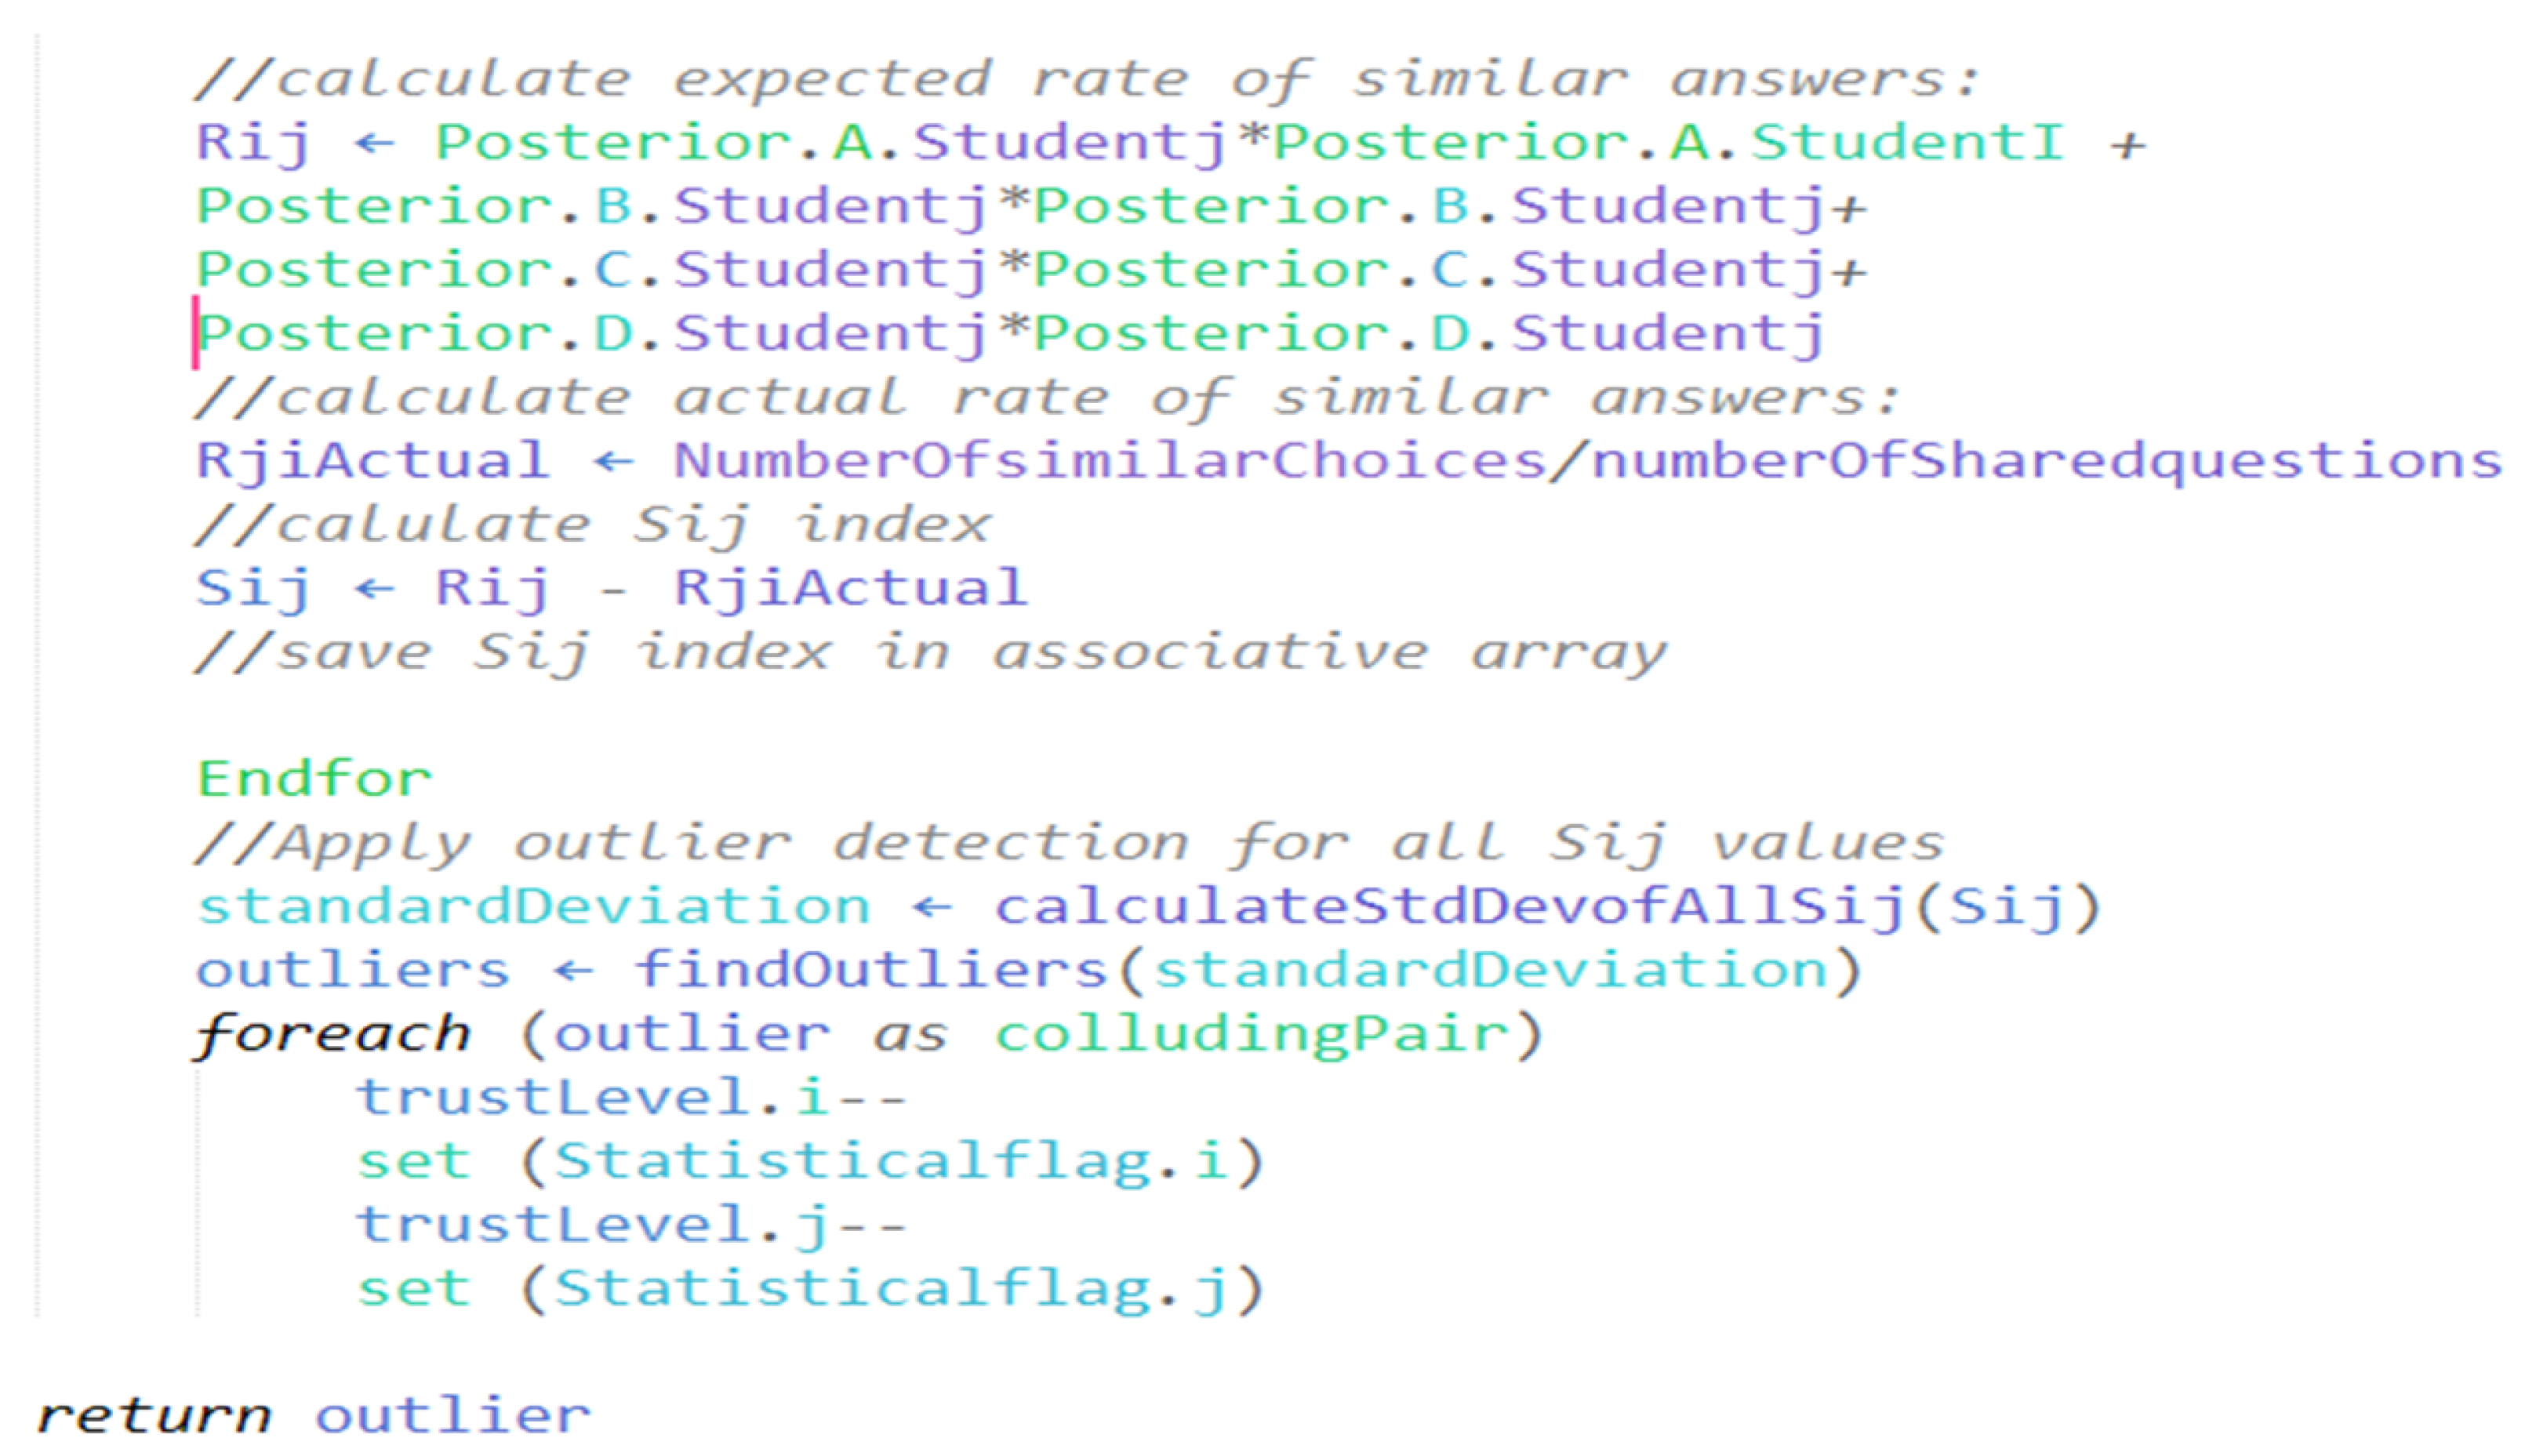
    • Step 6: For the pair of candidates (i, j), compute the expected rate of similar answers, r i , j e x p e c t e d as follows:
      r i , j e x p e c t e d = P i ( A | Ω ) P j ( A | Ω ) + P i ( B | Ω ) P j ( B | Ω ) + P i ( C | Ω ) P j ( C | Ω ) + P i ( D | Ω ) P j ( D | Ω )
    • Step 7: Calculate r i , j a c t u a l , as expressed in the following equation:
      r i , j a c t u a l = n b o t h _ s a m e n
      where n stands for the number of questions answered by both students (i, j), and ( n b o t h _ s a m e ) is the number of identical question answers for both students (i, j).
    • Step 8: Calculate S i j , the suspicion index for the pair. S i j is expressed in the following equation:
      S i j = r i , j a c t u a l r i , j e x p e c t e d
    • Step 9: High values of S i j demonstrate the possibly suspicious similarity between answers for a pair of students. Finding the high S i j values in all distinct pairs of students in the exam is achieved using a Gaussian distribution of all the N(N − 1) S i j values. Outlier S i j values are determined using the standard deviation. Values that are four standard deviations or more away from the mean of the data are considered outliers, indicating a high suspicion index.
    • Step 10: The collusion flag is raised for each pair with a high suspicion index value and saved in an array. Flagged students receive a trust-level penalty relative to their suspicion index.
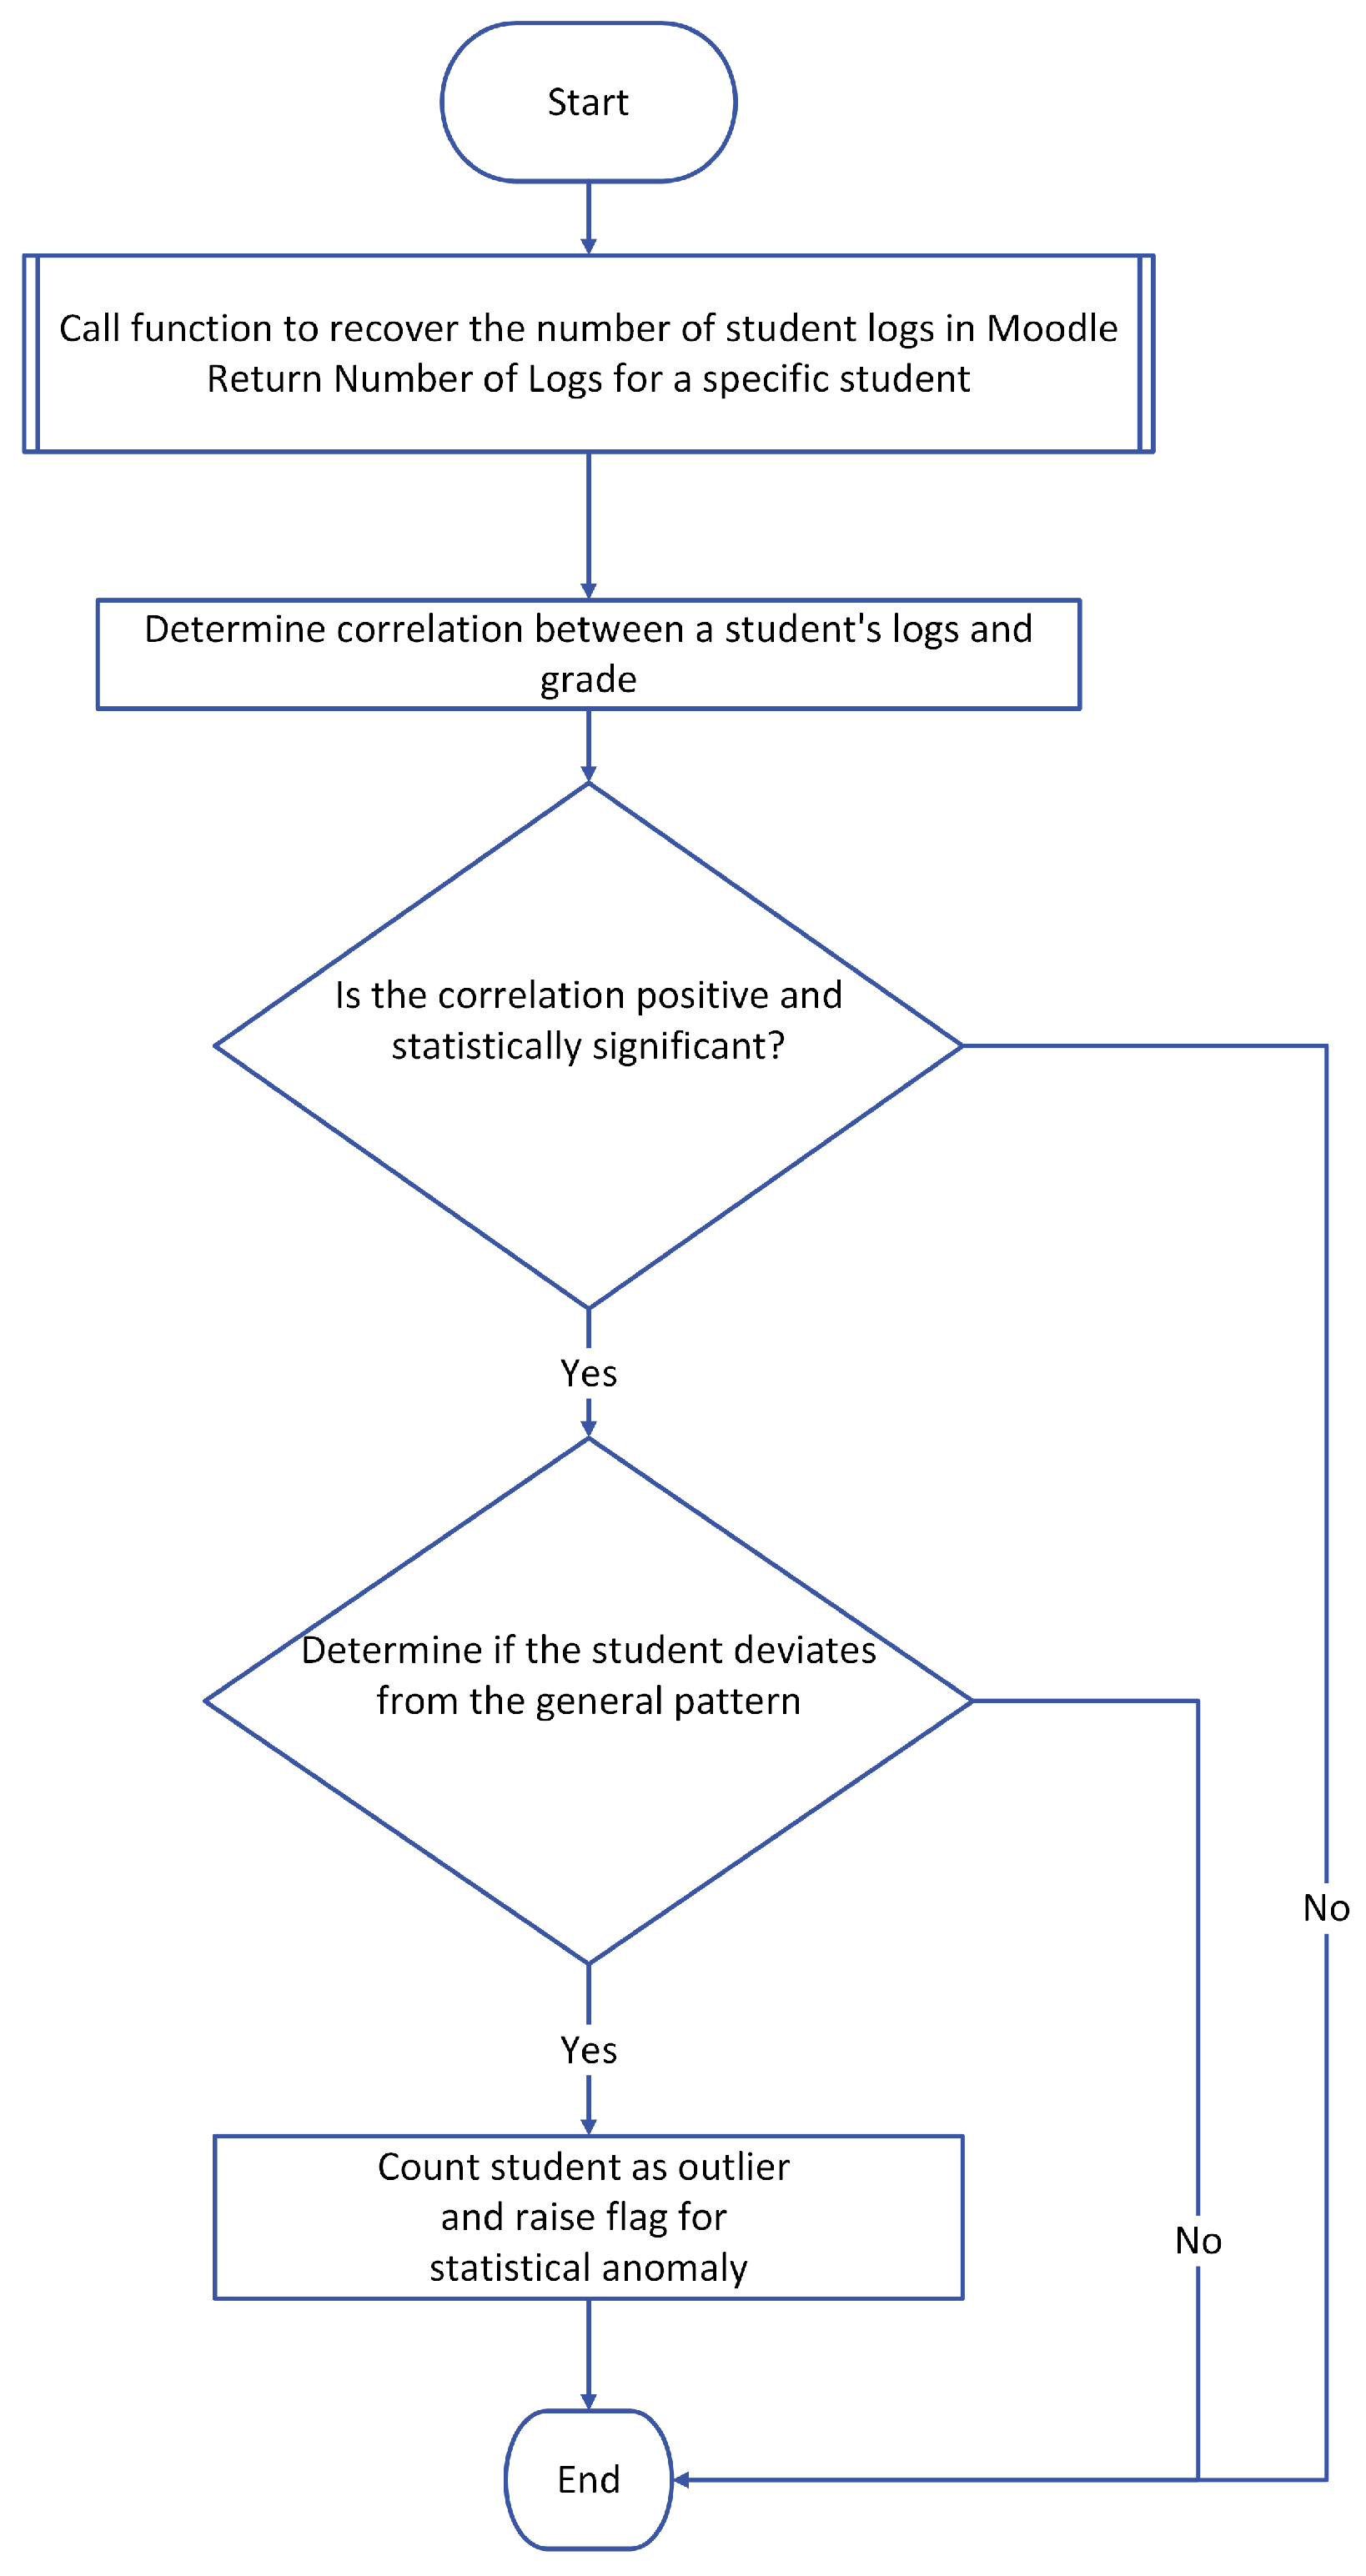
  • Correlation Analysis of Students’ Performance and Their Online Activity
    The Moodle built-in logging system logs all students’ activities on the platform. This includes the activity type, grading status, and submission status. Algorithm 2 utilizes these logs, which have been shown to positively correlate with the student’s performance in an online learning course [25]. Furthermore, logs adequately gauge the expected student’s performance in the semester [6]. The algorithm performs a correlation analysis on students’ quiz grades and their logs and activities. Such correlation is calculated using Pearson’s correlation index r, as expressed in the following equation:
    r = ( x i x ¯ ) ( y i y ¯ ) ( x i x ¯ ) 2 ( y i y ¯ ) 2
    where r is the Pearson coefficient, x i is the x-variable in the sample representing the number of students’ logs and activities, x ¯ is the mean of the values of the x-variable in the sample, y i is the y-variable representing the students’ grades in the quiz, and y ¯ is the mean of the values of the y-variable in the sample.
    The Pearson correlation coefficient, r, expresses the strength of the relationship between the two variables and their direction, which is either positive or negative. The r-value range is [−1, 1]. For example, if r = −0.9, a strong inverse relationship exists between the x- and y-variables. Conversely, if r = +0.9, a strong positive relationship exists between the x- and y-variables. r is sensitive to the course content. Therefore, it is necessary to calculate the r-value for the course that contains quizzes, as each course has different methods and E-learning processes. Some courses’ activities may not impact a student’s performance, while in other courses, the same activities may have a significant impact on a student’s performance.
    A regression analysis is carried out on the results of each quiz’s grades and the students’ logs if the determined correlation value is solid and positive. The student’s grades become the dependent variable in a regression model, while the logs of the grades become the independent variable. Then, using student scatter plots and the regression line equation, this regression model is utilized to identify outliers. The distance of the student from the regression line is then determined.
    Outliers in this analysis are the students whose points are three standard deviations or more from the mean distance to the regression line. Those outliers are flagged as statistical anomalies and have their level of trust demoted accordingly. This method will not be applied to students in the quiz if the r-value is less than 0.3.
    Figure 3 shows the flowchart for the correlation analysis algorithm:
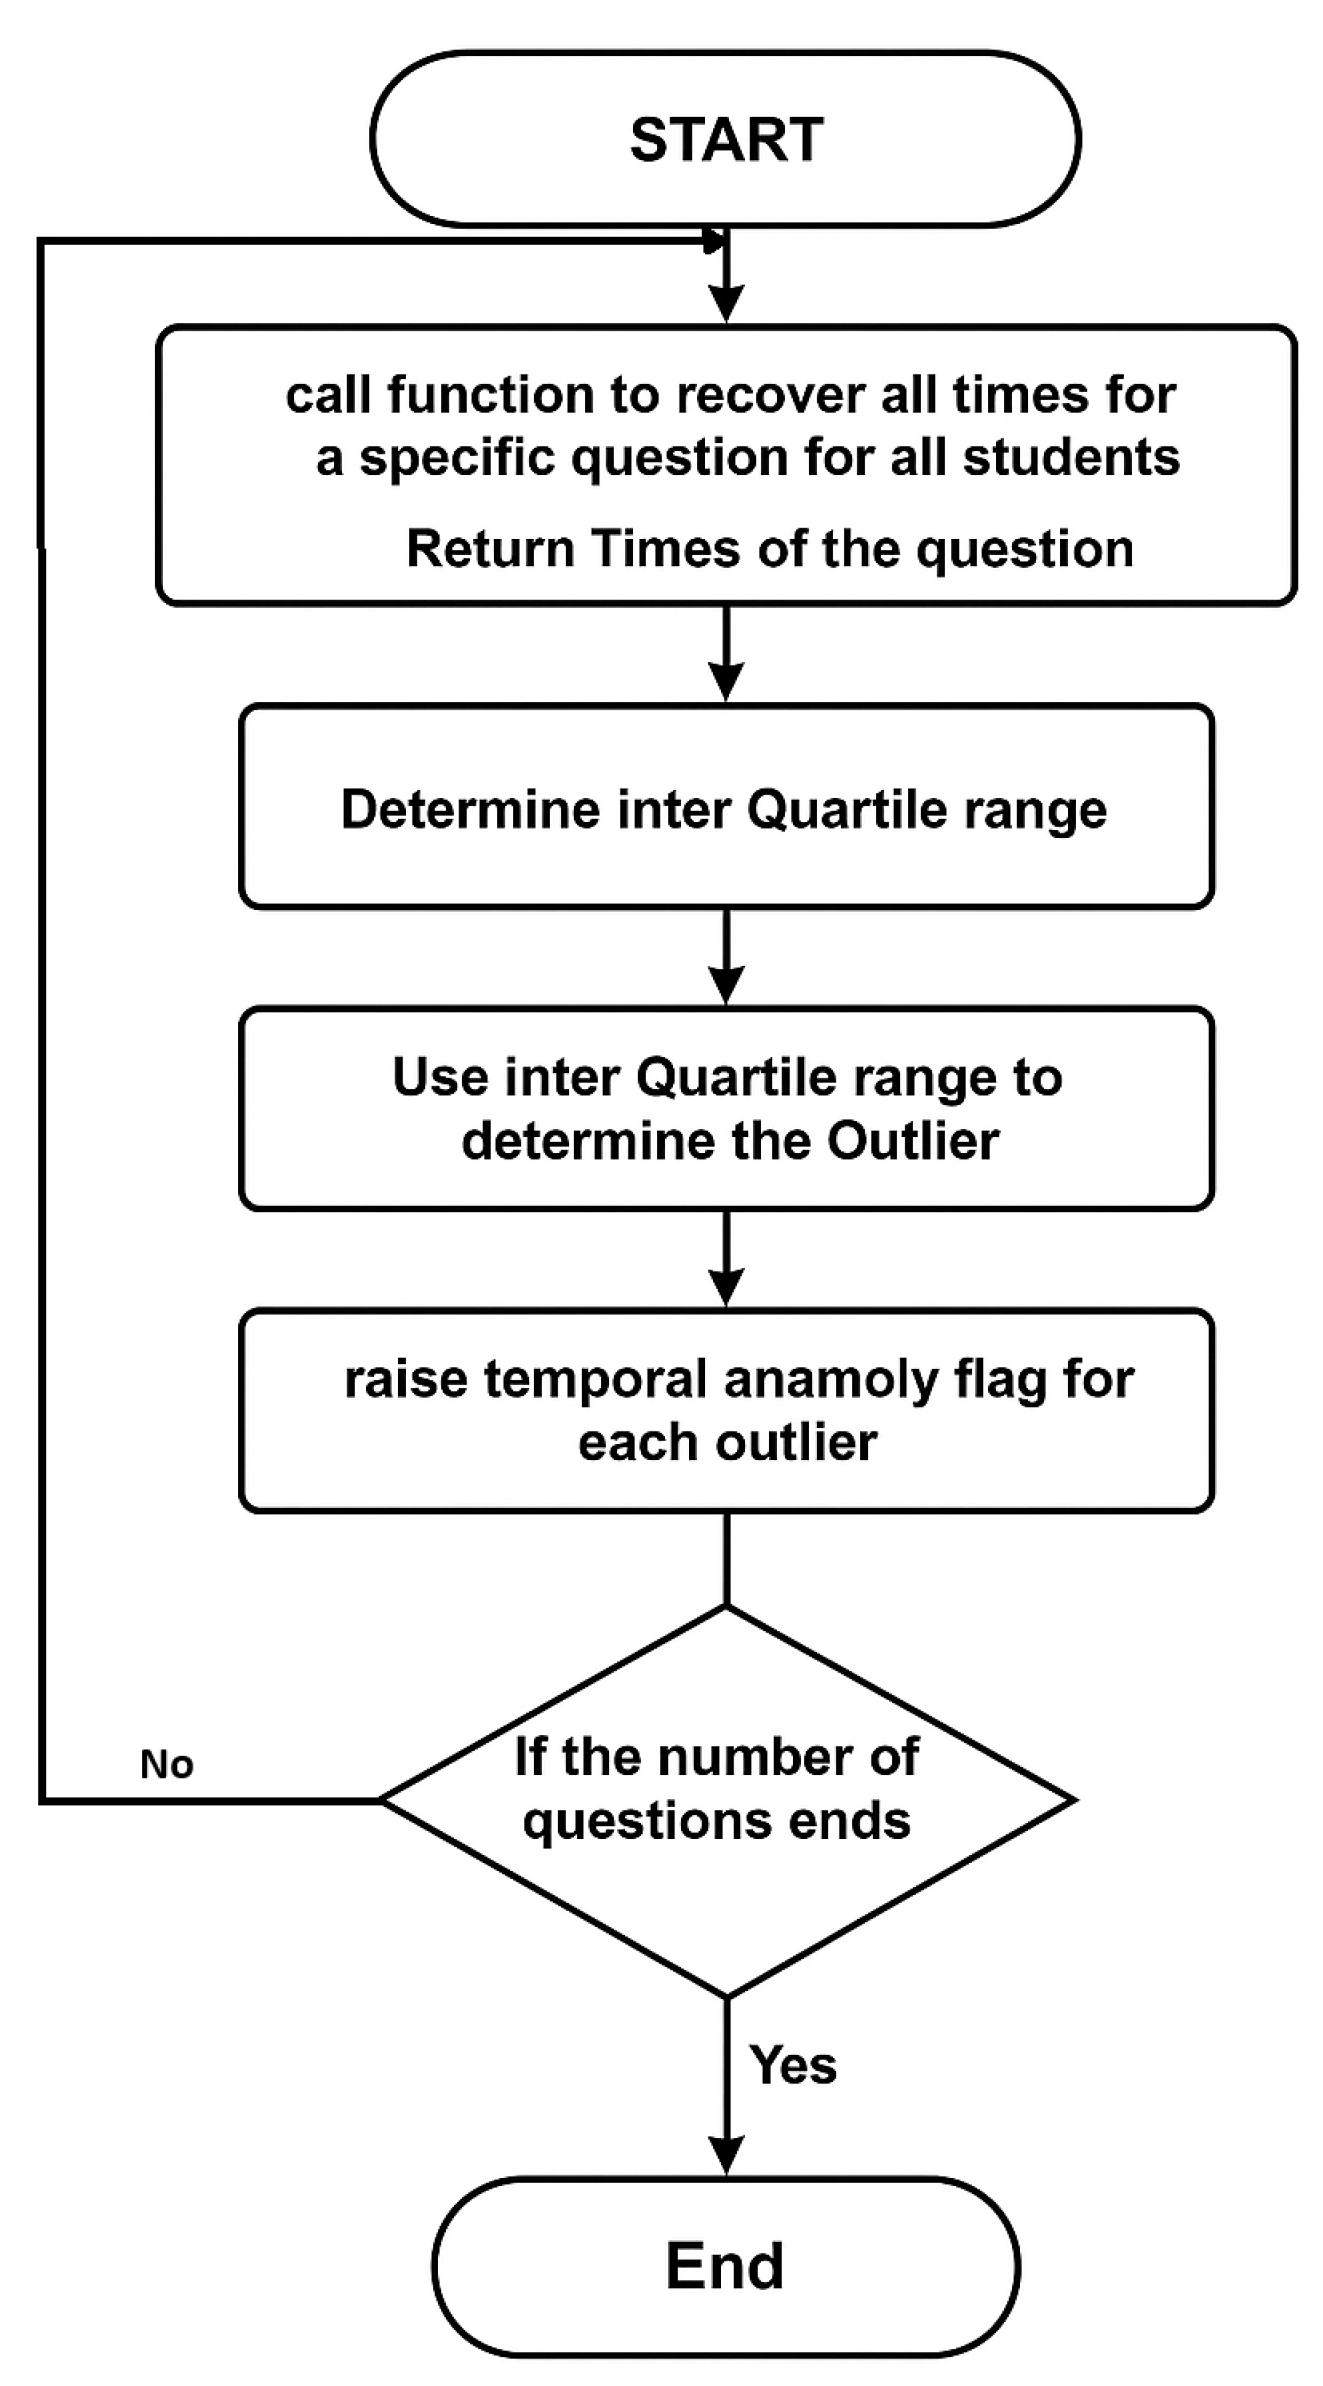
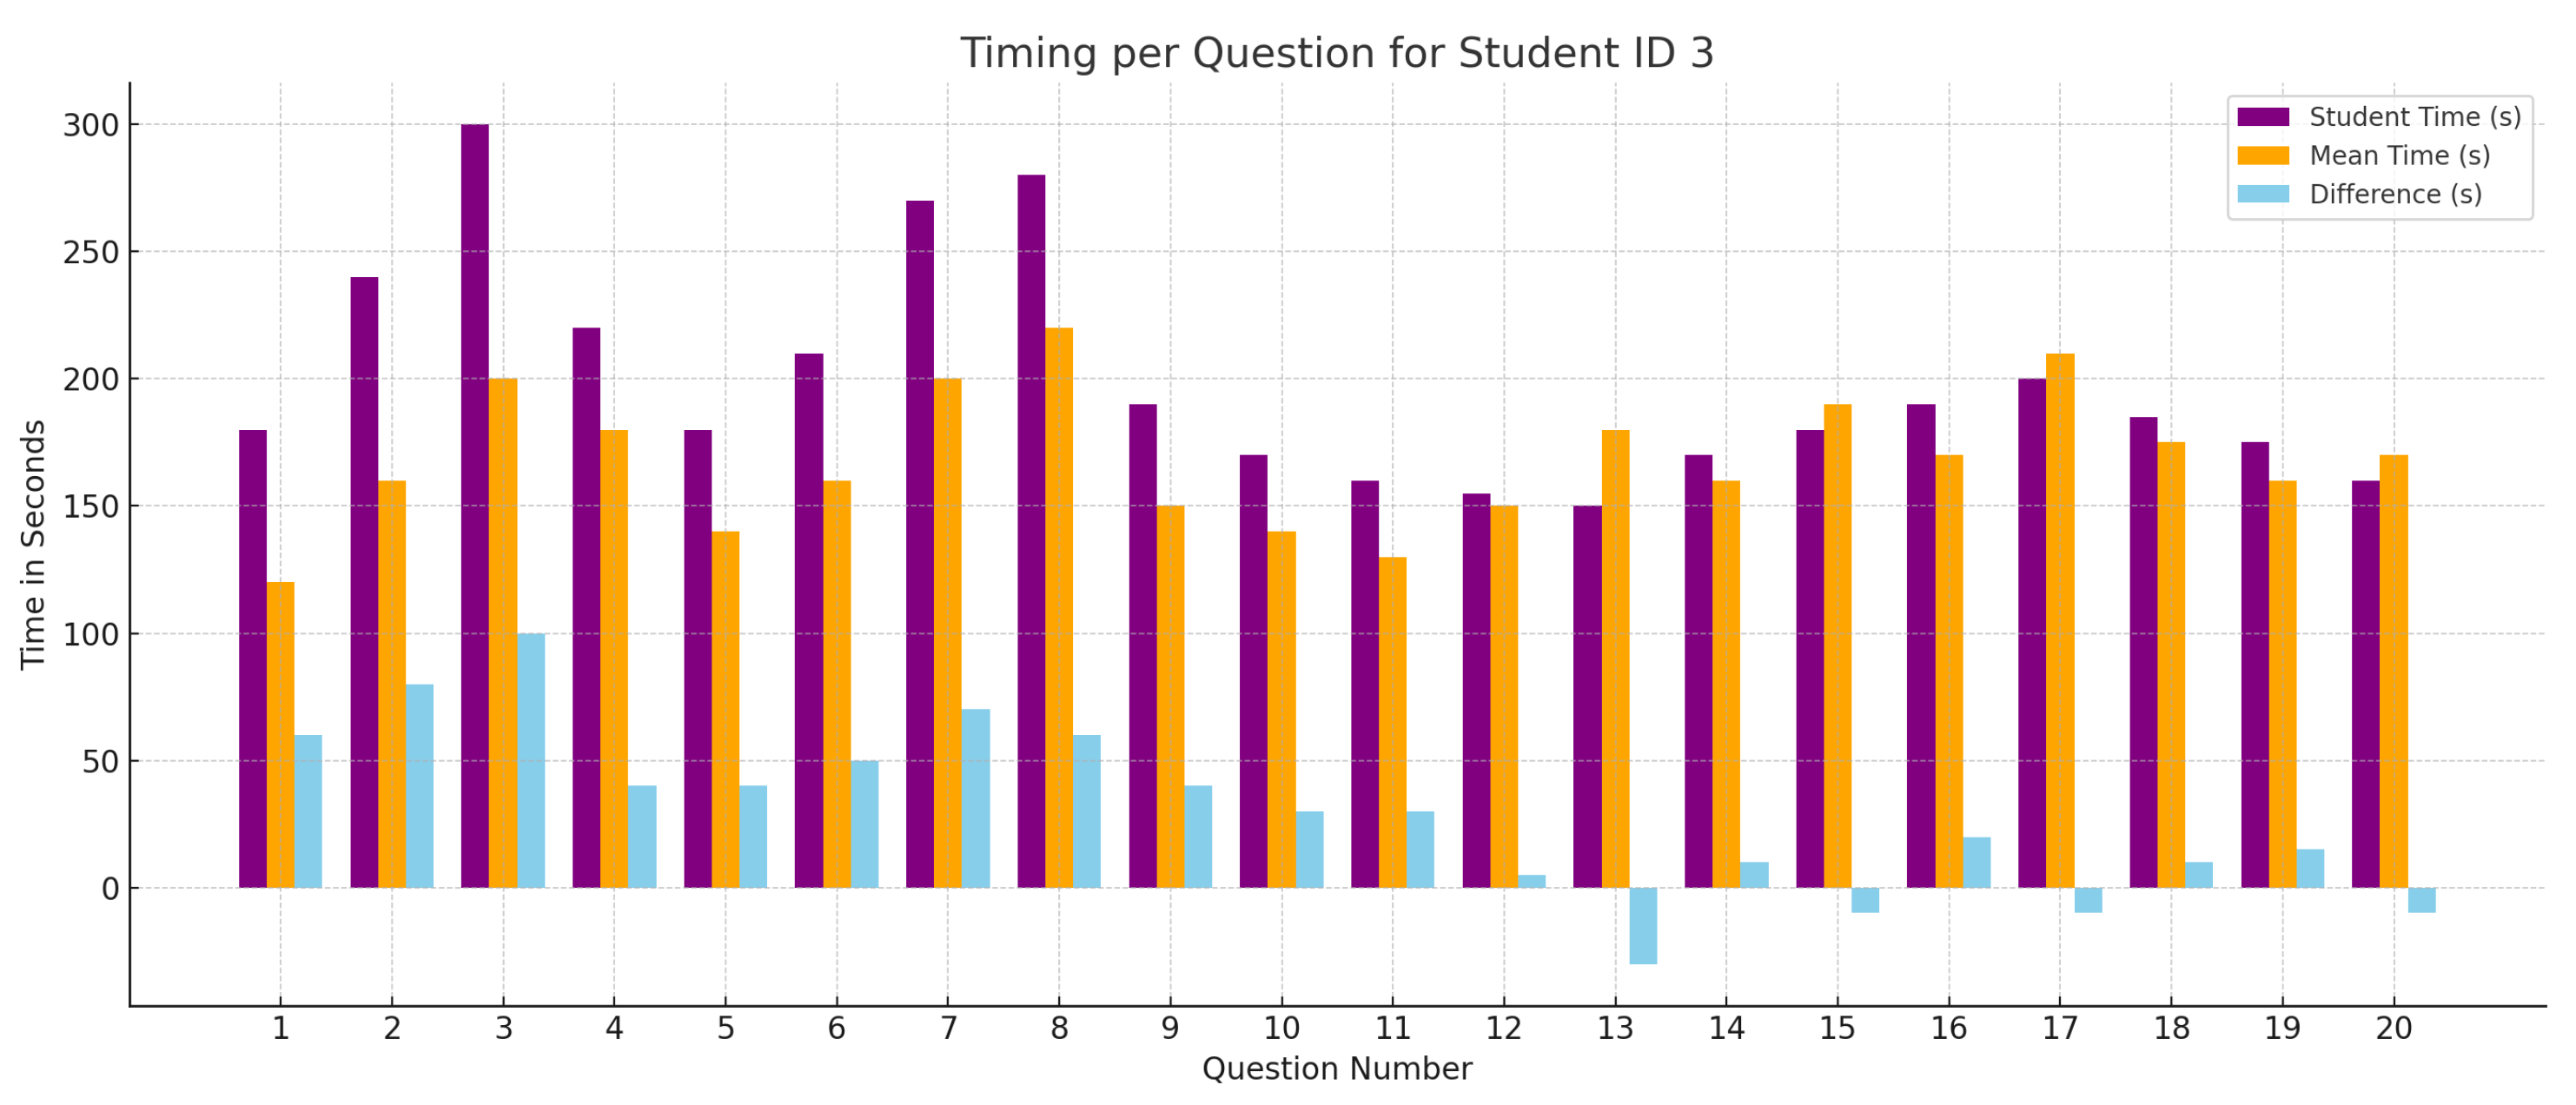
  • Response Time Anomaly Detection: Student response time measures the time it takes to answer a question and confirm the answer. Algorithm 3 is designed to detect suspicious students’ activities based on their response times. According to recent research [45], using online studying assistance websites, such as Chegg, among others, to breach academic integrity has been proven to be a real problem. Students who use those websites typically upload all their examination questions to the website and wait for solutions to be provided by an expert hired by the website. Detecting this case is relatively easy because a student would spend a long time waiting before answering the questions in a relatively short time. Additionally, some students have opted to wait, in one-way ordered exams, for their colleagues to solve their questions and share the answers with them. This would compromise the purpose of one-way examinations if it were supported by response time analysis. The response time anomaly algorithm is designed to detect students’ suspicious response times on each exam question. The students’ response times for each question are sorted to enable the use of the interquartile range (IQR) method. IQR stands for interquartile range, a measure of data dispersion in a sample. The following equation measures IQR:
    I Q R = Q 3 Q 1
    where Q3 is the middle value in the third quarter of the data, and Q1 is the middle value in the first half of the data. IQR is calculated for every question’s response time. Outlier students’ times are computed using the following equation:
    ( T q ) j > ( I Q R 1.5 ) + Q 3
    where T is the time in seconds, j is the student, and q is the question ID. All students’ response times ( T q ) j that satisfy Equation (8) are tagged and saved in the outlier array. The outlier’s trust level is then demoted relative to each question it was tagged on, based on the following equation:
    D e c r e m e n t = ( T q ) j M q
    where M q is the mean of all students’ times on q; this algorithm considers the relative timing of all class members’ times in finding the suspicious response times. Thus, a relatively difficult question in the examination would have a higher average response time than easier questions. Figure 4 demonstrates the flowchart for the response time anomaly detection algorithm:
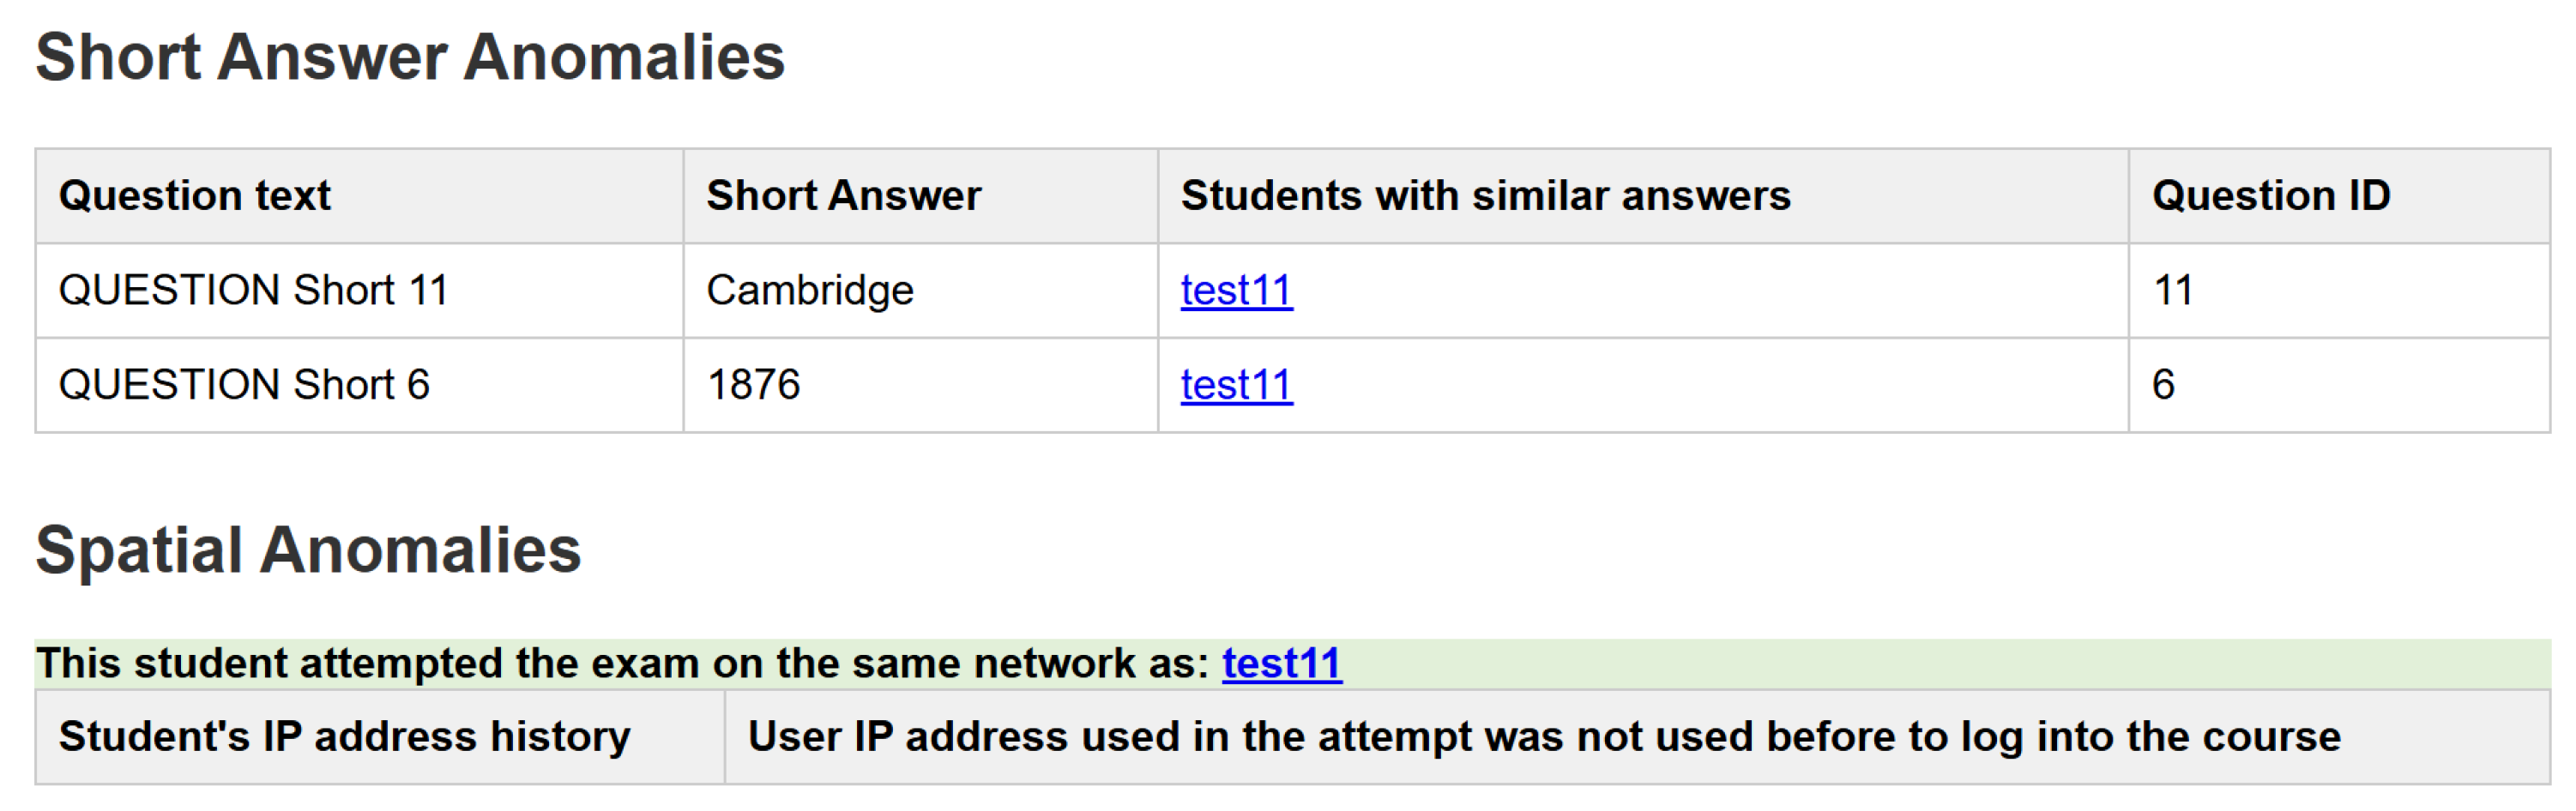
  • Spatial Anomaly Detection:
    Internet Protocol (IP) provides sufficient information regarding students’ spatial information, such as country, city, Internet Service Provider (ISP), and more. Moodle logs each student’s IP address once they start the quiz attempt. Using the Geo plug-in, a Moodle-integrated IP look-up AIP, we accurately determine the students’ spatial information by using their IP addresses. The geo plug-in takes IP as a parameter. It returns spatial information about it, such as students’ locations during exam attempts and whether they are on the same local network as other students. If two or more students are found to be on the same local network during an examination, they are all flagged, and their trust level is demoted. Moodle maintains logs of every student’s login event, including their IP address, to collect historical spatial data for each student. Inspecting these historical data helps us determine if a student has never used their examination IP address to log in before, which is also flagged as an anomaly in the system. Figure 5 demonstrates the flowchart for Algorithm 4:
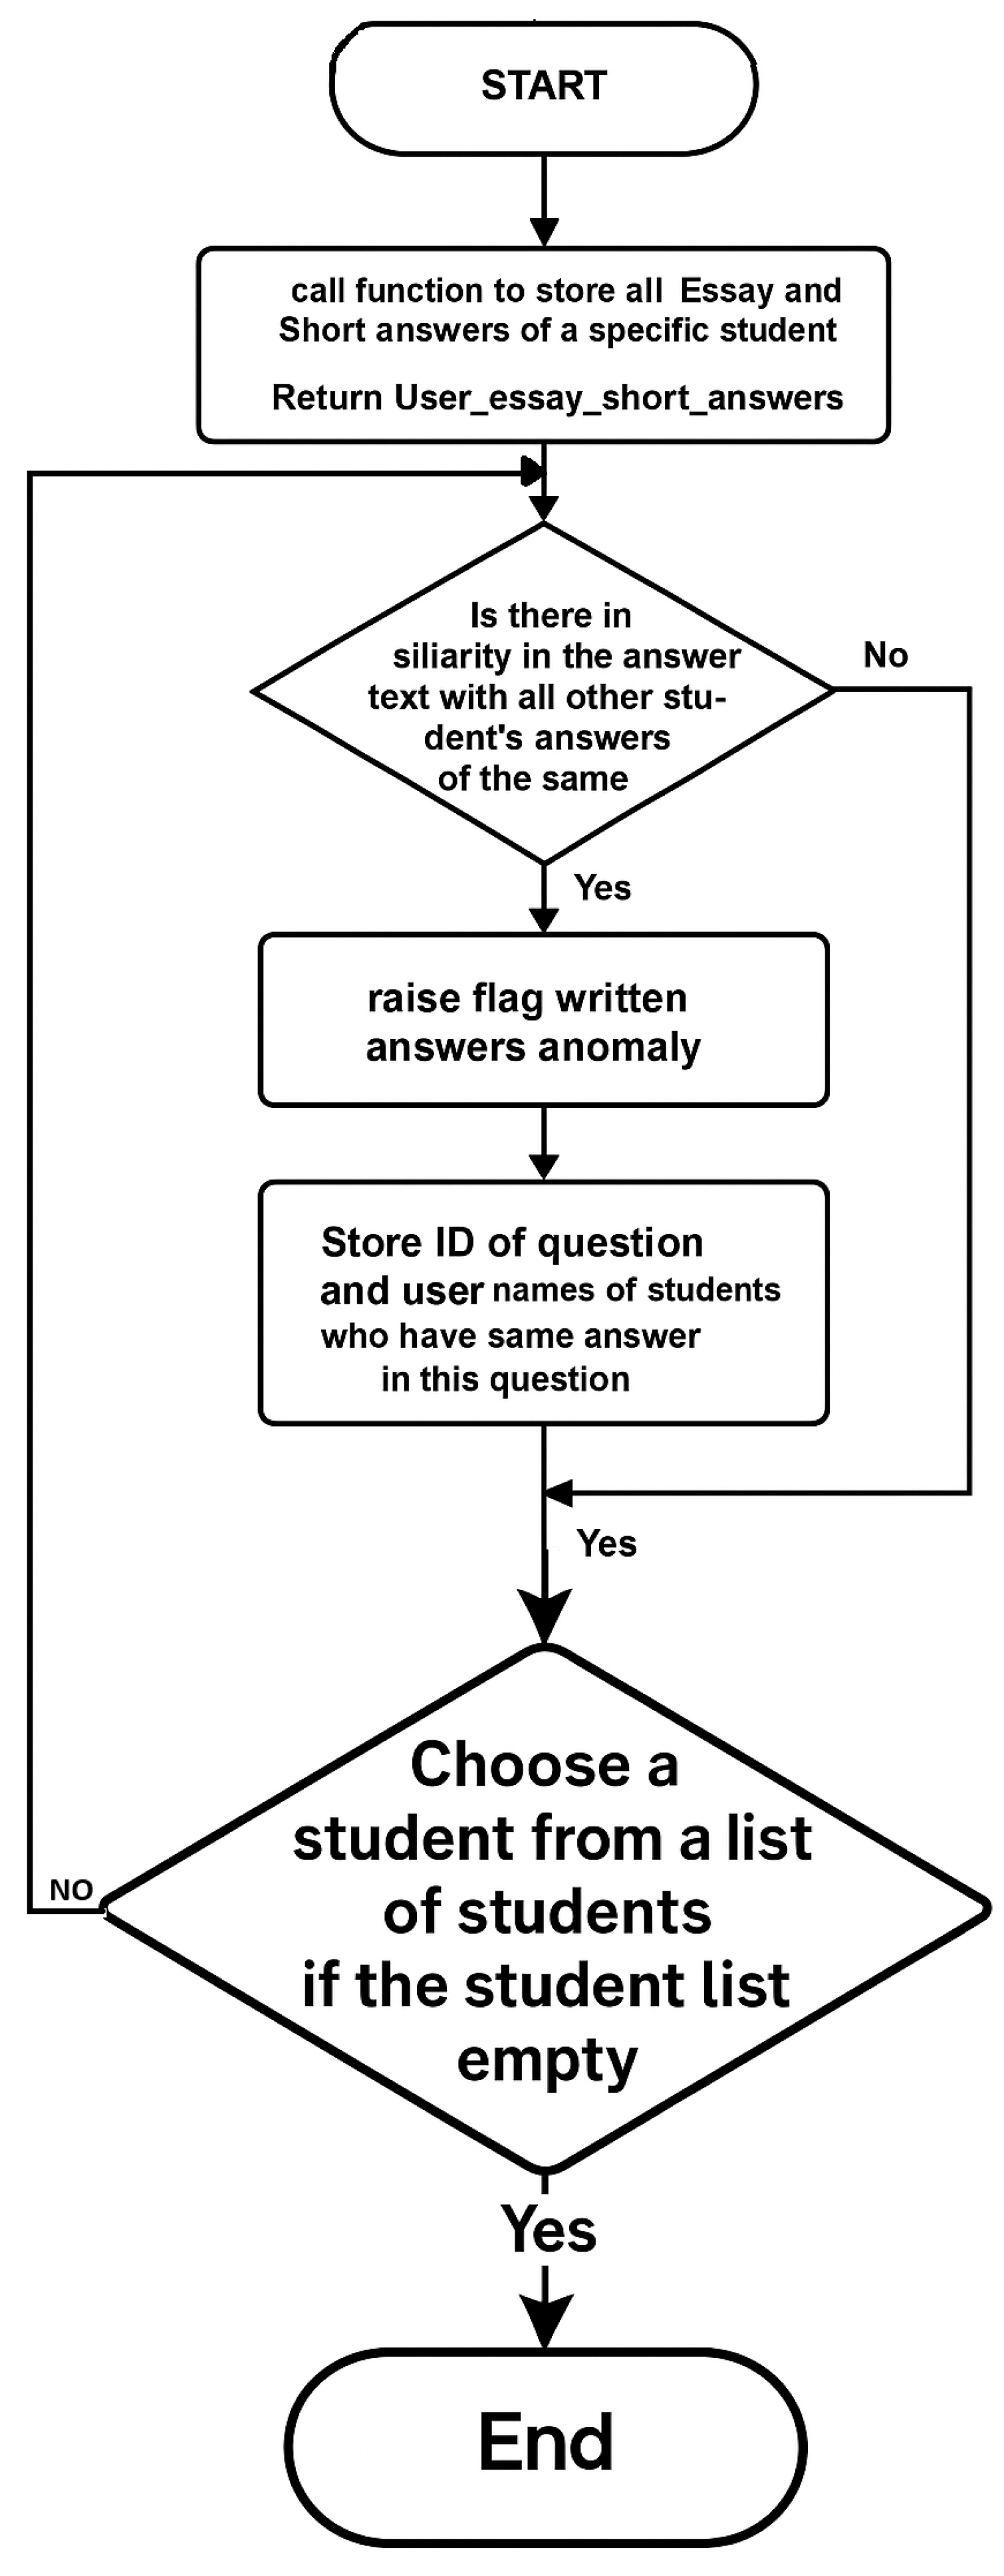
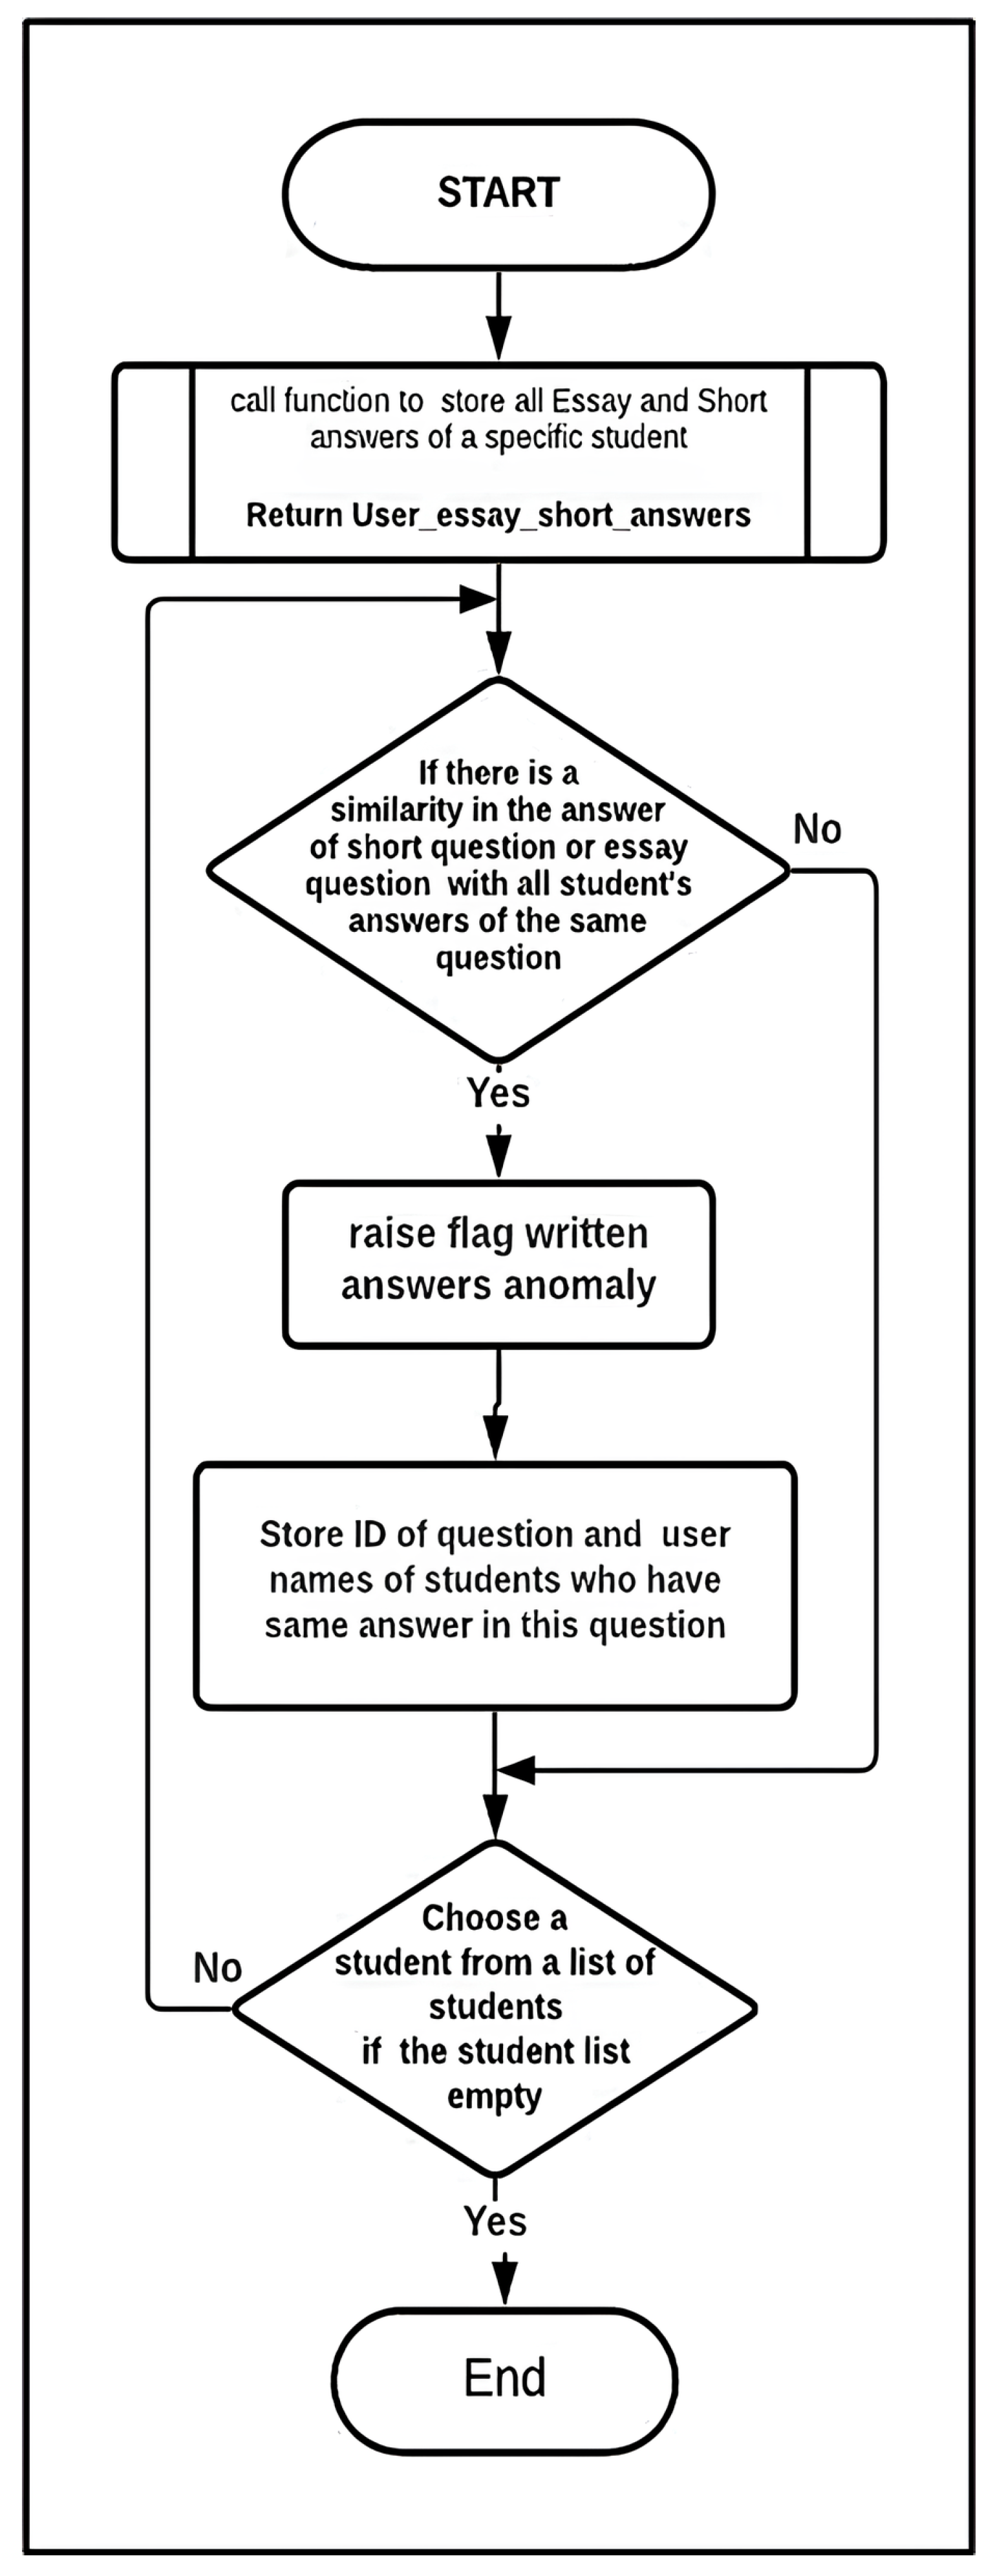
  • Written Answer Submissions: This algorithm is proposed for written answer submissions. It detects extreme similarity in students’ answers. The algorithm examines the answers to each written question and checks for a high similarity score. Each answer is given a similarity score compared to all other answers in the exam. After that, the IQR outlier detection method, previously discussed, is used to identify the highest similarity scores, which are flagged as outliers. These outliers then receive a trust-level penalty. Figure 6 demonstrates Algorithm 5:

4.2.3. Result Visualization

The system is designed to present the analysis results in an intuitive and easily understandable manner. Thus, multiple web pages were integrated into the report, each providing well-organized and informative content. The report consists of five visualization components to convey the information intuitively; each will be discussed below:
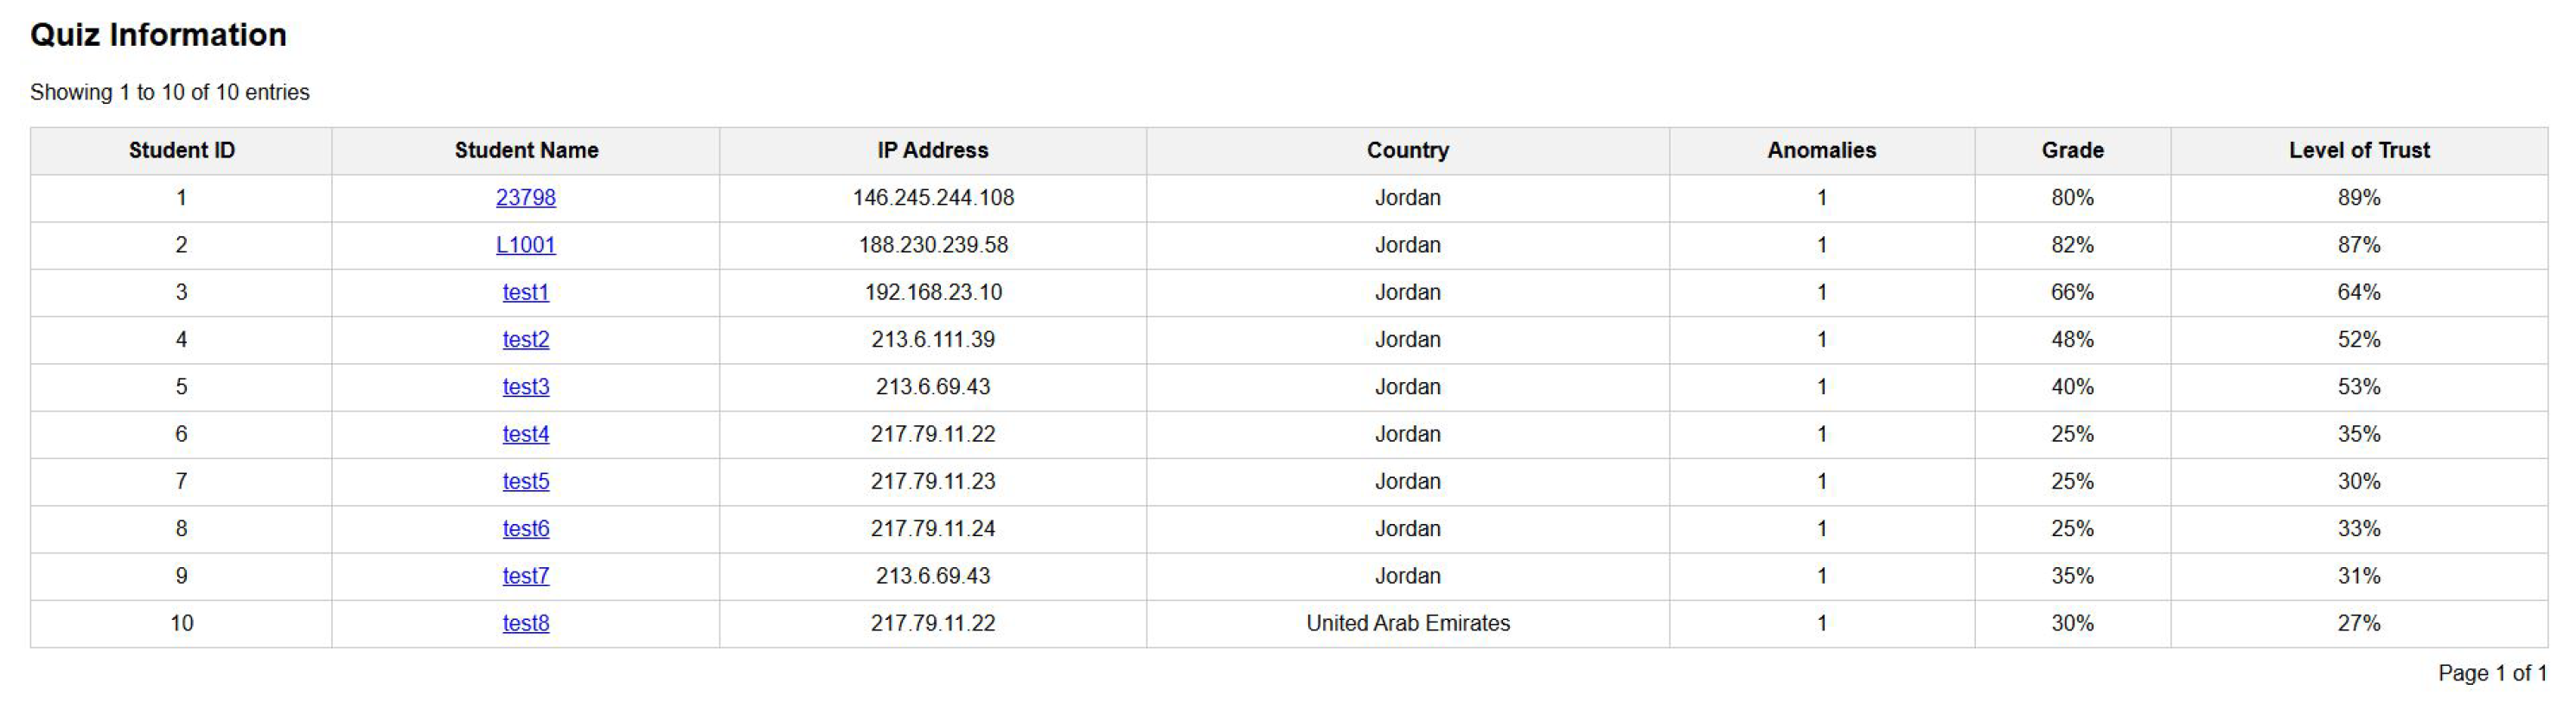
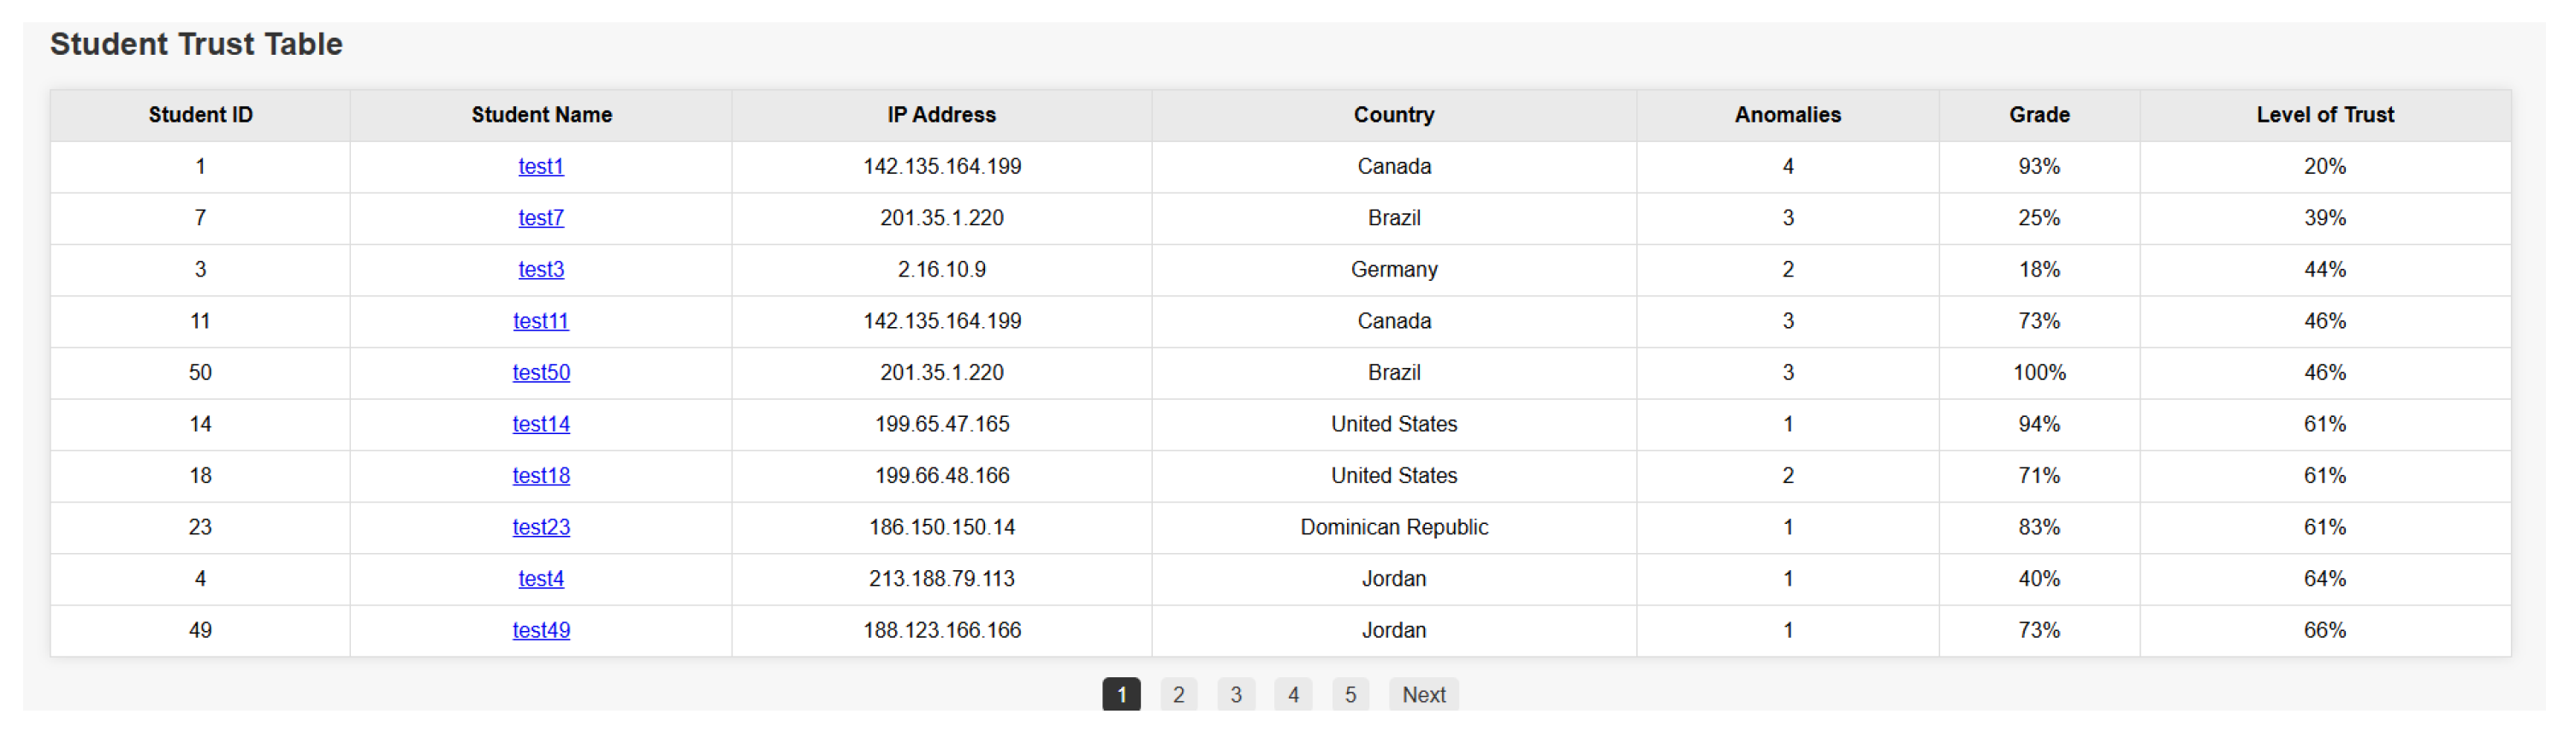
  • Data table, which displays all students who had attempted the quiz, their achieved grade in the quiz, their trust level, and the number of anomaly flags that had been triggered.
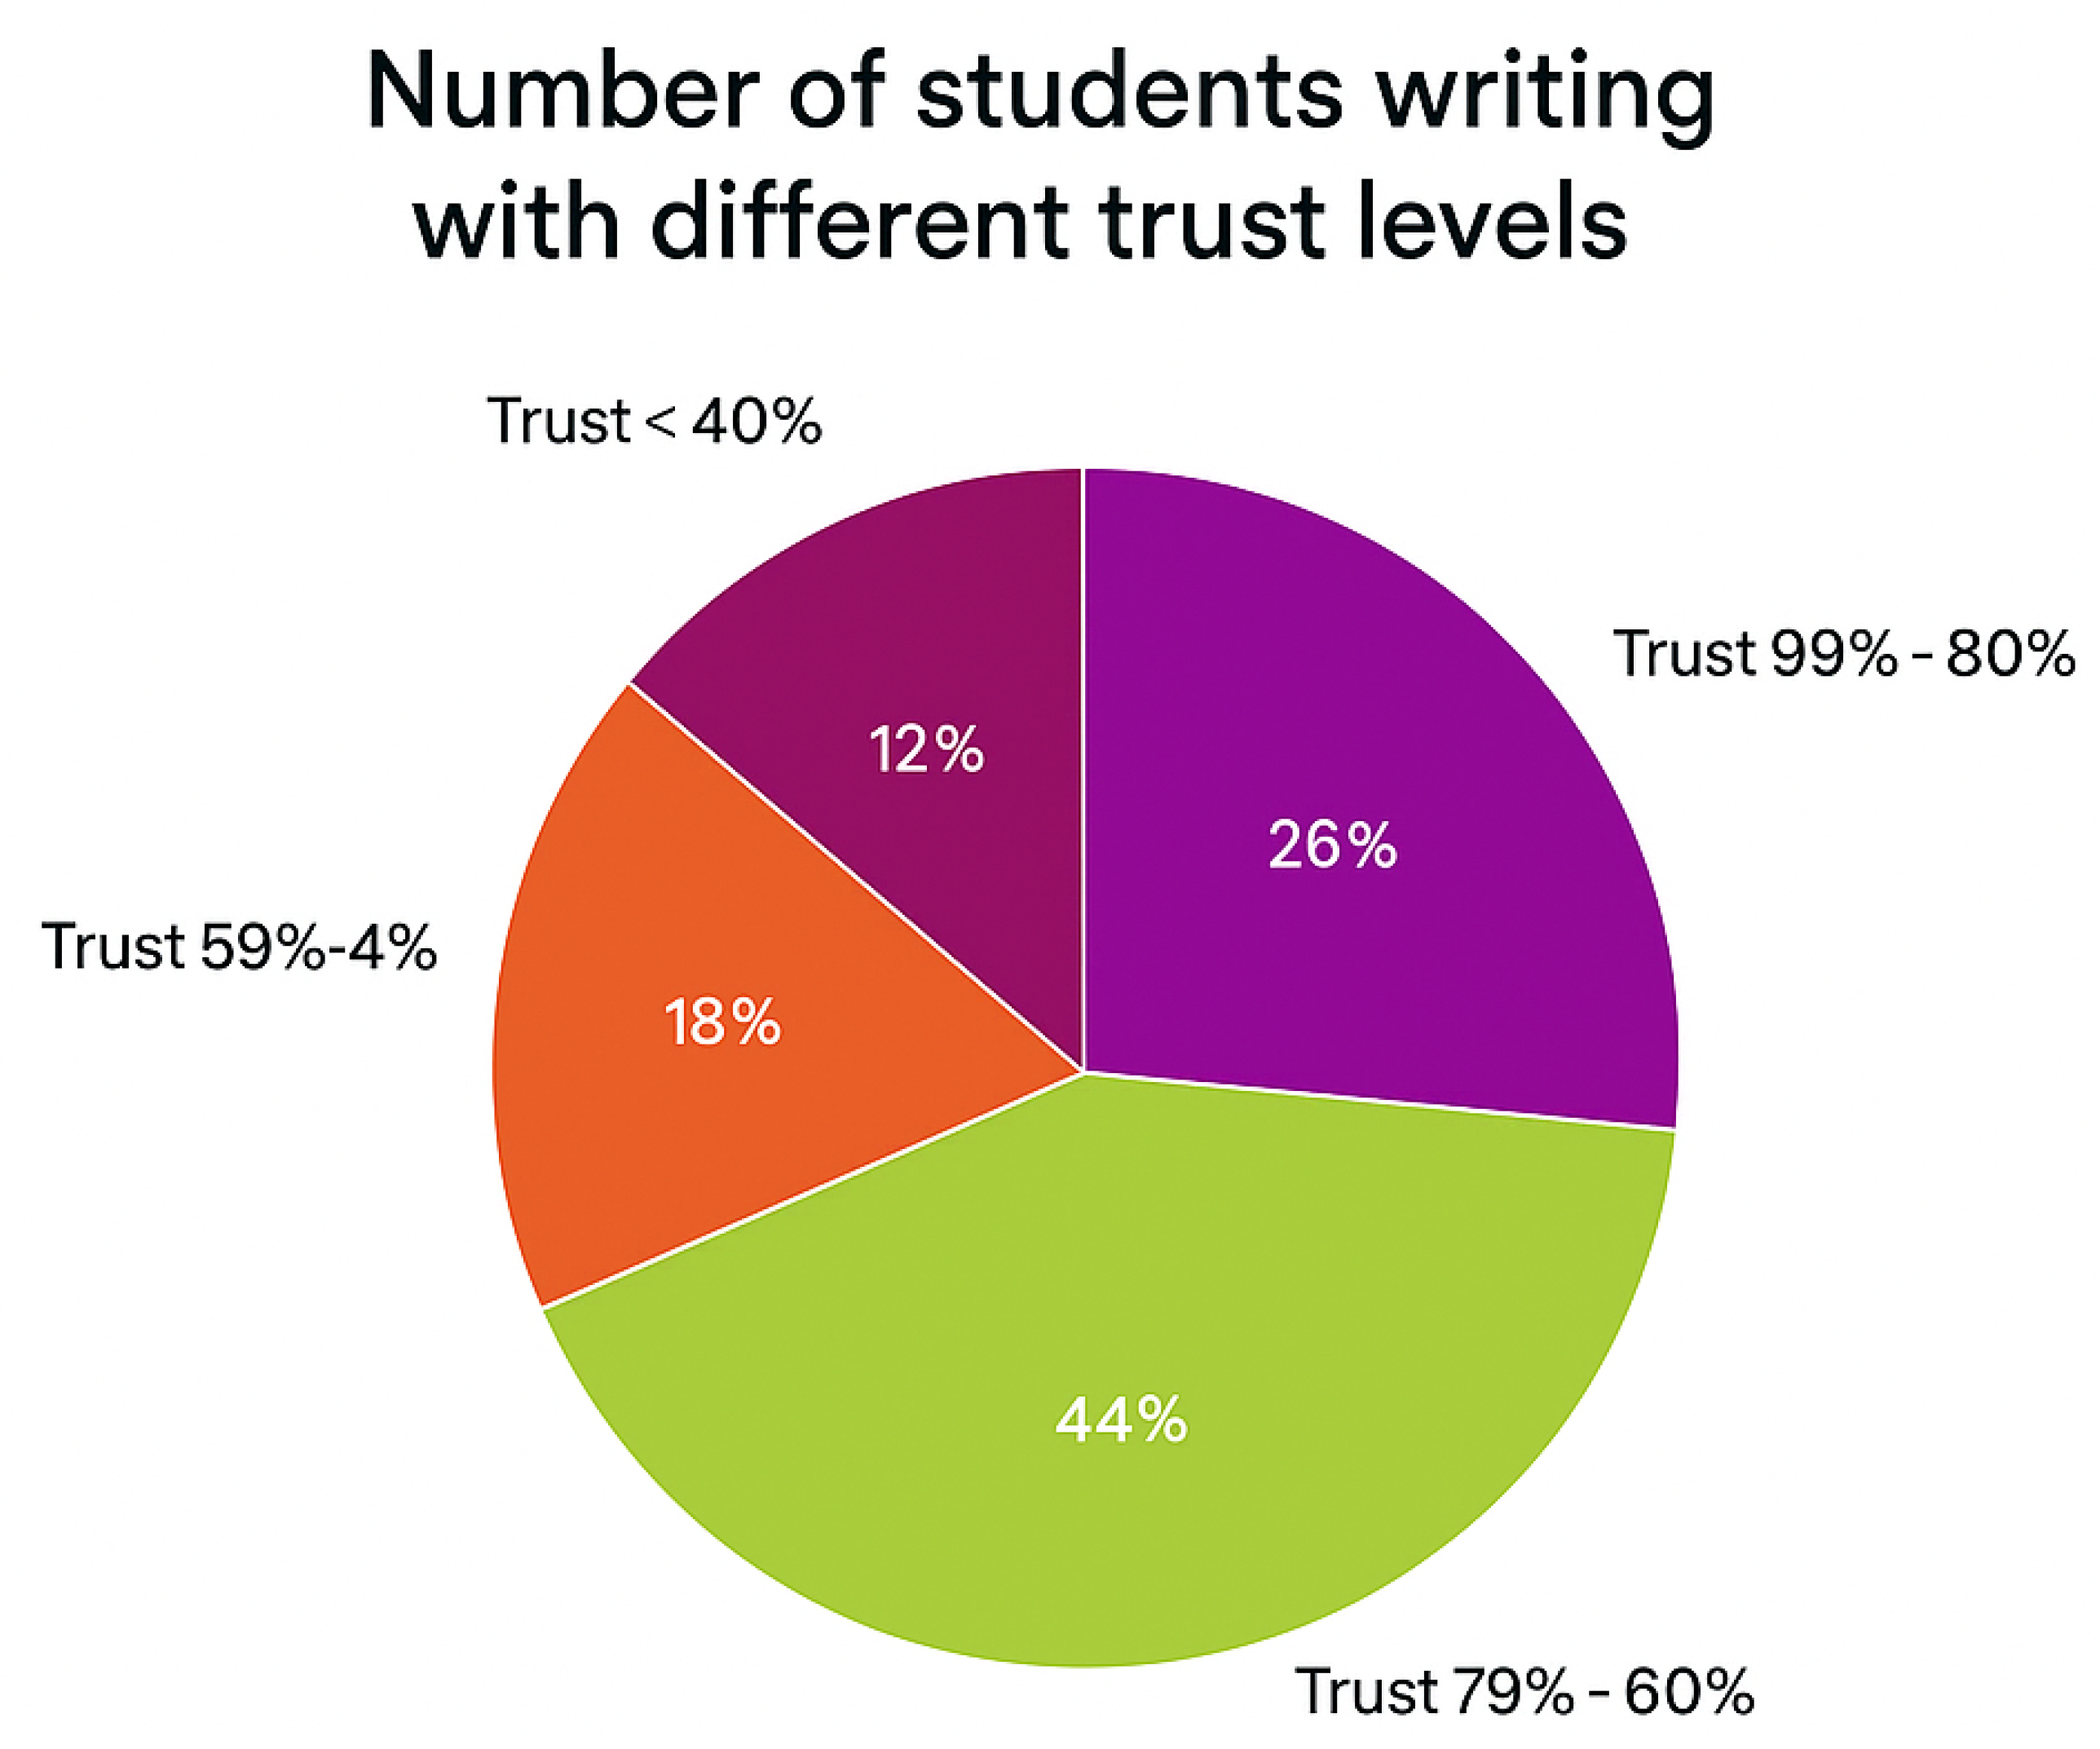
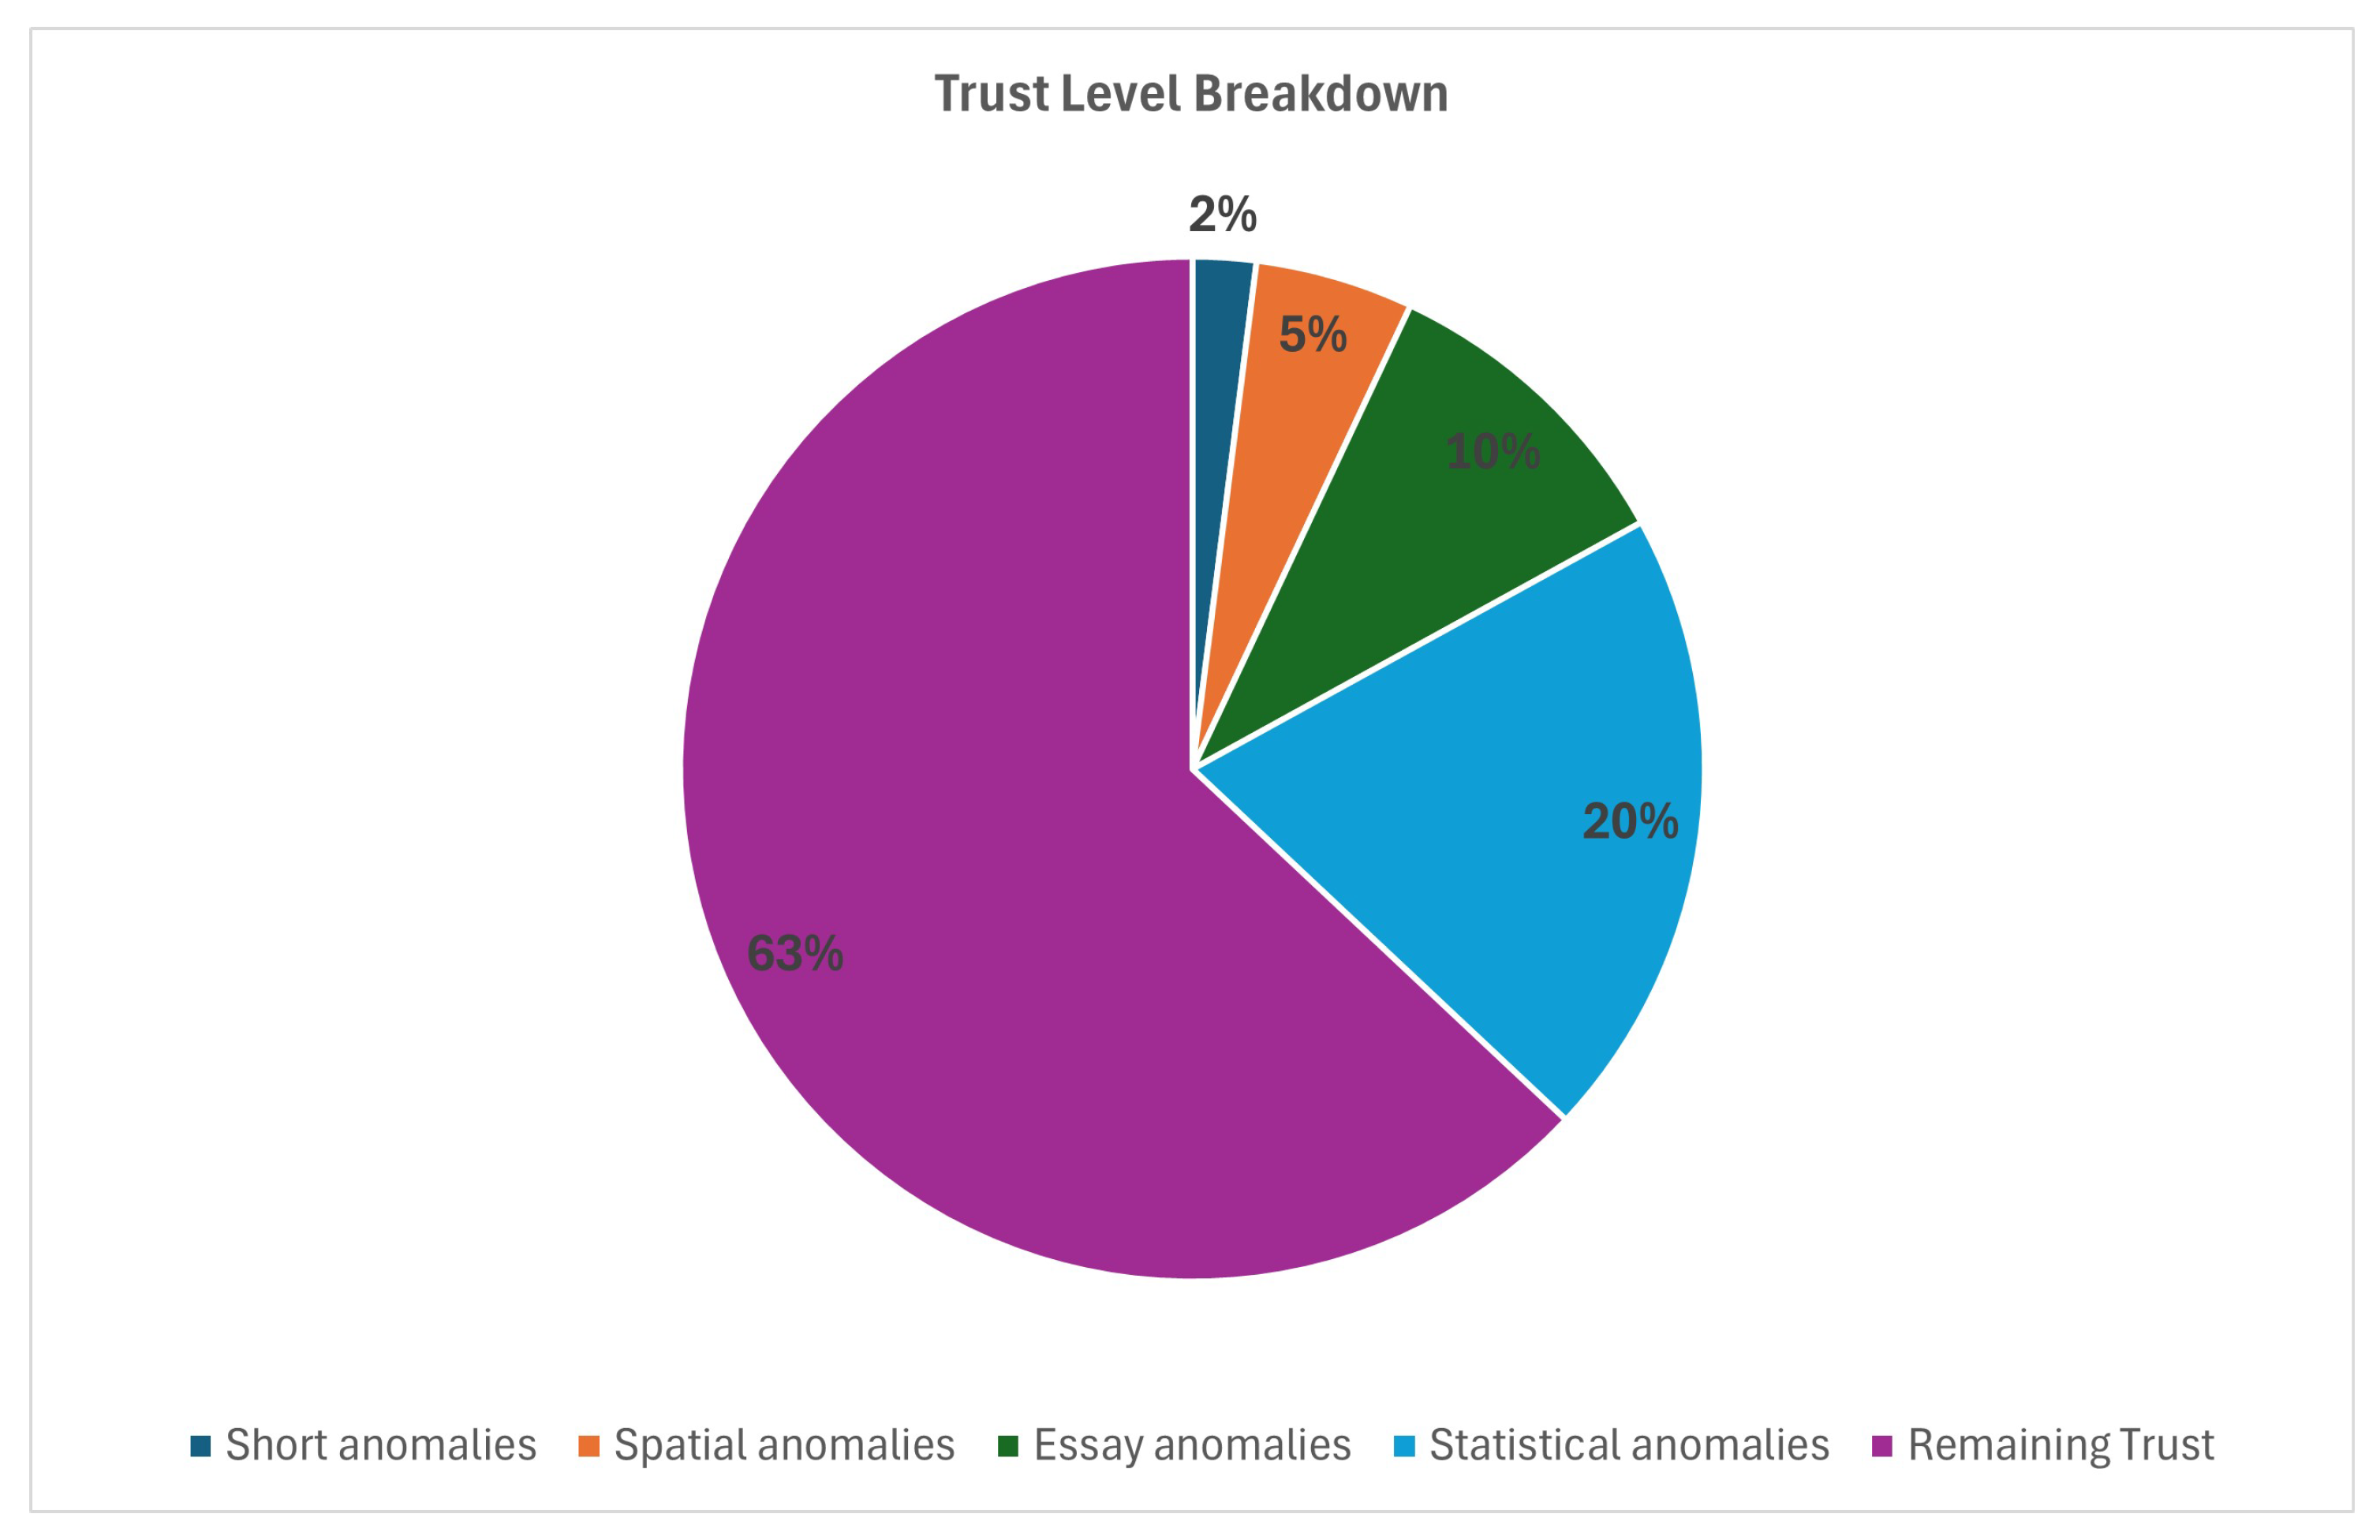
  • An interactive pie chart divides trust levels into ranges and presents the percentage of students for each range. Trust ranges start from [0%, 20%] to [80–100%]. Ranges are color-coded.
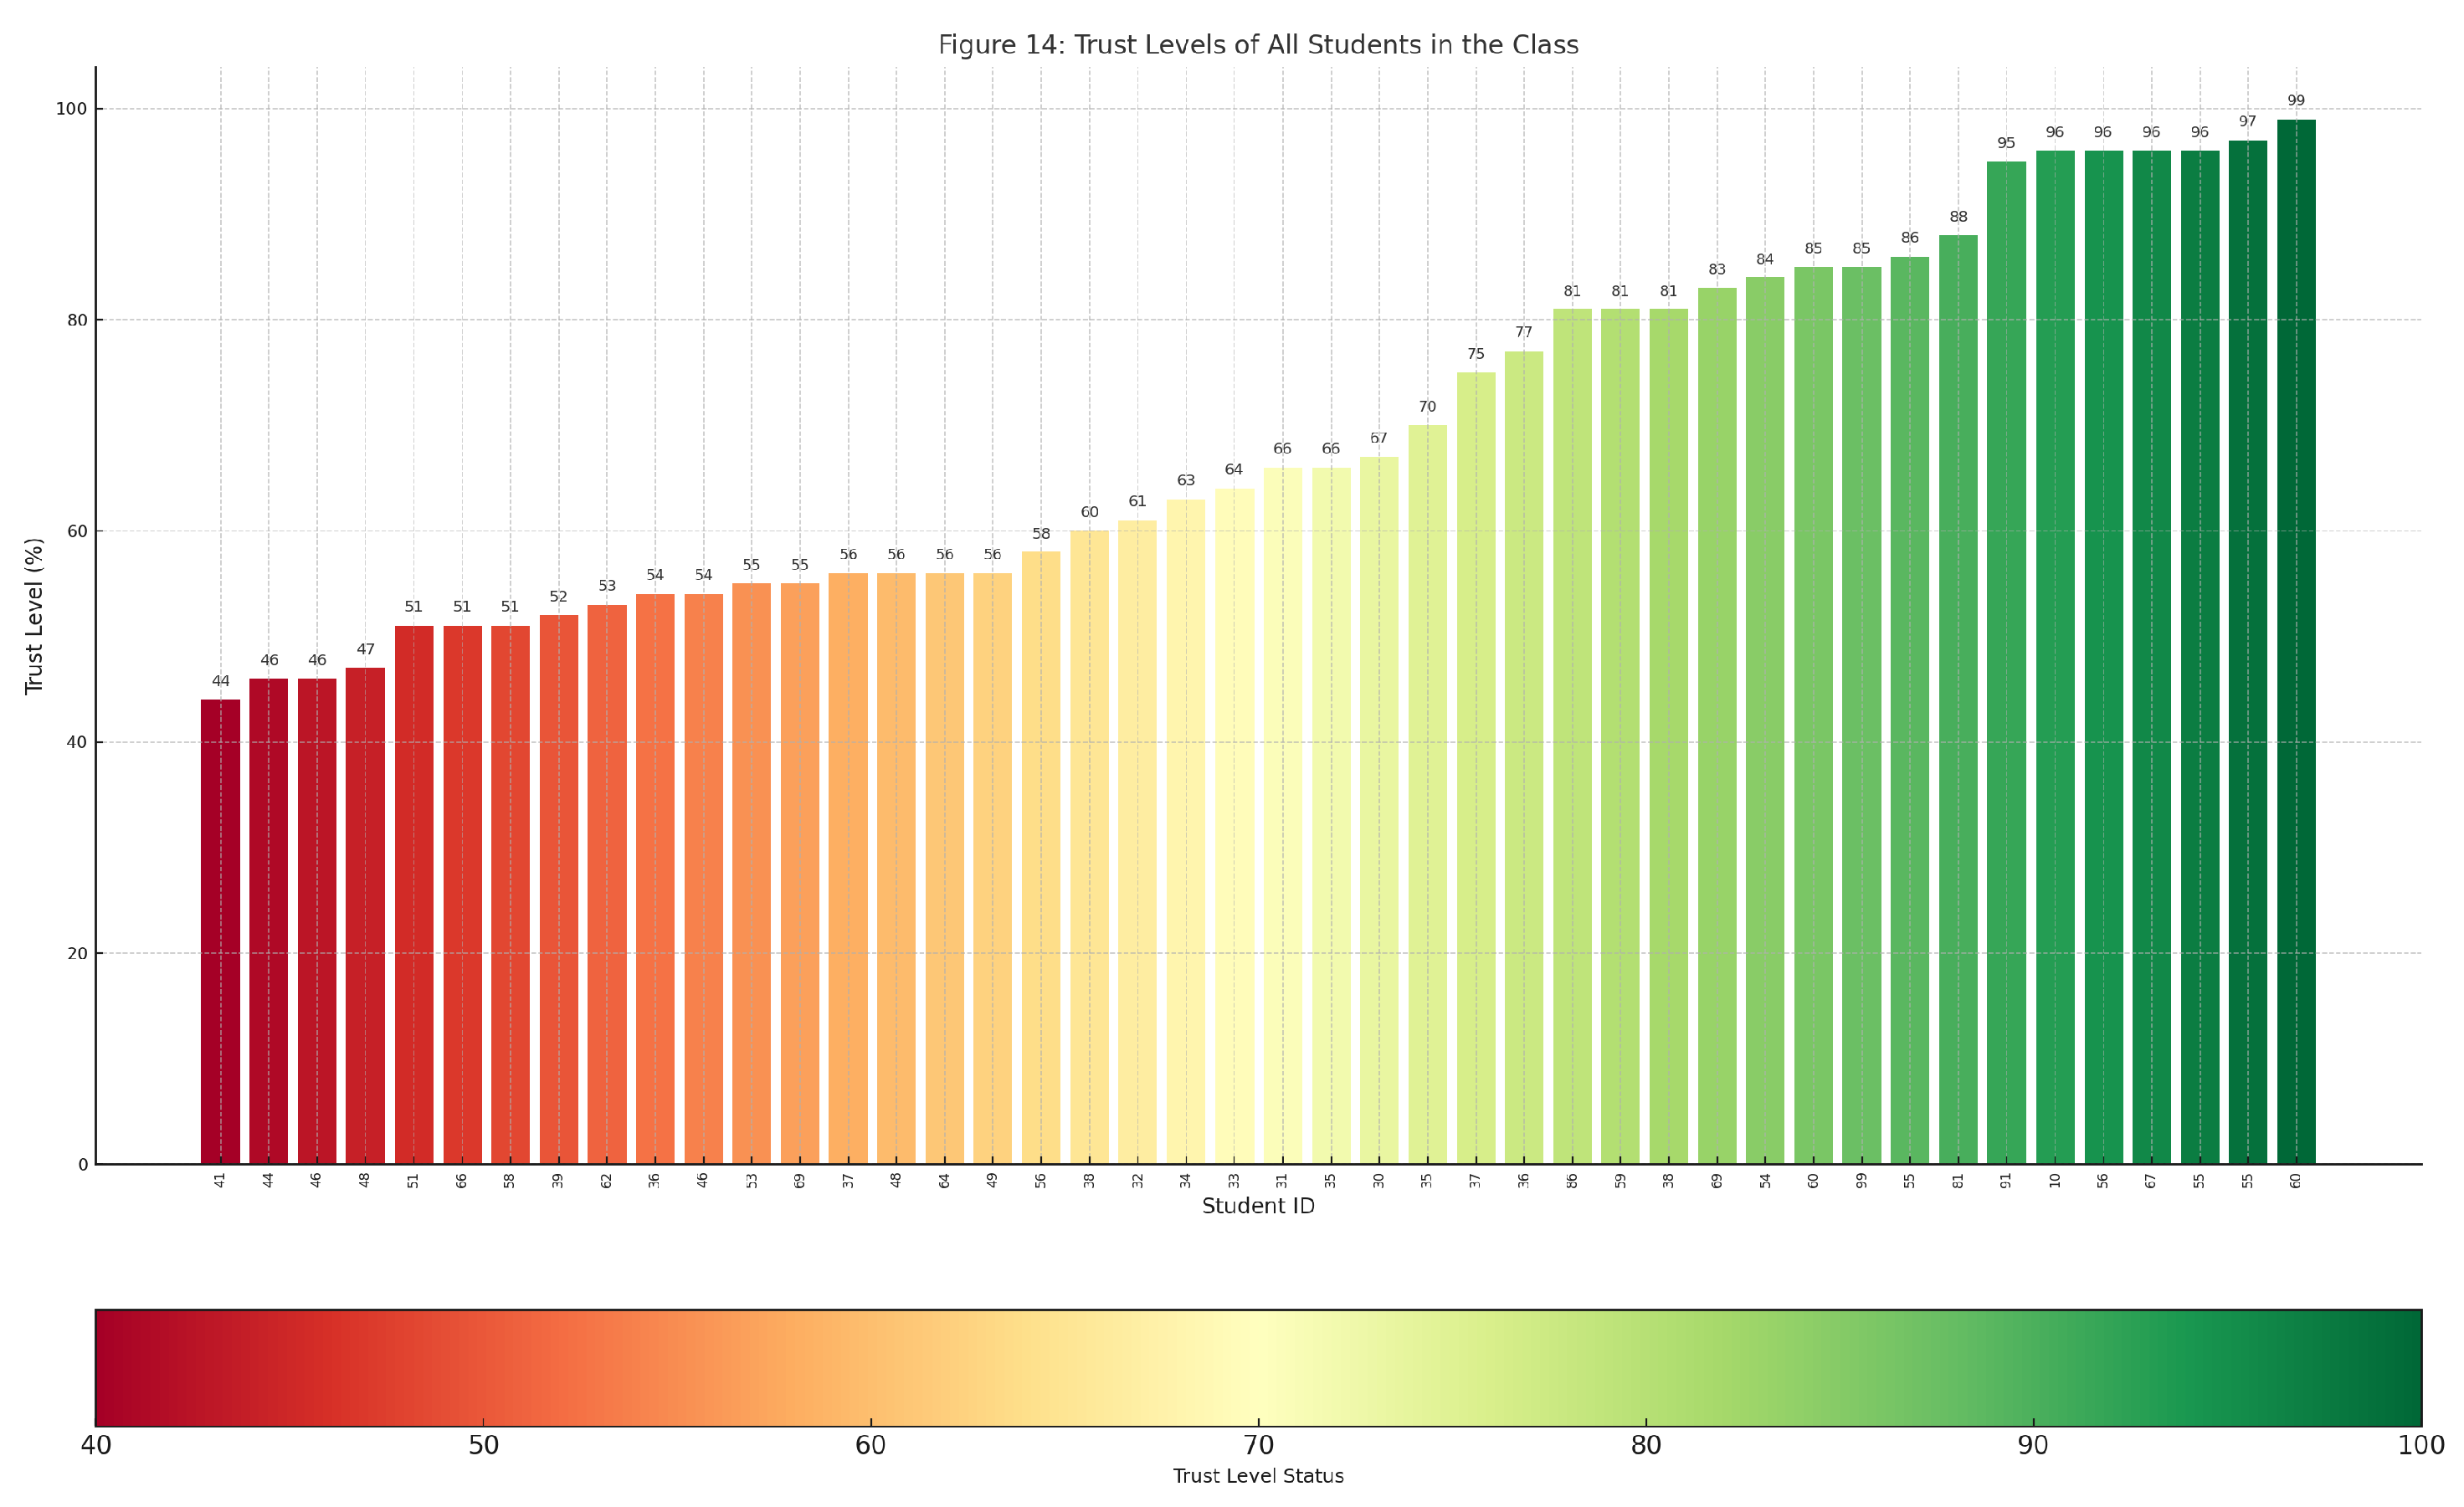
  • Interactive bar chart, with each bar resembling a student’s level of trust. The bar chart is color-coded using a red-to-green gradient, where the red color represents the lowest level of trust. Hovering over a student’s bar shows more details regarding that student and their anomalies.
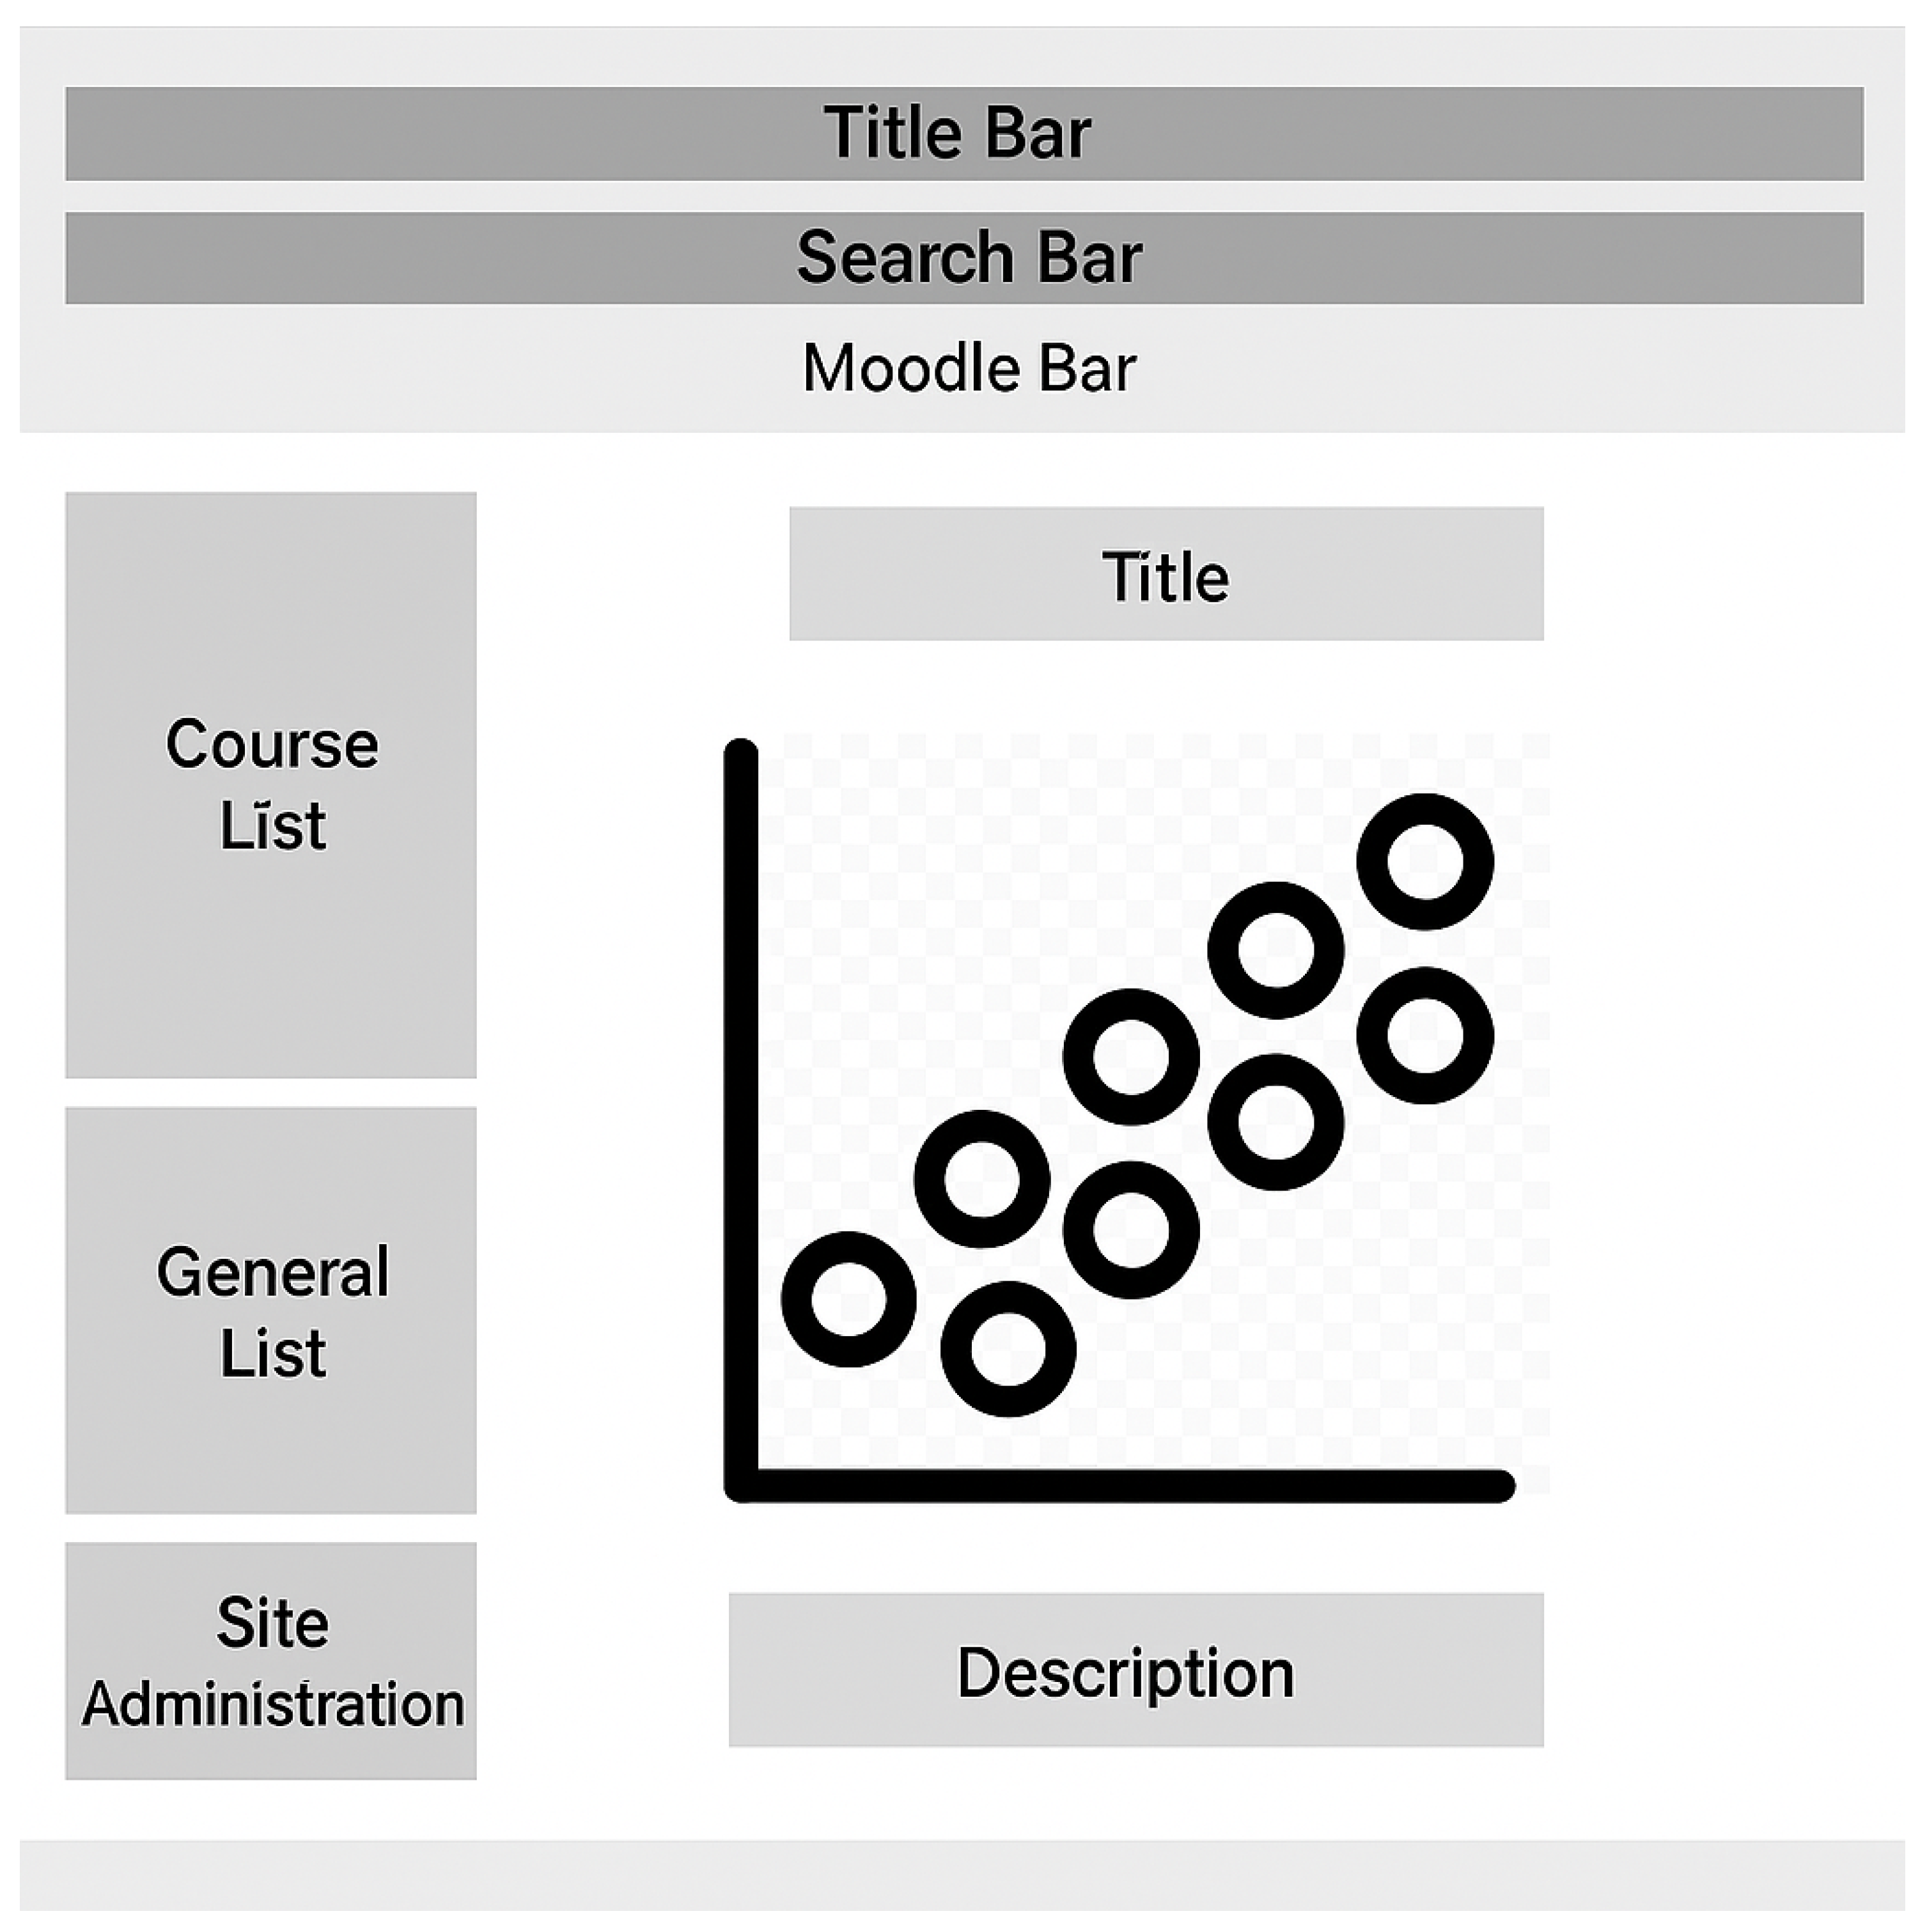
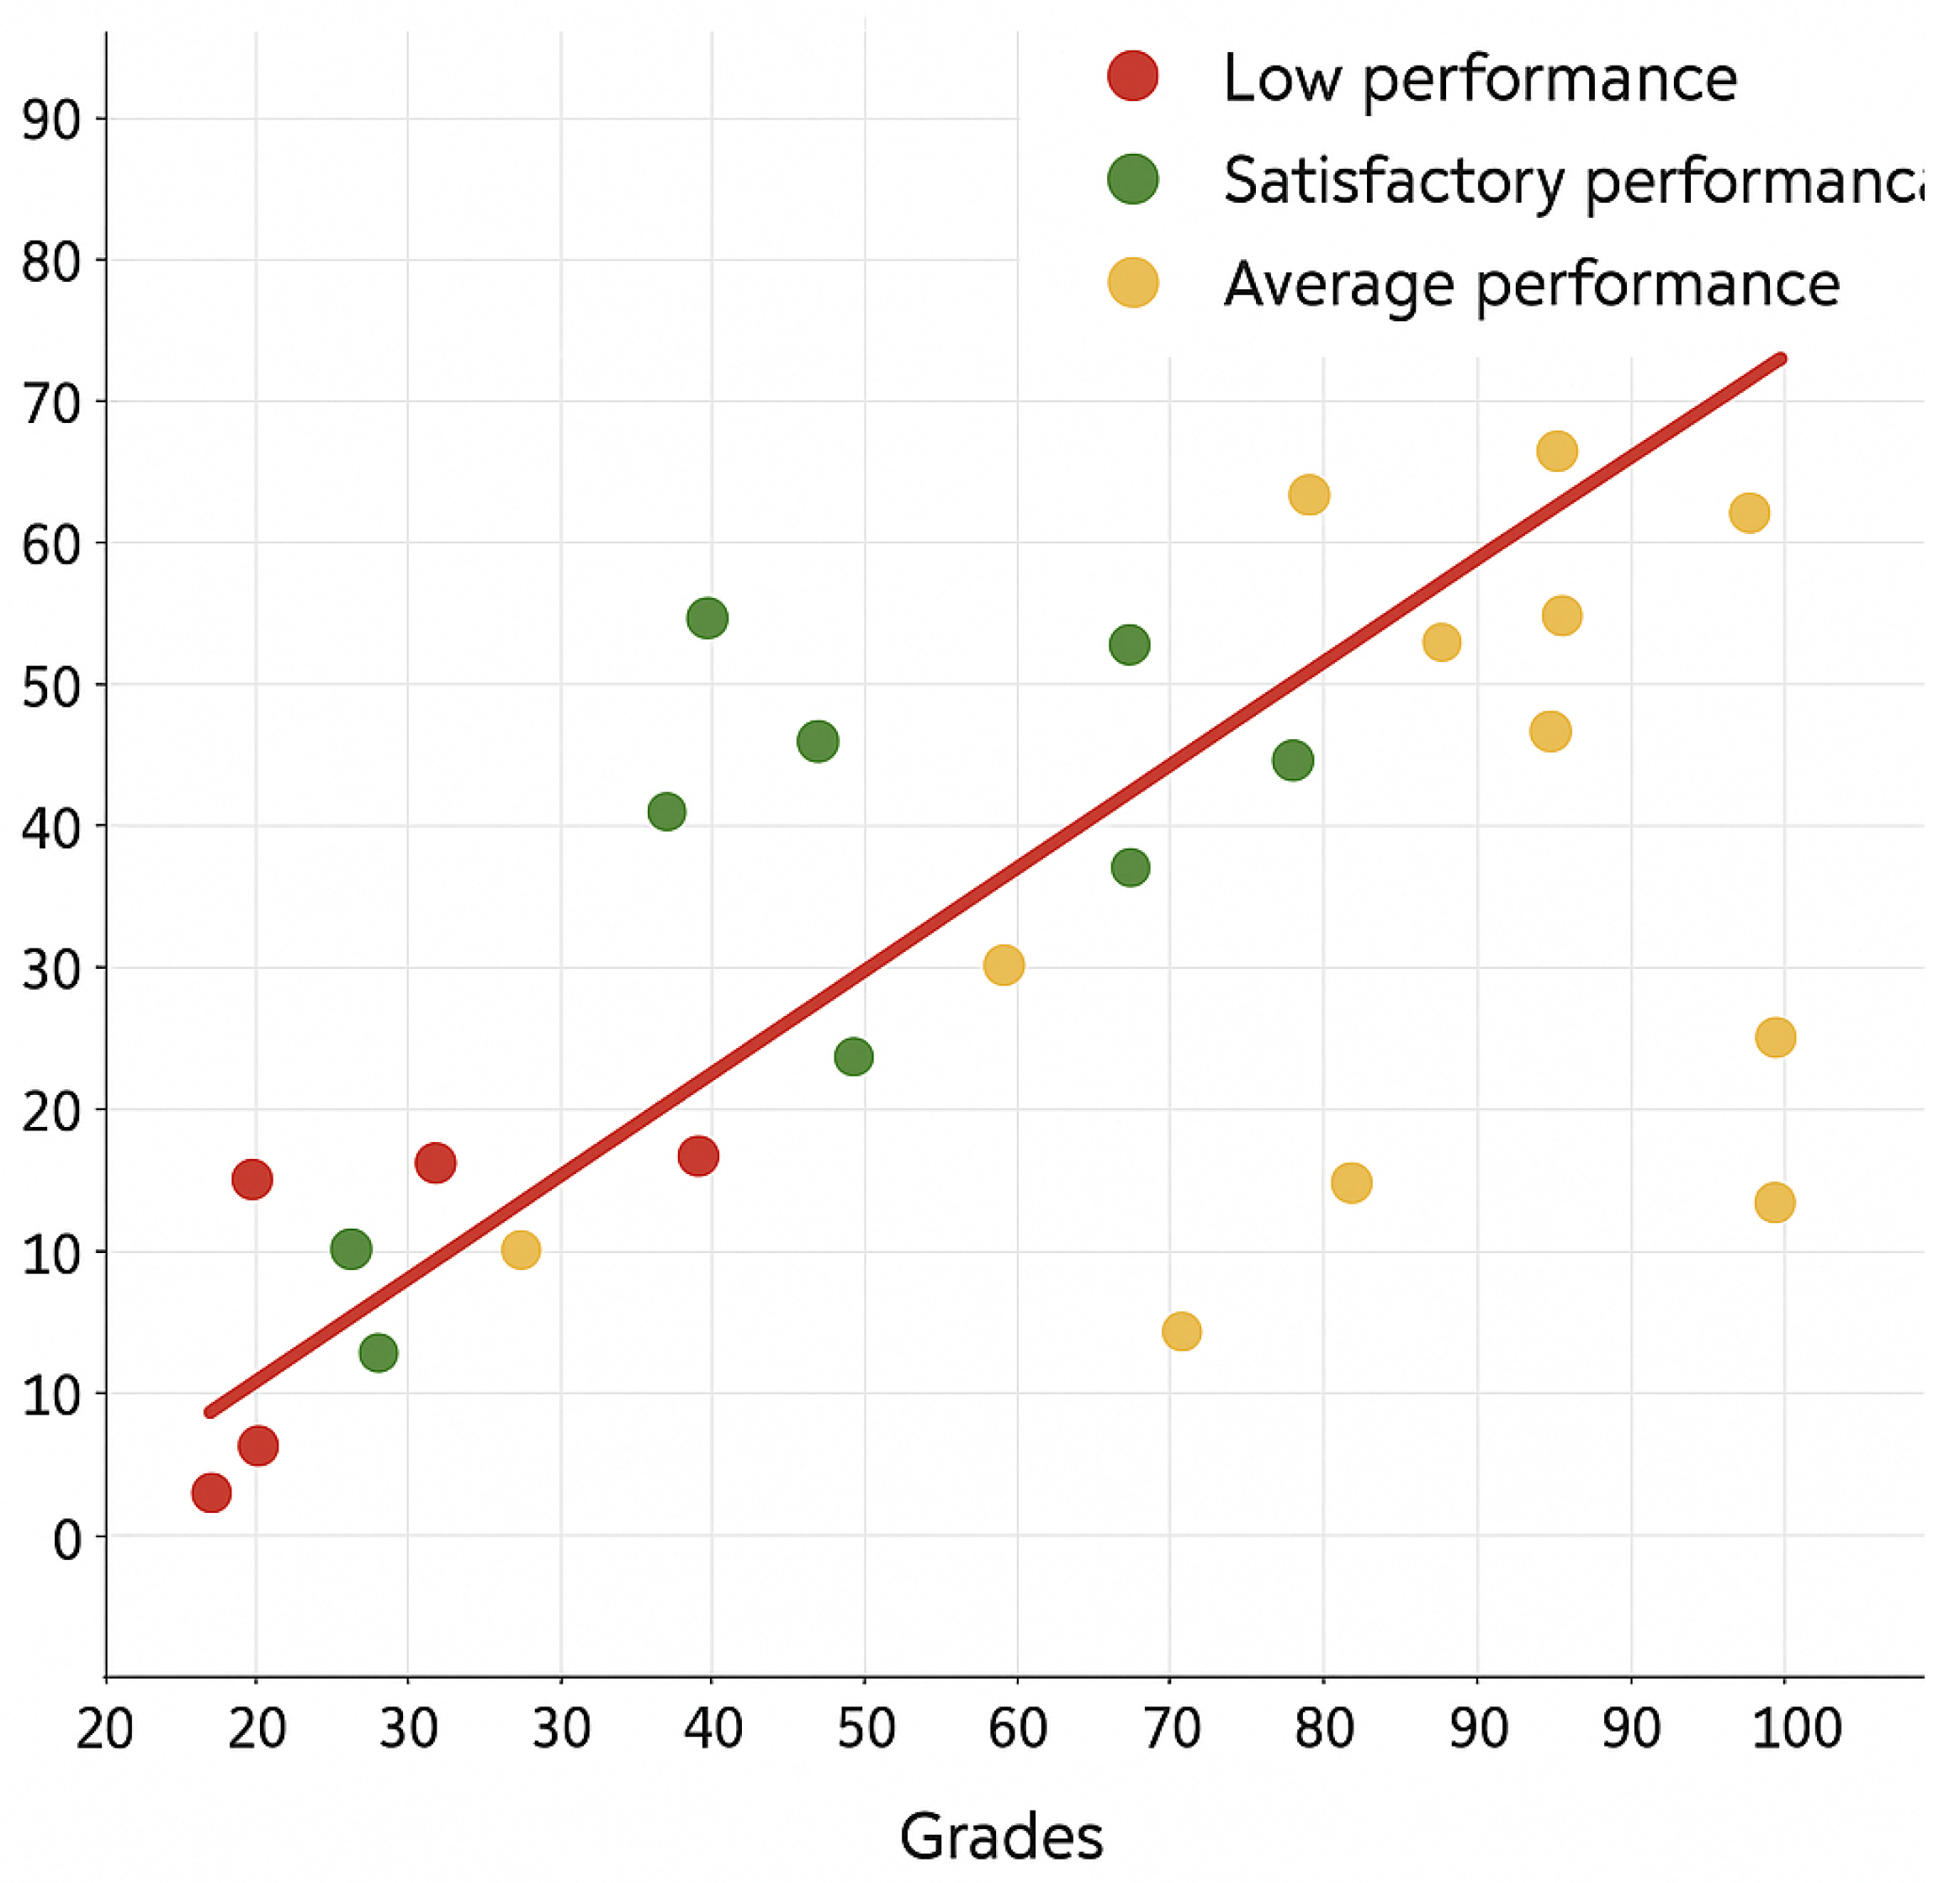
  • Scatter plot that demonstrates the regression analysis results of the grades and logs of all students in the quiz. Each dot in the scatter plot represents a student. The x-axis is the number of activities and logs, and the y-axis is the grade from 0 to 100%. Figure 7 demonstrates the wireframe of the scatter plot.
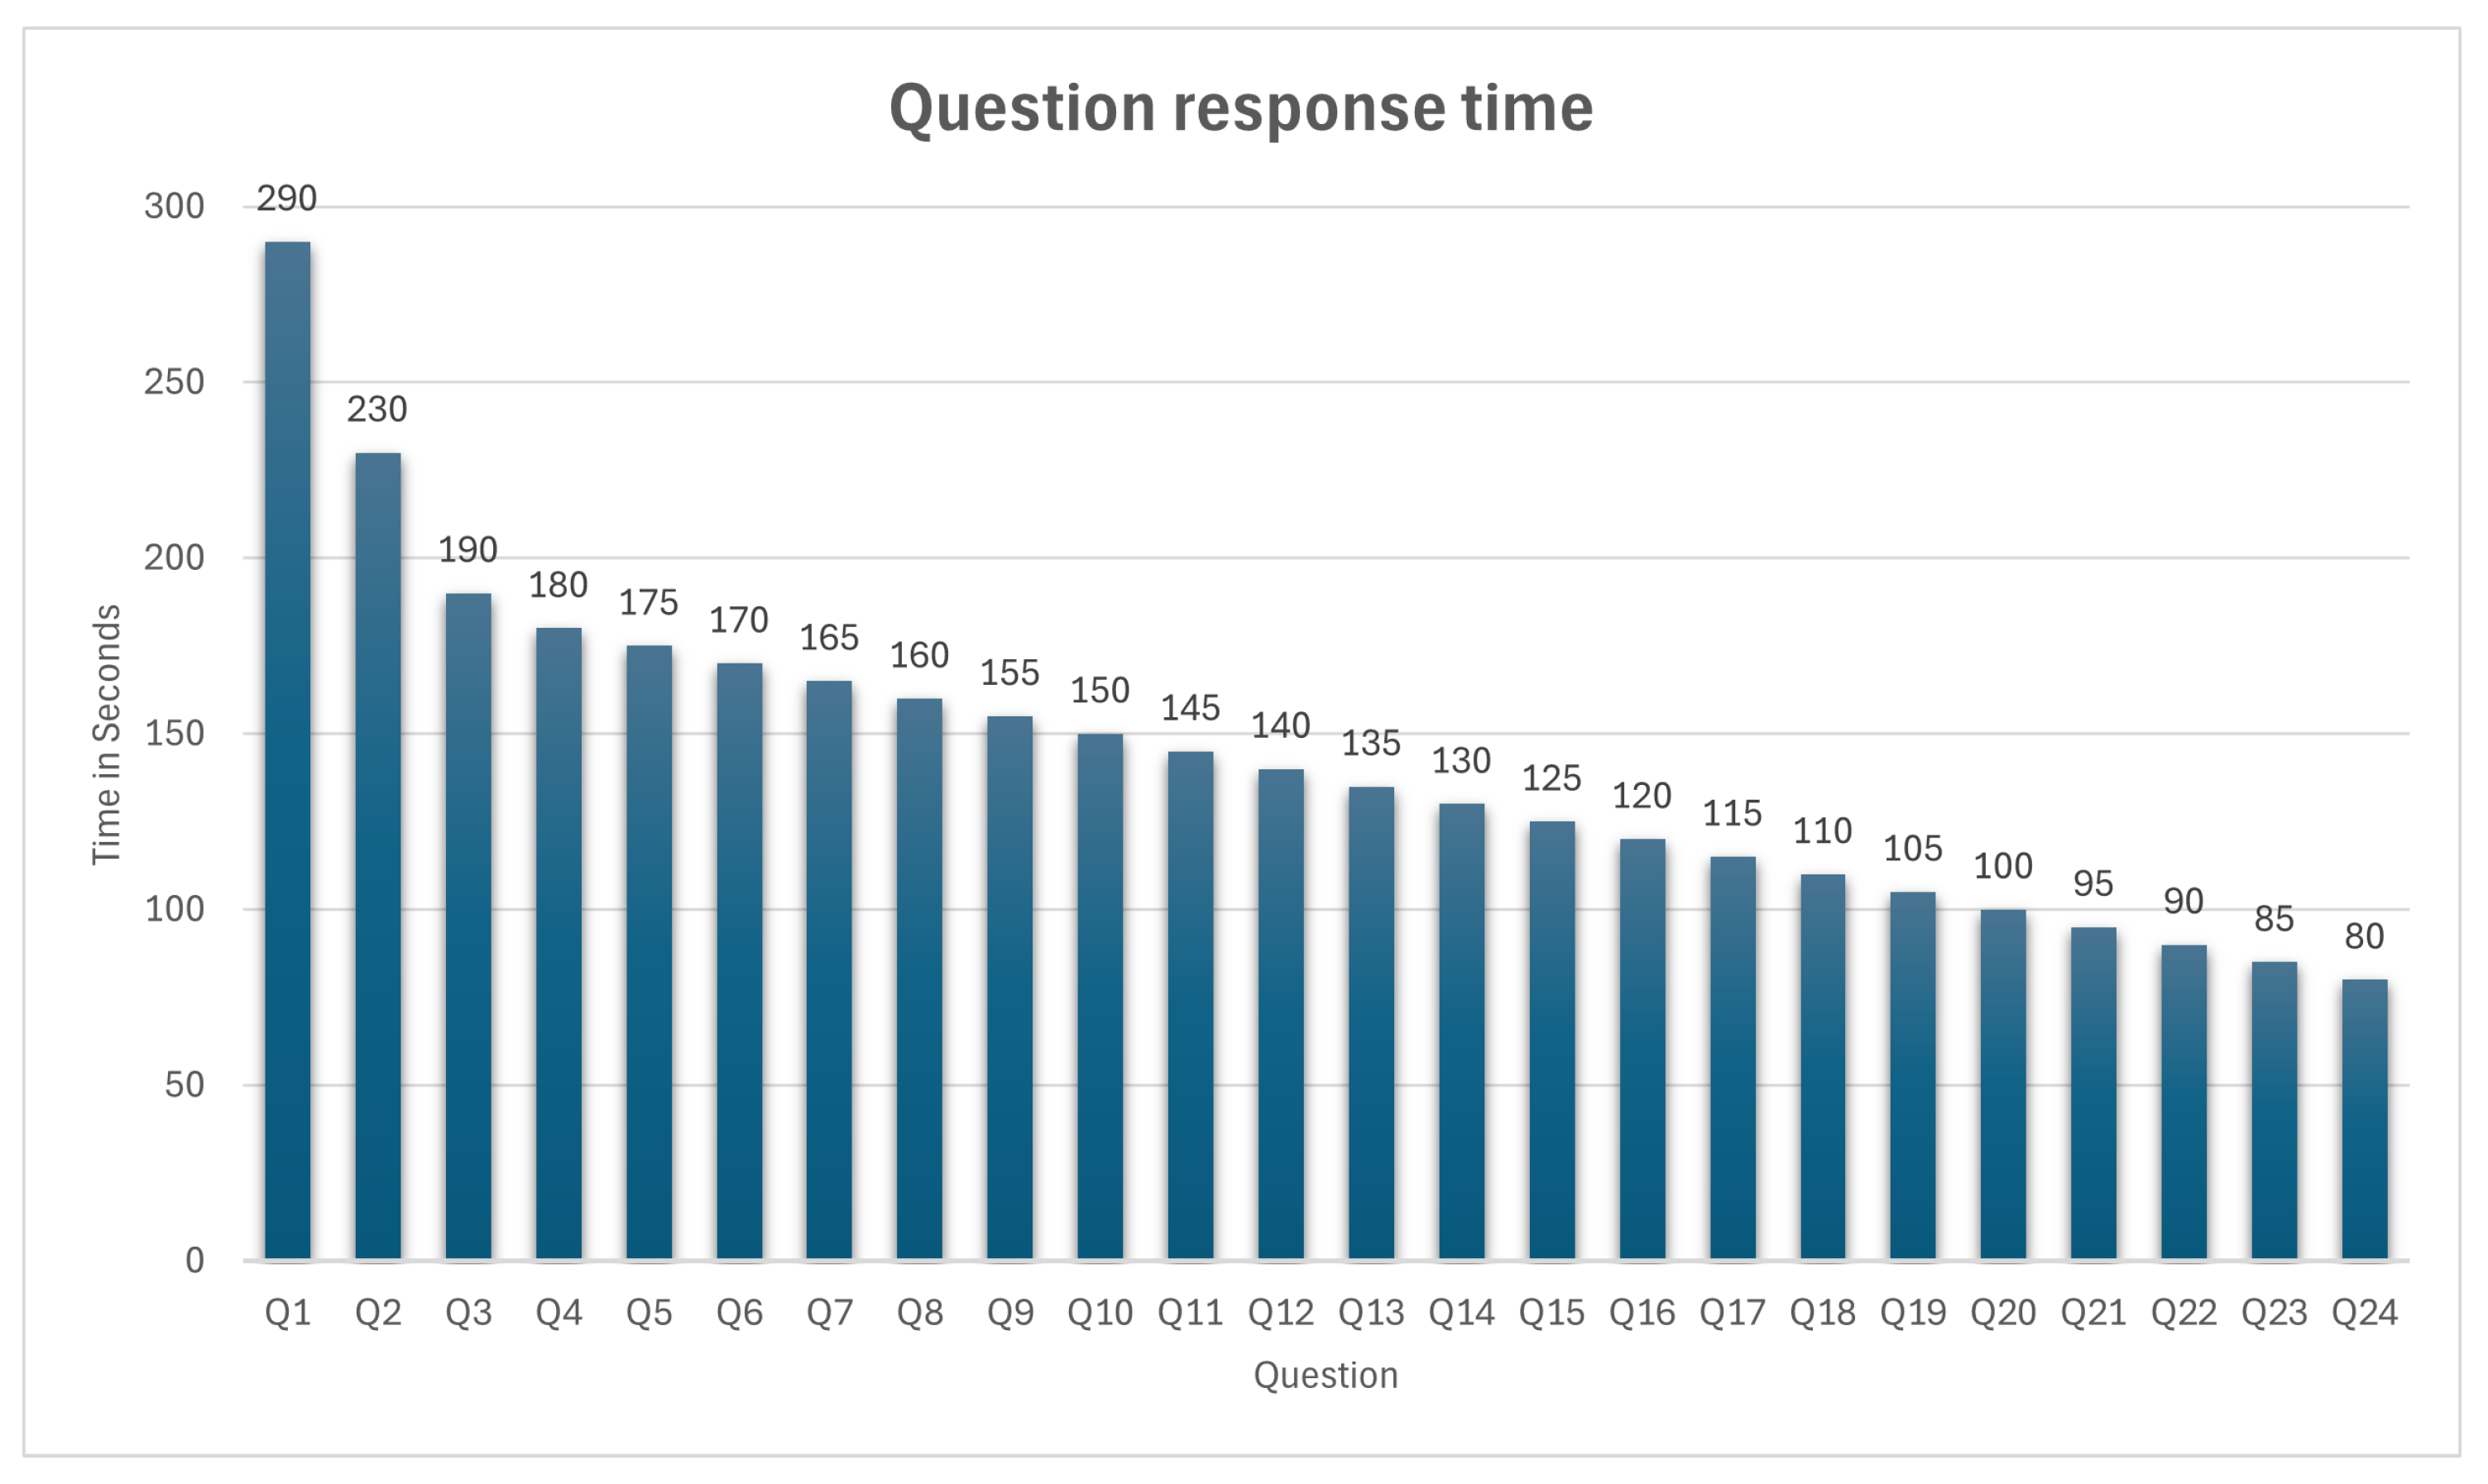
  • An interactive plot chart that demonstrates the average student’s response time for each question in the quiz.

5. Implementation

The academic dishonesty detection system was implemented as a Moodle quiz report using PHP, JavaScript, HTML, and CSS programming languages. The following subsections outline the system’s implementation details, using pseudocode and UML class diagrams.

5.1. Setup

After installing Moodle LMS on the Ubuntu 20.04 Linux virtual environment to host and run a local Moodle installation on an Apache local server, we followed the installation guide provided by the Moodle.org website [46].
Moodle quiz report plug-ins are installed in the quiz module directory in the Moodle root directory. All report plug-ins require a strict file hierarchy for installation using the Moodle plug-in interface.
The file hierarchy includes the following important files:
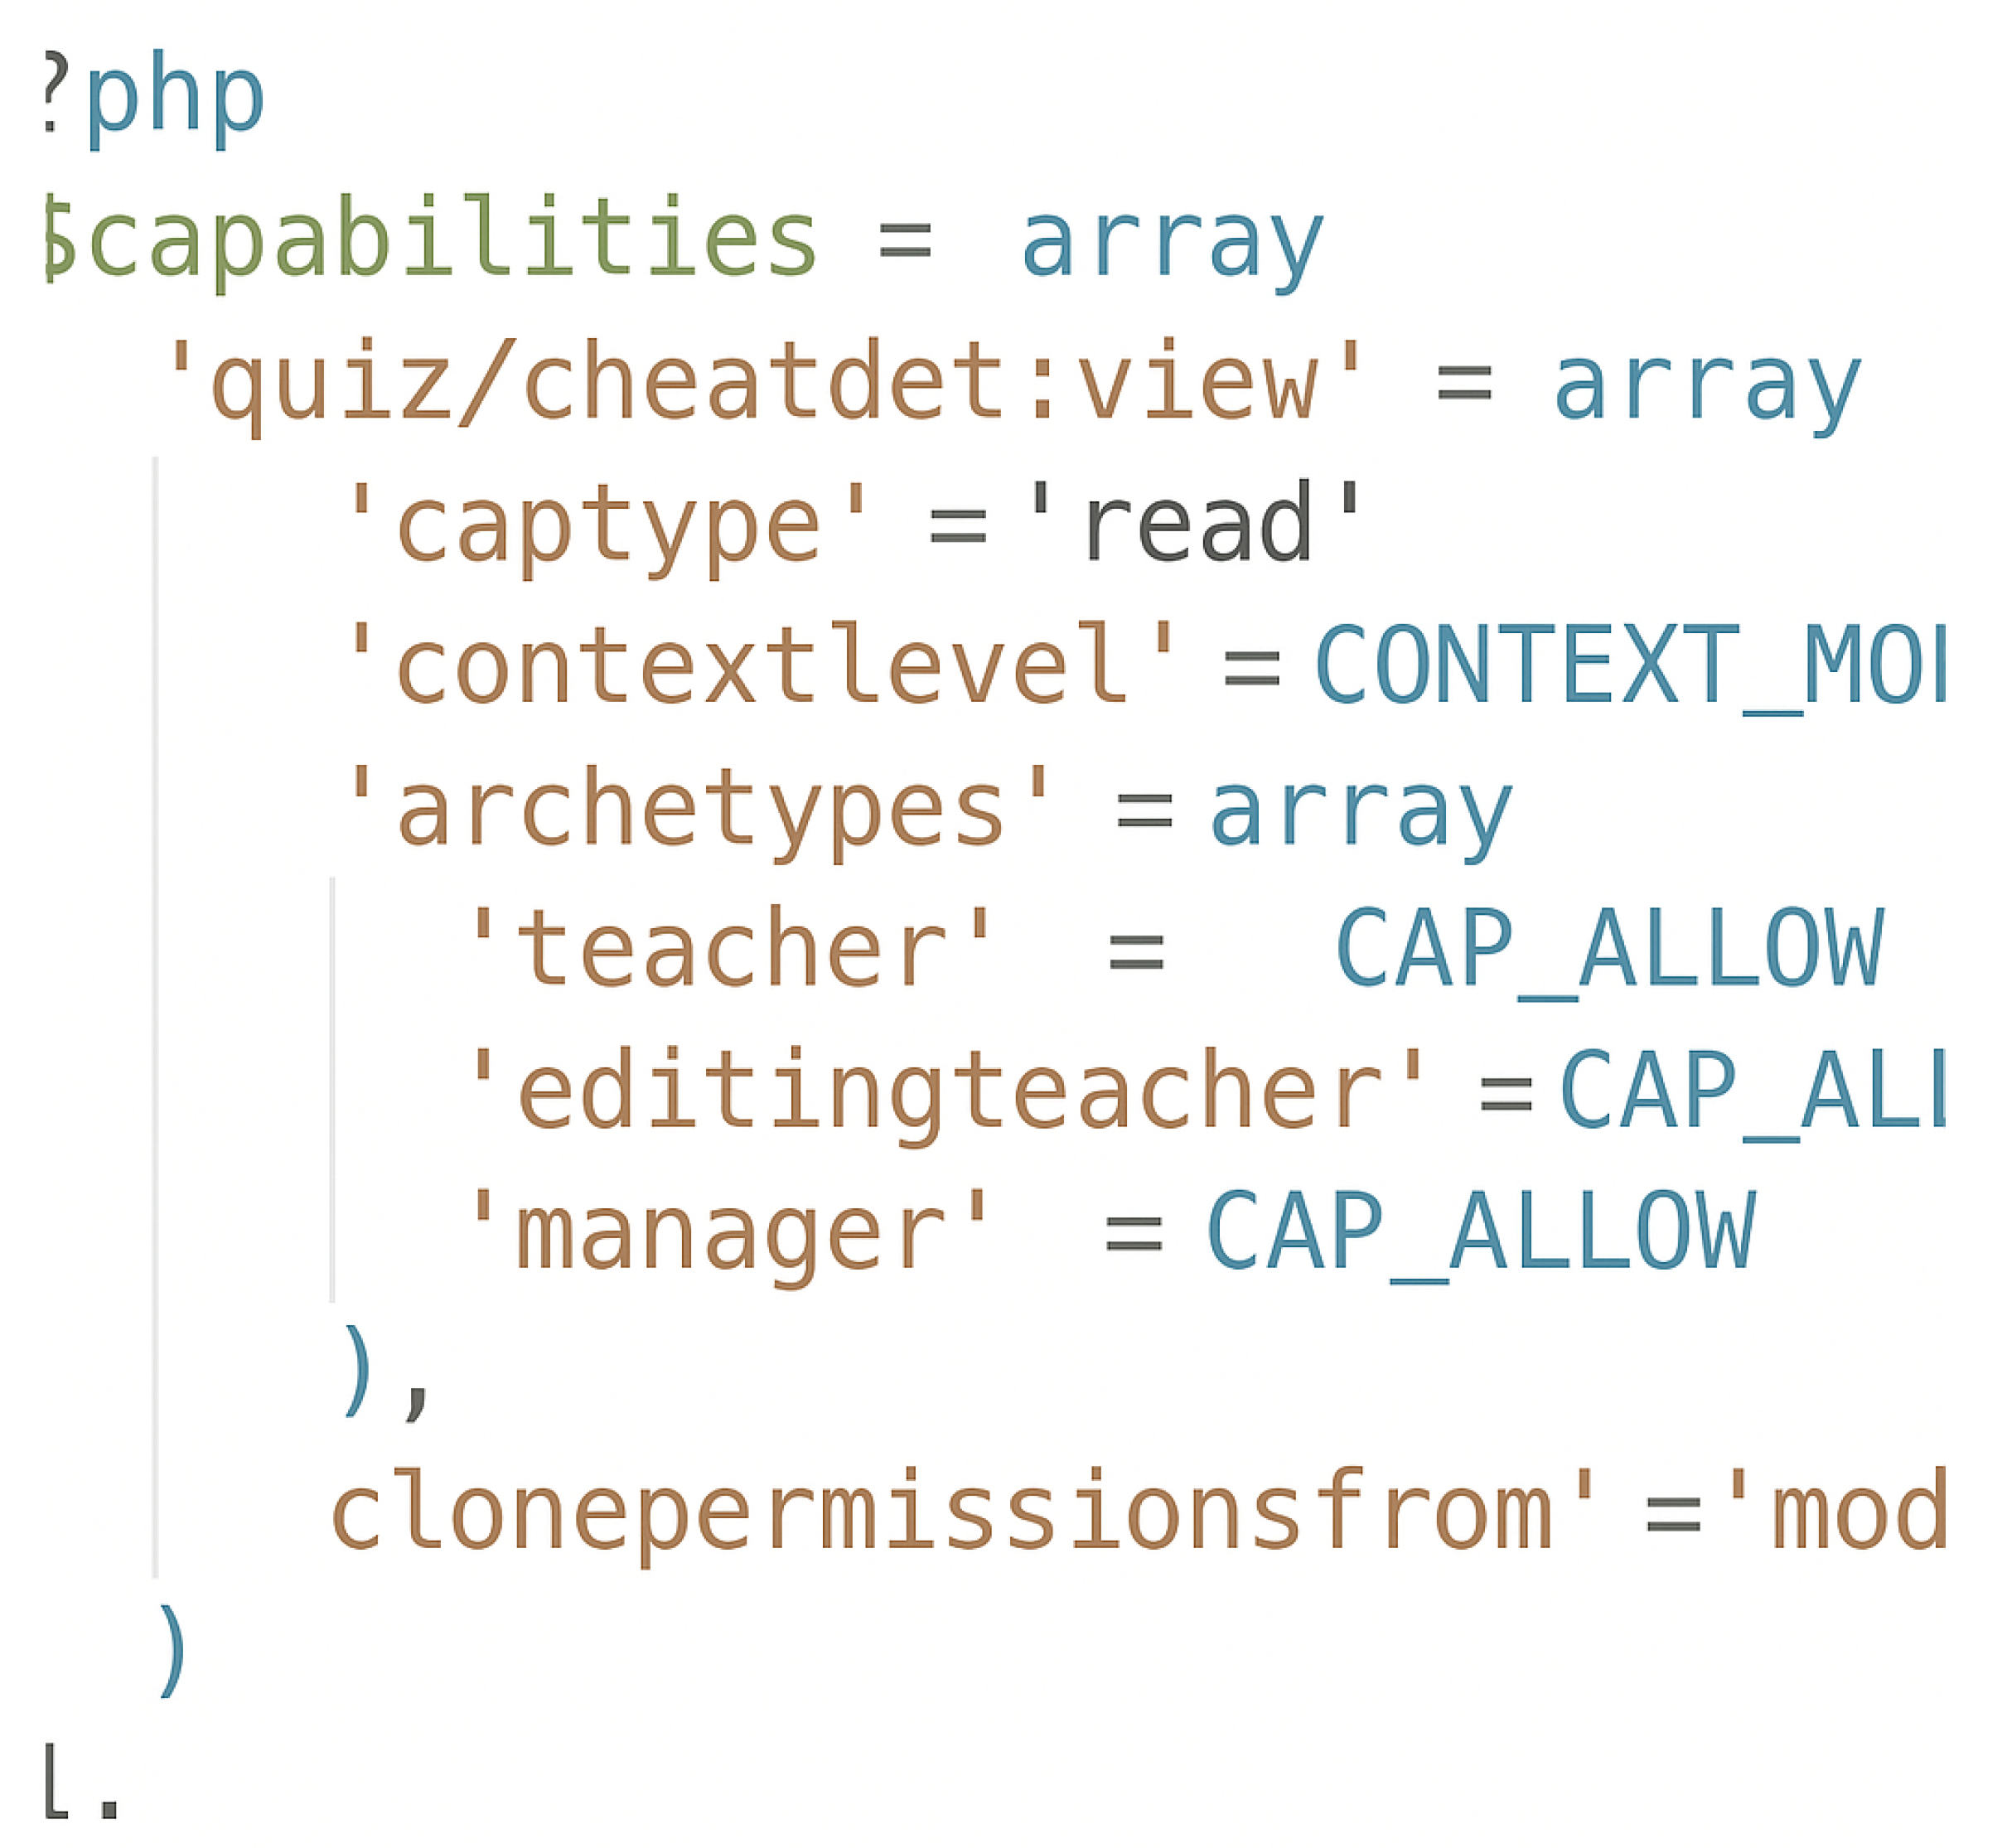
  • db/access.php script: contains the necessary report access control settings for each Moodle user role. After the plug-in installation, the Moodle core access API retrieves the capability database and verifies access permissions for any user attempting to view the report.
    Our plug-in is a quiz report designed for instructors. Hence, it has access capabilities for the roles of ‘editing teacher’, ‘course teacher’, and ‘admin’. It denies access to the ‘student role’. This is achieved using the following code snippet in Figure 8.
  • cheatdet/locallib: contains utility functions that are frequently used. This includes functions to set up database queries and retrieve their results as associative arrays or lists. Other functions are used to convert the output of an algorithm into data tables and charts using a dedicated JavaScript module.
  • cheatdet/report.php script: The main script is in the plug-in. It displays the report page and sets up the quiz and course data. It includes the implementation of the class quiz_default_class, which is responsible for setting up the user session and the Moodle page footer. The script also retrieves the necessary data for analysis and passes them to the respective methods and classes. The analysis results are then passed to the JavaScript modules to render them properly.

5.2. Algorithms’ Implementation

The system uses several algorithms to detect cheating and collusion. These algorithms were implemented as classes and included in the Moodle class directory. We discuss the implementation details of these algorithms in the following subsections.

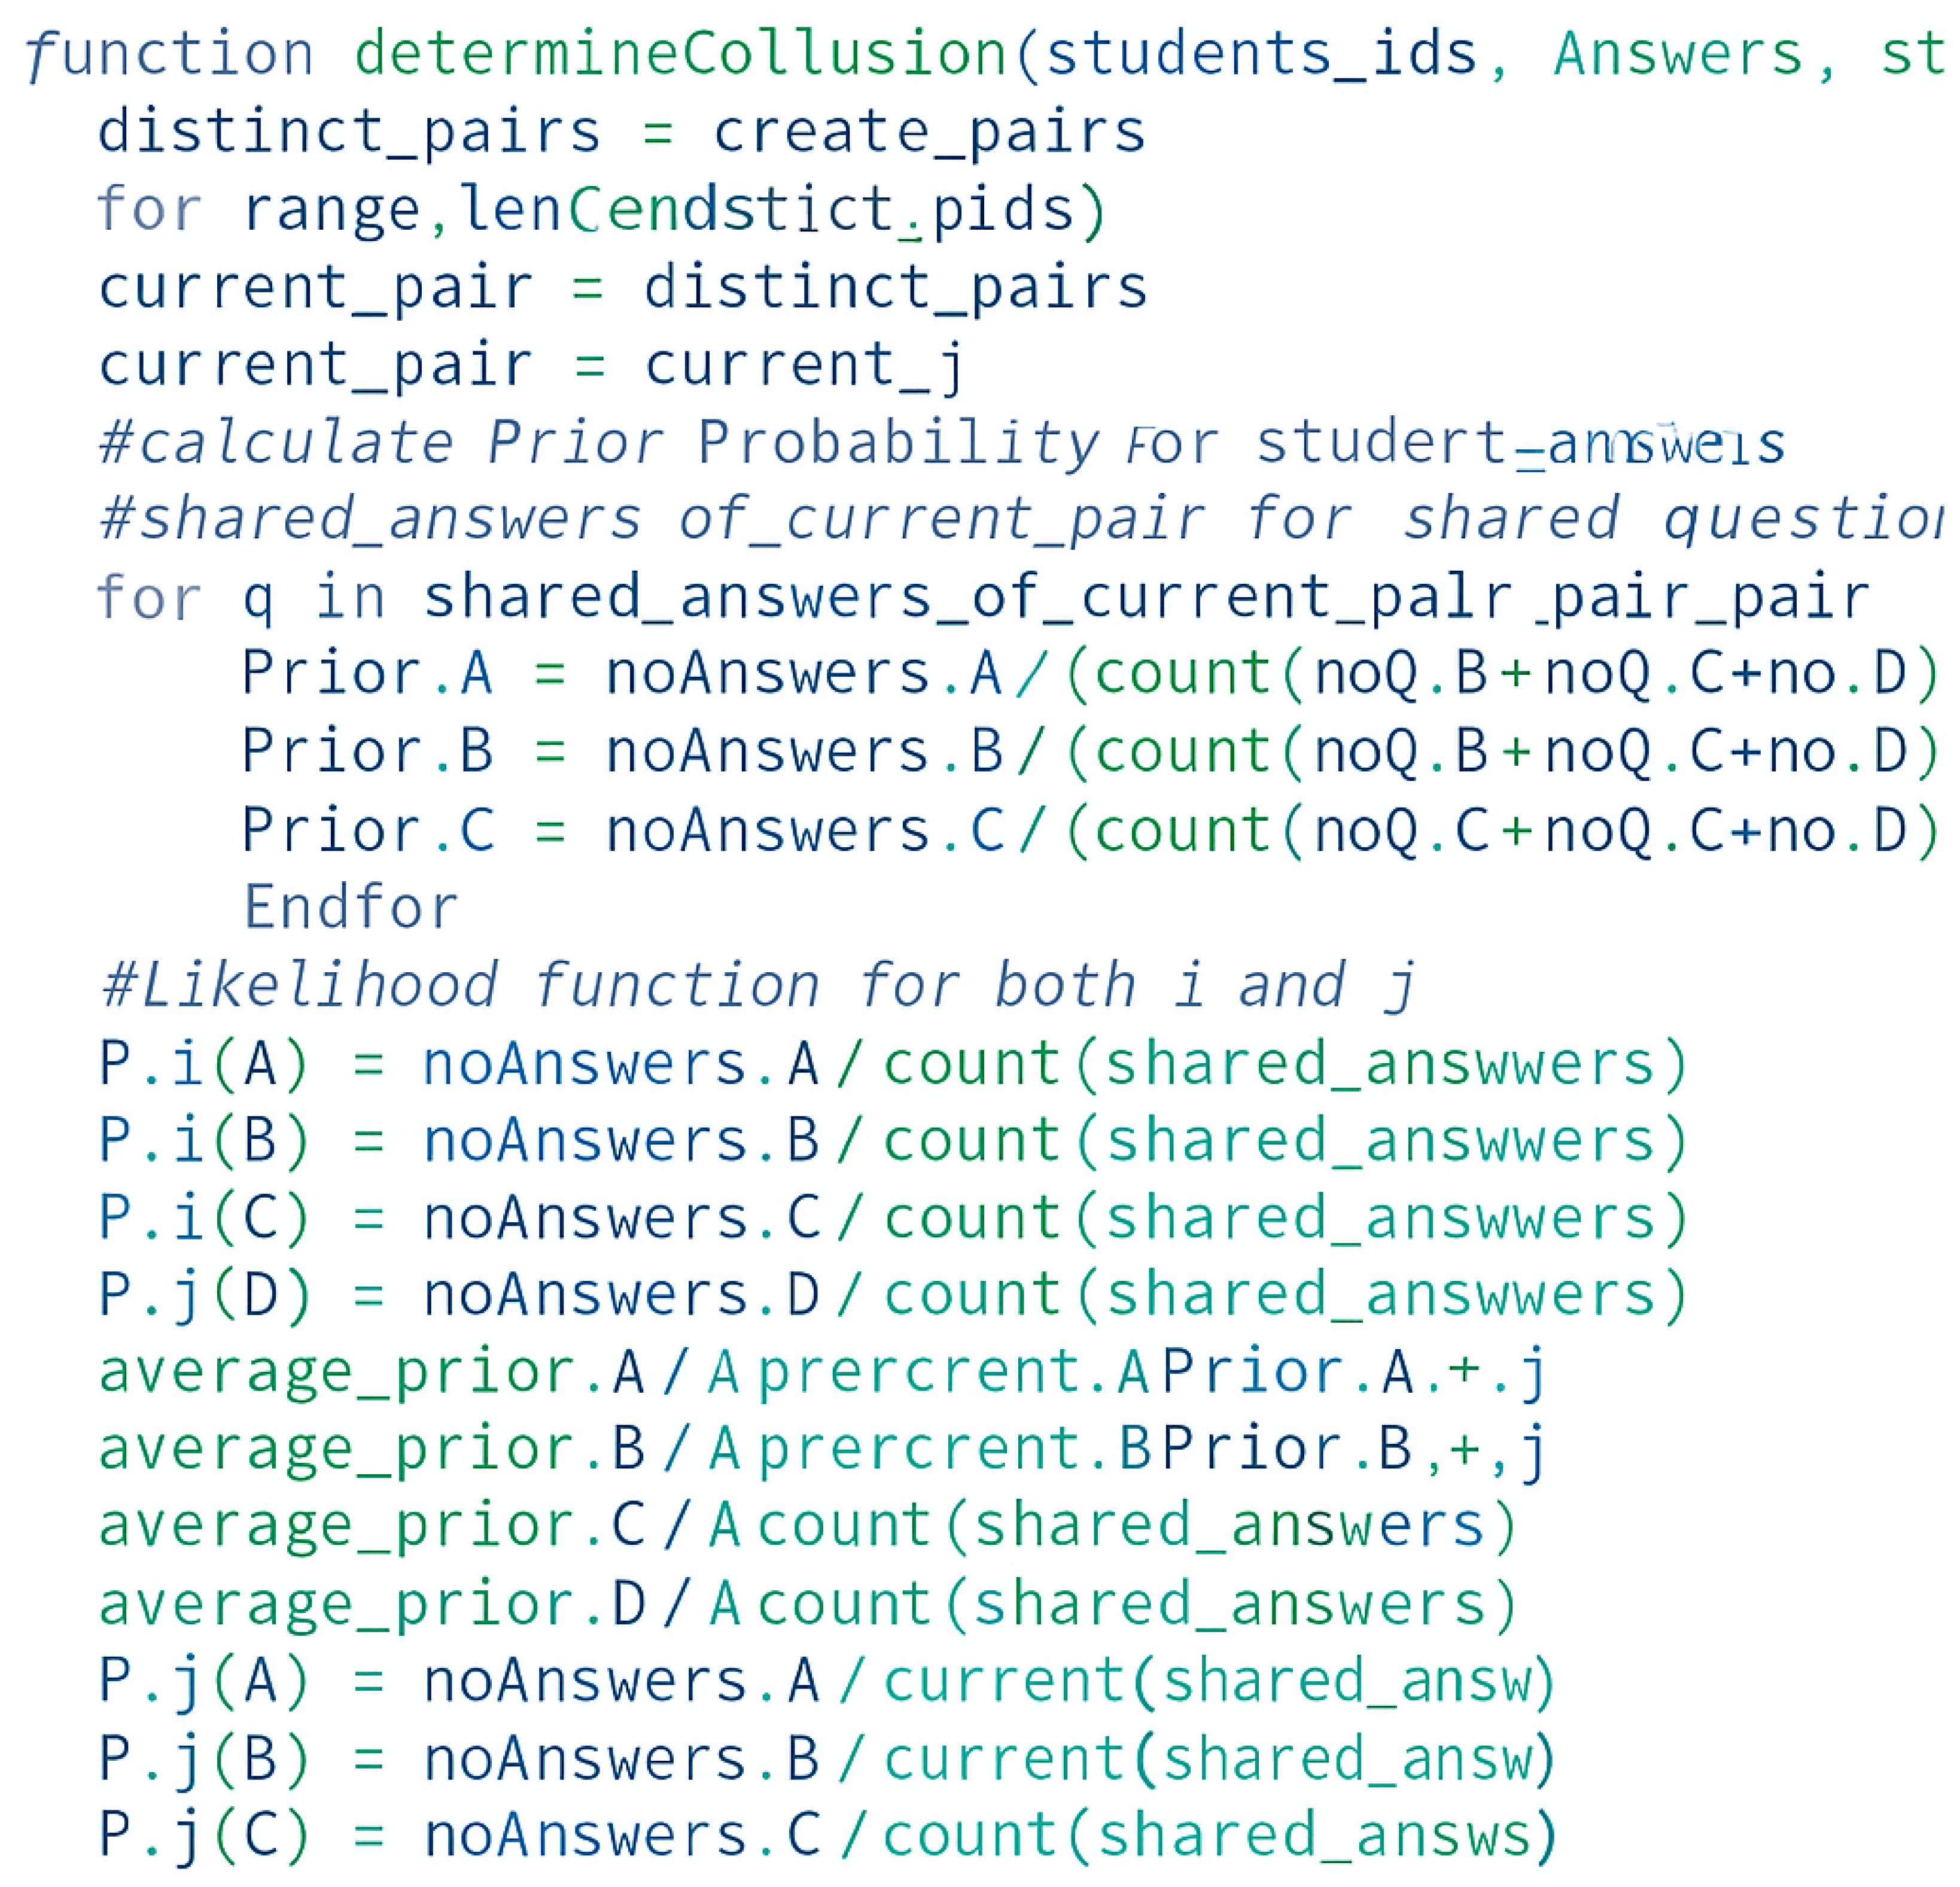
5.2.1. Collusion Detection Algorithm

The algorithm was implemented in the class cheatdet_stats.php. The report.php class first instantiates an object of type cheatdet_stats and initializes it using the class constructor with parameters Logs and Grades. Logs is an array indexed by the students’ IDs, containing their log and activity data, as well as the count. Grades is an array indexed by students’ IDs, containing their quiz grades as percentages. After initialization, the object is used to call the method cheatdet_stats_detect_collusion, which creates distinct pairs of students and runs the algorithm discussed in 1.
The collusion detection in the multiple-choice examinations method returns the S i j values of all distinct pairs in an associative array. It demotes the trust level for each pair with a high S i j value. This process is illustrated in the pseudocode and corresponding trust breakdown visualization as shown in Figure 9, Figure 10 and Figure 11).

5.2.2. Regression Analysis of Activities and Logs

This algorithm was implemented in the class cheatdet_stats.php. The report.php class first instantiates an object of type cheatdet_stats and initializes it using the class constructor with parameters Logs and Grades.
The log is an array indexed by the students’ IDs, containing their logs, activity data, and counts. Students’ IDs index grades and contain their quiz grades as a percentage. After initialization, the method PearsonCorrelation takes students’ grades and their course logs and activity amounts as class properties and returns an r-value. If r ≥ 0.3, it is passed to the regression analysis algorithm, and method RegressionAnalysis is invoked. This method takes the student’s grade array as the dependent variable and the student’s log array as the independent variable. As discussed in 2, the method returns a regression line equation and the students’ IDs that do not fit the regression analysis. Those students are then flagged and receive a trusted penalty.

5.2.3. Spatial Information Analysis

The spatial algorithm is divided into two parts: part one detects students who use the same local network, and part two checks if a student’s IP address is not recognized in their historical spatial data.

5.2.4. Temporal Information Analysis

The anomaly detection process based on response times is handled as follows: First, the Mainreport class queries the database for each question answered on the quiz. These response times are exported as a two-dimensional array, where the first index corresponds to the question ID in the quiz and the second index corresponds to the student ID. Response time values are the server UNIX time when the question was answered. Second, the Stats_IQR method iterates over this two-dimensional array to determine the interquartile range for each question slot. Third, the results are passed to the Determine_outliers method to flag students with a timing anomaly, as per the IQR algorithm discussed previously.

5.3. Integration with Moodle

All statistical computations are performed within the Moodle Learning Management System through a custom-developed plug-in. The plug-in leverages Moodle’s built-in quiz report framework and event logging infrastructure, which allows it to operate passively without requiring additional configurations from students or third-party surveillance software.
The system uses Moodle APIs to access following:
  • Quiz attempts and question-level responses.
  • Timestamped logs of student interactions (e.g., clicks, submissions).
  • Network metadata, such as IP addresses and session origins.
  • Course-level engagement metrics (login frequency, assignment submissions, etc.).
This seamless integration allows instructors to generate trust scores and anomaly reports with minimal setup. The plug-in is accessed as a standard quiz report, indicating that educators can activate it on demand for any Moodle-based quiz or exam without compromising the platform’s usability or requiring separate data export.

6. Report Generation

To convey the analysis results, we used visual charts created with the D3JS JavaScript library and HTML data tables. The following subsections discuss the output of our system.

6.1. Data Table

The plug-in renders the first element, an HTML data table with interactive features such as sorting, searching, scrolling, etc. We implemented that using a JavaScript library called DataTables.JS, which adds jQuery functionality to HTML tables.
Figure 12 demonstrates the HTML data table. The first column, ‘Student ID’, lists the IDs of the students who attempted the quiz under analysis. Column two lists the students’ names, while column three indicates the IP address from which they attempted the quiz. The column ‘country’ suggests the student’s country of origin from which they attempted the quiz. The ‘Anomalies’ column is the number of anomalies each student committed based on the analysis. The ‘Grade’ column contains each student’s grades achieved in the quiz as a percentage. The last column includes each student’s level of trust, computed by the system’s algorithms discussed earlier.

6.2. Trust-Level Distribution Using Pie Chart

As depicted in Figure 13, we utilized a pie chart to present the distribution of trust levels within the class. All class members are categorized depending on their trust levels into five categories: category one contains students who scored a trust level of 100%, category two contains students who scored a trust level between 99% and 80%, category three includes students who scored a trust level between 79% and 60%, category four contains students who scored a trust level between 59% and 40%, and category five contains students who scored a trust level below 40. Each slice of the pie is labeled with the ratio of students belonging to a given category.

6.3. Trust Levels Using Interactive Bar Chart

The bar chart in Figure 14 illustrates the trust levels of the entire class, sorted in ascending order and color-coded based on a gradient from red to green, where green represents the highest value. Each bar represents one student; the y-axis is the zero to one hundred percent trust level.
Hovering over individual bars will display a tooltip containing additional information about that student. This information includes the student’s name as a hyperlink to their report, along with a numerical breakdown of anomalies and the individual effects on the trust level. Zoom in/out of the chart, and scrolling options are provided through the chart sub-bar.

6.4. Regression Analysis Results Using Scatter Plot

Figure 15 shows a scatter plot demonstrating the relationship, or lack thereof, between the students’ grades and their logs and online activities, along with a regression line demonstrating the correlation and its direction; the x-axis represents the quiz grade from zero to one hundred percent, and the y-axis represents the logs and activities within the course. Each dot on the plot represents a student; a red-colored dot represents a student with a trust level less than 40%, a yellow dot represents a student with a trust level between 40% and 70%, and a green dot represents a student with a trust level between 70% and 100%. Hovering over a dot will provide further information regarding the respective student.

6.5. Timing Bar Chart

The timing bar chart shown in Figure 16 demonstrates the average time taken by all students who attempted to answer each question in the quiz. Students who did not answer a question are excluded from the average calculation for that specific question.
The x-axis displays the quiz questions by their IDs and is sorted in descending order based on their average answer time. The y-axis presents response time in seconds. Each bar in the chart represents one question in the quiz. Hovering over a question’s bar shows its exact average time in seconds. The mini chart below allows users to scroll, zoom in, and filter certain questions.

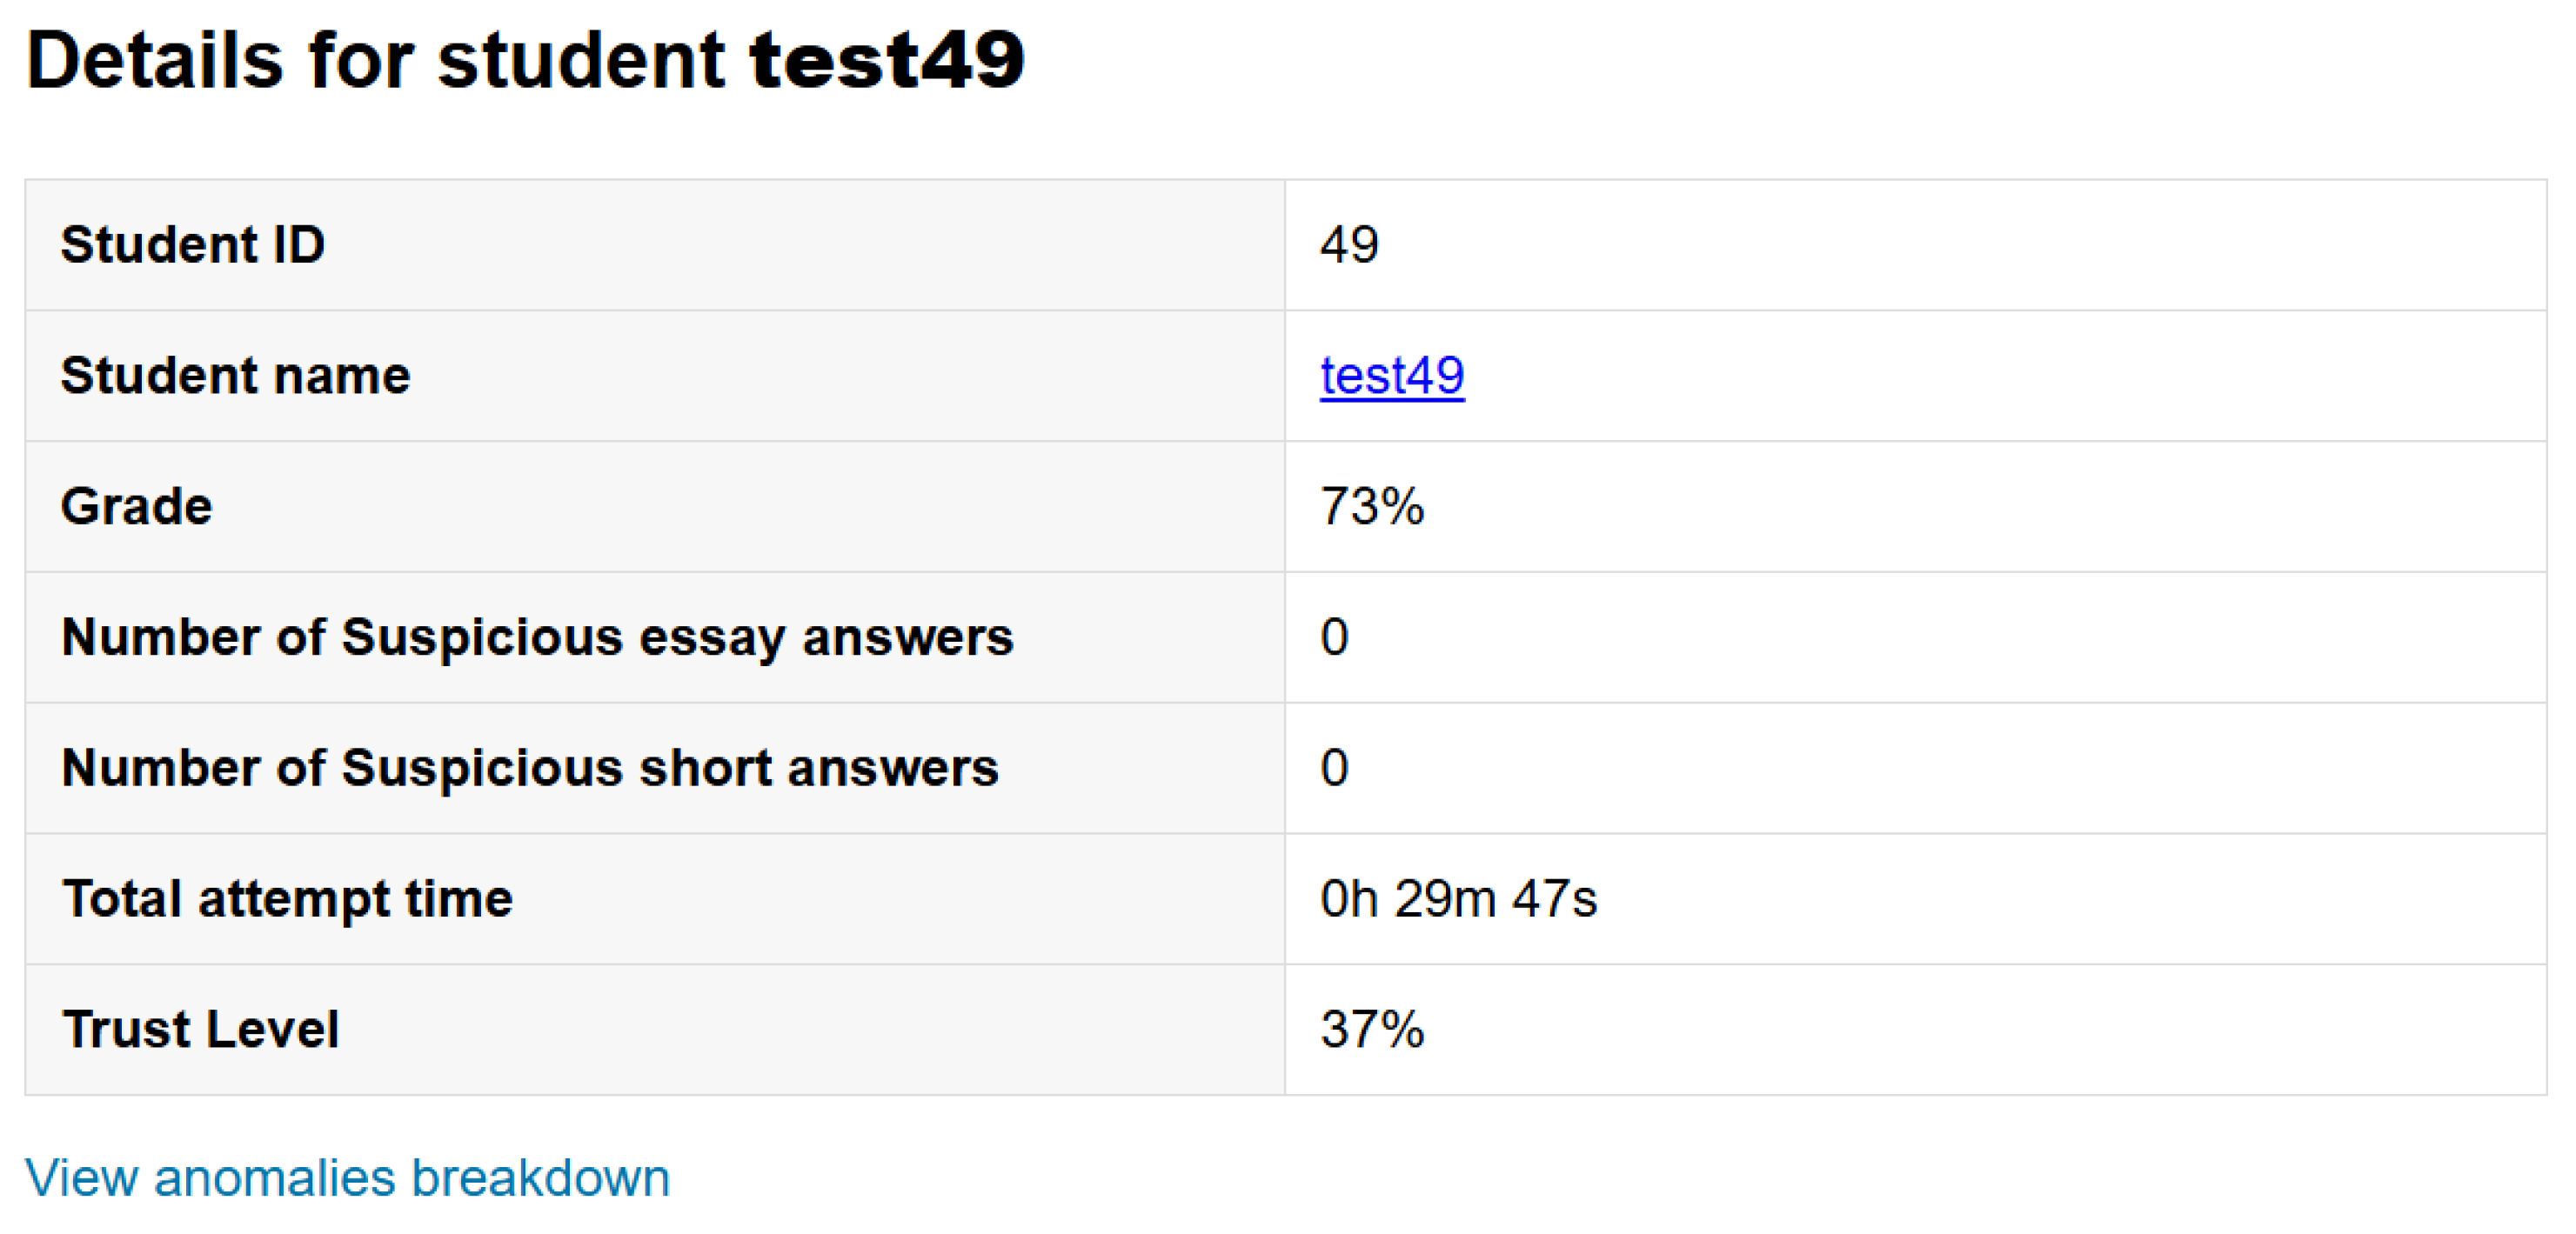
6.6. Student Personal Report Page

Upon clicking on a student’s name on the HTML data table, the instructor will be redirected to a second page of the report about the selected student. This page presents information about the student, including their exam attempts, anomalies, and the impact of each anomaly on their trust level. Each personal report includes an HTML data table, with each row containing information about the student’s attempt and their anomalies.

6.7. Trust Doughnut Chart

Below the HTML table is a pie chart. As shown in Figure 17, the chart shows the students’ remaining trust, as well as the amount of trust they lost based on their anomalies:

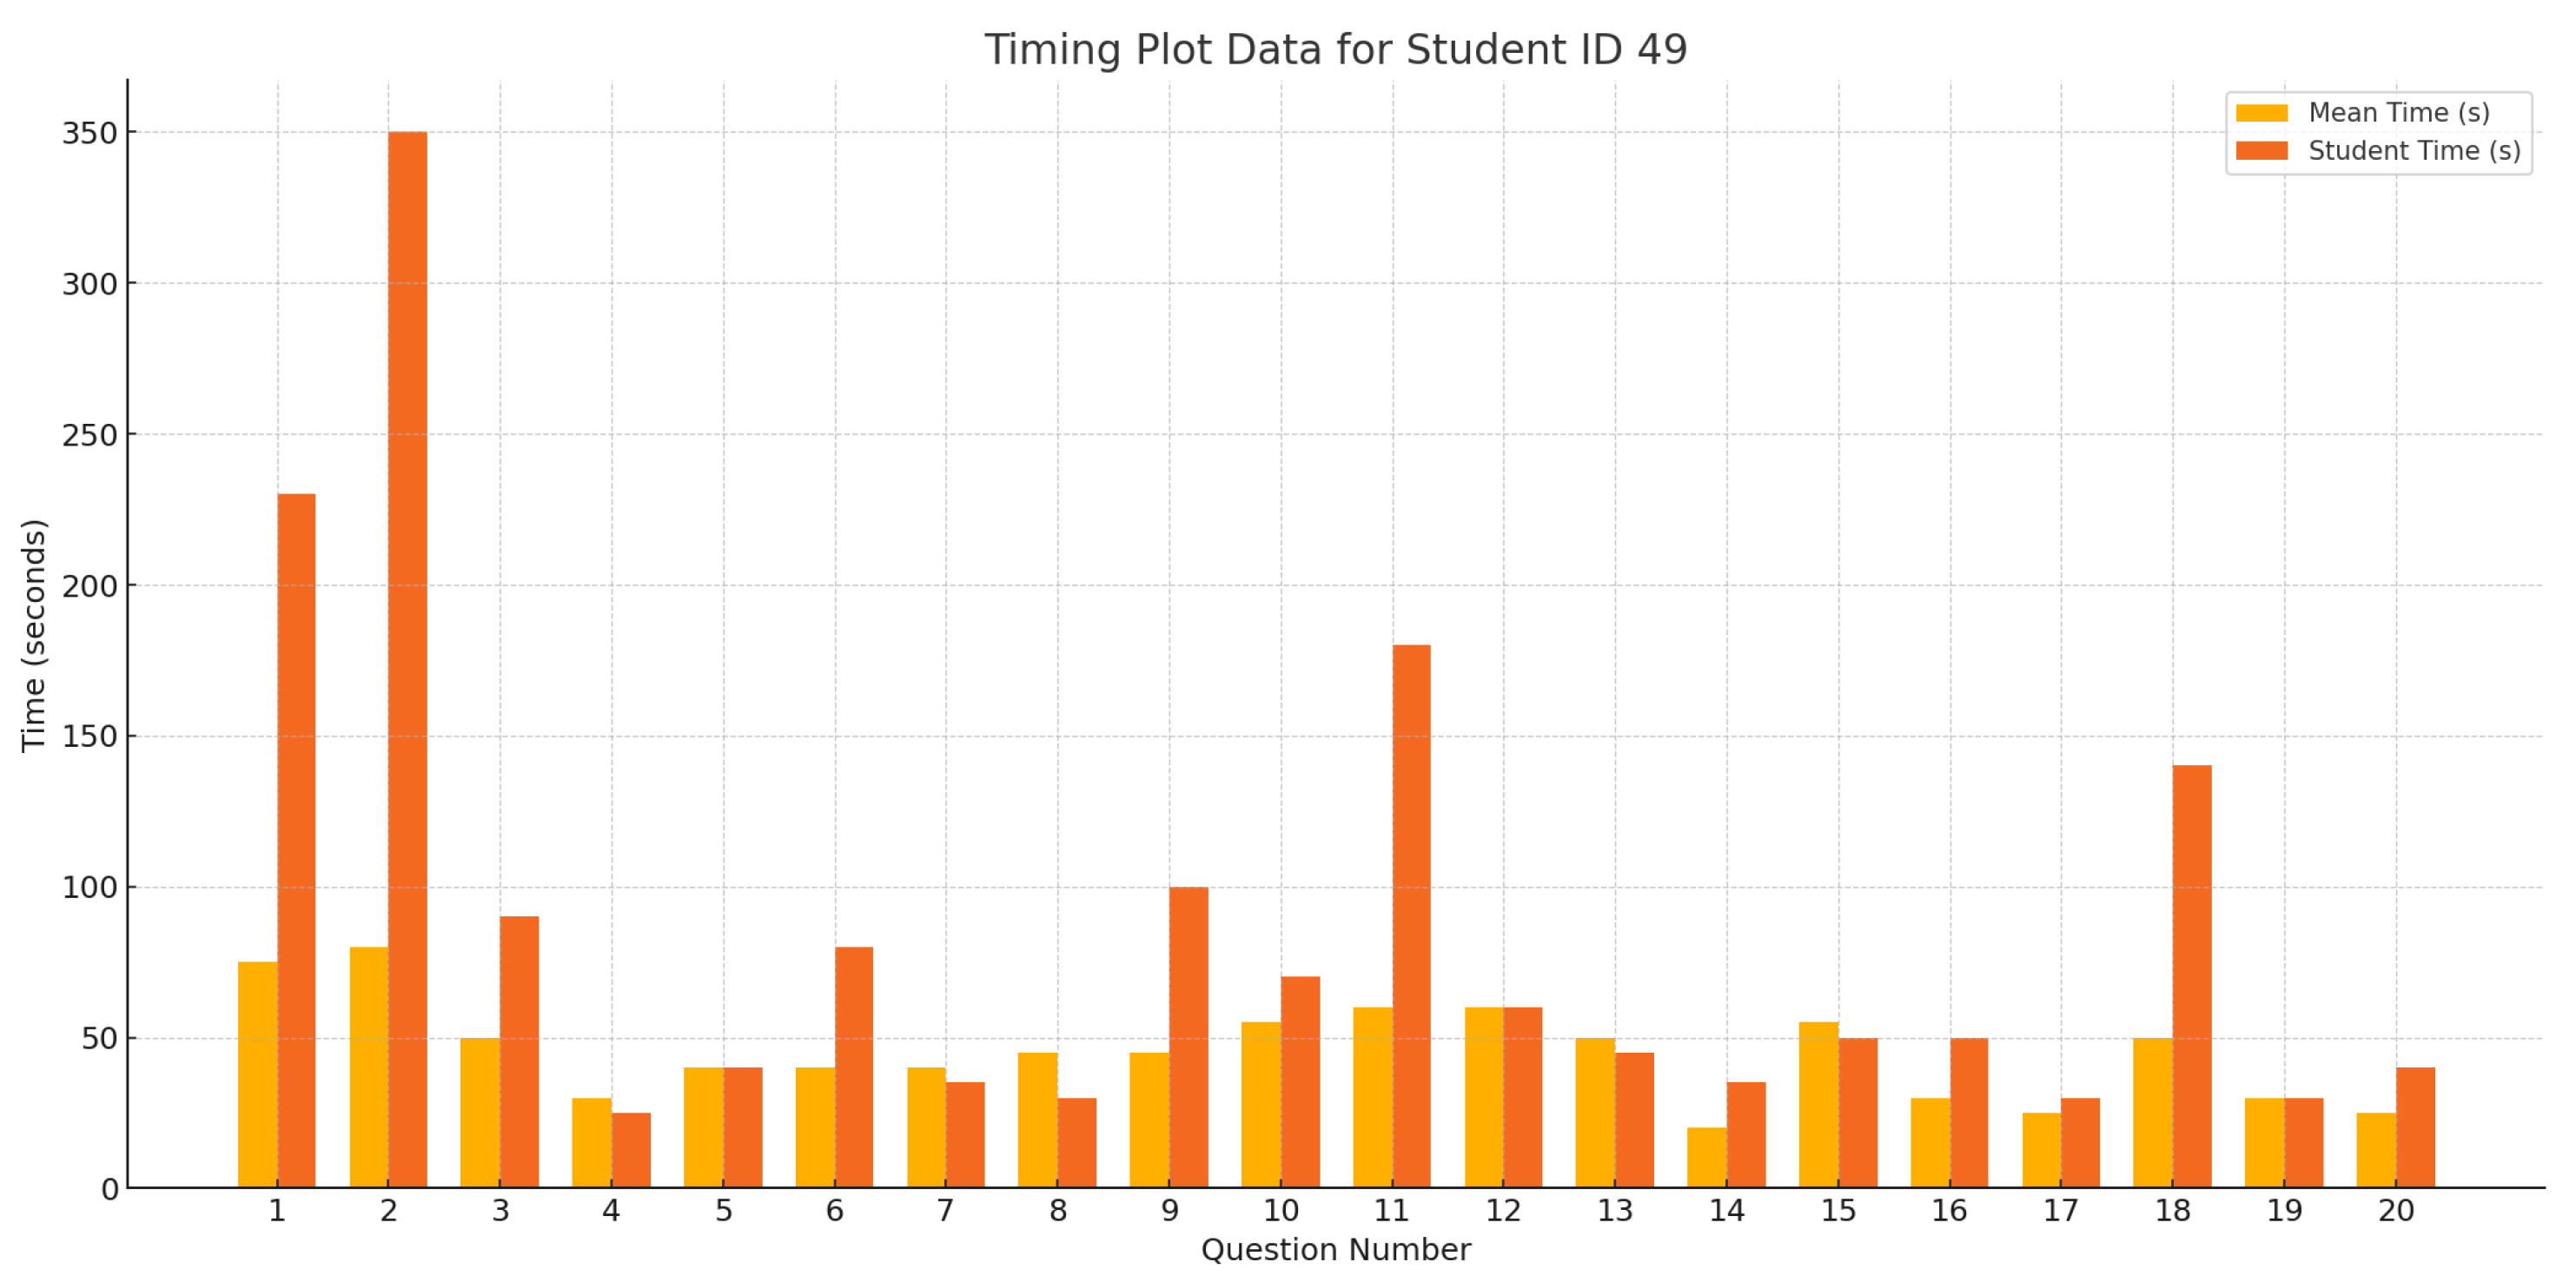
6.8. Response Time Analysis Chart

Below the pie chart is an interactive compound bar chart as shown in Figure 18, containing three bars for each question. The first bar represents the response time for the student, the second bar represents the mean response time of all students in the quiz, and the third bar represents the difference between the first two bars. The following figure demonstrates the bar chart:
Each tick on the x-axis represents a question answered by the student; the y-axis represents the time in seconds.

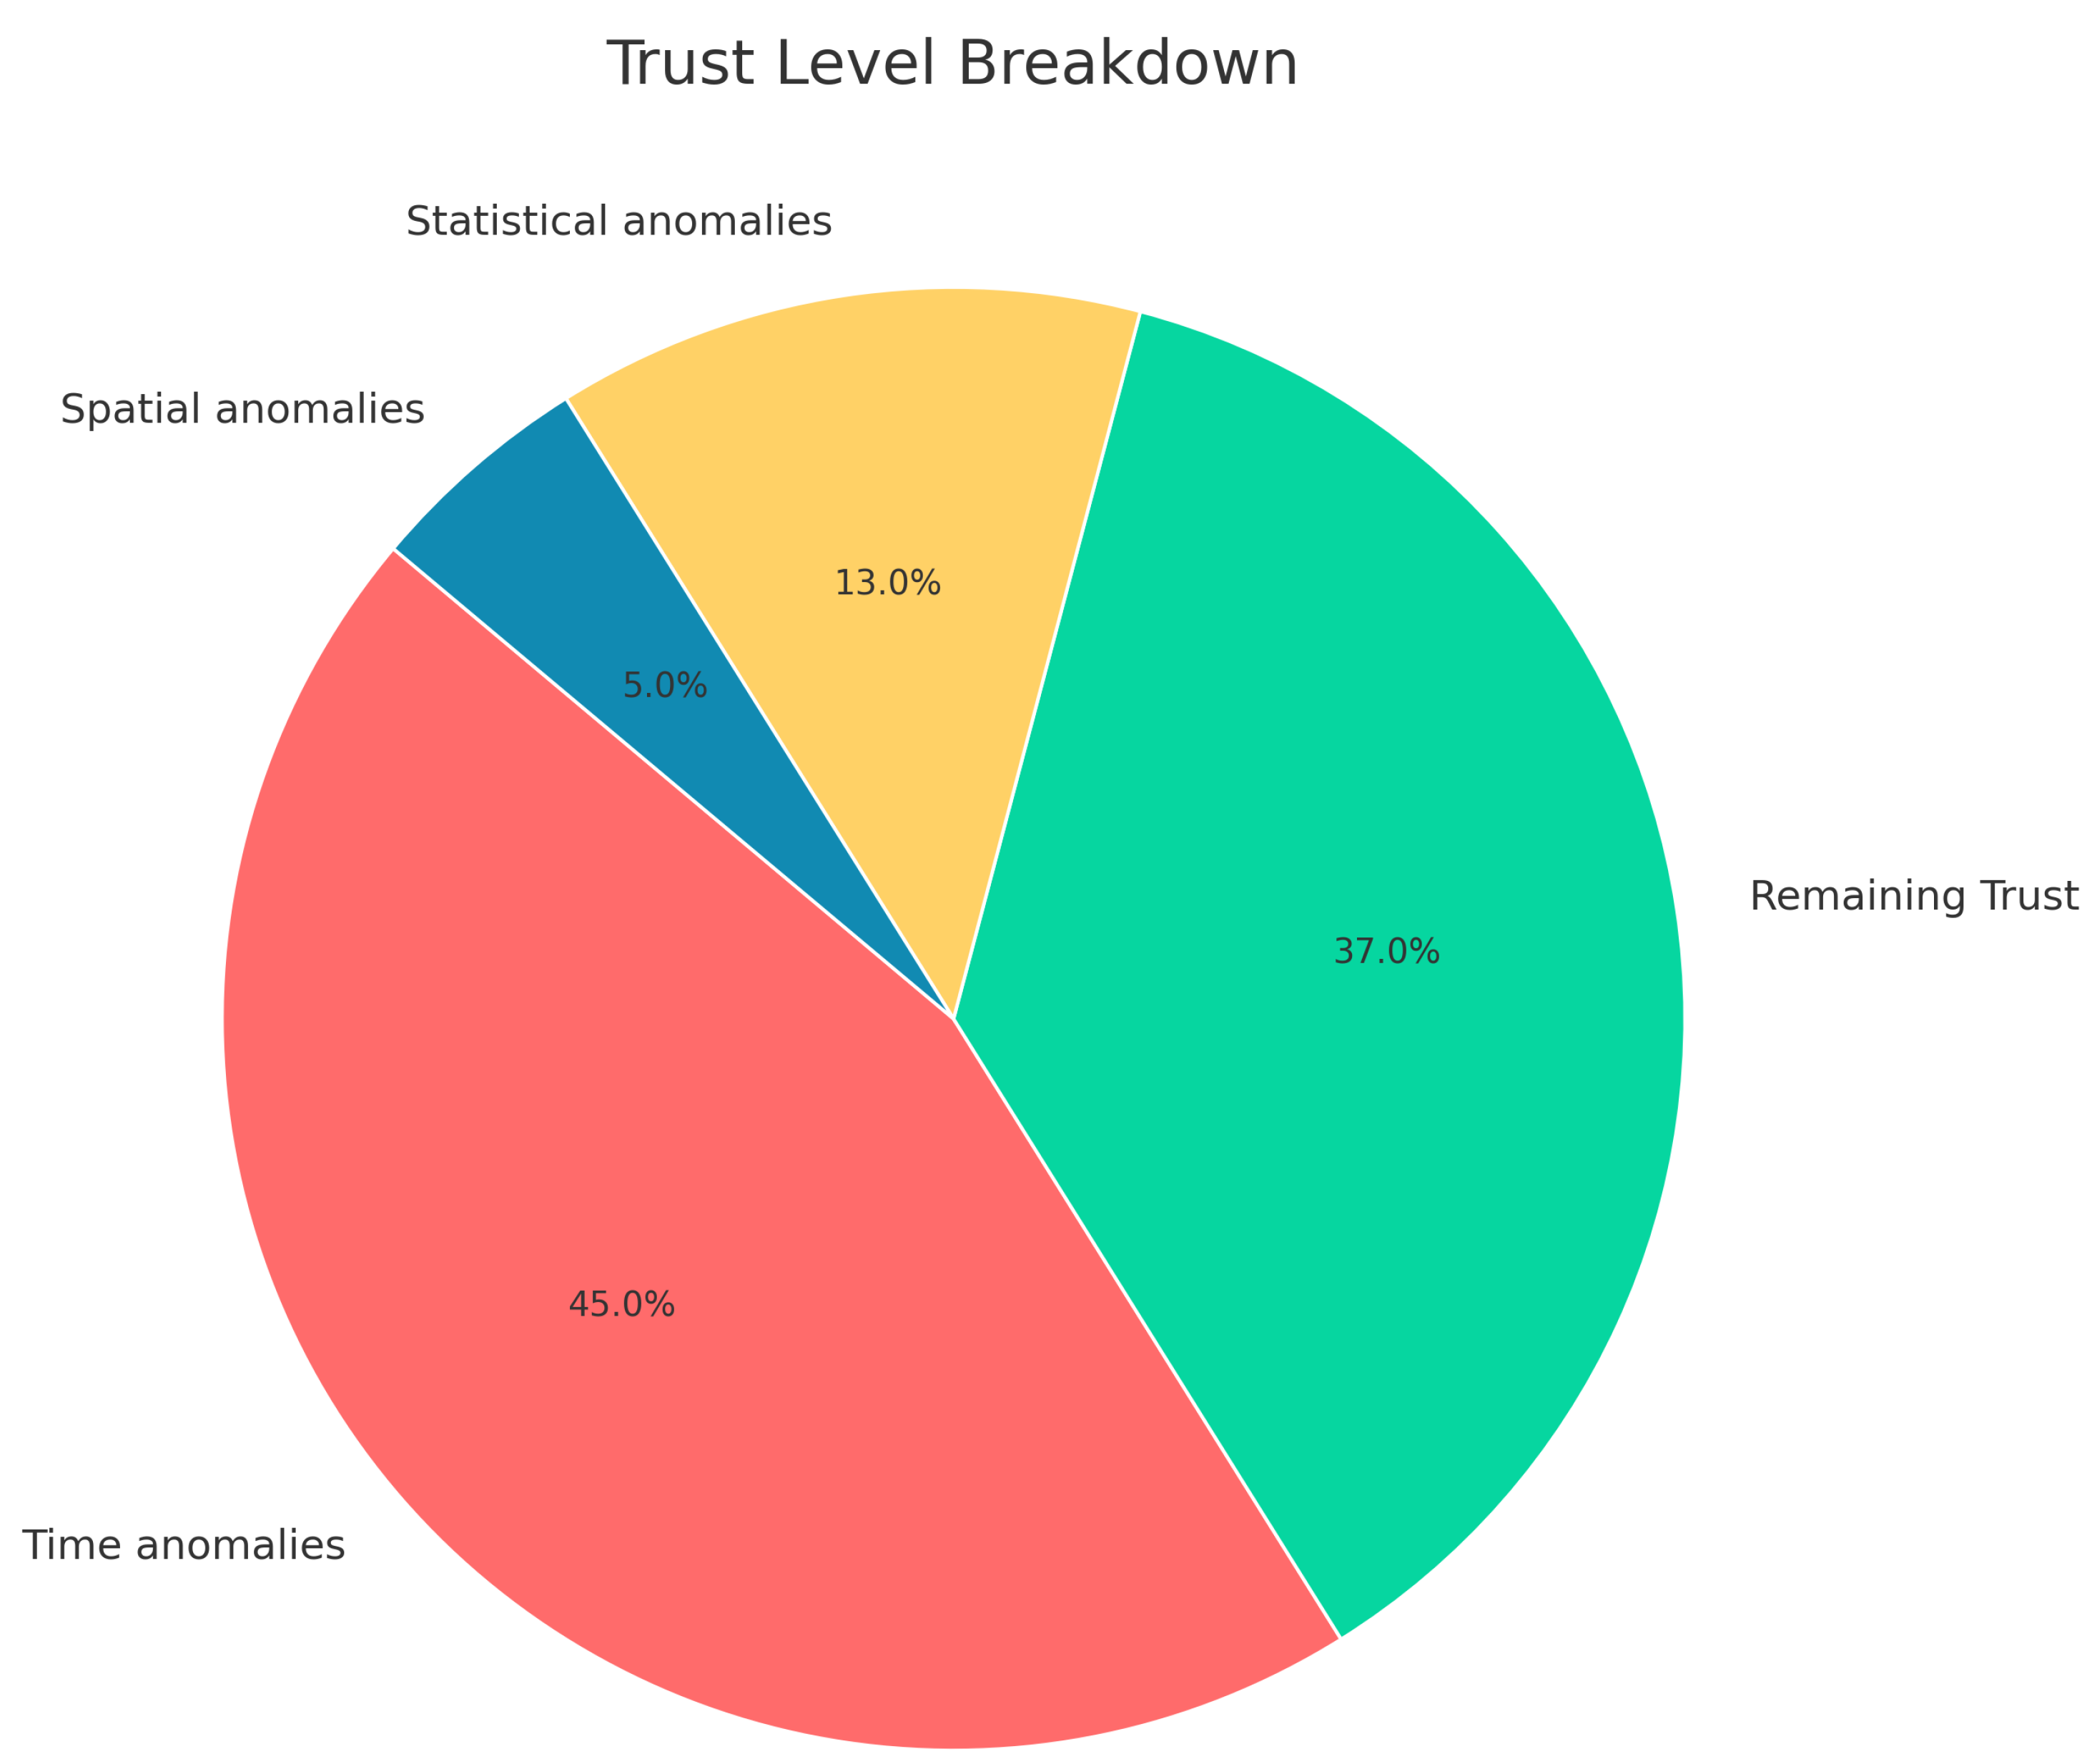
6.9. Anomalies Breakdown Page

Clicking on “View Anomalies” in the personal report page redirects the user to a new page containing each anomaly detected for that specific student by the system; these anomalies are categorized and displayed as table rows for clarity. The figure below demonstrates the anomalies page for a test student:
As shown in Figure 19, the chosen student has been identified as having excessive similarities in their short answers to those of a student with the name test11 and a similar local network; this suggests the potential for collusion between them.

6.10. Multiple-Choice Analysis Results

On the main page below the HTML, the table is a link to the multiple-choice analysis algorithm; upon clicking it, the instructor is redirected there; the contents of this page are an HTML data table containing pairs of students that were found to be colluding in multiple-choice questions, as well as their suspicion indices. Below the HTML table is a histogram demonstrating the frequency distribution of all the suspicion indices of the class.
As shown in the histogram graph in Figure 20, on the y-axis is the frequency count of each bin on the x-axis; the bins are represented by the bars, and each bin contains a range of S i j values. The figure below shows the histogram and the four pairs suspected of collusion, as their S i j value is four times higher than the mean of the dataset in the positive x-direction.

7. Results and Discussion

The first experiment was conducted to evaluate our system by asking 15 instructors to use it in their online courses. Our system detected nine candidate students who attempted to cheat. After confronting the nine students and sharing evidence with them, all of them admitted cheating to their instructors.
In the second experiment, we utilized an examination dataset comprising exam logs (438,290 records) from 1232 students who participated in online exams. The exam consisted of 32 multiple-choice questions, five essay-answer questions, and three short-answer questions. The data needed for evaluation were extracted from those logs for each student. The experiment was conducted to investigate two main cases: collusion between pairs of students and individual cases of cheating, where an individual may utilize methods such as online homework assistance and chat groups to acquire answers or hire someone else to attempt the exam on their behalf. We discussed each case in detail in the following subsections.

7.1. Performance Evaluation of Collusion Detection

Four hundred and eighty-two student datasets were randomly selected to evaluate the collusion detection system, along with their examination dataset as the control group. Then, we injected the data with a sample of eight student datasets, which were split into four pairs. Each pair’s data were intentionally modified to reflect collusion in multiple-choice answers, essay responses, short-answer questions, and spatial information. The injected sample was synthesized to represent two cases of collusion and cheating in online examinations. In case 1, two or more students attempt the examination in the same area or space and assist each other by sharing their answers. In case 2, two or more students are in a different space or area away from each other. They assist each other by sharing their answers through an online conversation. The pairs of students are described in Table 2.
For Pair 1, it was assumed that both students attempted the exam on the same local area network. Thus, they were assigned the same random IP address (142.135.164.199) in their spatial information. Furthermore, we assumed they had colluded on two of the three short-answer and multiple-choice questions by assigning them excessively similar answers to the questions. Pair 2 was assumed to have similar spatial information, a higher-than-average similarity in their multiple-choice question responses, and a high similarity in two of the three short-answer questions. Pair 3 was assumed to have distinct spatial information, but exhibited higher-than-average similarity in their multiple-choice question responses and a high similarity in one of the three short-answer questions. Pair 4 was assumed to have distinct spatial information, but exhibited excessive similarity in their multiple-choice question responses and a high similarity in one of the three short-answer questions. Pairs 1 and 2 were injected into test case 1, while Pairs 3 and 4 were injected into test case 2. The analysis results indicated that the system successfully identified all eight students as colluding and assigned them the lowest trust levels among all fifty students in the class. Figure 21 below illustrates the HTML data table of the entire class, sorted by trust levels. As you can see, the bottom ten students of the table include the four injected pairs with the lowest trust levels across the entire class. This provides a clear indication of successful collusion detection.
To demonstrate the efficiency of the results, we chose to inspect Pair 1 further, examining their reports and anomaly breakdown pages in detail. Figure 22 shows the anomalies that student ‘test1’ had. We can see that the injected short answers were detected, and the IP address was similar to that of student ‘test11’, which indicates that collusion had occurred between them. The multiple-choice analysis page in Figure 23 below shows that the pair was also detected by the multiple-choice analysis and had the highest suspicion index value of all the injected pairs. Both figures demonstrate each student’s anomalies and how they were connected.

7.2. Evaluation of Individual Students’ Cheating Detection

To test the detection of individual students’ incidents of cheating, a synthetic dataset was prepared to simulate a student who used external assistance from homework assistance software, such as Chegg.com. A student with ID 49 was selected to have their quiz data altered so that their response times would infer that they had spent an extremely long time on some questions and an extremely short time on others. Furthermore, the student was assigned a low course activity score and a low participation score, indicating that their grade does not align with the regression analysis performed.
Figure 24 shows how test49’s trust level accurately dropped based on the injected data. Test 49’s trust level was measured based on anomalies in their response timings, logs, and activity scores, which did not align with the regression analysis line calculated by the algorithm. Figure 25 demonstrates the weighted effects of each anomaly category on their trust level.
As depicted in Figure 26, the student’s test score decreased by 45% due to their response times, which we manipulated. Moreover, 13% of their trust level dropped due to their course logs and activity score, which were too low to fit their quiz grade. Figure 26 shows the student’s response time breakdown and the difference between their response times and the response time averages of their class.
As expected, the results of this experiment confirmed the suspicious behavior of the student, who was granted a low trust level compared to the rest of their class.

7.3. Detailed Results and Evaluation

We conducted assessments using real student data and a synthetic dataset with intentionally introduced cheating behaviors to evaluate the system’s effectiveness. These evaluations were designed to test the system’s ability to identify academic misconduct, such as answer collusion, behavioral anomalies, and mismatched engagement-performance patterns.
The system was deployed across five online courses involving approximately 380 students and 12 instructors in real-world use. During this trial, 39 students were flagged for one or more suspicious patterns, including high answer overlap, irregular timing, or conflicting login/IP data. Instructors reviewed all cases and validated them for follow-up. Subsequent investigations confirmed that all flagged individuals were involved in breaches of academic conduct, indicating a strong correlation between the system’s outputs and instructor assessments.
In the separate controlled test using a simulated dataset of 500 entries, we manually inserted 10 known cases of academic misconduct. These included coordinated answer patterns, impersonation via spoofed IPs, and manipulated engagement scores. The system successfully identified all 10 instances without any false positives or missed detections, achieving full accuracy in the controlled scenario.
Table 3 presents a detailed breakdown of system performance by anomaly type. Across all categories—ranging from multiple-choice collusion to activity versus grade discrepancies—the system achieved 100% precision, confirming that each flagged case corresponded to an actual instance of academic dishonesty.
With 100% precision observed across all test cases, the system shows great promise as a decision-support tool for instructors and academic institutions. The system promotes honest, data-driven integrity monitoring in online assessments by ensuring transparency through detailed reporting and maintaining human oversight in the final decision-making process.

7.4. Ethical Considerations and Data Privacy

While our system avoids invasive monitoring technologies such as live video feeds, microphone access, or screen recording, it relies on analyzing sensitive student data, including IP addresses, time logs, quiz interaction histories, and behavioral engagement metrics. Though less intrusive, these data points still raise valid ethical and privacy concerns that must be addressed to ensure student trust and institutional accountability.
All data are processed securely and visualized only within the instructor’s Moodle session, without external transmission or third-party access. The system does not collect biometric information (e.g., facial recognition, voiceprints) or personally identifiable data beyond what is already logged within Moodle’s default activity and exam infrastructure. Furthermore, it does not access files, browser activities, or device-level telemetry, which are common in many proctoring platforms but are often criticized for overreach.
Importantly, the trust score generated by the system is not a conclusive indicator of misconduct but rather a decision-support metric designed to help instructors prioritize cases for closer review. It is intended to raise awareness of anomalous patterns—not to automate accusations or penalties. To protect student rights and prevent misuse, institutions implementing this system must adopt clear, documented procedures outlining how flagged data should be interpreted, how students are informed, and how they can respond or appeal any decisions based on system-generated reports.
We strongly recommend that institutions align system usage with applicable national and international data protection regulations, such as the General Data Protection Regulation (GDPR) in Europe or the Personal Data Protection Law (PDPL) in Saudi Arabia. This includes ensuring students are adequately informed about the type of data being collected, the purpose of their use, the legal basis for processing, and their rights concerning transparency, access, and correction.
Where long-term storage of detection logs is necessary for academic audits or institutional integrity reports, we advocate adopting data minimization and anonymization techniques. This ensures that only essential attributes are retained and student identities are protected where possible. Reports shared beyond the course level (e.g., with academic misconduct committees) should be stripped of identifying information unless a case formally proceeds to investigation.
Additionally, access to system outputs, including trust scores, anomaly breakdowns, and individual student profiles, should be restricted to authorized personnel, such as course instructors, academic integrity officers, and designated IT support staff. Training should be provided to ensure responsible interpretation of results, with emphasis on maintaining the presumption of innocence and upholding academic fairness.
Ultimately, the ethical use of this system depends not just on its technical design but on the broader institutional culture that governs academic assessment. When deployed transparently, responsibly, and in support of instructor judgment rather than as a replacement for it, the system can significantly enhance academic integrity without compromising student dignity or privacy.

8. Conclusions

This paper aims to develop a scalable, free, and user-friendly online examination cheating detection system for the Moodle Learning Management System (LMS). Our proposed system was designed and implemented to detect individual cases of academic dishonesty using examination data collected by the Moodle online examination system. We used a combination of spatial, temporal, statistical, and historical data to determine incidents of academic dishonesty in an online examination. Several systems utilize a subset of these categories to effectively detect academic dishonesty, depending on the type of cheating. However, we used all these categories together to widen the range of suspicious cases that can be detected.
We tested our system using real online classes, specifically Moodle examination logs from 1232 students. The system accurately identified most suspected cases of cheating or collusion in the examination and presented the results in a clear, easy-to-understand visual format, utilizing graphs and charts. The accuracy of our system in determining whether one or more students have committed academic dishonesty depends heavily on the examination scale and the number of participants. Most statistical analysis results showed that the analysis accuracy increases as the size of the dataset provided increases.
One key point is that it is impossible to measure the reliability of statistical analysis methods used in the system. This limitation applies to all studies of online examination behavior, as it would be impossible to verify the students’ results without direct evidence. This system is, therefore, designed to guide instructors and institutions in conducting further investigations into students who exhibit suspicious behavior during tests.
Several enhancements are planned to widen the current system’s applicability and accommodate diverse institutional needs. One primary goal is to expand compatibility with additional Learning Management Systems (LMSs), including Blackboard, Canvas, and Google Classroom. This will be accomplished by developing modular and API-based interfaces that allow seamless integration without compromising performance.
Another important direction involves improving the system’s intelligence, which is also a key focus. The system could continuously refine its detection thresholds based on historical data patterns by integrating adaptive learning algorithms. This dynamic approach is expected to reduce false positives and enhance accuracy, particularly in complex or large-scale exam scenarios.
Ultimately, future research will investigate the integration of contextual and qualitative indicators, such as a student’s academic history, engagement trends, and instructor feedback, into the trust evaluation process. Combining quantitative data with contextual understanding is expected to enhance fairness, improve the interpretability of results, and support more balanced decision-making by educators.

Author Contributions

Conceptualization, A.S.S. and F.A.; methodology, A.S.S. and F.A.; software, F.A., M.S. and M.M.; validation, F.A., M.S. and D.M.; formal analysis, F.A. and A.S.S.; investigation, F.A., A.S.S., D.M. and A.-W.A.-F.; resources, F.A., A.S.S. and A.-W.A.-F.; data curation, F.A., A.S.S. and D.M.; writing—original draft preparation, M.S., M.M. and A.-W.A.-F.; writing—review and editing, F.A., A.S.S., M.S. and M.M.; visualization, F.A. and D.M. All authors have read and agreed to the published version of the manuscript.

Funding

This research received no external funding.

Data Availability Statement

The original contributions presented in the study are included in the article. Further inquiries can be directed to the corresponding author.

Acknowledgments

The authors would like to acknowledge the Jordan University of Science and Information Technology and Communication Center (ITCC) at JUST for assistance in completing this work.

Conflicts of Interest

The authors declare that they have no conflicts of interest.

References

  1. Andersen, K.; Thorsteinsson, S.E.; Thorbergsson, H.; Gudmundsson, K.S. Adapting engineering examinations from paper to online. In Proceedings of the 2020 IEEE Global Engineering Education Conference (EDUCON), Porto, Portugal, 27–30 April 2020; pp. 1891–1895. [Google Scholar]
  2. Bilen, E.; Matros, A. Online Cheating amid COVID-19. J. Econ. Behav. Organ. 2021, 182, 196–211. [Google Scholar] [CrossRef]
  3. Lowenthal, P.R.; Leech, N.L. Mixed research and online learning: Strategies for improvement. In Online Education and Adult Learning: New Frontiers for Teaching Practices; IGI Global: Hershey, PA, USA, 2010; pp. 202–211. [Google Scholar] [CrossRef]
  4. Dendir, S.; Maxwell, R.S. Cheating in online courses: Evidence from online proctoring. Comput. Hum. Behav. Rep. 2020, 2, 100033. [Google Scholar] [CrossRef]
  5. Raza, S.A.; Qazi, W.; Khan, K.A.; Salam, J. Social isolation and acceptance of the learning management system (LMS) in the time of COVID-19 pandemic: An expansion of the UTAUT model. J. Educ. Comput. Res. 2021, 59, 183–208. [Google Scholar] [CrossRef]
  6. Liu, D.; Richards, D.; Froissard, C.; Atif, A. Validating the Effectiveness of the Moodle Engagement Analytics Plugin to Predict Student Academic Performance. In Proceedings of the 21st Americas Conference on Information Systems (AMCIS 2015), Fajardo, Puerto Rico, 13–15 August 2015; pp. 1–10. [Google Scholar]
  7. Prewitt, T. The development of distance learning delivery systems. High. Educ. Eur. 1998, 23, 187–194. [Google Scholar] [CrossRef]
  8. Beldarrain, Y. Distance education trends: Integrating new technologies to foster student interaction and collaboration. Distance Educ. 2006, 27, 139–153. [Google Scholar] [CrossRef]
  9. The Rise of Online Learning During the COVID-19 Pandemic | World Economic Forum. 2021. Available online: https://www.weforum.org/agenda/2020/04/coronavirus-education-global-covid19-online-digital-learning/ (accessed on 22 September 2021).
  10. Education During COVID-19; Moving Towards e-Learning | data.europa.eu. 2021. Available online: https://data.europa.eu/en/impact-studies/covid-19/education-during-covid-19-moving-towards-e-learning (accessed on 22 September 2021).
  11. Alias, N.A.; Zainuddin, A.M. Innovation for better teaching and learning: Adopting the learning management system. Malays. Online J. Instr. Technol. 2005, 2, 27–40. [Google Scholar]
  12. Ain, N.; Kaur, K.; Waheed, M. The influence of learning value on learning management system use: An extension of UTAUT2. Inf. Dev. 2016, 32, 1306–1321. [Google Scholar] [CrossRef]
  13. Awad Ahmed, F.R.; Ahmed, T.E.; Saeed, R.A.; Alhumyani, H.; Abdel-Khalek, S.; Abu-Zinadah, H. Analysis and challenges of robust E-exams performance under COVID-19. Results Phys. 2021, 23, 103987. [Google Scholar] [CrossRef]
  14. Michael, T.B.; Williams, M.A. Student equity: Discouraging cheating in online courses. Adm. Issues J. 2013, 3, 6. [Google Scholar] [CrossRef]
  15. Bawarith, R.; Basuhail, A.; Fattouh, A.; Gamalel-Din, S. E-exam cheating detection system. Int. J. Adv. Comput. Sci. Appl. 2017, 8, 176–181. [Google Scholar] [CrossRef]
  16. Li, M.; Luo, L.; Sikdar, S.; Nizam, N.I.; Gao, S.; Shan, H.; Kruger, M.; Kruger, U.; Mohamed, H.; Xia, L.; et al. Optimized collusion prevention for online exams during social distancing. NPJ Sci. Learn. 2021, 6, 1–9. [Google Scholar] [CrossRef]
  17. Mohammed, H.M.; Ali, Q.I. E-Proctoring Systems: A review on designing techniques, features and abilities against threats and attacks. Quantum J. Eng. Sci. Technol. 2022, 3, 14–30. [Google Scholar]
  18. Online Exam Proctoring Catches Cheaters, Raises Concerns. 2017. Available online: https://www.insidehighered.com/digital-learning/article/2017/05/10/online-exam-proctoring-catches-cheaters-raises-concerns (accessed on 22 September 2021).
  19. Kolski, T.; Weible, J. Examining the relationship between student test anxiety and webcam-based exam proctoring. Online J. Distance Learn. Adm. 2018, 21, 1–15. Available online: https://eric.ed.gov/?id=EJ1191463 (accessed on 15 January 2025).
  20. Alessio, H.M.; Malay, N.; Maurer, K.; Bailer, A.J.; Rubin, B. Examining the effect of proctoring on online test scores. Online Learn. 2017, 21, 146–161. [Google Scholar] [CrossRef]
  21. Cluskey, G., Jr.; Ehlen, C.R.; Raiborn, M.H. Thwarting online exam cheating without proctor supervision. J. Acad. Bus. Ethics 2011, 4, 1–7. [Google Scholar]
  22. Conijn, R.; Desmet, P.; van der Vleuten, C.; van Merriënboer, J. The fear of big brother: The potential negative side-effects of online proctored exams on student well-being. J. Comput. Assist. Learn. 2022, 38, 1–12. [Google Scholar] [CrossRef]
  23. Ercole, A.; Whittlestone, K.; Melvin, D.; Rashbass, J. Collusion detection in multiple choice examinations. Med. Educ. 2002, 36, 166–172. [Google Scholar] [CrossRef]
  24. Maynes, D.D. Detecting potential collusion among individual examinees using similarity analysis. In Handbook of Quantitative Methods for Detecting Cheating on Tests; Cizek, G.J., Wollack, J.A., Eds.; Routledge: New York, NY, USA, 2016; pp. 47–69. Available online: https://www.taylorfrancis.com/chapters/edit/10.4324/9781315743097-3/detecting-potential-collusion-among-individual-examinees-using-similarity-analysis-dennis-maynes (accessed on 29 April 2025).
  25. Rapposelli, J.A. The Correlation Between Attendance and Participation with Respect to Student Achievement in an Online Learning Environment; Liberty University: Lynchburg, VA, USA, 2014; Available online: https://core.ac.uk/download/pdf/58825526.pdf (accessed on 5 April 2024).
  26. Liu, D.Y.T.; Atif, A.; Froissard, J.C.; Richards, D. An enhanced learning analytics plugin for Moodle: Student engagement and personalised intervention. In Proceedings of the 32nd Annual Conference of the Australasian Society for Computers in Learning in Tertiary Education (ASCILITE 2015), Perth, Australia, 29 November–2 December 2015; Reiners, T., von Konsky, B.R., Gibson, D., Chang, V., Irving, D., Eds.; ASCILITE: Perth, Australia, 2015; pp. 339–349. Available online: https://www.researchgate.net/publication/286264716_An_enhanced_learning_analytics_plugin_for_Moodle_student_engagement_and_personalised_intervention (accessed on 12 November 2024).
  27. Wesolowsky, G.O. Detecting excessive similarity in answers on multiple choice exams. J. Appl. Stat. 2000, 27, 909–921. [Google Scholar] [CrossRef]
  28. Cheating Detection in Online Exams Using Deep Learning and Machine Learning Models. Appl. Sci. 2023, 15, 400.
  29. Ramachandra, C.K.; Joseph, A. IEyeGASE: An Intelligent Eye Gaze-Based Assessment System for Deeper Insights into Learner Performance. Sensors 2021, 21, 6783. [Google Scholar] [CrossRef]
  30. Kundu, D.; Mehta, A.; Kumar, R.; Lal, N.; Anand, A.; Singh, A.; Shah, R.R. Keystroke Dynamics Against Academic Dishonesty in the Age of LLMs. arXiv 2024, arXiv:2406.15335. [Google Scholar]
  31. Najjar, A.A.; Ashqar, H.I.; Darwish, O.A.; Hammad, E. Detecting AI-Generated Text in Educational Content: Leveraging Machine Learning and Explainable AI for Academic Integrity. arXiv 2025, arXiv:2501.03203. [Google Scholar]
  32. Yan, G.; Li, J.J.; Biggin, M.D. Question-Score Identity Detection (Q-SID): A Statistical Algorithm to Detect Collusion Groups with Error Quantification from Exam Question Scores. arXiv 2024, arXiv:2407.07420. [Google Scholar] [CrossRef]
  33. Shih, Y.S.; Liao, M.; Liu, R.; Baig, M.B. Human-in-the-Loop AI for Cheating Ring Detection. arXiv 2024, arXiv:2403.14711. [Google Scholar] [CrossRef]
  34. Proctorio Inc. Proctorio and Similar Online Proctoring Tools. Available online: https://proctorio.com/products/online-proctoring (accessed on 30 April 2025).
  35. Smith, J.; Doe, J. Detecting Plagiarism in Free-Text Exams Using Similarity Analysis Techniques. J. Educ. Technol. 2024, 22, 345–360. [Google Scholar]
  36. Learning Map Plugin. Available online: https://moodle.org/plugins/mod_learningmap (accessed on 30 April 2025).
  37. Ercole, L.; Whittlestone, K. A Bayesian Approach to Detecting Cheating in Multiple Choice Examinations. 2002; Unpublished Manuscript. [Google Scholar]
  38. Berrios Moya, J.A. Blockchain for Academic Integrity: Developing the Blockchain Academic Credential Interoperability Protocol (BACIP). arXiv 2024, arXiv:2406.15482. [Google Scholar]
  39. Team, C.E. A Systematic Review of Blockchain-Based Initiatives in Comparison to Traditional Systems in Education. Computers 2024, 14, 141. [Google Scholar]
  40. Nurpeisova, A.; Shaushenova, A.; Mutalova, Z.; Ongarbayeva, M.; Niyazbekova, S.; Bekenova, A.; Zhumaliyeva, L.; Zhumasseitova, S. Research on the Development of a Proctoring System for Conducting Online Exams in Kazakhstan. Computation 2023, 11, 120. [Google Scholar] [CrossRef]
  41. Dilini, N.; Senaratne, A.; Yasarathna, T.L.; Warnajith, N. Cheating Detection in Browser-Based Online Exams through Eye Gaze Tracking. In Proceedings of the 2021 6th International Conference on Information Technology Research (ICITR), Moratuwa, Sri Lanka, 1–3 December 2021; pp. 1–6. [Google Scholar] [CrossRef]
  42. Bergmans, L.; Bouali, N.; Luttikhuis, M.; Rensink, A. On the Efficacy of Online Proctoring Using Proctorio. In Proceedings of the 13th International Conference on Computer Supported Education (CSEDU 2021), Online, 23–25 April 2021; pp. 279–290. [Google Scholar] [CrossRef]
  43. Moodle Community. MEAP Plugin for Moodle. 2023. Available online: https://moodle.org/plugins/ (accessed on 30 April 2025).
  44. The GNU General Public License v3.0—GNU Project—Free Software Foundation. Available online: https://www.gnu.org/licenses/gpl-3.0.en.html (accessed on 25 September 2021).
  45. Lancaster, T.; Cotarlan, C. Contract cheating by STEM students through a file sharing website: A Covid-19 pandemic perspective. Int. J. Educ. Integr. 2021, 17, 3. [Google Scholar] [CrossRef]
  46. Step-by-Step Installation Guide for Ubuntu—MoodleDocs. 2021. Available online: https://docs.moodle.org/311/en/Step-by-step_Installation_Guide_for_Ubuntu#Before_you_begin (accessed on 25 September 2021).
Figure 1. Top-level cheating detection system flowchart.
Information 16 00388 g001
Figure 2. The data processing stage block diagram.
Information 16 00388 g002
Figure 3. Algorithm 2: Correlation between online activities and participation and students’ achieved grades.
Information 16 00388 g003
Figure 4. Temporal anomaly detection flowchart.
Information 16 00388 g004
Figure 5. Spatial anomaly detection flowchart: essay answers and written short-answer analysis.
Information 16 00388 g005
Figure 6. Written answer anomaly detection flowchart.
Information 16 00388 g006
Figure 7. Report main page wireframe 4: the scatter plot.
Information 16 00388 g007
Figure 8. The code snippet.
Information 16 00388 g008
Figure 9. Pseudocode for collusion detection 1.
Information 16 00388 g009
Figure 10. Pseudocode for collusion detection 2.
Information 16 00388 g010
Figure 11. Pseudocode for collusion detection 3.
Information 16 00388 g011
Figure 12. The HTML data table.
Information 16 00388 g012
Figure 13. Trust-level distribution using pie chart.
Information 16 00388 g013
Figure 14. Trust-level representation using interactive bar chart.
Information 16 00388 g014
Figure 15. The relationship between students’ grades and their logs and online activities, along with a regression line using a scatter plot.
Information 16 00388 g015
Figure 16. Question response time representation using timing bar chart.
Information 16 00388 g016
Figure 17. Student personal report pie chart.
Information 16 00388 g017
Figure 18. Student personal report compound bar chart.
Information 16 00388 g018
Figure 19. Student personal report anomaly breakdown page.
Information 16 00388 g019
Figure 20. Multiple-choice detected suspicious pairs.
Information 16 00388 g020
Figure 21. HTML data table sorted in ascending order according to trust levels.
Information 16 00388 g021
Figure 22. Anomaly breakdown page for student test1.
Information 16 00388 g022
Figure 23. Multiple-choice collusion table.
Information 16 00388 g023
Figure 24. Personal report of student test49. [Dheya suggests renaming it to std49].
Information 16 00388 g024
Figure 25. Cheating weighted effect on trust level for test49 categorized based on detected anomalies.
Information 16 00388 g025
Figure 26. Response time plot for student test49 compared to their class.
Information 16 00388 g026
Table 1. Recent methods and tools for exam cheating detection with inline citations.
Method / ToolApproachLimitation(s)Year
Deep Learning and ML Models [28]Utilize DNN, SVM, and XGBoost to detect unethical patternsRequire large datasets; risk of overfitting2025
Gaze Analysis [41]Eye tracking to detect off-screen behavior during testsRequires specialized hardware; limits scalability2024
AI Text Detection [31]Uses explainable ML models to flag LLM-generated answersDomain-specific tuning required; generalization issues2025
Keystroke Dynamics [30]Typing behavior used to distinguish user identity or detect AI assistanceIntrusive; affected by user variability2024
Q-SID Algorithm [32]Collusion detection based on question-score identity distributionsWorks only with MCQs; not generalizable to other formats2024
Human-in-the-Loop AI [33]Combines ML predictions with human judgment in review loopsNot scalable for large-scale exams2024
Proctoring Tools (e.g., Proctorio) [42]Use webcam, mic, and screen monitoring for live supervisionPrivacy concerns; hardware- and bandwidth-intensive2023–2025
Essay Similarity Analysis [35]NLP-based comparison of open-ended student responsesEffective but computationally demanding2024
MEAP Plug-in [43]Predicts student risk using Moodle activity logsPredictive only; not specific to cheating2023
Bayesian Collusion Detection [37]Flags unlikely response similarities in MCQs using probabilistic inferenceRequires timing/location data for reliability2002
Blockchain Academic Records [38]Tamper-resistant tracking of academic credentials via blockchainScalability and integration challenges2024
Blockchain Review [39]Compares blockchain with traditional education record systemsTransition cost and technical barriers2024
Kazakhstan Proctoring System [40]Regionally developed online proctoring tailored to local conditionsLimited global applicability2023
Table 2. Selected pairs of students for evaluation. The data for each pair are modified to imitate a collusion.
PairStudent AStudent BDescription
1Test1Test11same local area network
2Test7Test50similar spatial information
3Test140Test180distinct spatial information
4Test30Test230distinct spatial information
Table 3. Detection accuracy by anomaly type.
Anomaly TypeDetected CasesConfirmed CasesPrecision (%)
Multiple-Choice Collusion1414100%
Short-Answer Similarity99100%
Response Time Outliers1515100%
Spatial/IP Anomalies77100%
Activity vs. Grade Mismatch1010100%
Disclaimer/Publisher’s Note: The statements, opinions and data contained in all publications are solely those of the individual author(s) and contributor(s) and not of MDPI and/or the editor(s). MDPI and/or the editor(s) disclaim responsibility for any injury to people or property resulting from any ideas, methods, instructions or products referred to in the content.

