Article

Amazon Web Service–Google Cross-Cloud Platform for Machine Learning-Based Satellite Image Detection

by
David Pacios
1,*,
Sara Ignacio-Cerrato
2,
José Luis Vázquez-Poletti
1,
Rafael Moreno-Vozmediano
1,
Nikolaos Schetakis
3,4,
Konstantinos Stavrakakis
3,
Alessio Di Iorio
3,
Jorge J. Gomez-Sanz
5 and
Luis Vazquez
5
1
Department of Computer Architecture and Automation, Faculty of Informatics, Universidad Complutense de Madrid, Calle del Prof. José García Santesmases 9, 28040 Madrid, Spain
2
Optics Department, Faculty of Optics and Optometry, Universidad Complutense de Madrid, Calle Arcos de Jalón 118, 28037 Madrid, Spain
3
ALMA Sistemi Srl, 00012 Guidonia, Italy
4
Quantum Innovation Pc, 731000 Chania, Greece
5
Faculty of Informatics, Universidad Complutense de Madrid, Calle del Prof. José García Santesmases 9, 28040 Madrid, Spain
*
Author to whom correspondence should be addressed.
Information 2025, 16(5), 381; https://doi.org/10.3390/info16050381
Submission received: 27 January 2025 / Revised: 11 April 2025 / Accepted: 30 April 2025 / Published: 2 May 2025
(This article belongs to the Special Issue Real-World Applications of Machine Learning Techniques)

Abstract

:
Satellite image analysis is a critical component of Earth observation and satellite data analysis, providing detailed information on the effects of global events such as the COVID-19 pandemic. Cloud computing offers a flexible way to allocate resources and simplifies the management of infrastructure. In this study, we propose a cross-cloud system for ML-based satellite image detection, focusing on the financial and performance aspects of utilizing Amazon Web Service (AWS) Lambda and Amazon SageMaker for advanced machine learning tasks. Our system utilizes Google Apps Script (GAS) to create a web-based control panel, providing users with access to our AWS-hosted satellite detection models. Additionally, we utilize AWS to manage expenses through a strategic combination of Google Cloud and AWS, providing not only economic advantages, but also enhanced resilience. Furthermore, our approach capitalizes on the synergistic capabilities of AWS and Google Cloud to fortify our defenses against data loss and ensure operational resilience. Our goal is to demonstrate the effectiveness of a cloud environment in addressing complex and interdisciplinary challenges, particularly in the field of object analysis using spatial imagery.

1. Introduction

Space observation and satellite data are critical tools in today’s scientific landscape, especially when analyzing global events such as the COVID-19 [1] pandemic. Satellite data offer a wide range of information, from economic indicators to health metrics. This includes environmental measurements, pollution levels, and economic markers such as transportation and trade patterns. For this purpose, we analyze the metrics obtained from satellite images within the Economy bY Space (EyE) project (accessed on 10 October 2024: https://www.economy-by-space.eu/).
This project obtains low-resolution images from the Copernicus program [2] in order to determine the impact of COVID-19 in a given area over a period of time. To this end, we first improved the resolution of the images and then counted the elements of each image using machine learning (ML). Initially, the ML analysis process was performed locally, but due to the high resource consumption, it was decided to change to a model that uses both cloud computing and serverless technology. The Infrastructure-as-a-Service [3] (IaaS) model in cloud computing offers a flexible way to allocate resources and simplifies the management of infrastructure. Moving to a serverless model in cloud computing allows for better resource use, where users are charged only for the actual computational time they consume, making it cost-effective. On the other hand, serverless architecture is designed to operate pre-trained satellite detection models using SageMaker [4]; this enables a careful examination of spatial images and will support detailed spatial image analysis. In this way, different cloud services are coordinated through a Google App Script [5] platform in order to analyze a series of images of a given area in real time.
Figure 1 shows the images obtained from the Copernicus program used for the container detection dataset. These images were processed in order to improve their resolution, and then the containers were marked.
Finally, the Google App Script platform was used to coordinate the different platforms. Among the platforms we used were Amazon Web Service for the serverless part, and, in addition, the Google Drive platform was used to store the data obtained. On the other hand, SageMaker was also used to perform the training of the datasets. These different platforms were used within the same environment, Google App Script, allowing us to perform the analysis of each of the elements of an image in real time within the application.
The main contributions of this paper are as follows:
  • We reduced costs and increased application efficiency by coordinating and integrating architectures and services in Google App Script. Amazon Web Service was one of the services that we integrated into the application.
  • We implemented several services in the application, including AWS Lambda and SageMaker, in order to process and analyze the images in real time. The AWS Lambda service was in charge of image processing and SageMaker was in charge of ML in order to detect image elements in real time.
  • We created a replicable model for real-time image detection. We standardized the application to make it replicable on all types of web platforms.
  • We compared processes performed on-premise with different cloud applications and with different multi-cloud servers. The different benchmark values are shown in a table to evaluate the difference in the performance of the image processing and ML processes.
This research proposes a multi-cloud system in Google App Script. This system is coordinated by services such as AWS, SageMaker, and other external services such as Google Colab. This tool is currently being used for the EyE project and has served as a basis for multiple publications related to the detection of the elements and relating them to the economic costs.
The article is structured as follows: Section 2 shows the previous state of the art studied for the development of the application and the subsequent creation of the platform, Section 3 shows all the steps for developing the whole machine learning model, Section 4 shows the serverless architecture that was used to develop the application, Section 5 describes how the application works and how the different multi-cloud services are coordinated, Section 6 develops the methodology used to calculate the accuracy of the ML model and the calculation of the various services used, Section 7 shows the results of the item count and application costs, and Section 8 shows the conclusions and future work of this research.

2. Related Works

In this section, we evaluate all the works related to this research. We highlight articles related to serverless architectures, the different ML models, and the models used in the European project. And, finally, we evaluate studies related to AWS, SageMaker, and Google App Script.
First, during the development of the experiment, different studies [6,7,8] related to different applications of serverless technology were evaluated. One of the articles that was evaluated was one about an experiment used in the MARSIS mission [6]. For this, the authors proposed a serverless architecture where they streamlined the process of detecting oblique echoes [6] in ionograms. Unlike the proposed experiment, this proposal used a simple application where it was only connected to Amazon Web Service. In contrast, the proposal in this experiment is connected to more than one platform. On the other hand, the article [7] proposes an architecture based on IoT, i.e., the Internet of Things. In this case, it proposes different tools for scheduling using two different technologies: serverless technology and edge computing. For this, the deep learning part is both in edge computing and serverless, while our application performs all the ML in the same environment without having to resort to edge computing. Finally, we assessed an article related to SNVDI [8], i.e., applying serverless technology to obtain vegetation indices in the shortest possible time, a task of significant importance, particularly in the context of Earth observation. At its core, SNDVI leverages serverless computing and integrates essential libraries such as GDAL, ensuring not only maximized performance, but also adherence to the stringent demands of satellite data processing [9]. NDVI, a critical metric in remote sensing and agriculture, requires a robust and efficient framework, especially given the immense volume and complexity of data associated with NDVI computations, highlighting the need for architectures capable of dynamic scaling and real-time data processing [10]. With the architecture proposed in this article, the processing of a large amount of data in a small amount of time can be solved. Therefore, it served as a basis and counterpoint to establish a similar architecture for the ML.
Secondly, moving from space-to-earth applications, the EyE-Sense Web platform stands out as a significant example of the effective application of serverless technology in satellite data acquisition and analysis [11]. Grounded in the principles of serverless containers, this platform is designed to optimize the performance of scientific processes, simplifying complex operations and broadening access to satellite data for a diverse range of users. In the EyE project, this platform serves as a web-based interface for sequential data processing. Building on this foundation, there is a drive to develop a more comprehensive system for large-scale parallel processing of spatial information, with the aim of creating a more versatile and generic platform. The goal is to extend the capabilities of the EyE-Sense platform, making it suitable for both scientific and business applications, with user-friendly interfaces and robust satellite data analysis capabilities.
Next, we searched for works related to applications developed in Google App Script [12,13]. In the first article [12], we saw a state of the art for multi-cloud platforms. We saw the standard updated in a variety of different applications and all of them developed in multi-cloud. With this article, we saw the way forward to develop our technology and limit its framework. On the other hand, for the other article [13], we assessed a use case applied to cybersecurity. In the latter, we assessed how to develop the application in Google Script and how to coordinate it with other clouds.
Finally, we contextualized the literature related to SageMaker [14,15,16]. In these articles we see some use cases related to this tool. The first [14] of these cases is related to a tool that is a news classifier; it is a tool similar to the one presented here since it uses Python 3.8 and access to the news is achieved through an API. In the second case, we looked at how different predictors [15] could affect processing in SageMaker. Fourteen different markers used for different use cases were measured. With this article, we identified which markers we should use in our example and how to implement the connection between SageMaker and Google App Script. And the last article [16] is a use case applied to the detection of credit card fraud. A series of metrics were performed to assess the effectiveness of the algorithm and to evaluate false positives and false negatives. From this article, we obtained a way to implement SageMaker in the application in order to detect the objects through different training sets.

3. Model Development

In this section, we explain the elements used for the development of the model; in our case, we used satellite pictures, and they were used to train different ML models. Satellite pictures of the Earth, also known as Earth observation imagery, are taken by satellites that orbit our planet [17,18,19,20]. Both government and private entities operate satellites that supply invaluable data for a variety of purposes, such as meteorology, oceanography, urban planning [20], and disaster management. The interpretability of these images is enabled by specialized remote sensing software [18], which is a significant factor.
The resolution of satellite imagery [21,22], which determines visible detail, depends on satellite instrumentation and orbital altitude. The Landsat program has been a base for Earth observation since 1972, providing images with a resolution of 30 m. This resolution is perfect for surveying expansive areas and detecting large-scale environmental changes. Sentinel-1 [23,24] satellites, which are part of the European Union’s Copernicus program, are renowned for their synthetic aperture radar (SAR) instruments. The SAR’s ability to take pictures day or night, regardless of weather, guarantees a steady data stream, which is essential for applications such as disaster monitoring and sea ice tracking. Although it is possible to access low-resolution Google Maps satellite images by date, it is important to create a platform that can accommodate and process all types of images. As mentioned above, Figure 1 shows an example of the images extracted from a given area using the Sentinel-1 satellite of the Copernicus mission, and were analyzed directly from the application. These images were classified according to different models as shown in Table 1.
Table 1 shows the whole elements to create the dataset model. In the first column are the categories, i.e., the data type; in the second column is the use case determined for the ship detection model; in the third column is the use case determined for the aircraft detection model; and in the last column is the use case determined for the container detection model.
We now explain step-by-step how we performed the training process for each of the elements shown in Table 1. These steps are as follows:
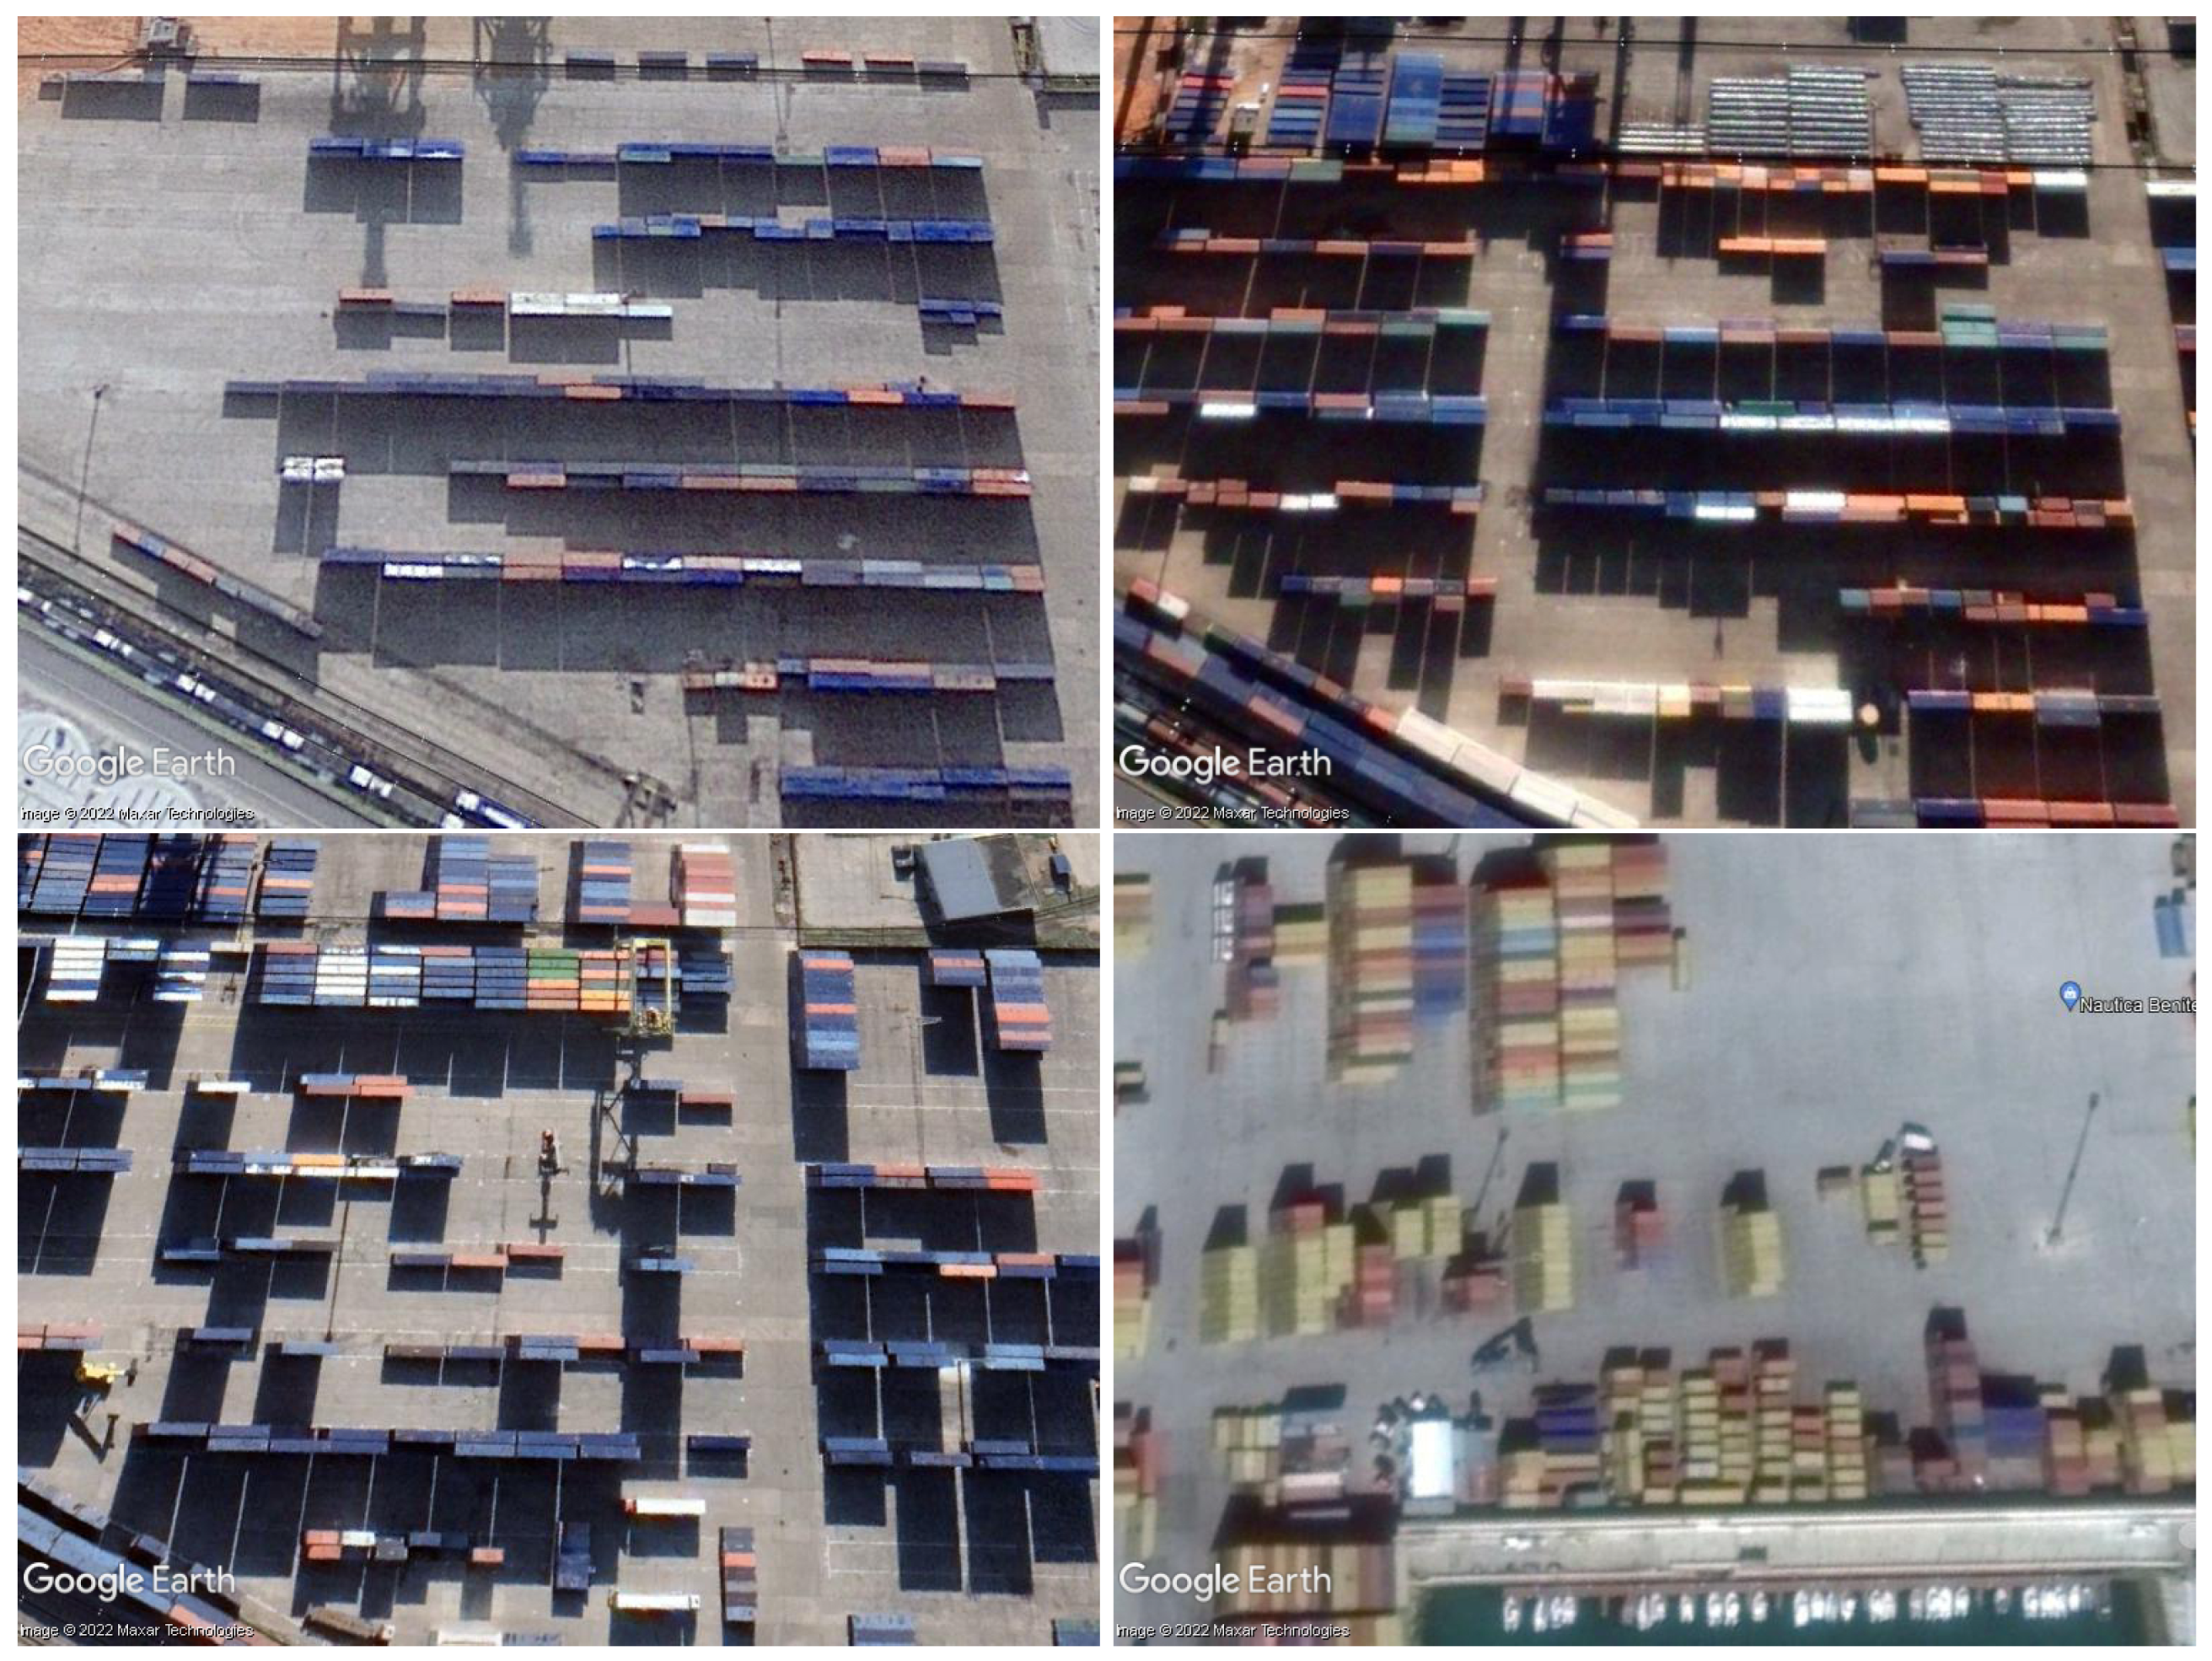
  • Labeling images: We labeled 400 images to create a comprehensive dataset that captures the details of our target objects. This dataset was the basis for training the model to accurately identify and locate shipping containers in different port settings. These images were classified in a repository called Roboflow (Link to the platform accesed on 1 March 2023: https://roboflow.com/) and then trained in Google Colab.
  • Setting up the repository: We cloned the repository in the Google Colab platform in order to be able to train it. This repository includes a wide range of scripts and files necessary for training and assessing the YOLOvX model (X being a custom YOLO model beginning with 5). After cloning, we set up the required dependencies, with a special focus on the Roboflow library.
  • Coordination of SageMaker for conducting training: Without moving from Google Colab, we used tools that could communicate with AWS services, in this case SageMaker, so that the training could be performed in a more optimal way. This tool then moved to both the architecture and the final web platform.
  • Model training deployment: We executed the training script, specifying various parameters such as image size, batch size, epoch count, and configuration files for data and initial weights. This last part was implemented in the web platform in such a way that by clicking a button and selecting the type of item to be detected and a specific calendar, the platform displayed the detected elements as a final result.

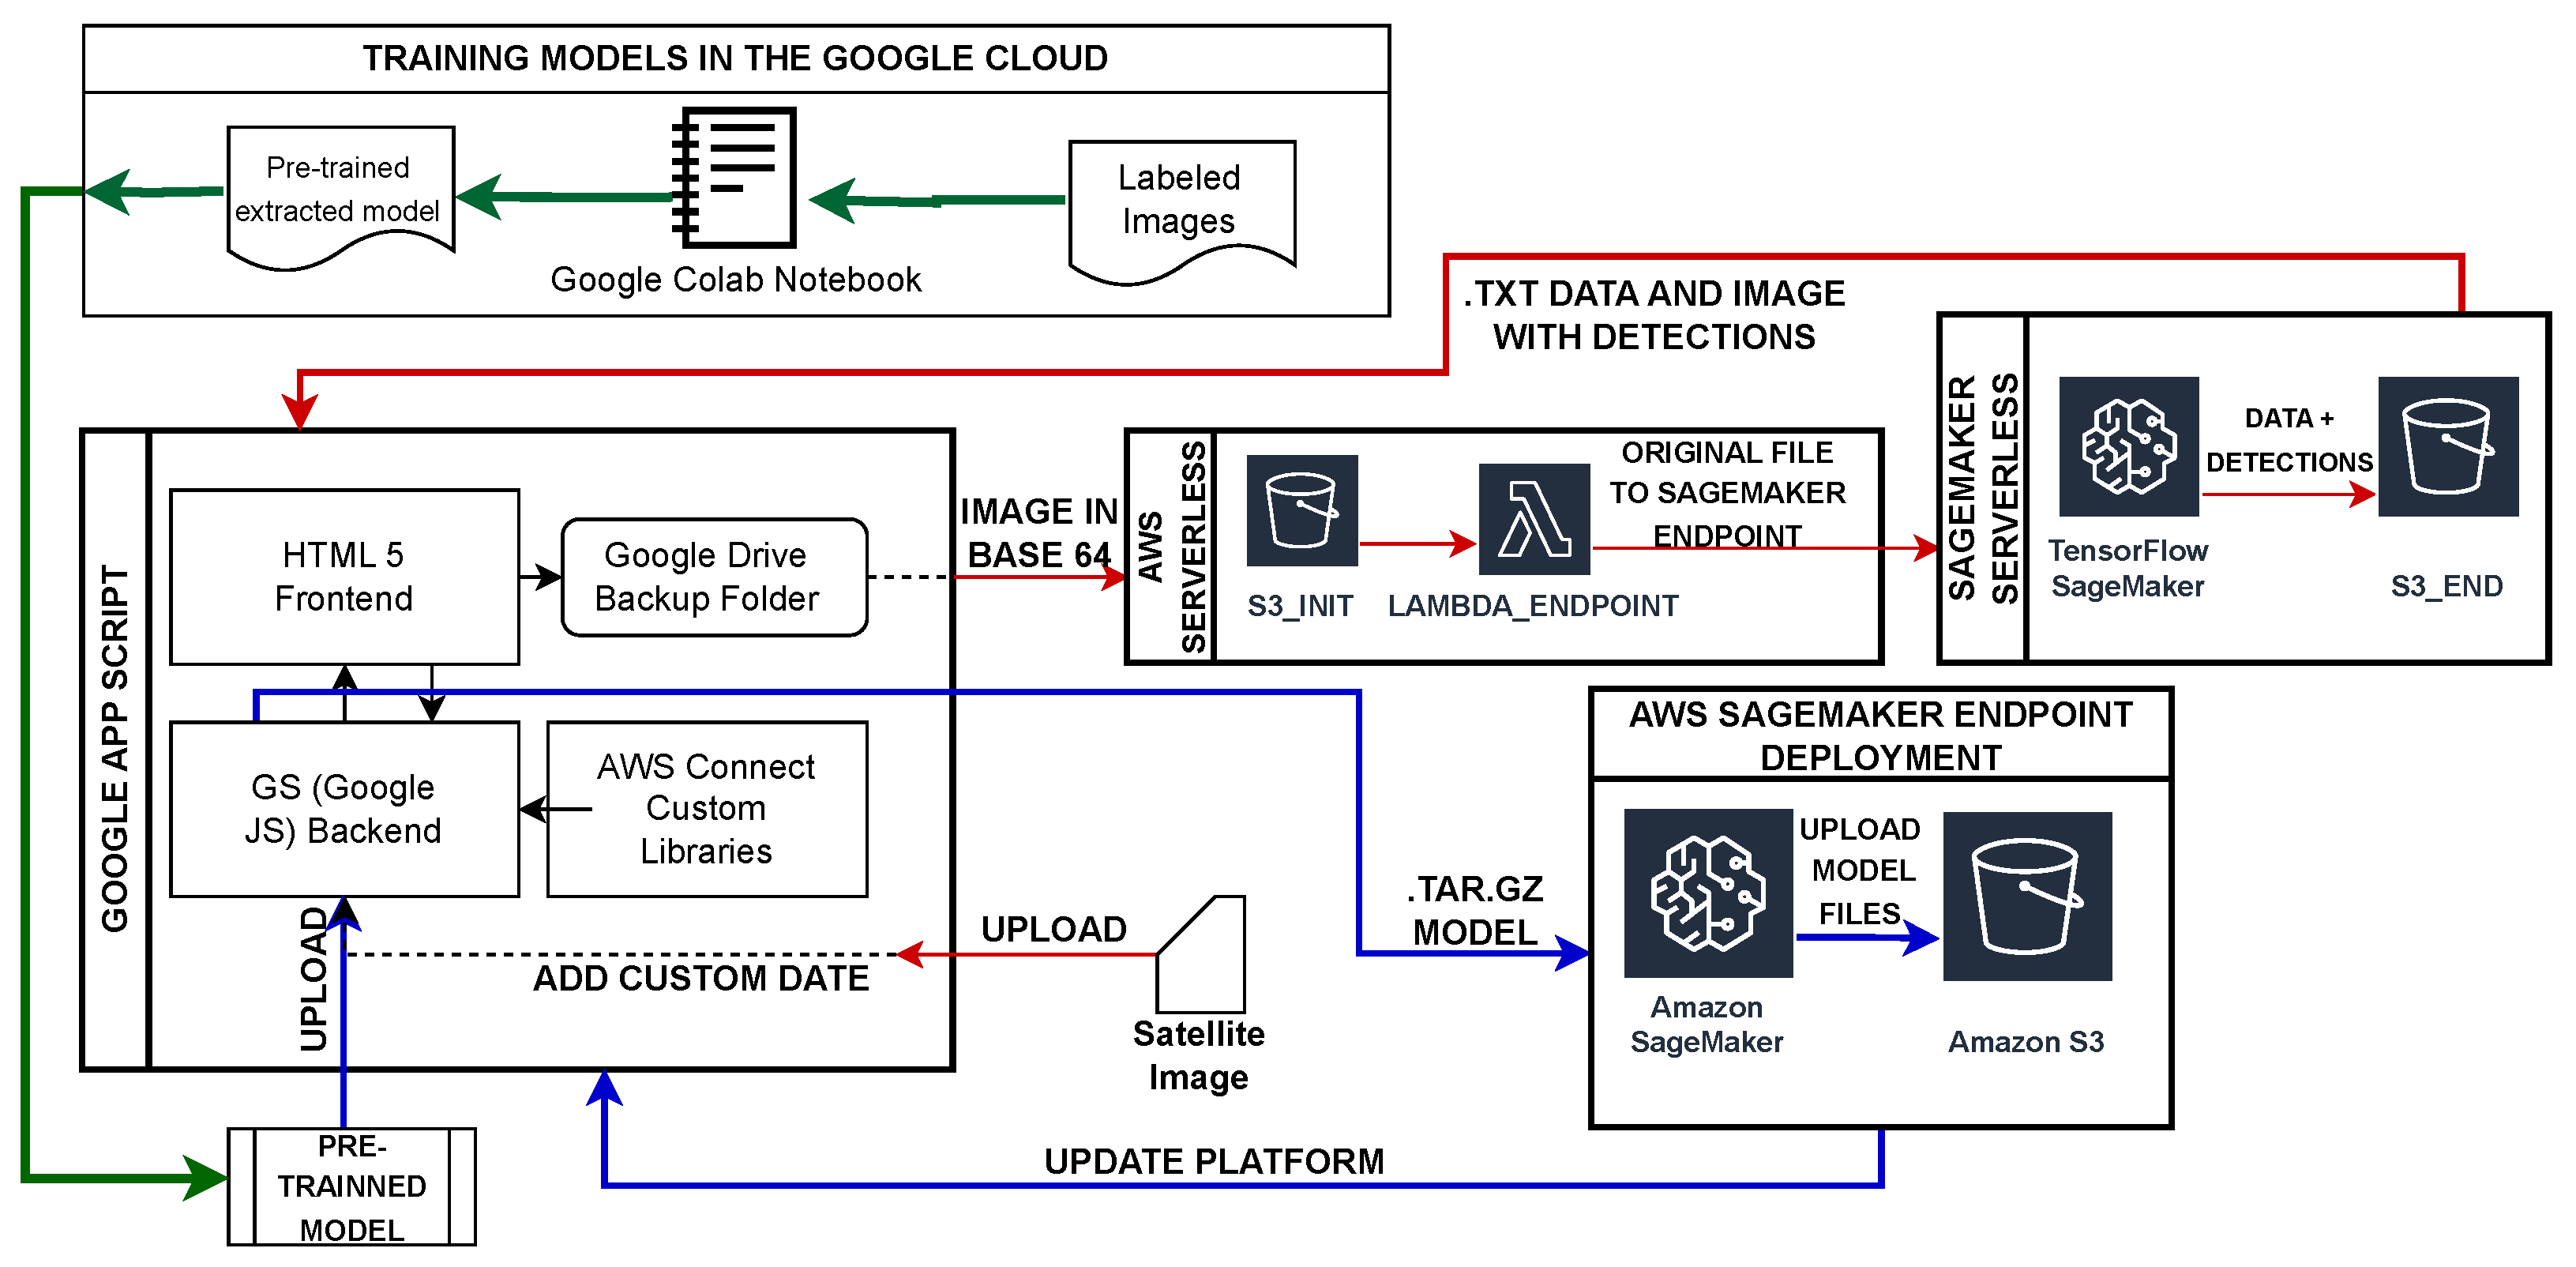
4. Serverless Architecture
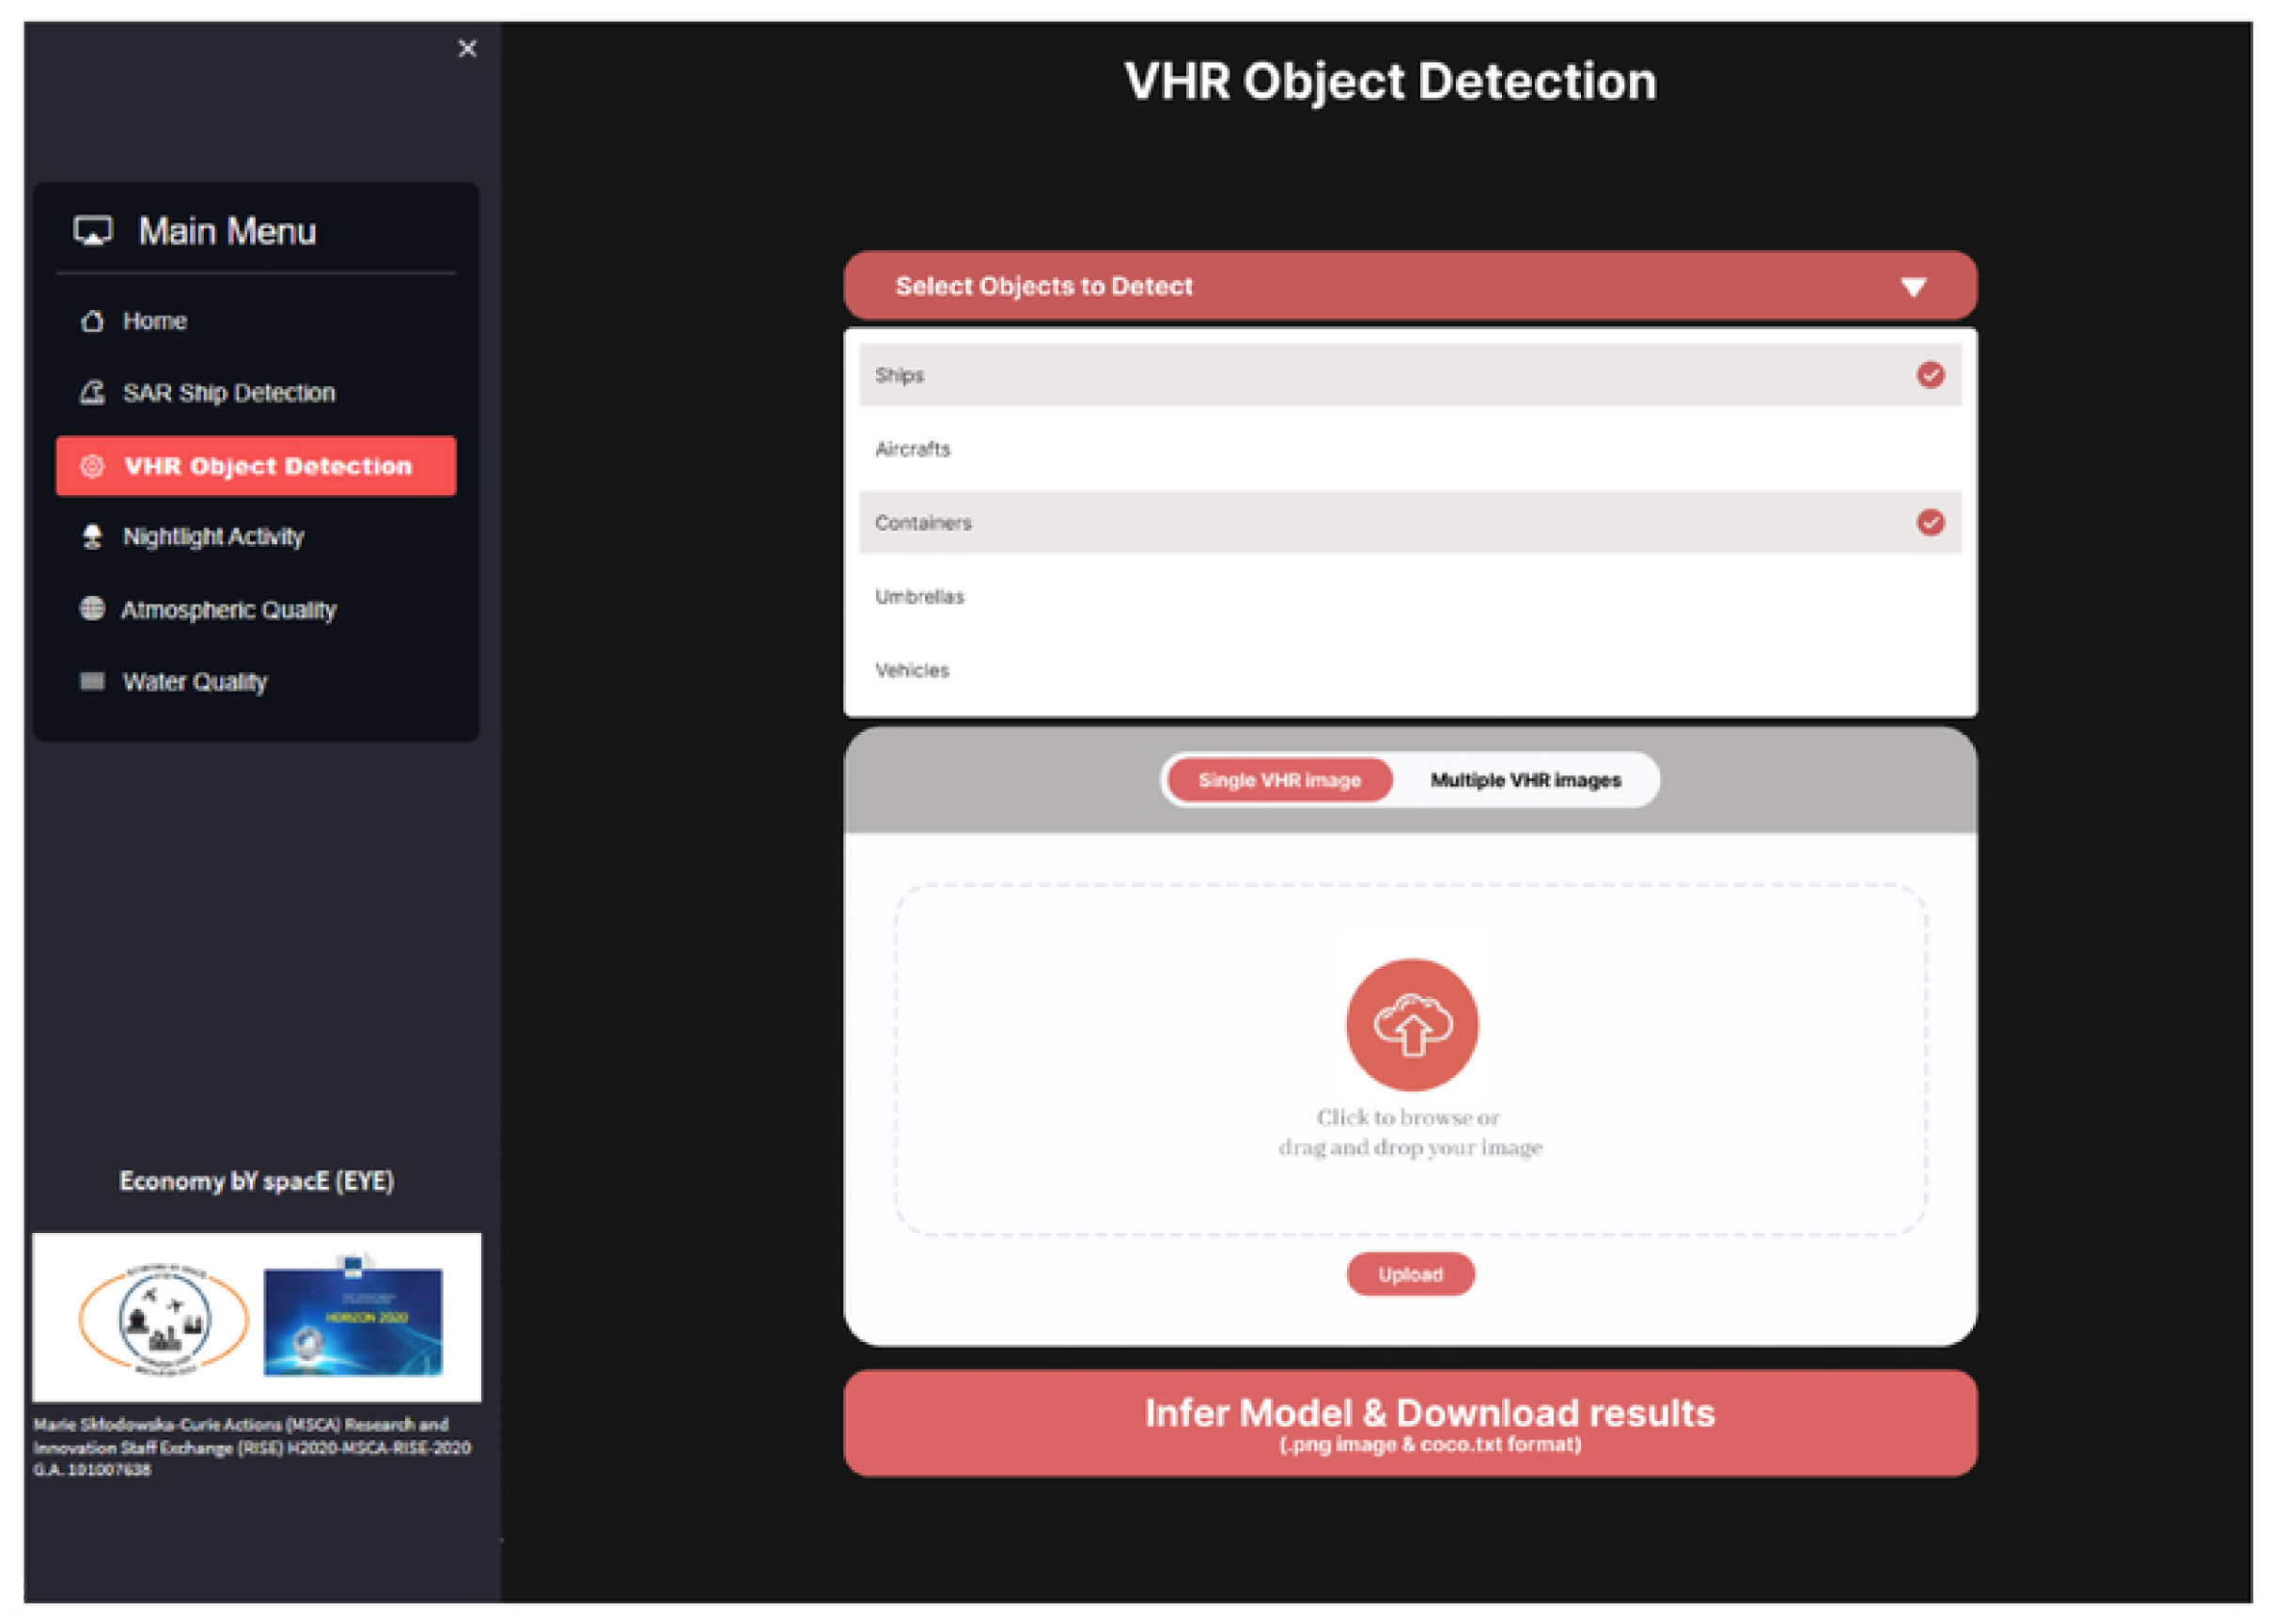
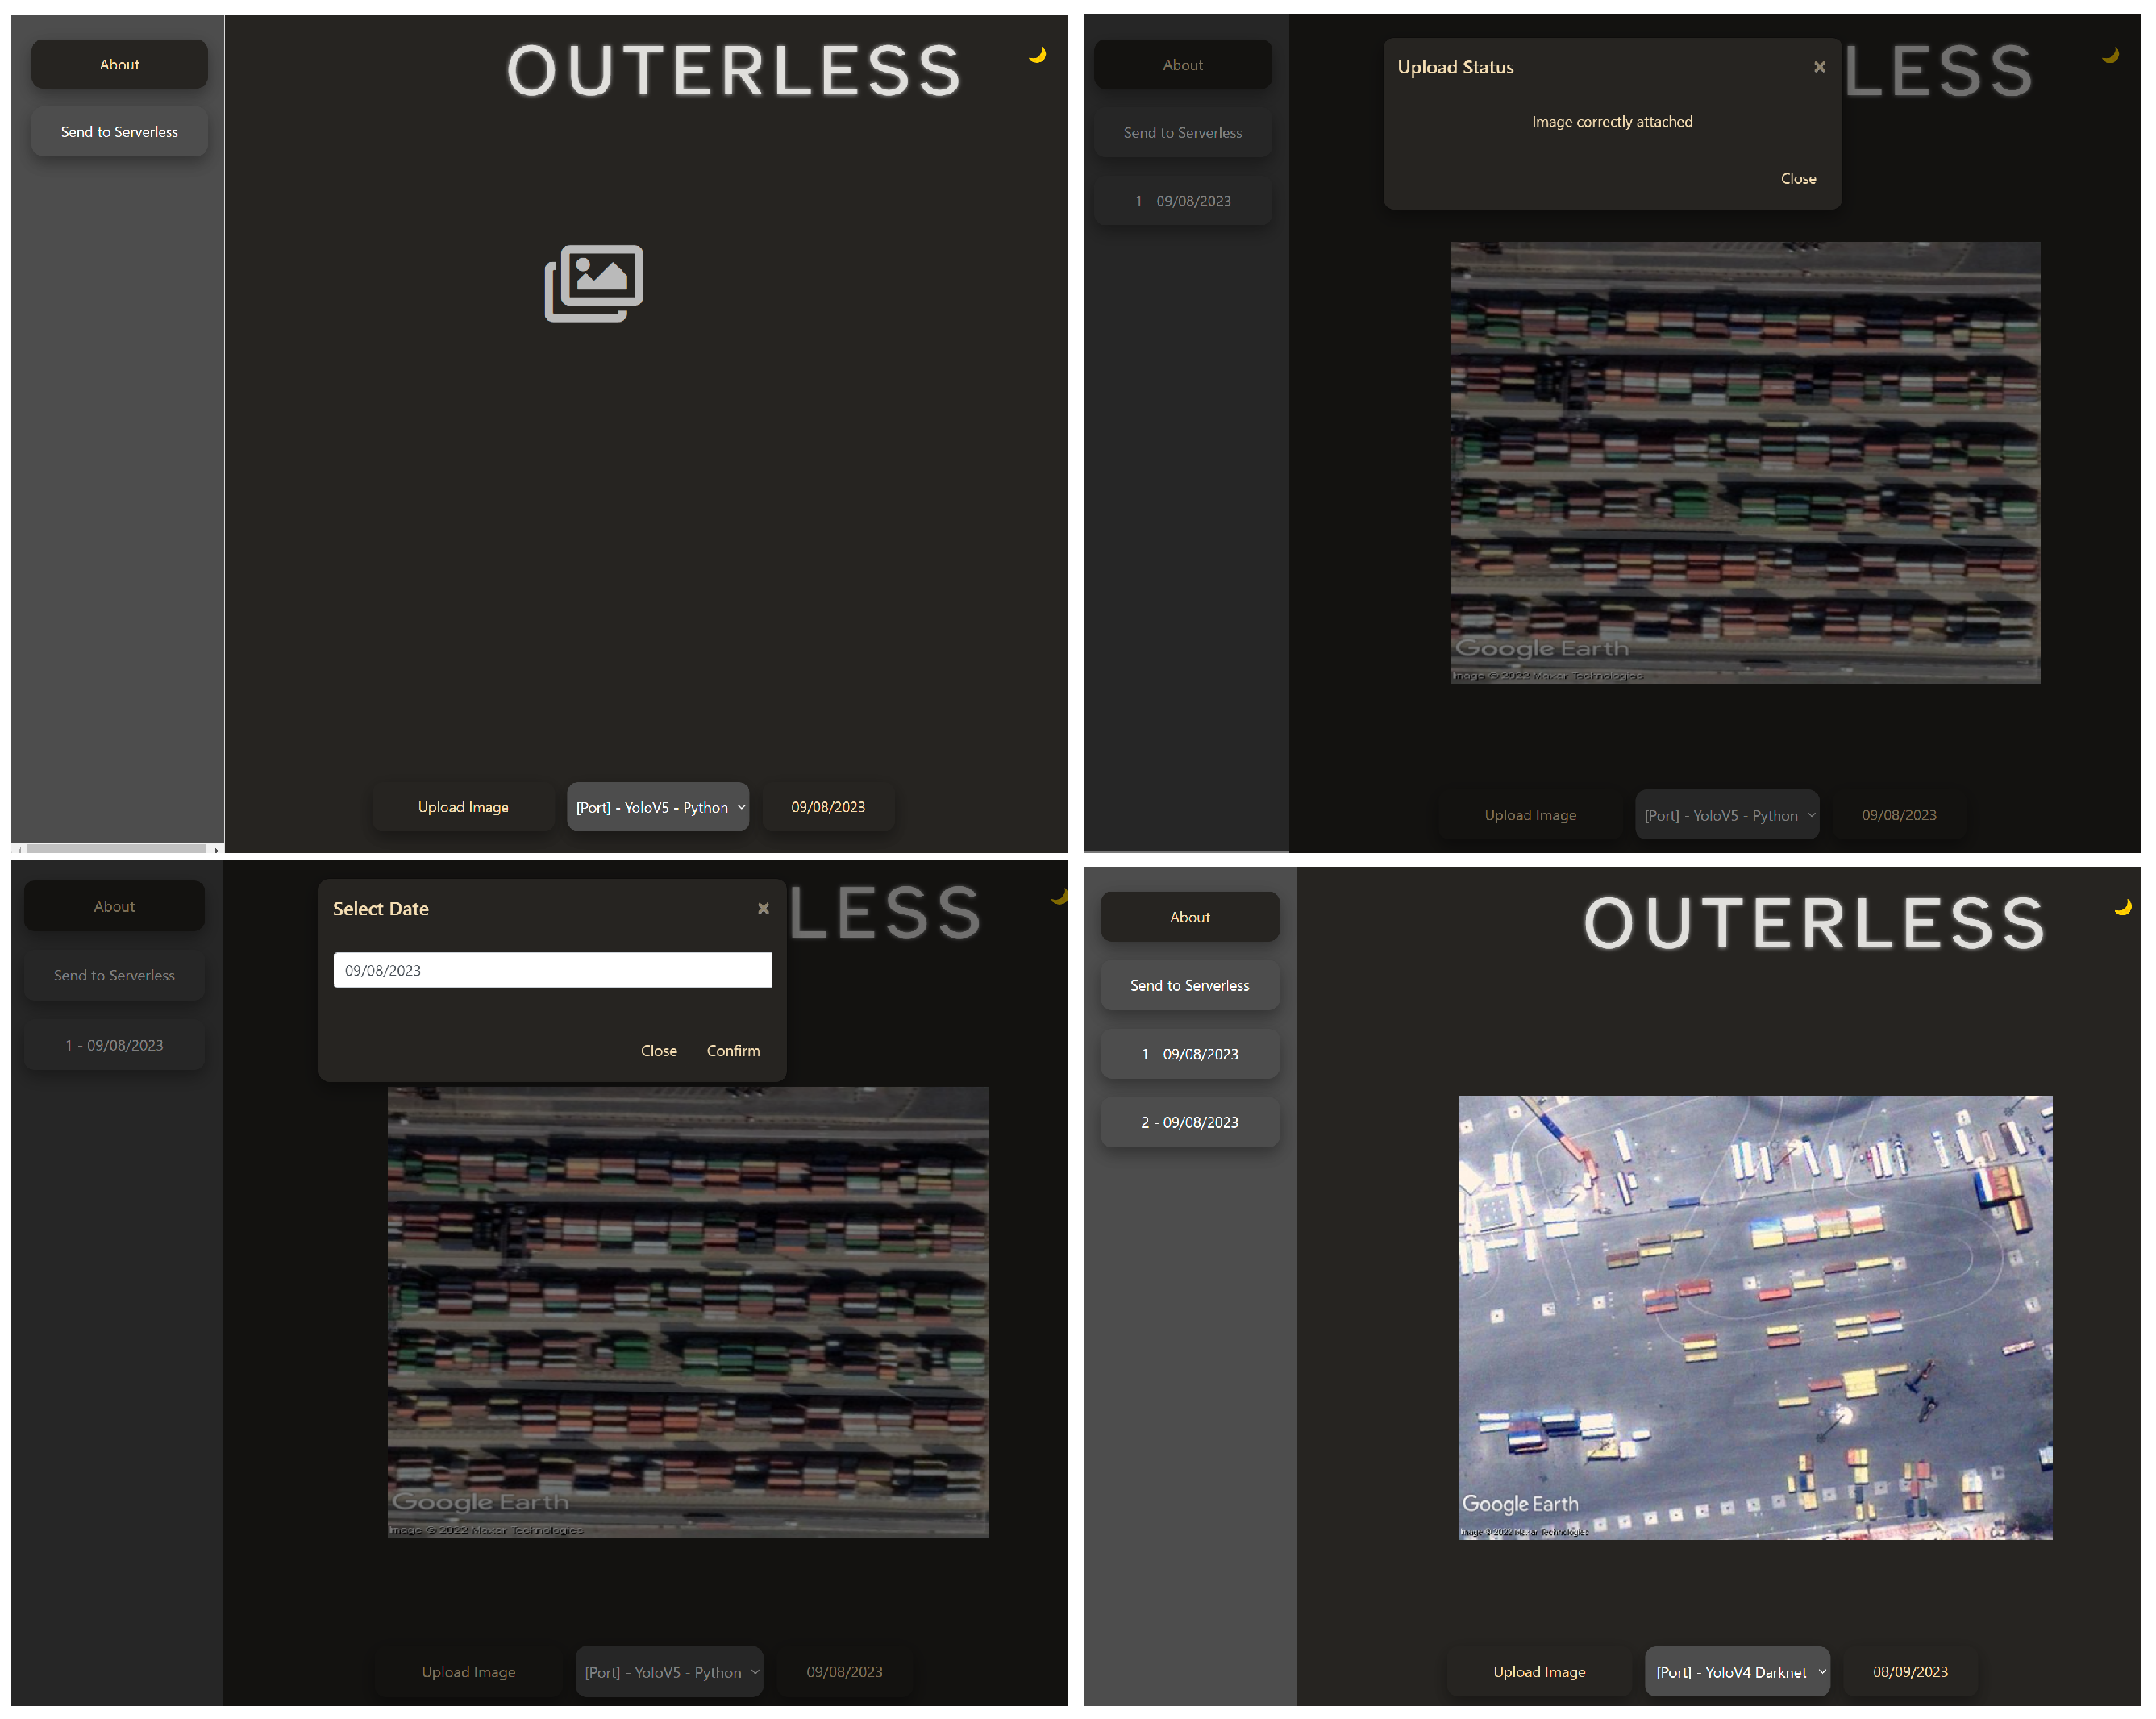
In this section, we explain how the architecture works. To do this, we divide the application into different parts and explain which functions are provided in each of them. The primary objective of this architecture is to create a modular cloud platform on demand for the simple deployment of satellite spatial element detection models, as illustrated in Figure 2. The EyE project, which serves as a key case study for this experiment, demonstrates the application of these technologies to identify and assess land-based occurrences associated with COVID-19 using satellite technology. Our main goal is that this multi-cloud and multi-platform architecture could be replicated or used in different applications.
Figure 2 shows how the architecture used in the platform works. First, we see three different paths based on the colors of the line: the green is used for pre-trained models from Google Colab and the red is used from satellite images.
The first path is green and is determined by a training set in Google Colab. For this case, the training is performed in the Google Colab platform, and then the file obtained from this training is uploaded so that the application performs the classification of the images using this model. It is coordinated with SageMaker through a backend in the Google App Script platform. SageMaker then performs the training and deposits the result in S3 in such a way that the user can download it from the same application.
The second path is the red one where it is determined what happens if a user uploads a satellite image directly to the platform. Users can select a specific date using the calendar feature and then upload the corresponding image file. This file is assigned a unique ID for tracking and backup purposes. Subsequently, it is converted into a text string format and processed through our custom-built serverless libraries. This setup enables the simultaneous processing of all images using the specific endpoints selected in the Google Apps Script (GAS) application. The system determines the appropriate model for each image, reconstructs the original image, and forwards both the image and its data from AWS S3 to a TensorFlow model hosted on Amazon SageMaker for detailed detection analysis. The results of this analysis are then compiled into an a.txt file and a visual representation of the detected elements. These results are stored back in an AWS S3 bucket and subsequently relayed to our GAS application where they are preserved in Google Drive for easy access and reference.

5. Application

For the development of the web application, the idea was to create an application with a simple interface that would operate with cross-cloud platforms. The use of multiple cloud platforms through cross-cloud integration can improve the efficiency and cost-effectiveness of large data projects [25]. For the development of this multi-cloud application, we used Google App Script. Google Apps Script [26,27,28] is a cloud-based scripting language within the Google Workspace suite that enables the development of web-based applications. This platform offers a wide range of capabilities, including task automation, data integration, and custom application development, all without the need for server management due to its serverless architecture. We took advantage of these functionalities to generate an application that is connected to Amazon Web Service with Lambda functions and with the ML part through SageMaker.
Figure 3 shows the main interface of the application where the following elements can be seen: drop-down of the object to be detected (airplanes, ships, and containers can be detected), if it is necessary to upload a previous training set, and a button to perform the upload directly.
The application is built on of JavaScript-compatible files designed specifically for Google’s environment, housing essential functions and scripts that drive the application. From the designed application environment, we can highlight the following functionalities:
  • Web Interface Presentation: We employed JavaScript functions to create an HTML template that can be modified in regard to parameters like title and display mode. This provides a convenient and adjustable user interface.
  • Image Upload to Google Drive: We created a function that makes it easier to upload images to Google Drive. This function takes care of base64-encoded data and file names, transforming the data, creating blobs, and uploading the files to a specific Google Drive folder.
  • Interaction with AWS S3: A particular function is devoted to dealing with interactions with an S3 instance on AWS. This function securely uploads pictures to a designated bucket on AWS S3, goes through files in a Google Drive folder, transforms JPEG images to base64 format, and transfers them to the S3 bucket.
  • Calendar and Image Handling Scripts: These scripts are essential for controlling calendar and image processing capabilities. They start and run the calendar component, manage the image upload feature, enable dynamic theme transformation, and interact with AWS S3 for secure image uploads.
  • Deployment of Custom Pre-Trained Model: We integrated a button within the web interface that triggers the deployment of a custom pre-trained model packaged as a .tar.gz file. This button initiates a script that uploads the model file to a designated storage solution, unpacks the contents, and sets up a new endpoint in Amazon SageMaker.
In addition to these functionalities, we added the following features:
  • Establishing the Web Interface: We selected Google App Script due to its compatibility with Google services as well as other services.
  • Ensure Secure Data Transfer and Authentication: The custom library begins the integration process by creating a tailored request to AWS S3, taking into account the kind of operation and the type of content. This system creates a URL tailored to the particular task, guaranteeing precise and secure data transmission. To maintain security, the library generates authorization headers, authenticating each request to AWS S3 using our AWS credentials combined with additional parameters. This process creates a unique signature for each request, protecting our operations in the S3 storage.
Figure 4 presents various elements of the web interface, including image upload options and integration with AWS S3, illustrating the seamless integration and user-friendly design of the platform. In each of the images, you can see how each of the different services is coordinated in order to detect one of the elements, in this case the containers.
Figure 5 shows what the web interface looks like before and after detection. The image on the left shows how the user sees when the image is uploaded directly to the platform and the image on the right shows the image with the detected containers on the same platform.

6. Methodology

In this section, we explain the methodology developed for the calculation of metrics in the detection of objects in the case of ML and the calculation of platform costs in different services.
For the case of the ML predictive models used, we calculated the accuracy, which is the proportion of correct classifications, either false or positive, within the 400-image dataset. The accuracy formula we used is as follows:
Accurancy = TP + TN TP + TN + FP + FN
Equation (1) shows the accuracy, where TP is true positive, TF is false detection, FP is false positive, and FN is true negative. A perfect model would have no false positives and no false negatives and, therefore, would have an accuracy of 1.0 or 100%. Thus, we determined the accuracy of each of the ML algorithms applied in the application.
On the other hand, we determined the costs (Update costs from consuled on 28 November 2023: https://aws.amazon.com/es/lambda/pricing) of the multi-cloud platform created and compared them with similar services. We included detailed cost calculations based on AWS pricing for the North Virginia region. For AWS Lambda, the cost was determined by two main factors: the number of requests and the duration of code execution. We assumed that each batch processed contained 1000 images. For this calculation, we took into account the following requirements:
  • The number of requests (n) per million, with a cost of USD 0.2 per million requests.
  • Average memory allocation (503 MB out of 1024 MB) multiplied by execution duration (15 min).
  • The cost per GB-second is valued at 0.00001667.
On the other hand, we calculated the cost of SageMaker in dollars determined in the same region. The following parameters were taken into account:
  • The number of batches processed (n).
  • The average processing time in seconds per batch (8 s).
  • The hourly rate (USD 0.28) of the ml.m4.xlarge instance, converted to a per-second rate.

7. Results and Discussion

7.1. Counting Elements

Table 2 shows the accuracy results when detecting aircraft, ships, and containers. It can be seen that all the models have a very high accuracy, around 100%, from which it could be concluded that these models detect the elements of each of the images.

7.2. Cost

Table 3 shows the cost of different applications in different systems. As can be seen, the cost of the proposed application is lower compared to other similar services. By integrating multiple services within the same platform and having them not being triggered until they are needed, costs are reduced. All other services compared in this table are for the same number of images.
The developed system shows an economical approach to large-scale image analysis. Detailed metrics were derived using AWS CloudWatch, providing insight into the system’s operations. The system architecture is designed to balance latency and cost-effectiveness, demonstrating the viability of our approach in the context of large-scale, complex data processing tasks.

8. Conclusions and Future Work

In this comprehensive exploration, we dived into the integration of AWS Lambda, Amazon SageMaker, and Google Apps Script, showcasing a seamless blend of cost efficiency, computational power, and architectural resilience.
From an economic standpoint, our approach capitalizes on the affordability of AWS, effectively managing expenses through a strategic combination of Lambda for resource allocation and SageMaker for advanced machine learning tasks. This proves to be especially beneficial when dealing with large datasets, ensuring that costs remain under control. Furthermore, the use of Google Apps Script, which is free of charge for our usage, adds to the economic benefits of our platform.
On the computational front, the collaboration between Lambda and SageMaker results in a robust and scalable solution for complex image analysis tasks. Lambda efficiently handles invocations and resource distribution, while SageMaker brings its machine learning expertise to the table, together forming a powerful platform for our needs.
The integration of Google Apps Script with AWS in a cross-cloud architecture is a key aspect of our system, providing not only economic advantages, but also enhanced resilience. This setup allows us to invoke AWS services without additional costs, while also offering the flexibility to switch between platforms as the project requirements change, highlighting the strategic value of our cross-cloud approach.
Looking ahead, the future of our project is filled with potential for innovation and growth. As we integrate machine learning models from all project partners, we are also exploring the possibility of adding edge computing features. Although this represents a shift from traditional cloud computing and serverless architectures, the idea of a serverless version is appealing, pending a positive evaluation of parallelization and resource management.
The success of these future developments depends on the smooth integration of machine learning models by our partners and thorough data analysis. As we collect more data on dates and detection from our serverless function, we plan to create detailed evolution reports. These reports, developed using Lua algorithms and LATEX, will provide insights from economic, epidemiological, and linguistic perspectives. Domain experts will ensure the accuracy and depth of our analyses, and the automation of report generation and integration into our platform and architecture is a primary objective. Our goal is to demonstrate the effectiveness of a cross-cloud environment in addressing complex and interdisciplinary challenges, particularly in the field of object analysis using spatial imagery.

Author Contributions

Data curation: D.P., N.S. and K.S.; formal analysis: D.P., S.I.-C., N.S. and K.S.; funding acquisition: N.S., J.L.V.-P., R.M.-V., A.D.I. and L.V.; investigation: D.P., S.I.-C., J.L.V.-P., R.M.-V., N.S., K.S., A.D.I. and L.V.; project administration: N.S., J.L.V.-P., A.D.I. and L.V.; resources: N.S., K.S., A.D.I. and L.V.; software: D.P., S.I.-C., N.S. and K.S.; supervision: N.S., J.L.V.-P., A.D.I. and L.V.; validation: J.J.G.-S. and L.V.; visualization: D.P., S.I.-C., N.S. and K.S.; writing-original draft: D.P., S.I.-C., N.S. and K.S.; writing-review & editing: J.L.V.-P., R.M.-V., A.D.I., J.J.G.-S. and L.V. All authors have read and agreed to the published version of the manuscript.

Funding

This project received funding from the European Union’s Horizon 2020 research and innovation program under Marie Skodowska-Curie grant, agreement No.101007638 (EyE-Economy bY spacE). This research was supported by the Complutense University of Madrid through the research grant PR12/24-31574.

Institutional Review Board Statement

Not applicable’ for studies not involving humans or animals.

Informed Consent Statement

Not applicable.

Data Availability Statement

Pacios Izquierdo, David (2023). EyE-AWS-Google Cloud-Based Cross-Cloud Platform for Satellite Image Detection. figshare. Software. https://doi.org/10.6084/m9.figshare.24915456.v1.

Conflicts of Interest

Nikolaos Schetakis, Konstantinos Stavrakakis and Alessio Di Iorio was employed by the company ALMA Sistemi Srl, Nikolaos Schetakis was employed by the company Quantum Innovation Pc. The remaining authors declare that the research was conducted in the absence of any commercial or financial relationships that could be construed as a potential conflict of interest.

References

  1. McCloskey, B.; Zumla, A.; Ippolito, G.; Blumberg, L.; Arbon, P.; Cicero, A.; Endericks, T.; Lim, P.L.; Borodina, M. Mass gathering events and reducing further global spread of COVID-19: A political and public health dilemma. Lancet 2020, 395, 1096–1099. [Google Scholar] [CrossRef] [PubMed]
  2. Jutz, S.; Milagro-Perez, M.P. Copernicus: The european earth observation programme. Rev. Teledetección 2020, V–XI. [Google Scholar] [CrossRef]
  3. Derollez, R.; Petitdemange, R.; Brémond, L. Building Space Infrastructure as a Service: An Automated Planning and Scheduling System for a Heterogeneous Spacecraft Constellation. In Proceedings of the International Conference on Space Operations, Montreal, QC, Canada, 26–30 May 2025; Springer: Berlin/Heidelberg, Germany, 2025; pp. 311–337. [Google Scholar]
  4. Gupta, H. AWS Lambda and SageMaker: Real-Time Solutions for Machine Learning. Int. J. Adv. Res. Sci. Commun. Technol. 2025, 5, 517–522. [Google Scholar] [CrossRef]
  5. Petrović, N.; Roblek, V.; Radenković, M.; Nejković, V. Approach to rapid development of data-driven applications for smart cities using appsheet and apps script. In Proceedings of the AIIT 2020 International conference on Applied Internet and Information Technologies, Zrenjanin, Serbia, 16 October 2020; pp. 77–81. [Google Scholar]
  6. Pacios, D.; Vazquez-Poletti, J.L.; Sánchez-Cano, B.; Moreno-Vozmediano, R.; Schetakis, N.; Vazquez, L.; Titov, D.V. Serverless Architecture for Data Processing and Detecting Anomalies with the Mars Express MARSIS Instrument. Astron. J. 2023, 166, 19. [Google Scholar] [CrossRef]
  7. Wang, Z.; Goudarzi, M.; Buyya, R. TF-DDRL: A Transformer-enhanced Distributed DRL Technique for Scheduling IoT Applications in Edge and Cloud Computing Environments. IEEE Trans. Serv. Comput. 2025, 55, 1–41. [Google Scholar] [CrossRef]
  8. Iacono, L.E.; Pacios, D.; Vazquez-Poletti, J.L. SNDVI: A new scalable serverless framework to compute NDVI. Front. High Perform. Comput. 2023, 1, 1151530. [Google Scholar] [CrossRef]
  9. Iacono, L.E.; Poletti, J.L.V.; Garino, C.G.; Llorente, I.M. Performance models for frost prediction in public cloud infrastructures. Comput. Inform. 2018, 37, 815–837. [Google Scholar] [CrossRef]
  10. Zhang, J.; Huang, Y.; Pu, R.; Gonzalez-Moreno, P.; Yuan, L.; Wu, K.; Huang, W. Monitoring plant diseases and pests through remote sensing technology: A review. Comput. Electron. Agric. 2019, 165, 104943. [Google Scholar] [CrossRef]
  11. Stavrakakis, K.; Pacios, D.; Papoutsakis, N.; Schetakis, N.; Bonfini, P.; Papakosmas, T.; Charalampopoulou, B.; Vázquez-Poletti, J.L.; Di Iorio, A. EYE-Sense: Empowering remote sensing with machine learning for socio-economic analysis. In Proceedings of the Ninth International Conference on Remote Sensing and Geoinformation of the Environment (RSCy2023), Ayia Napa, Cyprus, 3–5 April 2023; Volume 12786, pp. 100–117. [Google Scholar]
  12. Rajesh, S.C.; Goel, L. Architecting Distributed Systems for Real-Time Data Processing in Multi-Cloud Environments. Int. J. Emerg. Technol. Innov. Res. 2025, 12, b623–b640. [Google Scholar]
  13. Singh, A.; Aggarwal, A. Enhancing Security: Vulnerability Detection and Monitoring in Microservices within Multi-Cloud Environments Utilizing Sysdig. PriMera Sci. Eng. 2025, 6. [Google Scholar] [CrossRef]
  14. Linden, J.v.d.; Wang, X.; Forsström, S.; Zhang, T. Productify news article classification model with sagemaker. Adv. Sci. Technol. Eng. Syst. J. 2020, 5, 13–18. [Google Scholar] [CrossRef]
  15. Shergadwala, M.; Lakkaraju, H.; Kenthapadi, K. A human-centric perspective on model monitoring. Proc. AAAI Conf. Hum. Comput. Crowdsourcing 2022, 10, 173–183. [Google Scholar] [CrossRef]
  16. Chougule, N.S.; Awati, C.J.; Deshmukh, R. Using AWS SageMaker to Deploy ML Credit Card Fraud Detection Model. In Proceedings of the 2024 5th International Conference on Mobile Computing and Sustainable Informatics (ICMCSI), Lalitpur, Nepal, 18–19 January 2024; IEEE: Piscataway, NJ, USA, 2024; pp. 150–156. [Google Scholar]
  17. Zhu, X.; Tang, X.; Zhang, G.; Liu, B.; Hu, W. Accuracy comparison and assessment of dsm derived from gfdm satellite and gf-7 satellite imagery. Remote Sens. 2021, 13, 4791. [Google Scholar] [CrossRef]
  18. Khaliq, A.; Comba, L.; Biglia, A.; Aimonino, D.R.; Chiaberge, M.; Gay, P. Comparison of satellite and uav-based multispectral imagery for vineyard variability assessment. Remote Sens. 2019, 11, 436. [Google Scholar] [CrossRef]
  19. Ghuffar, S. Dem generation from multi satellite planetscope imagery. Remote Sens. 2018, 10, 1462. [Google Scholar] [CrossRef]
  20. Kamiya, K.; Fuse, T.; Takahashi, M. Applicability evaluation of object detection method to satellite and aerial imageries. Int. Arch. Photogramm. Remote Sens. Spat. Inf. Sci. 2016, XLI-B7, 229–234. [Google Scholar] [CrossRef]
  21. Coffer, M.M.; Whitman, P.J.; Schaeffer, B.A.; Hill, V.; Zimmerman, R.C.; Salls, W.; Lebrasse, M.C.; Graybill, D.D. Vertical artifacts in high-resolution worldview-2 and worldview-3 satellite imagery of aquatic systems. Int. J. Remote. Sens. 2022, 43, 1199–1225. [Google Scholar] [CrossRef] [PubMed]
  22. Zhang, T.; Hu, S.; He, Y.; You, S.; Yang, X.; You-min, G.; Liu, A. A fine-scale mangrove map of china derived from 2-meter resolution satellite observations and field data. ISPRS Int. J. Geo-Inf. 2021, 10, 92. [Google Scholar] [CrossRef]
  23. Strozzi, T.; Antonova, S.; Günther, F.; Mätzler, E.; Vieira, G.; Wegmüller, U.; Westermann, S.; Bartsch, A. Sentinel-1 sar interferometry for surface deformation monitoring in low-land permafrost areas. Remote Sens. 2018, 10, 1360. [Google Scholar] [CrossRef]
  24. Derkacheva, A.; Mouginot, J.; Millan, R.; Maier, N.; Gillet-Chaulet, F. Data reduction using statistical and regression approaches for ice velocity derived by landsat-8, sentinel-1 and sentinel-2. Remote Sens. 2020, 12, 1935. [Google Scholar] [CrossRef]
  25. Gangwar, H.; Date, H.; Ramaswamy, R. Understanding determinants of cloud computing adoption using an integrated tam-toe model. J. Enterp. Inf. Manag. 2015, 28, 107–130. [Google Scholar] [CrossRef]
  26. Suyatna, E.T.K. Pengembangan aplikasi web google script sebagai instrumen assesment. J. Didakt. Pendidik. Dasar 2022, 6, 997–1016. [Google Scholar] [CrossRef]
  27. Baptista, L. Using python and google colab to teach physical chemistry during pandemic. ChemRxiv 2021. [Google Scholar] [CrossRef]
  28. Papilaya, P.P.E. Aplikasi google earth engine dalam menyediakan citra satelit sumberbedaya alam bebas awan. Makila 2022, 16, 96–103. [Google Scholar] [CrossRef]
Figure 1. Example images processed in the EyE project: (top left) Cádiz 2011, (top right) Cádiz 2015, (bottom left) Cádiz 2018, and (bottom right) Cádiz 2016.
Information 16 00381 g001
Figure 2. Overview of a cross-cloud architecture for satellite machine learning workflow. This schematic illustrates an integrated approach to training machine learning models that utilize Google Cloud and AWS services. Pre-trained models are extracted and further refined with labeled images in the Google Cloud environment, with Google Script (GS) providing back-end support and HTML5 for the front-end interface. Model backups are stored on Google Drive. AWS services facilitate endpoint deployment, where the refined model is deployed using Amazon SageMaker, and data flow is managed between AWS S3 buckets. TensorFlow coordinates between SageMaker and S3 storage, handling initial data setup (S3_INIT) and concluding data transactions (S3_END). This architecture provides a multi-platform training.
Information 16 00381 g002
Figure 3. Web platform interface where you can see the image upload button directly from the satellite or upload a previously trained model.
Information 16 00381 g003
Figure 4. Screenshots showcasing the user interface, calendar functionalities, image upload options, and integration with AWS S3, as part of the web platform developed using Google Apps Script.
Information 16 00381 g004
Figure 5. On the left you can see an image uploaded directly to the platform to perform the detection. On the other side on the right is the same image with the number of containers detected.
Information 16 00381 g005
Table 1. Categorization of all the elements used for the development of each of the models. Each of the detected elements has its own output data, its own model, and its own output data. These models can be selected on the developed web platform.
CategoryShip DetectionAircraft DetectionContainer Detection
InputArea of interest, datesVHR ImageVHR Image
OutputTime series of detected shipsDetected objects in image, .txt fileDetected objects in image, .txt file
EnvironmentPython, SentinelapiPython, OBBDetectionpytorch (Python)
ModelsYOLOv5, Faster-RCNNFaster-RCNNYOLOv5-7
ProductNumber of shipsNumber of aircraftNumber of containers
SatelliteSentinel-1/2, VHR (Planet)VHR (Planet)VHR (Worldview-3, Planet)
InstrumentSAR-C/Sentinel-1, MSIMSIMSI
Spatial Resolution9 m × 9 m (S-1), 10 m × 10 m (S-2)(0.8–1.5) m(0.8–1.5) m, 10 m × 10 m (S-2)
Temporal3–5 days (S-1), 1–10 days (S-2)On requestOn request, 1–10 days (S-2)
File Size800 MB (S-1), 600–700 MB (S-2)100 MB600–700 MB (S-2), 100 MB
DatabaseGoogle Earth Engine, third-partyCreodias, Google Earth EngineCreodias, Google Earth Engine
Table 2. Accuracy calculated for each of the elements detected in the application.
ObjectModelAccuracy
AircraftFaster-RCNN99%
ShipFaster-RCNN96%
ContainersYOLOv586%
Table 3. Cost analysis for AWS services.
ServiceCost per 1000 Images (Dollars)
ApplicationUSD 0.8056
Lambda with S3 and EFS storageUSD 1.3456
EC2 instance with S3 storageUSD 1.544
Lambda without S3 storageUSD 0.1956
Azure5USD 158
Storm6USD 351
DreamHost5USD 106
Disclaimer/Publisher’s Note: The statements, opinions and data contained in all publications are solely those of the individual author(s) and contributor(s) and not of MDPI and/or the editor(s). MDPI and/or the editor(s) disclaim responsibility for any injury to people or property resulting from any ideas, methods, instructions or products referred to in the content.

