Article

Improved U-Net for Precise Gauge Dial Segmentation in Substation Inspection Systems: A Study on Enhancing Accuracy and Robustness

by
Wan Zou
1,
Yiping Jiang
1,
Wenlong Liao
2,*,
Songhai Fan
2,
Yueping Yang
2,
Jin Hou
3 and
Hao Tang
3
1
State Grid Sichuan Electric Power Company, Chengdu 610041, China
2
State Grid Sichuan Electric Power Research Institute, Chengdu 610041, China
3
School of Information Science and Technology, Southwest Jiaotong University, Chengdu 611756, China
*
Author to whom correspondence should be addressed.
Information 2025, 16(5), 382; https://doi.org/10.3390/info16050382
Submission received: 21 March 2025 / Revised: 21 April 2025 / Accepted: 30 April 2025 / Published: 3 May 2025

Abstract

:
In practical applications, the clarity of analog dial images is often compromised due to factors such as lighting conditions, leading to low precision and poor segmentation of dial scales and pointers. This results in segmentation outcomes that fail to meet the real-time requirements of substation inspection systems. To address these challenges, we propose an improved U-Net segmentation algorithm. The key innovation of our approach is the insertion of a layer-hopping connection module between the Encoder and Decoder to capture feature information across multiple scales, enhancing semantic expressiveness and optimizing feature fusion. Additionally, we replace traditional convolution operations with wavelet convolution, which improves the network’s ability to capture low-frequency information, essential for understanding the overall dial structure. An adaptive attention mechanism is also incorporated in the upsampling stage of the network, enabling the model to dynamically focus on salient features, further improving generalization. These improvements enable the network to more accurately detect target regions within dial images, significantly enhancing segmentation accuracy and robustness. Experimental results demonstrate that the proposed method outperforms traditional U-Net models in segmentation tasks, achieving superior precision in segmenting scales and pointers, effectively addressing issues of low precision and poor segmentation, and making it suitable for real-time substation inspection systems.

1. Introduction

In today’s rapidly evolving technological landscape, despite the fact that digital display instruments are more convenient for monitoring compared to analog instruments, it cannot be denied that analog instruments are more stable and less susceptible to interference from environmental factors such as electromagnetic fields. In substations, the data from analog instruments are primarily recorded through regular manual inspections to ensure the normal operation of equipment and various instruments. In recent years, with the integration and development of deep learning technology across various industries, an increasing number of scholars have been dedicated to researching methods for automatically recognizing readings from analog instruments in substations. This is aimed at reducing the inconvenience of manual reading and minimizing errors caused by natural factors such as weather. The first step in recognizing readings is to extract the instrument dial from a complex spatial background. To some extent, locating the dial of an analog instrument in a complex space can be understood as the application of image segmentation technology in the field of instrument recognition. Deep learning holds great potential in automated detection, as it can utilize computer vision techniques to analyze and process images, achieving functions such as recognition, detection, and classification through iterative learning. In contrast, manual meter reading is labor-intensive, inefficient, and prone to errors due to the working conditions of inspectors and complex environments. Automated reading technology based on deep learning is faster, more accurate, and has a lower error rate than manual reading, thus offering significant practical value.
Substations are typically equipped with a large number of pressure gauges, thermometers, and ammeters to monitor the operating conditions of equipment. Staff members need to manually read the meters regularly to check whether the equipment is functioning properly. However, due to the presence of high magnetic fields and high radiation in the substation environment, frequent personnel movement not only easily increases the risk of accidents [1]. At the same time, manual meter reading consumes a lot of manpower and material resources, is inefficient, and is easily affected by the working condition of the patrol personnel and the complex environment, leading to data errors [2]. In recent years, with the rapid development of deep learning technology in the power industry, and with the deployment of high-definition pan-tilt-zoom cameras and inspection robots in substations, a large amount of image data can be obtained. Automatic reading technology based on deep learning is faster, more accurate, and has a lower error rate compared to manual meter reading. Therefore, the adoption of this automated technology has significant practical value.

2. Related Works

In recent years, domestic and international scholars have conducted extensive research on the segmentation of analog instrument dial images. Yang Yaoquan et al. [3] used edge detection on captured dial images to determine the pointers, scale lines, and dial centers, followed by binary processing and the Hough transform to obtain scale and pointer information. However, this method is highly dependent on lighting conditions. Fang Y. X. [4] et al. employed the Mask R-CNN network to detect key points of pointers and scales, but this approach is susceptible to reflection and uneven lighting, leading to significant errors. Wan Jilin et al. [5]. used a Faster R-CNN and an improved U-Net network structure to learn and classify the dial region images, enhancing the segmentation of complete pointer details by adding downsampling processes in the encoding stage to extract depth information. Huang Siyuan et al. [6]. added an attention mechanism to CenterNet, combined with DeepLabv3+, to complete target detection and segmentation tasks for pointers and scales. Jaffery et al. [7]. proposed a dynamic sliding window algorithm that captures regions of interest for image segmentation and designed a line detection algorithm for pointer recognition, achieving good results in terms of real-time performance and robustness. Tunca et al. [8]. proposed a real-time method for monitoring aircraft simulator pointers using the YOLOv4-Tiny network for pointer detection, followed by the GrabCut algorithm for pointer segmentation. Wang et al. [9]. introduced a Mask Scoring Convolutional Neural Network (MSC R-CNN) that more effectively segments pointer and scale regions. The residual learning framework proposed in ResNet [10] has profoundly influenced the development of deep segmentation architectures, including U-Net variants applied to pointer-type gauge image analysis. Hou et al. [11] introduces an effective spatial pooling strategy that captures long-range contextual dependencies, which has proven beneficial in dense prediction tasks such as scene parsing and can inspire improvements in gauge image segmentation.
Although the aforementioned studies have made certain contributions to the field of image segmentation, when dealing with actual substation instrument image datasets, challenges arise due to low image resolution, complex backgrounds and natural environments such as raindrops and fog, and the small number of pixels occupied by pointers. These factors lead to unclear segmentation of dial boundaries and difficulties in detecting and segmenting small targets like pointers. In light of this, this study proposes a U-Net-based segmentation model for substation instrument dial images, aiming to improve the detection accuracy of analog instrument dials in substations. In this study, we have already conducted extensive comparisons with several state-of-the-art segmentation models, such as HR-net, PIDNet and ConvNeXt. The results show that, although these models perform well in complex backgrounds, U-Net demonstrates significant advantages in detail recovery, small object segmentation, and computational efficiency. Specifically, U-Net’s encoder-decoder structure and skip connections effectively preserve spatial information and prevent information loss, which is critical for accurately segmenting small targets like pointers and scales in substation dial images. Therefore, by choosing U-Net as the base architecture and optimizing it, we achieve higher segmentation accuracy while ensuring computational efficiency suitable for real-time substation monitoring systems. In the subsequent experimental section, we present detailed results of these comparison experiments, further validating the superiority of our proposed method.
The main contributions of this paper are as follows:
(1)
We propose a novel combination of WTConv, SimAM, and CCA modules within the U-Net architecture, tailored to the challenges of analog dial segmentation in substations.
(2)
The use of wavelet convolution enhances the receptive field and low-frequency feature extraction while reducing computational burden.
(3)
The dual attention design (SimAM + CCA) enables both spatial and cross-scale channel-wise feature enhancement.
(4)
Extensive experiments demonstrate the superior accuracy, robustness, and generalizability of the proposed method, even on limited data.

3. Proposed Approach

This section describes the proposed approach in two parts, the first part describes the U-net network model in detail, and the second part presents the improved model proposed in this paper.

3.1. Proposed U-Net

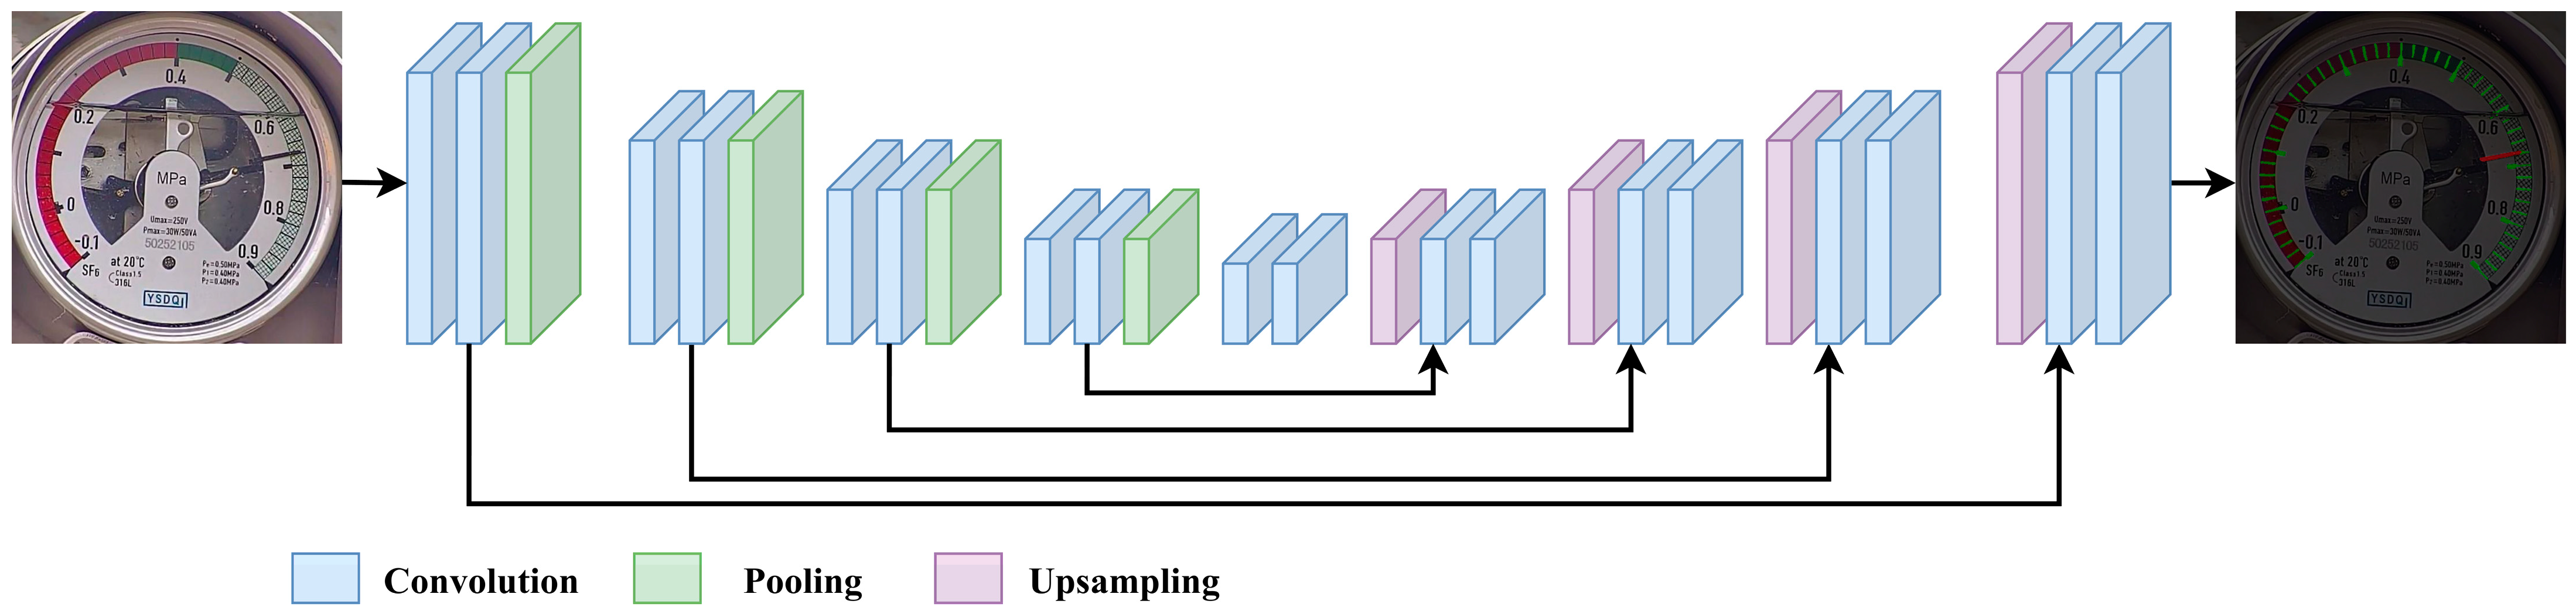
The U-Net segmentation network is renowned for its high precision, concise structure, and superior overall performance [12]. Its architecture primarily consists of two core components: the encoder and the decoder, as illustrated in Figure 1. The encoder is composed of a series of convolutional layers, pooling layers, and activation functions, which are responsible for extracting image features. The decoder, on the other hand, integrates low-level features from the backbone network with high-level features through upsampling operations and skip connections, thereby improving the segmentation of fine details. With its symmetric encoder-decoder structure, the U-Net network effectively extracts multi-scale features from images. Its unique skip connection mechanism is particularly effective in recovering image details, making it widely used in the segmentation of small-sample medical images.
Despite its remarkable performance in tasks such as medical image segmentation, the U-Net architecture still has several limitations. First, the conventional convolutions used in the encoder can extract features but have limited ability to capture multi-scale information in images. This makes it difficult to effectively handle complex textures and structures within images. Second, traditional upsampling methods in the decoder may lead to the loss of detail information, thereby affecting segmentation accuracy. Additionally, although the skip connections in U-Net can preserve spatial information to some extent, the efficiency of feature fusion is still insufficient when dealing with complex images, which may result in discontinuities in the segmentation outcomes.
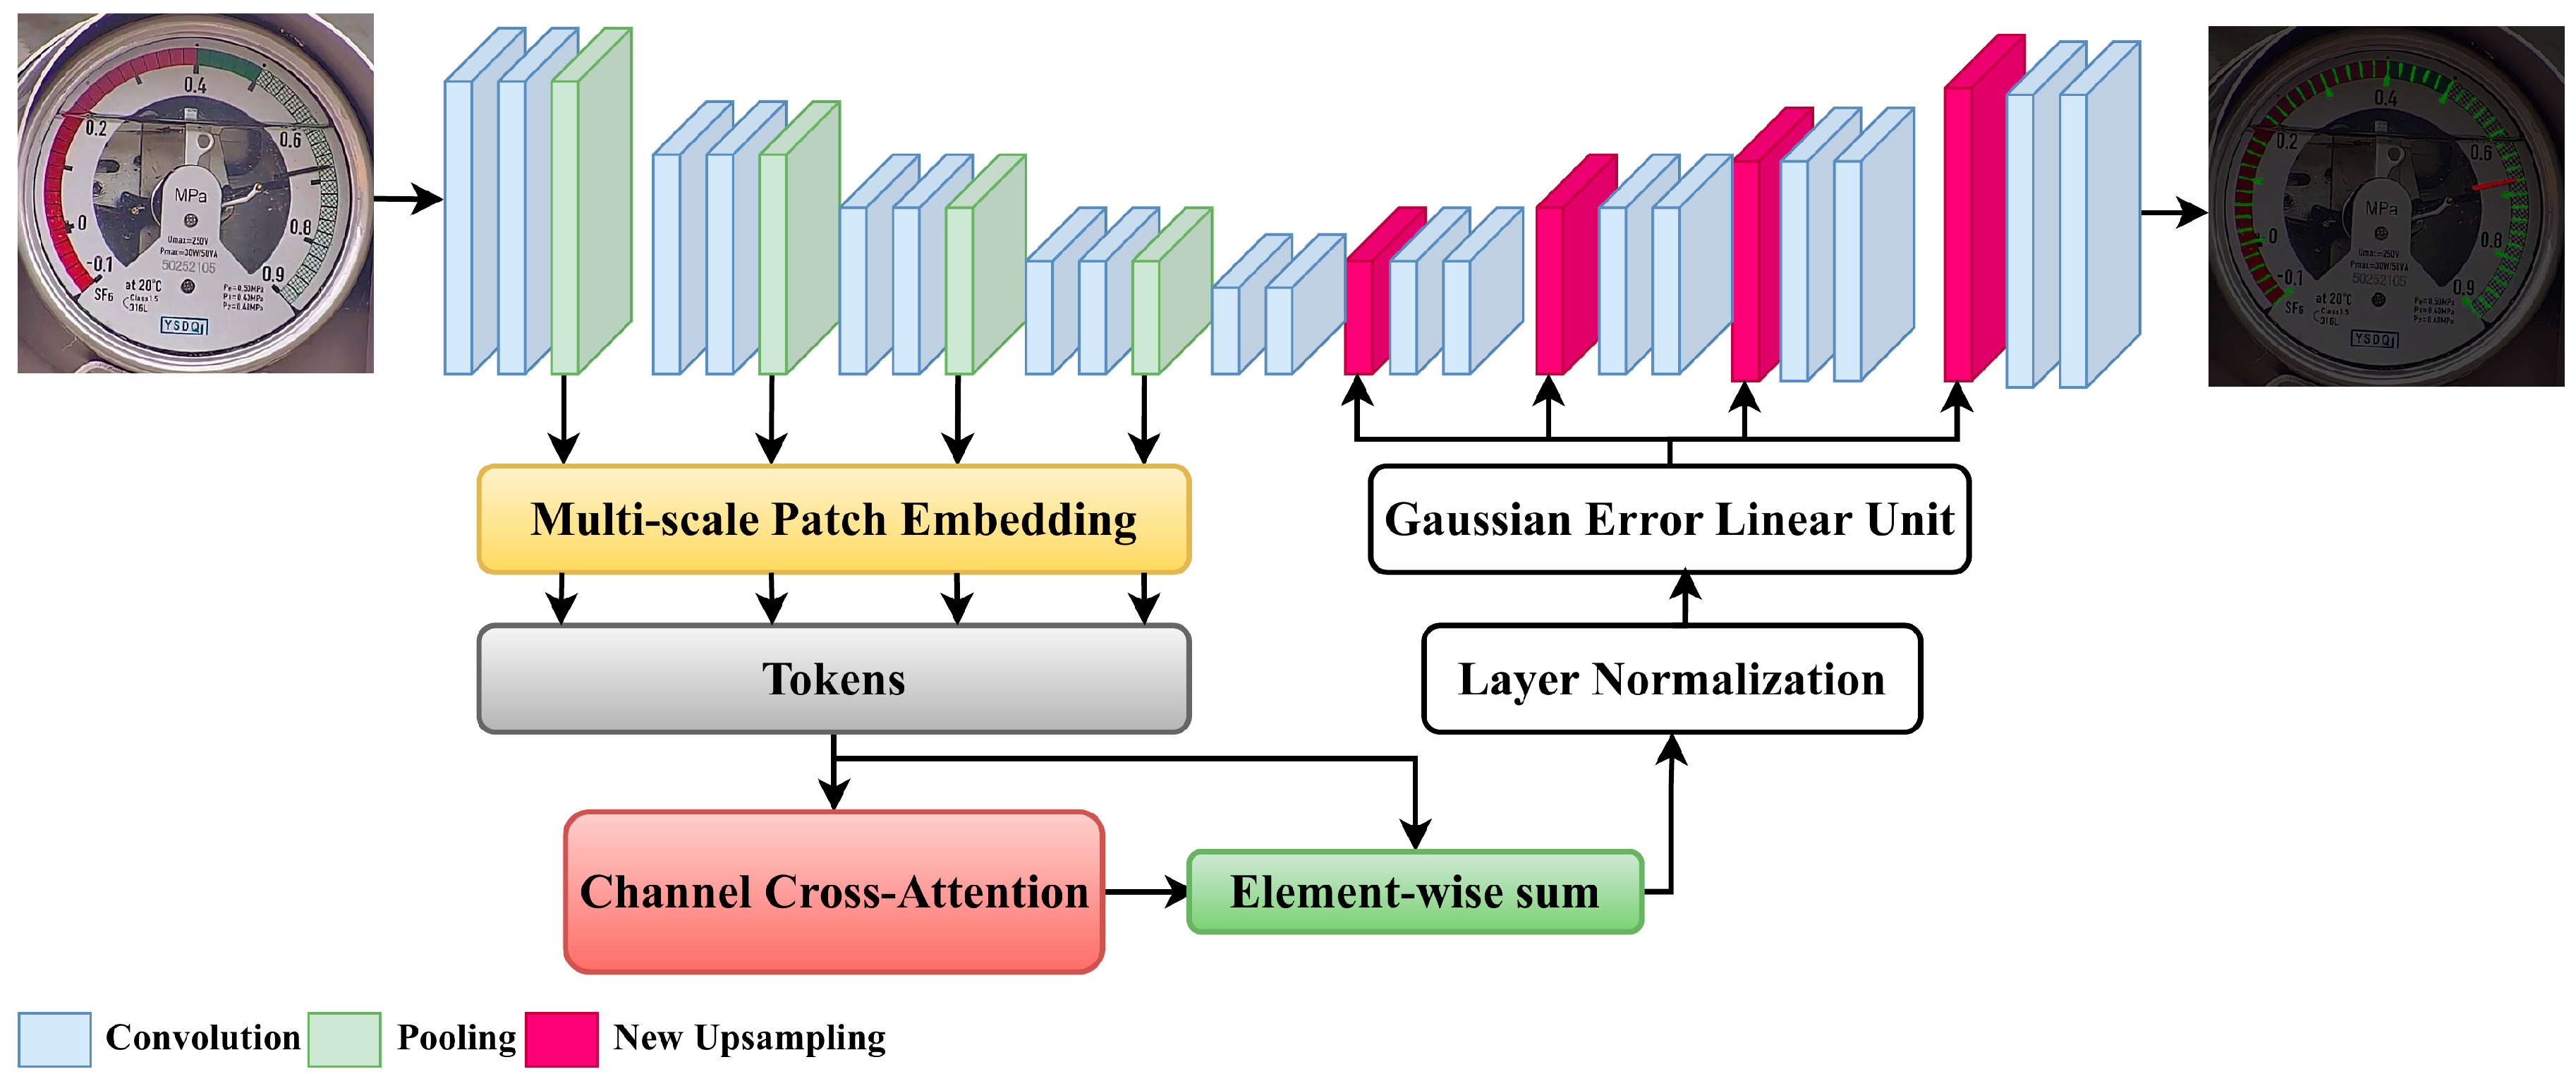
To address these limitations of the original U-Net, the following optimizations have been made to the network architecture in this study. First, conventional convolutions in the encoder are replaced with wavelet convolutions. Wavelet convolutions leverage the advantages of multi-scale analysis to more effectively extract details and structural information from images, thereby enhancing the richness and expressiveness of features. Second, the SimAM module is introduced in the upsampling stage [13]. By adaptively enhancing important information and suppressing redundant information in feature maps, the SimAM module can effectively mitigate the loss of detail information during upsampling and improve the accuracy of segmentation results. Furthermore, a Channel Cross-Attention (CCA) [14] module is embedded in the intermediate part of the model. The CCA module dynamically adjusts channel weights to focus on features that are more critical for the segmentation task, further improving the efficiency of feature fusion and segmentation performance. The improved network architecture is illustrated in Figure 2.
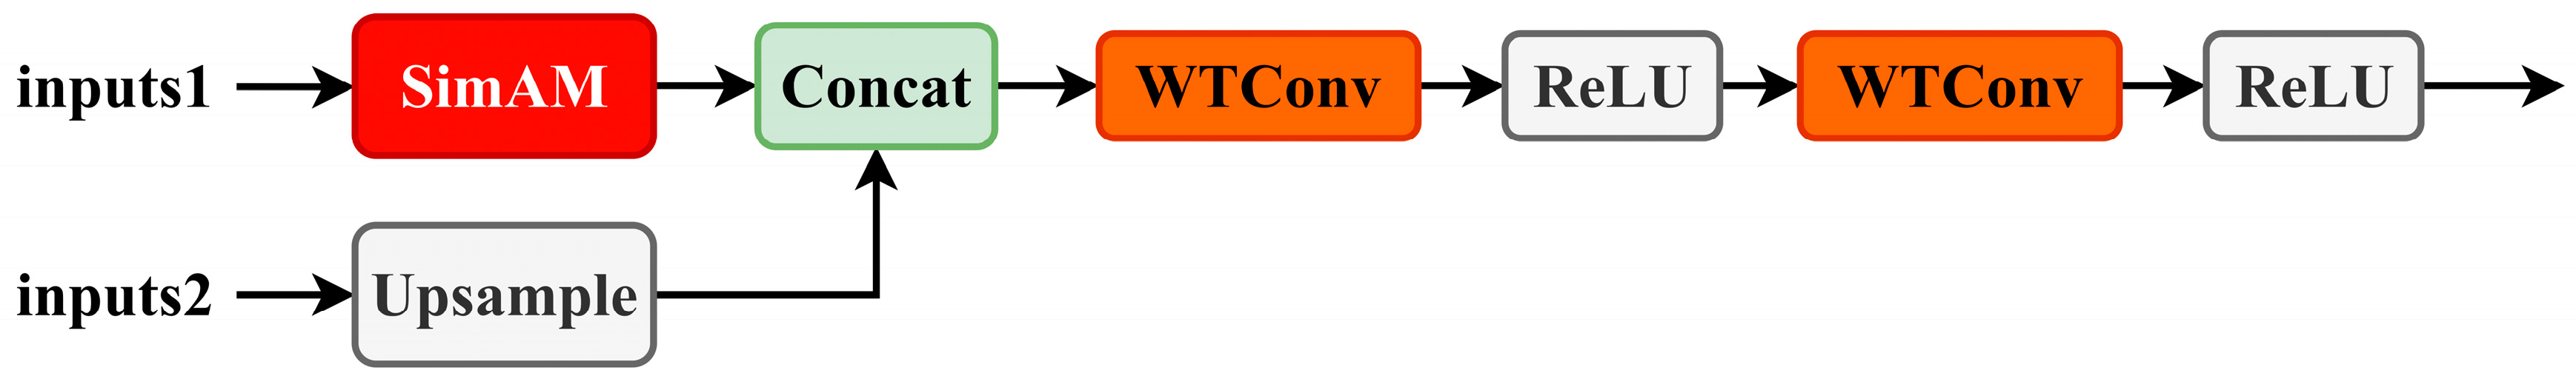
Replacing traditional convolutions with WTConv (Wavelet Transform-based Convolution) provides a sophisticated alternative for enhancing the receptive field within convolutional neural networks. This approach efficiently broadens the receptive field with a logarithmic increase in the number of trainable parameters relative to the size of the field, thereby circumventing the issue of over-parameterization. WTConv not only augments the network’s ability to capture multi-frequency responses but also bolsters its robustness against image corruptions and enhances its propensity for shape recognition, all while maintaining computational efficiency and ease of integration into existing CNN frameworks. The improvement in the upsampling stage is illustrated in Figure 3.

3.1.1. Integrate Cross-Channel Attention Mechanism

In this work, the Cross-Channel Attention (CCA) module plays a crucial role in improving feature representation by capturing dependencies across channels at multiple scales within the encoder, specifically in the context of the U-Net architecture. U-Net’s structure, known for its encoder-decoder design, facilitates feature extraction at various scales through the encoder and connects these features to the decoder via skip connections. When applied to complex image segmentation tasks (e.g., dial images with small objects, intricate backgrounds, and noise), the CCA module helps in addressing the semantic gap, thereby enhancing feature fusion. The standard skip connections in U-Net, while useful, may lead to the loss of important semantic information. The CCA module, by modeling cross-channel dependencies, allows for more efficient fusion of low-level and high-level features, addressing the semantic gap and improving overall segmentation quality.
  • Feature Mapping and Projection
The extracted feature patches are passed through a 1 × 1 depthwise convolution to project them into 1D representations. Depthwise convolution is effective in capturing local information while reducing computational complexity, making it ideal for use in attention mechanisms. The resulting feature blocks are then flattened into queries (Q), keys (K), and values (V), which will be used in subsequent computations.
  • Feature Extraction
The extracted feature patches are then passed through 1×1 depthwise convolution to project them into a 1D form. Depthwise convolutions are particularly suited for attention mechanisms as they preserve local information with minimal computational overhead. After this transformation, the patches are flattened and turned into queries (Q), keys (K), and values (V), which are the primary components used in the attention mechanism.
  • Cross-Channel Attention Calculation
In the cross-channel attention computation, a dot-product operation is performed, calculating the similarity between the queries (Q) and keys (K). Then, a Softmax function is applied to normalize the attention weights, ensuring that they sum to 1. These weights represent the importance of each channel, and they are used to perform a weighted summation of the values (V), resulting in enhanced feature representations.
  • Capturing Global Channel Dependencies
The central idea behind the CCA module is its ability to model global dependencies across channels from different scales. The attention mechanism, through the dot-product and Softmax function, calculates the relationship between queries and keys, thereby capturing long-range dependencies between channels. This process minimizes the semantic gap between the encoder and decoder, optimizes feature fusion, and enables better representation of critical information at multiple scales. To clearly demonstrate how the CCA module works, refer to Figure 4, which illustrates the structure and information flow of the CCA module. The figure shows how queries, keys, and values interact and highlights the process of capturing cross-channel dependencies, as well as how effective connections are made between features at different scales.
To better illustrate the function of the CCA module, Figure 4 depicts its structure and the flow of information. The figure demonstrates how the queries, keys, and values interact to capture cross-channel dependencies and establishes how the features from multiple scales are connected to improve segmentation.
Our CCA module implementation uses depthwise separable convolutions to project queries, keys, and values in order to reduce computational complexity. CCA is applied at four levels of the U-Net, with feature dimensions of 64, 128, 256, and 512, respectively, and a single-head attention mechanism at each level. The input features are first spatially compressed through a 28 × 28 adaptive average pooling, then the channel-wise relationships are computed via a dot-product attention mechanism. Finally, the attention output is fused with the original features through a residual connection. The hyperparameters of the CCA module are shown in Table 1.

3.1.2. Incorporate an Adaptive Attention Mechanism

To better segment fine pointers and scales within the dial, the model’s feature extraction capabilities must be enhanced. Attention mechanisms help the network focus on the pointer and scale regions of the dial, thereby improving target segmentation accuracy. By incorporating the SimAM attention mechanism into the decoder structure, the network is enabled to adaptively focus on the pointer targets, further enhancing segmentation performance.
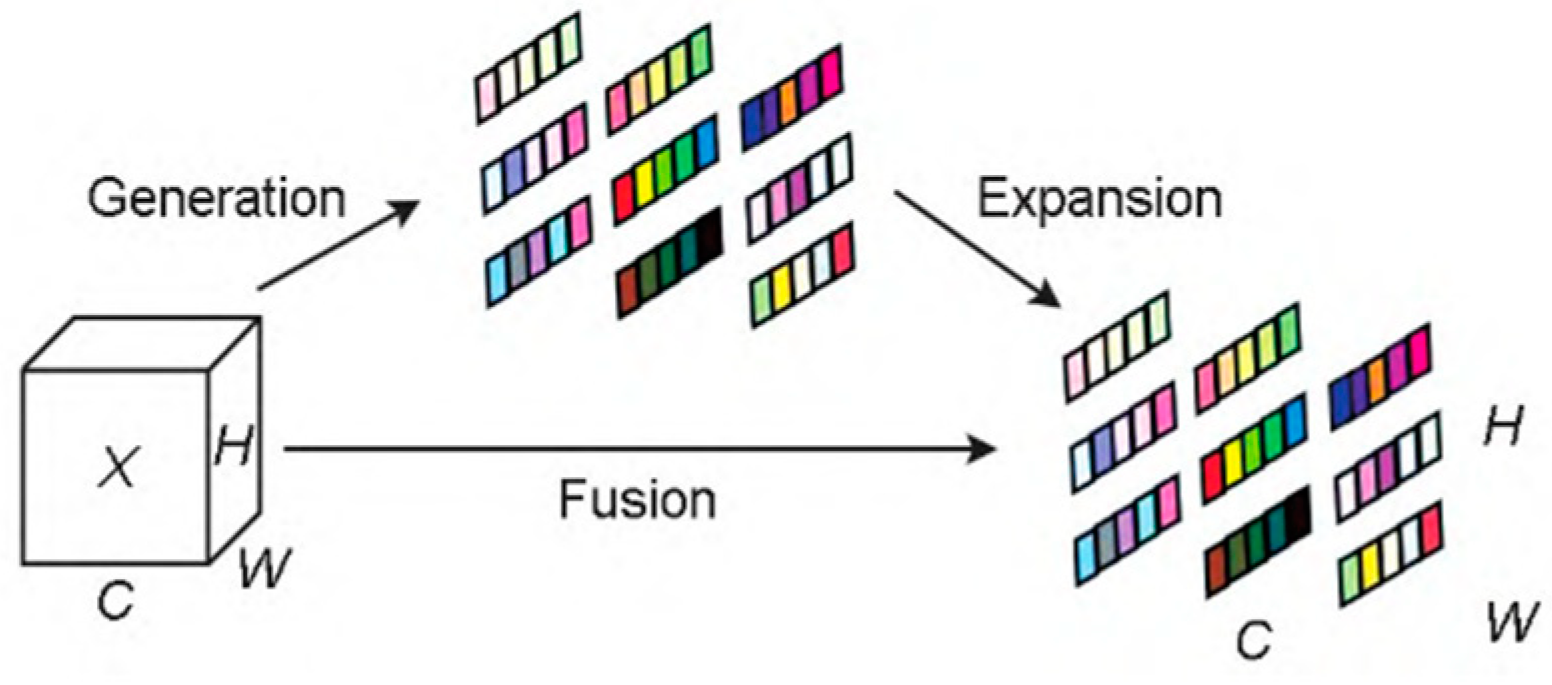
SimAM calculates the importance of each neuron through a process involving linear transformation and spatial suppression, as illustrated in Figure 5. Inspired by principles from neuroscience, SimAM offers a novel attention approach that avoids adding parameters. Unlike traditional attention mechanisms, which operate along either the channel or spatial dimensions, SimAM generates 3D attention weights that consider both spatial and channel information simultaneously. This is achieved through an energy function that quantifies the importance of each neuron within the feature map. By minimizing this energy function, SimAM efficiently assigns higher importance to neurons that show distinct activity compared to surrounding neurons, a concept rooted in spatial suppression from neuroscience. This approach not only reduces computational overhead but also allows the model to focus on the most informative features, improving attention across multiple dimensions of the feature map.
The energy function has a fast closed-form solution, enabling SimAM to compute the attention weights efficiently without adding extra parameters. The implementation typically involves global average pooling (GAP), variance calculation, and weight computation based on the energy function. Overall, SimAM effectively introduces an attention mechanism through a simple, parameter-free approach, boosting the network’s performance and efficiency. Simultaneously, integrating wavelet convolution with this attention mechanism further demonstrates its advantages.
In this study, I integrated this parameter-free attention module at the front end of the upsampling stage in the U-Net architecture and introduced an efficient channel attention mechanism after upsampling. This dual-attention enhancement strategy not only optimizes the representation of feature maps and improves the accuracy and robustness of image segmentation but also maintains the network’s computational efficiency due to its lightweight nature. It provides an excellent solution for image processing that is both high-performing and low-resource-consuming. The architecture is shown in Figure 5.
  • Definition of the energy function
The energy function is defined to measure the importance of each neuron based on its separability from other neurons within the same channel:
e t w t , b t , y , x i = ( y t t ^ ) 2 + 1 M 1 i = 1 M 1 ( y 0 x i ^ ) 2
where t ^ = w t t + b t and x i ^ = w t x i + b t represent the linear transformations of the target neuron t and other neurons x i in the feature map X R C × H × W . Here, y t and y 0 are predefined labels for the target and other neurons, respectively. M = H × W denotes the total number of neurons in a single channel, and w t and b t are the weight and bias parameters of the linear transformation.
  • Final Computation of Energy
The final energy value for each neuron is computed as:
e t * = 4 ( σ ^ 2 + λ ) ( t μ ^ ) 2 + 2 σ ^ 2 + 2 λ
where μ ^ = 1 M   i = 1 M x i and σ ^ 2 = 1 M   i = 1 M ( x i μ ^ ) 2 represent the mean and variance of the neurons in the same channel, excluding the target neuron t. The energy e t * is a measure of how distinct the target neuron t is from the other neurons in the channel. A lower energy value indicates that the neuron is more distinctive and thus more important for the task. The term ( t μ ^ ) 2 in the denominator measures the squared difference between the target neuron and the mean of the channel, which reflects the neuron’s deviation from the average. The term 2 σ ^ 2 in the denominator accounts for the variance of the channel, which represents the spread of the neuron values. The λ in this module is a hyperparameter, and in this study, λ is set to 0.0001.
  • Feature weighting
The importance of each neuron is inversely proportional to its energy value, denoted as 1 e t * . The refined feature map is obtained by scaling the original feature map using the computed attention weights:
X ^ = S i g m o i d 1 E X
where E is the matrix containing all e t * values, and ⊙ denotes element-wise multiplication.

3.1.3. Replacing Traditional Convolution with Wavelet Convolution

In traditional convolutional neural networks, increasing the kernel size to capture a larger receptive field often results in an exponential increase in the number of parameters, which leads to over-parameterization. To address this, we propose using Wavelet Convolution (WTConv) as an alternative to traditional convolutions, enabling more efficient receptive field expansion while maintaining relatively low parameter count.
WTConv integrates the advantages of the Wavelet Transform (WT) by decomposing the input image into multiple frequency bands, processing each band separately using smaller kernels. This method allows the network to efficiently capture both low- and high-frequency features without a significant increase in computational cost. The key advantage of WTConv lies in its ability to handle multi-scale features more effectively compared to traditional convolution.
To improve computational efficiency, depthwise separable convolution is combined with WTConv. Depthwise convolution is applied to each frequency component independently, followed by pointwise convolution to integrate the features. The resulting operation is:
D e p t h w i s e C o n v W i t h W T C o n v 2 d ( x ) = D ( W T C o n v ( x ) )
W T C o n v x = i C i × A i x + i C i × D i x
where C i represents the convolution kernel applied to each frequency component, and A i x and D i x are the low-frequency and high-frequency components, respectively. The wavelet convolution operates on each component independently, ensuring efficient feature extraction across multiple frequency bands. D represents the depthwise convolution operation.
Wavelet Convolution (WTConv) offers significant advantages over traditional convolution methods. While traditional convolutions increase the receptive field by enlarging the kernel size, leading to exponential growth in the number of parameters, WTConv achieves larger receptive fields in a more parameter-efficient manner by leveraging wavelet decomposition. This method scales the receptive field logarithmically with kernel size, which reduces the computational burden. Additionally, WTConv decomposes the input into multiple frequency bands, enabling the simultaneous capture of both low- and high-frequency features, whereas traditional convolution typically focuses on high-frequency components. This multi-frequency approach enhances the model’s ability to extract detailed and robust features across different scales, making it particularly beneficial for tasks that require comprehensive feature extraction. Furthermore, WTConv retains spatial resolution, unlike Fourier-based methods, making it especially suitable for tasks like segmentation that rely on preserving fine spatial details. By using smaller convolution kernels applied to each frequency component, WTConv also significantly reduces the computational cost compared to traditional large-kernel convolutions, ensuring both efficiency and scalability.
In summary, Wavelet Convolution (WTConv) offers several advantages over traditional convolutional methods, including more efficient receptive field expansion, the ability to handle multi-frequency features, and enhanced computational efficiency. These properties make WTConv particularly suitable for tasks requiring robust feature extraction across different scales, such as segmentation. We demonstrate the effectiveness of WTConv through experimental results, showing improved segmentation accuracy. By replacing traditional convolutions with WTConv, we achieve better performance and maintain a manageable model complexity.

3.1.4. Improvement of the Loss Function

In this study, the segmentation task for dials is characterized by an imbalanced distribution of difficult and easy samples. This imbalance may lead to a decline in model performance and difficulty in focusing on difficult samples. To address the extreme imbalance in the number of scales and pointers in the dial dataset, we employed the Focal Loss (FL) function. The formula for the F L function is as follows:
F L ( p i ) = α 1 p i γ log p i
Here, p i represents the predicted probability of the target class. The parameter γ is a modulating factor that adjusts the weights of different samples. By reducing the weights of easy samples, it enables the model to focus more on difficult samples. The parameter α is a balancing factor that assigns different weights to the losses of each class, thereby allowing the model to pay more attention to difficult samples during training. By assigning higher weights to difficult samples, the F L function prevents easy samples from dominating the training process, thereby enhancing the model’s segmentation capability for difficult samples.

3.2. Experimental Design

The software environment for the experiment was Ubuntu 16.04, Pytorch 2.0.1, Torchvision 0.15.2, CUDA 10.2, the programming language was Python 3.7.12, and the hardware environment for the experiment was: the CPU was an Intel Core i7-6800k(Intel Corporation, Santa Clara, CA, USA) the graphics card was a GeForce GTX 1080Ti (NVIDIA Corporation, Santa Clara, CA, USA), and the memory was 31.3 GB. The experimental hardware environment.

3.2.1. Dataset

The experiment utilized dial images of substations collected by a power company in Sichuan. The initial dataset comprised 440 images. Data augmentation techniques, including color adjustment, contrast variation, and brightness modification, were applied to expand the dataset to 1760 images. The augmented dataset was randomly divided into training, validation, and testing sets in a ratio of 7:1:2. The results of data augmentation are illustrated in Figure 6.

3.2.2. Evaluation Metrics

To validate the effectiveness of the proposed method in this study, multiple metrics were employed to evaluate the segmentation performance of the network, including Pixel Accuracy (PA), Mean Pixel Accuracy (MPA), Mean Intersection over Union (MIoU), the number of parameters, and Floating-Point Operations (FLOPs). In addition, the Dice Similarity Coefficient (DSC) is a metric that quantifies the similarity between two sets and is commonly employed to evaluate the similarity between segmentation results and ground-truth annotations. The Hausdorff Distance (HSD) measures the maximum distance between two point sets, effectively reflecting the boundary accuracy of segmentation results. The Average Surface Distance (ASD) assesses the average distance between the boundaries of segmentation results and ground-truth annotations. A smaller ASD value indicates that the segmentation boundaries are closer to the ground-truth boundaries. Compared to HSD, ASD provides a smoother measure of overall boundary accuracy but is less sensitive to local outliers. The formulas for these evaluation metrics are presented as follows:
P A = T P + T N T P + T N + F T + F N
I o U = T P T P + T N + F N
M I o U = 1 k + 1 i = 0 k T P T P + T N + F N
A S D A , B = 1 A a A min b B a b + 1 B b B min a A b a
D S C = 2 · A B A + B
H S D A , B = m a x ( h A , B , h B , A )
h A , B = m a x a A m i n b B a b

4. Experiment Setup

4.1. Ablation Experiments

4.1.1. Impact of Different Attention Mechanisms

To study the impact of different attention mechanisms on model segmentation accuracy, experiments were conducted by replacing the MobileNetV2 feature extraction network and introducing CA [15], SE [16], ECA [17], and SimAM [13] in the upsampling module. The results are shown in Table 2. Among these attention mechanisms, SimAM not only has the fewest parameters but also shows the most significant improvement in segmentation performance.

4.1.2. Impact of Focal Loss Hyperparameters

To study the impact of the hyperparameters in Equation (1) on dial segmentation performance, experiments were conducted with different values to find the optimal settings. The range of hyperparameters was based on the results from the original paper, and the results are shown in Table 3. The results indicate that the best segmentation performance is achieved when α = 0.0001.

4.1.3. Ablation Experiments of Different Modules

To evaluate the effectiveness of the improved modules in dial image segmentation, ablation experiments were conducted to test the performance of each improvement and their combinations. The results are shown in Table 4. Replacing the original VGG16 feature extraction network in U-Net with VGG16+ significantly reduced computational burden, decreasing FLOPs from 82.6 G to 52.8 G, while maintaining or improving segmentation performance metrics such as MIoU and MPA. Adding the SimAM module in the upsampling stage of the Decoder further reduced FLOPs to 48.4 G and improved segmentation performance, increasing MIoU from 75.9% to 76.7% and MPA from 89.8% to 90.6%. Introducing the cross-layer attention mechanism (CCA) further enhanced performance while maintaining stable computational and parameter costs. When all improvements—VGG16+, SimAM, and CCA—were applied to the DeepLabV3+ model, MIoU increased from 74.2% to 78.7%, and MPA increased from 88.8% to 91.8%. These results demonstrate the significant effectiveness of the proposed improvements in reducing computational burden and enhancing segmentation performance.
To further validate the effectiveness of the final improved method in improving segmentation accuracy, detailed comparison experiments were conducted between the improved model and the original model on the dial dataset. The results are shown in Table 5. The loss curves before and after the improvement at different epochs are shown in Figure 7.

4.2. Comparative Experiments

To validate the effectiveness of the improved network, the proposed network was compared with other segmentation networks, including HR-net [18], PIDNet [19], and ConvNeXt [20] using the lightweight MobileNetV2. The results are shown in Table 6. In terms of MPA, the traditional HR-net algorithm achieved 87.5%, PIDNet achieved 88.9%, and ConvNeXt achieved 90.4%, while the proposed algorithm reached 91.8%, representing a 3% improvement over traditional U-Net, a 4.3% improvement over HR-net, a 2.9% improvement over PIDNet, and a 1.4% improvement over ConvNeXt. In terms of MIoU, the traditional U-Net achieved 74.2%, HR-net achieved 73.2%, PIDNet achieved 73.7%, and ConvNeXt achieved 77.2%, while the proposed algorithm increased to 78.7%. This represents a 4.5% improvement over traditional U-Net, a 5.5% improvement over DeepLabV3+, a 5.0% improvement over PIDNet, and a 1.5% improvement over ConvNeXt. The experimental results demonstrate that the proposed algorithm effectively improves segmentation accuracy while reducing computational burden.
Visual comparison of segmentation results from different models is shown in Figure 8. The results indicate that HR-net performed poorly in pointer segmentation, while PIDNet successfully segmented the pointer but exhibited discontinuities and artifacts. ConvNeXt failed to segment the pointer accurately. In contrast, the proposed model successfully segmented the pointer without discontinuities. In the second set of results, all models successfully segmented scales and pointers, but ConvNeXt showed many artifacts in scale segmentation. HR-net and PIDNet had minor issues with fine scale segmentation, while the proposed model’s segmentation results were closest to the ground truth. In the third set of results, ConvNeXt exhibited discontinuities in pointer segmentation, HR-net made errors in scale starting positions, and PIDNet successfully segmented pointers and scales but with less accuracy than the proposed model. Overall, the proposed model demonstrated superior segmentation performance with reduced computational requirements, validating the effectiveness of the improved algorithm.
The segmentation results and metric variations of the improved U-net model at different epochs are presented in Table 7. Meanwhile, the segmentation results at different epochs are shown in Figure 9.
Several factors, including low image resolution, the presence of water droplets on the dial surface, and reflections, introduce significant challenges to accurate segmentation. Low resolution can result in a loss of fine details, such as the pointer and scale, making it difficult for the model to differentiate between them. Water droplets that accumulate on the dial surface obscure key features, which can cause misidentifications or incomplete segmentations. Similarly, reflections on the dial’s surface can distort visual information, leading to inconsistencies in the segmentation results. These issues underscore the limitations of the current model under real-world conditions, where environmental factors can substantially affect performance. Future efforts will focus on enhancing the model’s robustness to such factors, potentially through more advanced image preprocessing or augmented training strategies. As shown in the Figure 10, several factors such as low resolution, water droplets on the dial surface, and reflections significantly hinder the accuracy of segmentation.

4.3. Generalization Experiments

To further validate the superiority of the improved algorithm over the original algorithm, comparative experiments were conducted on the public PASCAL VOC 2012 dataset. The results shown in Table 8 compare the IoU of different classes between the improved and original algorithms. The improved algorithm achieved higher IoU results in most classes, demonstrating enhanced segmentation performance for various objects. Significant improvements were observed in the IoU results for Tvmonitor, Pottedplant, Bottle, and Bicycle, with increases of 8%, 8%, 6%, and 6%, respectively. The mIoU increased from 70.1% to 73.4%.
Partial comparison of segmentation results before and after improvement on the PASCAL VOC 2012 dataset is shown in Figure 11. In the first and fifth sets of results, the improved algorithm addressed the issue of holes in segmentation results from the original algorithm. In the second set of results, the improved algorithm successfully segmented the mast of the ship. In the third and fourth sets of results, the improved algorithm provided more refined and complete segmentation for areas such as wings and cow legs.

5. Conclusions

To more efficiently segment dial scales and pointers for accurate reading recognition, this study introduced wavelet convolution (WTConv), cross-layer cross-attention (CCA) modules, and feature enhancement modules into the U-Net network to improve segmentation performance. Wavelet convolution effectively enlarged the receptive field and enhanced the response to low-frequency information, significantly improving feature extraction capabilities. The dual cross-attention modules captured channel and spatial dependencies, optimizing feature fusion between the Encoder and Decoder and reducing semantic gaps. The feature enhancement module further improved the model’s expression of multi-scale features, ensuring full utilization of information. Experimental results demonstrated that combining these modules significantly enhanced the performance of the improved U-Net in multiple medical image segmentation tasks, validating the effectiveness of these modules in improving segmentation accuracy and robustness. These improvements provide new ideas and methods for future applications in medical image analysis.

Author Contributions

Conceptualization, W.Z. and W.L.; methodology, Y.J.; validation, S.F., W.Z. and Y.Y.; formal analysis, W.L.; writing—original draft preparation, H.T.; writing—review and editing, W.Z., Y.J. and J.H.; visualization, H.T.; All authors have read and agreed to the published version of the manuscript.

Funding

This research was funded by State Grid Sichuan Electric Power Company Science and Technology Program, grant number 521997230014.

Data Availability Statement

Substation instrumentation image data is not available due to privacy, PASCAL VOC 2012 public datasets can be downloaded from http://host.robots.ox.ac.uk/pascal/VOC/voc2012/ (accessed on 2 May 2025).

Conflicts of Interest

Authors Wan Zou and Yiping Jiang employed by the company State Grid Sichuan Electric Power Company. Authors Wenlong Liao, Songhai Fan and Yueping Yang were employed by the company State Grid Sichuan Electric Power Research Institute. The remaining authors declare that the research was conducted in the absence of any commercial or financial relationships that could be construed as a potential conflict of interest.

References

  1. Han, S.C.; Xu, Z.Y.; Yin, Z.C.; Wang, J.X. Research Status and Development of Automatic Reading Technology for Pointer Instruments. Comput. Sci. 2018, 45, 54–57. [Google Scholar]
  2. Zhai, Y.J.; Zhao, Z.Y.; Wang, Q.M.; Bai, K. Pointer meter detection method based on artificial-real sample metric learning. Electr. Meas. Instrum. 2022, 59, 174–183. [Google Scholar]
  3. Yang, Y.Q.; Zhao, Y.Q.; He, X.Y.; Tian, P. Automatic Calibration of Analog Measuring Instruments Using Computer Vision. In Proceedings of the 3rd Youth Academic Conference of the China Instrument and Control Society (Volume I), North China Electric Power University, Beijing, China, 2001; p. 3. [Google Scholar]
  4. Fang, Y.X.; Dai, Y.; He, G.L.; Qi, D. A mask RCNN based automatic reading method for pointer meter. In Proceedings of the 2019 Chinese Control Conference (CCC), Guangzhou, China, 27–30 July 2019; pp. 8466–8471. [Google Scholar]
  5. Wan, J.; Wang, H.; Guan, M.; Shen, J.; Wu, G.; Gao, A.; Yang, B. Automatic Reading Method for Pointer Instruments in Substations Based on Faster R-CNN and U-Net. Power Syst. Technol. 2020, 44, 3097–3105. [Google Scholar] [CrossRef]
  6. Huang, S.Y.; Fan, S.S.; Wang, Z.Y. A Reading Recognition Method for Pointer Instruments in Substations Based on CenterNet and DeepLabv3+. J. Electr. Power 2022, 37, 232–243. [Google Scholar]
  7. Jaffery, Z.A.; Dubey, A.K. Architecture of Noninvasive Real-Time Visual Monitoring System for Dial Type Measuring Instrument. IEEE Sens. J. 2012, 13, 1236–1244. [Google Scholar] [CrossRef]
  8. Tunca, E.; Saribas, H.; Kafali, H.; Kahvecioglu, S. Determining the Pointer Positions of Aircraft Analog Indicators Using Deep Learning. Aircraft Eng. Aeros. Technol. 2022, 94, 372–379. [Google Scholar] [CrossRef]
  9. Wang, Z.L.; Tian, L.F.; Du, Q.L.; An, Y.; Sun, Z.; Liao, W. Robust Pointer Meter Reading Recognition Method Under Image Corruption. IEEE Trans. Instrum. Meas. 2024, 73, 1–16. [Google Scholar] [CrossRef]
  10. He, K.; Zhang, X.; Ren, S.; Sun, J. Deep Residual Learning for Image Recognition. In Proceedings of the IEEE Conference on Computer Vision and Pattern Recognition (CVPR), Las Vegas, NV, USA, 27–30 June 2016; pp. 770–778. [Google Scholar]
  11. Hou, Q.B.; Zhang, L.; Cheng, M.M.; Feng, J.S. Strip Pooling: Re-thinking Spatial Pooling for Scene Parsing. In Proceedings of the IEEE/CVF Conference on Computer Vision and Pattern Recognition (CVPR), Seattle, WA, USA, 13–19 June 2020; pp. 4003–4012. [Google Scholar]
  12. Ronneberger, O.; Fischer, P.; Brox, T. U-Net: Convolutional Networks for Biomedical Image Segmentation. In Proceedings of the International Conference on Medical Image Computing and Computer-Assisted Intervention, Munich, Germany, 5–9 October 2015; Springer International Publishing: Cham, Switzerland, 2015. [Google Scholar] [CrossRef]
  13. Yang, L.; Zhang, R.Y.; Li, L.; Xie, X. SimAM: A Simple, Parameter-Free Attention Module for Convolutional Neural Networks. In Proceedings of the International Conference on Machine Learning, PMLR, Virtual, 18–24 July 2021; Volume 139, pp. 11863–11874. [Google Scholar]
  14. Ates, G.C.; Mohan, P.; Celik, E. Dual Cross-Attention for Medical Image Segmentation. Eng. Appl. Artif. Intell. 2023, 126, 107139. [Google Scholar] [CrossRef]
  15. Hou, Q.; Zhou, D.; Feng, J. Coordinate Attention for Efficient Mobile Network Design. In Proceedings of the IEEE/CVF Conference on Computer Vision and Pattern Recognition (CVPR), Nashville, TN, USA, 20–25 June 2021; pp. 13713–13722. [Google Scholar]
  16. Hu, J.; Shen, L.; Sun, G. Squeeze-and-Excitation Networks. In Proceedings of the IEEE/CVF Conference on Computer Vision and Pattern Recognition (CVPR), Salt Lake City, UT, USA, 18–22 June 2018; pp. 7132–7141. [Google Scholar]
  17. Wang, Q.; Wu, B.; Zhu, P.; Li, P.; Zuo, W.; Hu, Q. ECA-Net: Efficient Channel Attention for Deep Convolutional Neural Networks. In Proceedings of the IEEE/CVF Conference on Computer Vision and Pattern Recognition (CVPR), Seattle, WA, USA, 14–19 June 2020; pp. 11531–11539. [Google Scholar] [CrossRef]
  18. Sun, K.; Xiao, B.; Liu, D.; Wang, J. Deep High-Resolution Representation Learning for Human Pose Estimation. In Proceedings of the IEEE/CVF Conference on Computer Vision and Pattern Recognition (CVPR), Long Beach, CA, USA, 15–20 June 2019; pp. 5686–5696. [Google Scholar] [CrossRef]
  19. Xu, J.; Xiong, Z.; Bhattacharyya, S.P. PIDNet: A real-time semantic segmentation network inspired by PID controllers. In Proceedings of the IEEE/CVF Conference on Computer Vision and Pattern Recognition (CVPR), Vancouver, BC, Canada, 17–24 June 2023; pp. 19529–19539. [Google Scholar]
  20. Liu, Z.; Mao, H.; Wu, C.-Y.; Feichtenhofer, C.; Darrell, T.; Xie, S. A ConvNet for the 2020s. In Proceedings of the IEEE/CVF Conference on Computer Vision and Pattern Recognition (CVPR), New Orleans, LA, USA, 18–24 June 2022; pp. 11976–11986. [Google Scholar]
Figure 1. U-net network architecture diagram.
Information 16 00382 g001
Figure 2. Improved U-net network architecture diagram.
Information 16 00382 g002
Figure 3. Improved unsampling architecture diagram.
Information 16 00382 g003
Figure 4. Schematic diagram of the cross-channel CCA module.
Information 16 00382 g004
Figure 5. SimAM attention mechanism structure diagram.
Information 16 00382 g005
Figure 6. Data augmentation results diagram.
Information 16 00382 g006
Figure 7. The loss curves before and after improvement at different epochs.
Information 16 00382 g007
Figure 8. Comparison of segmentation results from different models.
Information 16 00382 g008
Figure 9. Comparison of segmentation results from different epoch.
Information 16 00382 g009
Figure 10. Impact of environmental factors on dial segmentation accuracy. Red boxes indicate areas affected by raindrops, reflections, or low-contrast scale marks.
Information 16 00382 g010
Figure 11. Comparison of segmentation results before and after improvement on the PASCAL VOC 2012 Dataset.
Information 16 00382 g011aInformation 16 00382 g011b
Table 1. Hyperparameters of CCA.
HyperparametersValueDescription
Channel Head[1, 1, 1, 1]The number of channel attention heads at different levels.
Projection Kernel Size(1, 1)The kernel size used for the convolution operations to map the queries (Q), keys (K), and values (V)
Feature Dimensions[64, 128, 256, 512]The number of feature channels at each level.
Pooling Size28Adaptive average pooling output size
Number of Attention Blocks1Number of cascaded CCA blocks
Projection MethodDepthwise Separable ConvolutionUsed to reduce computational complexity
Table 2. Comparison of different attention mechanisms.
NetworkAttention MechanismsBackboneMIoU%MPA%Parameters/MFlops/G
U-netSEVGG1676.988.45.9953.1
U-netCBAMVGG1677.290.26.0253.4
U-netECAVGG1677.689.85.9752.9
U-netSimAMVGG1678.091.75.9752.9
Table 3. Comparison of different hyperparameter settings.
αMIoU%MPA%
074.288.8
0.174.489.1
0.0174.589.2
0.00174.890.1
0.000175.090.2
Table 4. Comparison of ablation experiment results.
NetworkBackboneAttention MechanismSkip ConnectionMIoU%MPA%Flops/G
U-netVGG1674.288.882.6
U-netVGG16+75.989.852.8
U-net VGG16+SimAM76.790.648.4
U-netVGG16+CCA77.590.948.4
U-netVGG16+SimAMCCA78.791.847.5
Table 5. Detailed segmentation accuracy comparison.
ModelPA%MPA%IoU%MIoU%
Scale MarkPointerBackgroundScale MarkPointerBackground
Original828510088.858659974.2
Ours868910091.862739978.7
Table 6. Comparison of model performance.
ModelBackboneMIoU%MPA%Flops/G
HR-net [18]Xception73.287.582.6
PIDNet [19]VGG1673.788.9321.3
ConvNeXt [20]MobileNetV277.290.428.6
OursVGG16+78.791.847.5
Table 7. Comparison of model performance.
ModelEpochMIoU%MPA%Flops/G
Ours5070.088.045.0
Ours10075.090.046.0
Ours15077.091.047.0
Ours20081.3691.847.5
Table 8. MIoU results for different classes.
ClassOriginal Algorithm%Proposed Algorithm%
Background9393
Tvmonitor5967
Train8083
Sofa4648
Sheep8077
Pottedplant4957
Person7880
motorbike7881
Horse7378
Dog7781
Diningtable5859
Cow7982
Chair3032
Cat8587
Car8284
Bus8993
Bottle6773
Boat6366
Bird7681
Bicycle5157
Aeroplane8083
mIoU70.173.4
Disclaimer/Publisher’s Note: The statements, opinions and data contained in all publications are solely those of the individual author(s) and contributor(s) and not of MDPI and/or the editor(s). MDPI and/or the editor(s) disclaim responsibility for any injury to people or property resulting from any ideas, methods, instructions or products referred to in the content.

