Article

Fusion of Aerial and Satellite Images for Automatic Extraction of Building Footprint Information Using Deep Neural Networks

by
Ehsan Haghighi Gashti
1,
Hanieh Bahiraei
2,
Mohammad Javad Valadan Zoej
2,* and
Ebrahim Ghaderpour
3,4,*
1
School of Surveying and Geospatial Eng, College of Engineering, University of Tehran, 1417935840 Tehran, Iran
2
Faculty of Geomatics Engineering, K. N. Toosi University of Technology, 1969764499 Tehran, Iran
3
Department of Earth Sciences, Sapienza University of Rome, P. le Aldo Moro, 5, 00185 Rome, Italy
4
Earth and Space Inc., Calgary, AB T3A 5B1, Canada
*
Authors to whom correspondence should be addressed.
Information 2025, 16(5), 380; https://doi.org/10.3390/info16050380
Submission received: 2 March 2025 / Revised: 18 April 2025 / Accepted: 29 April 2025 / Published: 2 May 2025
(This article belongs to the Special Issue Machine Learning and Artificial Intelligence with Applications)

Abstract

:
The analysis of aerial and satellite images for building footprint detection is one of the major challenges in photogrammetry and remote sensing. This information is useful for various applications, such as urban planning, disaster monitoring, and 3D city modeling. However, it has become a significant challenge due to the diverse characteristics of buildings, such as shape, size, and shadow interference. This study investigated the simultaneous use of aerial and satellite images to improve the accuracy of deep learning models in building footprint detection. For this purpose, aerial images with a spatial resolution of 30 cm and Sentinel-2 satellite imagery were employed. Several satellite-derived spectral indices were extracted from the Sentinel-2 image. Then, U-Net models combined with ResNet-18 and ResNet-34 were trained on these data. The results showed that the combination of the U-Net model with ResNet-34, trained on a dataset obtained by integrating aerial images and satellite indices, referred to as RGB–Sentinel–ResNet34, achieved the best performance among the evaluated models. This model attained an accuracy of 96.99%, an F1-score of 90.57%, and an Intersection over Union of 73.86%. Compared to other models, RGB–Sentinel–ResNet34 showed a significant improvement in accuracy and generalization capability. The findings indicated that the simultaneous use of aerial and satellite data can substantially enhance the accuracy of building footprint detection.

1. Introduction

The analysis of aerial and satellite images for building footprint detection is one of the major challenges in remote sensing and photogrammetry. This information is valuable for numerous applications, including urban planning [1], disaster monitoring [2], and 3D city modeling [3]. In this context, the automatic extraction of building footprint information from such images has become a key research focus in recent decades [4].
The conventional approach for generating this information relies on ground surveying and manual data extraction. However, the continuous expansion of cities and the need for frequent updates of building footprint information have made this process highly time-consuming and costly [5]. Consequently, there is a growing demand for an automated method to extract this information from aerial and satellite images. Due to the varying characteristics of buildings—such as shape, color, size, and shadow interference—developing accurate, reliable, and fully automated methods for building extraction remains a significant challenge [6].
In recent decades, numerous studies have focused on extracting building footprint information using traditional image processing methods, such as shadow-based [7], edge-based [8], and object-based approaches [9], as well as machine learning techniques [10].
Chen et al. [7] investigated building extraction from high-resolution remote sensing images using shadow detection. Their proposed method began by applying a simple linear iterative clustering algorithm to segment the input image into homogeneous regions. The color features of these segments were then extracted using a linear discriminant analysis-based method to identify shadow areas. Based on the detected shadow locations, an adaptive strategy was designed for initial point placement and region growing, enabling preliminary building identification. Experimental results showed that the proposed algorithm is more effective, robust, and precise than some competing models, with an average false alarm rate of 5.51% and an average missing rate of 2.89%. Femiani et al. [11] focused on extracting building roof information from RGB (red–green–blue) images. Their proposed method identified buildings based on existing shadows in the images and applied constraints to determine which areas could or could not be considered roofs. The results showed an average F-score of 89% compared to 68% and 33%.
Turker and Koc-San [12] proposed an integrated approach for automatic building extraction using a support vector machine (SVM). The dataset included Ikonos pan-sharpened (PS) and stereo panchromatic images and a 1:1000-scale existing digital vector dataset that contains contour lines and 3D points. Buildings were identified through binary SVM classification, with the normalized Digital Surface Model (nDSM) and the Normalized Difference Vegetation Index (NDVI) included as additional bands in the classification process. For industrial buildings in the test areas, the proposed method achieved a building detection rate of 93.45% and a quality score of 79.51%. For rectangular residential buildings, the average detection rate and quality score were 95.34% and 79.05%, respectively. In contrast, for circular residential buildings, these values dropped to 78.74% and 66.81%, respectively.
Although all the aforementioned methods have achieved relatively good accuracy in building detection, they rely on handcrafted features, requiring prior expertise to design specific features. As a result, they are only effective in specific scenarios. One limitation of algorithms like SVM is their excessive consumption of computational resources when applied to large datasets. This can hinder the model’s generalizability during implementation [13]. Additionally, these methods suffer from sensitivity to noise. They may also have low accuracy in complex environments and struggle to detect intricate patterns [14], making them unsuitable for practical large-scale applications.
In the past decade, significant advancements in deep learning, particularly convolutional neural networks (CNNs), have led to remarkable progress in computer vision and remote sensing image processing [15]. By learning contextual information, CNNs can automatically extract meaningful semantic features from input data without requiring prior domain knowledge [16]. Additionally, CNNs offer high generalizability and greater accuracy compared to traditional methods, making them the state-of-the-art approach for classification, segmentation, and object detection tasks in remote sensing [17].
Various networks, including fully convolutional networks (FCNs) [18], U-Net [19], DenseNet [20], ResNet [21], and HRNet [22], have been employed for classification and segmentation tasks, particularly for building footprint extraction.
For instance, Pasquali et al. [23] focused on optimizing the U-Net architecture to develop a version capable of achieving high accuracy using a single model and a single data type. The dataset in this study consisted of Worldview-2 and Worldview-3 satellite images. Their study demonstrated that appropriate modifications to the architecture and effective data augmentation techniques could significantly improve model performance. The best U-Net architecture resulted in an F1-score of 0.683 and an Intersection over Union (IoU) of 0.721.
In another study, Zhu et al. [24] introduced a novel architecture called MAP-Net, which, unlike conventional multi-scale feature extraction methods, employs a multi-path parallel approach to capture high-level semantic features from RGB images while preserving spatial resolution. Experimental results showed that MAP-Net outperformed state-of-the-art methods like HRNetv2 and MA-FCN, achieving notable improvements in F1-score (95.21%, 89.28%, and 93.44%) and IoU (90.86%, 80.63%, and 87.68%) across all datasets, without increasing computational complexity or requiring pre-training and post-processing.
Gashti et al. [25] evaluated five U-Net models with different depths using RGB aerial imagery from Berlin, Paris, Chicago, and Zurich, analyzing the impact of training dataset size and learning rate on model performance. Their results indicated that the U-Net-32-1024 model achieved the best performance, with an IoU of 73.73%, an accuracy of 88.65%, and an F1-score of 88.53%. Moreover, increasing the size of the training dataset significantly enhanced model performance.
One key aspect of these studies is that the data used mainly consists of high-spatial-resolution aerial imagery or high-radiometric-resolution satellite imagery. However, an important question arises: Can the fusion of different data sources, such as aerial and satellite imagery, improve model performance?
Ayala et al. [26] attempted to address this question by integrating 10 m Sentinel-2 (S2) images with 2.5m Sentinel-1 (S1) images to extract building footprints and roads. In this research, a combination of the U-Net model and ResNet-34 was employed. The results indicated that S1 alone struggles with road extraction (0.2376 IoU) and performs worse than S2 for building detection (0.4704 vs. 0.5389 IoU). However, combining S1 and S2 data improves performance, with IoU scores rising to 0.5549 for buildings and 0.4415 for roads. This fusion enhances both tasks, as reflected in the metrics (0.4982 vs. 0.4860 avg. IoU) and visual results.
Despite the advancements in deep learning for building footprint extraction, several challenges remain:
  • Most existing models rely solely on either high-resolution aerial imagery or high-radiometric-resolution satellite images, limiting their adaptability across different datasets;
  • While deep learning models have demonstrated strong feature extraction capabilities, they still struggle with occlusions, shadows, and complex urban landscapes, leading to errors in footprint delineation;
  • Previous studies have primarily focused on single-source data (e.g., aerial or satellite imagery), with limited exploration of how integrating multiple data sources might enhance model performance;
  • Many state-of-the-art models achieve high accuracy at the cost of significant computational overhead, limiting their real-world applicability.
To address these gaps, the present study does the following:
  • Proposes a novel approach that combines aerial and satellite imagery to improve building footprint extraction, leveraging complementary spatial and spectral information;
  • Develops an optimized deep learning framework that integrates multi-source data without significantly increasing computational complexity;
  • Evaluates the impact of data fusion on model accuracy across different urban environments, offering insights into the scalability and robustness of the approach and finally;
  • Introduces an enhanced U-Net-based architecture with specific modifications tailored to multi-source data integration, improving segmentation performance.
The rest of this research is categorized as follows. Section 2 describes the study area, datasets, the deep learning models utilized, and the training parameters. Section 3 presents the model’s outputs, evaluates the results, and discusses the study limitations. Section 4 provides the conclusion.

2. Materials and Methods

The conceptual model of the research is shown in Figure 1. Initially, the necessary data, including Sentinel-2 satellite images, aerial images, and available building footprint information, are collected. In the satellite data preprocessing section, the required indices are extracted from the satellite image, and then resampling is performed on these indices to match the spatial resolution of the aerial images. Two training datasets are then created: one comprising only aerial images and the other consisting of both aerial images and satellite indices. Finally, three different U-Net models, utilizing ResNet-18 and ResNet-34 backbones, are trained using these datasets. The performance of these models is compared to determining the best one.

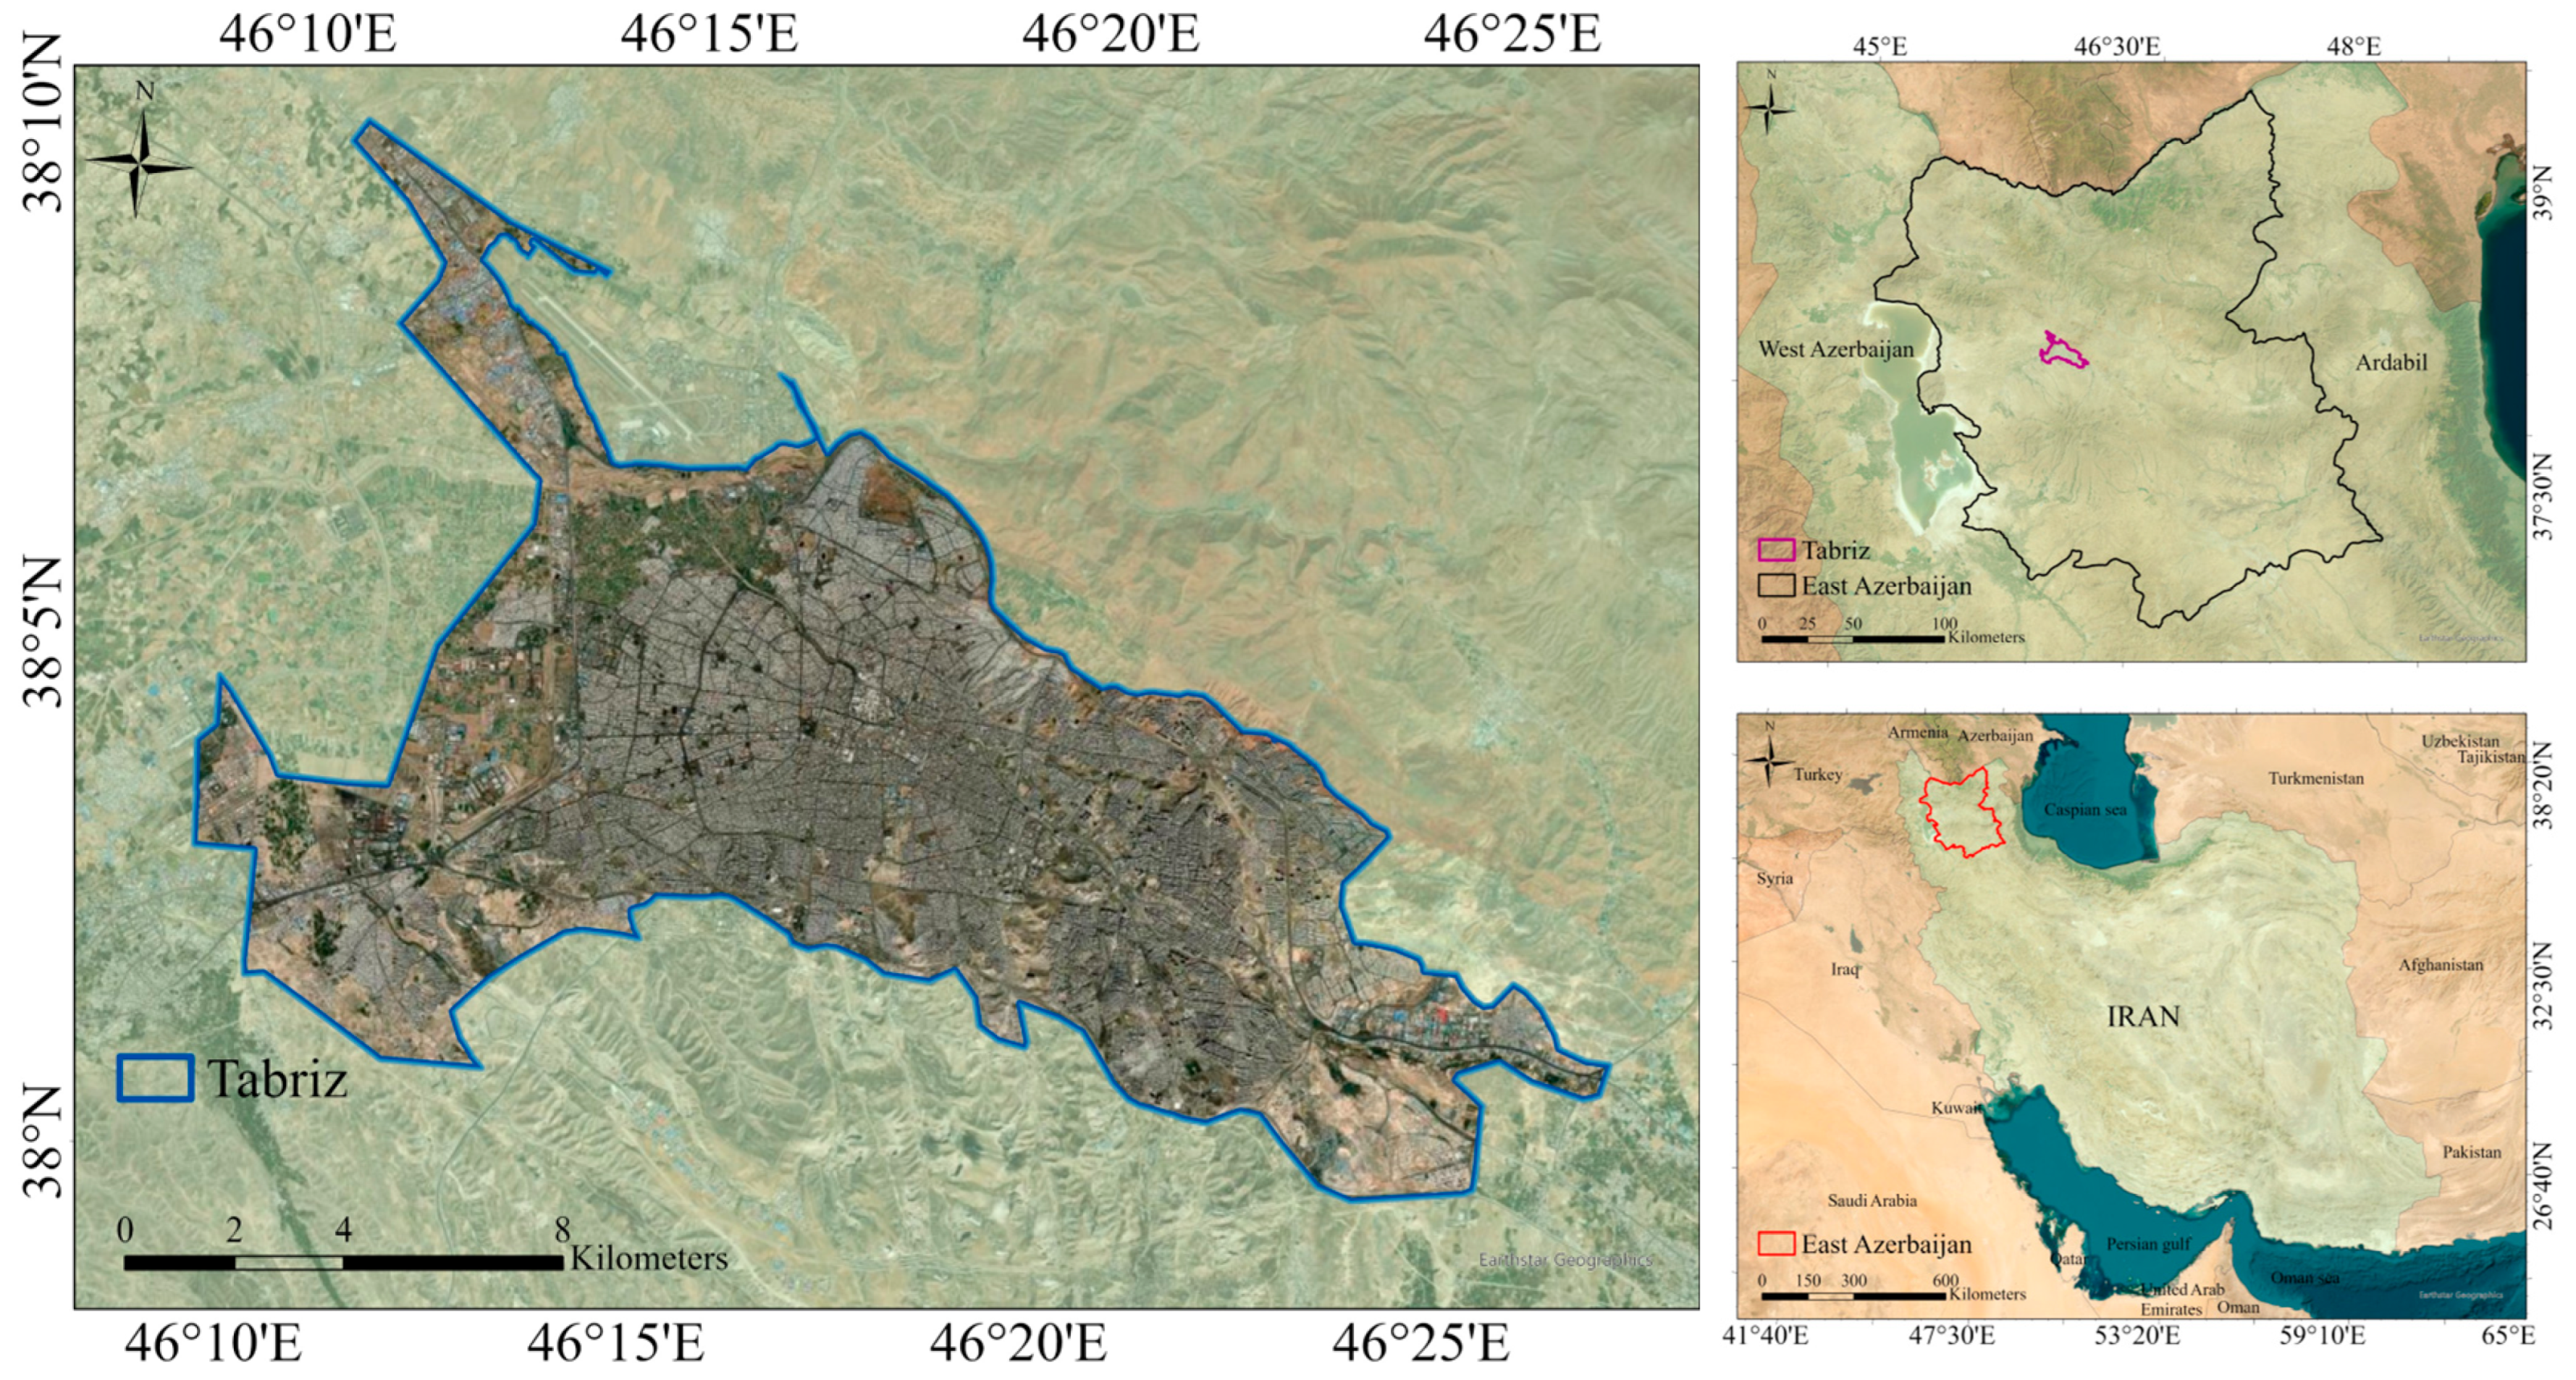
2.1. Study Area and Datasets
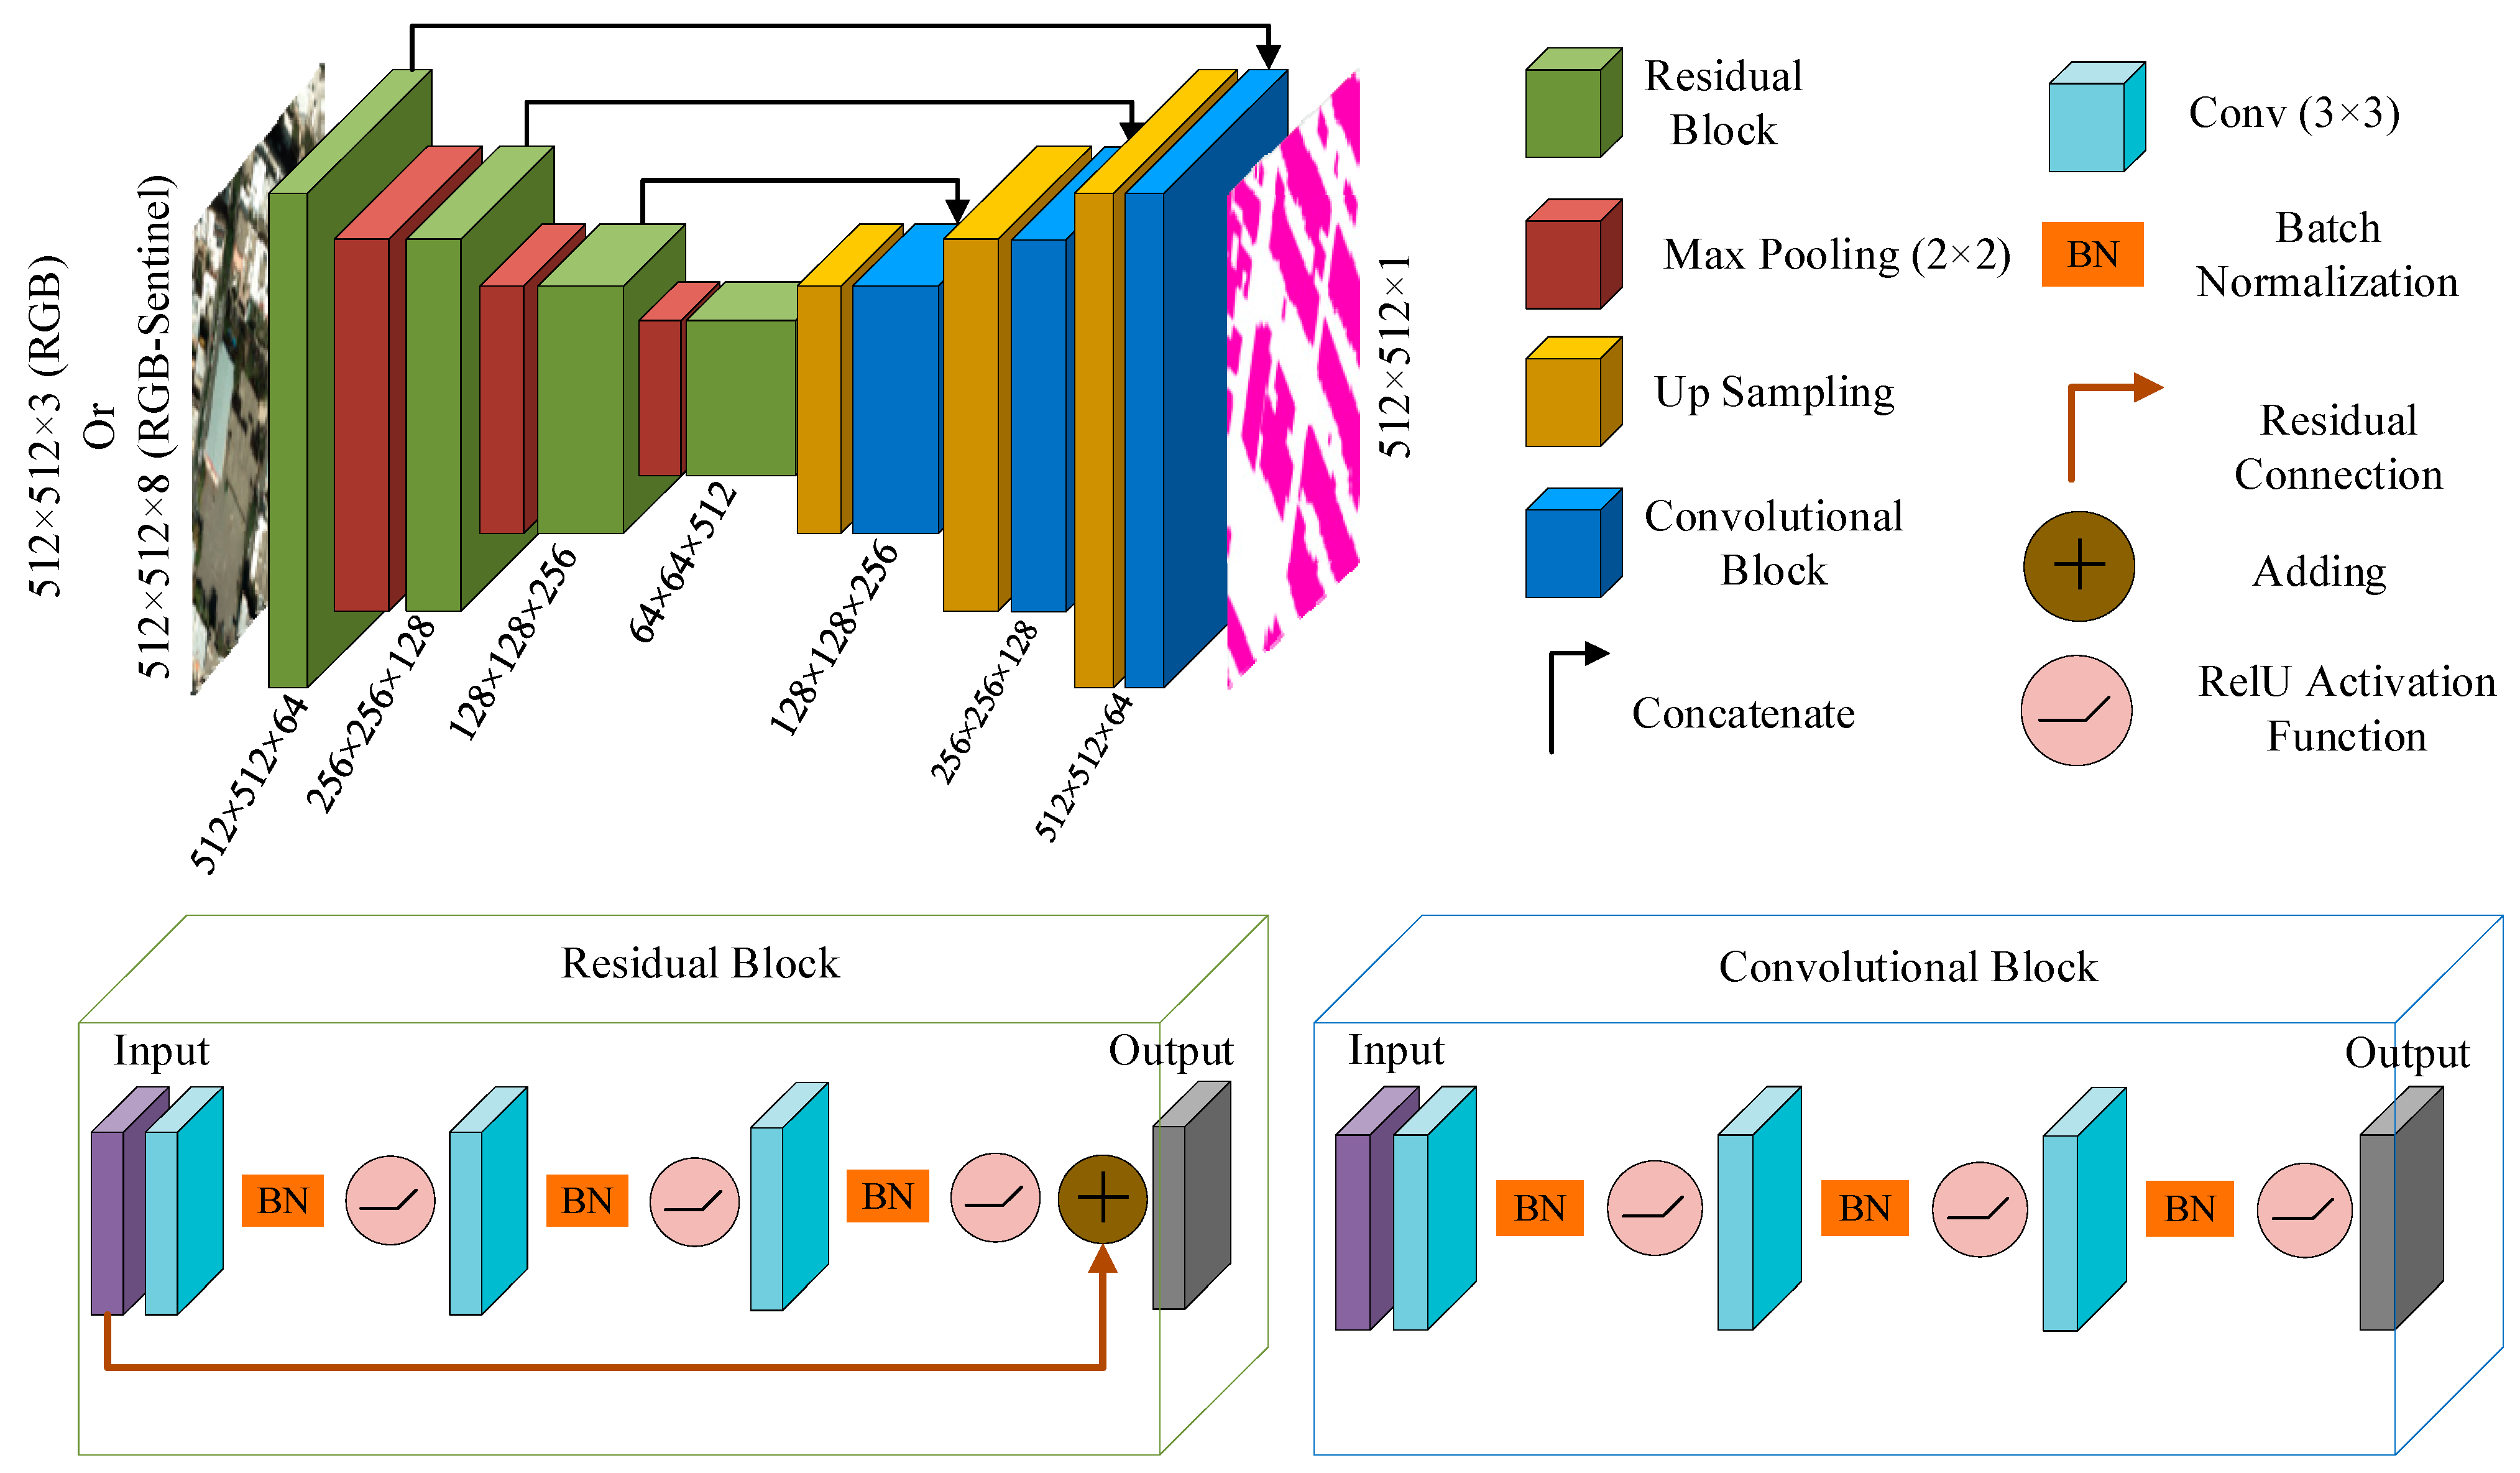
The study area in this research is the city of Tabriz (Figure 2), the capital of East Azerbaijan province in Iran. Tabriz is located at the foothills of the Sahand Mountains, near the Aji Chay River. It is situated approximately 630 km northwest of Tehran and serves as a key transit point between Iran and European and Central Asian countries. The city boasts a combination of old and new buildings, offering a diverse urban landscape.
The historical areas of Tabriz are characterized by old houses featuring traditional architecture, some of which have been designated as national heritage sites. In contrast, the modern sections of the city include high-rise buildings, residential complexes, and commercial centers, all constructed using advanced technologies and designed to be earthquake resistant. The mixture of historical and contemporary architecture makes Tabriz an ideal city for urban studies, particularly for building footprint extraction using deep learning techniques applied to aerial and satellite images.
The aerial images used in this study include orthophotos from Tabriz, produced by aerial imagery with a spatial resolution of 30 cm. The second dataset comprises Sentinel-2 satellite imagery.
Table 1 provides the details of the bands of the Sentinel-2 satellite, which includes the spectral bands used for various applications such as vegetation analysis, water bodies detection, and land cover classification.
The third dataset consists of vector data for building footprints that were hand-drawn from aerial photos of the city of Tabriz (Figure 2).

2.2. U-Net Model

The U-Net model is a deep neural network architecture specifically designed for image segmentation tasks. It has gained significant popularity due to its outstanding performance in image processing-related tasks. U-Net is widely used in fields like computer vision and remote sensing because of its simple yet powerful structure. The U-Net architecture consists of two main pathways: the encoder and the decoder [19].
The encoder part of the network is responsible for feature extraction and reducing the dimensionality of the image. On the other hand, the decoder part is responsible for restoring the image resolution and generating high-precision output maps. A key innovative feature of the U-Net architecture is the skip connections, which transfer spatial information from the encoder layers to the corresponding layers in the decoder. This helps preserve spatial details and improves segmentation accuracy.
Thanks to its effective use of data and skip connections, U-Net performs well even with limited training data, making it highly efficient in segmentation tasks. This capability is particularly useful in remote sensing applications, where high accuracy is required to extract meaningful information from satellite or aerial imagery [27].

2.3. ResNet Model

The ResNet model is one of the most popular and successful deep learning architectures, designed primarily to address the issue of reduced accuracy in very deep neural networks [21]. The core innovation of the ResNet model is the use of residual connections. These connections allow the input of a layer to be directly passed to deeper layers without being altered by the intermediate computations of the earlier layers.
In very deep neural networks, the model’s accuracy often decreases due to learning issues like vanishing gradients or optimization problems. The residual connections enable the model to leverage its initial input information in deeper layers, thus improving the overall performance of the model [28].
By using these residual connections, the network can retain lower-level features from the input and generate only more significant and complex features in deeper layers. This makes the learning process more efficient. ResNet models are categorized into different architectures based on the number of convolutional layers, such as ResNet-18, ResNet-34, ResNet-50, ResNet-101, and ResNet-152. Deeper networks are capable of extracting more information from the input data but require more training data and computational power to be trained effectively [29].

2.4. Combination of U-Net and ResNet

Given the strong performance of the U-Net model in semantic segmentation and the ability of the ResNet model to enhance model performance and mitigate the vanishing gradient problem through residual connections, combining these two models allows the advantages of both to be leveraged. To this end, U-Net has been used as the base model, while ResNet-18 and ResNet-34 serve as the backbone of the U-Net model (Figure 3).
Using ResNet-18 and ResNet-34 as the backbone in the U-Net model improves the feature extraction process using residual blocks. These blocks enable the model to learn and represent more diverse and powerful features, capturing both low-level details, such as edges and textures, and higher-level concepts like shapes and object relationships. This capability results in more precise and detailed segmentation outcomes.
Additionally, ResNet-18 and ResNet-34 are computationally efficient, making them practical choices for applications with resource constraints. This balance ensures that the model delivers high-quality results without requiring extensive computational resources [30]. Figure 3 illustrates the U-Net architecture with ResNet-18 as its backbone.

2.5. Model Training Parameters

In the training process of deep learning models, loss functions are used to evaluate the model’s error. Various loss functions are employed in semantic segmentation, with the most well-known ones being Binary Cross-Entropy (BCE) [31], Categorical Cross-Entropy (CCE) [32], and Focal Loss [33] (Equation (1)). The main drawback of BCE and CCE is their inefficiency in handling imbalanced data [33]. For instance, if an image contains only a small building, the model might still achieve a low error, even if it fails to detect the building. However, Focal Loss addresses this issue by focusing more on challenging classes, enabling the model to identify small classes more effectively. Therefore, this loss function was chosen for model training. The formula for Focal Loss is shown below:
L F L p t = α ( 1 p t ) γ l o g ( p t ) p t =   y ^ i f   t h e   t r u e   c l a s s   i s   1 1 y ^ i f   t h e   t r u e   c l a s s   i s   0
where, in the formula, y ^ is the model’s predicted probability for the positive class, α is a weighting factor (typically between 0 and 1) to balance the importance of positive and negative classes, and γ is the focusing parameter that controls the effect of the modulating factor. Higher values of γ increase the emphasis on hard examples.
To optimize the training process, the Adam optimizer [34] was used as it allows adaptive learning and a faster convergence compare to SGD and requires less tunning [35]. The initial learning rate was set to 0.0001.
All the models were trained for 100 epochs, and the batch size was set to 8 to allow the maximum number of images to be given to the model in order to lower the training time. All models were trained using a fixed number of 100 epochs to ensure consistency and comparability across different architectures.
While it is acknowledged that different CNN architectures may have distinct learning curves and convergence behaviors, a uniform training schedule was adopted to provide a controlled environment for benchmarking performance. This approach allows the effect of model architecture on segmentation performance to be isolated from training duration. To reduce the risk of underfitting or overfitting due to the fixed epoch setting, validation loss was monitored during training, and the model weights corresponding to the best-performing epoch on the validation set were saved and used for evaluation.
All the models were trained on a NVIDIA RTX 4070ti GPU, along with an Intel Core i9 13700k Central Processing Unit (CPU) with 128 Gigabytes of DDR4 RAM.

2.6. Model Evaluation Metrics

To evaluate the model’s performance in building footprint segmentation, the following metrics were used: Intersection over Union (IoU) [36], accuracy [37], precision [38], recall [38], and F1-score [38].
A c c u r a c y = T P T P + T N + F P + F N
I o U = T P T P + F P + F N
P r e c i s i o n = T P T P + F P
R e c a l l = T P T P + F N
F 1 S c o r e = 2 P r e c i s i o n R e c a l l P r e c i s i o n + R e c a l l
Here, TP represents true positives, TN represents true negatives, FP represents false positives, and FN represents false negatives.

3. Results and Discussion

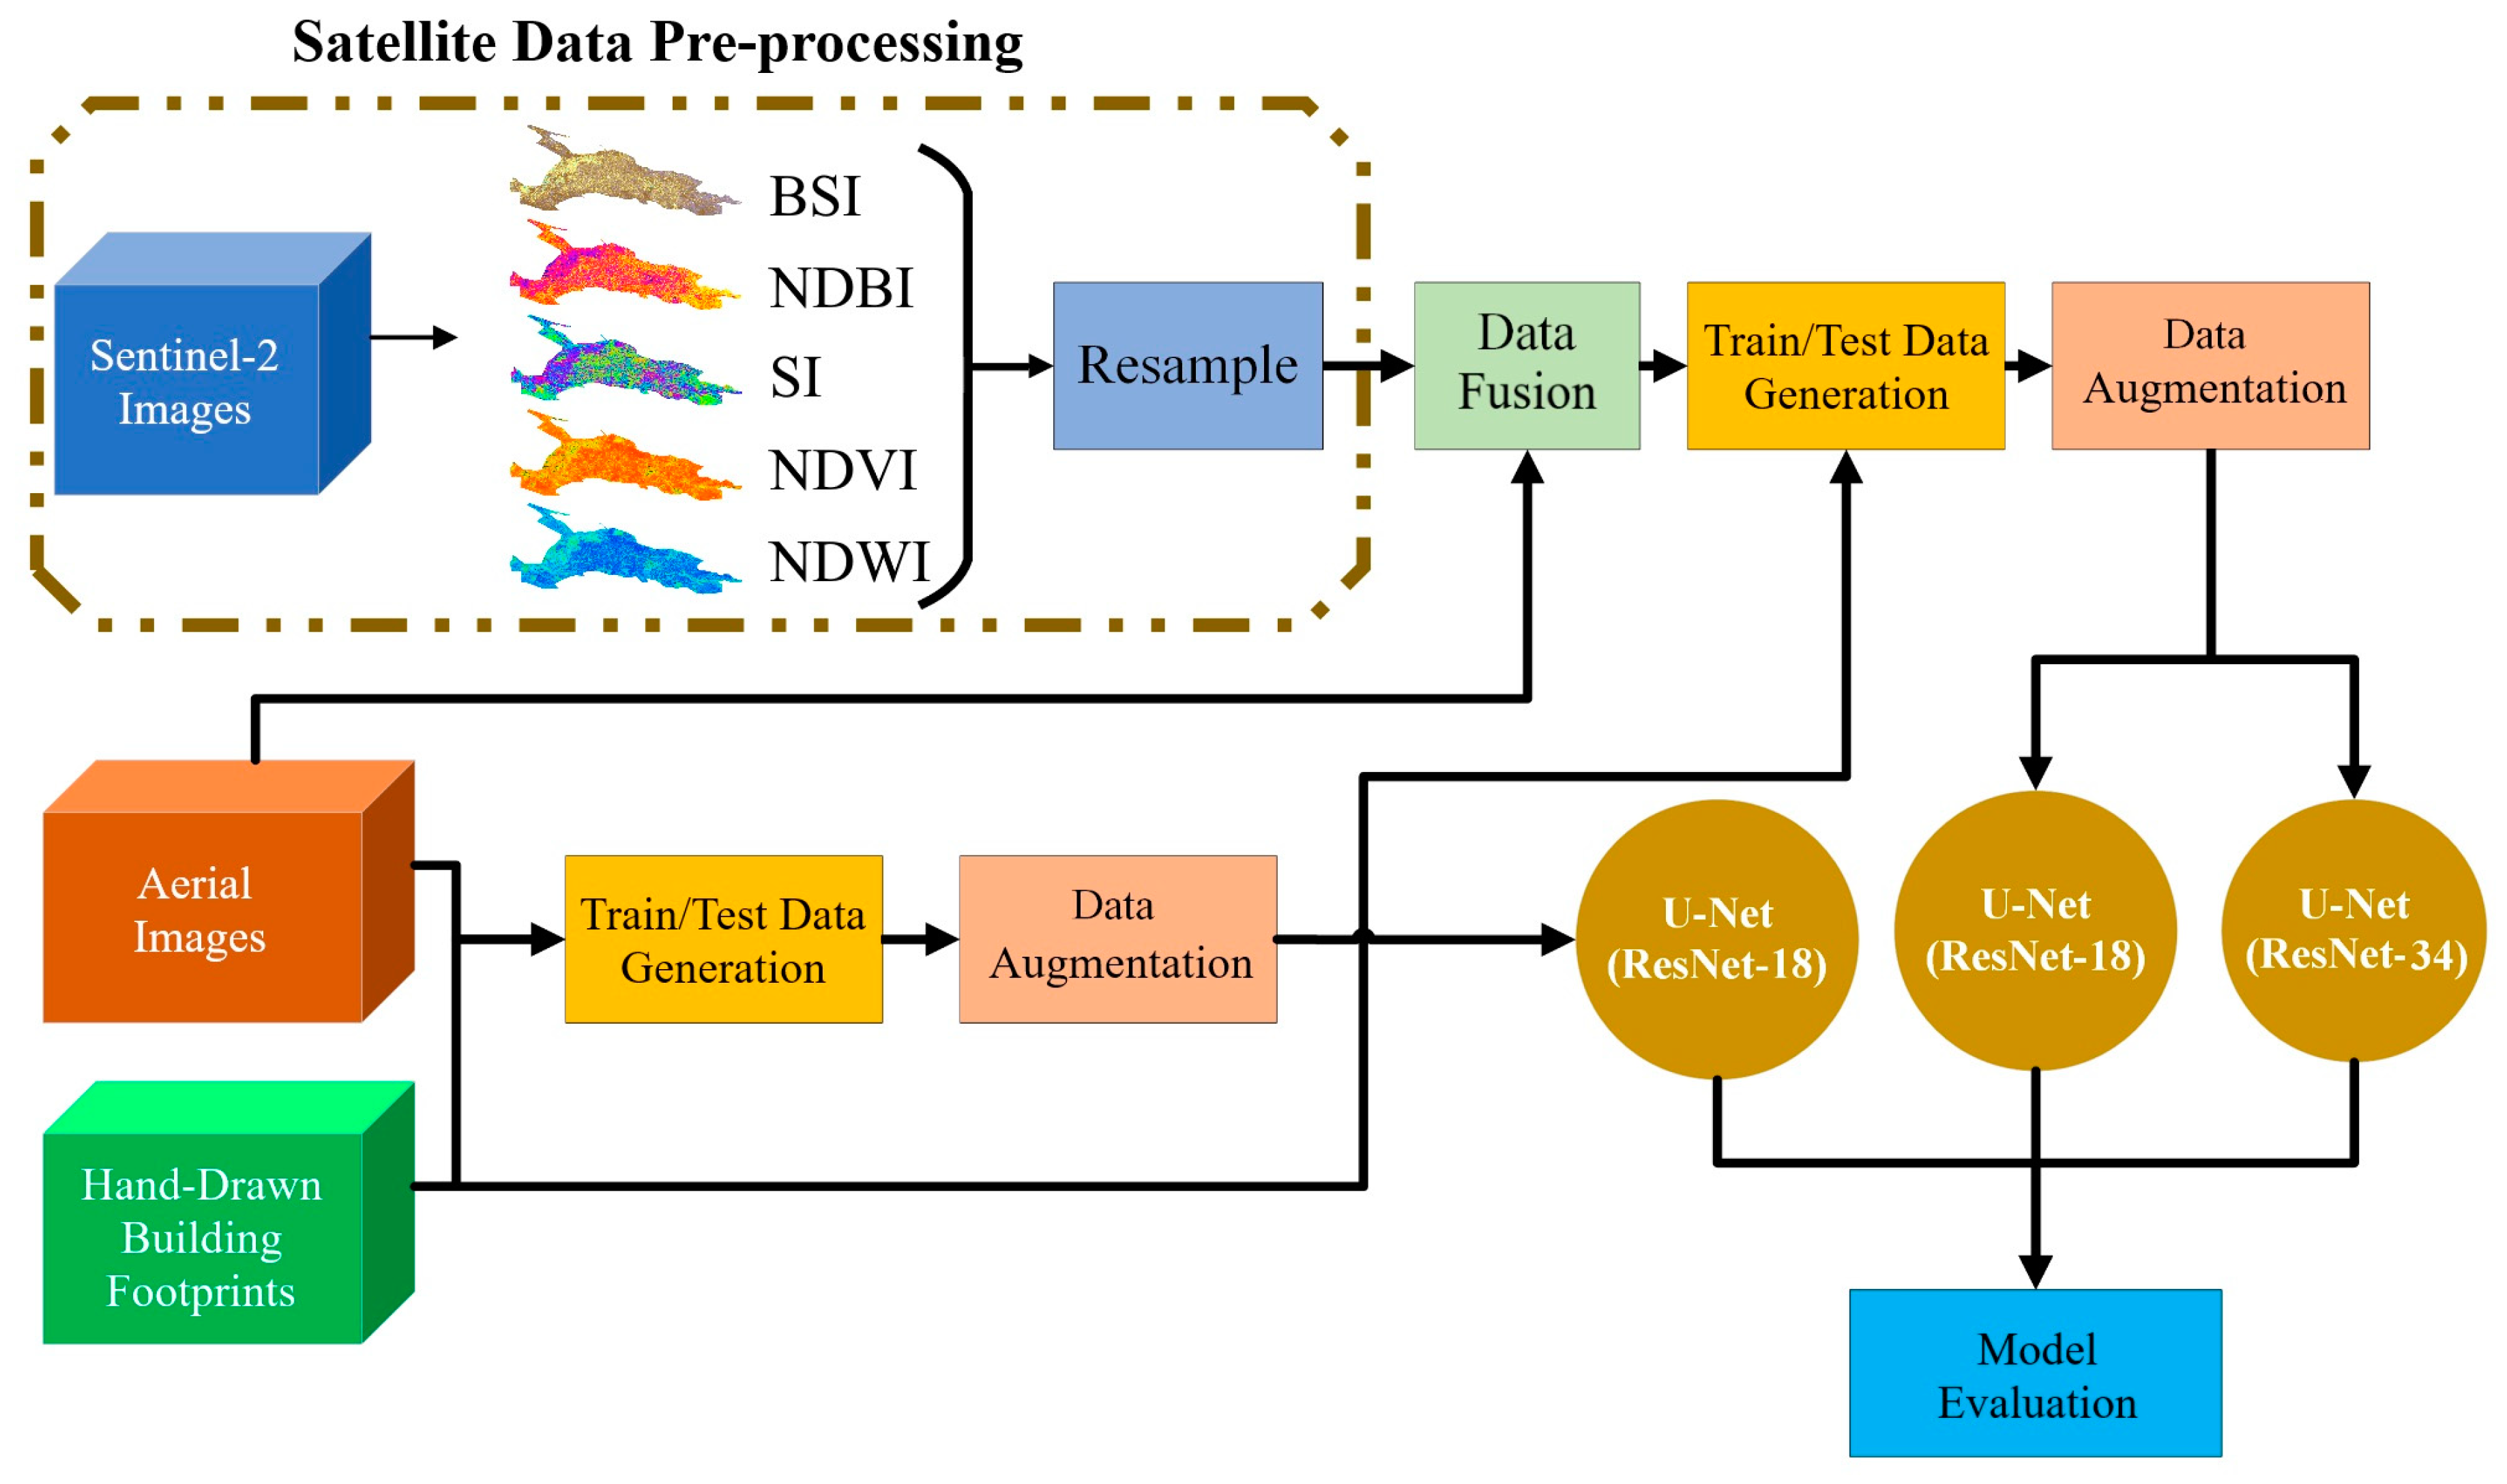
3.1. Extraction and Processing of Spectral Indices

Using Sentinel-2 satellite imagery, various indices were extracted, including the Normalized Difference Vegetation Index (NDVI), Normalized Difference Water Index (NDWI), Normalized Difference Built-up Index (NDBI), Shadow Index (SI), and Bare Soil Index (BSI) (see Figure 4).
The selection of these indices was guided by their relevance to building footprint segmentation. NDVI was included to distinguish vegetated areas from built-up regions, ensuring that green spaces do not interfere with the extraction of building footprints [39]. NDWI was used to mask water bodies, preventing the misclassification of water surfaces as built-up areas [40].
Since the primary objective is to segment buildings, NDBI was selected, as it is specifically designed to enhance the detection of built-up areas, making it a crucial index for identifying urban structures in satellite imagery [41]. SI was incorporated to account for shadows cast by buildings and other structures, which can impact segmentation accuracy by altering reflectance values [42]. Lastly, BSI was used to differentiate bare soil from built-up areas, as exposed land surfaces can sometimes be confused with buildings in spectral analysis [43]. This index is particularly useful for detecting soil in landscapes with minimal vegetation, such as deserts, harvested agricultural fields, or areas affected by erosion.
The formulas for these indices are presented below.
N D V I = N I R R e d N I R + R E D
N D W I = G r e e n N I R G r e e n + N I R
N D B I = S W I R N I R S W I R + N I R
S I = 1 B l u e × ( 1 G r e e n ) × ( 1 R e d ) 3
B S I = R e d + S W I R ( N I R + B l u e ) R e d + S W I R + ( N I R + B l u e )
The aerial image has a spatial resolution of 30 cm, and all extracted indices were resampled to match this resolution. The nearest neighbor interpolation method was used for resampling to ensure that the index values remained unchanged. While other methods, such as bilinear interpolation and cubic convolution, could have produced smoother results by averaging neighboring pixels, the nearest neighbor method was chosen to maintain the integrity of the original index values. It is important to note that Sentinel-2 data were not resampled to improve their spatial detail but to ensure spatial alignment with the aerial images for effective data fusion. Nearest neighbor interpolation was specifically chosen to avoid modifying index values and to preserve the categorical and semantic nature of the spectral indices.
Additionally, deep learning algorithms have indeed demonstrated strong performance in image fusion tasks. However, in our study, we opted for a non-deep-learning approach, as traditional fusion methods provide more interpretability and deterministic outputs, making them more suitable for integration into our framework.
Using the required indices and the building footprint information extracted from the aerial image, two datasets were created for training and testing deep learning models. Following preprocessing, all layers were spatially aligned and co-registered to ensure pixel-level correspondence. In the data fusion step, the aerial imagery was combined with the resampled index layers to create a unified dataset with multiple channels. The result was two distinct datasets:
  • The RGB dataset, containing only aerial imagery with three channels (red, green, and blue);
  • The RGB–Sentinel dataset, containing the aerial image (three channels) plus five additional channels representing the NDVI, NDWI, NDBI, SI, and BSI indices, for a total of eight channels per image.
Both datasets were divided into image patches of size 512 × 512 pixels to standardize input dimensions for training and to allow efficient processing by deep learning models.
Initially, both datasets consisted of 7388 images. Through data augmentation techniques, such as 90-degree and 180-degree rotations as well as horizontal and vertical flipping, for each image, two more images were created, increasing the total number of images to 22,164. While other data augmentation methods, such as brightness adjustment, contrast enhancement, and Gaussian noise addition, exist, rotation and flipping were specifically chosen as they preserve the original image values.
Finally, both datasets were split into training, validation, and test sets at a ratio of 7:2:1. Figure 5 shows the images and corresponding masks for the training data.

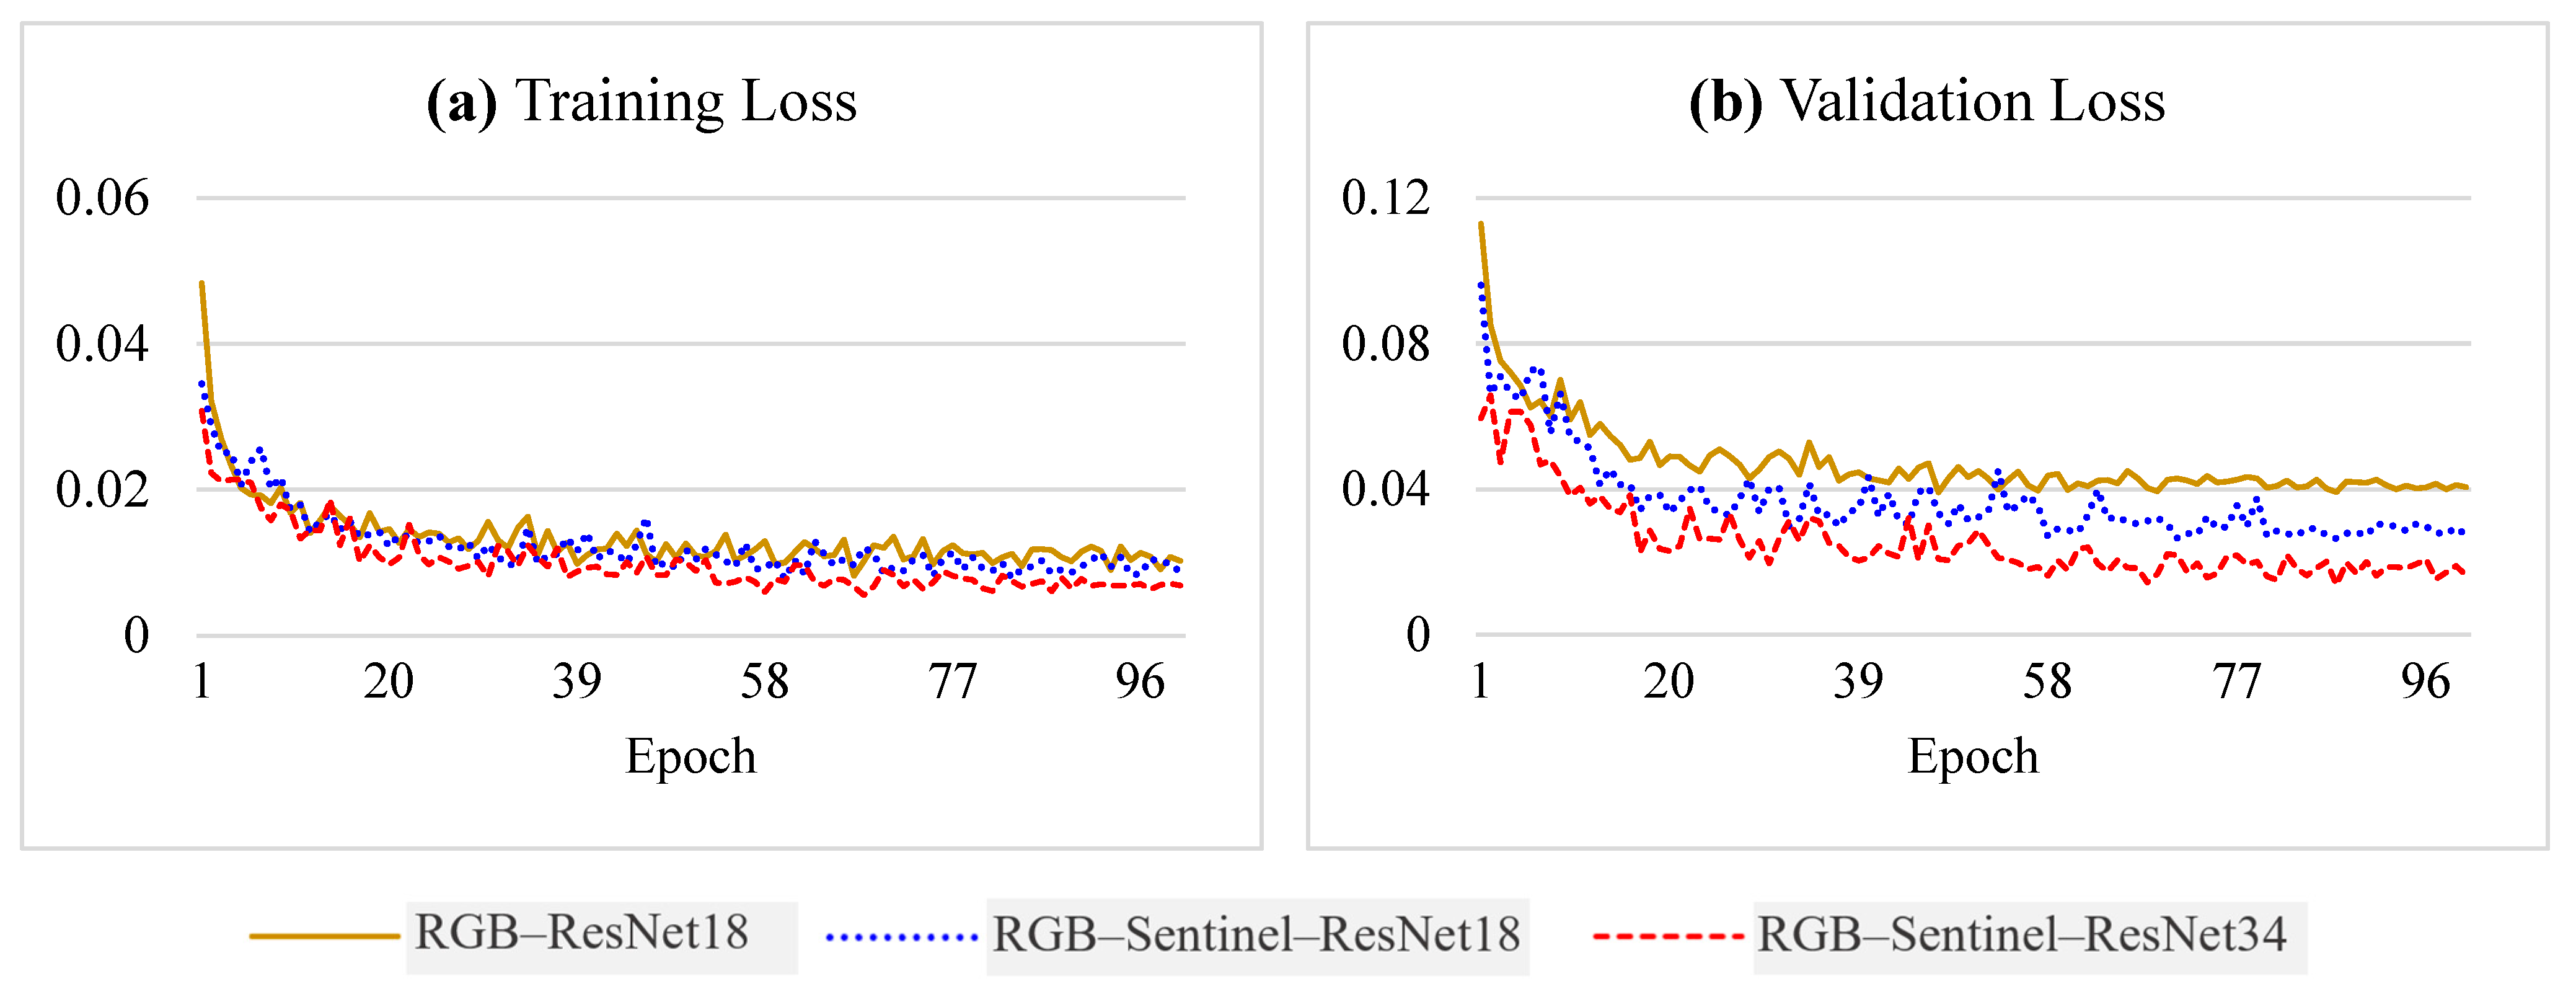
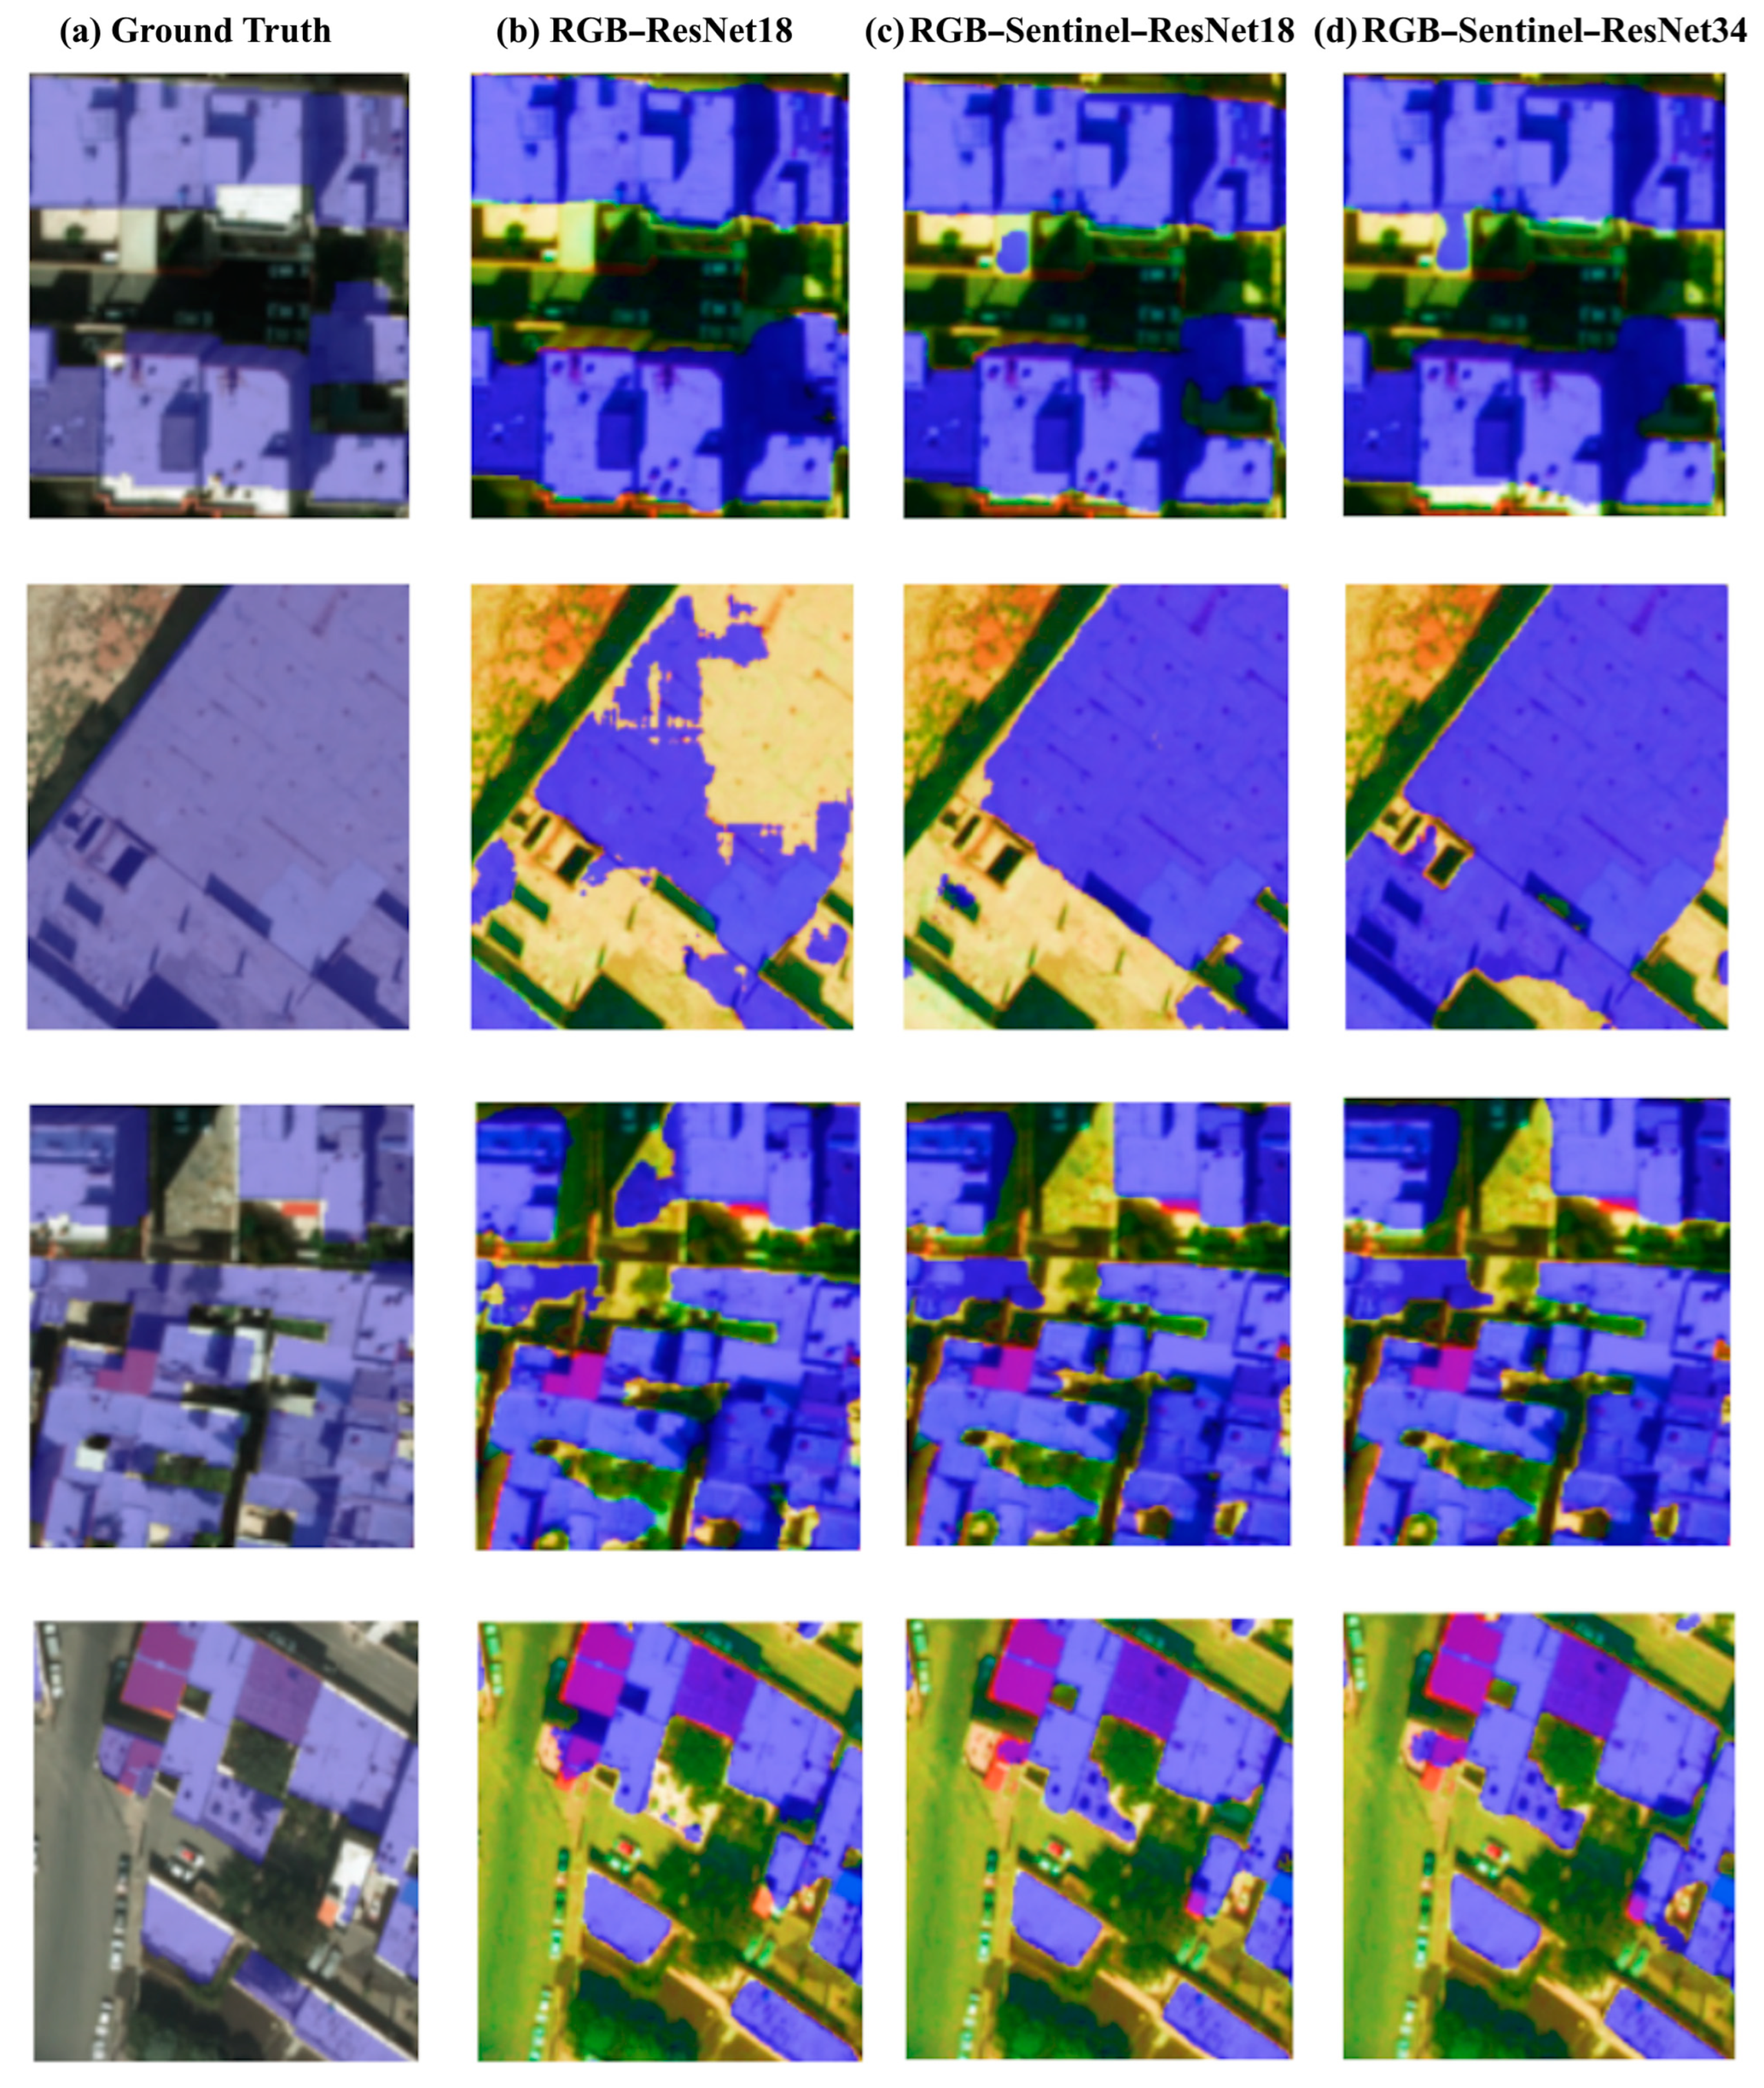
3.2. Model Training and Performance Evaluation

The first model utilized U-Net architecture with a ResNet-18 backbone and was trained solely on aerial images. The second model retained the same U-Net and ResNet-18 architecture but was trained on fused data that included both aerial images and Sentinel-derived indices. The inclusion of additional spectral indices, such as NDVI, NDWI, and NDBI, aimed to enhance the model’s ability to distinguish between different land cover types and improve segmentation accuracy.
The third model, featured a U-Net architecture with a ResNet-34 backbone and was also trained on the fused dataset. Compared to ResNet-18, ResNet-34 offers deeper feature extraction capabilities, allowing for better representation of complex spatial patterns. Training loss and validation loss results for the models are displayed in Figure 6.
The results of training loss and validation loss for the models are displayed in Figure 6. The x-axis represents the epochs. Analyzing the training loss of all three models reveals that none of them overfitted the data. However, when analyzing the validation loss, it is evident that the RGB–Sentinel–ResNet34 model consistently had the lowest validation loss from the beginning. It demonstrated a more stable decrease throughout the training process, ultimately reaching a final validation loss of 0.0162. The RGB–Sentinel–ResNet18 model performed slightly worse, with a final validation loss of 0.0277. The RGB–ResNet18 model had the poorest performance among the three, achieving a final value of 0.0400. Overall, the RGB–Sentinel–ResNet34 model outperformed the others in reducing validation loss, demonstrating its superior performance. Furthermore, an analysis of the IoU and accuracy values (Figure 7) confirms that the RGB–Sentinel–ResNet34 model outperforms the other two models.
Analyzing the IoU and accuracy values, reveals that the RGB–Sentinel–ResNet34 model significantly outperforms the other two models, achieving an IoU of 73.86% and an accuracy of 96.99%. The RGB–Sentinel–ResNet18 model ranks second, with an IoU of 69.29% and an accuracy of 94.59%. In contrast, the RGB–ResNet18 model has the lowest performance among the three, with an IoU of 66.92% and an accuracy of 92.77%. Additionally, after analyzing the IoU and accuracy values, the average precision, recall, and F1-score for the evaluation data were calculated. The results of these calculations are presented in Table 2.
The RGB–Sentinel–ResNet34 model has achieved the best results for both the building footprint and background classes due to its more advanced architecture and the use of Sentinel data (Figure 8).
Considering the training times, the RGB–ResNet18 model took 19 h, 50 min, and 11 s; the RGB–Sentinel–ResNet18 took 30 h, 48 min, and 55 s; and finally, the RGB–Sentinel–ResNet34 completed training in 32 h, 26 min, and 32 s. This represents an increase of about 10 h and 58 min (roughly 55% longer) for adding the Sentinel data. Although the RGB–Sentinel–ResNet34 is the most complex model among the three models, its training time is only about 5% longer than the RGB–Sentinel–ResNet18 model.
While this increase in training time may seem significant, the performance gains provided by adding the Sentinel data to the models justify the added time. The RGB–Sentinel–ResNet34 and RGB–Sentinel–ResNet18 models demonstrated consistently higher precision, recall, and F1-score for both the “Background” and “Building Footprint” classes. Therefore, if computational resources are limited, the RGB–Sentinel–ResNet18 model is a suitable alternative, as it still provides acceptable results. The use of Sentinel data has significantly enhanced the performance of the models, and these data can be leveraged further in similar projects. These findings suggest that combining diverse data sources with advanced architecture can lead to a substantial improvement in the accurate and comprehensive extraction of geographic information.

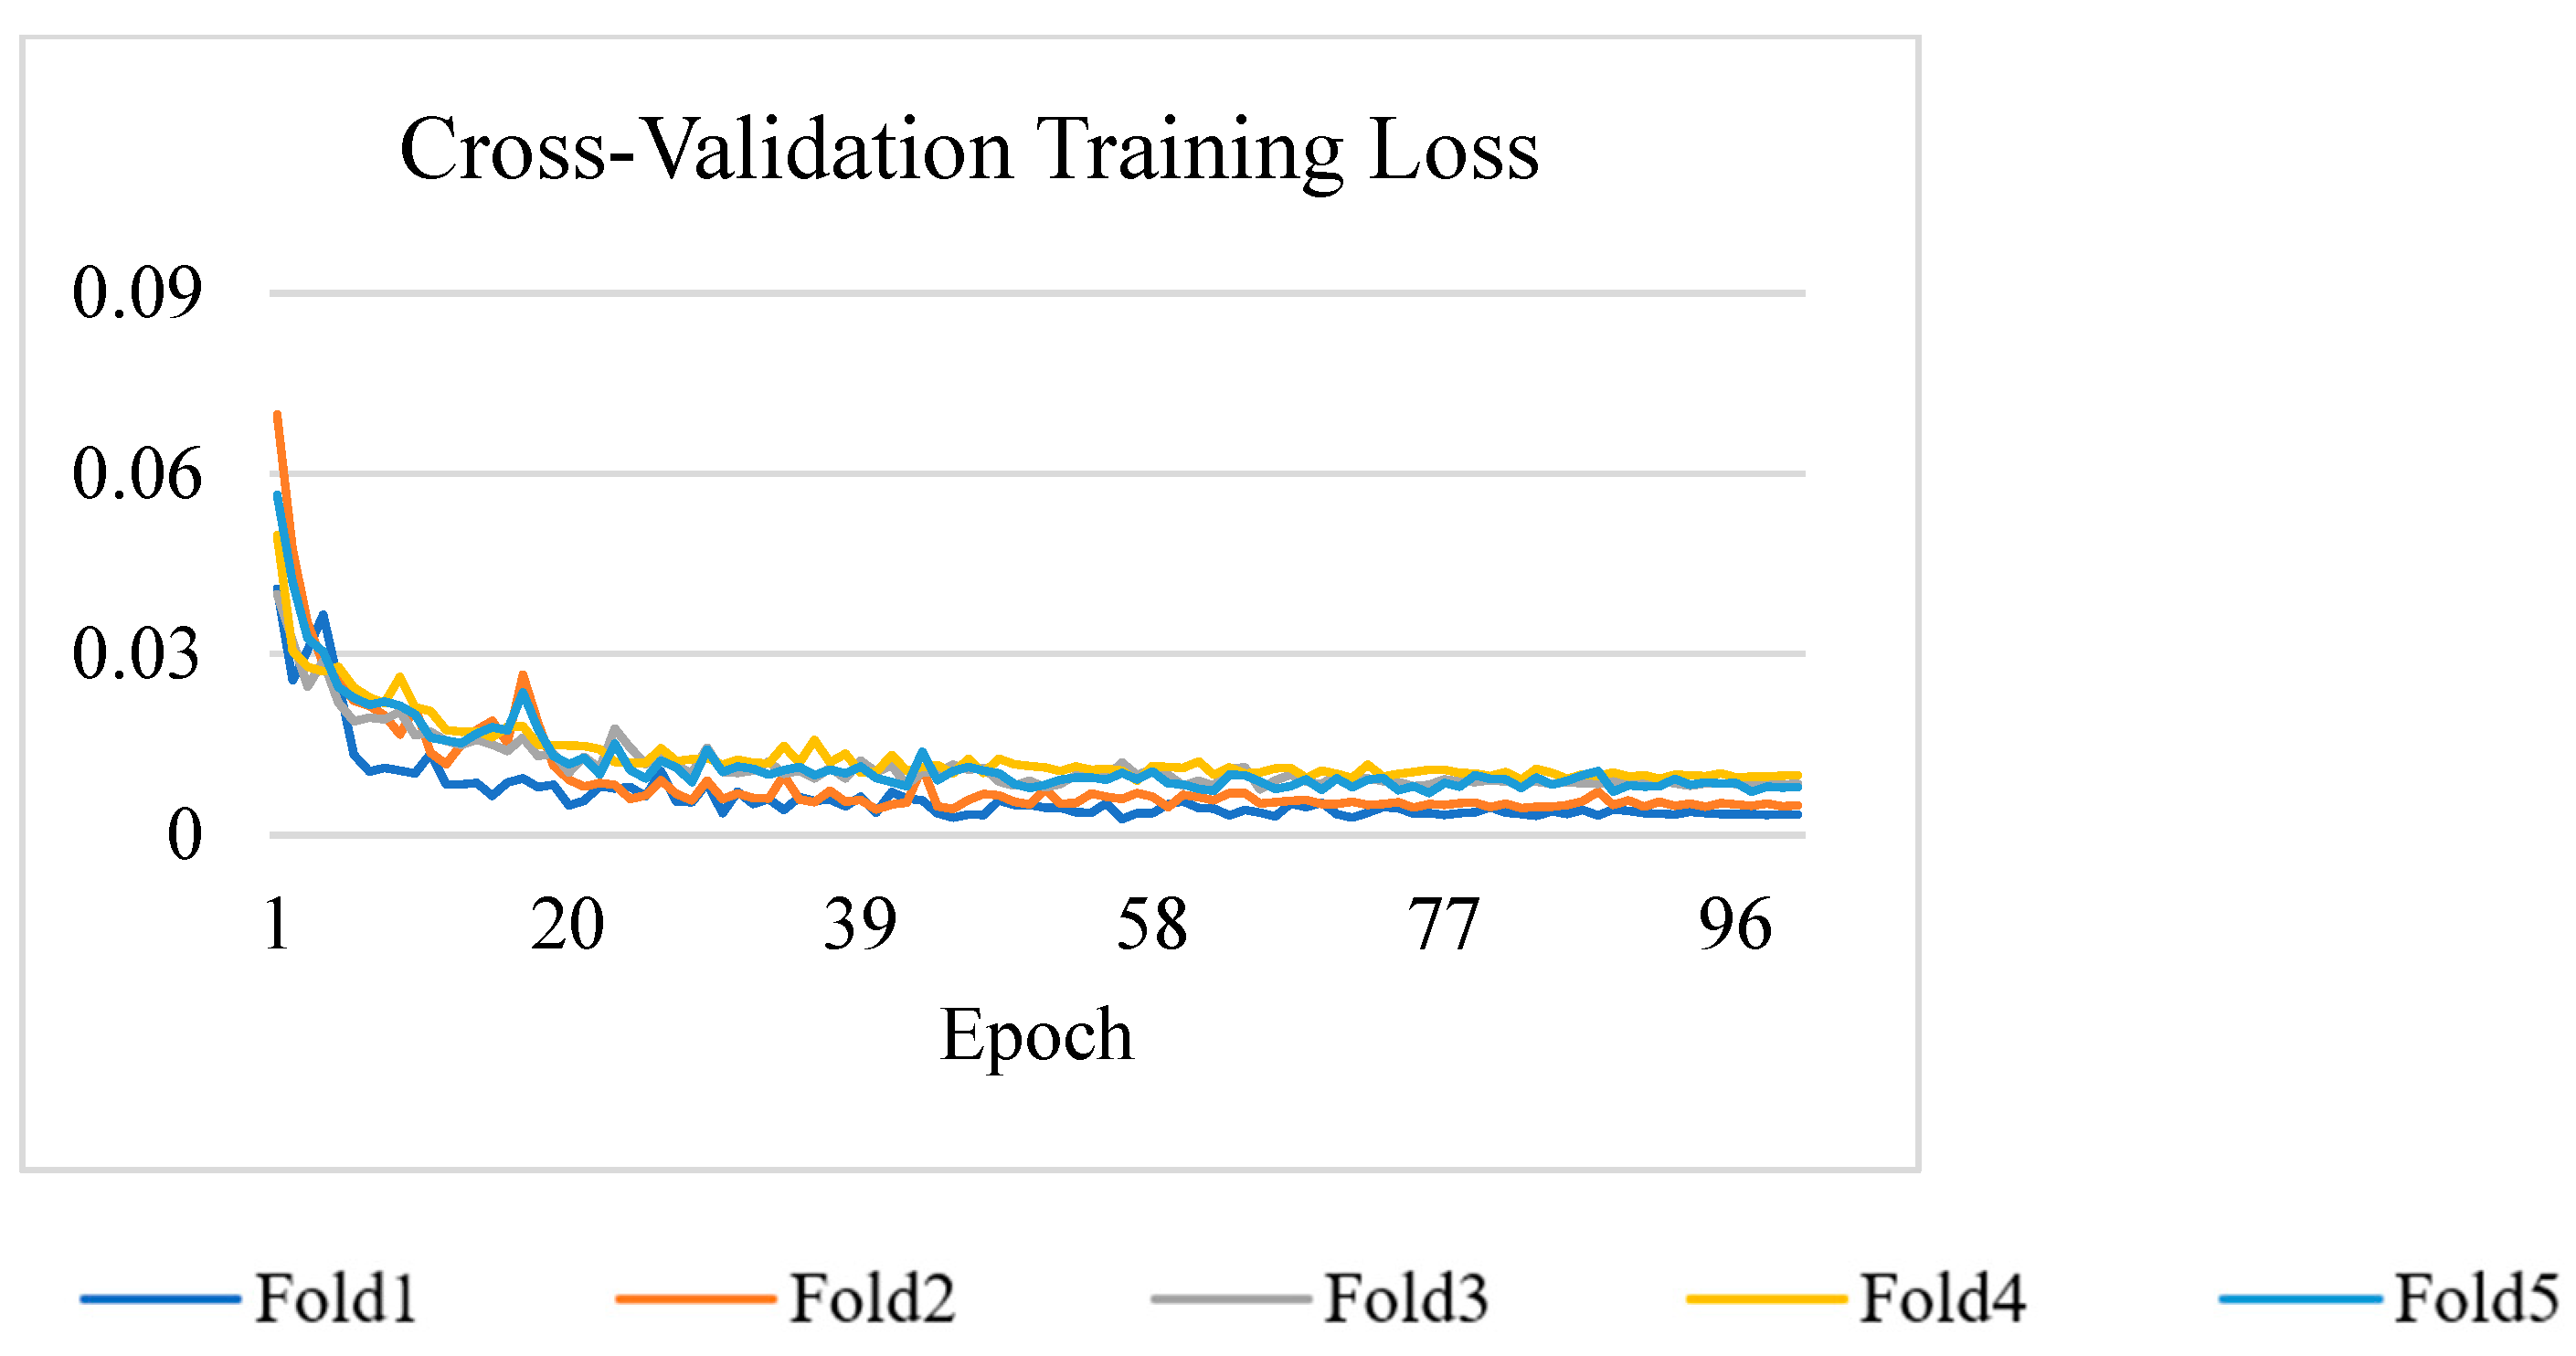
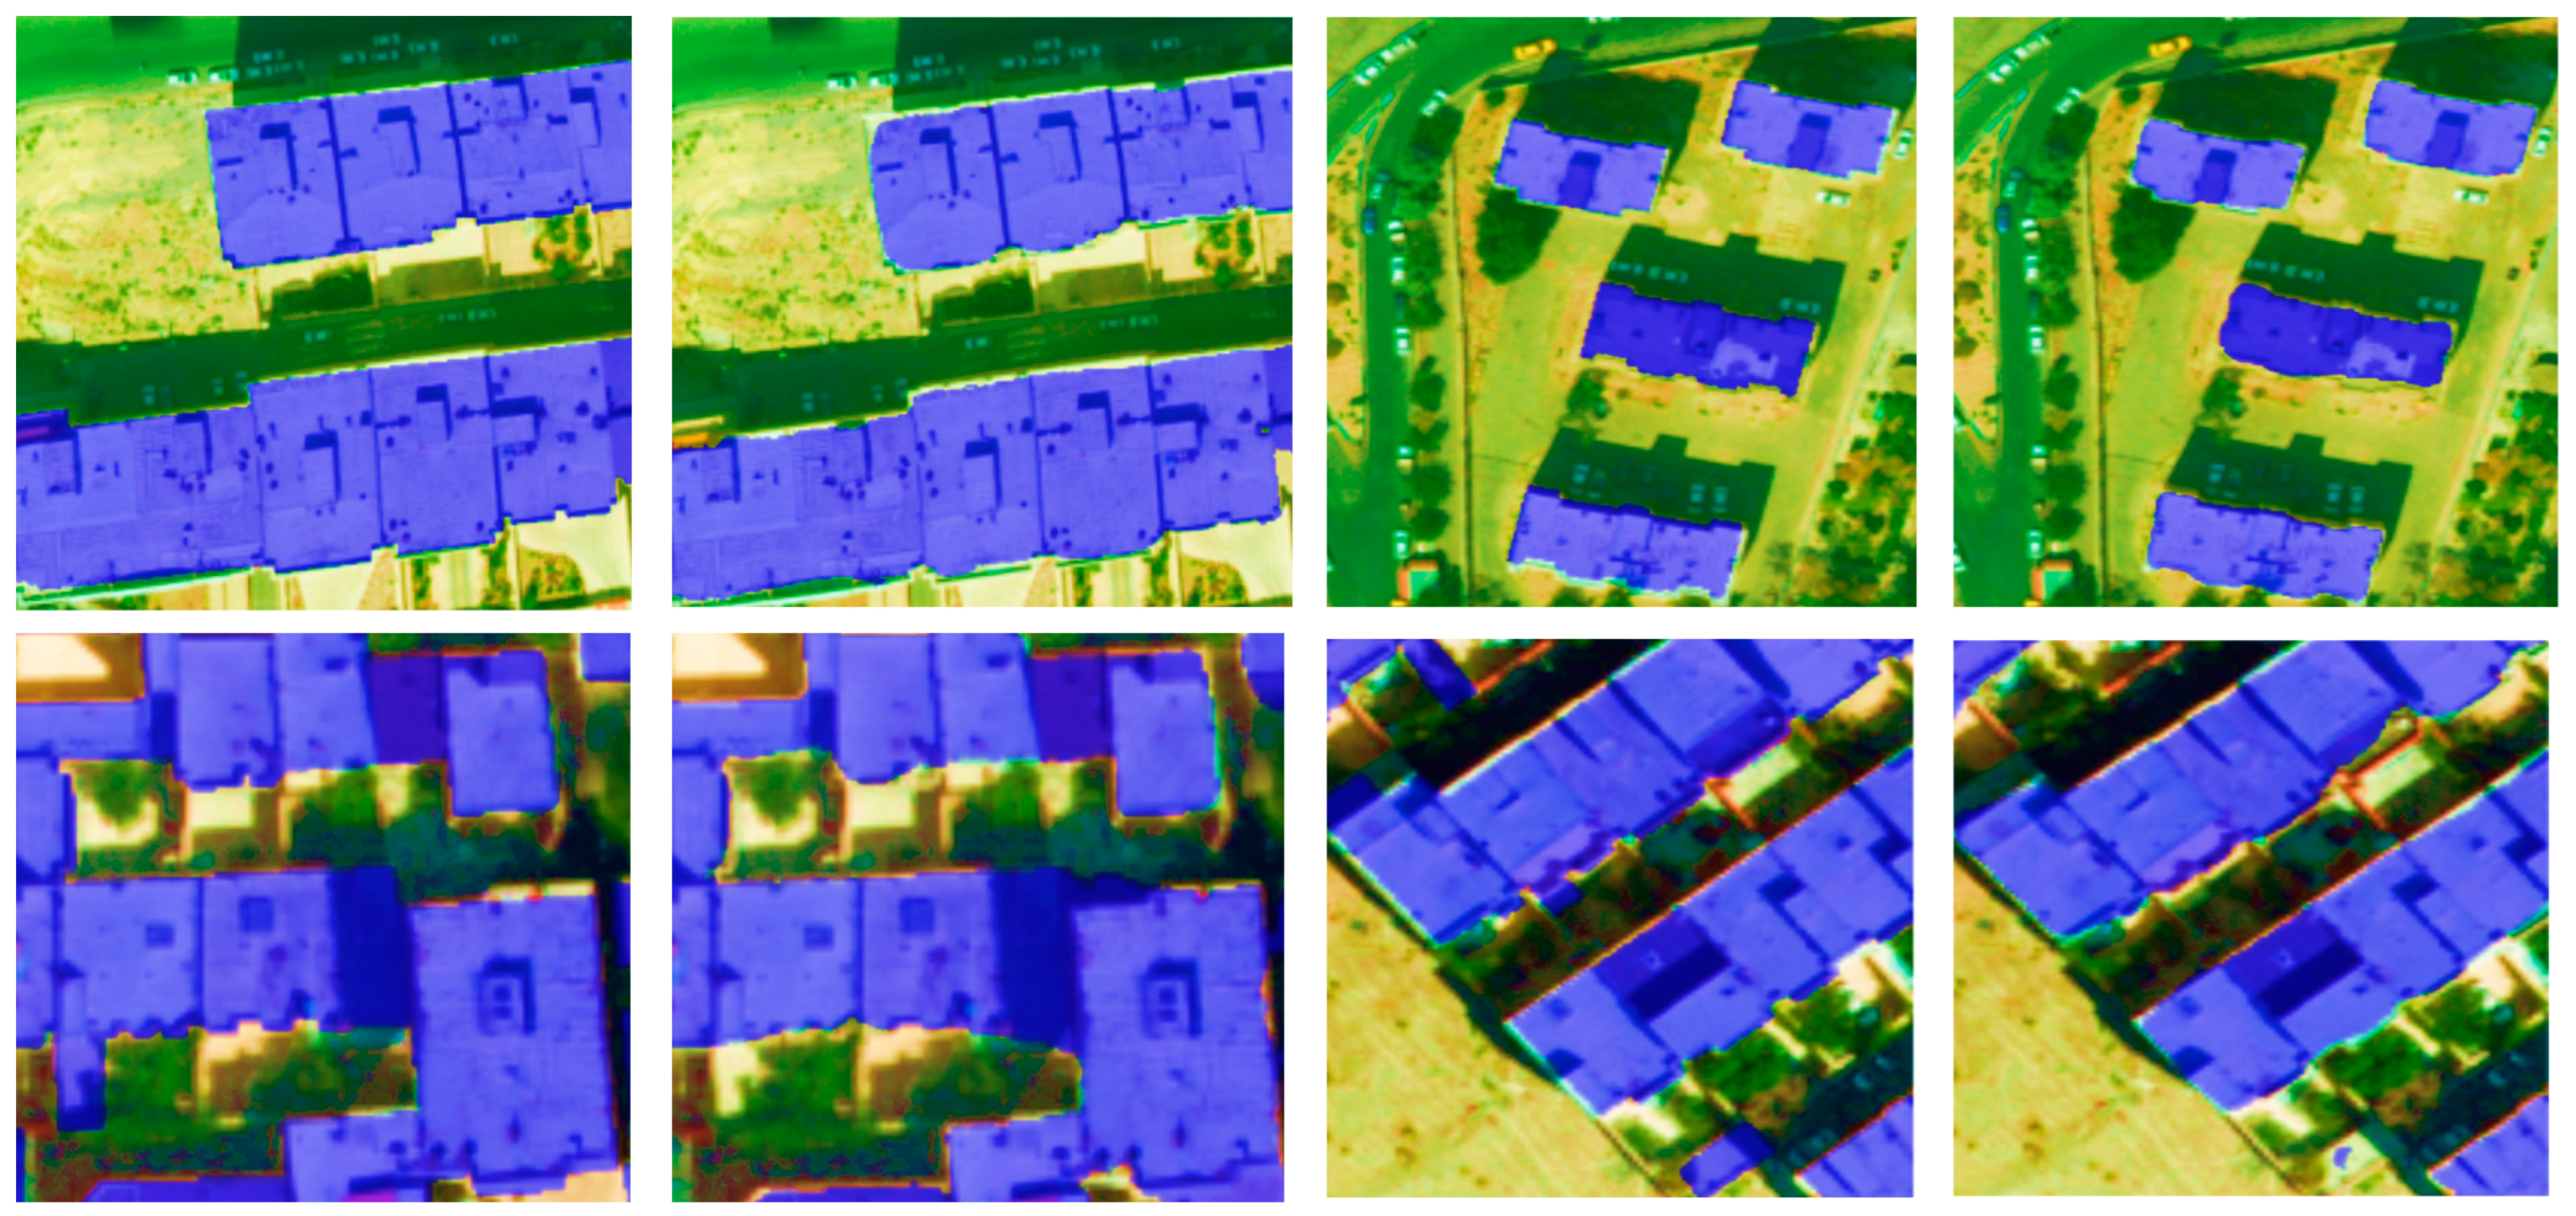
3.3. Cross-Validation of the Best Model

Cross-validation is a technique used to evaluate the performance of a machine learning or deep learning model. Instead of relying on a single train-test split, cross-validation gives a more robust estimate of a model’s ability to generalize to new, unseen data [44]. To evaluate the generalizability and robustness of the proposed model, K-fold cross-validation was employed. In this approach, the dataset is randomly divided into K equally sized subsets or “folds”. Each fold is used exactly once as a validation set, while the remaining K-1 folds serve as the training data. This process is repeated K times, and the performance metrics from each fold are averaged to obtain a reliable estimate of the model’s overall performance.
In this study, we used K = 5, which is a commonly used setting that provides a good balance between bias and variance in the error estimation.
The cross-validation training loss (Figure 9) across all five folds exhibits a consistent and sharp decrease within the first 10–15 epochs. This indicates that the model rapidly learns to minimize error early in training. As training progresses, the curves flatten and converge, suggesting stability in learning and absence of major overfitting signs within the training domain.
The accuracy curves (Figure 10) show steady improvement across all folds, starting around 80–88% and reaching above 95% by the end of training. Fold 2 starts notably lower (around 78%) and ends around 93–94%, slightly behind the others, which may suggest either higher complexity or noise in that particular data split. Nevertheless, all folds exhibit upward trends, demonstrating strong performance.
IoU improves steadily across epochs for all folds. Initial values range between 35 and 50% and eventually rise to 65–75%. Similarly to the accuracy plot, fold 2 consistently underperforms slightly, possibly due to less ideal data distribution or more challenging examples. Still, all folds show significant performance gains, with convergence around the 70% mark, indicating reliable spatial overlap predictions.
Figure 11 illustrates some of the results of RGB-Sentinel_ResNet34. Finally, the average precision, recall, and F1-score for the cross-validation folds were calculated. The results of these calculations are presented in Table 3.
The background class exhibits near-perfect performance, with minimal variability across folds—showcasing excellent model generalization and reliability. For the building footprint class, the model performs well but with slightly greater variability and a noticeable gap between precision and recall, hinting at a conservative prediction bias (favoring precision over recall). The consistency of scores across folds further confirms the robustness of the model under different data splits, supporting the validity of the reported performance.

3.4. Limitations and Future Directions

One key limitation is the reliance on Sentinel-2 satellite imagery, which has a spatial resolution that may not capture fine-grained details in dense urban areas or complex building structures. The models’ performances might be impacted by variations in lighting conditions, seasonal changes, and atmospheric distortions that affect satellite images. Furthermore, while Sentinel-2 indices provided valuable spectral information, incorporating additional remote sensing data sources such as LiDAR, SAR, or higher-resolution aerial imagery, could further improve model accuracy.
Computational efficiency is another challenge. The RGB–Sentinel–ResNet34 model demonstrated superior performance, but its deeper architecture demands significant computational resources. In real-world applications, where access to high-performance GPUs may be limited, model optimization techniques such as knowledge distillation, pruning, or quantization should be considered to reduce computational overhead while maintaining high accuracy. Future work could explore the application of model compression techniques to reduce inference time and computational load, particularly for deployment on edge devices or large-scale processing tasks.
For future work, integrating multi-modal data sources, including SAR imagery and LiDAR point clouds, could provide richer spatial and spectral information, leading to improved segmentation performance. Additionally, exploring advanced deep learning architectures, such as transformer-based models, could enhance the model’s ability to capture long-range dependencies in remote sensing data. Future studies should also investigate semi-supervised and unsupervised learning approaches to reduce the dependency on labeled datasets, making the approach more scalable and applicable to larger geographic areas.
Considering that building height can significantly influence detection, it is recommended that future research explore the impact of using elevation data, such as the normalized digital elevation model, in building detection efforts.
Overall, while this research has demonstrated the effectiveness of integrating Sentinel-2 indices with deep learning architectures for building footprint extraction, further advancements in data fusion, model optimization, and domain generalization are necessary to refine and enhance the applicability of these methods in practical scenarios.

4. Conclusions

The extraction of building footprints from aerial and satellite images has become a key focus in remote sensing, primarily due to its significant role in urban planning, disaster management, and 3D city modeling. While traditional methods, which rely on manual processing and classic algorithms such as SVM, have achieved acceptable accuracy in some cases, they come with notable limitations. These include sensitivity to noise, high computational resource requirements, and poor performance in complex environments. In the past decade, the emergence of deep learning, especially convolutional neural networks, has revolutionized remote sensing image processing. These advanced methods are capable of learning complex semantic features without the need for manual feature design, offering higher accuracy and generalizability than traditional methods. As a result, they have become the standard for extracting building footprint information.
This research investigates methods to improve model accuracy by fusing aerial data and Sentinel-2 satellite images, along with various spectral indices. The study employed two different datasets: high-resolution aerial images (30 cm) and Sentinel-2 satellite data from the city of Tabriz. From the satellite image, indices such as NDVI, NDWI, NDBI, SI, and BSI were extracted. Different models were then trained using either the aerial images alone or a combination of the aerial images and the extracted indices.
In the evaluation of IoU and accuracy values, the RGB–Sentinel–ResNet34 model showed superior performance compared to the other models, with an IoU of 73.86% and accuracy of 96.99%. When evaluating precision, recall, and F1-score metrics, the RGB–Sentinel–ResNet34 model again performed the best, with an F1-Score of 90.57% for the building class and 97.44% for the background class. The RGB–Sentinel–ResNet18 model also provided good results and, considering its lower computational requirements, is a suitable option when resources are limited. In contrast, the RGB–ResNet18 model performed the weakest for both the building and background classes. Overall, the RGB–Sentinel–ResNet34 model, with its advanced architecture and use of diverse data, showed better performance in extracting building footprint information. The use of Sentinel data significantly improved the results, indicating that these data can be utilized to increase accuracy in similar projects. The combination of diverse data sources and advanced architectures is an effective approach for improving the accurate and comprehensive extraction of geographic information. In future studies, the proposed methodology will be applied to datasets from other geographic regions, including cities in Europe, North America, and East Asia. This will allow a more comprehensive evaluation of the model’s generalizability across diverse urban forms and architectural styles.
Considering the fact that building height can significantly influence detection, it is recommended that future research explore the effect of using elevation data, such as the normalized digital elevation model, in building detection.
Overall, the RGB–Sentinel–ResNet34 model, with its advanced architecture and the integration of diverse data, showed enhanced performance in extracting building footprint information. The incorporation of Sentinel data significantly improved the results, indicating that these data can be leveraged to increase accuracy in similar projects. The combination of various data sources and advanced architectures is an effective strategy for improving the accurate and comprehensive extraction of geographic information.

Author Contributions

Conceptualization, E.H.G., H.B., M.J.V.Z. and E.G.; methodology, E.H.G.; formal analysis, E.H.G. and H.B., data curation, E.H.G. and H.B.; writing—original draft preparation, E.H.G. and H.B.; writing—review and editing, M.J.V.Z. and E.G.; visualization, E.H.G., H.B. and E.G.; supervision, M.J.V.Z. and E.G. All authors have read and agreed to the published version of the manuscript.

Funding

This research is funded by Space It Up, funded by the Italian Space Agency and the Ministry of University and Research—Contract No. 2024-5-E.0—CUP No. I53D24000060005.

Institutional Review Board Statement

Not applicable.

Informed Consent Statement

Not applicable.

Data Availability Statement

Data employed in this research can be made available upon request.

Acknowledgments

The authors thank the reviewers for their time and insightful comments. E. Ghaderpour thanks Space It Up, funded by the Italian Space Agency and the Ministry of University and Research—Contract No. 2024-5-E.0—CUP No. I53D24000060005.

Conflicts of Interest

Author Ebrahim Ghaderpour was employed by the Earth and Space Inc. The remaining authors declare that the research was conducted in the absence of any commercial or financial relationships that could be construed as a potential conflict of interest.

References

  1. Nurkarim, W.; Wijayanto, A.W. Building footprint extraction and counting on very high-resolution satellite imagery using object detection deep learning framework. Earth Sci. Inform. 2023, 16, 515–532. [Google Scholar] [CrossRef]
  2. Soleimani, R.; Soleimani-Babakamali, M.H.; Meng, S.; Avci, O.; Taciroglu, E. Computer vision tools for early post-disaster assessment: Enhancing generalizability. Eng. Appl. Artif. Intell. 2024, 136, 108855. [Google Scholar] [CrossRef]
  3. Bittner, K.; Adam, F.; Cui, S.; Körner, M.; Reinartz, P. Building footprint extraction from VHR remote sensing images combined with normalized DSMs using fused fully convolutional networks. IEEE J. Sel. Top. Appl. Earth Obs. Remote Sens. 2018, 11, 2615–2629. [Google Scholar] [CrossRef]
  4. Guo, H.; Shi, Q.; Marinoni, A.; Du, B.; Zhang, L. Deep building footprint update network: A semi-supervised method for updating existing building footprint from bi-temporal remote sensing images. Remote Sens. Environ. 2021, 264, 112589. [Google Scholar] [CrossRef]
  5. Chen, H.; Li, W.; Shi, Z. Adversarial instance augmentation for building change detection in remote sensing images. IEEE Trans. Geosci. Remote Sens. 2021, 60, 1–16. [Google Scholar] [CrossRef]
  6. Liu, P.; Liu, X.; Liu, M.; Shi, Q.; Yang, J.; Xu, X.; Zhang, Y. Building footprint extraction from high-resolution images via spatial residual inception convolutional neural network. Remote Sens. 2019, 11, 830. [Google Scholar] [CrossRef]
  7. Chen, D.; Shang, S.; Wu, C. Shadow-based Building Detection and Segmentation in High-resolution Remote Sensing Image. J. Multim. 2014, 9, 181–188. [Google Scholar] [CrossRef]
  8. Ziaei, Z.; Pradhan, B.; Mansor, S.B. A rule-based parameter aided with object-based classification approach for extraction of building and roads from WorldView-2 images. Geocarto Int. 2014, 29, 554–569. [Google Scholar] [CrossRef]
  9. Norman, M.; Shahar, H.M.; Mohamad, Z.; Rahim, A.; Mohd, F.A.; Shafri, H.Z.M. Urban building detection using object-based image analysis (OBIA) and machine learning (ML) algorithms. IOP Conf. Ser. Earth Environ. Sci. 2021, 620, 012010. [Google Scholar] [CrossRef]
  10. Dai, Y.; Gong, J.; Li, Y.; Feng, Q. Building segmentation and outline extraction from UAV image-derived point clouds by a line growing algorithm. Int. J. Digit. Earth 2017, 10, 1077–1097. [Google Scholar] [CrossRef]
  11. Femiani, J.; Li, E.; Razdan, A.; Wonka, P. Shadow-based rooftop segmentation in visible band images. IEEE J. Sel. Top. Appl. Earth Obs. Remote Sens. 2014, 8, 2063–2077. [Google Scholar] [CrossRef]
  12. Turker, M.; Koc-San, D. Building extraction from high-resolution optical spaceborne images using the integration of support vector machine (SVM) classification, Hough transformation and perceptual grouping. Int. J. Appl. Earth Obs. Geoinf. 2015, 34, 58–69. [Google Scholar] [CrossRef]
  13. Shi, Y.; Li, Q.; Zhu, X.X. Building footprint generation using improved generative adversarial networks. IEEE Geosci. Remote Sens. Lett. 2018, 16, 603–607. [Google Scholar] [CrossRef]
  14. Mikeš, S.; Haindl, M.; Scarpa, G.; Gaetano, R. Benchmarking of remote sensing segmentation methods. IEEE J. Sel. Top. Appl. Earth Obs. Remote Sens. 2015, 8, 2240–2248. [Google Scholar] [CrossRef]
  15. LeCun, Y.; Bengio, Y.; Hinton, G. Deep learning. Nature 2015, 521, 436–444. [Google Scholar] [CrossRef]
  16. Marmanis, D.; Datcu, M.; Esch, T.; Stilla, U. Deep learning earth observation classification using ImageNet pretrained networks. IEEE Geosci. Remote Sens. Lett. 2015, 13, 105–109. [Google Scholar] [CrossRef]
  17. Li, Z.; Xin, Q.; Sun, Y.; Cao, M. A deep learning-based framework for automated extraction of building footprint polygons from very high-resolution aerial imagery. Remote Sens. 2021, 13, 3630. [Google Scholar] [CrossRef]
  18. Long, J.; Shelhamer, E.; Darrell, T. Fully convolutional networks for semantic segmentation. In Proceedings of the IEEE Conference on Computer Vision and Pattern Recognition, Boston, MA, USA, 7–12 June 2015; pp. 3431–3440. [Google Scholar]
  19. Ronneberger, O.; Fischer, P.; Brox, T. U-net: Convolutional networks for biomedical image segmentation. In Medical Image Computing and Computer-Assisted Intervention—MICCAI 2015, Proceedings of the 18th International Conference, Munich, Germany, 5–9 October 2015; Springer: Cham, Switzerland, 2015; Proceedings, Part III 18; pp. 234–241. [Google Scholar]
  20. Huang, G.; Liu, Z.; Van Der Maaten, L.; Weinberger, K.Q. Densely connected convolutional networks. In Proceedings of the IEEE Conference on Computer Vision and Pattern Recognition, Honolulu, HI, USA, 21–26 July 2017; pp. 2261–2269. [Google Scholar]
  21. He, K.; Zhang, X.; Ren, S.; Sun, J. Deep residual learning for image recognition. In Proceedings of the IEEE Conference on Computer Vision and Pattern Recognition, Las Vegas, NV, USA, 27–30 June 2016; pp. 770–778. [Google Scholar]
  22. Wang, J.; Sun, K.; Cheng, T.; Jiang, B.; Deng, C.; Zhao, Y.; Liu, D.; Mu, Y.; Tan, M.; Wang, X. Deep high-resolution representation learning for visual recognition. IEEE Trans. Pattern Anal. Mach. Intell. 2020, 43, 3349–3364. [Google Scholar] [CrossRef]
  23. Pasquali, G.; Iannelli, G.C.; Dell’Acqua, F. Building footprint extraction from multispectral, spaceborne earth observation datasets using a structurally optimized U-Net convolutional neural network. Remote Sens. 2019, 11, 2803. [Google Scholar] [CrossRef]
  24. Zhu, Q.; Liao, C.; Hu, H.; Mei, X.; Li, H. MAP-Net: Multiple attending path neural network for building footprint extraction from remote sensed imagery. IEEE Trans. Geosci. Remote Sens. 2020, 59, 6169–6181. [Google Scholar] [CrossRef]
  25. Haghighi Gashti, E.; Delavar, M.R.; Guan, H.; Li, J. Semantic Segmentation Uncertainty Assessment of Different U-net Architectures for Extracting Building Footprints. ISPRS Ann. Photogramm. Remote Sens. Spat. Inf. Sci. 2024, 10, 141–148. [Google Scholar] [CrossRef]
  26. Ayala, C.; Sesma, R.; Aranda, C.; Galar, M. A deep learning approach to an enhanced building footprint and road detection in high-resolution satellite imagery. Remote Sens. 2021, 13, 3135. [Google Scholar] [CrossRef]
  27. Tao, C.; Meng, Y.; Li, J.; Yang, B.; Hu, F.; Li, Y.; Cui, C.; Zhang, W. MSNet: Multispectral semantic segmentation network for remote sensing images. GIScience Remote Sens. 2022, 59, 1177–1198. [Google Scholar] [CrossRef]
  28. Borawar, L.; Kaur, R. ResNet: Solving vanishing gradient in deep networks. In Proceedings of International Conference on Recent Trends in Computing; Lecture Notes in Networks and Systems; Springer: Singapore, 2023; Volume 600, pp. 235–247. [Google Scholar]
  29. Gupta, A.; Arora, S.; Jain, M.; Jain, K. Comparative Analysis of ResNet-18 and ResNet-50 Architectures for Pneumonia Detection in Medical Imaging. In Proceedings of Fifth Doctoral Symposium on Computational Intelligence: DoSCI 2023; Lecture Notes in Networks and Systems; Springer: Singapore, 2025; Volume 1096, pp. 355–365. [Google Scholar]
  30. Sarwinda, D.; Paradisa, R.H.; Bustamam, A.; Anggia, P. Deep learning in image classification using residual network (ResNet) variants for detection of colorectal cancer. Procedia Comput. Sci. 2021, 179, 423–431. [Google Scholar] [CrossRef]
  31. Ruby, U.; Theerthagiri, P.; Jacob, I.J.; Vamsidhar, Y. Binary cross entropy with deep learning technique for image classification. Int. J. Adv. Trends Comput. Sci. Eng. 2020, 9, 5393–5397. [Google Scholar]
  32. Gordon-Rodriguez, E.; Loaiza-Ganem, G.; Pleiss, G.; Cunningham, J.P. Uses and abuses of the cross-entropy loss: Case studies in modern deep learning. arXiv 2020, arXiv:2011.05231. [Google Scholar]
  33. Lin, T.-Y.; Goyal, P.; Girshick, R.; He, K.; Dollár, P. Focal Loss for Dense Object Detection. In Proceedings of the 2017 IEEE International Conference on Computer Vision (ICCV), Venice, Italy, 22–29 October 2017; pp. 2999–3007. [Google Scholar]
  34. Kingma, D.P.; Ba, J. Adam: A method for stochastic optimization. arXiv 2014, arXiv:1412.6980. [Google Scholar]
  35. Zhang, J.; Karimireddy, S.P.; Veit, A.; Kim, S.; Reddi, S.J.; Kumar, S.; Sra, S. Why ADAM beats SGD for attention models. arXiv 2019, arXiv:1912.03194. [Google Scholar]
  36. Zhou, D.; Fang, J.; Song, X.; Guan, C.; Yin, J.; Dai, Y.; Yang, R. Iou loss for 2d/3d object detection. In Proceedings of the 2019 International Conference on 3D Vision (3DV), Québec City, QC, Canada, 16–19 September 2019; pp. 85–94. [Google Scholar]
  37. Blagec, K.; Dorffner, G.; Moradi, M.; Samwald, M. A critical analysis of metrics used for measuring progress in artificial intelligence. arXiv 2020, arXiv:2008.02577. [Google Scholar]
  38. Powers, D.M. Evaluation: From precision, recall and F-measure to ROC, informedness, markedness and correlation. arXiv 2020, arXiv:2010.16061. [Google Scholar]
  39. Rouse, J.W.; Haas, R.H.; Schell, J.A.; Deering, D.W. Monitoring vegetation systems in the Great Plains with ERTS. NASA Spec. Publ. 1974, 351, 309. [Google Scholar]
  40. Gao, B.-C. NDWI—A normalized difference water index for remote sensing of vegetation liquid water from space. Remote Sens. Environ. 1996, 58, 257–266. [Google Scholar] [CrossRef]
  41. Karanam, H.K.; Neela, V. Study of normalized difference built-up (NDBI) index in automatically mapping urban areas from Landsat TN imagery. Int. J. Eng. Sci. Math. 2017, 8, 239–248. [Google Scholar]
  42. Sun, G.; Huang, H.; Weng, Q.; Zhang, A.; Jia, X.; Ren, J.; Sun, L.; Chen, X. Combinational shadow index for building shadow extraction in urban areas from Sentinel-2A MSI imagery. Int. J. Appl. Earth Obs. Geoinf. 2019, 78, 53–65. [Google Scholar] [CrossRef]
  43. Chen, W.; Liu, L.; Zhang, C.; Wang, J.; Wang, J.; Pan, Y. Monitoring the seasonal bare soil areas in Beijing using multitemporal TM images. In Proceedings of the IGARSS 2004—2004 IEEE International Geoscience and Remote Sensing Symposium, Anchorage, AK, USA, 20–24 September 2004; pp. 3379–3382. [Google Scholar]
  44. Berrar, D. Cross-validation. In Encyclopedia of Bioinformatics and Computational Biology; Academic Press: Cambridge, MA, USA, 2019; Volume 1, pp. 542–545. [Google Scholar] [CrossRef]
Figure 1. Workflow for building footprint extraction using multi-source data and deep learning models.
Information 16 00380 g001
Figure 2. Study area in Tabriz, located in East Azerbaijan province in Iran.
Information 16 00380 g002
Figure 3. U-Net architecture with ResNet-18 backbone. The number below each residual or convolutional block represents the dimension of output layer.
Information 16 00380 g003
Figure 4. The RGB image and various indices for the city of Tabriz. (a) RGB image, (b) BSI, (c) NDBI, (d) SI, (e) NDVI, and (f) NDWI.
Information 16 00380 g004
Figure 5. The image patches and their corresponding masks.
Information 16 00380 g005
Figure 6. (a) Training loss and (b) validation loss of different models.
Information 16 00380 g006
Figure 7. (a) Validation accuracy and (b) IoU.
Information 16 00380 g007
Figure 8. The output results of different models: (a) Ground Truth, (b) RGB–ResNet18 model output, (c) RGB–Sentinel–ResNet18 model output, (d) RGB–Sentinel–ResNet34 model output.
Information 16 00380 g008
Figure 9. Cross-validation training loss for five different folds.
Information 16 00380 g009
Figure 10. (a) Cross-validation accuracy and (b) cross-validation IoU for different folds.
Information 16 00380 g010
Figure 11. The RGB–Sentinel–ResNet34 output results.
Information 16 00380 g011aInformation 16 00380 g011b
Table 1. Sentinel-2 bands.
BandBand NameSpatial Resolution (m)Central Wavelength
1Aerosol60443
2Blue10490
3Green10560
4Red10665
5Red edge20705
6-20740
7-20783
8NIR10842
8A-20865
9-60945
10-601375
11SWIR1201610
12SWIR2202190
Table 2. Model evaluation metrics. Best values are in boldface.
ClassMetricRGB–ResNet18 (%)RGB–Sentinel–ResNet18 (%)RGB–Sentinel–ResNet34 (%)
Background ClassPrecision92.8595.1796.59
Recall95.2197.4998.30
F1-score94.0296.3297.44
Building Footprint ClassPrecision89.5092.3792.96
Recall83.048688.29
F1-score86.1589.0690.56
Table 3. Cross validation evaluation metrics results.
ClassMetricFold 1 (%)Fold 2 (%)Fold 3 (%)Fold 4 (%)Fold 5 (%)
Background ClassPrecision96.4795.5697.0596.3196.66
Recall99.2298.6299.3999.4197.88
F1-score97.8397.0798.2197.8496.91
Building Footprint ClassPrecision94.1692.3594.1494.0193.42
Recall87.1484.6387.7885.5286.34
F1-score90.5188.3290.8589.5689.81
Disclaimer/Publisher’s Note: The statements, opinions and data contained in all publications are solely those of the individual author(s) and contributor(s) and not of MDPI and/or the editor(s). MDPI and/or the editor(s) disclaim responsibility for any injury to people or property resulting from any ideas, methods, instructions or products referred to in the content.

