Article

Artificial Intelligence-Based Prediction Model for Maritime Vessel Type Identification

1
Naval Department, University of Defense and Security “Dr. Franjo Tuđman”, 10000 Zagreb, Croatia
2
Faculty of Electrical Engineering, Mechanical Engineering and Naval Architecture, University of Split, 21000 Split, Croatia
3
Faculty of Maritime Studies, University of Split, 21000 Split, Croatia
4
Naval Studies, University of Split, 21000 Split, Croatia
*
Author to whom correspondence should be addressed.
Information 2025, 16(5), 367; https://doi.org/10.3390/info16050367
Submission received: 7 February 2025 / Revised: 9 April 2025 / Accepted: 29 April 2025 / Published: 29 April 2025
(This article belongs to the Section Artificial Intelligence)

Abstract

:
This paper presents an artificial intelligence-based model for the classification of maritime vessel images obtained by cameras operating in the visible part of the electromagnetic spectrum. It incorporates both the deep learning techniques for initial image representation and traditional image processing and machine learning methods for subsequent image classification. The presented model is therefore a hybrid approach that uses the Inception v3 deep learning model for the purpose of image vectorization and a combination of SVM, kNN, logistic regression, Naïve Bayes, neural network, and decision tree algorithms for final image classification. The model is trained and tested on a custom dataset consisting of a total of 2915 images of maritime vessels. These images were split into three subsections: training (2444 images), validation (271 images), and testing (200 images). The images themselves encompassed 11 distinctive classes: cargo, container, cruise, fishing, military, passenger, pleasure, sailing, special, tanker, and non-class (objects that can be encountered at sea but do not represent maritime vessels). The presented model accurately classified 86.5% of the images used for training purposes and therefore demonstrated how a relatively straightforward model can still achieve high accuracy and potentially be useful in real-world operational environments aimed at sea surveillance and automatic situational awareness at sea.

1. Introduction

In the past few decades, we have witnessed an increased use of artificial intelligence (AI) in every area of life, ranging from smartphones that can provide access to an unimaginable amount of information in an instant to smart houses that you can converse with and that know when you run out of milk. One of the areas most influenced by these intelligent information systems has undoubtedly been the military domain. Long past are the days of using smoke and mirrors, such as dazzle camouflage [1,2], in order to confuse or disorient the opponent—today’s armies are equipped with advanced information systems and surveillance capable of easily seeing through such distortion techniques. NATO armies are gradually shifting towards more and more automation [3], and it is reasonable to expect that other military forces and alliances are doing the same. In the interest of national security and overall safety, it is therefore of paramount importance to keep up with these movements towards automation in order to maintain the status quo or gain a competitive advantage on the battlefield.
Artificial intelligence use in the military spans multiple areas, from dynamic decision support [4,5] to ethically questionable lethal autonomous weapons systems (LAWS) [6,7]. It can be applied to almost every area belonging to the military domain, but in this paper, we specifically focused on its application in the real-time surveillance of territorial waters via automatic classification of maritime vessels. We concentrated our research on one specific geographical area, namely the Croatian part of the Adriatic Sea, and built a custom image dataset to support the development of our classification model. The final model presented in this paper is therefore specifically designed for the surveillance of Mediterranean and Mediterranean-like waters. However, its adaptable architecture allows for straightforward upgrades and expansions to accommodate other geographical regions where the types of maritime vessels encountered may differ in both variety and frequency compared to those typically found in Mediterranean waters.
The proposed maritime vessel classification model is based on computer vision and data mining (DM) and combines advanced AI techniques such as deep learning for initial image representation with more traditional machine learning algorithms such as k-Nearest Neighbors (kNN) and linear regression. The model is implemented in the Orange Data Mining tool [8] that allows for rapid prototyping and design. This capability is particularly relevant in the context of information systems, which are of great importance for the safety of activities at sea [9]. They can be used in automatic collision avoidance [10], vessel tracking [11], search and rescue operations [12], detection of illegal activities [13], etc. While we based our classification model on computer vision techniques, it is important to note that not all models aimed at maritime surveillance do the same. Some of them employ different sets of detection and identification systems and can commonly include synthetic-aperture radars (SAR), automatic identification systems (AIS), and visual information obtained by human operators or surveillance cameras. Radars are used for the detection and monitoring of different objects, while AIS provides navigational and other vessel information [14]. Because the information obtained through radars and AIS alone is often not enough for accurate identification of a vessel, visual identification plays a key role in confirming the identity of the vessel [15,16]. The combination of radar, AIS, and visual data and their subsequent aggregation can be very useful for maritime security [17], and this is especially important in military applications [18,19]. Technological development has enabled the application of AI and data mining methods in the analysis of various types of data, including digital images, thus ensuring a more efficient and reliable operation in various domains [20].
Even though highly reliable results in maritime vessel classification can be obtained by combining different types of detection and identification systems, as discussed previously, our approach of using visual data alone has one tremendous advantage over this: cameras are relatively inexpensive. This makes them accessible to the vast majority of researchers and organizations looking to develop and test information systems for automatic monitoring of territorial waters or the high seas.
The research presented in this paper is concentrated on the detection of maritime vessels in one specific geographical area, that being the Croatian part of the Adriatic Sea. According to the Croatian Bureau of Statistics [21], Croatia’s mainland coast spans 1880 km, while the island coastline spans 4398 km, totaling 6278 km of coastline. Given the extensive length of the Croatian coastline, human surveillance alone is insufficient for effective monitoring, and automatic or semi-automatic video surveillance is recommended. Croatia is strategically significant as a NATO member state and one of the bases for NATO operations due to its numerous naval ports and significant naval infrastructure, and this emphasizes the need for effective surveillance of critical areas. Additionally, Croatia has many national parks and nature reserves situated on islands and along the coastline, such as Lastovo Archipelago Nature Park and Brijuni, Mljet, and Kornati National Parks. These protected areas are not only beautiful, but also a home to numerous protected and critically endangered marine species, including the Mediterranean monk seal (lat. Monachus monachus), noble pen shell or fan mussel (lat. Pinna nobilis), and loggerhead sea turtle (lat. Caretta caretta). The protection of these species, as well as the coastline and Croatian waters, is essential for ensuring safety and conserving the balance of marine ecosystems.
The rest of the paper is organized as follows: Section 2 provides an overview of related research and challenges that can often be encountered in automatic maritime surveillance and monitoring, especially in the military domain. Section 3 presents artificial intelligence background, including the principles of computer vision, traditional machine learning and deep learning, and data mining. Section 4 presents an artificial intelligence-based maritime vessel classification model. It elaborates on the process of image dataset construction and model design and evaluation. In Section 5 we present a conclusion and discuss future work.

2. Related Work

Vessel detection and identification are procedures by which the identity of the vessel is determined and confirmed based on specific characteristics and information [22]. This process is crucial for the regulation of maritime traffic, safety, and management of maritime resources. The number of new vessels and the density of maritime traffic are increasing every day, and therefore the process of detecting, classifying, and identifying given vessels is becoming more and more difficult and time-consuming.
The detection procedure is the first step in the identification of the vessel. Detection refers to the process of locating or identifying an object on or beneath the sea surface. Vessel detection plays a key role in maritime security, protection, and prevention of illegal activities such as smuggling, illegal fishing, or piracy. Vessel detection technologies also assist in search and rescue operations, providing critical information for rapid response in emergency situations. Detection can be performed in several ways with the help of different devices such as radar, sonar, or AIS or with the help of different visual cameras and satellite images. By fusing data obtained from different sensors, it is possible to unambiguously identify a specific vessel [23].
Automatic maritime vessel classification algorithms can broadly be divided into five main categories, depending on the type of data used during their training and testing: algorithms based on the analysis of AIS data, algorithms based on the analysis of SAR data, and algorithms based on the analysis of optical data. While the classification model presented in this paper clearly belongs to the third category, it remains essential to discuss, at least briefly, AIS- and SAR-based algorithms as well. The comparison between these three types of algorithms can highlight the advantages that can be achieved by utilizing optical data instead of or in addition to AIS and SAR, particularly regarding military surveillance and reconnaissance operations.

2.1. Classification Approaches Based on AIS Data

The International Maritime Organization (IMO) defines automatic identification systems (AISs) as transponders that “are designed to be capable of providing position, identification, and other information about the ship to other ships and to coastal authorities automatically” [24]. In 2004, the requirement for the following three classes of maritime vessels to be equipped with AIS became effective: (1) ships of at least 300 gross tonnage that are engaged in international voyages, (2) cargo ships of at least 500 gross tonnage that are not engaged in international voyages, and (3) all passenger ships regardless of their size [24].
Even though AIS can provide important information for vessel identification, McCauley et al. [25] emphasize two main problems associated with its usage: only a small number of vessels are actually required to be equipped with AIS, and vessels can manipulate AIS information and turn off transponders. Additionally, some vessels may be exempt from carrying AIS [25] or retain the option to turn it off in specific conditions (e.g., military vessels during combat or covert operations) [26].
In spite of these AIS shortcomings, there are methods that are used for the automatic classification of maritime vessels. For example, Huang et al. [27] use AIS and machine learning methods for the automatic classification of ships into bulk carriers, containers, general cargo, and vehicle carriers, Sheng et al. [28] use logistic regression and ship trajectories obtained from AIS to classify vessels into cargo ships and fishing boats, and Baeg and Hammond [29] use ship trajectories obtained from AIS and classify them via different machine learning algorithms into fishing, passenger, tanker, and cargo classes.
While we do acknowledge the potential benefits of AIS when used correctly, we also believe that it has several limitations, especially in the military surveillance and reconnaissance domains. While AIS is not the primary focus of this paper, those seeking more information on its use in maritime research can consult [30].

2.2. Classification Approaches Based on SAR Data

High-resolution synthetic-aperture radars (SARs) are imaging radars capable of high-resolution mapping of the Earth’s surface under certain conditions. They can be mounted on elevated places on land and on manned and unmanned aircraft and spacecraft [31]. They can operate in all-day and all-weather conditions [32] and are able to penetrate clouds, fog, and sometimes even leaves, snow, and sand [31]. These abilities make SARs highly appealing for maritime surveillance, as they can remain unaffected by certain conditions that could potentially impede optical sensors such as surveillance cameras.
There are many existing AI-based methods that employ SAR imaging in the automatic classification of maritime vessels. For example, Sannapu et al. [33] compared the performance of convolutional neural network (CNN), ResNet50, and VGG-16 deep learning architectures for the classification of maritime vessels from SAR images and obtained an accuracy of over 99% when using the CNN architecture, and Wang et al. [34] proposed a ship classification model based on the VGG-16 architecture that obtained an average classification accuracy of more than 95%.
While we do recognize the advantages of SAR-based models for maritime vessel classification, we also identify some serious drawbacks that are particularly evident in the military domain. These key challenges primarily include security concerns and the problem of real-time information gathering required for swift decision-making in rapidly evolving battlefield environments. The process of timely data acquisition from SAR-mounted satellites can be problematic as it depends on their orbits, and although utilizing SAR-mounted aircraft can help mitigate this issue, it can also introduce another one: these aircraft can represent potential targets for adversaries due to their immense strategic importance. Even if data from SAR-mounted satellites or aircraft are obtained in a timely manner, there still exists the problem of the interpretation of the acquired data that usually require experts in the field, therefore prolonging the decision-making process.
Since battlefields represent dynamic environments where even the slightest delay can have grave consequences, timely decision-making is crucial. There is a well-known saying amongst military personnel that states that speed kills [35], meaning that in order to have better chances of defeating the adversary, one must operate faster than the adversary, thereby placing the adversary in an unfavorable position. This principle, therefore, serves to highlight the importance of speed in military decision-making processes (MDMPs) and is further detailed in the well-known OODA (Observe, Orient, Decide, Act) loop initially proposed by the U.S. Air Force fighter pilot John R. Boyd [36,37,38].

2.3. Classification Approaches Based on Optical Data

Algorithms for maritime vessel classification from optical data usually rely on the analysis of data gathered from surveillance cameras or imaging systems mounted on satellites. These cameras can either have fixed (e.g., being mounted on land) or dynamic (e.g., being mounted on an unmanned aerial vehicle or UAV, ship, buoy, or satellite) positions and can operate in the visible or non-visible part of the electromagnetic (EM) spectrum.
Cameras also have a key role in visual data collection used to identify vessels. They enable detailed recording of the object and its surroundings, which is necessary for recognizing the vessel’s characteristics and monitoring its movements. Regardless of whether they are mounted on a ship, a coastal station, an unmanned system, or a satellite, cameras can provide a realistic picture of an object that is difficult to visually conceal or alter its shape [39]. Some types of cameras in use are RGB (Red, Green, Blue) or RGB-D (Depth), IR (Infrared), and HDR (High Dynamic Range). All mentioned types of cameras utilize specialized types of sensors and have specific applications. In the context of this paper, we limited our research to studies oriented on the analysis of visible parts of the EM spectrum and divided classification approaches to maritime vessel classification from optical data into three main categories: approaches based on traditional machine learning methods, approaches based on novel deep learning methods, and approaches that combine both.
It is important to note that due to the extensive number of existing AI-based approaches to maritime vessel classification, we have chosen to highlight only those that we deemed most relevant to our research. For readers seeking a comprehensive review of the latest advancements in maritime surveillance, we recommend referring to [40].

2.3.1. Approaches Based on Machine Learning

Approaches to maritime vessel classification that belong to this category of algorithms are based on traditional machine learning techniques such as support vector machine (SVM), k-Nearest Neighbors, or Naïve Bayes algorithms. These methods do not employ convolutional neural networks nor deep learning in general. Since the appearance of the deep learning paradigm in AI, these types of methods have decreased in frequency. Some of the algorithms that belong to this category include [41,42,43].
Mattyus [41] presented an approach for the automatic detection of maritime vessels from optical satellite images. Their method was based on pattern recognition and computer vision techniques and consisted of two parts: a binary classifier trained on images of maritime vessels and backgrounds and a cascade classifier based on Haar-like features and the Gentle AdaBoost algorithm.
Feineigle et al. [42] proposed an approach for ship recognition in harbor surveillance environments. Their method was based on a SIFT (Scale Invariant Feature Transform) [44] keypoint extractor and descriptor that they used to extract interest points from training images. These interest points were subsequently saved into a database, and when a novel image arrived, its SIFT keypoints were compared to the ones already in the database in order to perform the final ship recognition. The authors tested their method on images of tugboats and cargo carriers.
Du et al. [43] proposed a method for ship classification based on the extraction of ship shape eigenvalues from images, the construction of a library featuring the most separable types of those eigenvalues, and a ship target classification approach based on a kNN algorithm. They obtained the highest final classification rate of 96% and used the following ship classes in their research: bulk carrier, container vessel, tanker, passenger ship, and speedboat.
Approaches to maritime vessel classification based solely on traditional machine learning approaches are becoming increasingly rare, as the research in this field is shifting towards the development of deep learning-based classification methods.

2.3.2. Approaches Based on Deep Learning

Approaches to maritime vessel classification that belong to this category of algorithms are based on deep learning techniques alone and do not combine them with traditional machine learning methods such as SVM or kNN (or at least not to a great extent). Some of the algorithms that belong to this category include [45,46,47,48].
Leclerc et al. [45] used transfer learning and fine-tuned pre-trained CNNs based on Inception and ResNet deep learning architectures in order to construct a maritime image vessel classifier. They used the MARVEL image dataset [49] in their experiments that divided images into 26 super-classes, e.g., container ship, sailing vessel, patrol vessel, etc. Their final model obtained 78.73% classification accuracy.
Mishra et al. [46] used transfer learning and fine-tuned a pre-trained CNN based on the VGG-16 deep learning architecture. The final outcome of their proposed model was the classification of images of maritime vessels into one of four classes: aircraft carriers, crude oil tankers, cruise ships and liners, and destroyers. Their model obtained the average classification accuracy of 97.08%.
Leonidas and Jie [47] proposed a ship classification method based on an improved ResNet-152 architecture. Their proposed model achieved the best average accuracy of 95.8% on a public image dataset from Kaggle [50] consisting of 8932 images belonging to five classes: cargo, military, carrier, cruise, and tanker ships. The authors also tested their method on the MARVEL dataset and achieved an accuracy of 91.35%.
Zhenzhen et al. [48] proposed two CNN-based models for ship classification. They used the following ship classes in their research: aircraft carrier, warship, and a civil ship. If the ship is classified as a warship, it is further classified into one of the five types of warships: coastal combat ships, shipyard transport ships, amphibious assault ships, submarines, and destroyers. The first model that the authors presented was based on AlexNet, and the second one on GoogLeNet. The authors also presented two image datasets, one for coarse-grained and the other for fine-grained ship classification. Their AlexNet-based model achieved an accuracy of 94.7% on the testing part of the images from the first dataset and 91.0% on the testing part of the second dataset. Their GoogLeNet-based model achieved the accuracies of 98.0% and 95.0%, respectively.

2.3.3. Approaches That Combine Machine Learning and Deep Learning

Approaches to maritime vessel classification that belong to this category of algorithms are based on a combination of traditional machine learning methods and deep learning techniques. Some of the algorithms that belong to this category include [51,52,53].
Gallego et al. [51] presented a novel approach for the classification of ships and small unidentified floating objects. Their method was based on CNNs and used optical aerial imagery acquired in the visible part of the EM spectrum. They used the Xception CNN for feature extraction and the kNN algorithm for final classification. The final output of their method was information about the existence or non-existence of a ship in an image. The best F1-measure they obtained for their approach was 99.05%.
Liu et al. [52] proposed an approach consisting of image processing-based detection of ship candidates and subsequent classification of ships into predefined categories via a CNN. Their CNN model was evaluated on 240 images from Google Earth, where it achieved 99% accuracy for ship detection and 92% accuracy for ship classification. Additionally, they evaluated their model on another dataset consisting of 1500 images across 10 categories of ships, although these specific categories were not disclosed. On this supplementary dataset, their method achieved classification accuracy of 95%. They compared the classification accuracy of SVM and a neural network on the same dataset, and the results they obtained were 87% accuracy for SVM and 81% accuracy for a neural network.
Polap and Wlodarczyk-Sielicka [53] presented an approach for ship classification using a bag-of-words (BoW) mechanism, SURF (Sped-Up Robust Features) [54] keypoint extractor, and a CNN. The best accuracy they achieved with their proposed method was 84.38% for a two-class classification problem (sailing ships and other classes) and 79.58% for a five-class classification problem (cargo, military, tanker, yacht, and motorboat).

2.4. Concluding Remarks

Image analysis used for vessel identification has a crucial role in the process of creating a Recognized Maritime Picture (RMP) [55]. The RMP presents the relevant maritime information based on the process that involves detection, classification, and assessment [56]. All of these processes are necessary elements in establishing situational awareness (SA) that provides a real-time view of activities in a specific area and forms a basis for the decision-making and response [57,58]. The establishment of SA in the information environment is a key requirement, and advanced solutions that enable it are important assets for organizations [59].
In light of the previous discussion, it can be concluded that the research in automatic maritime vessel classification has significantly shifted from traditional machine learning methods to methods that employ deep learning techniques. We expect that this trend will continue, as deep learning-based approaches can typically yield superior classification results.
Additionally, it is important to note that many of the existing methods for maritime vessel classification utilize different image datasets and classify different types of maritime vessels. Therefore, it does not appear that a universally accepted standard dataset for testing and comparison of various methods exists, which in turn makes the comparison of different classification approaches extremely challenging.

3. Artificial Intelligence Background

Automatic maritime vessel classification is a complex and interdisciplinary challenge that necessitates collaboration among experts from various fields. To address this, we aim to ensure that the content presented in this paper is accessible and understandable to a wide audience, including not only AI researchers but also military researchers who may not be as familiar with advanced AI terminology and techniques. It is therefore necessary to outline and discuss the various tools and techniques that we will employ in developing the proposed model for automatic maritime vessel classification.
In this section we will therefore explore the fundamental principles of computer vision and its diverse applications. We will also examine some of the traditional machine learning algorithms that we utilized in this paper, as well as the core concepts of deep learning. Finally, we will discuss the data mining process employed in the development of our maritime vessel classification model.

3.1. Computer Vision Principles

Computer vision is a branch of artificial intelligence that enables computers and systems to recognize information from digital images, videos, and other image-type input data and take actions or provide recommendations based on this information [60]. It can be stated that if artificial intelligence allows computers a certain type of thinking, computer vision allows them to see and interpret the content of an image. The way computer vision works is comparable to human vision, as artificial intelligence largely mimics biological systems [61,62].
Computer vision techniques use machines to perform these functions, from the initial phase of capturing the input and its transformation into a form suitable for processing up to the point where, based on what has been learned, conclusions can be drawn about the previously unknown [63]. A requirement placed before information systems is to perform these tasks on relatively large data collections in a relatively short time with a permissible or relatively small margin of error [64]. The use of computer vision techniques has applications in the manufacturing sector (e.g., defect detection), security (e.g., surveillance), healthcare (e.g., diagnostics), transportation (e.g., traffic management), and more [65]. Additionally, military applications of computer vision techniques are becoming more common [66,67], not just in maritime surveillance but in various other fields (e.g., in camouflage detection [68] and target tracking [69,70]).
The beginnings of digital image processing date back to the early twenties of the 20th century. Devices used to take photos are called cameras. A digital camera is a hardware device consisting of a high-resolution sensor with a fast signal processor for image processing. Recorded images are stored in memory, from where they can be sent to other devices through the communication interface and further processed. Images obtained by a camera sensitive to the visible part of the spectrum represent the illumination of objects on the scene. The image is basically a 2D function of light intensity f(x,y), where x and y denote spatial coordinates and the value of function f at any point (x,y), as shown in Figure 1.
It is useful to consider the function of the image with respect to illumination as a third axis. If we follow the rule that proportionally larger values are assigned to lighter areas, more components in such a drawing will correspond to lighter areas. A digital image is an image f(x,y) that is discretized by spatial coordinates and illumination. A digital image can be represented by a matrix whose columns and rows correspond to the columns and rows of the image. The value of an individual element of the matrix is determined by the level of illumination at that point of the image. The elements of such a digital field are called picture elements, or pixels. A 2D representation of a digital image I of dimensions MxN is displayed in a matrix form in Equation (1). In this equation, symbols ai,j represent the illumination of a pixel located at position (i, j).
I = a 0,0 a 0,1 a 1,0 a 1,1 a 0 , M a 1,2 a N , 0 a N , 1 a N , M
EM radiation itself does not contain any colors. Understanding the human perception of EM waves in the visible range includes the physiology of the eye, the conversion of the light spectrum into an RGB signal, and the human experience of that signal as hue, saturation, and brightness. RGB is simply a signal of the photosensor’s response to electromagnetic radiation, but the perception of colors is entirely a creation of the brain. The information allocated to specify a pixel’s color is a blend of these three primary colors. Figure 2 shows the decomposition of an image from the Split Port Ship Classification Dataset (SPSCD) [71] into red, green, and blue channels. The decomposition of the image into RGB channels was accomplished with Python and the OpenCV [72] image processing library.
The resolution of a digital image is measured using its pixels. An image of M pixels in height by N pixels in width has a resolution of MxN, where the first variable represents the number of rows and the second represents the number of columns. Higher resolutions mean that there are more pixels per inch (PPI), containing more information and resulting in a higher-quality image. The pixel depth determines the range of values it can store; it is based on the formula 2n, with n indicating depth. Color depth, on the other hand, indicates the number of bits used for each color component of a single pixel. Considering the mentioned parameters, the image file size is calculated and usually expressed in kilobytes (KB) or megabytes (MB). Image format refers to the structure and organization of data used to store a digital image; the most common types include JPEG, PNG, GIF, and others.

3.2. Machine Learning and Deep Learning Principles

The concept of machine learning refers to the development and implementation of computer programs capable of learning from data and making informed decisions. It is generally divided into five categories: supervised learning, unsupervised learning, semi-supervised learning, reinforcement learning, and deep learning.
Supervised learning encompasses algorithms trained on labeled data. Labeled data refer to data that have been examined and labeled with appropriate classes, preferably by experts in the associated field. For example, medical doctors could look at a dataset containing magnetic resonance (MRI) images of a number of patients and label each image with a “healthy” or “non-healthy” diagnosis. A machine learning-based algorithm could then be constructed that could have the ability to differentiate, more or less successfully, between healthy and non-healthy individuals.
Unsupervised learning encompasses algorithms trained on unlabeled data. These kinds of algorithms are not provided with the names of classes that can be found in the dataset, so they operate by identifying patterns and similarities within the data itself. For example, if an unlabeled image dataset consisted of images of fishing boats and ocean liners, the algorithm would have to learn the difference between these two classes by itself, perhaps on the basis of different image features such as size, shape, and color. The algorithm would still lack the knowledge associated with the names of the classes but should still be able to, more or less successfully, accurately classify images containing fishing boats into class “A” and ocean liners into class “B”.
Semi-supervised learning refers to a combination of supervised and unsupervised learning and encompasses algorithms trained on partially labeled datasets. These kinds of datasets exist because manual data labeling is time-consuming and expensive, and it can result in errors or missing information due to human error.
Reinforcement learning incorporates “rewards” for the algorithm if it reaches a desired conclusion and “punishments” otherwise. This feedback mechanism is used to steer the algorithm towards the desired behavior.
Deep learning can be defined as an advanced form of machine learning that operates on a significantly larger scale. This approach typically involves the use of much larger datasets and much more powerful hardware infrastructure. With the rise of high-performance computing (HPC) and the increased availability of powerful computing resources available to researchers (e.g., advanced computing resources Supek and Vrančić in Croatia [73]), deep learning has gained widespread adoption across multiple fields.

3.3. Data Mining Process

Data mining is the process of discovering interesting and useful patterns and relationships in large amounts of data [74]. The field combines tools from statistics and artificial intelligence with database management to analyze large digital collections, known as datasets [75]. Essentially, data mining involves a step beyond just collecting and managing data, as it uses sophisticated algorithms to transform these large amounts of data into meaningful insights that can support decision-making. The data mining process is a very important part of model creation and follows clearly defined stages. For the purpose of this study, the Cross-Industry Standard Process for Data Mining (CRISP-DM) [76] was applied.
CRISP-DM is a widely accepted methodological framework for conducting data mining and data analysis projects [77]. This model provides a comprehensive process that helps users design, build, test, and execute data mining projects [78]. CRISP-DM consists of six consecutive phases covering the entire data mining life cycle [79]: business understanding, data understanding, data preparation, modeling, evaluation, and deployment.
In the field of data science, the CRISP-DM model has become the most widely used standard for executing projects [80,81]. This is not at all surprising considering its flexibility and reliability. It offers the benefits of agile principles and practices and can be followed easily even by those with less expertise in the field of data science.

4. Proposed Model for Maritime Vessel Classification

Maritime surveillance is a pivotal task in marine protection. It can aid in the identification of illegal fishing or shell poaching hotspots, in the detection of hostile vessels, in the monitoring of nature reserves situated on islands, and in the surveillance and protection of habitats that support protected species. This is especially important for countries with extensive coastlines, such as Croatia.
In the following sections we will detail the design and evaluation of our proposed model for maritime vessel classification, which is specifically tailored for Mediterranean and Mediterranean-like waters. Our primary focus is on the Croatian waters of the Adriatic Sea, and the image dataset that was constructed for model training and evaluation is specifically curated to reflect this unique maritime environment.

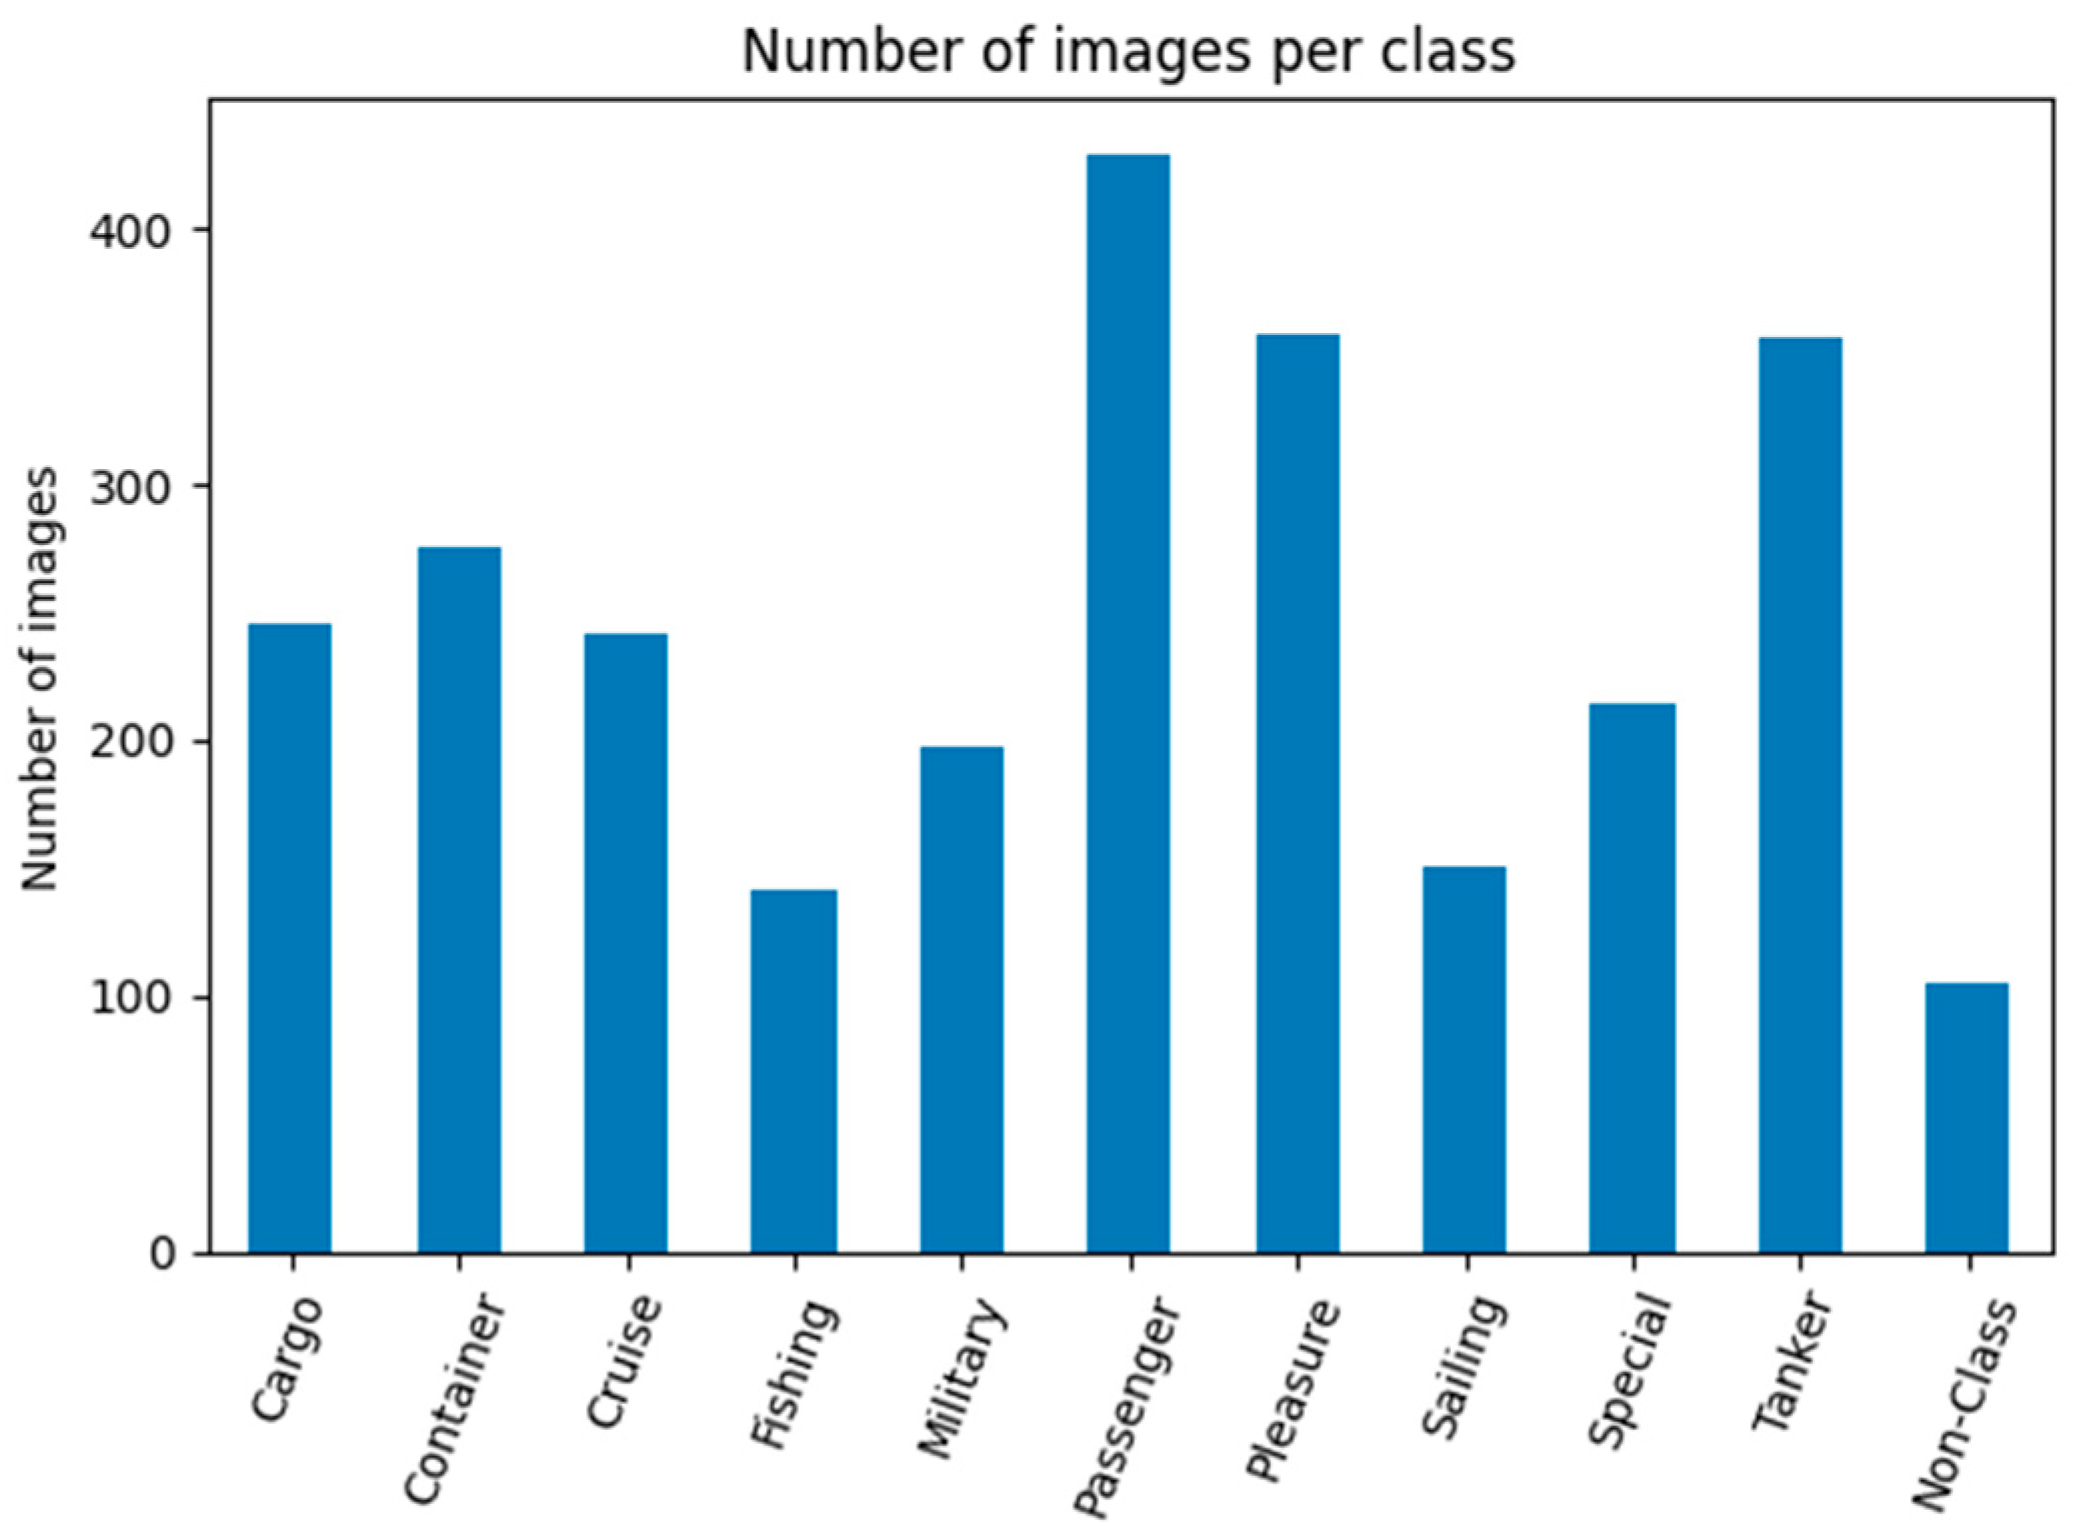
4.1. Dataset Preparation
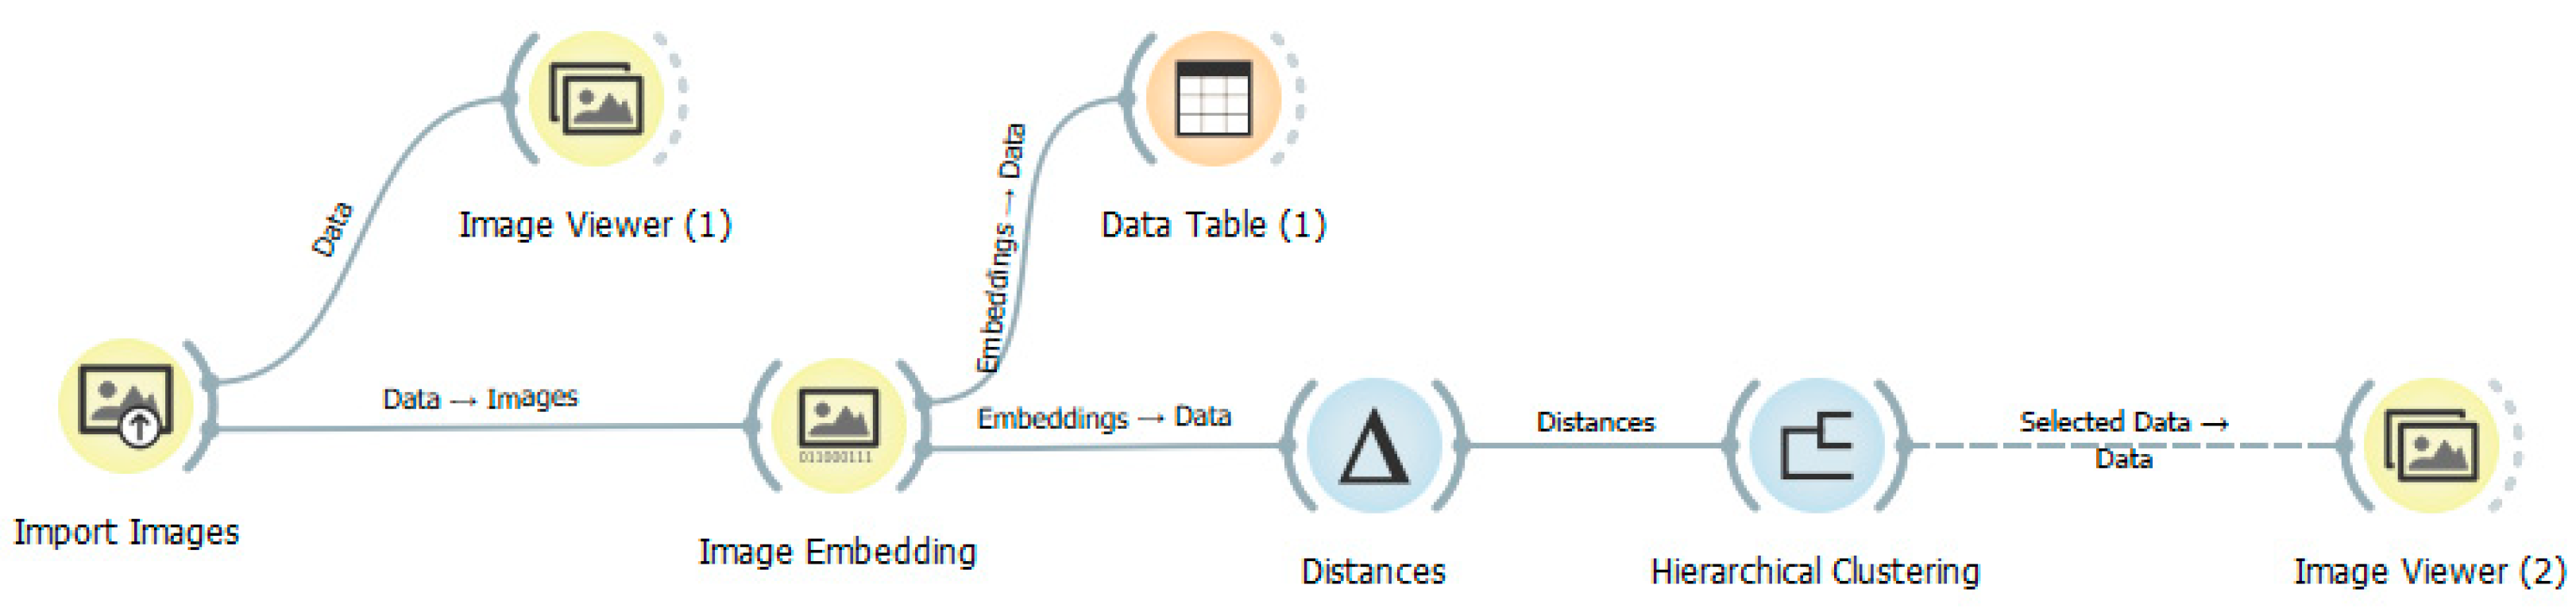
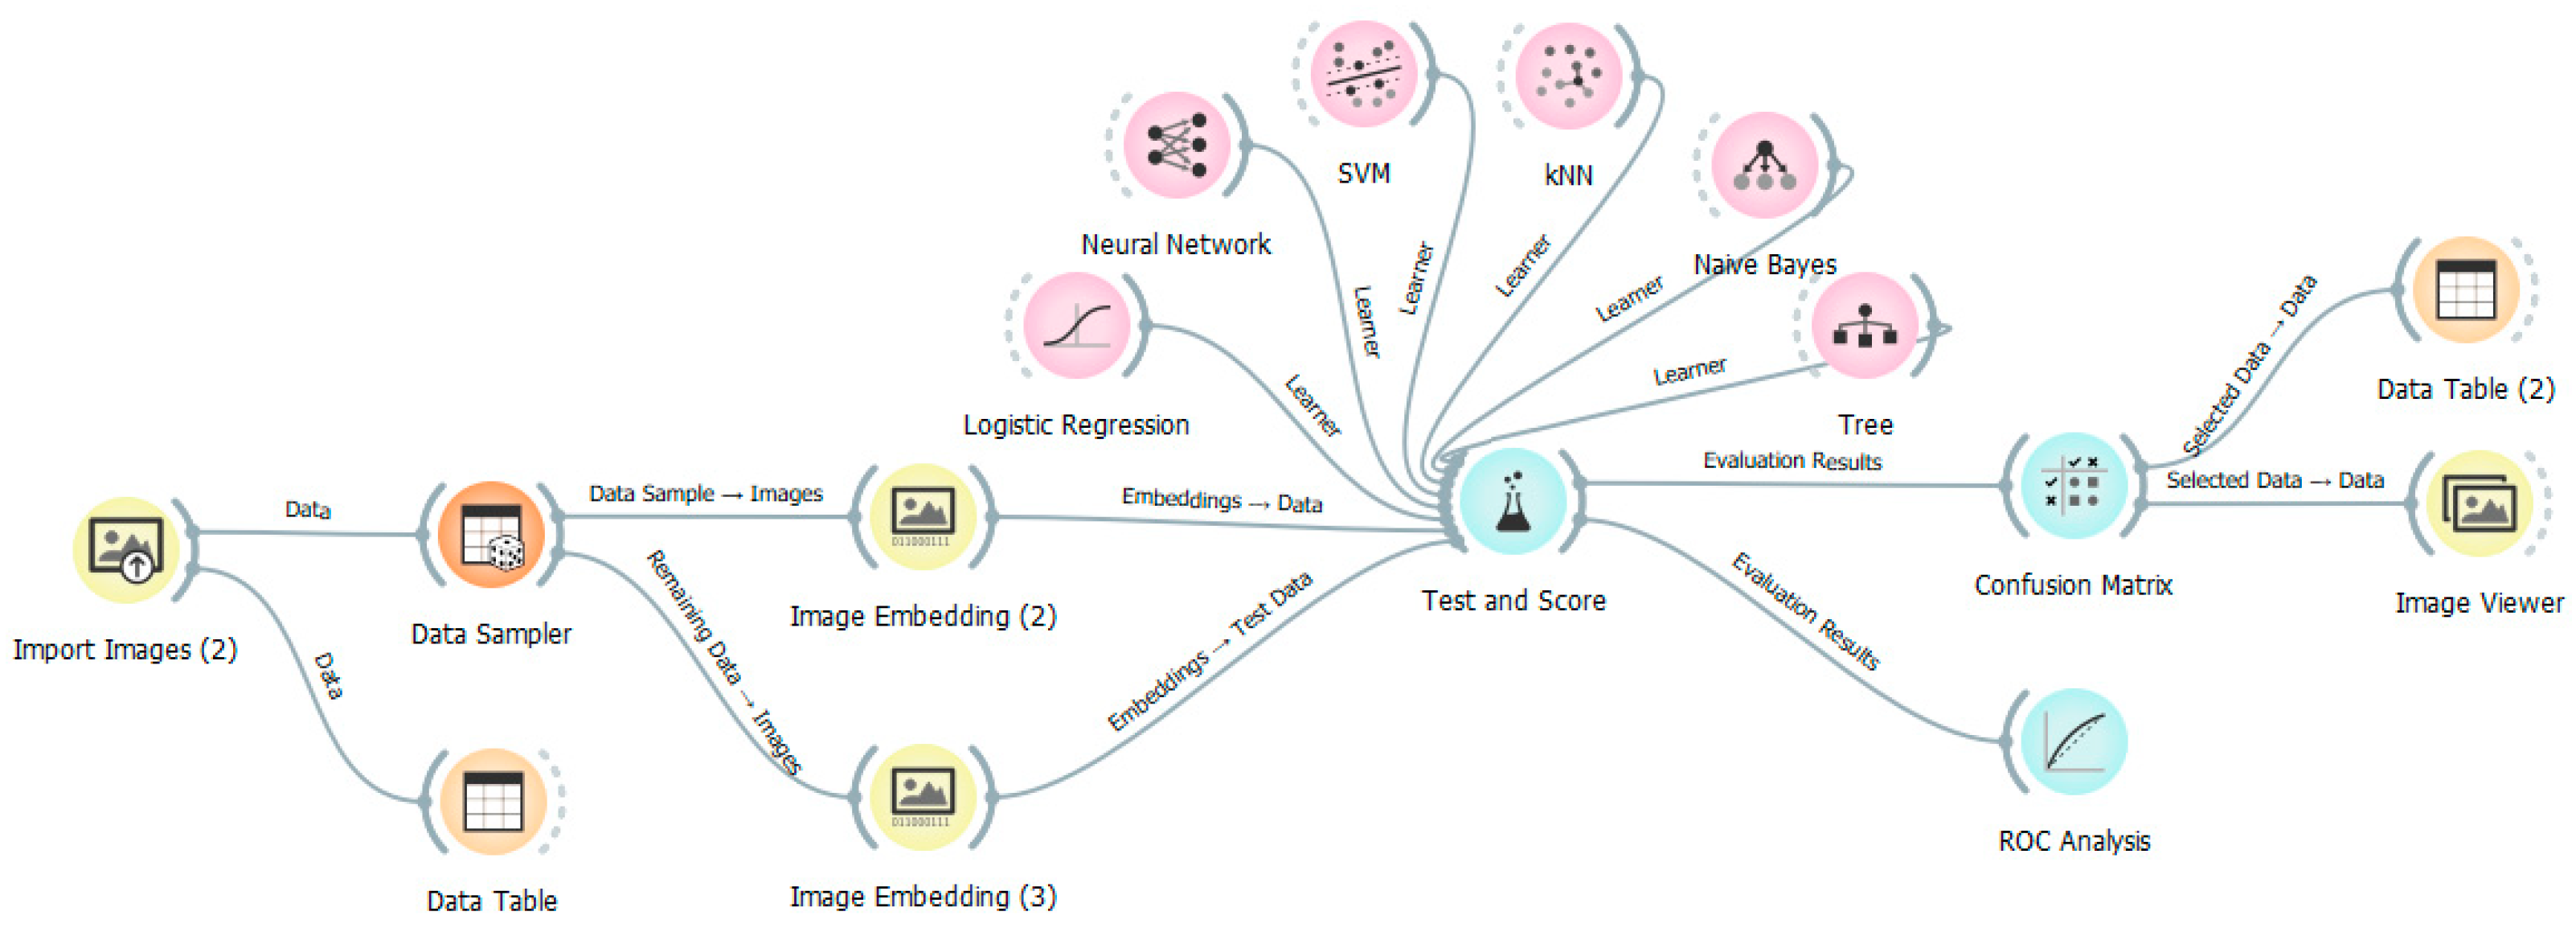
Thorough preparation and an in-depth understanding of input data are an extremely important and time-consuming phase of model development and have an immense influence on the model’s final performance and overall results.
Despite the absence of a standardized dataset of maritime vessel images, several datasets do exist, with one of the largest being the MARVEL [49] dataset. The MARVEL dataset contains two million images categorized into 26 superclasses (e.g., container ship, sailing vessel, patrol vessel) and 109 vessel type classes. As stated by Teixeira et al. [40], the MARVEL dataset exhibits significant class imbalance, as some of the classes contain significantly fewer images than others. Teixeira et al. also state that this imbalance is a “natural reflection of a realistic environment, where there are many more ships of one type than of another” [40]. This principle has been integrated into the dataset that we constructed as well, where the number of images per category approximately corresponds to the actual occurrences of maritime vessels in their respective environments.
With the absence of a singular dataset that is generally considered standard for maritime vessel classification, we constructed our own and obtained maritime vessel images from various open sources available on the Internet, as well as our own independent photography. The images were classified into one of the 11 predefined categories: cargo, container, cruise, fishing, military, passenger, pleasure, sailing, special, tanker, and non-class (objects that can be encountered at sea but do not represent maritime vessels).
From the point of view of the relationship between the camera and the object being recorded, practically in all cases this is a conditionally static scene. This conditionality arises because the vessel is an object that moves relatively slowly, and the cameras used to record it are mounted in a fixed position (in the case of a coastal station) or on a platform (floating or flying). Furthermore, these elements are usually so distant from each other that the speed of movement of the objects in relation to the speed of the camera sensor is negligible, and therefore we consider the images to be static.
When it comes to the perspective or the shooting angle, it is the position of the camera in relation to the shooting object, more precisely the angle formed by the axis of the lens with the visible or imaginary horizontal of the shooting space. The input set of images, with regard to the relationship of the objects, contains images in which the camera is approximately at the height of the object being recorded (image from another vessel), slightly at the upper angle (image from a coastal station or flying platform), or, less often, at the zenith of the imaged object (the angle of 90°, which means that the overflight of the object has been carried out). All this contributes to the diversity of the input dataset, ensuring effective algorithm learning and more reliable model prediction.
It should be noted that the images that form the input to the model were created using different equipment in diverse meteorological and light conditions, which contributed to the representativeness of the collected dataset. Given that the implemented model represents a prototype of a future real information system, it is necessary for it to be able to process images of different formats and quality. This indicates that data can be obtained through our own sensors, received from external systems via the interface, or manually imported into the system. The model should be capable of processing all of these data sources effectively.
The organization of input data into distinct categories is a prerequisite for the model to be able to successfully learn how to classify types of maritime vessels based on their images. This is the responsibility of the analyst, who must determine the appropriate number and types of categories in alignment with business requirements while also ensuring that each category contains a sufficient number of instances. Classification of vessels into general types used in the model has been derived from AIS Ship Types [82] and NOAA Vessel Type and Group Codes [83] and adapted to meet the specific environmental requirements associated with the Adriatic Sea.
The presented division of vessel types is general and suitable for the needs of the proposed model, but it can be further refined according to the specific requirements of the future production system. For the purposes of building a predictive model, a total of 2715 images were collected, approximately half from open sources and half by independent photography. Distribution of maritime vessel images per class in this dataset is given in Figure 3 (generated with Python and Matplotlib [84]) and further detailed in Table 1. The ratio of collected images attempts to reflect the typical proportion of the number of vessels per type observed in the considered environment. This requirement was set during the model design phase.
The constructed dataset consists of 11 categories in total, 10 of which represent the corresponding type of maritime vessel. The last category is reserved for objects that can be encountered at sea but do not belong to maritime vessels. This category encompasses objects such as buoys, docks, submarines, aircraft, and drones, i.e., objects that can be captured by marine surveillance cameras. This category was incorporated into the model to ensure that it can handle a certain amount of noise that can be present in the input data. More specifically, the model should be able to distinguish maritime vessels from non-vessels and further classify vessels by type. Non-vessels, floating objects, and other artifacts should be assigned to a non-class category without further consideration.
The image dataset consisting of 2715 images was further divided into two subsets—one designated for the training of machine learning algorithms and the other one for testing. In the context of this paper, we will refer to this process as data sampling. Data sampling is basically a technique of dividing the input images into subsets, one for model training and the other for model evaluation. Using this approach, it is possible to make inferences about the data being analyzed and the selected learning algorithms. A fixed sample size option was chosen in which 90% of the input data were used for training (i.e., 2444 images) and the rest (i.e., 271 images) for testing machine learning algorithms.
In addition to the previously discussed 2715 maritime images in the input set, an additional set of 200 images is utilized to evaluate the model’s predictive performance during the final assessment stage. Distribution of maritime vessel images per class in this dataset is given in Figure 4 (generated with Python and Matplotlib).

4.2. Model Design

The proposed model for the classification of maritime vessels consists of three main phases:
  • Image embedding and clustering. In this stage of model development, the input images are transformed into vectors via different deep learning-based image embedding methods (e.g., Inception v3, SqueezeNet, VGG-16, etc.). After the comparison of these methods, Inception v3 [85,86] was selected as optimal for the problem at hand. Following this comparison, hierarchical clustering is performed on the input images in order to evaluate the model’s ability to separate instances into categories based on a selected similarity measure and image embedding. After comparing different similarity measures (e.g., Euclidean, Manhattan, and Cosine distances), Euclidean distance was chosen as optimal.
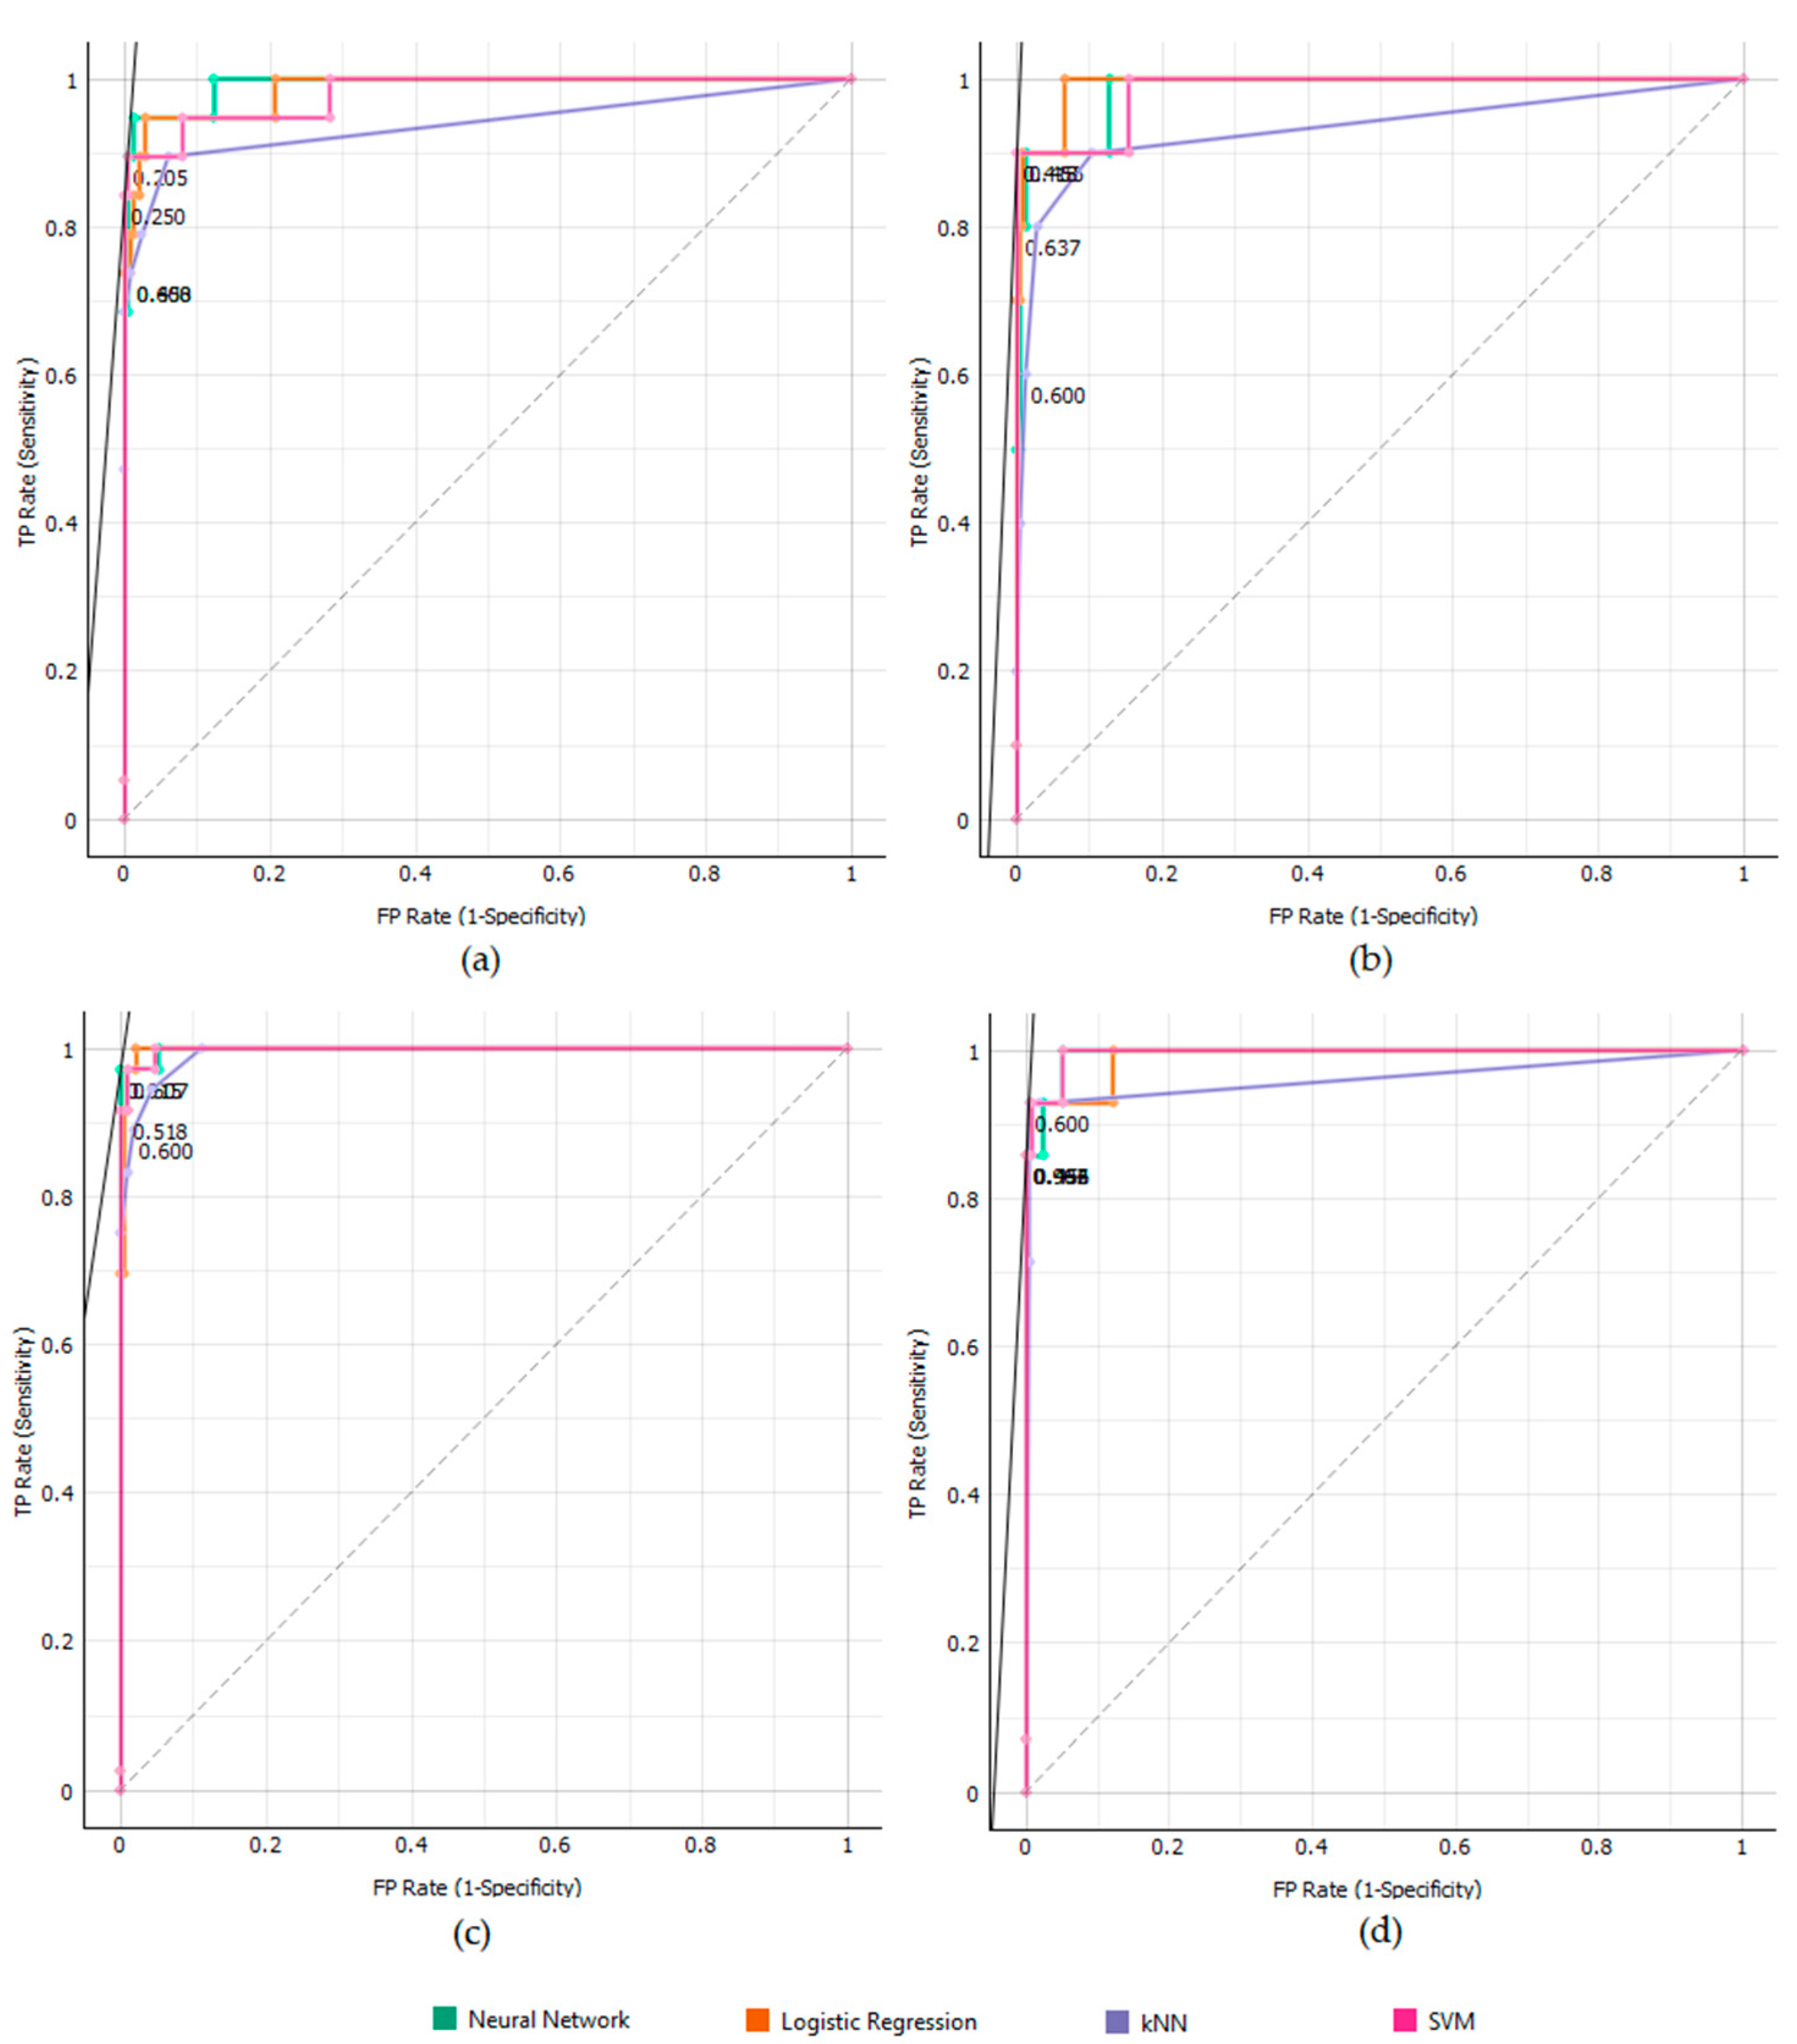
  • Comparison of different machine learning algorithms. In this stage of model development, different machine learning algorithms are trained, tested, and evaluated in order to determine the optimal one for maritime vessel classification. We focused on the evaluation of well-known, traditional machine learning algorithms such as logistic regression, a neural network, SVM, kNN, Naïve Bayes, and decision tree.
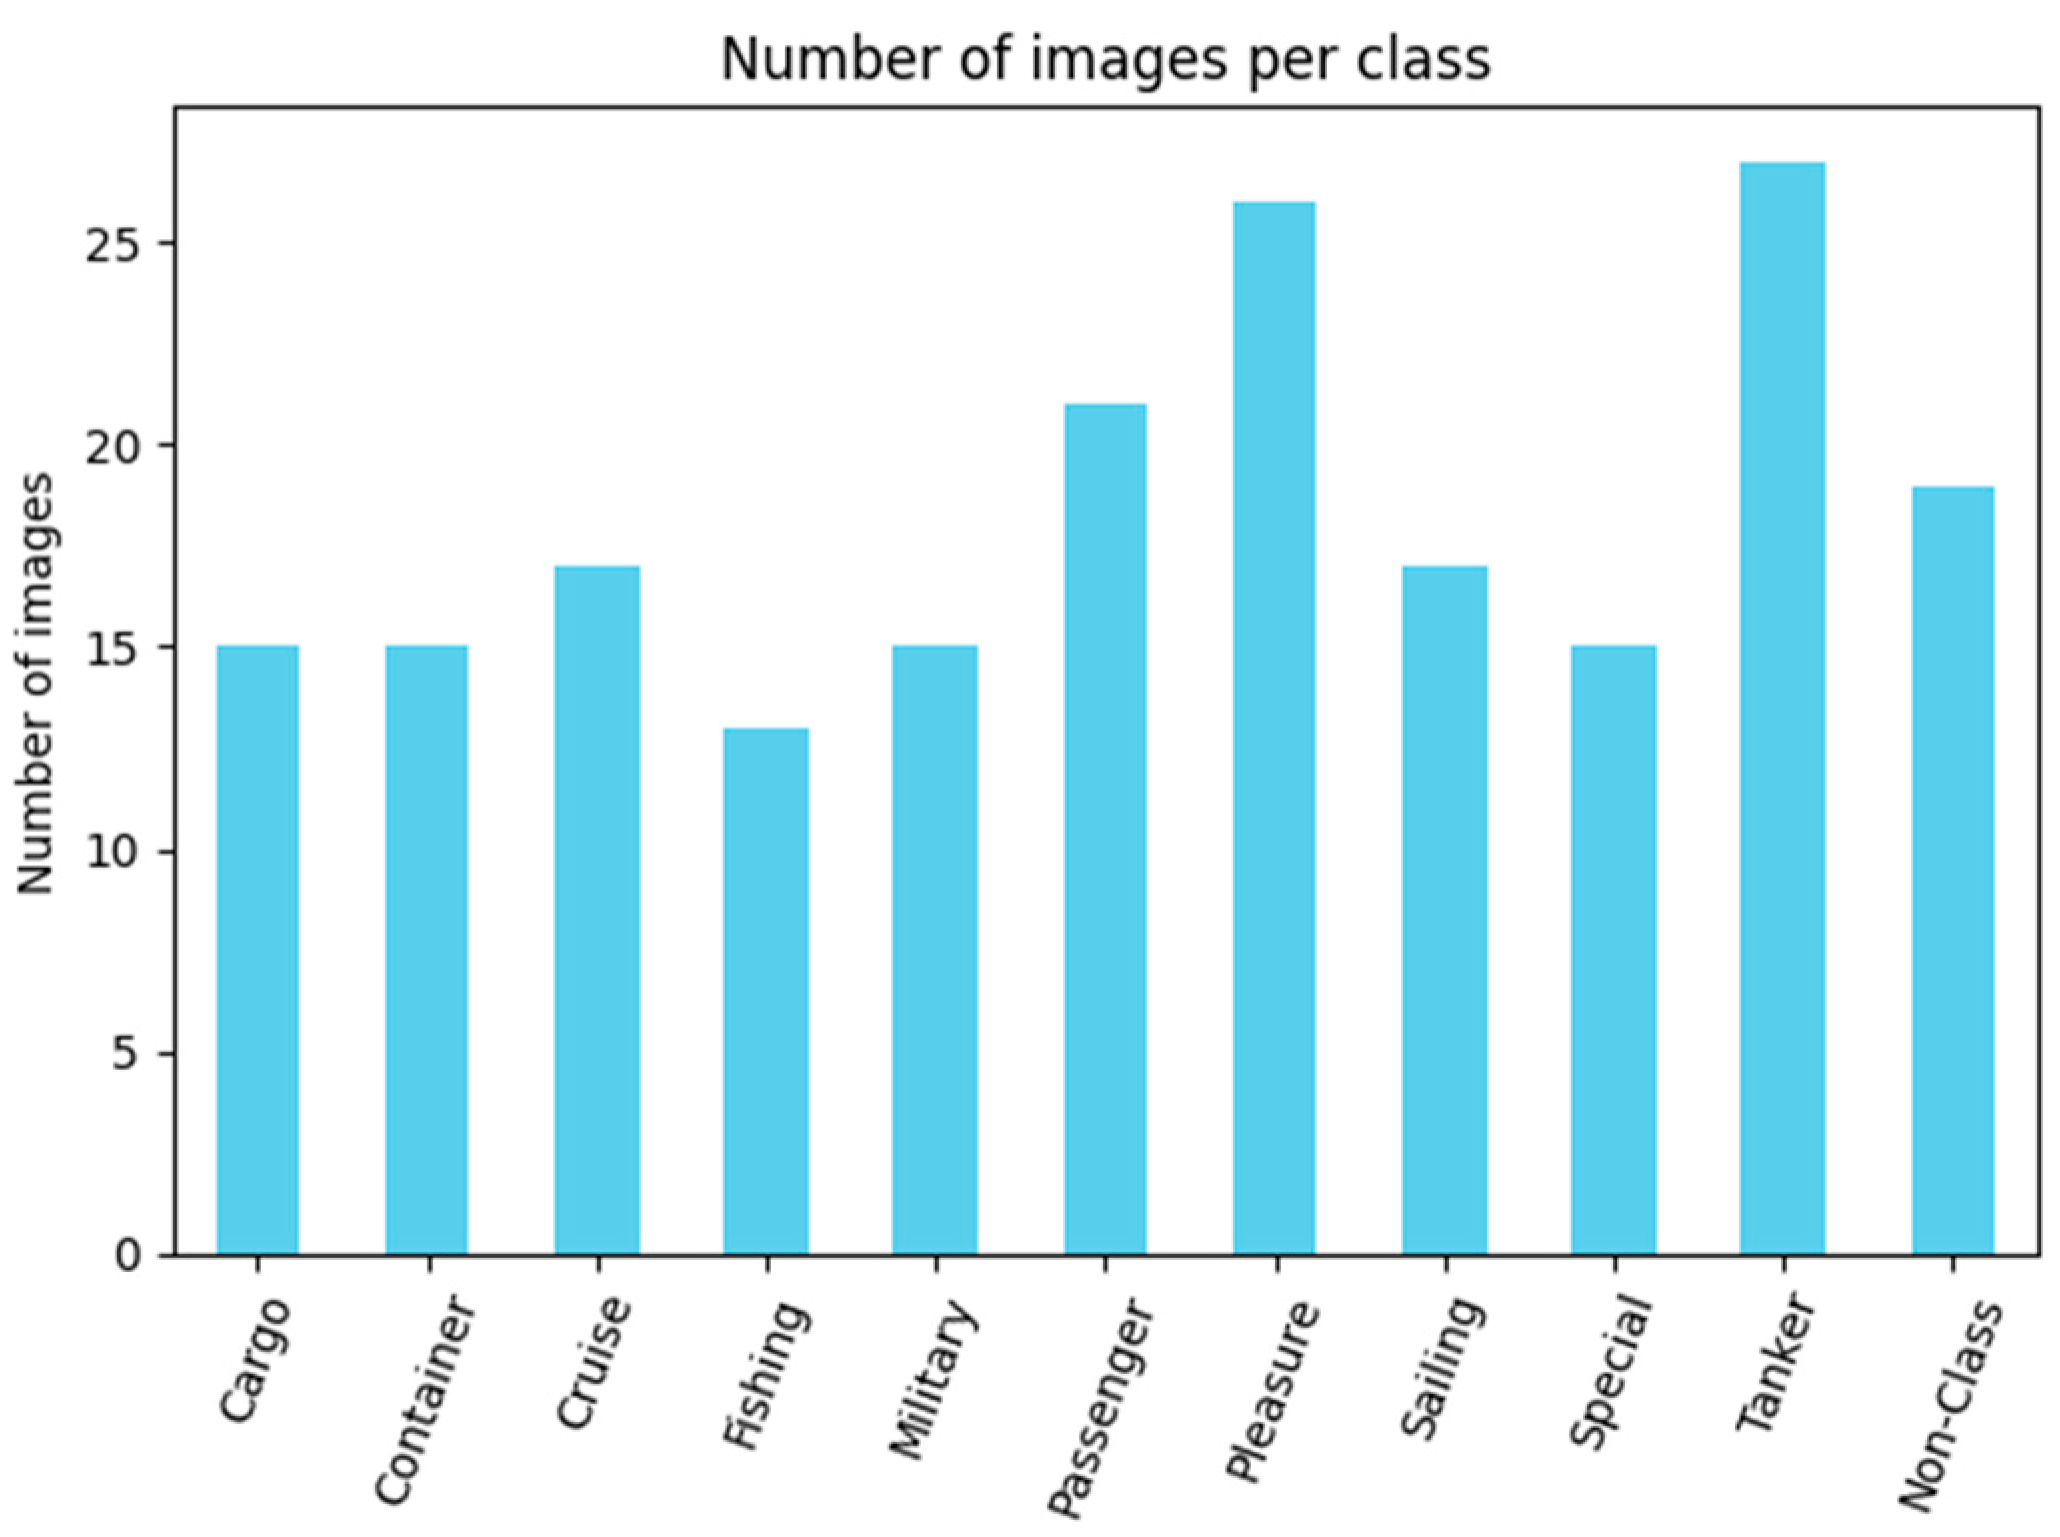
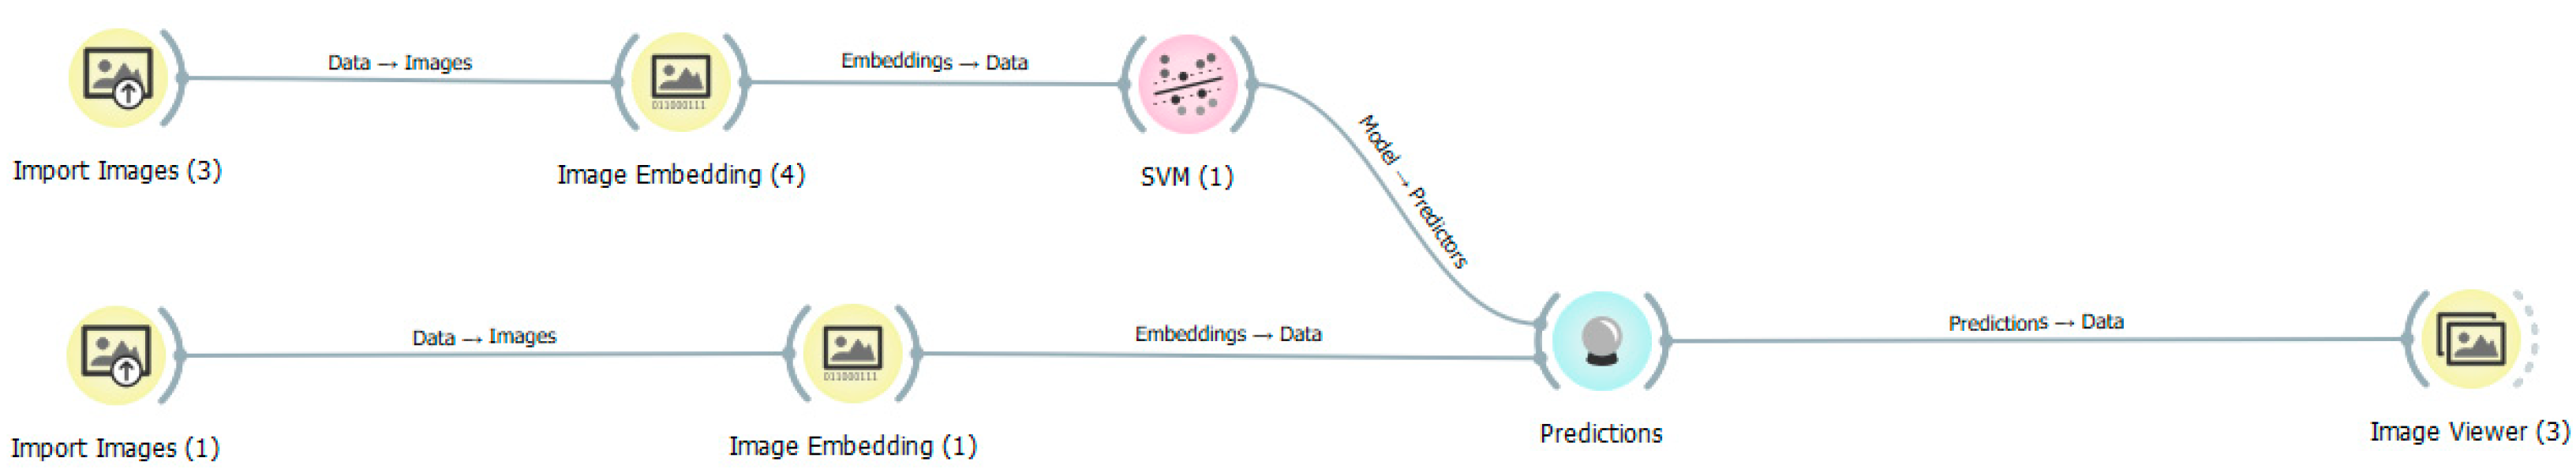
  • Model evaluation. The optimal machine learning algorithm chosen in a previous stage of model development is evaluated on 200 previously unseen maritime images.
The implementation of the proposed model was realized using the Orange Data Mining tool, an open-source data visualization, machine learning, and data mining toolkit [8]. The presented model was created using the latest tool version, 3.38.1, on the x64-based system using an Intel(R) Core(TM) i5-3320M CPU and running MS Windows 10 Enterprise Build 19045.
Each phase of the proposed model’s development is elaborated in detail in the following subsections:

4.2.1. Image Embedding and Clustering

Image embedding is a technique used in many fields of data processing and artificial intelligence, including computer vision. It is used to convert high-dimensional data into lower-dimensional vectors. Vector representations of visual elements, namely images or video frames, are used in tasks such as object recognition, image search, data clustering, and image classification. Image embeddings are therefore numerical representations of digital images that condense the complexity of visual data, capturing their features and semantics, and encoding them into lower-dimensional vector representations that are basically image descriptors. Consequently, embedding is the process of deep learning. In the case of images, embeddings are calculated using computer vision models that are trained on very large datasets. The training of deep neural networks in this case encompasses automatic learning of image features through layers of convolution operations, activation functions, and fusion layers. This encodes the information that represents the content of the image in a condensed form, incomprehensible to humans in its raw form, but suitable for machine learning models to carry out further processing.
Several different image embedding methods (Inception v3, SqueezeNet, VGG-16, etc.) were evaluated, and Inception v3 was finally chosen based on its performance on the maritime vessel image dataset used in this paper. Inception v3 is Google’s 48-layer-deep convolutional neural network for image classification, originally published in [85] and pretrained on the ImageNet dataset [86]. By using Inception v3, each image in the dataset was represented by a vector of 2048 elements, i.e., features.
Next, hierarchical clustering is conducted in order to determine the effectiveness of image embeddings in distinguishing between 11 classes of maritime images. During this process, several different distance metrics that were discussed previously were compared, and Euclidean distance was chosen as optimal.
Euclidean distance DE represents the shortest distance between two data points or vectors in a Cartesian coordinate system. It is the square root of the sum of the squares of the differences between the corresponding elements. Most machine learning algorithms use this distance metric to measure the similarity between observations [87]. The equation for the calculation of Euclidean distance DE between points (x1, y1) and (x2, y2) in two-dimensional space is given in Equation (2).
D E = x 1 y 1 2 + x 2 y 2 2
For a space with n dimensions, the Euclidean distance is calculated as shown in Equation (3), where n is the number of dimensions, and xi and yi are data points.
D E = i = 1 n x i y i 2
Drawing from the findings of the hierarchical clustering analysis, it can be seen that the images from the same class are usually grouped together, but that the algorithm also encounters some problems when distinguishing between similar images belonging to different classes. For example, some of the images representing yachts were classified as cruisers, but this is not surprising considering that there are similarities between these objects and that these similarities can be greatly emphasized depending on the scale of images.
This initial phase of model development concentrated on unsupervised learning, specifically hierarchical clustering. During this stage, raw input data were transformed into numerical vectors suitable for further processing, allowing us to evaluate the distinctiveness of these vectors across 11 different maritime classes. The final results obtained during this stage were promising, as they indicated that the numerical representations of images generated by the Inception v3 model are indeed valuable for further analysis, as they do exhibit significant differences across 11 classes of maritime images.
The final workflow of the first phase of model development is shown in Figure 5.

4.2.2. Comparison of Different Machine Learning Algorithms

In order to determine the machine learning algorithm that would be optimal for the automatic classification of image embeddings obtained in the previous stage of model development, six machine learning algorithms were evaluated. These algorithms included logistic regression, a neural network, SVM, kNN, Naïve Bayes, and a decision tree. The parameters used in the training process of these algorithms within the Orange Data Mining tool were determined during the development phase. This procedure entailed empirical testing and a comprehensive comparison of multiple hyperparameter values using the Orange Data Mining tool. The optimal hyperparameters were those that consistently yielded the best results. For each model, a range of key parameter values was tested (e.g., C and kernel type for SVM, the number of neighbors k for kNN, and the number of layers and activation functions for neural networks) using a validation dataset. These configurations were compared based on accuracy, precision, recall, and F1-score metrics, and the final parameters were selected because they consistently achieved the best results across multiple experiment repetitions. Additionally, the Adam optimizer was chosen for training neural networks, as it has been proven to demonstrate high robustness and convergence speed in image classification tasks [88,89] (Dogo et al.; Kartowisastro and Latupapua, De et al.). The selected hyperparameters are detailed below:
  • Logistic regression—L2 or ridge regularization was employed, and the strength of regularization was set at 1.
  • Neural network—the number of hidden layers was set at 100, ReLU (Rectified Linear Unit) activation function and Adam optimizer were used, and the maximum number of iterations was set at 200.
  • SVM—the cost C was set at 0, the kernel was set to RBF (Radial Basis Function), numerical tolerance was set at 0.0010, and the iteration limit was set at 100.
  • kNN—number of neighbors was set at 5, Euclidean metric was used, and the weight of data points was uniform.
  • Naïve Bayes—no parameters were set during training.
  • Decision tree—the minimum number of instances in leaves of the tree was set at 2, subsets smaller than 5 were not split, binary trees were included, maximum tree depth was limited to 100, and the classification would stop when the majority threshold would reach 95%.
After the completion of training and evaluation of selected machine learning algorithms, their evaluation was performed. The focus was placed on the assessment of their suitability for the specific input dataset of maritime images, as well as their prediction accuracy. Five different performance measures were utilized for this purpose: area under the curve (AUC), classification accuracy (CA), F1-score, recall, and precision. These measures are useful in the comparison of performances of different models, with higher scores usually indicating better performance.
For the task of maritime vessel classification, precision—defined as the proportion of true positives among instances classified as positive—was selected as the decisive criterion [90]. Precision is a key indicator in computer vision applications, especially when false positives can be costly, which is precisely the case for this model. The performance results obtained by using these measures are shown in Table 2.
The results presented in Table 2 reflect the average performance across classes and demonstrate that the selected models achieve high classification accuracy. It should be noted that the SVM stands out with the highest precision. The effectiveness of the SVM model is further validated by its Receiver Operating Characteristic (ROC) value, utilized as an additional method for the evaluation and comparison of models’ performance [90]. Figure 6 shows the ROC curve for cargo, fishing, tanker, and sailing classes of maritime vessels. The area under a given ROC curve, or AUC, represents the probability that the prediction will be accurate, and it is often used as a measure of aggregated classification performance [91]. All tested models achieved excellent AUC scores, but since AUC is a relative measure that does not specify the exact number of errors the classifier commits and for which instances [92], it is advisable to combine it with other measures such as CA and precision. Considering these factors, the SVM algorithm was selected as optimal for the purpose of maritime image classification.
In order to further demonstrate the effectiveness of the SVM-based model for maritime image classification, the associated confusion matrix is presented in Figure 7. The confusion matrix is a common way to summarize the classifier results [93]. It shows the exact distribution of evaluated test data as the model based on the SVM algorithm assigns their belonging to a particular class [94]. This is therefore an objective measure of its ability to deal with unknown data. Numbers that are not on the diagonal indicate classification errors. The results clearly indicate that the model achieves high accuracy, and when it does make errors, it typically confuses similar types of maritime classes (e.g., it mistakes cargo as tanker or passenger vessels). This is not surprising given that the prediction is based on the recognition of distinctive features in images, and the objects in images can appear similar even if they belong to different classes.
In conclusion, several commonly used machine learning algorithms were evaluated during the model development phase. The trained models showed an overall high classification reliability, which indicated that they can be used for the maritime image classification task. Among the evaluated models, SVM exhibited the best performance and was therefore selected as the predictive algorithm that would be incorporated into the proposed model for maritime image classification.
Figure 8 illustrates the final workflow for the second phase of the model development process oriented towards maritime image classification.

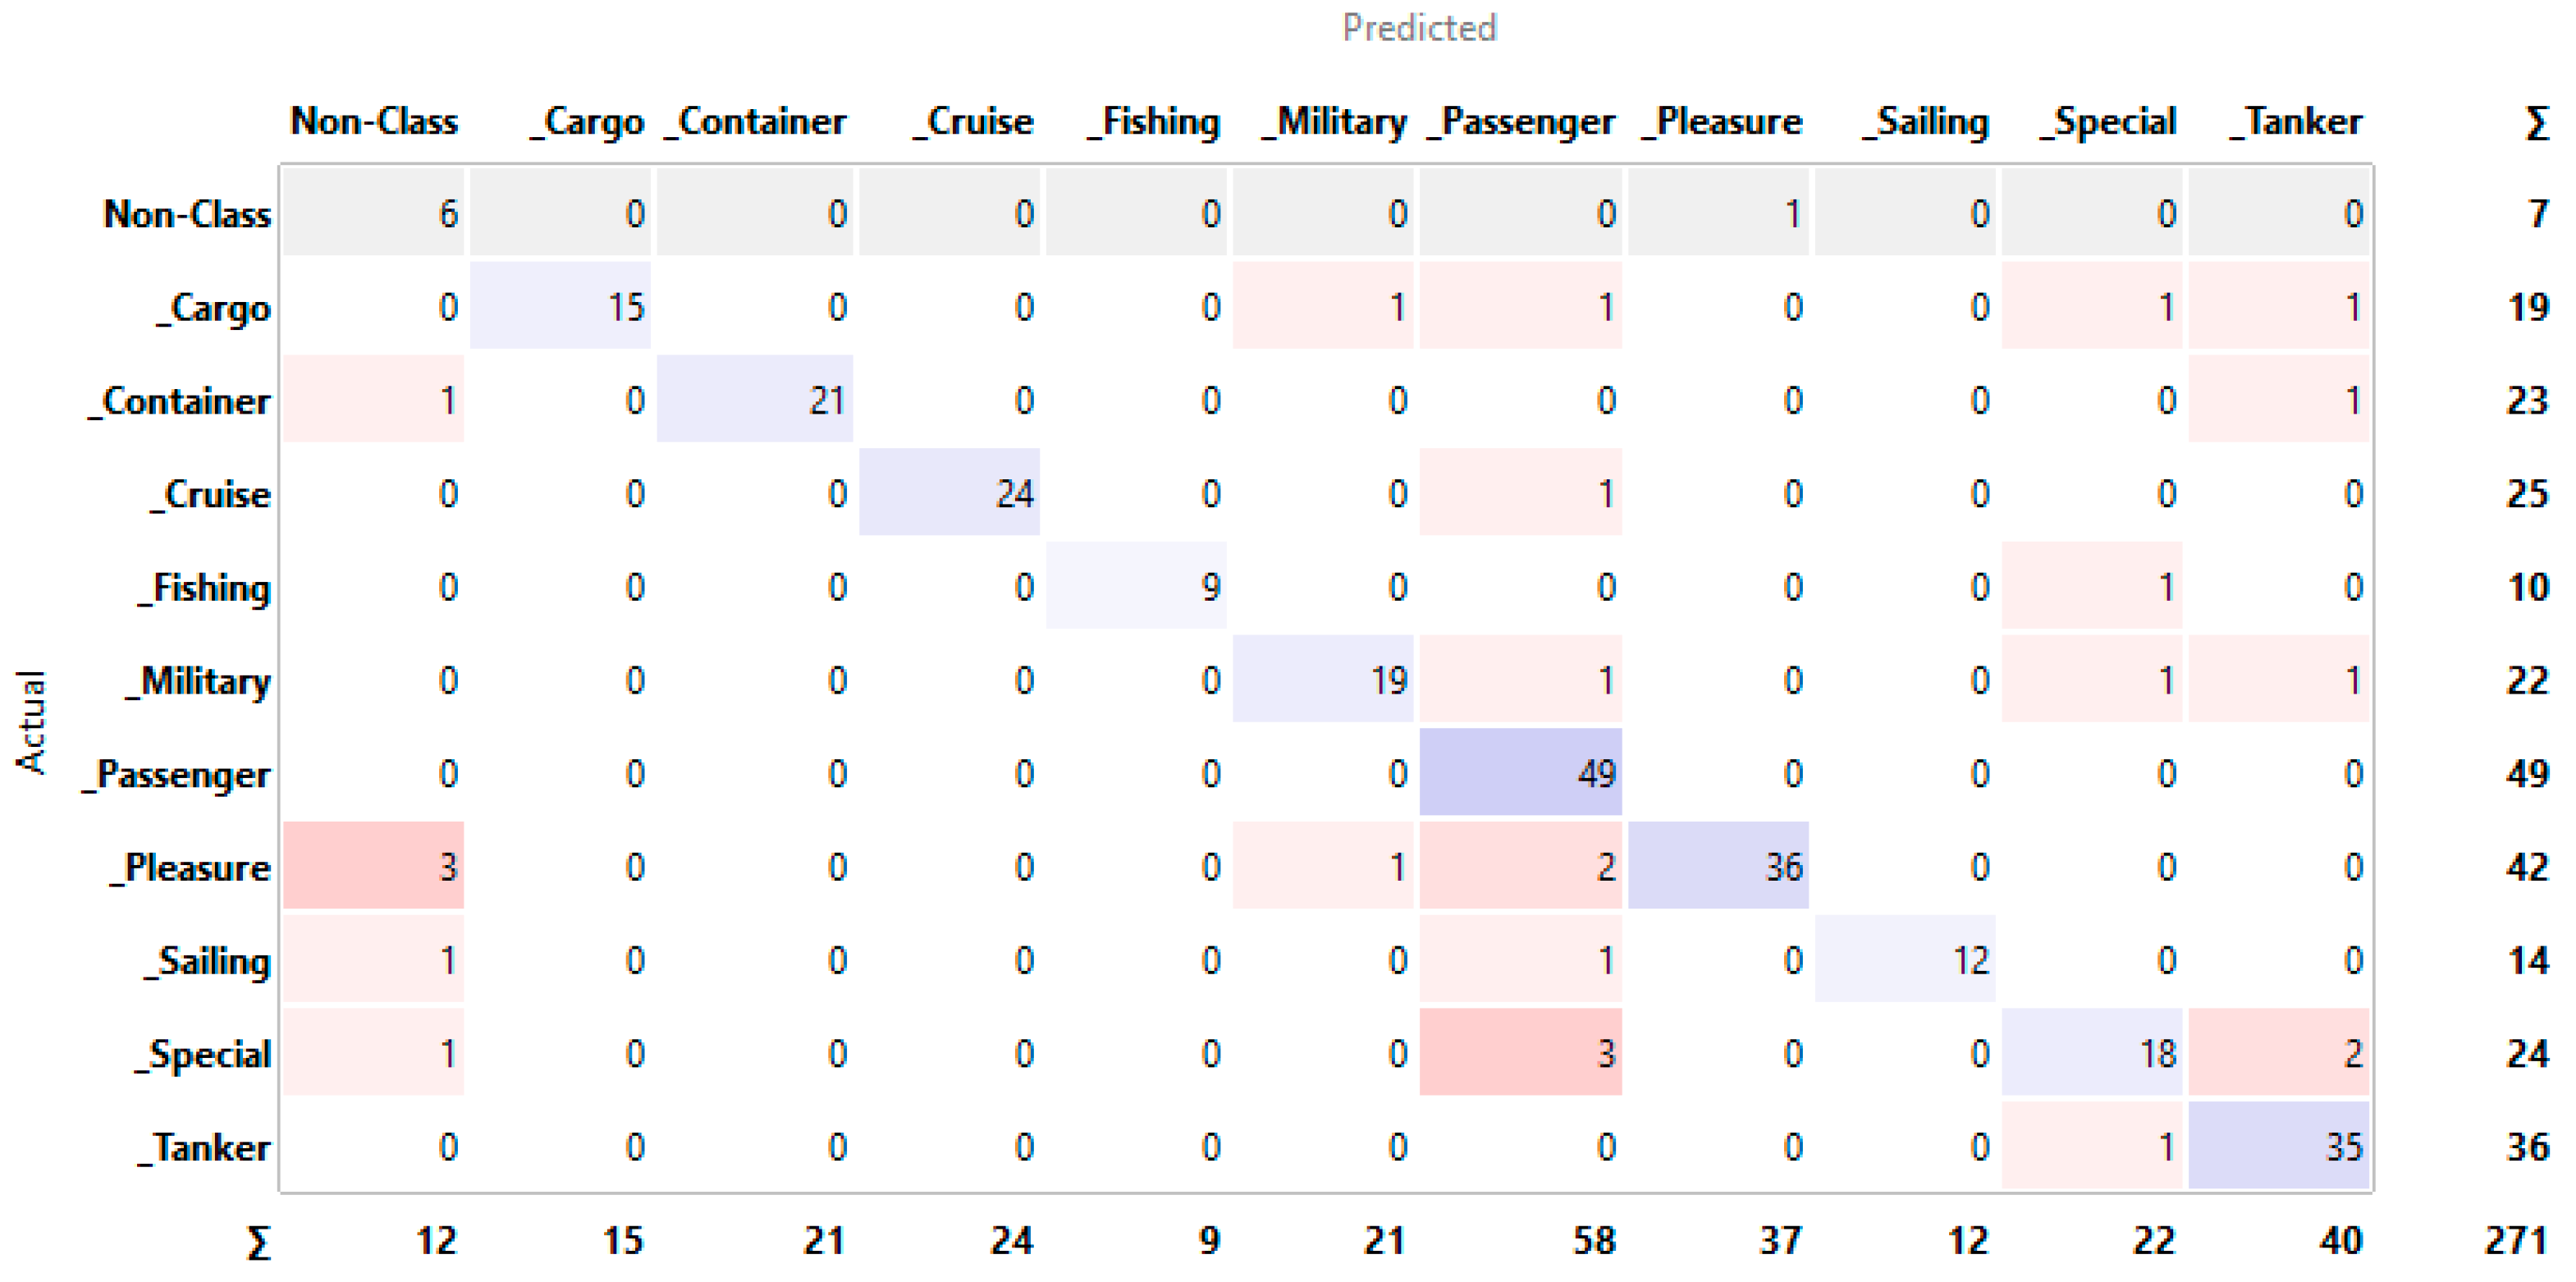
4.2.3. Model Evaluation

With the proposed model for maritime image classification fully constructed, the final step that remains is to evaluate its performance on previously unseen data. These data encompass 200 images whose class distribution is shown in Figure 4.
The final workflow of the prediction framework is shown in Figure 9, and a confusion matrix detailing the average classification accuracy per class is shown in Table 3.
From the results shown in Table 3, it can be seen that on the sample of 200 maritime images, the model accurately identified 173 instances, which corresponds to an overall accuracy of 86.50%, which is a high score. However, when looking at precision by individual image class, it can be observed that the success rate ranges from 66.67% (for the classes cargo and special) up to 100.00% (for the class sailing).
The relatively low prediction rate for cargo and special classes is not unexpected and can be attributed to several reasons. Different instances of vessels in these classes sometimes actually resemble the shape of vessels in other classes, which leads to an increase in classification errors. Specifically, the class special is characterized by significant variability in shape and other attributes, which consequently makes classification more difficult. Additionally, it is important to consider the specifics of the dataset on which the model was constructed and evaluated, but this is a standard property of all such predictive models.
Alternatively, the model achieved 100% accuracy in classifying maritime vessels belonging to the sailing class. This result can be attributed to the distinctive shape of these vessels, by which it is possible (on our dataset) to unambiguously determine their class.
Given that our research was conducted with a military context in mind, it is noteworthy that the model achieved a classification accuracy of 86.67% for images belonging to the military class. This achievement underscores the potential reliability of a similar model in real-world applications, in which the accurate detection of this type of vessel would be of utmost importance.
Finally, in Table 4 we compared our proposed model for maritime image classification to several existing models. It is important to note, however, that not all models focus on the identification of the same types of vessels, utilize the same image datasets for training and testing, employ the same artificial intelligence techniques, or use the same evaluation measures. Therefore, this comparison should be viewed as a preliminary assessment that is liable to change.
In conclusion, the proposed model for maritime image classification exhibited a high prediction accuracy, even for the non-class category, which was included in the model to introduce a controlled level of noise. Overall, the model demonstrated its ability to differentiate vessels from non-vessels and its effectiveness in determining the particular type to which the vessel belongs. Alternatively, the effectiveness in differentiating separate types of non-vessel objects was not the focus of this research and remains an area for future exploration.

5. Conclusions

The preceding analysis confirms the feasibility of independently developing and deploying models for maritime surveillance that are based on the analysis of images collected by optical sensors already in use in many seaports. The introduction of decision-making process automation based on artificial intelligence algorithms can ensure a high level of reliability and relieve operators, leaving them room to intervene only in doubtful situations. This proves that a similar model can be integrated as a crucial part of the information system used to maintain the maritime picture. The implementation of this model into real-world applications could automate the maritime surveillance process and thus contribute to maintaining situational awareness at sea.
The primary limitation of the presented model is the dataset on which it was constructed. This dataset was created by combining multiple sources that predominantly reflect conditions specific to the Croatian part of the Adriatic Sea. While the model is tailored for analyzing this region, any attempts to replicate similar systems in different areas would necessitate retraining on localized datasets.
To enhance the model’s performance in the future, we recommend the following strategies:
  • Dataset augmentation. By increasing the number of images in the dataset, a more robust foundation for model training can be established.
  • Refinement of maritime vessel categories. Enhancing the dataset by incorporating additional maritime vessel categories could ensure it is not restricted to one specific geographic area. This would make it more versatile and applicable to a wider number of applications.
  • Evaluation of additional machine learning algorithms. Testing the performance of additional algorithms on the newly constructed dataset could provide valuable insights about the type of classification method most suited for the task at hand. The evaluation should prioritize not only classification accuracy but also the speed of processing, as real-time performance is essential for effective maritime vessel surveillance, especially in military domains.
In conclusion, we believe that the approach presented in this paper provides a robust new method for maritime vessel classification by emphasizing traditional machine learning algorithms over deep learning-based algorithms. Deep learning techniques usually require an extensive amount of training data and a substantial computational infrastructure, i.e., things that are arguably not readily available to the majority of users. However, many people do have access to home computers that can be used for training simple machine learning algorithms, and this accessibility makes our proposed approach more practical and widely applicable.

Author Contributions

Conceptualization, H.K. and M.B.; methodology, H.K., M.B. and K.B.; software, H.K. and K.B.; validation, H.K., M.B., A.G. and K.B.; formal analysis, A.G.; investigation, H.K., M.B., A.G. and K.B.; resources, A.G. and K.B.; data curation, H.K.; writing—original draft preparation, H.K. and M.B.; writing—review and editing, H.K., M.B., A.G. and K.B.; visualization, H.K. and M.B.; supervision, H.K. and A.G.; project administration, H.K.; funding acquisition, H.K., M.B. and A.G. All authors have read and agreed to the published version of the manuscript.

Funding

This work received funding from the National Competence Centers in the framework of EuroHPC Phase 2 (EuroCC 2) under grant agreement No. 951732 101101903. This project is funded by the Joint Undertaking for High-Performance Computing (EuroHPC JU) as well as partner countries Germany, Bulgaria, Austria, Croatia, Cyprus, the Czech Republic, Denmark, Estonia, Finland, Greece, Hungary, Ireland, Italy, Lithuania, Latvia, Poland, Portugal, Romania, Slovenia, Spain, Sweden, France, the Netherlands, Belgium, Luxembourg, Slovakia, Norway, Turkey, the Republic of North Macedonia, Iceland, Montenegro, and Serbia. This work was also partly supported by the Ministry of Science and Education of the Republic of Croatia under the FESB VIF project “iEnv—Intelligent Observers in Environmental Protection”.

Institutional Review Board Statement

Not applicable.

Informed Consent Statement

Not applicable.

Data Availability Statement

The data presented in this study are openly available in Split Port Ship Classification Dataset (SPSCD) at https://labs.pfst.hr/maritime-dataset/ (accessed on 28 April 2025).

Acknowledgments

The authors would like to thank Miro Petković, Igor Vujović, Zvonimir Lušić, and Joško Šoda for making their Split Port Ship Classification Dataset available online. The authors would also like to sincerely thank LTC Craig Broyles, a former commander of the U.S. Army Washington National Guard 3rd Battalion, 161st Infantry Regiment (The Dark Rifles), 81st Stryker Brigade Combat Team, for making his military lessons available online. We are deeply grateful for the selfless dedication of these individuals to the principles of open research and education, without which this work would not have been possible.

Conflicts of Interest

The authors declare no conflicts of interest.

Abbreviations

The following abbreviations are used in this manuscript:
2Dtwo-dimensional
AIartificial intelligence
AISautomatic identification system
AUCarea under the curve
BoWbag-of-words
CAclassification accuracy
CNNconvolutional neural network
CRISP-DMCross-Industry Standard Process for Data Mining
DMdata mining
EMelectromagnetic
HDRHigh Dynamic Range
HPCHigh-Performance Computing
IRInfrared
kNNk-Nearest Neighbors
LAWSlethal autonomous weapons systems
MDMPmilitary decision-making process
MRIMagnetic Resonance Imaging
NATONorth Atlantic Treaty Organization
NOAANational Oceanic and Atmospheric Administration
OODAObserve, Orient, Decide, Act
PPIpixels per inch
RBFRadial Basis Function
ReLURectified Linear Unit
RGBRed, Green, Blue
RGB-DRGB-Depth
RMPRecognized Maritime Picture
ROCReceiver Operating Characteristic
SARsynthetic-aperture radar
SIFTScale Invariant Feature Transform
SURFSped-Up Robust Features
SVMsupport vector machine
UAVunmanned aerial vehicle

References

  1. Scott-Samuel, N.E.; Baddeley, R.; Palmer, C.E.; Cuthill, I.C. Dazzle camouflage affects speed perception. PLoS ONE 2011, 6, e20233. [Google Scholar] [CrossRef]
  2. White, E. Technicities of deception: Dazzle camouflage, avant-gardes and sensory augmentation in the First World War. Mod. Cult. 2017, 12, 36–58. [Google Scholar] [CrossRef]
  3. de Reus, N.M.; Kerbusch, P.J.M.; Schadd, M.P.D.; de Vos, A. Geospatial Analysis for Machine Learning in Tactical Decision Support. STO-MP-MSG-184 2021. Available online: https://www.researchgate.net/publication/357768410_Geospatial_analysis_for_Machine_Learning_in_Tactical_Decision_Support (accessed on 28 December 2024).
  4. Surdu, J.R.; Kittka, K. Deep Green: Commander’s tool for COA’s concept. Comput. Commun. Control. Technol. 2008, 34, 45–51. [Google Scholar]
  5. Chen, C.; Kong, D.F.; Du, Z.J.; Li, R. Modeling and solution of COA development based on timed influence net and game theory. Appl. Math. Model. 2014, 38, 5269–5278. [Google Scholar] [CrossRef]
  6. Christie, E.H.; Ertan, A.; Adomaitis, L.; Klaus, M. Regulating lethal autonomous weapon systems: Exploring the challenges of explainability and traceability. AI Ethics 2024, 4, 229–245. [Google Scholar] [CrossRef]
  7. Righetti, L.; Pham, Q.C.; Madhavan, R.; Chatila, R. Lethal autonomous weapon systems [ethical, legal, and societal issues]. IEEE Robot. Autom. Mag. 2018, 25, 123–126. [Google Scholar] [CrossRef]
  8. Orange Data Mining. University of Ljubljana. Available online: https://orangedatamining.com/ (accessed on 28 December 2024).
  9. Şengül, B.; Yılmaz, F.; Uğurlu, Ö. Safety–security analysis of maritime surveillance systems in critical marine areas. Sustainability 2023, 15, 16381. [Google Scholar] [CrossRef]
  10. Burmeister, H.C.; Constapel, M. Autonomous collision avoidance at sea: A survey. Front. Robot. AI 2021, 8, 739013. [Google Scholar] [CrossRef]
  11. Dunn, D.C.; Jablonicky, C.; Crespo, G.O.; McCauley, D.J.; Kroodsma, D.A.; Boerder, K.; Gjerde, K.M.; Halpin, P.N. Empowering high seas governance with satellite vessel tracking data. Fish Fish. 2018, 19, 729–739. [Google Scholar] [CrossRef]
  12. Gonçalves, L.; Damas, B. Automatic detection of rescue targets in maritime search and rescue missions using UAVs. In Proceedings of the International Conference on Unmanned Aircraft Systems (ICUAS), Dubrovnik, Croatia, 21–24 June 2022; pp. 1638–1643. [Google Scholar] [CrossRef]
  13. Shanthi, T.S.; Dheepanbalaji, L.; Priya, R.; Kumar, V.D.A.; Kumar, A.; Sindhu, P.; Kumar, A. Illegal fishing, anomalous vessel behavior detection through automatic identification system. Mater. Today Proc. 2022, 62, 4685–4690. [Google Scholar] [CrossRef]
  14. Emmens, T.; Amrit, C.; Abdi, A.; Ghosh, M. The promises and perils of Automatic Identification System data. Expert Syst. Appl. 2021, 178, 114975. [Google Scholar] [CrossRef]
  15. Jiang, Z.; Zhang, L.; Li, W. A machine vision method for the evaluation of ship-to-ship collision risk. Heliyon 2024, 10, e25105. [Google Scholar] [CrossRef]
  16. Huang, Z.; Hu, Q.; Mei, Q.; Yang, C.; Qu, Z. Identity recognition on waterways: A novel ship information tracking method based on multimodal data. J. Navig. 2021, 74, 1336–1352. [Google Scholar] [CrossRef]
  17. Zardoua, Y.; Sebbar, B.; Chbeine, M.; Astito, A.; Boulaala, M. Role and Integration of Image Processing Systems in Maritime Target Tracking. arXiv 2024. [Google Scholar] [CrossRef]
  18. Copple, R.; The Fallacy of Unambiguous Warning. US Army War College. Available online: https://publications.armywarcollege.edu/News/Display/Article/3890315/the-fallacy-of-unambiguous-warning/ (accessed on 27 December 2024).
  19. Xu, H.; Huang, L.; Chen, Y.; Zhu, J.; Zeng, H. Unsupervised military-civilian cross-domain vessel re-identification using improved momentum contrast learning. In Proceedings of the 2024 International Conference on New Trends in Computational Intelligence (NTCI), Qingdao, China, 18–20 October 2024; pp. 106–110. [Google Scholar] [CrossRef]
  20. Soori, M.; Jough, F.G.J.; Dastres, R.; Arezoo, B. AI-based decision support systems in industry 4.0, A review. J. Econ. Technol. 2024. [Google Scholar] [CrossRef]
  21. Državni Zavod za Statistiku Republike Hrvatske (Croatian Bureau of Statistics). Statistički Ljetopis Republike Hrvatske (Statistical Yearbook of the Republic of Croatia). 2018. Zagreb. ISSN 1333-3305. Available online: https://podaci.dzs.hr/media/wsdkedwa/sljh2018.pdf (accessed on 5 February 2025).
  22. Kanjir, U.; Greidanus, H.; Oštir, K. Vessel detection and classification from spaceborne optical images: A literature survey. Remote Sens. Environ. 2018, 207, 1–26. [Google Scholar] [CrossRef] [PubMed]
  23. Lu, Y.; Ma, H.; Smart, E.; Vuksanovic, B.; Chiverton, J.; Prabhu, S.R.; Glaister, M.; Dunston, E.; Hancock, C. Fusion of camera-based vessel detection and AIS for maritime surveillance. In Proceedings of the 26th International Conference on Automation and Computing (ICAC), Portsmouth, UK, 2–4 September 2021; pp. 1–6. [Google Scholar] [CrossRef]
  24. International Maritime Organization (IMO). AIS Transponders. Available online: https://www.imo.org/en/OurWork/Safety/Pages/AIS.aspx (accessed on 13 January 2025).
  25. McCauley, D.J.; Woods, P.; Sullivan, B.; Bergman, B.; Jablonicky, C.; Roan, A.; Hirshfield, M.; Boerder, K.; Worm, B. Ending hide and seek at sea. Science 2016, 351, 1148–1150. [Google Scholar] [CrossRef] [PubMed]
  26. Škrlec, Z.; Bićanić, Z.; Tadić, J. Specific requirements for automated identification system on NATO vessels. In Proceedings of the 5th International Maritime Science Conference, Solin, Croatia, 22–23 April 2013; pp. 50–58. [Google Scholar]
  27. Huang, I.-L.; Lee, M.-C.; Nieh, C.-Y.; Huang, J.-C. Ship classification based on AIS data and machine learning methods. Electronics 2024, 13, 98. [Google Scholar] [CrossRef]
  28. Sheng, K.; Liu, Z.; Zhou, D.; He, A.; Feng, C. Research on ship classification based on trajectory features. J. Navig. 2018, 71, 100–116. [Google Scholar] [CrossRef]
  29. Baeg, S.; Hammond, T. Ship type classification based on the ship navigating trajectory and machine learning. In Proceedings of the ACM IUI Workshops, Sydney, Australia, 27–31 March 2023. [Google Scholar]
  30. Yang, D.; Wu, L.; Wang, S.; Jia, H.; Li, K.X. How big data enriches maritime research—A critical review of automatic identification system (AIS) data applications. Transp. Rev. 2019, 39, 755–773. [Google Scholar] [CrossRef]
  31. Tsokas, A.; Rysz, M.; Pardalos, P.M.; Dipple, K. SAR data applications in earth observation: An overview. Expert Syst. Appl. 2022, 205, 117342. [Google Scholar] [CrossRef]
  32. Ma, M.; Chen, J.; Liu, W.; Yang, W. Ship classification and detection based on CNN using GF-3 SAR images. Remote Sens. 2018, 10, 2043. [Google Scholar] [CrossRef]
  33. Sannapu, A.R.; Nayak, P.; Charan, U.R.; Keshava, S.G.; Naidu, K.S. Classification of marine vessels using deep learning models based on SAR images. In Proceedings of the International Conference on Inventive Computation Technologies (ICICT), Online, 20–22 July 2022; pp. 123–129. [Google Scholar] [CrossRef]
  34. Wang, Y.; Wang, C.; Zhang, H. Ship classification in high-resolution SAR images using deep learning of small datasets. Sensors 2018, 18, 2929. [Google Scholar] [CrossRef] [PubMed]
  35. LTC Craig Broyles (Author). Cascade Rifles (YouTube Channel Name). Dark Rifle Way of War Ep. 3—Outmaneuver the Enemy. 2022. Available online: https://www.youtube.com/watch?v=mO1M5-SmlZw (accessed on 4 July 2024).
  36. Boyd, J.R. Patterns of Conflict. Presentation, 1986. Available online: https://www.coljohnboyd.com/static/documents/1986-12__Boyd_John_R__Patterns_of_Conflict__PPT-PDF.pdf (accessed on 4 July 2024).
  37. Boyd, J.R. The Essence of Winning & Losing. Presentation, 1995. Available online: https://www.coljohnboyd.com/static/documents/1995-06-28__Boyd_John_R__The_Essence_of_Winning_and_Losing__PPT-PDF.pdf (accessed on 4 July 2024).
  38. Boyd, J.R.; Hammond, G.T. A Discourse on Winning and Losing; Air University Press, 386 Maxwell Air Force Base: Montgomery, AL, USA, 2018; p. 400. [Google Scholar]
  39. Abba, S.; Bizi, A.M.; Lee, J.-A.; Bakouri, S.; Crespo, M.L. Real-time object detection, tracking, and monitoring framework for security surveillance systems. Heliyon 2024, 10, e34922. [Google Scholar] [CrossRef]
  40. Teixeira, E.; Araujo, B.; Costa, V.; Mafra, S.; Figueiredo, F. Literature review on ship localization, classification, and detection methods based on optical sensors and neural networks. Sensors 2022, 22, 6879. [Google Scholar] [CrossRef]
  41. Máttyus, G. Near real-time automatic marine vessel detection on optical satellite images. Int. Arch. Photogramm. Remote Sens. Spat. Inf. Sci. 2013, XL-1/W1, 233–237. [Google Scholar] [CrossRef]
  42. Feineigle, P.A.; Morris, D.D.; Snyder, F.D. Ship recognition using optical imagery for harbor surveillance. In Proceedings of the Association for Unmanned Vehicle Systems International (AUVSI), Washington, DC, USA, June 2007; pp. 1–17. [Google Scholar]
  43. Du, Q.; Zhang, Y.; Yang, X.; Liu, W. Ship target classification based on Hu invariant moments and ART for maritime video surveillance. In Proceedings of the 4th International Conference on Transportation Information and Safety (ICTIS), Banff, AB, Canada, 8–10 August 2017; IEEE: Piscataway, NJ, USA, 2017; pp. 414–419. [Google Scholar] [CrossRef]
  44. Lowe, D.G. Distinctive Image Features from Scale-Invariant Keypoints. Int. J. Comput. Vis. 2004, 60, 91–110. [Google Scholar] [CrossRef]
  45. Leclerc, M.; Tharmarasa, R.; Florea, M.C.; Boury-Brisset, A.-C.; Kirubarajan, T.; Duclos-Hindié, N. Ship classification using deep learning techniques for maritime target tracking. In Proceedings of the 21st International Conference on Information Fusion (FUSION), Cambridge, UK, 10–13 July 2018; pp. 737–744. [Google Scholar] [CrossRef]
  46. Mishra, N.K.; Kumar, A.; Choudhury, K. Deep convolutional neural network based ship images classification. Def. Sci. J. 2021, 71, 200–208. [Google Scholar] [CrossRef]
  47. Leonidas, L.A.; Jie, Y. Ship classification based on improved convolutional neural network architecture for intelligent transport systems. Information 2021, 12, 302. [Google Scholar] [CrossRef]
  48. Zhenzhen, L.; Baojun, Z.; Linbo, T.; Zhen, L.; Fan, F. Ship classification based on convolutional neural networks. J. Eng. 2019, 21, 7343–7346. [Google Scholar] [CrossRef]
  49. Gundogdu, E.; Solmaz, B.; Yücesoy, V.; Koç, A. Marvel: A large-scale image dataset for maritime vessels. In Computer Vision–ACCV 2016: 13th Asian Conference on Computer Vision, Revised Selected Papers, Part V 13; Springer: Cham, Switzerland, 2016; pp. 165–180. [Google Scholar]
  50. Jain, A. Game of Deep Learning: Ship Datasets. Available online: https://www.kaggle.com/datasets/arpitjain007/game-of-deep-learning-ship-datasets (accessed on 5 February 2025).
  51. Gallego, A.-J.; Pertusa, A.; Gil, P. Automatic ship classification from optical aerial images with convolutional neural networks. Remote Sens. 2018, 10, 511. [Google Scholar] [CrossRef]
  52. Liu, Y.; Cui, H.Y.; Kuang, Z.; Li, G.Q. Ship detection and classification on optical remote sensing images using deep learning. In ITM Web of Conferences, Proceedings of The 4th Annual International Conference on Information Technology and Applications (ITA 2017), Guangzhou, China, 26–28 May 2017; EDP Sciences: Les Ulis, France, 2017; Volume 12, p. 05012. [Google Scholar] [CrossRef]
  53. Polap, D.; Wlodarczyk-Sielicka, M. Classification of non-conventional ships using a neural Bag-of-Words mechanism. Sensors 2020, 20, 1608. [Google Scholar] [CrossRef] [PubMed]
  54. Bay, H.; Ess, A.; Tuytelaars, T.; Van Gool, L. Speeded-up robust features (SURF). Comput. Vis. Image Underst. 2008, 110, 346–359. [Google Scholar] [CrossRef]
  55. Syms, M.S.; Isenor, A.W.; Chivari, B.; DeBaie, A.; Hogue, A.; Glessing, B. Building a maritime picture in the era of big data: The development of the geospatial communication interface+. In Proceedings of the International Conference on Military Communication and Information Systems (ICMCIS), The Hague, The Netherlands, 4–5 May 2021; pp. 1–7. [Google Scholar] [CrossRef]
  56. Karna, H.; Mikulićić, N.; Škiljo, M. Towards Enhanced Recognized Maritime Picture. In Proceedings of the 7th International Conference on Smart and Sustainable Technologies (SpliTech), Bol, Croatia, 5–8 July 2022; pp. 1–4. [Google Scholar] [CrossRef]
  57. Chauvin, C.; Clostermann, J.-P.; Hoc, J.-M. Situation awareness and the decision-making process in a dynamic situation: Avoiding collisions at sea. J. Cogn. Eng. Decis. Mak. 2008, 2, 1–23. [Google Scholar] [CrossRef]
  58. Song, R.; Papadimitriou, E.; Negenborn, R.R.; Gelder, P.V. Integrating situation-aware knowledge maps and dynamic window approach for safe path planning by maritime autonomous surface ships. Ocean Eng. 2024, 311, 118882. [Google Scholar] [CrossRef]
  59. Paul, C.; Clarke, C.P.; Triezenberg, B.L.; Manheim, D.; Wilson, B. Requirements for Better C2 and Situational Awareness of the Information Environment; RAND Corporation: Santa Monica, CA, USA, 2018; Available online: https://www.rand.org/pubs/research_briefs/RB10032.html (accessed on 30 December 2024).
  60. Matsuzaka, Y.; Yashiro, R. AI-based computer vision techniques and expert systems. AI 2023, 4, 289–302. [Google Scholar] [CrossRef]
  61. Dehghani, N.; Levin, M. Bio-inspired AI: Integrating biological complexity into artificial intelligence. arXiv 2024. [Google Scholar] [CrossRef]
  62. Malowany, D.; Guterman, H. Biologically inspired visual system architecture for object recognition in autonomous systems. Algorithms 2020, 13, 167. [Google Scholar] [CrossRef]
  63. Mahadevkar, S.V.; Khemani, B.; Patil, S.; Kotecha, K.; Vora, D.R.; Abraham, A.; Gabralla, L. A review on machine learning styles in computer vision—Techniques and future directions. IEEE Access 2022, 10, 107293–107329. [Google Scholar] [CrossRef]
  64. Aldoseri, A.; Al-Khalifa, K.N.; Hamouda, A.M. Re-thinking data strategy and integration for artificial intelligence: Concepts, opportunities, and challenges. Appl. Sci. 2023, 13, 7082. [Google Scholar] [CrossRef]
  65. Cernadas, E. Applications of computer vision. 2nd Edition. Electronics 2024, 13, 3779. [Google Scholar] [CrossRef]
  66. Svenmarck, P.; Luotsinen, L.; Nilsson, M.; Schubert, J. Possibilities and Challenges for Artificial Intelligence in Military Applications. NATO S&T Organization. 2018. STO-MP-IST-160, S1-5-1–S1-5-16. Available online: https://www.sto.nato.int/publications/STO%20Meeting%20Proceedings/STO-MP-IST-160/MP-IST-160-S1-5.pdf (accessed on 30 December 2024).
  67. Žigulić, N.; Glučina, M.; Lorencin, I.; Matika, D. Military decision-making process enhanced by image detection. Information 2024, 15, 11. [Google Scholar] [CrossRef]
  68. Hwang, K.S.; Ma, J. Military camouflaged object detection with deep learning using dataset development and combination. J. Def. Model. Simul. Appl. Methodol. Technol. 2024. [Google Scholar] [CrossRef]
  69. Budiharto, W.; Andreas, V.; Suroso, J.S.; Gunawan, A.A.S.; Irwansyah, E. Development of tank-based military robot and object tracker. In Proceedings of the 2019 4th Asia-Pacific Conference on Intelligent Robot Systems (ACIRS), Nagoya, Japan, 13–15 July 2019; IEEE: Piscataway, NJ, USA, 2019; pp. 221–224. [Google Scholar] [CrossRef]
  70. Budiharto, W.; Irwansyah, E.; Suroso, J.S.; Gunawan, A.A.S. Design of object tracking for military robot using PID controller and computer vision. ICIC Express Lett. 2020, 14, 289–294. [Google Scholar] [CrossRef]
  71. Petković, M.; Vujović, I.; Lušić, Z.; Šoda, J. Image dataset for neural network performance estimation with application to maritime ports. J. Mar. Sci. Eng. 2023, 11, 578. [Google Scholar] [CrossRef]
  72. Bradski, G. The OpenCV library. Dr. Dobb’s J. Softw. Tools 2000, 120, 122–125. [Google Scholar]
  73. Imamagić, E.; Belavić, M. Croatian National Advanced Computing Resources Supek and Vrančić. In Proceedings of the Austrian-Slovenian HPC Meeting 2024—ASHPC24, Seeblickhotel Grundlsee, Austria, 10–13 June 2024. [Google Scholar]
  74. Shah, K.; Shah, N.; Sawant, V.; Parolia, N. (Eds.) Practical Data Mining Techniques and Applications, 1st ed.; Auerbach Publications: Boca Raton, FL, USA, 2023. [Google Scholar] [CrossRef]
  75. Shu, X.; Ye, Y. Knowledge discovery: Methods from data mining and machine learning. Soc. Sci. Res. 2023, 110, 102817. [Google Scholar] [CrossRef] [PubMed]
  76. Wirth, R.; Hipp, J. CRISP-DM: Towards a standard process model for data mining. In Proceedings of the 4th International Conference on the Practical Applications of Knowledge Discovery and Data Mining, Manchester, UK, 11–13 April 2000; pp. 29–39. [Google Scholar]
  77. Martínez-Plumed, F.; Contreras-Ochando, L.; Ferri, C.; Hernández-Orallo, J.; Kull, M.; Lachiche, N.; Ramírez-Quintana, M.J.; Flach, P. CRISP-DM twenty years later: From data mining processes to data science trajectories. IEEE Trans. Knowl. Data Eng. 2021, 33, 3048–3061. [Google Scholar] [CrossRef]
  78. Lundén, N.; Bekar, E.T.; Skoogh, A.; Bokrantz, J. Domain knowledge in CRISP-DM: An application case in manufacturing. IFAC-Pap. 2023, 56, 7603–7608. [Google Scholar] [CrossRef]
  79. Schröer, C.; Kruse, F.; Gómez, J.M. A systematic literature review on applying CRISP-DM process model. Procedia Comput. Sci. 2021, 181, 526–534. [Google Scholar] [CrossRef]
  80. Saltz, J.S.; Hotz, N. Identifying the most common frameworks data science teams use to structure and coordinate their projects. In Proceedings of the IEEE International Conference on Big Data (Big Data), Atlanta, GA, USA, 10–13 December 2020; pp. 2038–2042. [Google Scholar] [CrossRef]
  81. CRISP-DM Is Still the Most Popular Framework for Executing Data Science Projects. Data Science PM. 2024. Available online: https://www.datascience-pm.com/crisp-dm-still-most-popular/ (accessed on 30 December 2024).
  82. AIS Ship Types. Available online: https://api.vtexplorer.com/docs/ref-aistypes.html (accessed on 15 November 2024).
  83. AIS Vessel Type and Group Codes Used by The Marine Cadastre Project. Available online: https://coast.noaa.gov/data/marinecadastre/ais/VesselTypeCodes2018.pdf (accessed on 20 November 2024).
  84. Hunter, J.D. Matplotlib: A 2D graphics environment. Comput. Sci. Eng. 2007, 9, 90–95. [Google Scholar] [CrossRef]
  85. Szegedy, C.; Vanhoucke, V.; Ioffe, S.; Shlens, J.; Wojna, Z. Rethinking the Inception architecture for computer vision. arXiv 2015. [Google Scholar] [CrossRef]
  86. Stanford Vision Lab, Stanford University, Princeton University. ImageNet. Available online: https://image-net.org/index.php (accessed on 20 November 2024).
  87. Blanco-Mallo, E.; Morán-Fernández, L.; Remeseiro, B.; Bolón-Canedo, V. Do all roads lead to Rome? Studying distance measures in the context of machine learning. Pattern Recognit. 2023, 141, 109646. [Google Scholar] [CrossRef]
  88. Kartowisastro, I.H.; Latupapua, J. A Comparison of Adaptive Moment Estimation (Adam) and RMSProp Optimisation Techniques for Wildlife Animal Classification Using Convolutional Neural Networks. Rev. Intell. Artif. 2023, 37, 1023–1030. [Google Scholar] [CrossRef]
  89. Dogo, E.M.; Afolabi, O.J.; Nwulu, N.I.; Twala, B.; Aigbavboa, C.O. A comparative analysis of gradient descent-based optimization algorithms on convolutional neural networks. In Proceedings of the 2018 international conference on computational techniques, electronics and mechanical systems (CTEMS), Belagavi, India 21–23 December 2018; IEEE: Piscataway, NJ, USA, 2018; pp. 92–99. [Google Scholar] [CrossRef]
  90. Majnik, M.; Bosnić, Z. ROC analysis of classifiers in machine learning: A survey. Intell. Data Anal. 2013, 17, 531–558. [Google Scholar] [CrossRef]
  91. Flach, P.A.; Hernández-Orallo, J.; Ferri, C. A coherent interpretation of AUC as a measure of aggregated classification performance. In Proceedings of the 28th International Conference on International Conference on Machine Learning (ICML’11), Bellevue, WA, USA, 28 June–2 July 2011; pp. 657–664. [Google Scholar]
  92. Carrington, A.M.; Manuel, D.G.; Fieguth, P.W.; Ramsay, T.; Osmani, V.; Wernly, B.; Bennett, C.; Hawken, S.; Magwood, O.; Sheikh, Y.; et al. Deep ROC analysis and AUC as balanced average accuracy, for improved classifier selection, audit and explanation. IEEE Trans. Pattern Anal. Mach. Intell. 2023, 45, 329–341. [Google Scholar] [CrossRef]
  93. Luque, A.; Mazzoleni, M.A.; Carrasco, A.; Ferramosca, A. Visualizing classification results: Confusion star and confusion gear. IEEE Access 2022, 10, 1659–1677. [Google Scholar] [CrossRef]
  94. Perri, D.; Simonetti, M.; Gervasi, O. Synthetic data generation to speed-up the object recognition pipeline. Electronics 2022, 11, 2. [Google Scholar] [CrossRef]
  95. Huang, L.; Li, W.; Chen, C.; Zhang, F.; Lang, H. Multiple features learning for ship classification in optical imagery. Multimed. Tools Appl. 2018, 77, 13363–13389. [Google Scholar] [CrossRef]
  96. Sullivan, M.D.R.; Shah, M. Visual surveillance in maritime port facilities. SPIE Vis. Inf. Process. XVII 2008, 6978, 291–298. [Google Scholar] [CrossRef]
Figure 1. A visualization of a coordinate plane, demonstrated on an image of the Mosor mountain range in Split–Dalmatia County in Croatia.
Information 16 00367 g001
Figure 2. A decomposition of an RGB image into channels, demonstrated on an image from the SPSCD.
Information 16 00367 g002
Figure 3. Distribution of images in the dataset of 2715 images, categorized by different classes.
Information 16 00367 g003
Figure 4. Distribution of images in the dataset of 200 images, categorized by different classes.
Information 16 00367 g004
Figure 5. Image embedding and clustering workflow, generated with the Orange Data Mining tool.
Information 16 00367 g005
Figure 6. ROC curves for (a) cargo, (b) fishing, (c) tanker, and (d) sailing classes.
Information 16 00367 g006
Figure 7. Confusion matrix associated with the SVM algorithm evaluated on maritime images.
Information 16 00367 g007
Figure 8. Workflow associated with the comparison of different machine learning algorithms, generated with the Orange Data Mining tool.
Information 16 00367 g008
Figure 9. Final prediction workflow, generated with the Orange Data Mining tool.
Information 16 00367 g009
Table 1. Maritime vessel type classes and number of instances for each class in the constructed dataset.
TypeDescriptionNo. of Images
CargoVessel designed to transport cargo, goods, and materials in bulk.245
ContainerVessel that carries all its load in truck-size intermodal containers.276
CruiseVessels designed for providing passengers with accommodation and entertainment.241
FishingVessels used to locate, catch, and preserve fish and other aquatic animals in the sea.142
MilitaryNaval vessel used to project power onto the sea or for naval warfare.197
PassengerVessel specially designed for those transports of persons and their cargo.429
PleasureVessels designed for navigation and recreational purposes while providing comfort. 358
SailingVessel provided with sufficient sail area for navigation used for cruising or racing.151
SpecialSelf-propelled vessel serving diverse and often multiple functions (e.g., tugboat and dragger).214
TankerVessels designed to transport or store liquids or gases in bulk.357
Non-ClassNon-vessels, floating or other objects.105
2715
Table 2. Evaluation measures for selected machine learning algorithms.
ModelAUCCAF1-ScorePrecisionRecall
SVM0.9910.9000.9020.9140.900
Neural network0.9920.9040.9040.9070.904
Logistic regression0.9920.8820.8810.8850.882
kNN0.9680.8560.8580.8610.856
Naïve Bayesn/a0.7790.7900.8210.779
Decision tree0.7690.6090.6190.6410.609
Table 3. Final classification results achieved by the proposed model. The input set of images refers to the collection of 2715 maritime images, and the test set refers to the collection of 200 maritime images.
TypeInput SetTest SetPercentage [%]
TrainTestSuccessfulUnsuccessful
Cargo2261910566.67
Container2532313286.67
Cruise2162516194.11
Fishing1321011284.61
Military1752213286.67
Passenger3804920195.24
Pleasure3164222484.62
Sailing13714170100.00
Special1902410566.67
Tanker3213625292.59
Non-Class98716384.21
Total24442711732786.50
Table 4. Comparison of the proposed model with existing methods for maritime image classification.
ModelMaritime ClassesAverage Accuracy [%]
[95]barges, container ships, cargo ships, and tankers94.63
[95]barges, container ships, cargo ships, and tankers86.87
[95]merchant ships, sailing ships, medium passenger ships, medium “other” ships, tugboats, and small boats85.07
[96]container ships, speedboats, tanker ships, tugboats, cruise ships, and fishing boats88.1
[53]cargo, military, tanker, yacht, and motorboat79.58
Proposed modelcargo, container ships, cruise, fishing, military, passenger, pleasure, sailing, special, tanker, and non-class86.50
Disclaimer/Publisher’s Note: The statements, opinions and data contained in all publications are solely those of the individual author(s) and contributor(s) and not of MDPI and/or the editor(s). MDPI and/or the editor(s) disclaim responsibility for any injury to people or property resulting from any ideas, methods, instructions or products referred to in the content.

