Abstract
The coke and ore are stacked alternately in layers inside the blast furnace. The capability of the charging system to distribute them in the desired manner and with optimum strata thickness is crucial for the efficiency and high-performance operation of the blast furnace itself. The objective of this work is the optimization of the charging equipment of a specific blast furnace. This blast furnace consists of a hopper, a single bell and a deflector inserted in the hopper under the conveyor belt. The focus is the search for a deflector geometry capable of distributing the material as evenly as possible in the hopper in order to ensure the effective disposal of the material released in the blast furnace. This search was performed by coupling the discrete element method with a multi-strategy and self-adapting optimization algorithm. The numerical results were qualitatively validated with a laboratory-scale model. Low cost and the simplicity of operation and maintenance are the strengths of the proposed charging system. Moreover, the methodological approach can be extended to other applications and contexts, such as chemical, pharmaceutical and food processing industries. This is especially true when complex material release conditions necessitate achieving bulk material distribution requirements in containers, silos, hoppers or similar components.
1. Introduction
Smooth and uniform downward movement of the burden materials and free upward flow of the furnace gases are necessary for the efficient and high-performance operation of a blast furnace (BF). This behavior is strongly influenced by the characteristics of the burden materials, the charging system and adequate automation of the furnace operation to eliminate human errors. The mechanism of burden movement and distribution in BF have been analyzed in several studies, which present simple models, such as the theoretical and experimental investigation of trajectory and profile models [1,2,3], and increasingly complex models using computational fluid dynamics (CFD) simulations [4,5,6] or even coupled with the discrete element method (DEM) [7,8]. Roeplal et al., in their recent review [9], synthesize research that uses DEM to model phenomena affecting blast furnace burden permeability, influenced by factors such as particle size, shape, and distribution. Several articles analyze and/or individually or jointly optimize the aspects that influence BF efficiency, such as the burden composition [10,11], charging system operation [12,13,14,15], proper burden surface distribution [16,17] and automation of the furnace operation [18,19,20].
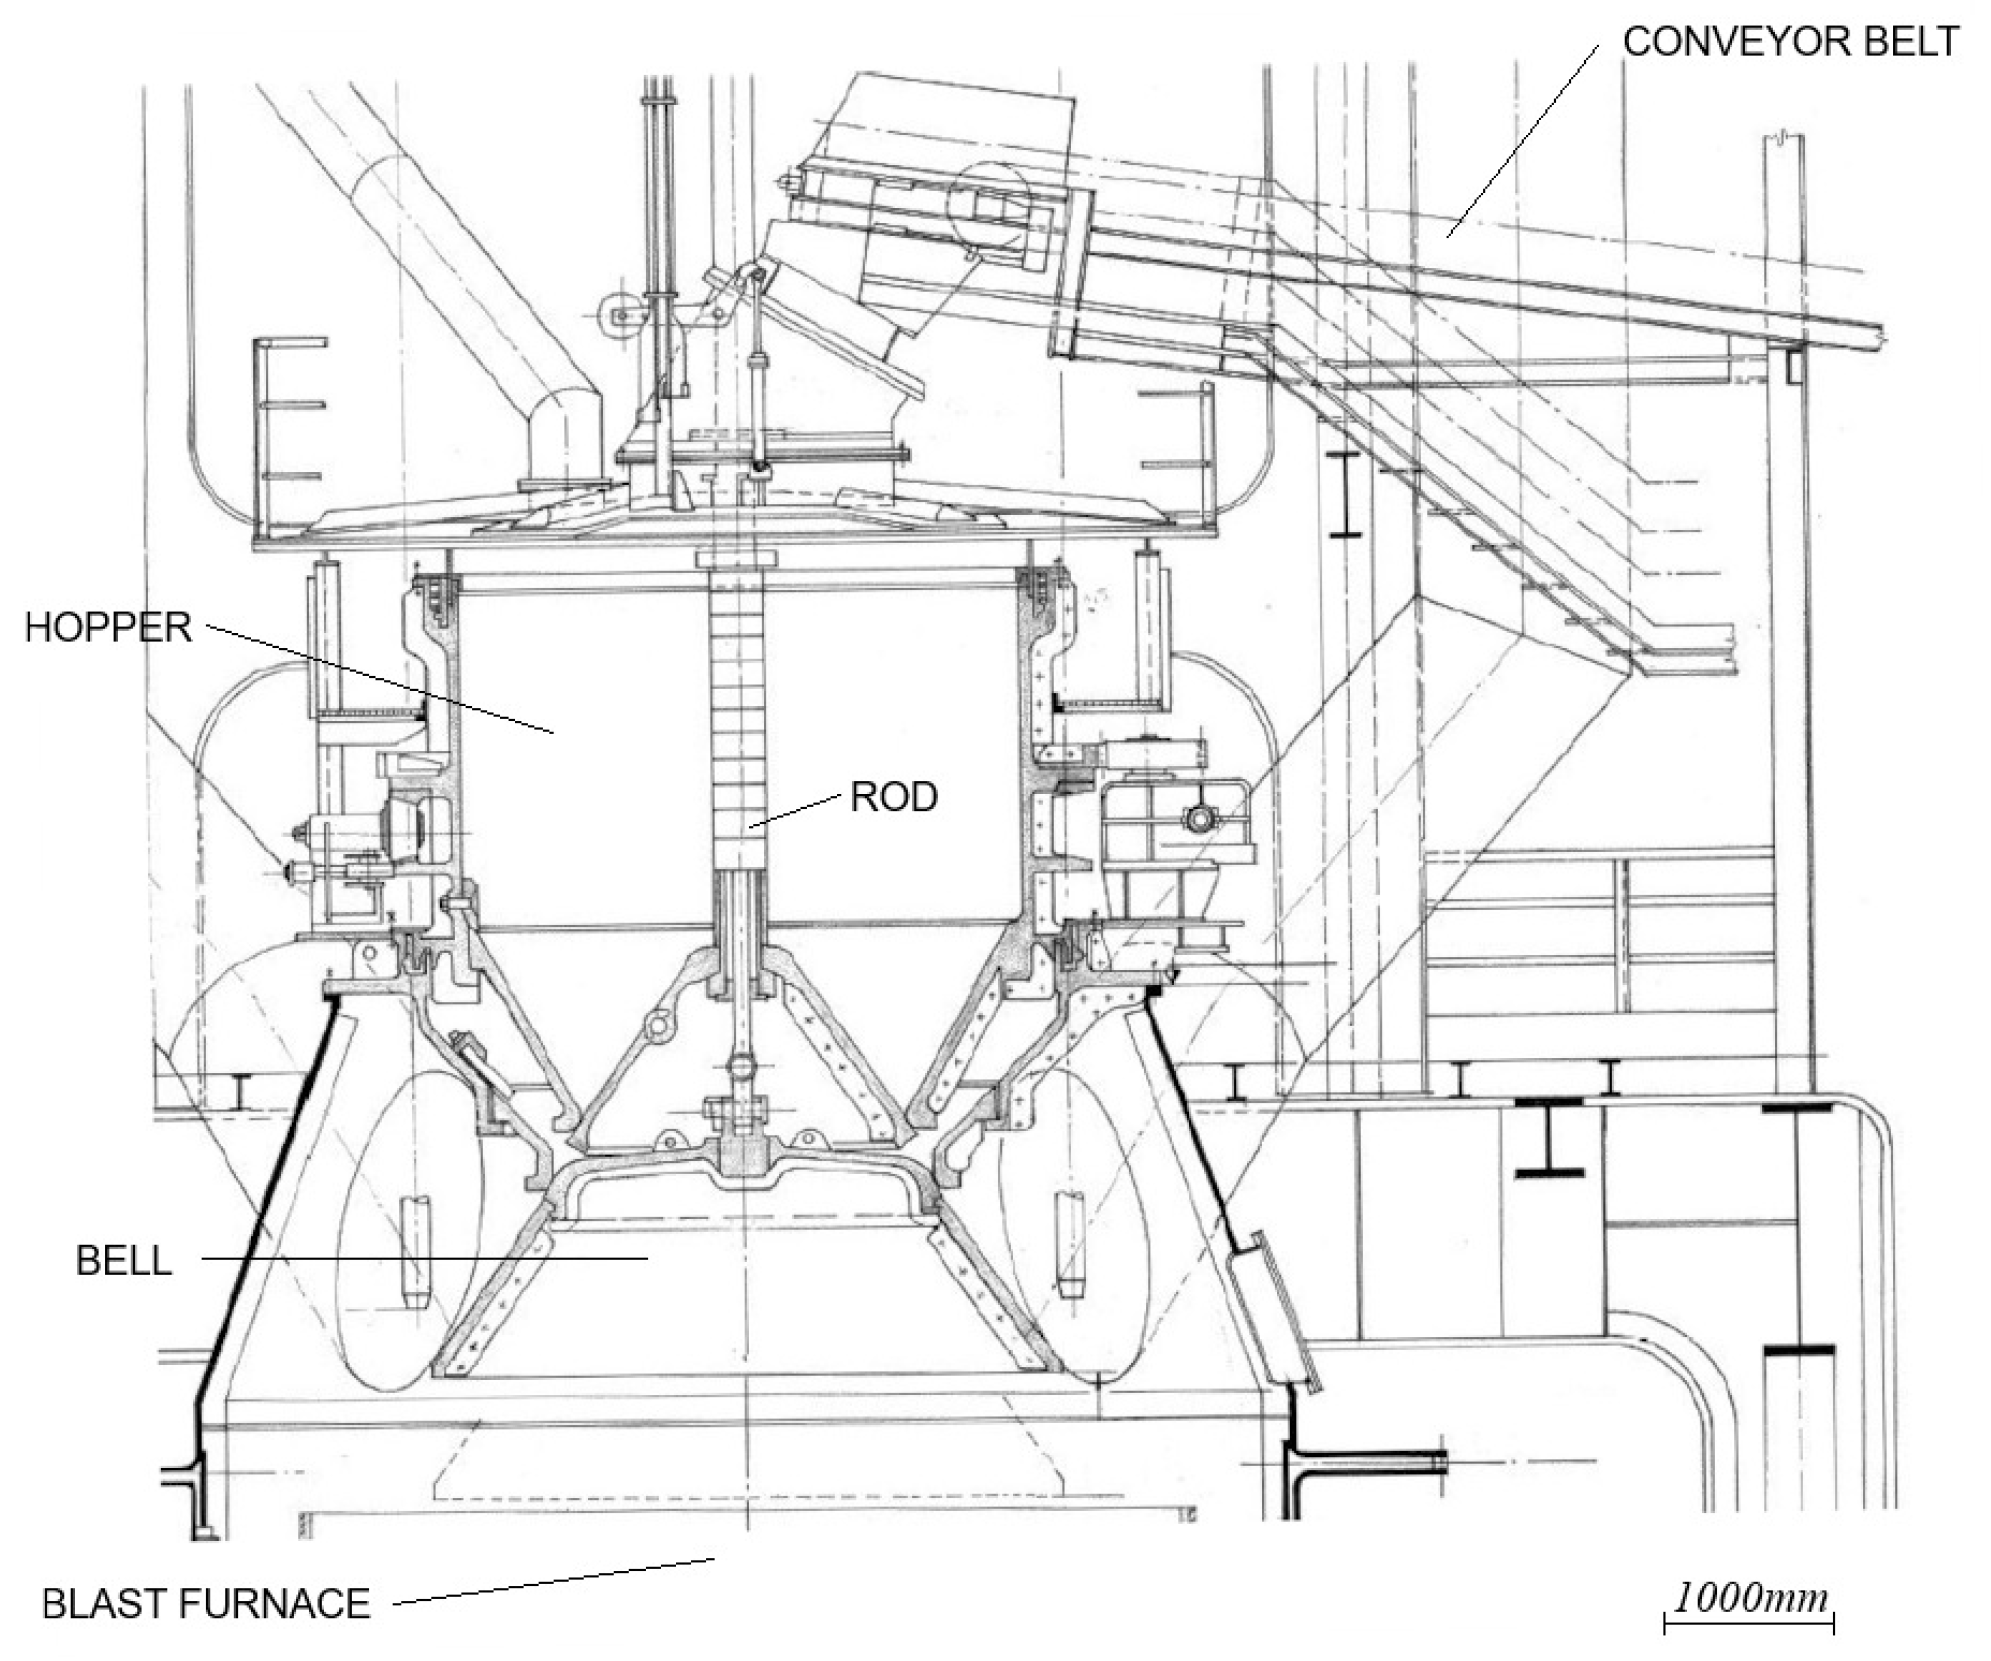
This study exclusively focuses on the charging system. The radial and circumferential distribution of the burden (coke and iron ore) in the furnace, stacked alternately in layers, plays an important role as it directly affects the reduction process. Therefore, the charging system should be capable of controlling where the materials are deposited with optimum layer thickness. The simplest charging system of BFs consists of a hopper and a single bell. Old concept plants use a double-bell system to control the entry of raw material into the BF. Bell-less systems, such as the Paul Wurth or Gimbal systems, are more common in recent plants and are able to provide the desired charge distribution within the blast furnace. A complete description of these charging systems can be found in Strassburger [21] and McNeil [22], to name a few. Of course, the bell-less system is the most widely analyzed, and recent works can be found in the literature [23,24,25,26,27].
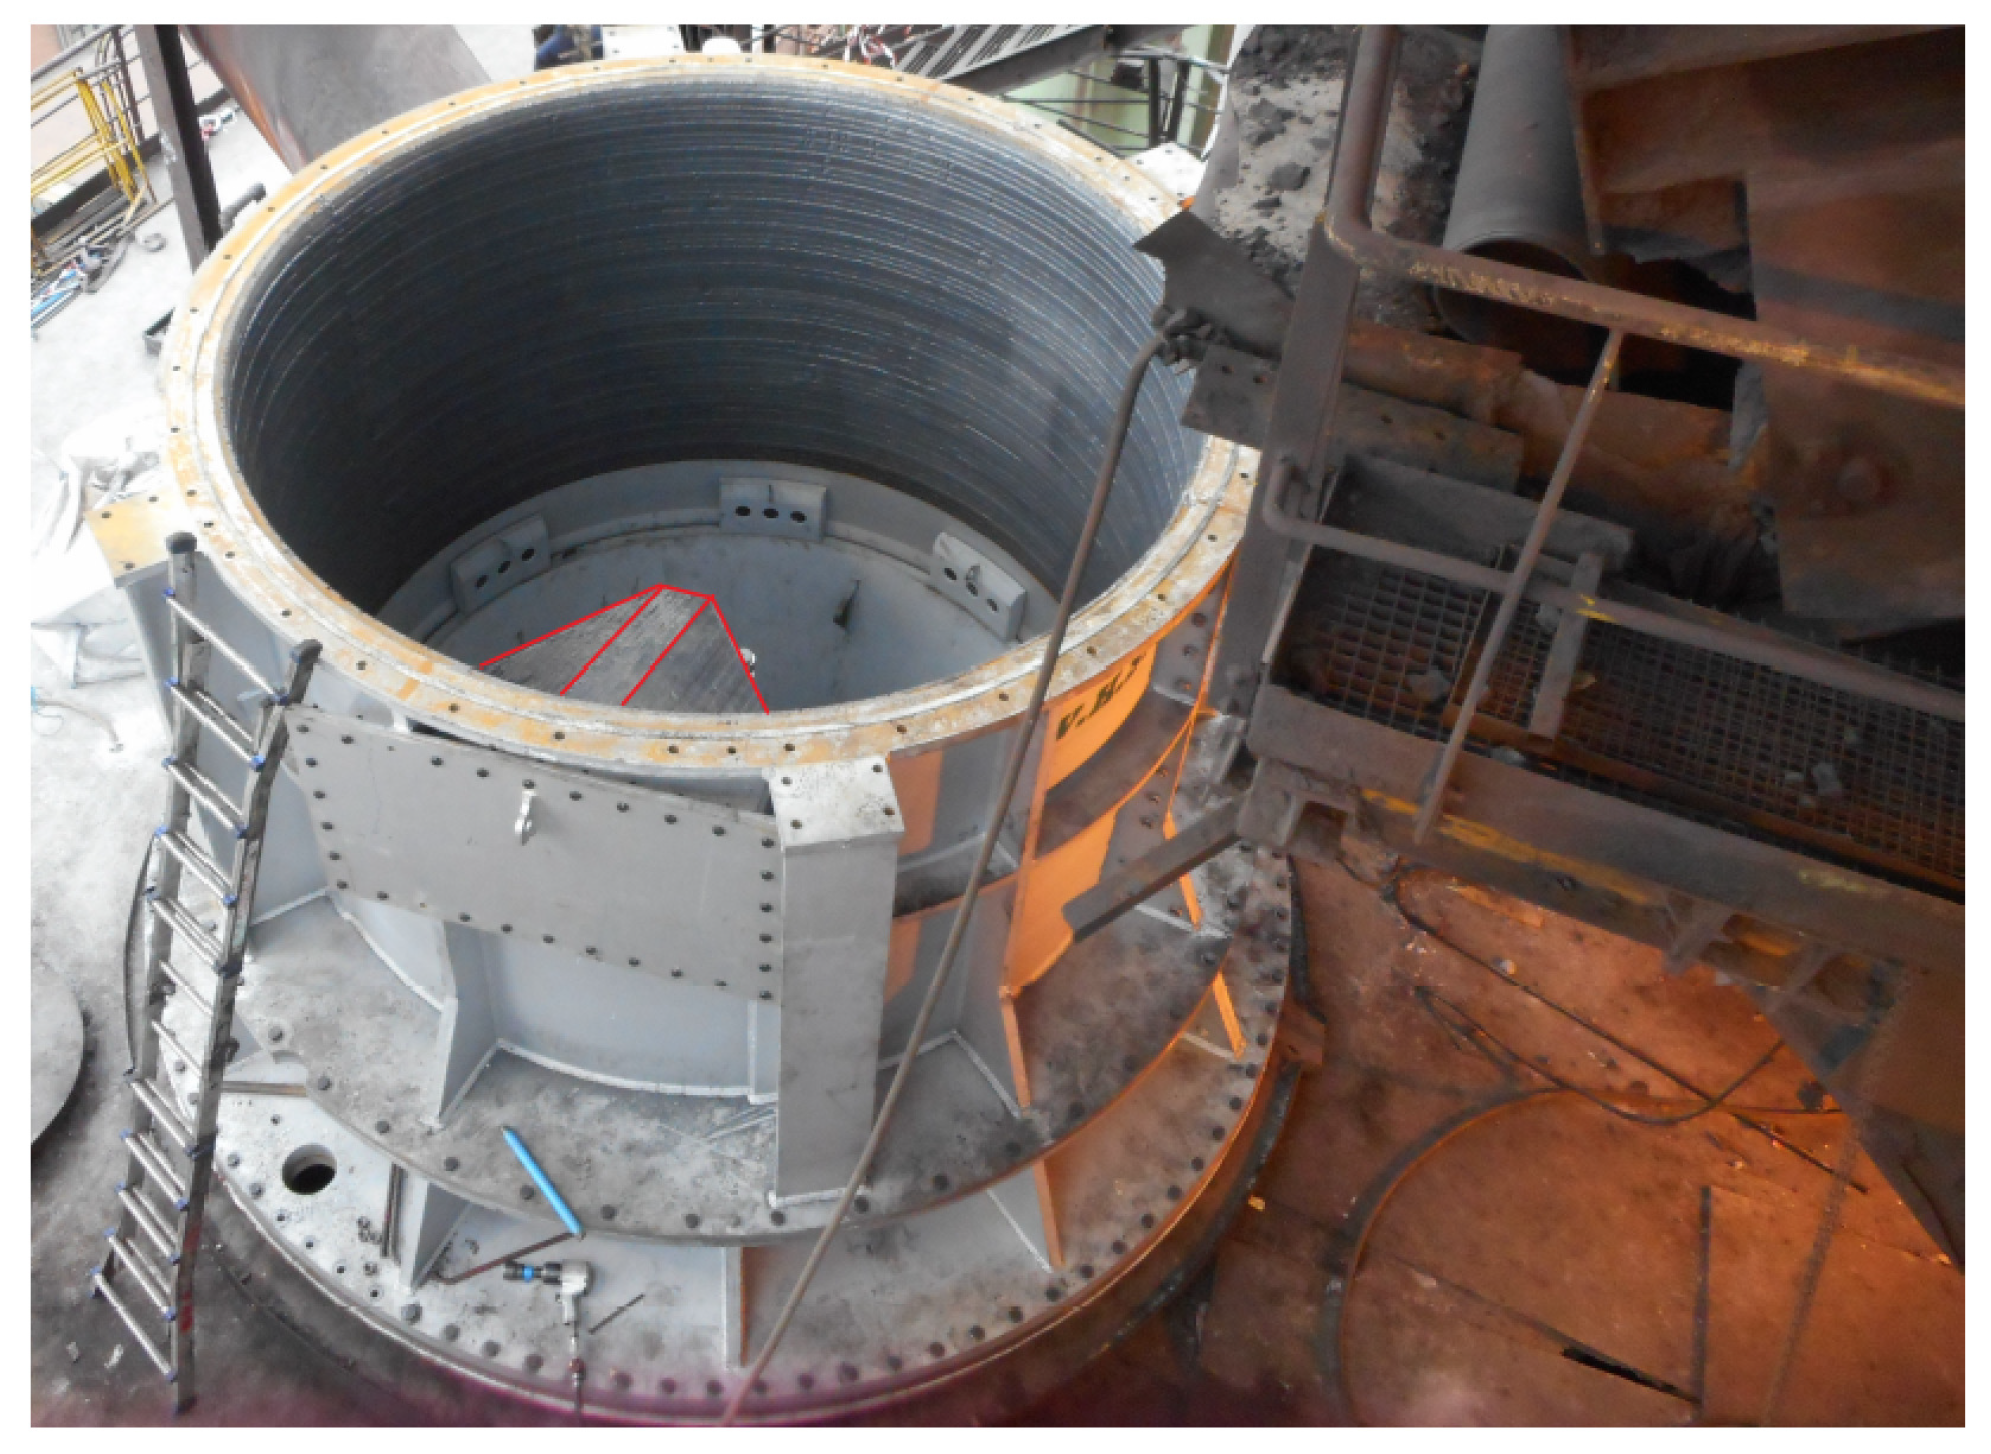
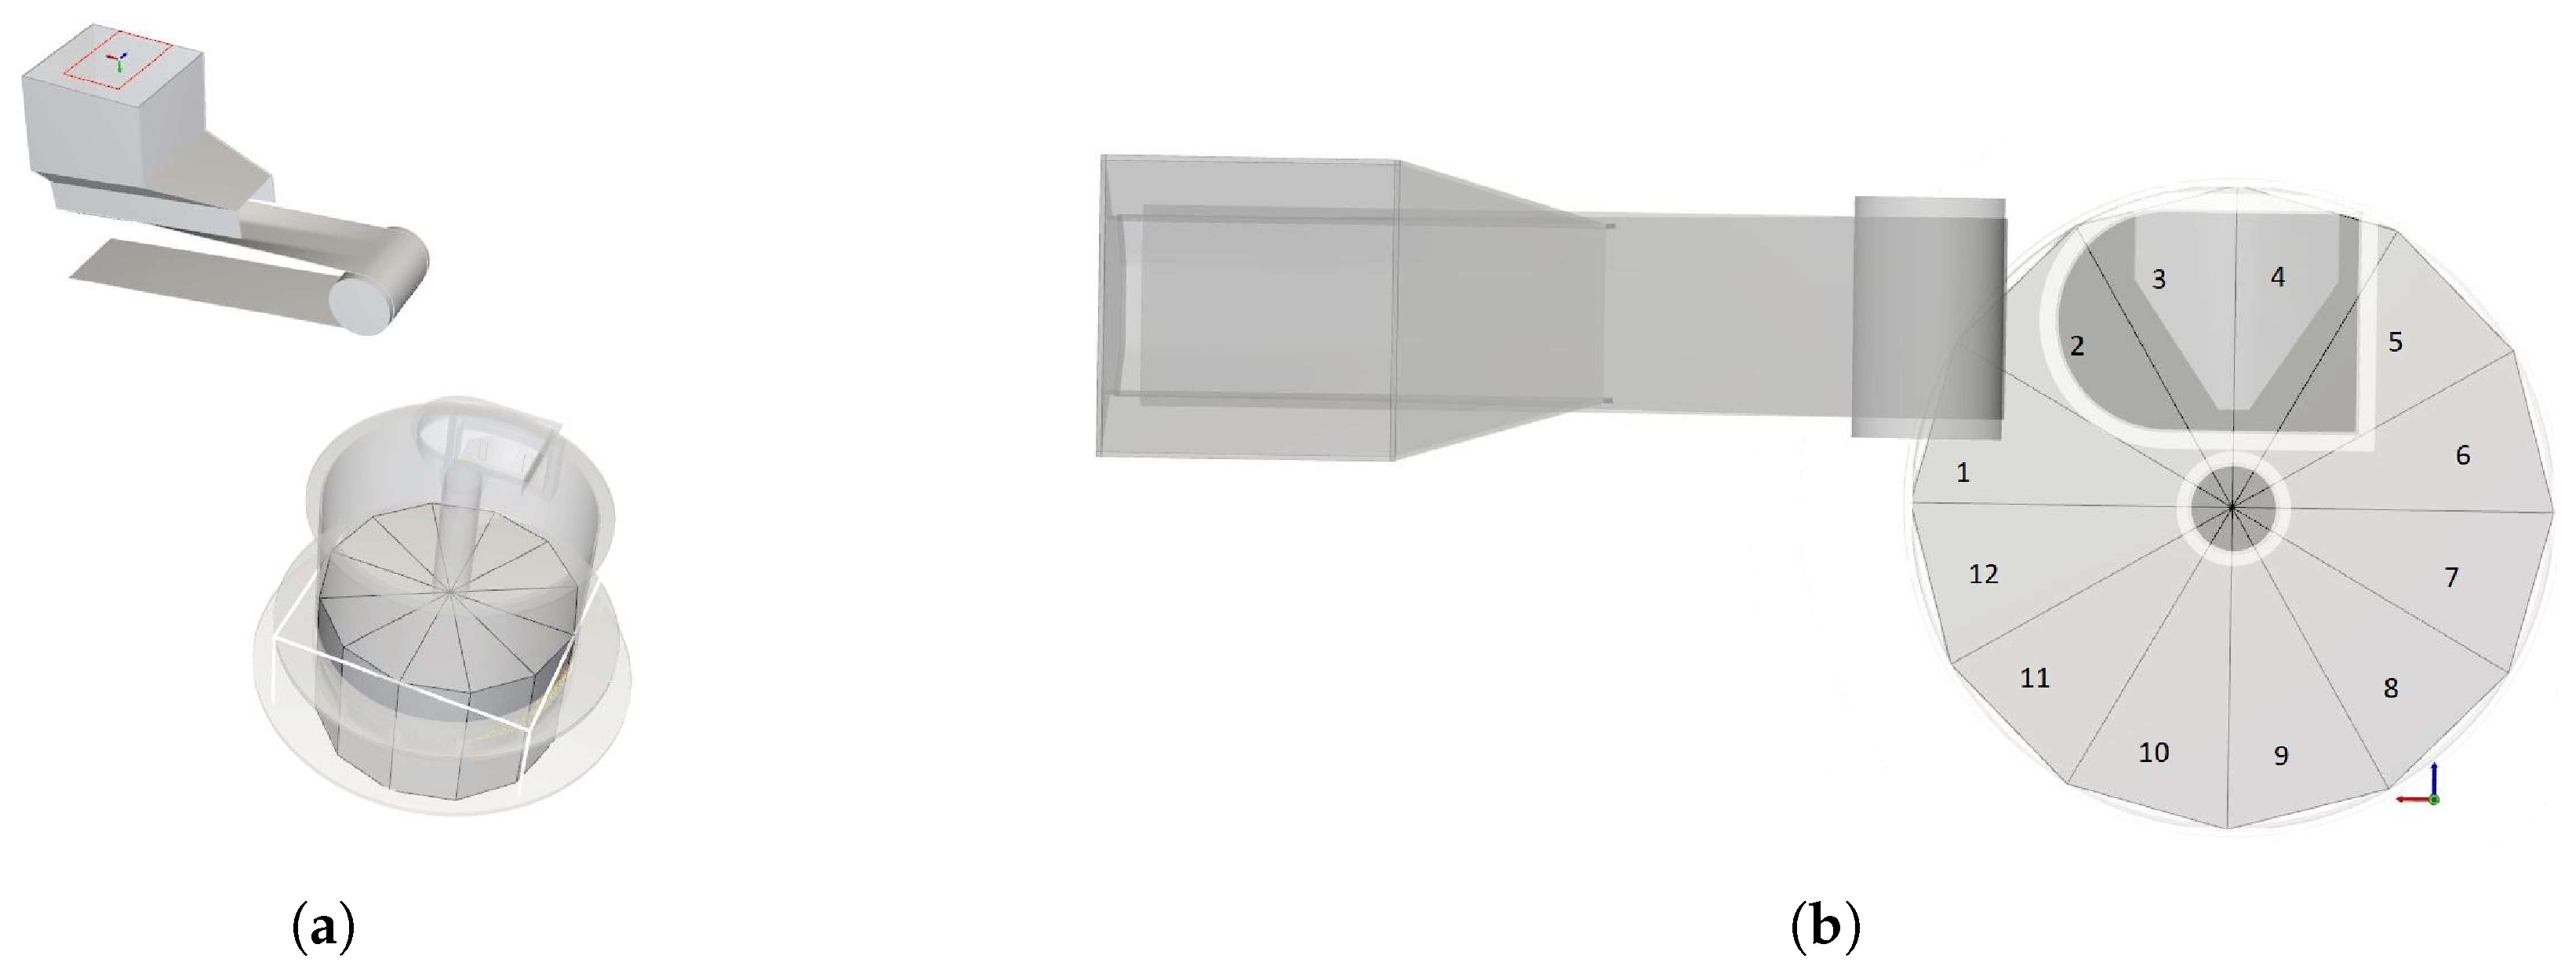
At the facility (Acciaieria Arvedi Trieste, founded as Ferriera di Servola, BF#3) for which the performance of the charging equipment is investigated, the system—following an old design—consists of a single bell which closes the bottom of the hopper during the hopper filling phase and, once the necessary amount of material is reached, moves downward, allowing the burden to slip inside the BF. For a system of this type, it is essential that the burden inside the hopper is distributed with as much radial symmetry as possible, so that when the bell moves downward, the material is distributed evenly inside the BF. Originally, to increase control over the burden distribution, the hopper was rotating; however, due to gas leakage issues, it was replaced with a fixed one, which inserts a two-skewed deflector under the conveyor belt in an attempt to obtain a suitable distribution of material inside the hopper.
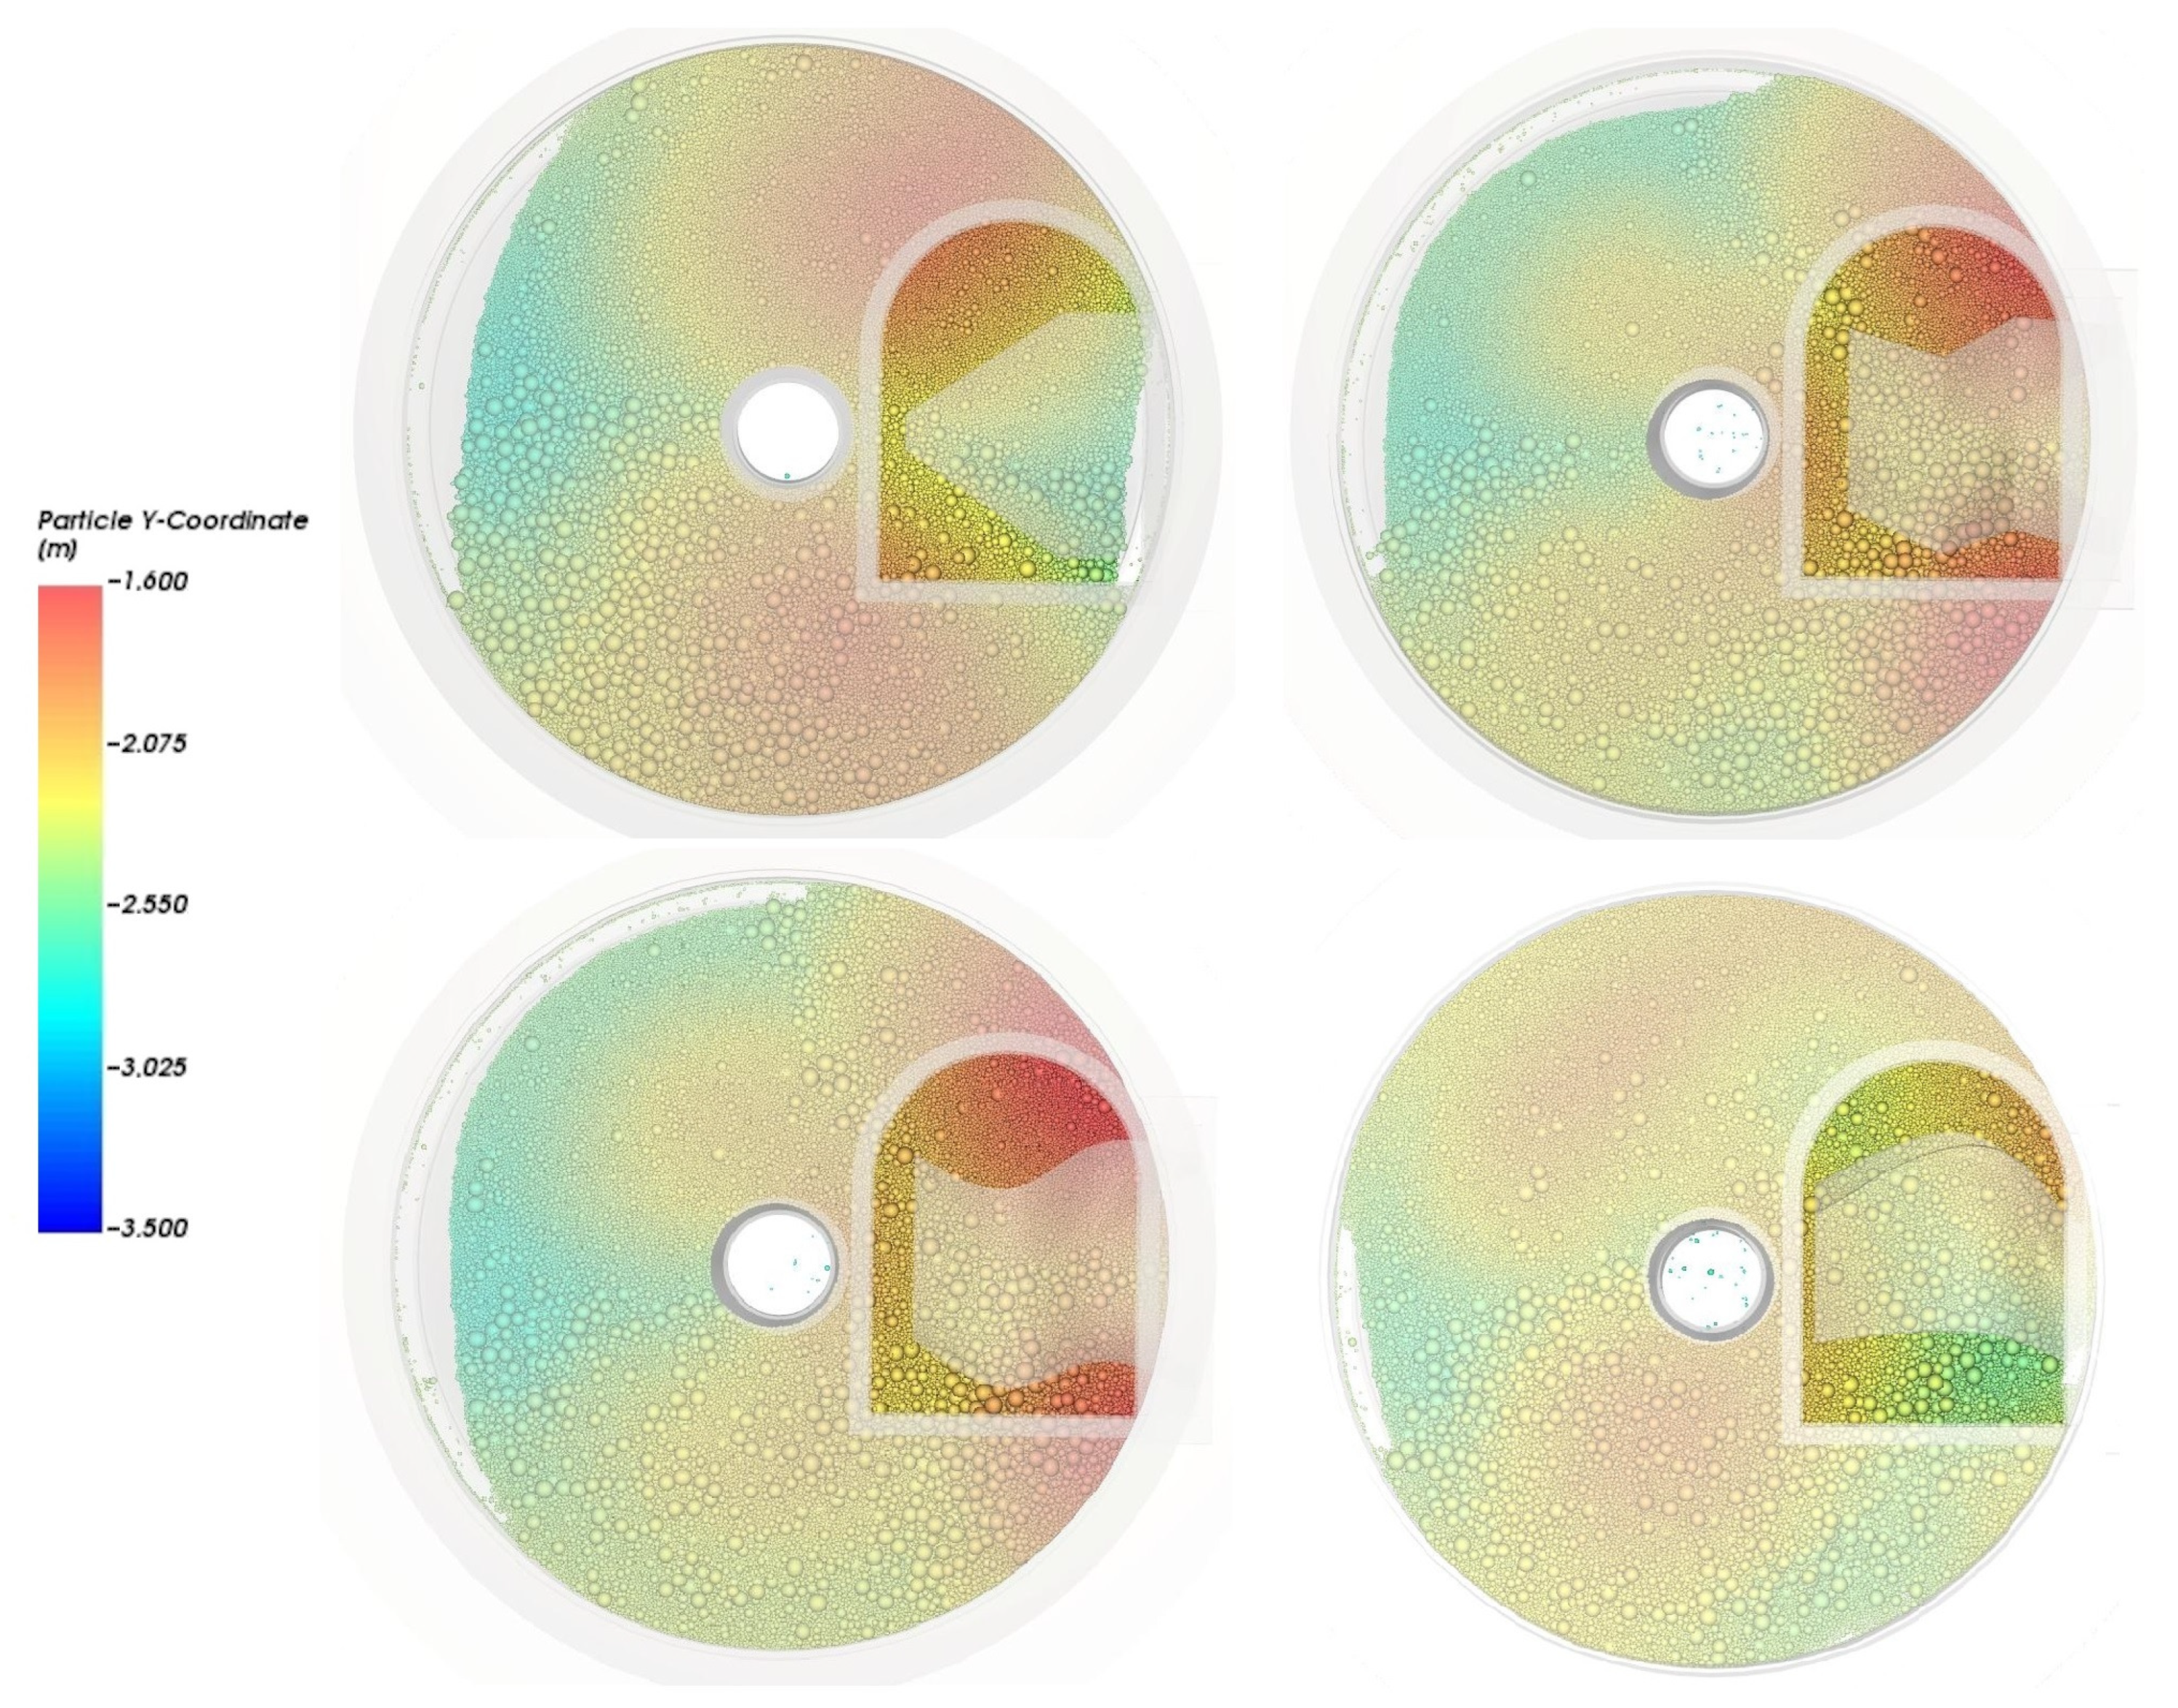
The functioning of this system was examined by Degrassi et al. [28]. The DEM simulations of the hopper charging highlighted the inability of the deflector to distribute the materials with radial symmetry to ensure that the BF runs properly. In particular, the simulations confirmed the formation of two piles inside the hopper and highlighted that the large and small particles are clearly separated during the charging phase, so that one pile consists mainly of small particles and the other of large particles. The particle segregation phenomenon is well known and present even when other charging systems are used [29,30,31]. However, in this specific case, the shape of the deflector emphasizes this behavior, hence the necessity to replace the device with a more effective one, optimizing the deflector shape.
The focus of this work is on the search for a deflector geometry capable of distributing the material as uniformly as possible in the hopper to ensure a more efficient functioning of the BF. This is achieved by coupling DEM simulations with a multi-strategy and self-adapting optimization algorithm. In the search for the optimum shape, overall dimensions are limited, as the new device will have to replace the current deflector without requiring any modification to the charging system.
The optimization of granular material conveying and charging systems is not new.
Some research reported in the literature is entirely based on experimental observations, such as [32,33,34,35]. These works focus on hopper discharge optimization. Statistical models (full factorial design) or mathematical models (response surface method, interpolating curves) are employed on experimental data to assess the relationships between input parameters (characteristic dimensions of hopper geometry, operational conditions, material properties) and output variables (feed rate, flow uniformity, discharge rate). A common goal in these studies is to optimize the efficiency and consistency of material discharge. This includes minimizing blockages, achieving uniform flow, and maximizing discharge rates. Although the material types vary (pellets, pulverized coal, general granular particles), all studies contribute to a better understanding of the behavior of the granular material within hopper systems.
In addition to the aforementioned works, optimizations of granular material conveying and charging systems based on numerical simulations are reported in the literature. Liu et al. [36] employ DEM simulations to analyze particle mixing within an overcoating drum used in high-temperature reactor (HTR) fuel fabrication. The study aimed to optimize the drum dimensions and operational parameters. By simulating the behavior of particles for several configurations, the researchers sought to achieve uniform mixing and improve the efficiency of the overcoating process, which is crucial for the quality of the HTR fuel. In Vaicis et al. [37], several geometrical configurations of the dust control hopper system are modeled and analyzed. The study focused on understanding and mitigating dust emissions during material handling. By employing the CFD and DEM software packages, the researchers aimed to optimize the hopper design for effective dust suppression. In [38], DEM modeling is employed to analyze and optimize material flow within a system of rotary coolers and an intake pipeline. Here, the objective is to analyze and optimize material flow throughout the entire system, not just a single component. By simulating several configurations, the researchers sought to enhance material transport and minimize blockages within the complex system. The study of Kang-Min et al. [39] explores the impact of deflector plates on controlling particle size segregation. The research utilized DEM simulations and experiments to analyze how deflector plates, strategically placed within a flow system, influence the distribution of particles with different sizes. The study focused on understanding how the position of the deflector plates affects the particle flow and segregation patterns. By systematically varying these parameters, the researchers aimed to identify optimal configurations that minimize segregation, which is partly what we will accomplish in our work, but addressed with a different approach. Moreover, in [39], the objective was to achieve a more uniform particle mixture, improving the consistency of the final product. In our work, the objective is to distribute the material with radial symmetry as uniformly as possible in the hopper. Nonetheless, the findings in [39] provide valuable insights for designing systems that require precise control over the particle size distribution.
In all the works cited so far, optimization essentially consists of the analysis of the simulated design of experiments. Very few examples can be found in the literature where an optimization algorithm is coupled directly with DEM simulations. Balevičius et al. [40] investigate the multi-objective optimization of viscoelastic frictional granular material discharge from a wedge-shaped hopper with a fixed outlet. Using DEM simulations, the study optimizes the discharge time and flow rate by varying the discharged mass and the characteristic dimensions of the hopper geometry. Though it is not explicitly stated in the article, it is likely that the optimization method itself is some form of evolutionary algorithm, such as a genetic algorithm, or other methods that can handle multiple objectives, resulting in a Pareto set. Finally, in [41,42], the optimization of the shape is reported in the context of granular material transport and charging systems, which also falls within the scope of this reasearch. In [41], the researchers used a numerical simulation combined with an optimization algorithm to find the bucket shape that resulted in the best possible material transport. Discontinuous deformation analysis, a member of the DEM family, was applied as the numerical method to simulate the behavior of granular materials. The gradual deformation optimization algorithm is used to maximize transport distance of the granular material and to minimize the remaining material within the bucket after discharge. The design variable is the shape of the bucket, described by Bezier curves. Both the velocity of the bucket and the properties of the grains are taken into account in the optimization process, too. Huang et al. [42] explored the shape optimization of conical hoppers to maximize the mass discharge rate. Through DEM simulations and optimization techniques, the study investigated how variations in the hopper geometry impact material flow. The study aimed to determine the optimal cone shape to achieve the highest discharge rate possible. The cubic spline function was employed to parameterize the hopper shape, and optimization was performed using a combined genetic algorithm and gradient descent method.
Given the evidently scarce bibliography on the argument, the shape optimization of the specific charging equipment for BFs proposed here is an original contribution to this area of research. It is worth noting that the problem under investigation presents significant challenges, having achieved the objective with a device whose strengths are low cost and simplicity of operation and maintenance. These features are particularly important, because the operating conditions of the deflector are very severe due to the extremely aggressive gases present at the BF mouth and the action of the abrasive coal dusts impacting on the surface of the element. For this reason, despite being made of cast iron, it is subject to relatively rapid deterioration. However, this is not a major issue, as its installation is such as to ensure that it can be replaced promptly during the periodic monthly furnace shutdowns.
A possible objection to the solution presented here is its uncompetitiveness with the efficiency gain that could be achieved by replacing the charging system with a modern one, but the investment for this option, compared to replacing only the deflector, is not comparable either. The proposed solution is many orders of magnitude cheaper. No cost-benefit analysis is provided here to support this assertion and this is a limitation of the current study requiring further investigation.
The deflectors, resulting from the optimization process, have shown interesting behaviors in the numerical simulations. It was not possible to test them directly in the facility, which was in operation at the time this research activity began, but was recently dismantled. Therefore, in order to qualitatively validate the numerical simulations, experimental tests were carried out on a laboratory-scale model.
The paper is organized as follows: in Section 2, a description of the charging system is given; in Section 3, the optimization strategy of deflector shape is presented; and in Section 4, the results are shown. Section 5 discusses a comparison of the optimal devices. Section 6 focuses on experimental validation, and finally, conclusions are given in Section 7.
2. Description of the Charging System
The charging system, at the top of the BF under consideration, consists of the conveyor belt, the hopper, the deflector and the bell, which can move, vertically actuating the rod. Figure 1 shows a sketch of conveyor belt-hopper-bell system for the original rotating scheme. The deflector is installed on a hatch of the hopper, as shown in Figure 2, so that it can be easily removed. The conveyor belt has a tilt angle of and it runs at speed 1.79 m/s. It transports the carbon coke to the top inlet of the hopper, where it is released into the hopper, abandoning the belt. Falling, the coke particles impact on the deflector and they are distributed on the bottom of the hopper, consisting of the bell. A part of the particles impact on the deflector and then on the bell, the rod and the walls. When the required amount of coke is loaded, the bell descends downwards, allowing the burden to slide into the BF, forming a layer of material. At this point, the bell moves up, until it closes the bottom of the hopper, and the whole operation is repeated similarly for the iron ores charge. The process continues in this way, alternating carbon coke and iron ores charges.
Figure 1.
Sketch of conveyor belt-hopper-bell system for the original rotating scheme.
Figure 2.
Photograph of the currently installed fixed hopper, where the two-skewed deflector is highlighted in red. It can be seen an external hatch on the hopper. For maintenance purposes, the deflector, attached to the hatch, can be easily removed.
In Degrassi et al. [28], a DEM solver (Rocky DEM) is used to simulate the hopper charging of coke coal and the hopper charging of iron ores with this system. All the assumptions made to simplify the process to be simulated—mainly in order to reduce the computational time—and the parameter calibration details can be found in the cited work. The particle distributions obtained by the simulated charges have clearly no radial symmetry. The materials are distributed unevenly in both quantity and particle size. The deflector and the rod obstruct the passage of particles, creating vacuum zones where the material has difficulty in settling. Moreover, the deflector shape emphasizes the segregation caused by the conveyor belt, effectively separating large and small particles into two different piles, hence the need to optimize this device.
3. Deflector Device Optimization
The requirements that the optimized device for particles deflection must satisfy are as follows:
- It must be easily removable, possibly by attaching it to the hatch where the current one is installed;
- It must equalize the distribution of material along the circumference, avoiding the formation of pronounced voids or piles as much as possible;
- The distributions of coke coal and iron ores must be as similar as possible in order to create uniform layers inside the furnace.
A further requirement would be the resistance to the abrasive action of the involved materials, both for the collisions and chemical composition, but this has not been investigated at this stage.
modeFRONTIER is the platform used for the design optimization.
Three different devices were designed and optimized, using different parameterization of the geometry, by learning from the results of previous optimizations.
Table 1 reports the statistics used to evaluate the performance of the designs and the definitions of these statistics can be found in Appendix A. These quantities refer to 12 radial sectors into which the hopper was virtually split, as shown in Figure 3. It was verified that the results of the optimization processes were not affected by the chosen number of sectors.
Table 1.
List of the quantities used to evaluate the performance of the designs.
Figure 3.
The radial sectors into which the hopper is ideally divided: (a) axonometric view; (b) top view with the numbering of the radial sectors into which the hopper is virtually split.
3.1. Workflow
Figure 4 shows the optimization workflow, where the relevant nodes are highlighted by task: set A consists of the input variables, set B the operative nodes, set C the output variables, set D the objectives, and set E the constraints. A detailed description is given below. All not highlighted nodes in Figure 4 are auxiliary variables, which are not worth describing.
Figure 4.
Optimization workflow: set A collects the input variables, set B the operative nodes, set C the outputs, set D the objectives, and set E the constraints.
3.1.1. Input Variables
The input variables (set A in Figure 4) are those which define the device geometry in the optimization loop. The deflector geometry is generated with a loft function defined between planar parallel shapes, as shown in Figure 5.
Figure 5.
Sketch of the parametrization: the generation of the solid, extruding the planar parallel shapes.
The planar shapes are defined on four vertical sections for the first and second designed devices and on three sections for the third designed device. The distance of each section from the center of the hopper is a geometric variable.
The shape of each section is uniquely described by the coordinates of the control points. For the first device with planar surfaces, the control points are the vertices of a polygon inscribed into a rectangle with dimensions 1200 mm × 600 mm (see Figure A1). These dimensions correspond to those of the hatch through which the deflector is to be inserted into the interior of the hopper. The second and third devices have a curved top surface. The shape of each section is built by two splines in the upper part, as shown in Figure A2 and Figure A3.
By varying the coordinates of the control points and the position of the sections, the geometry is varied.
In the optimization, some of the geometric variables were assumed to be constant, based on preliminary sensitivity analysis and the results of previous optimizations. Some of the input parameters have to satisfy geometrical constraints. The specifics of the geometry parameters will be given in Appendix B for each of the three performed optimizations.
3.1.2. Operative Nodes
Set B in Figure 4 consists of the operative nodes. With reference to this scheme, the process runs from left to right, starting with optimization algorithm pilOpt which generates the designs, Onshape for the creation of geometry, Rocky DEM for the simulation of coke and iron ores charges, and finally, the calculation of outputs from the results of simulations.
The optimization pilOPT algorithm is a proprietary algorithm implemented directly in the modeFRONTIER platform [43], designed to be multi-strategy and self-adapting and smartly combining local and global search functions. It balances real and response surface method (RSM)-based optimization. In this way, it reduces the number of real experiments necessary to reach the optimum.
Onshape [44] is a free online 3D CAD (computer-aided design) software. Given the input variables values generated by pilOpt, it produces the .stl file containing the geometry of the hopper and the deflector.
Rocky DEM is a CAE (computer-aided engineering) software based on the discrete element method [45,46,47], which is used to simulate the charges. Details about the simulation algorithm, together with the equations for calculating particle translation, rotation and forces can be found in [48]. The nodes which feed the run of DEM simulations are provided with a script with the following definitions:
- The material parameters;
- The position and dimensional parameters of hopper and conveyor belt;
- The flow rate and the simulated time length;
- The algorithm to compute the weight and particle number values within each virtual sector.
In the simulations, some assumptions are made about the particle geometries assumed spherical, size distributions (both coarse-graining and cut off were used) and micro properties of the materials. Some values for these material parameters were obtained from the literature, while others were calibrated (see Degrassi et al. [28] for details).
The weight and particle number values obtained for coke and iron ores within each virtual sector are processed in the calculator node so as to compute the outputs, which are listed in Table 1.
3.1.3. Output Variables
The outputs of the DEM simulations, both for coke and iron ores, are the mass of material and the number of particles present within the radial sectors, into which the cylindrical control volume containing the hopper was ideally divided. The obtained values are then normalized by converting them into percentage values. From the normalized values, the quantities listed in Table 1 are computed (set C in Figure 4).
For the device optimizations, in order to reduce the computational time of each design, only the first 10 s of charging were simulated (corresponding to about 30 min of computational time for each charging simulation). It was observed that even with the partial charge of the material, the obtained distribution is significant for understanding the deflector efficiency. Only on the final optimal geometries, the outputs were recomputed by simulating the full charge of the materials.
3.1.4. Objectives
The are two objectives of the optimization (set D in Figure 4):
- minimizing ;
- minimizing .
Informally, variance measures how far a set of numbers are spread out from their average value. Thus, the minimization of and means a reduction in the fluctuations in the coke percentage weight and the difference between the iron and coke percentage weight, respectively, among the sectors into which the hopper was ideally divided. Due to the chosen multi-objective formulation, it is possible to enclose the requests for homogeneity of the distribution in the hopper and the similarity of the distribution of the two charges, independently of the burden material. In fact, if were low but were high, the situation would be that of a uniform coke charge, but the same could not be said of iron ores. With minimum values for both, it is possible to obtain the ideal situation of uniformity of charges with similar distributions varying the material.
3.1.5. Constraints
Set E in Figure 4 consists of constraint nodes. The constraints of optimization take into account the two-skewed deflector performance. Henceforth, this will be referred to as the current deflector. In Table 2 the values obtained by simulating the first 10 s of coke and iron ores charges with the current device are reported. The constraints impose that the values of the new geometries are better than the current one. In particular, the constraints on and should ensure less segregation between particles by size.
Table 2.
Outputs of simulations of the first 10 s of coke and iron ores charges with current device.
In order to avoid excessive material deposits on the deflector, two additional constraints were imposed. Both the weight of the coke and the weight of the iron ores within the control volume must not be 50 kg less than expected, i.e., the weight of all the material that has passed through the hopper inlet.
Finally, in order to limit the presence of peaks of minimum and maximum values of weight in the distribution, the minimum and maximum percentage values by weight for coke are constrained to be within the range, i.e., in the confidence interval twice the variance.
3.2. DEM Solver Calibration
An essential component in achieving significant outcomes from optimization is the precise modeling of the intricate granular flow within the blast furnace hopper. Prior to conducting optimization, it is essential to calibrate the DEM solver. DEM simulations rely on various parameters that define the behavior of granular materials, including the following:
- The particle–particle static friction coefficient, which determines the resistance to sliding between particles;
- The particle–wall static friction coefficient, which defines the friction between particles and the hopper walls;
- The particle–particle restitution coefficient, which represent the amount of energy retained after collisions between particles;
- The rolling resistance coefficient, which quantifies the magnitude of the moment that opposes the rolling motion of particles.
These parameters can significantly influence the simulation results, and inaccurate values can lead to marked discrepancies between the simulated and real-world behavior. In this sutdy, an optimization algorithm was employed for the calibration of such parameters. This algorithm systematically adjusted the parameters until the simulation results closely matched experimental data for the angle of repose test. This activity is documented in [28], and the values of the calibrated DEM parameters are summarized in Table 3. For further details, please refer to the cited article.
Table 3.
Calibrated DEM parameters.
In [28], after the calibration process, the authors validated the simulation by comparing the results with independent experimental data. The values of parameters, given by the calibration process, were used for the charge simulation of coke and iron in the hopper with the original deflector. The distributions of the materials were obtained and subsequently compared with empirical photographic data of the distribution. This comparison served as an indicator of the accuracy of the simulation. This step was necessary to ensure that the calibrated model accurately predicts the material behavior under different conditions.
4. Results
4.1. First Optimization
In the first optimization, an optimal device with planar surfaces was searched. Figure 6a shows the scatter chart of the objectives values of the designs really computed in the optimization process. The term real design means it has been simulated and not virtually predicted using RSM. The simulated designs are 349, of which 73 are feasible, that is they meet the constraints. Figure 6b shows only the feasible designs, with Pareto designs (the set of best designs) highlighted in black.

Figure 6.
First optimization: (a) real designs on objectives scatter chart; (b) feasible designs on objectives scatter chart with black highlighted Pareto designs, where the color from blue to red indicates the increase in the objective value.
The objective values of Pareto designs are given in Table 4.
Table 4.
First optimization: objective values for Pareto designs.
For the designs on the Pareto front, the complete coke and iron ores charges were simulated. Design 319 showed the best performance. In Table A1 the geometric parameters of the deflector design 319 are given. The distributions of coke and iron ores particles obtained by the complete simulations are shown in Figure 7.
Figure 7.
First optimization: view of the particle distributions obtained by the simulation of coke charge (left) and iron charge (right) with the design 319 as deflector. The color of the particle represents its height.
Device design 319 improved the homogeneity of both the distribution, reducing the segregation effect. The forming of two higher peaks is still evident, but now they reach equal heights. In particular, the peaks moved toward the area below the deflector. Below the deflector, they merge, eliminating the previously existing depression zone. The formation of two lower peaks can be glimpsed in the area furthest from the deflector, but with different heights. It is evident the difficulty of filling the area beyond the rod with material. The similarity of the coke and iron ores distribution was clearly improved thanks to the optimization.
A sensitivity analysis was performed using the smoothing spline ANOVA (SS-ANOVA) in order to understand the influence of the geometric parameters of the deflector on the final particle distributions. The main effect bar charts made it possible to compare the relative importance of the parameters on the objectives and constraints. In Figure 8, only the effect bars for the objectives are reported so as not to overburden the paper. The first ten factors are shown in order of importance.
Figure 8.
First optimization: effect bar of objective responses (a) and (b) .
The results of the sensitivity analysis show that the ordinates of the control points 1, 2 and 4 in section 3 and the ordinate of the control point 1 in section 4 mainly influence burden distribution. Sections 3 and 4 are those closer to the central rod.
Care must be taken with the parameters S2y2, S2x3 and S2x4 on the section 2 to avoid excessive material deposits on the deflector.
4.2. Second Optimization
Given the results of the first optimization, a different device concept with curved top surface was considered for the second optimization. Figure 9a shows the objectives scatter chart. The simulated designs are 200, of which 176 are feasible, that is they meet the constraints. Figure 9b shows only the feasible designs, with Pareto designs highlighted in black.
Figure 9.
Second optimization: (a) real designs on objectives scatter chart; (b) feasible designs on objectives scatter chart with black highlighted Pareto designs, where the color from blue to red indicates the increase in the objective value.
The objective values for Pareto designs are given in Table 5.
Table 5.
Second optimization: objective values for Pareto designs.
For the designs on the Pareto front, the complete coke and iron ores charges were simulated, except for design 160, because is evidently too high (11.28%). Design 196 proved to be the highest-performing, because it has the lowest and acceptable . In Table A3, the geometric parameters of the deflector design 196 are given. The distribution of coke and iron ores particles obtained by the complete simulations are shown in Figure 10.
Figure 10.
Second optimization: view of the particle distributions obtained by the simulation of coke charge (left) and iron charge (right) with design 196 as the deflector. The color of the particle represents its height.
Device design 196 made it possible to obtain distributions similar to those with the deflector resulting from the previous optimization, but with an evident symmetry of the distributions with respect to a vertical plane. Nevertheless, a third optimization, with a different parametrization of the geometry, was performed to improve the effectiveness of the solution. In this case too, a sensitivity analysis was performed using the SS-ANOVA. Figure 11 shows the effect bars on the objectives of the first ten factors in order of importance.
Figure 11.
Second optimization: effect bar of objective responses (a) and (b) .
The results of the sensitivity analysis show that the abscissa of the control points 5 in section 1, the position of the control point 6 and the ordinate of control point 5 in section 4, and the position of sections 2 and 3 mainly influence burden distribution.
Care must be taken with the parameter S2x5 to avoid excessive material deposits on the deflector.
4.3. Third Optimization
The optimization algorithm pilOpt has explored the design space of solutions with 500 simulated designs, of which 185 are feasible—that is, they meet the constraints. Figure 12a shows the objectives scatter chart of the third optimization. Figure 12b shows only the feasible designs, with Pareto designs highlighted in black.
Figure 12.
Third optimization: (a) real designs on objectives scatter chart; (b) feasible designs on objectives scatter chart with black highlighted Pareto designs, where the color from blue to red indicates the increase in the objective value.
The objective values for Pareto designs are given in Table 6.
Table 6.
Third optimization: objective values for Pareto designs.
For the designs on the Pareto front, the complete coke and iron ores charges were simulated. Design 365 proved to be the highest-performing, demonstrating much better behavior than both the current situation and the designs of previous optimizations. In Table A4 the geometric parameters of the deflector design 365 are given. The distribution of coke and iron ore particles obtained by the complete simulations are shown in Figure 13.
Figure 13.
Third optimization: view of the particle distributions obtained by the simulation of coke charge (left) and iron charge (right) with the design 365 as deflector. The color of the particle represents its height.
To better understand the influence of variables on the behavior of the deflector, the results of the sensitivity analysis, performed on the entire optimization design of experiments (DOE), are shown in Figure 14.

Figure 14.
Third optimization: effect bar of objective responses (a) and (b) .
The results of the sensitivity analysis have shown that the abscissa of the control point 0 and the ordinate of control point 6 in section 2, the ordinates of the control point 0 and 6 in section 3, and the position of section 3 mainly influence burden distribution.
Care must be taken with the parameters S3x6, S4x6 and zS3 to avoid excessive material deposits on the deflector.
5. Comparison of the Current Deflector and the Optimal Devices
Four devices are compared: the current deflector, and the best designs obtained from the three optimizations. Figure 15 shows the different geometries of the devices.
Figure 15.
Shapes of the current deflector and the optimized geometries: (a) current design, (b) first design, (c) second design, (d) and third design.
Table 7 reports the results for the quantities used to evaluate the performance of the designs, as listed in Table 1. These values are obtained by the complete simulations of the charges.
Table 7.
Values of the quantities used to evaluate the performance of the best designs from the three optimizations, obtained by the complete simulations of the charges.
The relevant values are definitely and , for which the improvement is evident in all optimized designs compared to the current design. Observing the values of and , it can be deduced that the segregation effect was greatly reduced with the optimized designs.
Comparing the optimized designs, the third deflector is ultimately the best. It is able to make the radial distribution of the charges sufficiently uniform. The difference between the distribution of coke and iron ores is slightly worse than the first and the second deflector, but it remains much better than that of the current device.
These considerations are confirmed in Figure 16 and Figure 17, where the top view of the coke and iron ores distributions are shown for the four different deflectors.
Figure 16.
Top view of the particle distribution obtained by the simulation of coke charge with the current design, the first design, the second design, and the third design as the deflector. The color of the particle represents its height.
Figure 17.
Top view of the particle distribution obtained by the simulation of iron ores charge with the current design, the first design, the second design, and the third design as the deflector. The color of the particle represents its height.
From Table 7, there is also an improvement in the parameter, which corresponds to the amount of coke in the emptiest zone. This zone is situated at the shadow cone caused by the bell rod (sectors 9 and 10 in Figure 3b). The third design manages to fill this zone more, even if it evidently fails to allow the particles to move around the obstacle.
6. Experimental Validation
As already mentioned, it was not possible to test the optimized deflectors directly in the facility, which no longer exists. Moreover, the experimental observation of material distribution within the real hopper would have been practically impossible due to the harsh environmental conditions.
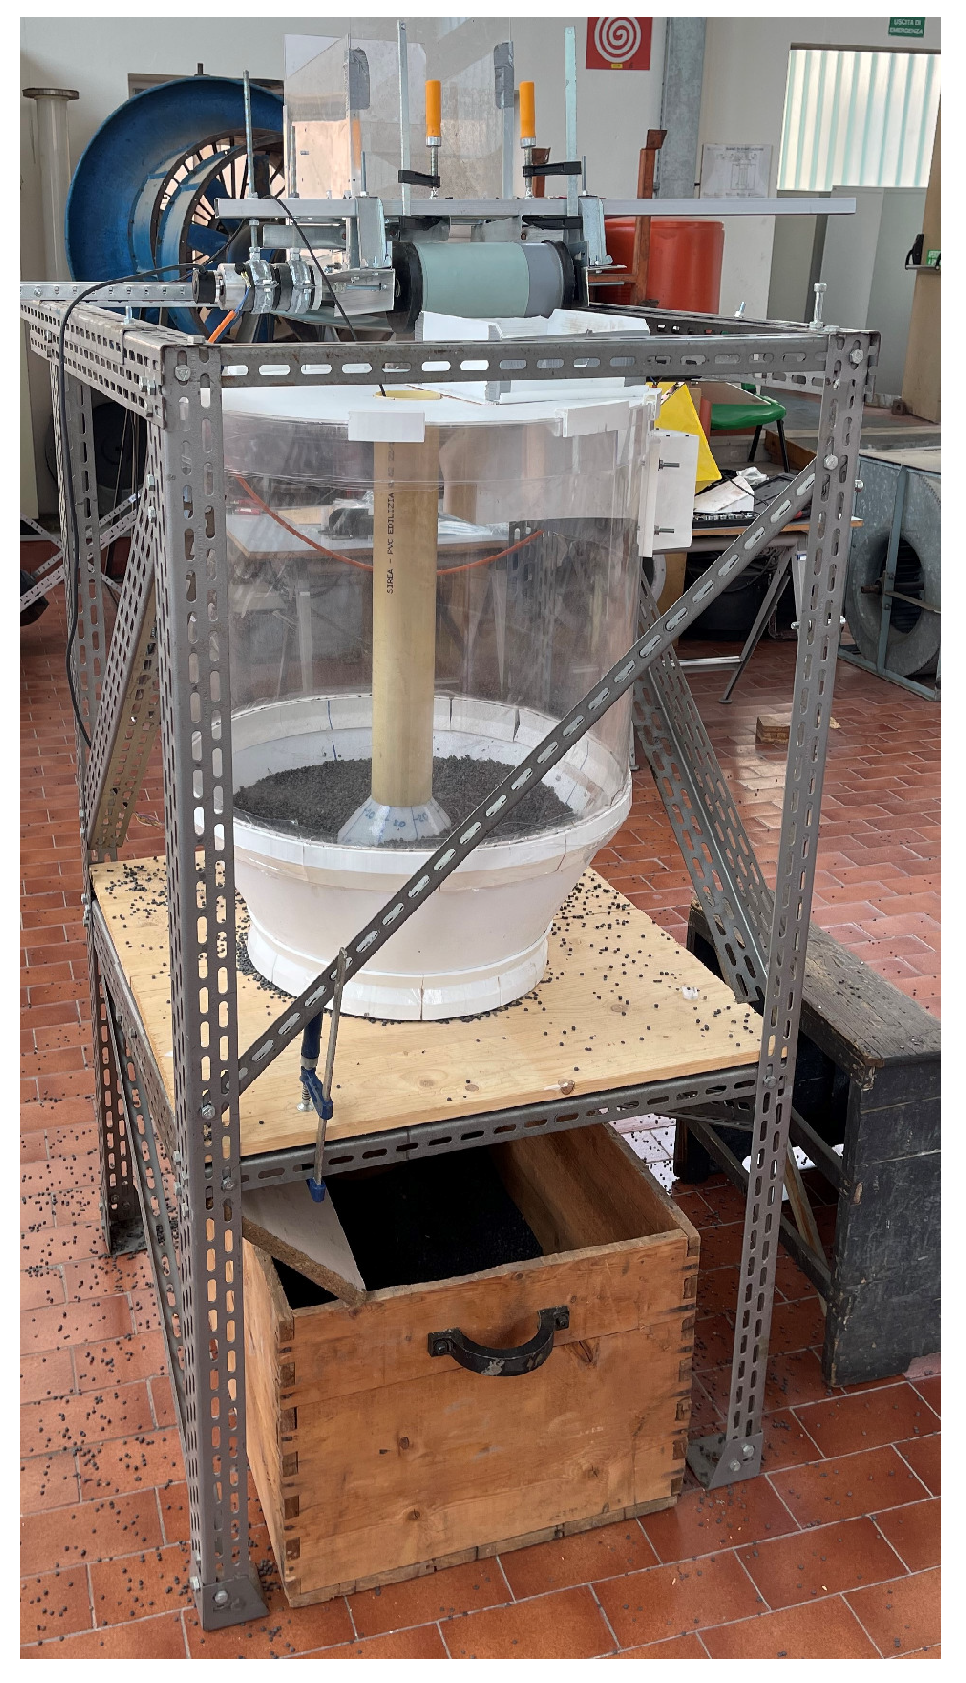
Therefore, in order to validate the numerical simulations, experimental tests were carried out on a laboratory-scale model. Only geometric similarity was ensured in the tested model, whereas kinematic and dynamic similarity could not be achieved. Thus, only a qualitative assessment of the validity of numerical simulations and optimization results could be performed. Because of the weak similarity of the laboratory model, it was not reasonable to make a quantitatively more accurate evaluation.
A 3:16 scale model was tested. This choice was forced by the 600 mm diameter of the plexiglass tube found on the market, where the real maximum internal diameter of the hopper was 3200 mm. The conical parts, i.e., the bottom and bell of the hopper, were made of PVC foil. The inner rod is a PVC tube. For the conveyor belt, a 200 mm width elastic band was used.
The tested deflectors, i.e., the current design and the second design, were printed by means of the 3D printer Ultimaker 3 Extended in PLA with extruder AA 0.4. This ensured that they had the same Young’s modulus of the material in the rebound of particles for a comparative test.
The burden material, used in the laboratory, was plastic pellets, usually used for ABS injection molding, with an almost cylindrical shape and measuring 5 mm in diameter and 2 mm in height on average. The repose angle of the material () is close to those of the materials charged in the real plant hopper. Obviously, the fact that the value for the plastic pellets is lower allows for a more homogeneous distribution within the scale model, and this must be taken into account in the final considerations.
Figure 18 shows the experimental apparatus.
Figure 18.
Laboratory-scale model of the system composed of the BF hopper, the conveyor belt, and the deflector used for experimental validation.
All tests were conducted using the same volume of material, repeating three experimental runs for each of the two deflectors. The volume height of the material, once charged in the scale model, was retrieved by identifying the top surface of the material. The surface was measured using the LiDAR scanner of an iPhone 12Pro in order to create 3D objects that can then be manipulated and superimposed for comparison.
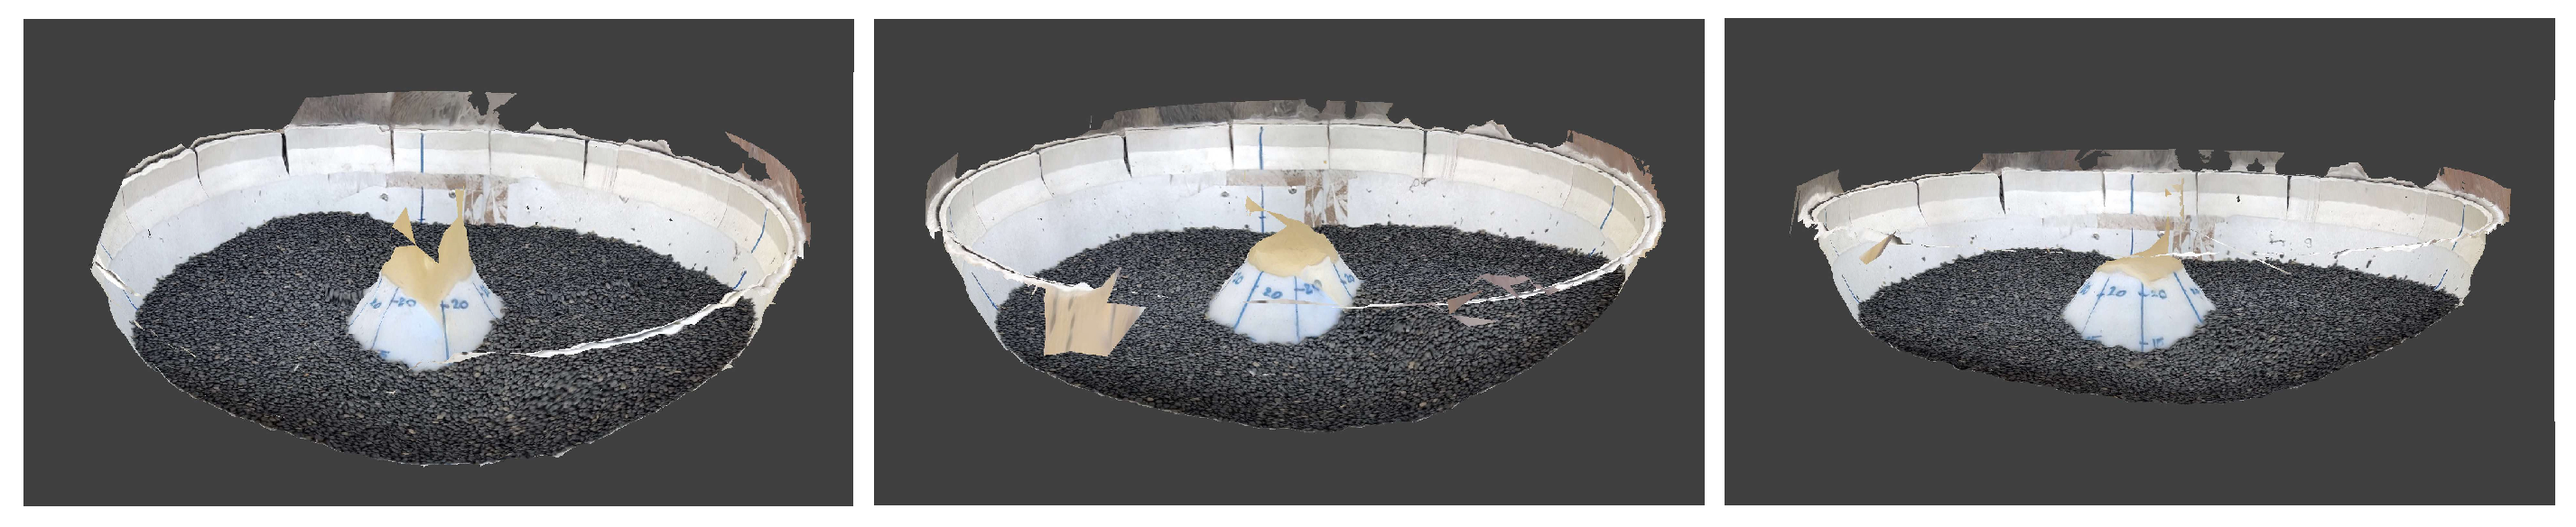
Figure 19 and Figure 20 show the surfaces obtained in the three different runs for the current deflector and the second deflector, respectively.
Figure 19.
Surfaces obtained in the three different runs for the current deflector.
Figure 20.
Surfaces obtained in the three different runs for the second deflector.
It can be noted that the material surface is quite repeatable in the various experiments and the much higher uniformity is obtained with the second deflector, as expected from numerical simulations. For the current deflector, the difference between the maximum and minimum heights in the distribution of the material is within 13 and 15 cm. For the second deflector, the difference between the maximum and minimum heights in the distribution of the material is within 5 and 6 cm.
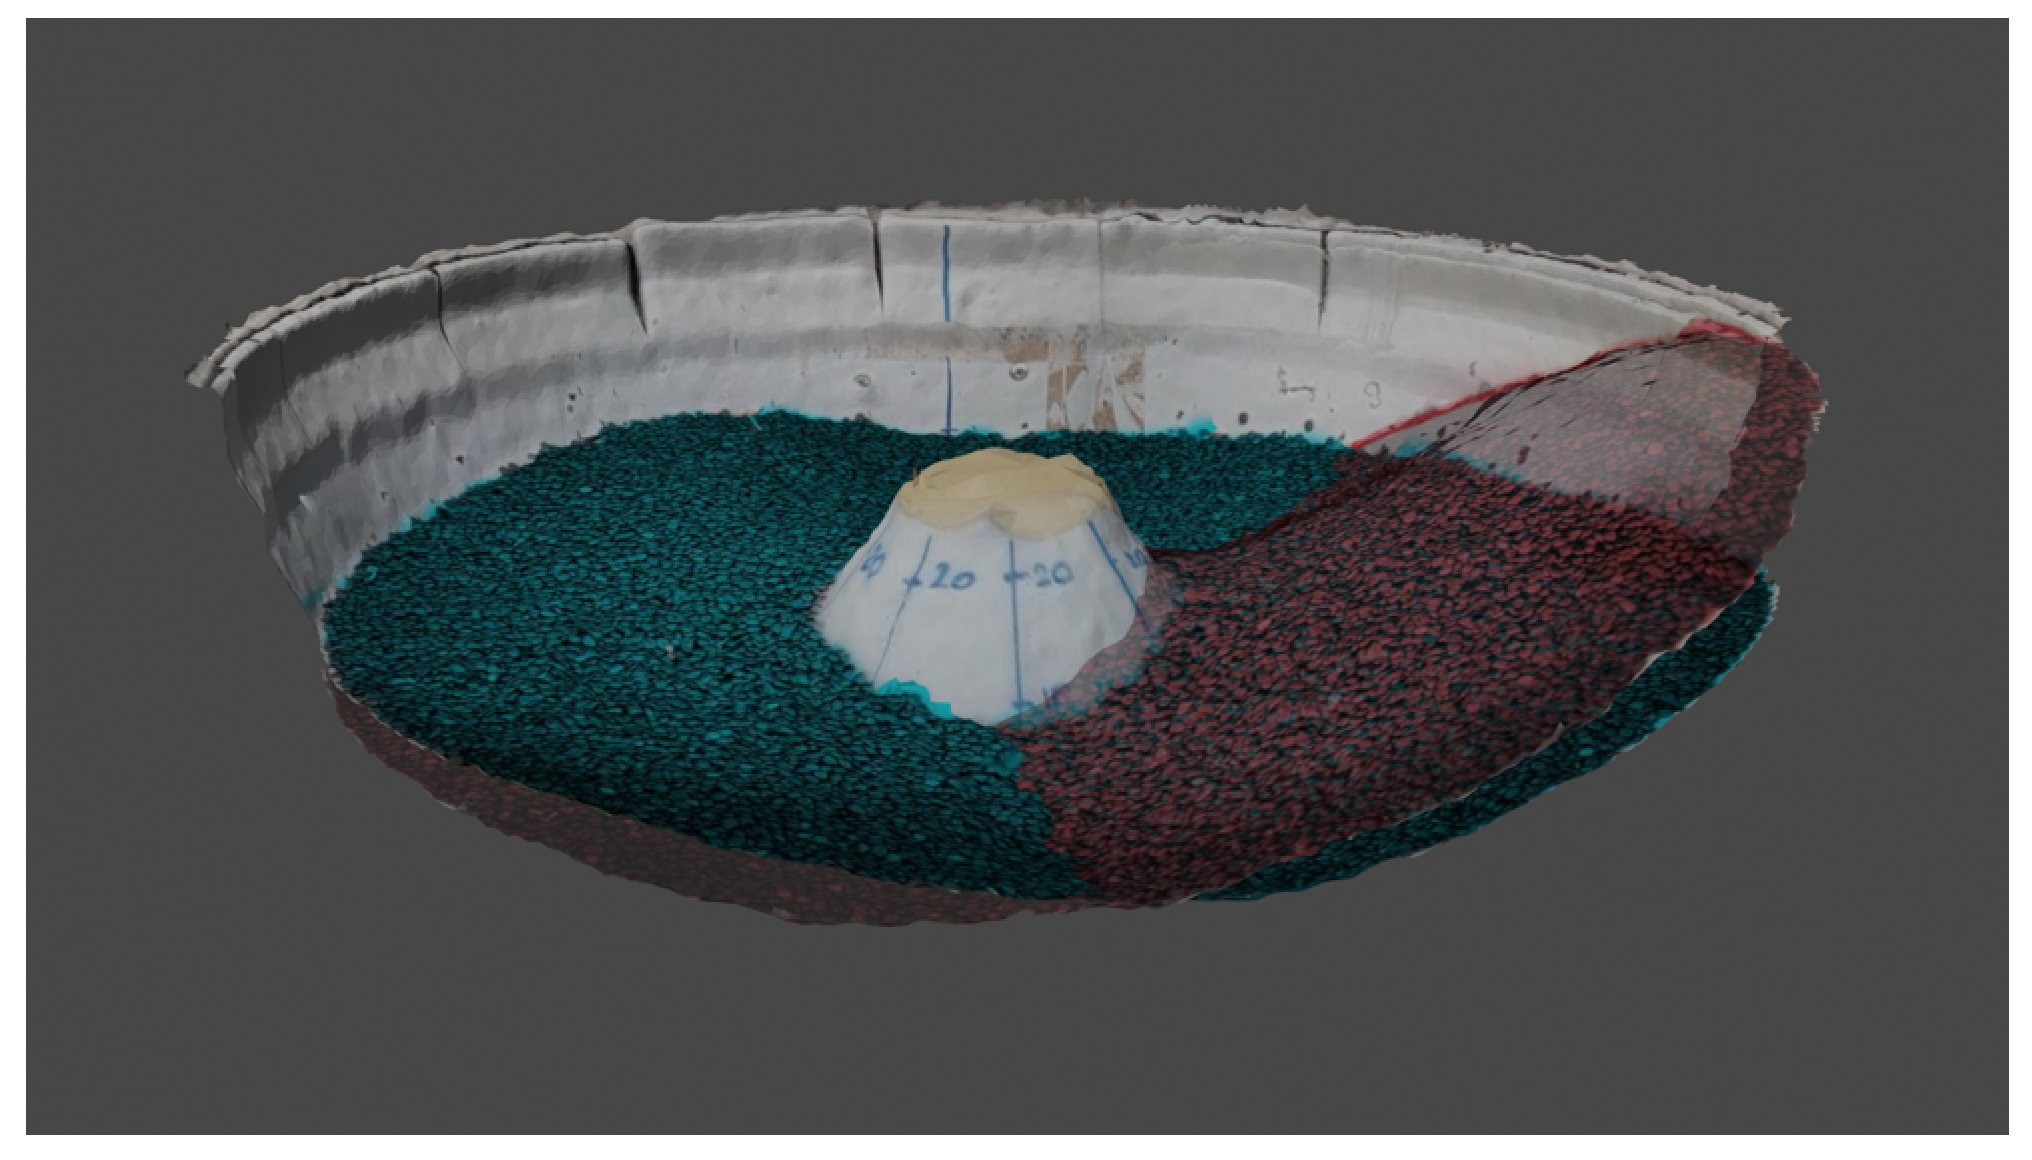
In Figure 21, one of the three surfaces obtained with the current deflector and the second deflector are superimposed, making one of the two surfaces partially transparent for readability of the figure.
Figure 21.
Surfaces obtained with the current deflector (red) and the second deflector (blue).
Although qualitative, the positive effect of the second deflector in making the material charge uniform is evident.
If the laboratory test results on the scale model were compared with the numerical results, the material distributions would obviously be different. The reason has already been mentioned: clearly, the numerical model and the laboratory-scale model are not in complete similarity. Therefore, it is not possible to perform a quantitative validation of numerical model using the experimental results. It is interesting to note that the laboratory-tested optimized geometry is nonetheless able to guarantee a better distribution of material within the hopper than the current one, even under different operating conditions and with different materials than those for which it was optimized.
7. Conclusions
The distribution of the material in the hopper, and thereby the correct deposition of the layers in the BF, is fundamental for good performance of the iron-making process.
For the examined facility, the charging system of the hopper is not able to guarantee the desirable material distribution, and the poor performance is due to the presence of a two-sided deflector, which only splits the material flow into two smaller flows, causing the creation of two piles and two voids at the bottom of the hopper.
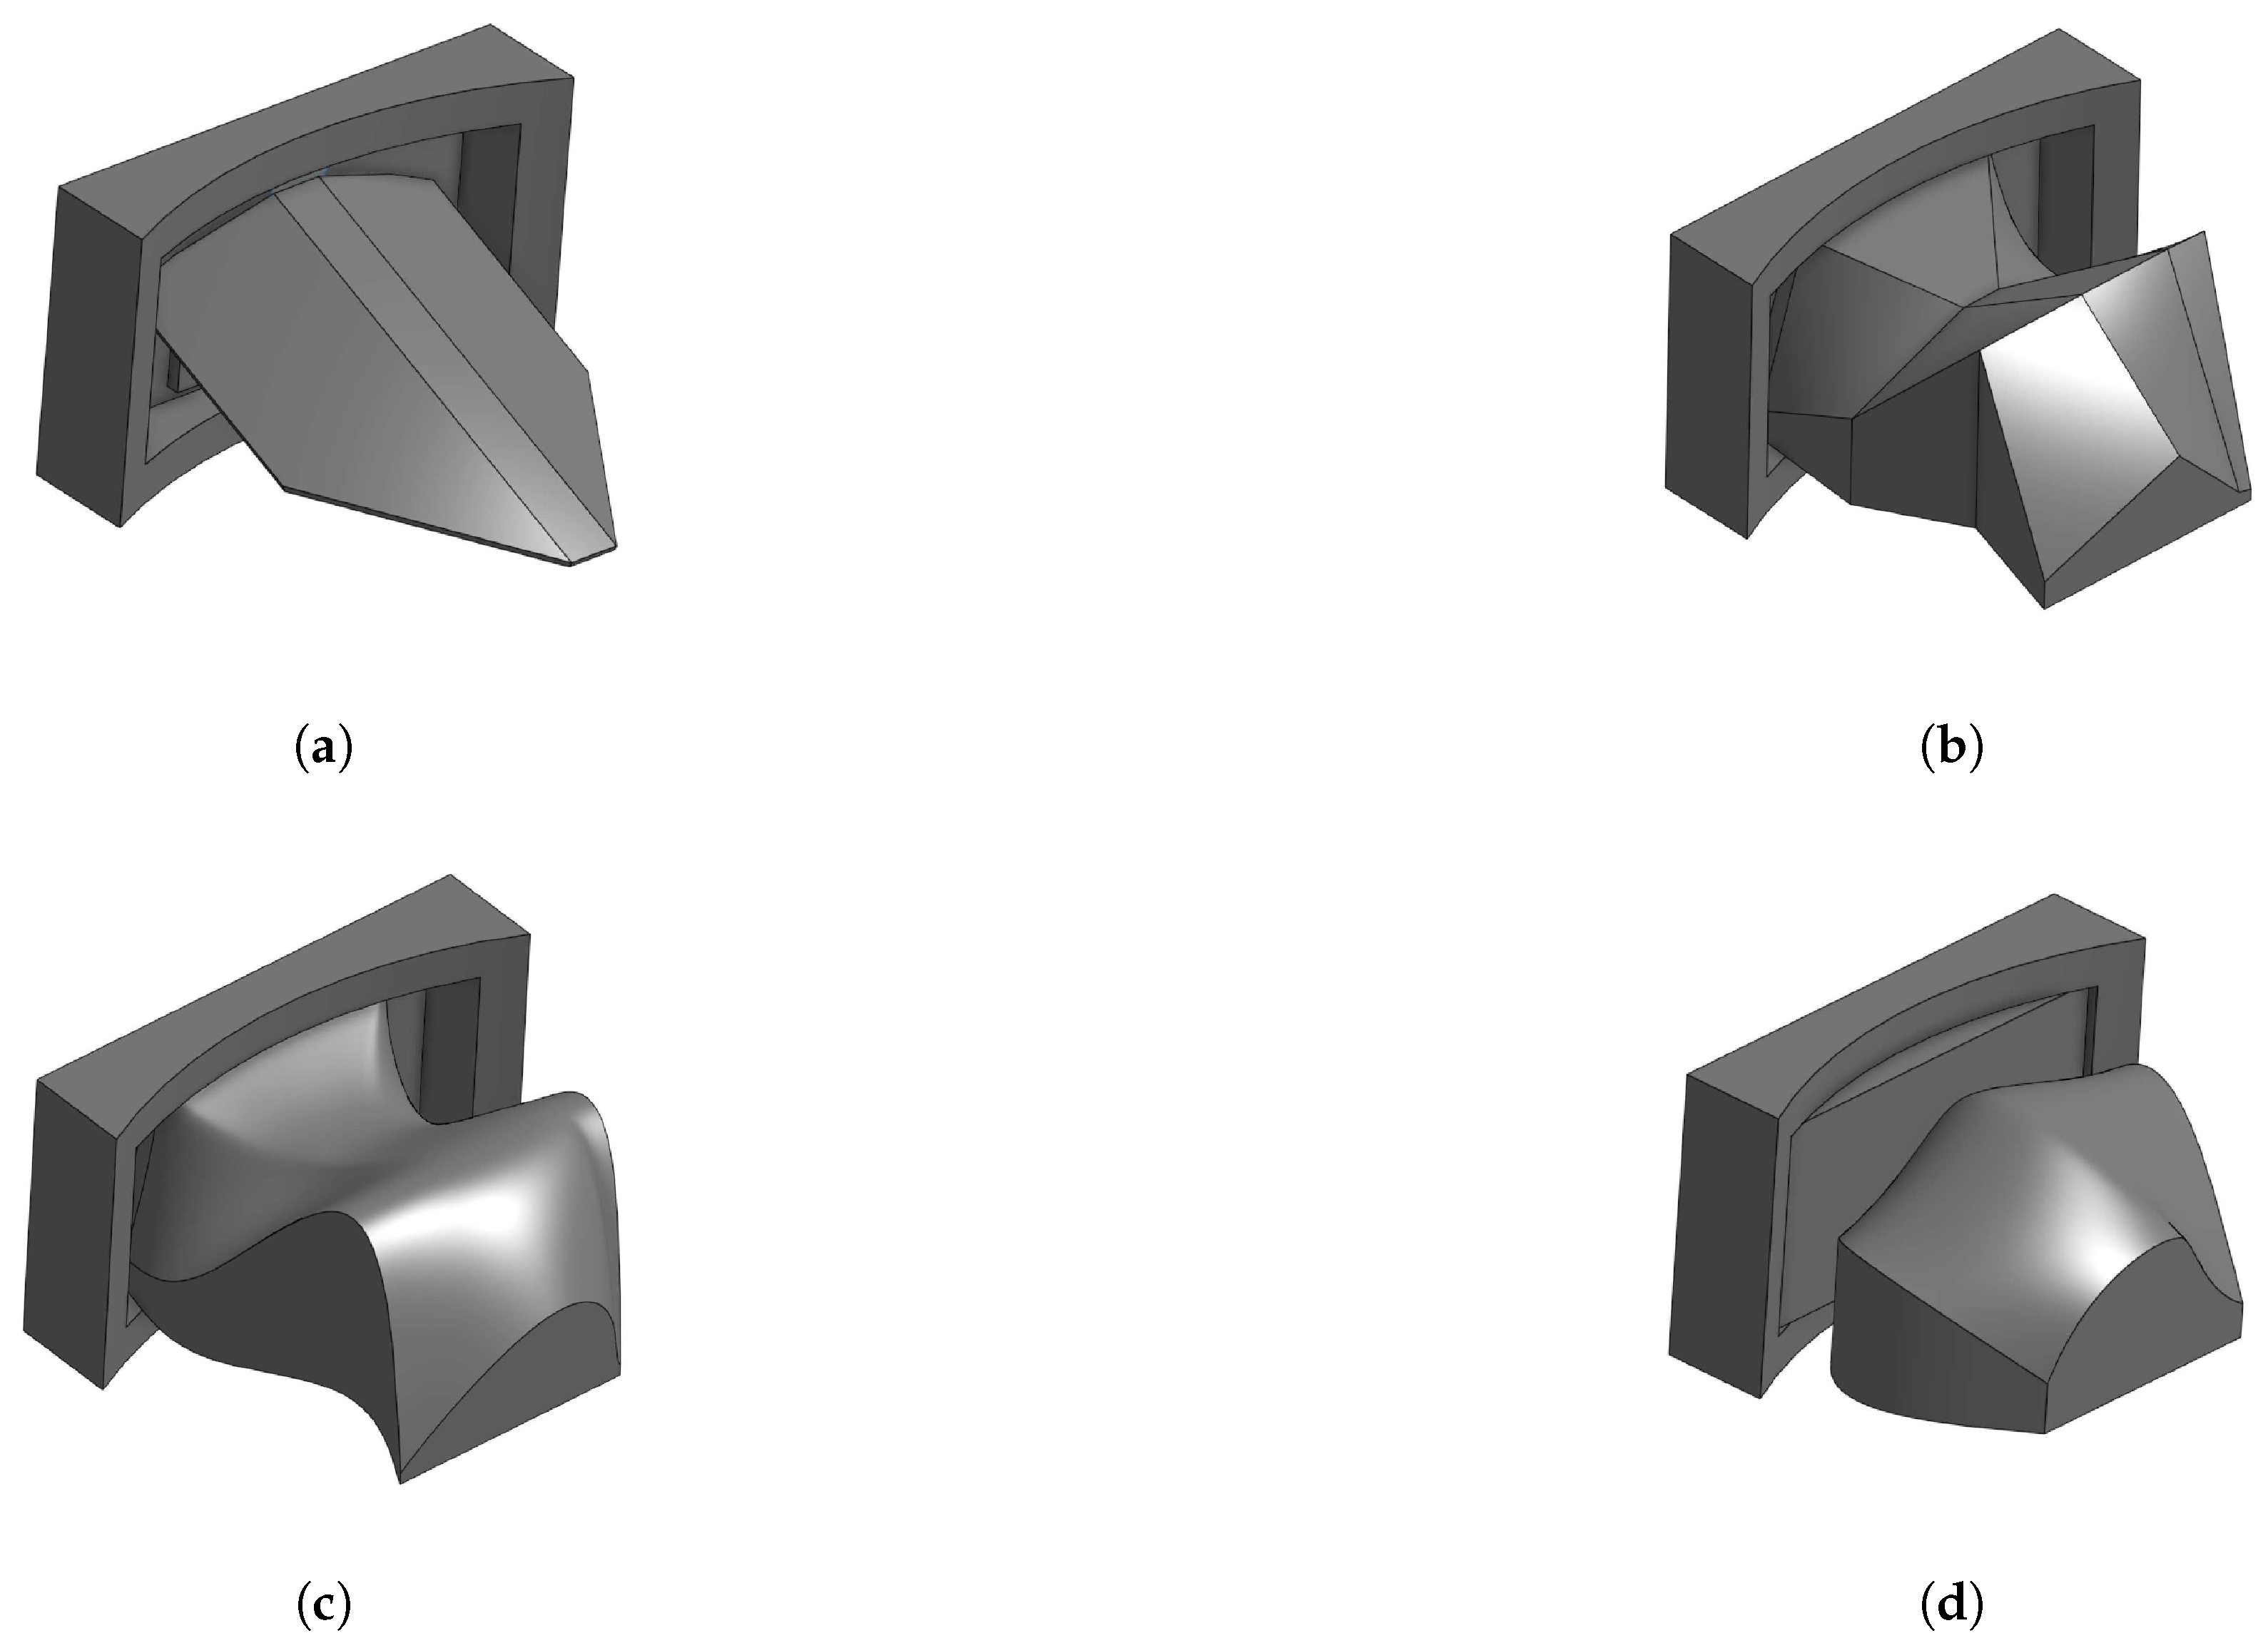
To improve the uniformity of material distribution at the bottom of the hopper, the shape of the deflector was optimized. Three interesting geometries were identified for the deflector, with three different optimizations corresponding to three different parameterizations of the geometry. These geometries have in common a belly shape that is very different from the original shape of the deflector and able to alleviate the problem of segregation. In fact, the distribution of both coke and iron ore in the hopper obtained with the new deflectors has a lower standard deviation for both weight and number of particles in the circumferential direction, indicating a reduction in the segregation effect. The first two optimum geometries are vaguely similar, although the first has planar surfaces and the second has curved surfaces. The performance is similar, too. The third optimum deflector, which has the best performance, was obtained by learning from the results of previous optimizations while using a different parameterization that was simplified in the radial direction. It constitutes a refinement of previous solutions, improving the cross-sectional shape. This complex shape succeeds in achieving close to the desired material distribution. This comes as a reminder of how much the parameterization affects the optimization result. Consequently, its formulation must represent a compromise between the need for simplification, motivated by computational tractability, and the imperative of sufficient complexity to ensure an adequate exploration for the optimal solution. The results obtained show that the shape optimization leads to non-intuitive geometries, highlighting the importance of computational tools.
The optimized deflectors have shown much better performance than the two-sided deflector in the numerical simulations. This improved behavior was confirmed by some experimental tests, albeit in a qualitative manner. Unfortunately, it was not possible to test these deflectors directly in the facility in order to verify the actual benefits for the iron-making process.
The decision to concentrate solely on optimizing the shape of the deflector, rather than enhancing the entire charging system or replacing it with a more modern and efficient alternative, was intended to identify a cost-effective solution that ensures ease of operation and maintenance. However, the actual cost-effectiveness of the solution should be verified and future research should explore this aspect. A limitation of this study lies in the absence of a comprehensive cost analysis covering device construction, installation and maintenance. Maintenance may constitute a significant expenditure, as the deflector is anticipated to experience a rapid rate of material degradation, despite being constructed from cast iron. This is because of the severe environmental conditions, particularly the presence of highly corrosive gases from the BF and the abrasive impact of particulate matter on its surface. The rate of degradation may also serve as a focal point for future research, which could be instrumental in determining maintenance costs.
Beyond the results obtained for the specific context, this research activity remains of great interest and the methodological approach could be extended to other similar applications, e.g., in the field of food, chemical and pharmaceutical production.
Author Contributions
Conceptualization, G.D., L.P., M.B. and V.D.; methodology, G.D., L.P. and C.P.; software, G.D.; validation, G.D., M.B., C.P. and N.P.; formal analysis, L.P. and E.P.; investigation, G.D.; resources, L.P., C.P. and V.D.; data curation, L.P. and E.P.; writing—original draft preparation, G.D. and L.P.; writing—review and editing, L.P. and E.P.; visualization, G.D.; supervision, L.P. and V.D. All authors have read and agreed to the published version of the manuscript.
Funding
This research received no external funding.
Institutional Review Board Statement
Not applicable.
Informed Consent Statement
Not applicable.
Data Availability Statement
The raw data supporting the conclusions of this article will be made available by the authors on request.
Acknowledgments
The authors thank Acciaieria Arvedi Trieste, ESSS, ESTECO. They also wish to express their thanks for the support received in the lab activity by Luigi Bregant and the technicians of the Department of Engineering and Architecture at the University of Trieste—Francesco Bacciocchini, Cristiano Ruzzier, and Mauro Fontana.
Conflicts of Interest
Authors Gabriele Degrassi and Carlo Poloni were employed by Esteco SpA. Author Nicola Petronelli was employed by SAM—Neuves Maisons—Riva Group. The remaining authors declare that the research was conducted in the absence of any commercial or financial relationships that could be construed as a potential conflict of interest.
Appendix A. Relevant Statistics Definition
Let be the number of radial sectors into which the hopper was virtually split, as shown in Figure 3, for the statistics calculation. Indicating with P the weight, N the number of particles and the material (c is coke and f is iron), the percentage weight in sector s is computed summing the weights of all particles in sector s divided by the sum of the weights of all particles fallen into the hopper. The percentage number of particles in sector s is computed dividing the number of all particles in sector s by the number of all particles fallen into the hopper.
The mean value of the percentage weight and the mean value of the percentage number of particles are:
and
respectively.
Given the definitions in Equations (A1) and (A2), the variance, the minimum and the maximum of the percentage weight are:
respectively, and the variance, the minimum and the maximum of the percentage number of particles are:
respectively.
Lastly, the difference between iron and coke percentage weight in sector s is defined as:
and its mean value:
So, the variance of the difference between iron and coke percentage is:
Appendix B. Geometry Parameterization
Appendix B.1. First Optimization
The geometry is parameterized by the distance of four sections from the center of the hopper and by the coordinates of four control points on each section.
Before the optimization phase, a sensitivity analysis on a DOE of 90 designs, generated with the Uniform Latin Hypercube algorithm, was carried out to establish the variability ranges of the parameters or their constant value.
The range for the variable parameters are reported in Table A1.
In the nomenclature of parameters, the sections are numbered increasingly, starting from the wall towards the center of the hopper, so refers to the outermost section and to the innermost section. z is the distance of the section from the hopper center, x and y are the coordinates of the control points in each section, numbered as shown in Figure A1 (for section 4 as an example).
Table A1.
First optimization: variation ranges of the variables and values of variables for the optimum design.
Table A1.
First optimization: variation ranges of the variables and values of variables for the optimum design.
| Parameter | Minimum [mm] | Maximum [mm] | Design 319 [mm] |
|---|---|---|---|
| zS2 | 930 | 1430 | 1277 |
| zS3 | 850 | 970 | 970 |
| zS4 | 430 | 630 | 570 |
| S1x1 | 25 | 100 | 113 |
| S1x2 | 30 | 400 | 262 |
| S1y1 | 30 | 590 | 91 |
| S2x1 | 25 | 300 | 82 |
| S2x2 | 30 | 1165 | 491 |
| S2x3 | 35 | 1170 | 621 |
| S2x4 | 900 | 1175 | 984 |
| S2y1 | 30 | 320 | 283 |
| S2y2 | 5 | 565 | 175 |
| S2y3 | 5 | 565 | 175 |
| S2y4 | 30 | 590 | 283 |
| S3x1 | 25 | 300 | 259 |
| S3x2 | 30 | 1165 | 637 |
| S3x3 | 35 | 1170 | 956 |
| S3x4 | 900 | 1175 | 1093 |
| S3y1 | 30 | 590 | 590 |
| S3y2 | 5 | 565 | 5 |
| S3y3 | 5 | 565 | 5 |
| S3y4 | 30 | 590 | 590 |
| S4x1 | 25 | 300 | 137 |
| S4x2 | 30 | 1165 | 632 |
| S4x3 | 35 | 1170 | 859 |
| S4x4 | 900 | 1175 | 903 |
| S4y1 | 30 | 590 | 91 |
| S4y2 | 5 | 565 | 183 |
| S4y3 | 5 | 565 | 10 |
| S4y4 | 30 | 590 | 36 |
Figure A1.
Sketch of the parametrization: control points for the first device with planar surfaces.
The first section is positioned on the same plane as the one where the device currently in use is attached to the hopper, so its distance from the hopper center is constant. The other three are parallel to the first one, with an adjustable distance between them.
On section 1 only 3 variables are defined, because the ordinate of point 2 is set to constant value 595 mm and control points 3 and 4 are set symmetrical, in respect to the vertical radial plane passing through the center of the hatch shape, to points 2 and 1 on the same section, respectively.
On sections 2, 3 and 4:
- the values and were set as a function of and , respectively, so that it is always and avoiding the formation of hollows on the device surface, where material would be deposited;
- it was imposed that .
On sections 2 and 3 and values were bound to be equal, in order to reduce the number of variables and limit the optimization computational time.
Appendix B.2. Second Optimization
The geometry is parameterized by the distance of four sections from the center of the hopper and by the coordinates of six control points on each section. Compared to the previous parameterization, two control points, 5 and 6, were added to uniquely define the splines. For the generation of the new geometry, some parameters were set constant and equal to the value that the corresponding parameter assumes in the optimal design (Table A2). The parameter was set at 5505 mm instead of 5705 mm for reasons related to the generation of the CAD model. For the same reason, parameter is set at 595 mm.
Table A2.
Second optimization: parameters with constant value.
Table A2.
Second optimization: parameters with constant value.
| Parameter | Constant Value [mm] |
|---|---|
| zS4 | 550 |
| S1x1 | 113 |
| S1x2 | 262 |
| S1y1 | 91 |
| S1y2 | 595 |
| S1y5 | 595 |
| S2x1 | 82 |
| S2x2 | 491 |
| S2x3 | 621 |
| S2x4 | 984 |
| S2y1 | 283 |
| S2y2 | 175 |
| S2y3 | 175 |
| S2y4 | 283 |
| S3x1 | 259 |
| S3x2 | 637 |
| S3x3 | 956 |
| S3x4 | 1093 |
| S3y1 | 590 |
| S3y2 | 5 |
| S3y3 | 5 |
| S3y4 | 590 |
| S4x1 | 137 |
| S4x2 | 632 |
| S4x3 | 859 |
| S4x4 | 903 |
| S4y1 | 91 |
| S4y2 | 183 |
| S4y3 | 175 |
| S4y4 | 36 |
The range for the variable parameters are reported in Table A3.
In the nomenclature of parameters, the sections are numbered increasingly, starting from the wall towards the center of the hopper, so refers to the outermost section and to the innermost section. z is the distance of the section from the hopper center, x and y are the coordinates of the control points in each section, numbered as shown in Figure A2 (for section 2 as an example).
The and parameters were made variable in a range of previous optimal design values because, with the curved surface, the radial position of maximum and minimum deflector height points do not coincide with the position of the sections.
It was imposed that , , and .
On section 1, control point 6 is set symmetrical, in respect to the vertical radial plane passing through the center of the hatch shape, to point 5 on the same section.
Table A3.
Second optimization: variation ranges of the variables and values of variables for the optimum design.
Table A3.
Second optimization: variation ranges of the variables and values of variables for the optimum design.
| Parameter | Minimum [mm] | Maximum [mm] | Design 196 [mm] |
|---|---|---|---|
| zS2 | 1225 | 1300 | 1300 |
| zS3 | 920 | 990 | 990 |
| S1x5 | 114 | 262 | 262 |
| S2x5 | 83 | 491 | 471 |
| S2x6 | 621 | 984 | 875 |
| S2y5 | 283 | 457 | 387 |
| S2y6 | 283 | 457 | 457 |
| S3x5 | 310 | 580 | 553 |
| S3x6 | 1000 | 1035 | 1000 |
| S3y5 | 591 | 595 | 591 |
| S3y6 | 591 | 595 | 592 |
| S4x5 | 137 | 632 | 211 |
| S4x6 | 860 | 902 | 885 |
| S4y5 | 92 | 273 | 110 |
| S4y6 | 36 | 45 | 41 |
Figure A2.
Sketch of the parametrization: control points for the second device with curved surfaces.
Appendix B.3. Third Optimization
The geometry is parameterized by the distance of three sections from the center of the hopper and by the coordinates of seven control points on each section. This is because, from the results of previous optimizations, it was seen that the first section was almost irrelevant.
The range for the variable parameters are reported in Table A4.
In the nomenclature of parameters, the sections are numbered increasingly, starting from the wall towards the center of the hopper, so refers to the outermost section and to the innermost section. z is the distance of the section from the hopper center, x and y are the coordinates of the control points in each section, numbered as shown in Figure A3 (for section 4 as an example).
Each section therefore has 7 points with two coordinates each, but the ordinate of point 2 is not independent because point 2 is bound to be on the same line as points 3 and 4.
Compared to the previous parameterizations, for section 2 it has been decided to allow a greater variability of the lateral control points, allowing the section to reach up to 400 mm in width.
It was also decided to allow a higher height for sections 3 and 4, so that the particles collide with the device at a higher altitude than the previous devices.
Table A4.
Third optimization: variation ranges of the variables and values of variables for the optimum design.
Table A4.
Third optimization: variation ranges of the variables and values of variables for the optimum design.
| Parameter | Minimum [mm] | Maximum [mm] | Design 365 [mm] |
|---|---|---|---|
| zS3 | 900 | 1400 | 1350 |
| zS4 | 400 | 700 | 430 |
| S2x0 | 25 | 400 | 372 |
| S2x1 | 0 | S2x3/2.00 | 28 |
| S2x2 | 0 | S2x3/2.00 | 95 |
| S2x3 | 0 | S2x6 | 306 |
| S2x4 | 0 | S2x6 − S2x3 − S2x0 | 54 |
| S2x5 | 0 | S2x6 − S2x3 − S2x0 | 59 |
| S2x6 | 800 | 1175 | 959 |
| S2y0 | 30 | 300 | 228 |
| S2y1 | 0 | (S2y3 − S2y0)/2.00 | 60 |
| S2y3 | max(S2y0, S2y6) | 595 | 514 |
| S2y4 | S2y3/1.05 | S2y3/0.95 | 531 |
| S2y5 | 0 | (S2y3 − S2y6)/2.00 | 33 |
| S2y6 | 30 | 300 | 39 |
| S3x0 | 25 | 400 | 175 |
| S3x1 | 0 | S3x3/2.00 | 9 |
| S3x2 | 0 | S3x3/2.00 | 31 |
| S3x3 | S3x0 | S3x6 | 184 |
| S3x4 | 0 | S3x6 − S3x3 − S3x0 | 205 |
| S3x5 | 0 | S3x6 − S3x3 − S3x0 | 163 |
| S3x6 | 800 | 1175 | 884 |
| S3y0 | 30 | 600 | 532 |
| S3y1 | 0 | (S3y3 − S3y0)/2.00 | 69 |
| S3y3 | max(S3y0, S3y6) | 700 | 684 |
| S3y4 | S3y3/1.05 | S3y3/0.95 | 709 |
| S3y5 | 0 | (S3y3 − S3y6)/2.00 | 22 |
| S3y6 | 30 | 600 | 589 |
| S4x0 | 25 | 400 | 334 |
| S4x1 | 0 | S4x3/2.00 | 63 |
| S4x2 | 0 | S4x3/2.00 | 105 |
| S4x3 | S4x0 | S4x6 | 234 |
| S4x4 | 0 | S4x6 − S4x3 − S4x0 | 110 |
| S4x5 | 0 | S4x6 − S4x3 − S4x0 | 110 |
| S4x6 | 800 | 1175 | 866 |
| S4y0 | 30 | 400 | 171 |
| S4y1 | 0 | (S4y3 − S4y0)/2.00 | 40 |
| S4y3 | max(S4y0, S4y6) | 700 | 405 |
| S4y4 | S4y3/1.05 | S4y3/0.95 | 408 |
| S4y5 | 0 | (S4y3 − S4y6)/2.00 | 10 |
| S4y6 | 30 | 400 | 311 |
Figure A3.
Sketch of the parametrization: control points for the third device with curved surfaces.
References
- Hattori, M.; Iino, B.; Shimomura, A.; Tsukiji, H.; Ariyama, T. Development of Burden Distribution Simulation Model for Bell-less Top in a Large Blast Furnace and Its Application. ISIJ Int. 1993, 33, 1070–1077. [Google Scholar] [CrossRef]
- Fu, D.; Chen, Y.; Zhou, C.Q. Mathematical modeling of blast furnace burden distribution with non-uniform descending speed. Appl. Math. Model. 2015, 39, 7554–7567. [Google Scholar] [CrossRef]
- Fojtik, D.; Tuma, J.; Faruzel, P. Computer modelling of burden distribution in the blast furnace equipped by a bell-less top charging system. Ironmak. Steelmak. 2021, 48, 1226–1238. [Google Scholar] [CrossRef]
- Abhale, P.B.; Viswanathan, N.N.; Saxén, H. Numerical modelling of blast furnace—Evolution and recent trends. Miner. Process. Extr. Metall. 2020, 129, 166–183. [Google Scholar] [CrossRef]
- Abhale, P.B.; Nag, S.; Bapat, Y.; Kulkarni, A.; Viswanathan, N.N.; Padmapal. Development of 2D Steady-State Mathematical Model for Blast Furnace Using OpenFOAM®. Metall. Mater. Trans. B 2022, 53, 3469–3491. [Google Scholar] [CrossRef]
- Mondal, D.N.; Liu, W.; Bartusch, H.; Kaymak, Y.; Paananen, T.; Mattila, O.; Saxén, H. Numerical Study of Gas Flow and Temperature Patterns in the Blast Furnace Throat. Metall. Mater. Trans. B 2022, 53, 3882–3895. [Google Scholar] [CrossRef]
- Jiao, L.; Kuang, S.; Yu, A.; Li, Y.; Mao, X.; Xu, H. Three-Dimensional Modeling of an Ironmaking Blast Furnace with a Layered Cohesive Zone. Metall. Mater. Trans. B 2020, 51, 258–275. [Google Scholar] [CrossRef]
- Jiao, L.; Kuang, S.; Li, Y.; Mao, X.; Xu, H.; Yu, A. Numerical Simulation of the 3D Asymmetric Inner States of an Ironmaking Blast Furnace Resulting From Circumferential Non-uniform Burden Distribution. Metall. Mater. Trans. B 2023, 54, 734–755. [Google Scholar] [CrossRef]
- Roeplal, R.; Pang, Y.; Adema, A.; van der Stel, J.; Schott, D. Modelling of phenomena affecting blast furnace burden permeability using the Discrete Element Method (DEM)—A review. Powder Technol. 2023, 415, 118161. [Google Scholar] [CrossRef]
- Shengli, W.; Hongliang, H.; Xiaoqin, L. Mathematical Model for Blast Furnace Burden Optimization Based on the High-temperature Reactivity. ISIJ Int. 2010, 50, 987–993. [Google Scholar]
- Agrawal, A.; Singh, R.S.; Singh, M.K. Improving the burdening practice by optimization of raw flux calculation in blast furnace burden. Ironmak. Steelmak. 2020, 47, 271–283. [Google Scholar] [CrossRef]
- Mio, H.; Kadowaki, M.; Matsuzaki, S.; Kunitomo, K. Development of particle flow simulator in charging process of blast furnace by discrete element method. Miner. Eng. 2012, 33, 27–33. [Google Scholar] [CrossRef]
- Yu, Y. Experimental and Discrete Element Simulation Studies of Bell-Less Charging of Blast Furnace. Doctoral Dissertation, Åbo Akademi University, Turku, Finland, 2013. [Google Scholar]
- Xu, W.; Cheng, S.; Niu, Q.; Zhao, G. Effect of the Main Feeding Belt Position on Burden Distribution during the Charging Process of Bell-less Top Blast Furnace with Two Parallel Hoppers. ISIJ Int. 2017, 57, 1173–1180. [Google Scholar] [CrossRef]
- Mio, H.; Narita, Y. Simulation of Particle Behavior in Charging Process of Blast Furnace by Discrete Element Method; Technical Report No. 120; Nippon Steel & Sumitomo Metal: Tokyo, Japan, 2018. [Google Scholar]
- Li, Y.; Zhang, S.; Zhang, J.; Yin, Y.; Xiao, W.; Zhang, Z. Data-Driven Multiobjective Optimization for Burden Surface in Blast Furnace With Feedback Compensation. IEEE Trans. Industr. Inform. 2020, 16, 2233–2244. [Google Scholar] [CrossRef]
- An, J.; Wu, M.; She, J.; Terano, T.; Cao, W. Decision-Making of Burden Distribution for Blast Furnace. In Developments in Advanced Control and Intelligent Automation for Complex Systems. Studies in Systems, Decision and Control; Wu, M., Pedrycz, W., Chen, L., Eds.; Springer: Cham, Switzerland, 2021; pp. 143–164. [Google Scholar]
- Wang, H.; Sheng, C.; Lu, X. Knowledge-Based Control and Optimization of Blast Furnace Gas System in Steel Industry. IEEE Access 2017, 5, 25034–25045. [Google Scholar] [CrossRef]
- Mikhailova, U.V.; Kalugina, O.B.; Afanasyeva, M.V.; Konovalov, M.V. Development of Automated Control System of Blast-Furnace Melting Operation. In Proceedings of the 2019 International Russian Automation Conference, Sochi, Russia, 8–14 September 2019; pp. 1–4. [Google Scholar]
- Masuda, R.; Hashimoto, Y.; Mulder, M.; van Paassen, M.M.R.; Kano, M. Automation on thermal control of blast furnace. Digit. Chem. Eng. 2023, 7, 100085.1–100085.10. [Google Scholar] [CrossRef]
- Strassburger, J.H. Blast Furnace: Theory and Practice; Gordon & Breach Science Publishers, Inc.: Philadelphia, PA, USA, 1969. [Google Scholar]
- McNeil, I. An Encyclopedia of the History of Technology; Routledge Companion Encyclopedias, Taylor & Francis: London, UK, 2002. [Google Scholar]
- Chen, J.; Zuo, H.; Xue, Q.; Wang, J. A review of burden distribution models of blast furnace. Powder Technol. 2022, 398, 117055.1–117055.23. [Google Scholar] [CrossRef]
- Cheng, X.; Cheng, S. DEM study of the effect of different chute conditions on burden distribution during charging process blast furnace. Metall. Res. Technol. 2023, 120, 214.1–214.10. [Google Scholar] [CrossRef]
- Wei, H.; Saxén, H.; Yu, Y. Numerical Analysis of Factors Affecting the Burden Surface and Porosity Distribution in the Upper Part of the Blast Furnace. Metals 2023, 13, 292. [Google Scholar] [CrossRef]
- Wu, D.; Yao, F.; Zhang, D.; Zu, E.; Zhou, P.; Chen, W. A Self-Adaption Growth Model for the Burden Packing Process in a Bell-Less Blast Furnace. Processes 2024, 12, 1523. [Google Scholar] [CrossRef]
- Wei, H.; Zhang, C.; Han, J.; Wang, Z.; Ren, W.; Zhang, J.; Chen, Z.; Lu, P. Effect of Pellet Proportion and Charging Sequence on Burden Distribution in Blast Furnaces According to Discrete Element Method Simulation. Processes 2025, 13, 237. [Google Scholar] [CrossRef]
- Degrassi, G.; Parussini, L.; Boscolo, M.; Petronelli, N.; Dimastromatteo, V. Discrete element simulation of the charge in the hopper of a blast furnace, calibrating the parameters through an optimization algorithm. SN Appl. Sci. 2021, 3, 242.1–242.16. [Google Scholar] [CrossRef]
- Spence, A. Improving Blast Furnace Burden Distribution by Stockfeed Segregation Control. Doctoral Dissertation, University of Wollongong, Wollongong, Australia, 1996. [Google Scholar]
- Mio, H.; Komatsuki, S.; Akashi, M.; Shimosaka, A.; Shirakawa, Y.; Hidaka, J.; Kadowaki, M.; Matsuzaki, S.; Kunitomo, K. Effect of Chute Angle on Charging Behavior of Sintered Ore Particles at Bell-less Type Charging System of Blast Furnace by Discrete Element Method. ISIJ Int. 2009, 49, 479–486. [Google Scholar] [CrossRef]
- Chen, J.; Zuo, H.; Wang, Y.; Xue, Q.; Wang, J. DEM Simulation of Burden Circumferential Distribution of Blast Furnace With Parallel Hoppers. Metall. Mater. Trans. B 2022, 53, 3793–3804. [Google Scholar] [CrossRef]
- Kukreja, A.; Chopra, P.; Aggarwal, A.; Khanna, P. Application of Full Factorial Design for Optimization of Feed Rate of Stationary Hook Hopper. Int. J. Model. Optim. 2011, 1, 205–209. [Google Scholar] [CrossRef]
- Jung, U.; An, J.H.; Lim, B.S.; Koh, B.H. Modeling discharge of pellets from a hopper using response surface methodology. Int. J. Precis. Eng. Manuf. 2012, 13, 565–571. [Google Scholar] [CrossRef]
- Lu, H.; Cao, J.; Guo, X.; Gong, X.; Fu, L. Design optimization of an aerated hopper for discharge of cohesive pulverized coal. Powder Technol. 2019, 35, 186–192. [Google Scholar] [CrossRef]
- Wang, X.; Zhu, H.W.; Shi, Q.F.; Zheng, N. Discharge flow of granular particles through an orifice on a horizontal hopper: Effect of the hopper angle. Chin. Phys. B 2020, 29, 044502.1–044502.4. [Google Scholar] [CrossRef]
- Liu, M.; Lu, Z.; Liu, B.; Shao, Y. DEM simulation of particle mixing for optimizing the overcoating drum in HTR fuel fabrication. AIP Conf. Proc. 2013, 154, 726–730. [Google Scholar]
- Vaicis, I.; Januševskis, A.; Auzinš, J.; Januševskis, J. Modeling and Analysis of Dust Control Hopper System. In Proceedings of the 18th International Scientific Conference “Engineering for Rural Development”, Jelgava, Latvia, 22–24 May 2019; pp. 1237–1242. [Google Scholar]
- Hlosta, J.; Žurovec, D.; Rozbroj, J.; Ramírez-Gómez, A.; Nečas, J.; Zegzulka, J. Analysis and Optimization of Material Flow inside the System of Rotary Coolers and Intake Pipeline via Discrete Element Method Modelling. Energies 2018, 11, 1849. [Google Scholar] [CrossRef]
- Kang-Min, K.; Ju-Hun, K.; Jae-Hong, K.; Ji-A, L.; Jeong-Whan, H. Effect of Deflector Plate for Particle Size Segregation Control. Arch. Metall. Mater. 2019, 64, 495–500. [Google Scholar]
- Balevičius, R.; Kačianauskas, R.; Mroz, Z.; Sielamowicz, I. Discrete element method applied to multiobjective optimization of discharge flow parameters in hoppers. Struct. Multidisc. Optim. 2006, 31, 163–175. [Google Scholar] [CrossRef]
- Pérez-Aparicio, J.L.; Bravo, R.; GGómez-Hernández, J.J. Optimal numerical design of bucket elevators using discontinuous deformation analysis. Granul. Matter 2014, 16, 485–498. [Google Scholar] [CrossRef]
- Huang, X.; Zheng, Q.; Yu, A.; Yan, W. Shape optimization of conical hoppers to increase mass discharging rate. Powder Technol. 2020, 361, 179–189. [Google Scholar] [CrossRef]
- Esteco. modeFRONTIER Users Guide; Esteco: Trieste, Italy, 2023. [Google Scholar]
- Onshape Help. PTC. Available online: https://cad.onshape.com/help/Content/EnterpriseHelp/Content/home.htm (accessed on 2 March 2025).
- Jing, L.; Stephansson, O. 11—Discrete Element Methods for Granular Materials. In Developments in Geotechnical Engineering; Jing, L., Stephansson, O., Eds.; Elsevier: Amsterdam, The Netherlands, 2007; Volume 85, pp. 399–444. [Google Scholar]
- Radjai, F.; Dubois, F. Discrete-Element Modeling of Granular Materials; John Wiley & Sons: Hoboken, NJ, USA, 2011. [Google Scholar]
- Thornton, C. Granular Dynamics, Contact Mechanics and Particle System Simulations: A DEM Study; Particle Technology Series; Springer: Cham, Switzerland, 2015. [Google Scholar]
- Rocky DEM Technical Manual. Ansys. Available online: https://ansyshelp.ansys.com/public//Views/Secured/corp/v242/en/dem_tec/dem_tec.html (accessed on 2 March 2025).
Disclaimer/Publisher’s Note: The statements, opinions and data contained in all publications are solely those of the individual author(s) and contributor(s) and not of MDPI and/or the editor(s). MDPI and/or the editor(s) disclaim responsibility for any injury to people or property resulting from any ideas, methods, instructions or products referred to in the content. |
© 2025 by the authors. Licensee MDPI, Basel, Switzerland. This article is an open access article distributed under the terms and conditions of the Creative Commons Attribution (CC BY) license (https://creativecommons.org/licenses/by/4.0/).