
Optimal Convolutional Networks for Staging and Detecting of Diabetic Retinopathy


Abstract
1. Introduction
2. AI at the Service of Early DR Detection: Issues, Challenges, and Approaches
3. Deep ConvNet for DR Staging and Detecting
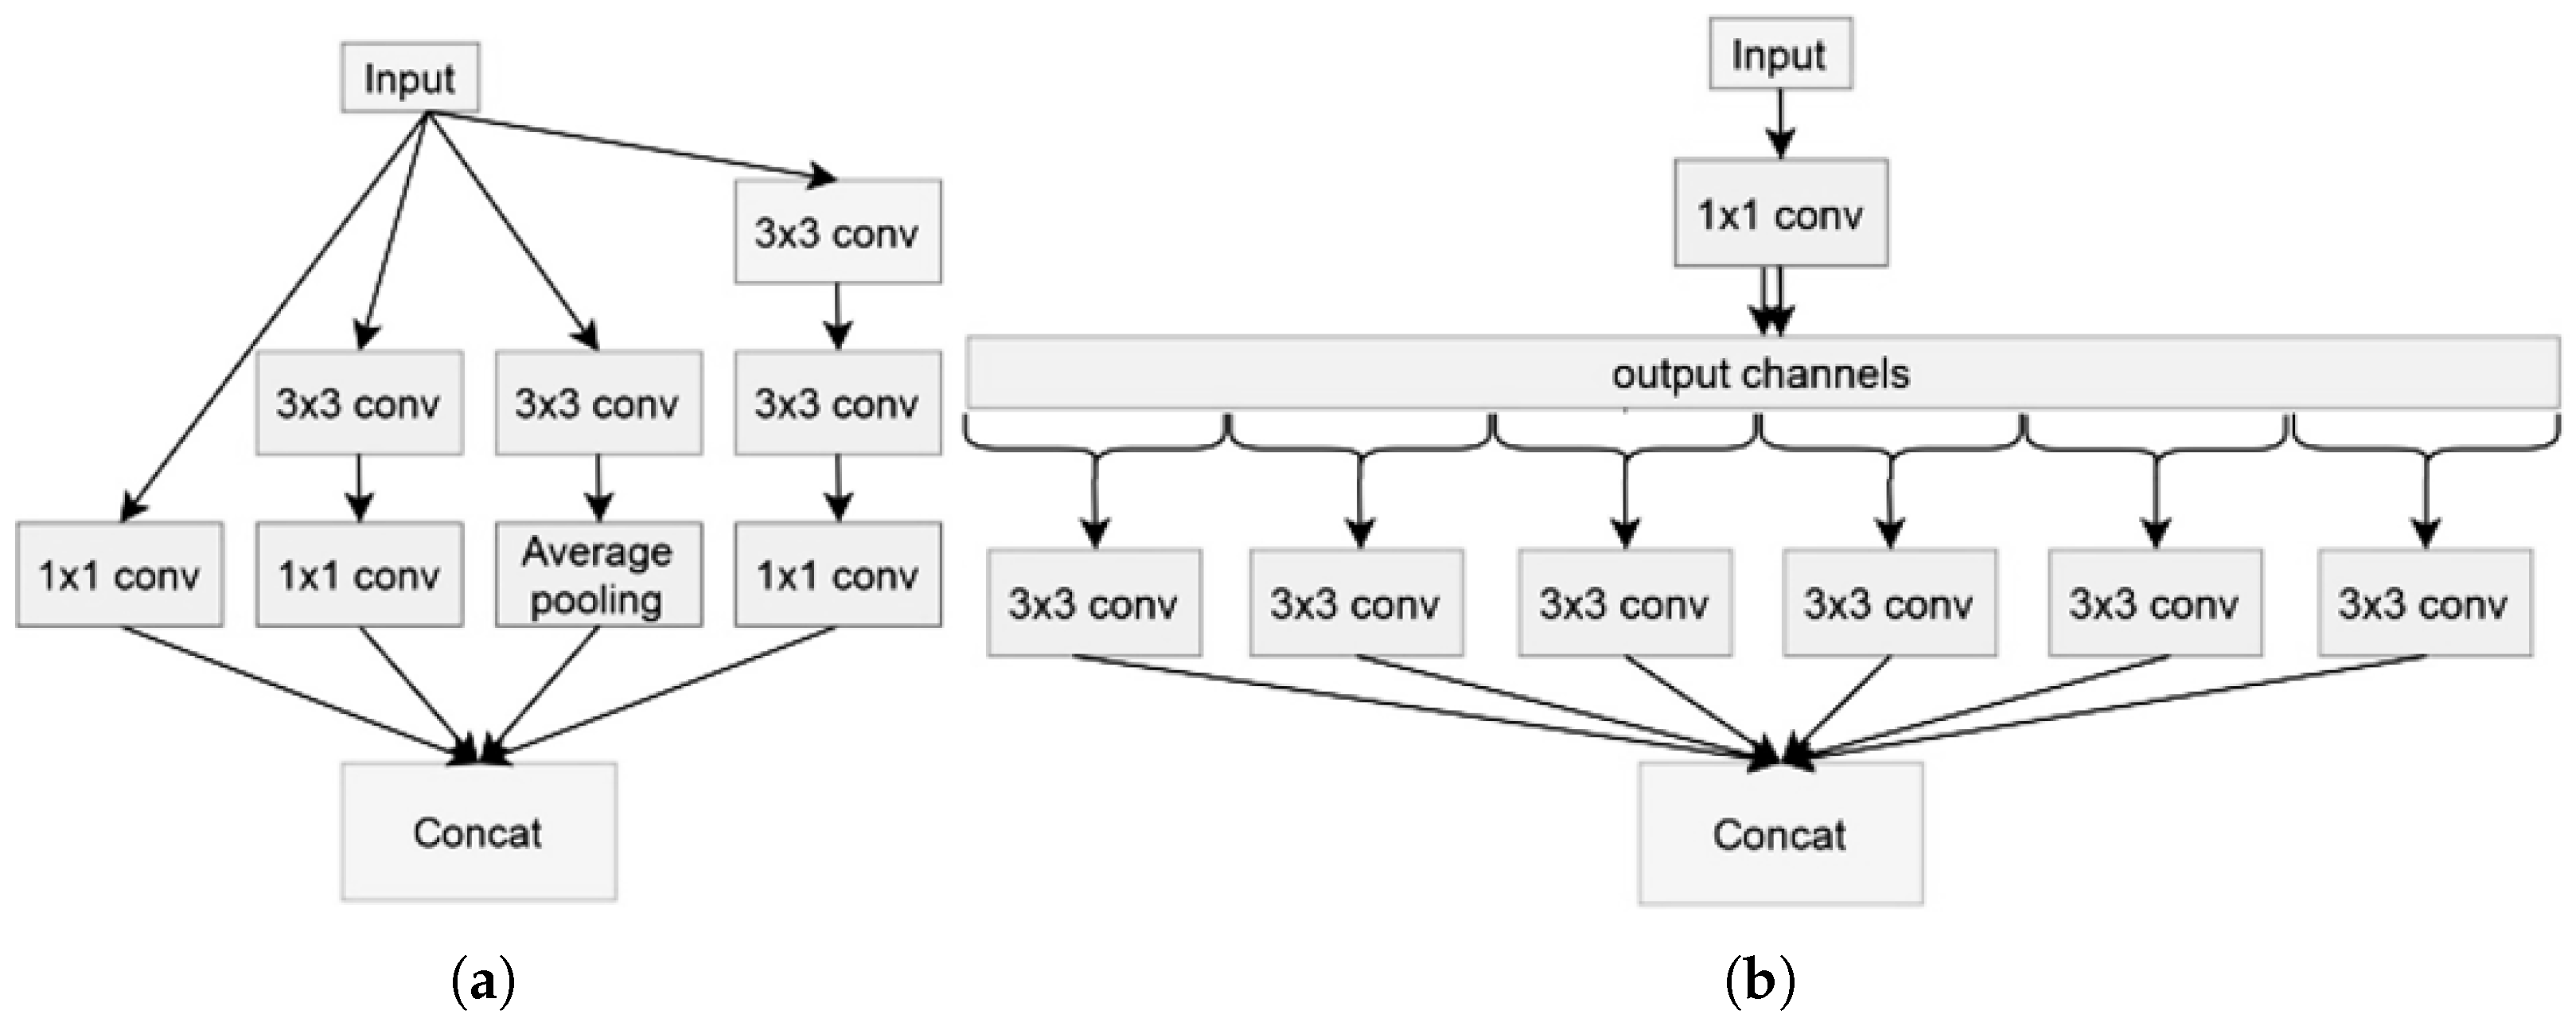
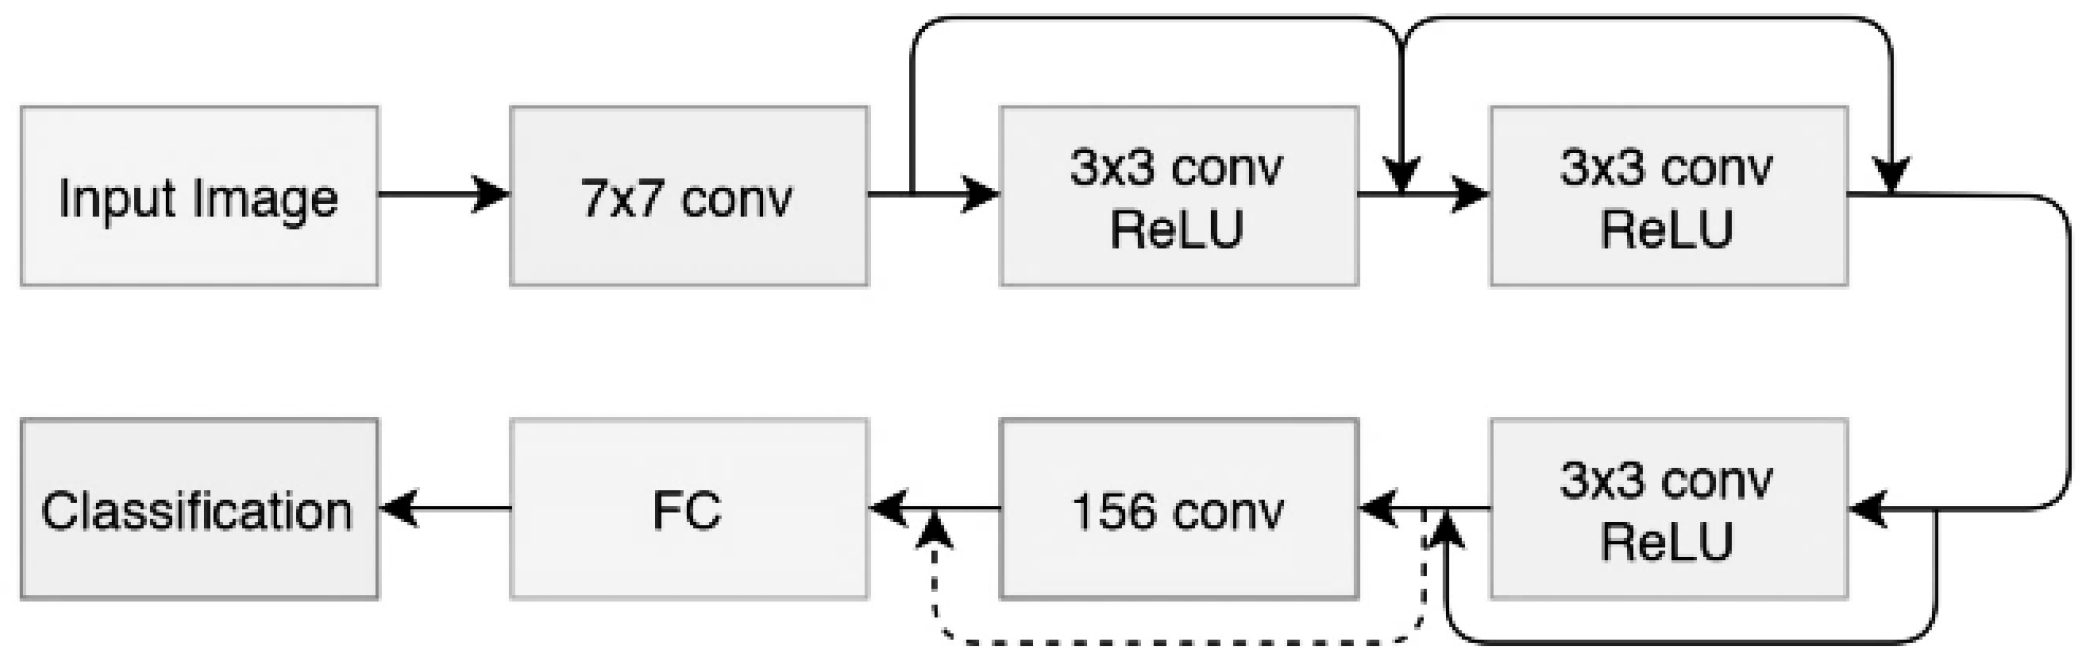
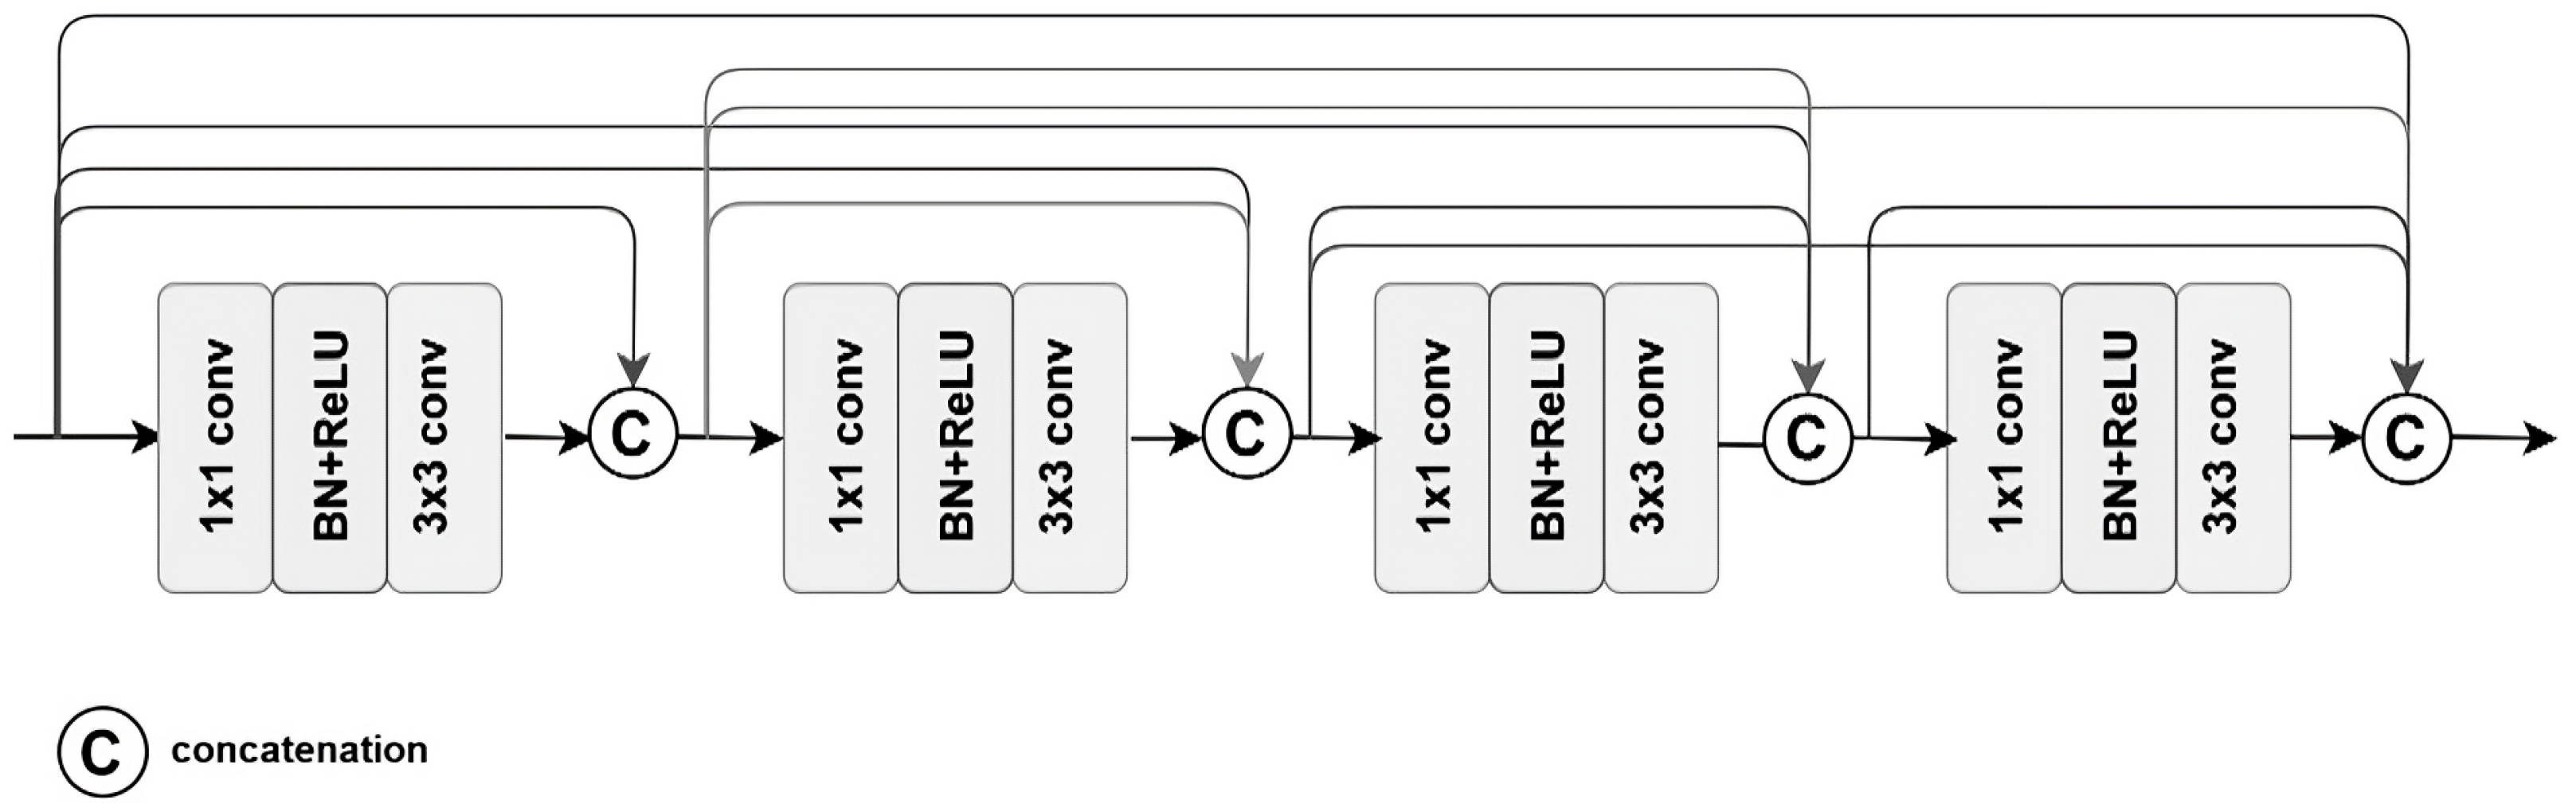
3.1. Model Architectures
- Depth-separable convolution: This is an alternative to classic convolutions, and is supposed to be much more efficient in terms of calculation time; in other words, certain kernels or filters can be separated into as many unidirectional vectors as dimensions (x-axis and ordered case of 2D), concerning 3D (we add the vectors concerning depth). Thus, this overcomes the problem of classic convolutions.
- Shortcuts between convolution blocks: This is when the activation of one layer is transferred quickly to a deeper layer of the neural network, which is called a residual block or identity.
- Batch normalization: This is a technique that accelerates the convergence of a model and improves its performance;
- ReLU activation;
- convolution.
- For the input layer, we add:
- –
- 1 layer (299, 299, 3) for Xception and Inception-Resnet V2.
- –
- 1 layer (224, 224, 3) for DenseNet201.
- For the output layer, we add:
- –
- A dense layer (fully connected with 256 neurons) + Relu activation function.
- –
- A dropout layer (0.4): this will allow us to drop units (both hidden or visible) in a neural network, these neurons will be chosen at random thanks to a probability , or kept with the probability p so that it remains at the end reduced network, and by abandonment, we mean that these neurons will not be taken into account during forward or backward pass to avoid overfitting.
- –
- Addition of a loss function (categorical cross entropy) loss calculation with three categories (for our three classes).
- –
- A softmax layer.
- Learning rate: a unified learning rate of 0.001/million was applied on three optimization methods (Adam, Adagrad, and SGD).
- Batch size: a treat of 32-f and 32-c was given for both the training and the testing and was kept in balance in the trade-off between the computational efficiency and model performance.
- Dropout rate: a dropout layer with a penalty of 0.4 was also settled in the context of overvaluating by performing the ablation of the redundant neurons.
- Medical imaging task performance: Convolutional Neural Networks (CNNs) have recorded remarkable performance in medical image classification tasks, specifically diabetic retinopathy detection. Xception, Inception-ResNet V2, and DenseNet201 have been thoroughly explored in the literature, and they have been found to possess excellent feature extraction capabilities for fundus images.
- Stability in training and computational efficiency: Although EfficientNet is renowned for parameter efficiency, we favored models that have been stable and consistent in their training on comparably modest medical datasets. Despite their strength, Vision Transformers (ViTs) usually need significantly larger datasets and processing resources to be comparable with other models.
- Transfer learning and pretrained weights: The chosen models are already pretrained on ImageNet, enabling efficient transfer learning for our dataset. This helped counter the problem of sparse training data, since medical datasets tend to be small and not very diverse.
3.2. Datasets
- 0—Healthy (No DR): 100 images;
- 1—Mild DR: 370 images;
- 2—Moderate DR: 900 images;
- 3—Severe DR: 190 images;
- 4—Proliferative DR: 290 images.
- Class #1: Healthy (No DR);
- Class #2: Merge Mild DR and Moderate DR classes;
- Class #3: Merge Severe DR and Proliferate DR classes.
3.3. Data Preprocessing
- Change of data format to tensor (matrix with dimension greater than 3).
- We carried out under-sampling (sample reduction) on our data, to overcome the problem of imbalance at the class level relating all classes to the number of samples of the lowest class (Class #5).
- Grouping of classes with a low number of samples as follows:
- –
- Class #0: Healthy (No Dr) (Class #0).
- –
- Class #1: Middle DR (Class #1 and #2).
- –
- Class #2: Severe DR (Class #3 and #4).
- Increase in the number of data available per class in a homogeneous manner.
- Normalize images by subtracting the minimum pixel intensity of each channel and dividing it by the average pixel intensity to represent pixels in a range of 0 to 1.
- Image processing using the CLAHE algorithm (Contrast-Limited Adaptive Histogram Equalization) [37] on RGB images, whose role is to improve the quality of the image. First, the image is separated into rectangular parts that resemble a grid, and each zone is subjected to typical histogram equalization. All these regions are combined, to obtain a complete optimized image.
- Resizing images to a format acceptable to models:
- –
- (229, 299, 3) for Xception and Inception-Resnet V2.
- –
- (224, 224, 3) for DenseNet201.
3.4. Improving Model Performance
- The model requires more data to be trained, creating a risk of over- or under-training (everything will depend on the behavior of the model).
- The dataset is unbalanced, which results in an imbalance within classes having a disproportionate number of samples (which makes the evaluation task more complex).
4. Simulation Results and Discussion
4.1. Testing and Evaluation
- Case 1 (Low specificity): Predict sickness among healthy patients.
- Case 2 (Low sensitivity): Predict health among sick patients.
- Case 3 (Low sensitivity and specificity): Wrong prediction, the model would have a prediction value below a random model.
4.2. Results
5. Conclusions and Limitations
Author Contributions
Funding
Data Availability Statement
Conflicts of Interest
References
- Nguyen, Q.H.; Muthuraman, R.; Singh, L.; Sen, G.; Tran, A.C.; Nguyen, B.P.; Chua, M. Diabetic Retinopathy Detection Using Deep Learning. In Proceedings of the 4th International Conference on Machine Learning and Soft Computing, Haiphong, Vietnam, 17–19 January 2020; pp. 103–107. [Google Scholar] [CrossRef]
- Joshi, S.; Kumar, R.; Rai, P.K.; Garg, S. Diabetic Retinopathy Using Deep Learning. In Proceedings of the 2023 International Conference on Computational Intelligence and Sustainable Engineering Solutions (CISES), Greater Noida, India, 28–30 April 2023; pp. 145–149. [Google Scholar] [CrossRef]
- Wahab Sait, A.R. A Lightweight Diabetic Retinopathy Detection Model Using a Deep-Learning Technique. Diagnostics 2023, 13, 3120. [Google Scholar] [CrossRef] [PubMed]
- Alwakid, G.; Gouda, W.; Humayun, M. Deep Learning-Based Prediction of Diabetic Retinopathy Using CLAHE and ESRGAN for Enhancement. Healthcare 2023, 11, 863. [Google Scholar] [CrossRef] [PubMed]
- Ten Dam, W.; Grol, M.; Zeegers, Z.; Dehghani, A.; Aldewereld, H. Representative Data Generation of Diabetic Retinopathy Synthetic Retinal Images. In Proceedings of the 2023 Conference on Human Centered Artificial Intelligence: Education and Practice, Dublin, Ireland, 14–15 December 2023; pp. 9–15. [Google Scholar] [CrossRef]
- Xu, K.; Feng, D.; Mi, H. Deep Convolutional Neural Network-Based Early Automated Detection of Diabetic Retinopathy Using Fundus Image. Molecules 2017, 22, 2054. [Google Scholar] [CrossRef]
- Gargeya, R.; Leng, T. Automated Identification of Diabetic Retinopathy Using Deep Learning. Ophthalmology 2017, 124, 962–969. [Google Scholar] [CrossRef]
- Jimenez-Baez, M.V.; Márquez-González, H.; Barcenas-Contreras, R.; Morales Montoya, C.; García, L.F. Early diagnosis of diabetic retinopathy in primary care. Colomb. Médica 2015, 46, 14–18. [Google Scholar] [CrossRef]
- García, G.; Gallardo, J.; Mauricio, A.; López, J.; Carpio, C.D. Detection of Diabetic Retinopathy Based on a Convolutional Neural Network Using Retinal Fundus Images. In Proceedings of the Artificial Neural Networks and Machine Learning —ICANN 2017—26th International Conference on Artificial Neural Networks, Alghero, Italy, 11–14 September 2017; Proceedings, Part II. Lecture Notes in Computer Science. Lintas, A., Rovetta, S., Verschure, P.F.M.J., Villa, A.E.P., Eds.; Springer: Cham, Switzerland, 2017; Volume 10614, pp. 635–642. [Google Scholar] [CrossRef]
- Firke, S.N.; Jain, R.B. Convolutional Neural Network for Diabetic Retinopathy Detection. In Proceedings of the 2021 International Conference on Artificial Intelligence and Smart Systems (ICAIS), Coimbatore, India, 25–27 March 2021; pp. 549–553. [Google Scholar] [CrossRef]
- Rashid, H.; Mohsin Abdulazeez, A.; Hasan, D. Detection of Diabetic Retinopathy Based on Convolutional Neural Networks: A Review. Asian J. Res. Comput. Sci. 2021, 8, 1–15. [Google Scholar] [CrossRef]
- Hernández, C.; Porta, M.; Bandello, F.; Grauslund, J.; Harding, S.P.; Aldington, S.J.; Egan, C.; Frydkjaer-Olsen, U.; García-Arumí, J.; Gibson, J.; et al. The Usefulness of Serum Biomarkers in the Early Stages of Diabetic Retinopathy: Results of the EUROCONDOR Clinical Trial. J. Clin. Med. 2020, 9, 1233. [Google Scholar] [CrossRef]
- Waheed, N.K.; Rosen, R.B.; Jia, Y.; Munk, M.R.; Huang, D.; Fawzi, A.; Chong, V.; Nguyen, Q.D.; Sepah, Y.; Pearce, E. Optical coherence tomography angiography in diabetic retinopathy. Prog. Retin. Eye Res. 2023, 97, 101206. [Google Scholar] [CrossRef]
- Abràmoff, M.D.; Reinhardt, J.M.; Russell, S.R.; Folk, J.C.; Mahajan, V.B.; Niemeijer, M.; Quellec, G. Automated Early Detection of Diabetic Retinopathy. Ophthalmology 2010, 117, 1147–1154. [Google Scholar] [CrossRef]
- Padmapriya, M.; Pasupathy, S.; Punitha, V. Early diagnosis of diabetic retinopathy using unsupervised learning. Soft Comput. 2023, 27, 9093–9104. [Google Scholar] [CrossRef]
- Wang, Z.; Li, Z.; Li, K.; Mu, S.; Zhou, X.; Di, Y. Performance of artificial intelligence in diabetic retinopathy screening: A systematic review and meta-analysis of prospective studies. Front. Endocrinol. 2023, 14, 1197783. [Google Scholar] [CrossRef] [PubMed]
- Barakat, A.A.; Mobarak, O.; Javaid, H.A.; Awad, M.R.; Hamweyah, K.; Ouban, A.; Al-Hazzaa, S.A.F. The application of artificial intelligence in diabetic retinopathy screening: A Saudi Arabian perspective. Front. Med. 2023, 10, 1303300. [Google Scholar] [CrossRef] [PubMed]
- Poly, T.N.; Islam, M.M.; Walther, B.A.; Lin, M.C.; Li, Y.J. Artificial intelligence in diabetic retinopathy: Bibliometric analysis. Comput. Methods Programs Biomed. 2023, 231, 107358. [Google Scholar] [CrossRef] [PubMed]
- Noriega, A.; Meizner, D.; Camacho, D.; Enciso, J.; Quiroz-Mercado, H.; Morales-Canton, V.; Almaatouq, A.; Pentland, A. Screening Diabetic Retinopathy Using an Automated Retinal Image Analysis System in Mexico: Independent and Assistive use Cases. medRxiv 2020. [Google Scholar] [CrossRef]
- Das, D.; Das, S.; Biswas, S.K.; Purkayastha, B. Deep Diabetic Retinopathy Feature eXtraction and Random Forest based ensemble Classification System (DDRFXRFCS). In Proceedings of the 2021 Asian Conference on Innovation in Technology (ASIANCON), Pune, India, 27–29 August 2021; pp. 1–7. [Google Scholar] [CrossRef]
- Uppamma, P.; Bhattacharya, S. A multidomain bio-inspired feature extraction and selection model for diabetic retinopathy severity classification: An ensemble learning approach. Sci. Rep. 2023, 13, 18572. [Google Scholar] [CrossRef]
- Usman, T.M.; Saheed, Y.K.; Ignace, D.; Nsang, A. Diabetic retinopathy detection using principal component analysis multi-label feature extraction and classification. Int. J. Cogn. Comput. Eng. 2023, 4, 78–88. [Google Scholar] [CrossRef]
- de Sousa, T.F.; Camilo, C.G. HDeep: Hierarchical Deep Learning Combination for Detection of Diabetic Retinopathy. Procedia Comput. Sci. 2023, 222, 425–434. [Google Scholar] [CrossRef]
- Tajudin, N.M.A.; Kipli, K.; Mahmood, M.H.; Lim, L.T.; Awang Mat, D.A.; Sapawi, R.; Sahari, S.K.; Lias, K.; Jali, S.K.; Hoque, M.E. Deep learning in the grading of diabetic retinopathy: A review. IET Comput. Vis. 2022, 16, 667–682. [Google Scholar] [CrossRef]
- Shen, Z.; Wu, Q.; Wang, Z.; Chen, G.; Lin, B. Diabetic Retinopathy Prediction by Ensemble Learning Based on Biochemical and Physical Data. Sensors 2021, 21, 3663. [Google Scholar] [CrossRef]
- Reddy, G.T.; Bhattacharya, S.; Siva Ramakrishnan, S.; Chowdhary, C.L.; Hakak, S.; Kaluri, R.; Praveen Kumar Reddy, M. An Ensemble based Machine Learning model for Diabetic Retinopathy Classification. In Proceedings of the 2020 International Conference on Emerging Trends in Information Technology and Engineering (ic-ETITE), Vellore, India, 24–25 February 2020; pp. 1–6. [Google Scholar] [CrossRef]
- Quellec, G.; Al Hajj, H.; Lamard, M.; Conze, P.H.; Massin, P.; Cochener, B. ExplAIn: Explanatory artificial intelligence for diabetic retinopathy diagnosis. Med. Image Anal. 2021, 72, 102118. [Google Scholar] [CrossRef]
- Obayya, M.; Nemri, N.; Nour, M.K.; Al Duhayyim, M.; Mohsen, H.; Rizwanullah, M.; Sarwar Zamani, A.; Motwakel, A. Explainable Artificial Intelligence Enabled TeleOphthalmology for Diabetic Retinopathy Grading and Classification. Appl. Sci. 2022, 12, 8749. [Google Scholar] [CrossRef]
- Shorfuzzaman, M.; Hossain, M.S.; El Saddik, A. An Explainable Deep Learning Ensemble Model for Robust Diagnosis of Diabetic Retinopathy Grading. ACM Trans. Multimed. Comput. Commun. Appl. 2021, 17, 1–14. [Google Scholar] [CrossRef]
- Lin, W.C.; Chen, J.S.; Chiang, M.F.; Hribar, M.R. Applications of Artificial Intelligence to Electronic Health Record Data in Ophthalmology. Transl. Vis. Sci. Technol. 2020, 9, 13. [Google Scholar] [CrossRef]
- Gupta, S.; Panwar, A.; Kapruwan, A.; Chaube, N.; Chauhan, M. Real Time Analysis of Diabetic Retinopathy Lesions by Employing Deep Learning and Machine Learning Algorithms using Color Fundus Data. In Proceedings of the 2022 International Conference on Innovative Trends in Information Technology (ICITIIT), Kottayam, India, 12–13 February 2022; pp. 1–5. [Google Scholar] [CrossRef]
- Ruamviboonsuk, P.; Tiwari, R.T.; Sayres, R.; Nganthavee, V.; Hemarat, K.; Kongprayoon, A.; Raman, R.; Levinstein, B.; Liu, Y.; Schaekermann, M.; et al. Real-time diabetic retinopathy screening by deep learning in a multisite national screening programme: A prospective interventional cohort study. Lancet Digit. Health 2022, 4, E235–E244. [Google Scholar] [CrossRef]
- Chollet, F. Xception: Deep learning with depthwise separable convolutions. In Proceedings of the IEEE Conference on Computer Vision and Pattern Recognition, Honolulu, HI, USA, 21–26 July 2017; pp. 1251–1258. [Google Scholar]
- He, K.; Zhang, X.; Ren, S.; Sun, J. Deep Residual Learning for Image Recognition. In Proceedings of the 2016 IEEE Conference on Computer Vision and Pattern Recognition (CVPR), Las Vegas, NV, USA, 27–30 June 2016; pp. 770–778. [Google Scholar] [CrossRef]
- Huang, G.; Liu, Z.; van der Maaten, L.; Weinberger, K.Q. Densely Connected Convolutional Networks. In Proceedings of the 2017 IEEE Conference on Computer Vision and Pattern Recognition (CVPR), Honolulu, HI, USA, 21–26 July 2017; pp. 2261–2269. [Google Scholar]
- Kumar, S. Diabetic Retinopathy Dataset. 2023. Available online: https://www.kaggle.com/datasets/way2tutorials/diabetic-retinopathy-dataset-2023 (accessed on 23 November 2024).
- Hana, F.; Maulida, I. Analysis of contrast limited adaptive histogram equalization (CLAHE) parameters on finger knuckle print identification. J. Phys. Conf. Ser. 2021, 1764, 012049. [Google Scholar] [CrossRef]
- Hanley, J.A.; McNeil, B.J. The meaning and use of the area under a receiver operating characteristic (ROC) curve. Radiology 1982, 143, 29–36. [Google Scholar] [CrossRef]
- Mustapha, A.; Mohamed, L.; Ali, K. Comparative study of optimization techniques in deep learning: Application in the ophthalmology field. J. Phys. Conf. Ser. 2021, 1743, 012002. [Google Scholar] [CrossRef]


| Case | Learning Rate | Dropout Layer | Input Resolution | Optimizer |
|---|---|---|---|---|
| (a) | 0.001 | 0.4 | (299, 299, 3), (299, 299, 3), (224, 224, 3) | Adam |
| (b) | 0.001 | 0.4 | (299, 299, 3), (299, 299, 3), (224, 224, 3) | Adagrad |
| (c) | 0.001 | 0.4 | (299, 299, 3), (299, 299, 3), (224, 224, 3) | SGD |
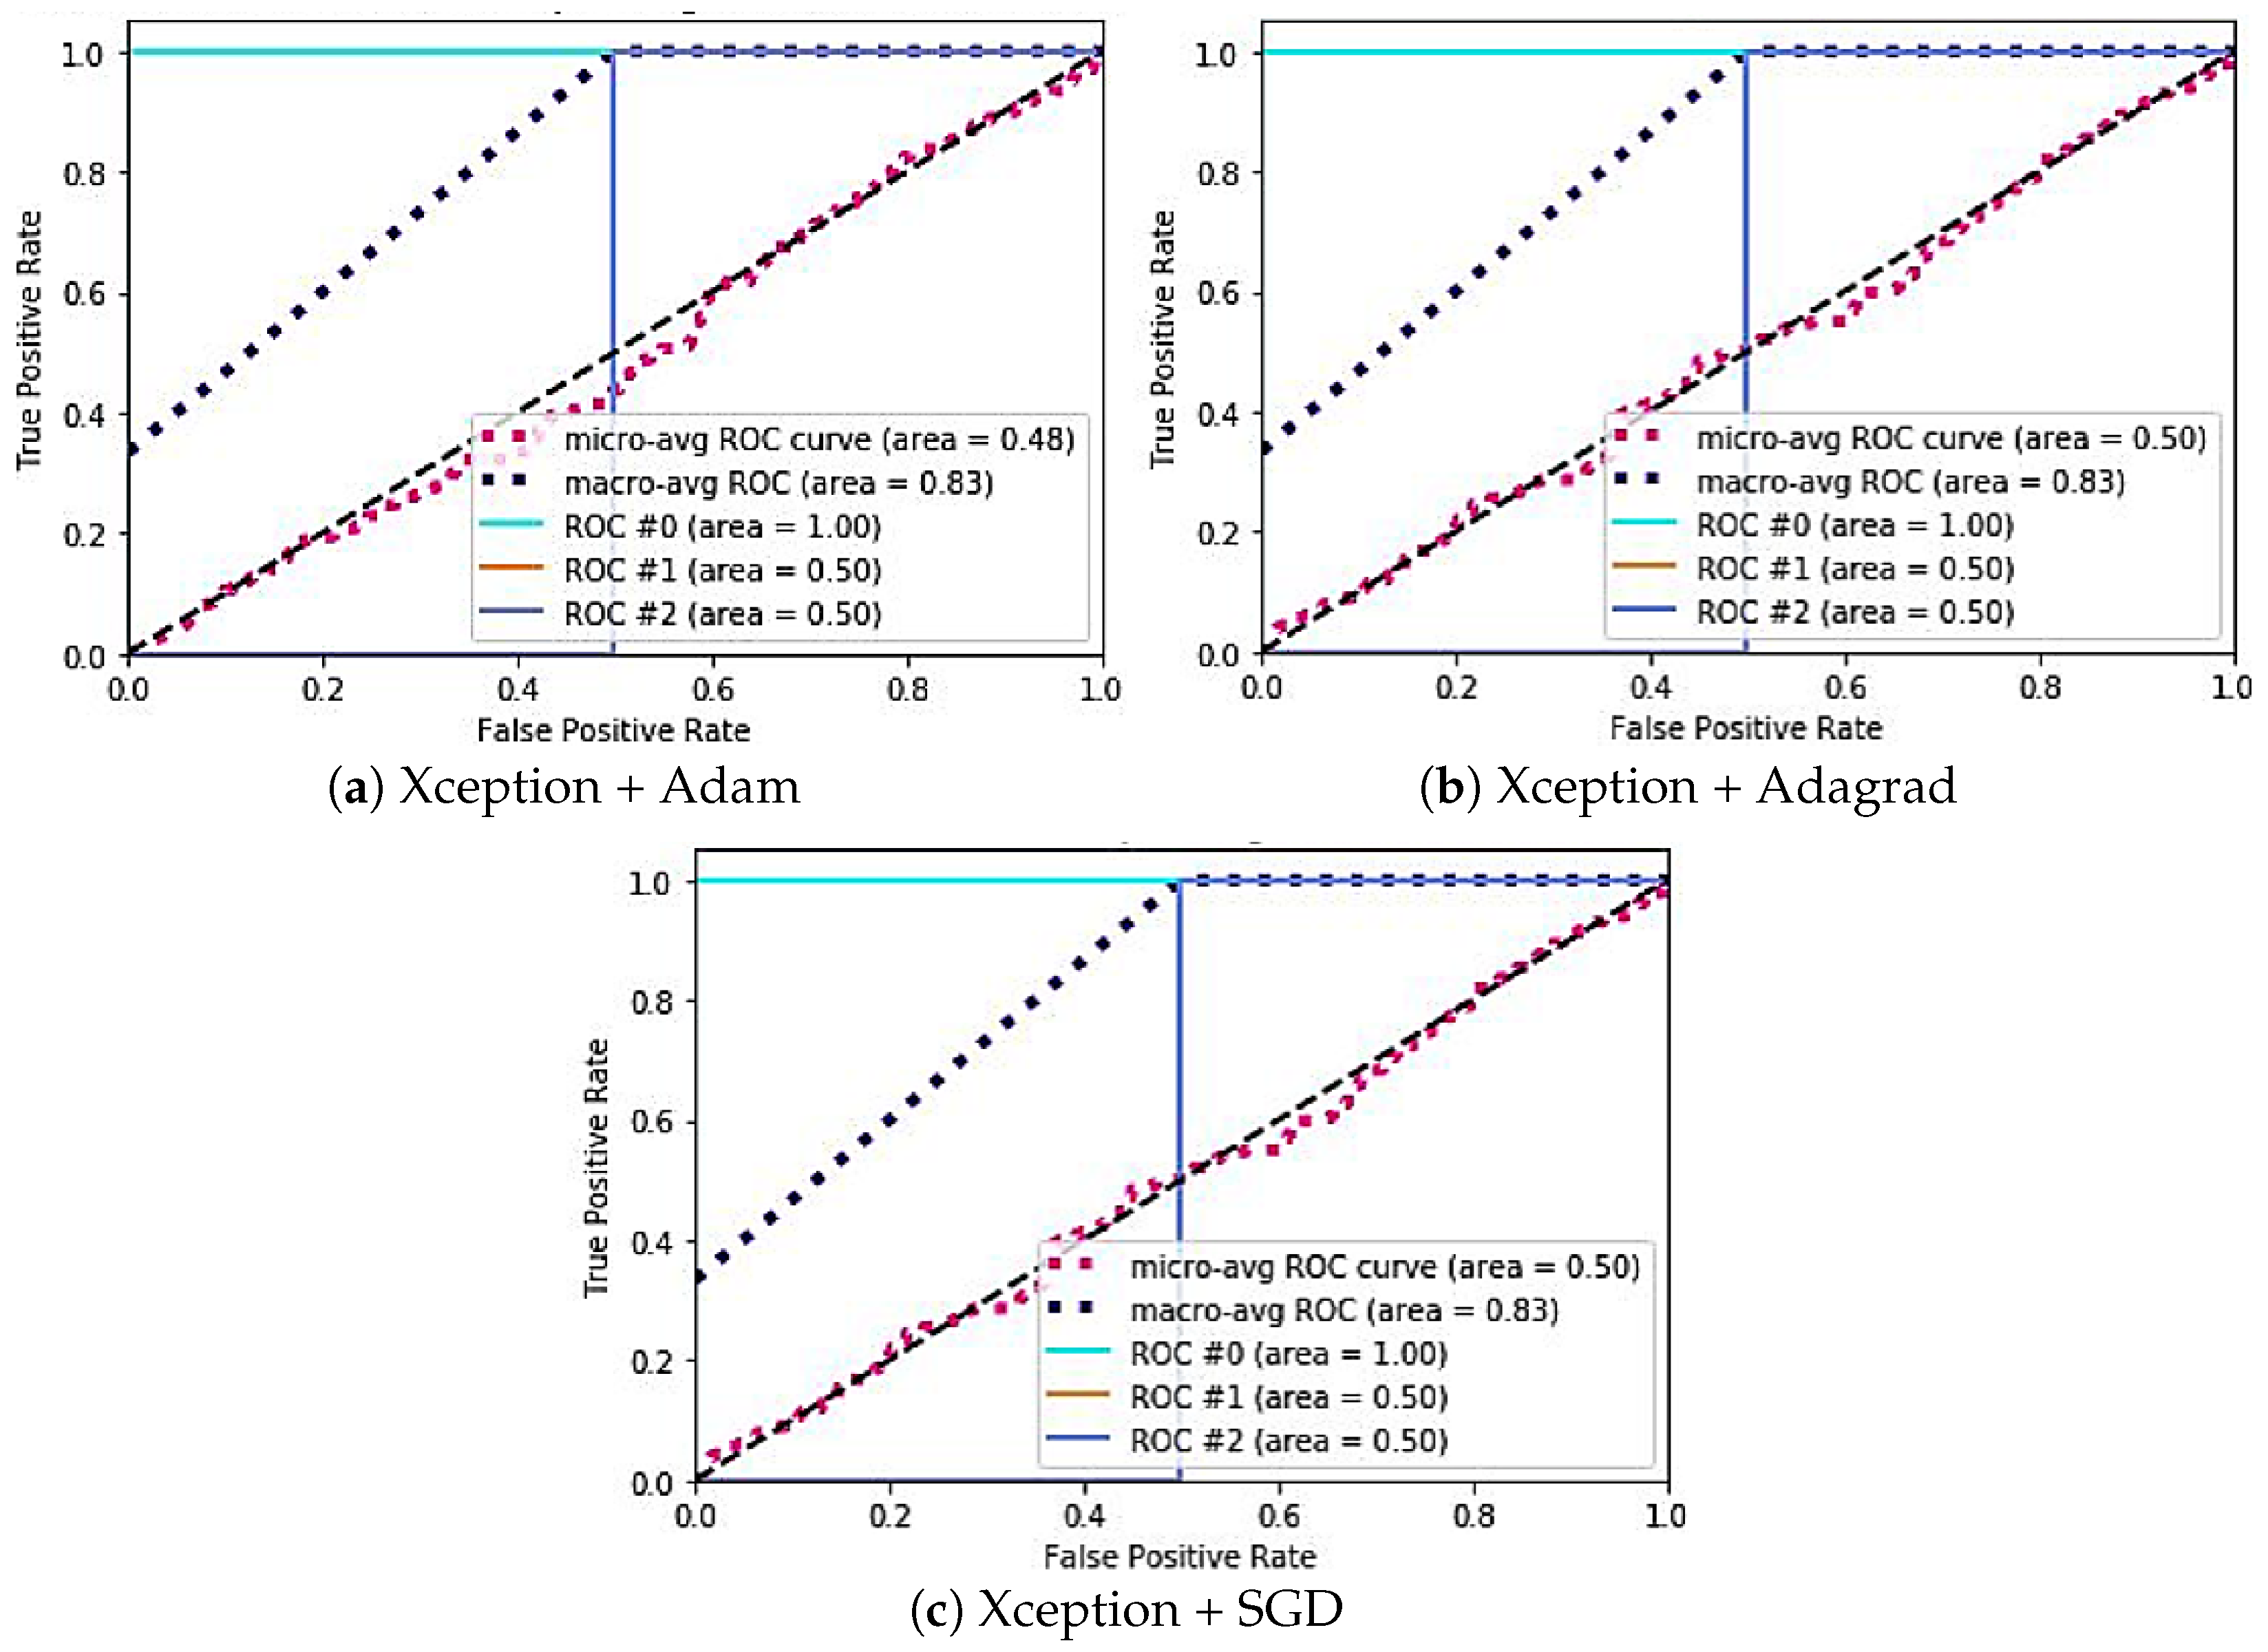
| Model | Case | Specificity | Sensitivity | AUC ROC |
|---|---|---|---|---|
| Xception | (a) | #0: 0.88 | #0: 0.33 | #0: 1 |
| #1: 1.54 | #1: 0.24 | #1: 0.50 | ||
| #2: 0.66 | #2: 0.39 | #2: 0.50 | ||
| (b) | #0: 0.79 | #0: 0.35 | #0: 1 | |
| #1: 0.85 | #1: 0.33 | #1: 0.50 | ||
| #2: 1.10 | #2: 0.24 | #2: 0.50 | ||
| (c) | #0: 1.0 | #0: 0.33 | #0: 0 | |
| #1: 0.9 | #1: 0.45 | #1: 0 | ||
| #2: 1.51 | #2: 0.29 | #2: 1 | ||
| Inception-Resnetv2 | (a) | #0: 2.5 | #0: 0.18 | #0: 0.50 |
| #1: 0.36 | #1: 0.50 | #1: 0 | ||
| #2: 1.13 | #2: 0.26 | #2: 0.50 | ||
| (b) | #0: 0.96 | #0: 0.38 | #0: 0 | |
| #1: 1.02 | #1: 0.38 | #1: 1 | ||
| #2: 1.30 | #2: 0.29 | #2: 0.5 | ||
| (c) | #0: 0.90 | #0: 0.39 | #0: 0 | |
| #1: 1.12 | #1: 0.32 | #1: 0 | ||
| #2: 1.12 | #2: 0.32 | #2: 0 | ||
| DenseNet | (a) | #0: 0.88 | #0: 0.41 | #0: 0 |
| #1: 1.33 | #1: 0.36 | #1: 0 | ||
| #2: 1.41 | #2: 0.33 | #2: 0 | ||
| (b) | #0: 0.57 | #0: 0.44 | #0: 1 | |
| #1: 1.54 | #1: 0.25 | #1: 0.50 | ||
| #2: 1.46 | #2: 0.31 | #2: 1 | ||
| (c) | #0: 0.46 | #0: 0.47 | #0: 1 | |
| #1: 1.51 | #1: 0.20 | #1: 0 | ||
| #2: 1.39 | #2: 0.26 | #2: 1 |
| Statistical Test | p-Value |
|---|---|
| t-test (Xception vs. DenseNet201) | 0.02 |
| t-test (Inception-ResNet V2 vs. DenseNet201) | 0.01 |
| Wilcoxon test (Xception vs. DenseNet201) | 0.03 |
| Wilcoxon test (Inception-ResNet V2 vs. DenseNet201) | 0.02 |
Disclaimer/Publisher’s Note: The statements, opinions and data contained in all publications are solely those of the individual author(s) and contributor(s) and not of MDPI and/or the editor(s). MDPI and/or the editor(s) disclaim responsibility for any injury to people or property resulting from any ideas, methods, instructions or products referred to in the content. |
© 2025 by the authors. Licensee MDPI, Basel, Switzerland. This article is an open access article distributed under the terms and conditions of the Creative Commons Attribution (CC BY) license (https://creativecommons.org/licenses/by/4.0/).
Share and Cite
Sassi Hidri, M.; Hidri, A.; Alsaif, S.A.; Alahmari, M.; AlShehri, E. Optimal Convolutional Networks for Staging and Detecting of Diabetic Retinopathy. Information 2025, 16, 221. https://doi.org/10.3390/info16030221
Sassi Hidri M, Hidri A, Alsaif SA, Alahmari M, AlShehri E. Optimal Convolutional Networks for Staging and Detecting of Diabetic Retinopathy. Information. 2025; 16(3):221. https://doi.org/10.3390/info16030221
Chicago/Turabian StyleSassi Hidri, Minyar, Adel Hidri, Suleiman Ali Alsaif, Muteeb Alahmari, and Eman AlShehri. 2025. "Optimal Convolutional Networks for Staging and Detecting of Diabetic Retinopathy" Information 16, no. 3: 221. https://doi.org/10.3390/info16030221
APA StyleSassi Hidri, M., Hidri, A., Alsaif, S. A., Alahmari, M., & AlShehri, E. (2025). Optimal Convolutional Networks for Staging and Detecting of Diabetic Retinopathy. Information, 16(3), 221. https://doi.org/10.3390/info16030221