Article

A Data-Driven Assessment of Redesign Initiatives in Financial Management Processes

by
George Tsakalidis
and
Kostas Vergidis
*
Department of Applied Informatics, University of Macedonia, 54636 Thessaloniki, Greece
*
Author to whom correspondence should be addressed.
Information 2025, 16(3), 179; https://doi.org/10.3390/info16030179
Submission received: 22 January 2025 / Revised: 22 February 2025 / Accepted: 24 February 2025 / Published: 26 February 2025
(This article belongs to the Special Issue Feature Papers in Information in 2024–2025)

Abstract

:
Business Process Redesign (BPR) is a fundamental approach to enhancing efficiency, compliance, and digital transformation in public sector operations. Despite extensive theoretical advancements, its application in real-world settings remains limited. This study addresses this gap by applying the BPR Assessment Framework to business processes within the Greek Public Financial Management (PFM) domain, specifically analyzing workflows from the Greek Customs Service and the Financial and Economic Crime Unit (S.D.O.E.). This research employs a structured methodology that integrates internal process metrics with clustering techniques to systematically classify processes based on their redesign potential. The findings reveal that a significant proportion of public sector workflows demonstrate high redesign capacity, highlighting opportunities for efficiency gains and improved regulatory compliance. Furthermore, this study identifies key challenges, such as organizational resistance and technological constraints, that impact BPR implementation. By demonstrating the framework’s applicability in a complex, operational environment, this study provides actionable insights for policymakers and practitioners. Specifically, the results show how structured process evaluation enables targeted redesign initiatives that streamline administrative workflows, enhance compliance with financial regulations, and support digital transformation in public administration. These insights contribute to advancing BPR practices by bridging the gap between theoretical development and real-world application, offering a replicable methodology for improving public sector efficiency.

Graphical Abstract

1. Introduction

The ever-increasing demand for organizations to adapt to volatile and competitive environments has made the design and management of business processes (BPs) a critical factor for sustained success [1]. Business Process Redesign (BPR) has emerged as a key approach for enhancing organizational performance, enabling reductions in cost and time, improving quality and efficiency, and addressing the continuous evolution of operational requirements [2]. Despite its potential, most BPR efforts are conducted reactively, at runtime, based on post-implementation analysis. This limits organizations’ ability to evaluate and systematically apply redesign strategies during the design phase, where decisions have a more significant impact and are less costly to implement.
To address these challenges, the BPR Assessment Framework [3] was developed as a structured methodology to evaluate the redesign capacity of BP models systematically. By introducing and operationalizing the concept of “model plasticity”, [4] the framework aims to measure the feasibility and effectiveness of applying BPR heuristics at design time. It provides a systematic approach to classify BPs based on internal and external quality metrics, thereby aiding practitioners in identifying candidate processes for redesign. This research builds upon the foundational work that introduced and demonstrated the framework using a repository of pre-existing BP models. While these efforts showcased the framework’s potential, the testing was confined to controlled conditions with repository-based models. The current study shifts focus toward exploring the framework’s applicability in real-world settings, specifically within the context of Greek Public Financial Management (PFM). By applying the framework to real-life processes, this study aims to emphasize its practical usability, challenges, and potential contributions to operational efficiency and digital transformation efforts. To this end, this research addresses the following question:
RQ: “How can a structured framework systematically assess and categorize business processes in public financial management to guide effective redesign initiatives?”.
This question frames this study’s methodological approach and highlights its contribution to both research and practice. The processes analyzed in this research originate from the Customs Service and the Financial and Economic Crime Unit (S.D.O.E.) of the Greek Ministry of Finance. These processes represent critical operational workflows that directly impact public sector efficiency and compliance. Through a series of analyses, this work categorizes processes by their plasticity and external quality, providing actionable insights for practitioners.
By bridging the gap between conceptual framework development and real-world application, this research contributes to advancing the discourse on systematic BPR methodologies. It highlights the significance of pre-implementation analysis and offers valuable perspectives for practitioners and researchers seeking to integrate BPR into dynamic and complex organizational environments.

2. Related Work

It is evident in the literature that Business Process Management (BPM) offers a multitude of methods used when improving BPs [5,6]. What is also apparent is that the margins of these disciplines are, in many cases, not clear, a fact that begets an overlap between them. Based on the work in [7], the different BP Change (BPC) disciplines and methods are categorized based on the level of change, i.e., from incremental (evolutionary) to radical (revolutionary) change. In the categorization of the BPC disciplines, the most radical change is described as BP Reengineering. This discipline is synonymous with BP Innovation and BP Transformation (BPT), all of which are used to describe projects that are radical, revolutionary, and one-time undertakings [8]. On the other hand, disciplines like BP Optimization, Refactoring, and Adaptation refer to more incremental changes. According to Dumas et al. [9], BPR has remained on the agenda of many organizations, although overhyped, criticized, and, many times, rebranded. The simple reason is that it is considered a powerful discipline to boost business performance and raise the satisfaction of customers.
BPR is the most common approach to BP optimization and forms an essential part of a BPM lifecycle [10,11]. Its purpose is to continuously refine the BP in terms of its non-functional requirements, e.g., operating faster and/or with less cost. The need for process refinement stems from the need to (i) cope with the continuously evolving internal and external setting in which an organization operates and (ii) keep pace with the changing end-user requirements [12]. The field of BPR has its roots in the seminal work of [13], who introduced the concept as a radical rethinking and redesign of BPs to achieve dramatic improvements in performance. This vision of transformative change emphasized the need for organizations to rethink how work is performed to optimize outcomes in cost, speed, quality, and service. Although BPR was initially perceived as a purely transformational discipline through the advent of Reengineering, over time transactional redesign methods became more prevalent and more popular than the revolutionary approaches [14]. In this sense, Davenport [15] expanded on the concept by integrating principles of incremental improvement and systematic analysis, paving the way for a broader adoption of BPR methodologies. Over the years, numerous methodologies have emerged to support BPR efforts. Early frameworks primarily focused on qualitative assessments, leveraging managerial insights to guide process redesign decisions [16,17]. However, as organizations increasingly sought data-driven approaches, quantitative metrics for evaluating BPs gained prominence.
A recent Systematic Literature Review (SLR) by Tsakalidis and Vergidis [18] critically examined existing BPR evaluation methodologies prior to implementation, analyzing 32 evaluation artifacts across two dimensions: (a) type of evaluation (e.g., process performance, organizational aspects, model quality) and (b) generalizability of the approaches. The findings revealed that most existing methods focus on runtime evaluation (i.e., post-implementation assessment), with limited methodologies available for pre-implementation evaluation of a BP’s redesign potential. Several evaluation frameworks were identified, each addressing different aspects of BPR feasibility assessment: The KPI4BPI Approach [19] defines Key Performance Indicators (KPIs) within the process model to measure the success of BPR initiatives. However, it focuses primarily on performance indicators such as time and cost but does not assess structural complexity or redesign feasibility before implementation. The IBUPROFEN Framework [20] applies refactoring techniques to improve BPMN model quality, measuring understandability and modifiability. While this ensures models are well-structured for redesign, the framework does not assess whether a given process is actually a good candidate for BPR. The Process Performance Indicators (PPIs) Framework [21] assesses process quality in terms of time, cost, flexibility, and standardization. However, it assumes that redesign has already been initiated and lacks a method for pre-selecting which processes should undergo BPR. The BP-RCA Framework [22] evaluates the redesign capacity of a BP model by considering available redesign techniques, process complexity, and applicable redesign heuristics. This framework introduces a more structured assessment methodology for determining redesign feasibility before execution. The Process Redesign Framework (PRF) [23] focuses on defining a standardized process model based on performance attributes such as effort time and calendar time. While useful for benchmarking, it does not integrate heuristic-based redesign assessment. The BPMIMA Framework [24] combines empirical quality measures with validated thresholds to evaluate redesign feasibility. However, it does not fully account for organizational constraints or the strategic feasibility of BPR. Mohapatra’s BP Selection Model [25] emphasizes defining business vision and objectives to determine redesign priorities. This aligns well with strategic decision-making but lacks a structured quantitative evaluation of process complexity and redesign potential. The Khan–Hassan-Butt (KHB) Method [26] identifies process interdependencies and uses them as decision-making tools to increase productivity. However, it does not offer a granular assessment of BPR feasibility at the process model level. Despite the variety of approaches, none of these methodologies provide a fully systematic, pre-implementation assessment that combines process complexity evaluation, redesign feasibility, and heuristic applicability. This research gap underscores the need for structured, pre-implementation evaluation methodologies that integrate process complexity measures and heuristic-based feasibility assessments to better guide BPR decision-making before execution.
A significant shift occurred with the introduction of quantitative measures for pre-implementation analysis. Sánchez-González et al. [27] and Zur Muehlen and Ho [28] highlighted the importance of structural complexity, modifiability, and flexibility in determining a process’s redesign potential. These metrics, such as modularity and control flow complexity, provided a foundation for evaluating processes systematically. More recently, the concept of “model plasticity” has emerged [4], emphasizing the adaptability of process models to structural changes without compromising functional integrity. Model plasticity synthesizes prior work on complexity and flexibility, offering a holistic measure for assessing redesign feasibility. The advent of computational techniques further enhanced the field, with clustering algorithms playing a central role in modern BPR methodologies [29,30]. Clustering, particularly K-means, enables the categorization of processes based on similarity in their structural metrics, allowing organizations to prioritize redesign efforts effectively [31]. For instance, repositories such as the SOA-based BP Database have been utilized in research to demonstrate the utility of clustering in evaluating and grouping processes by redesign potential. These efforts demonstrated the value of clustering in identifying high-priority processes and provided insights into patterns that might not be evident through qualitative assessments alone.
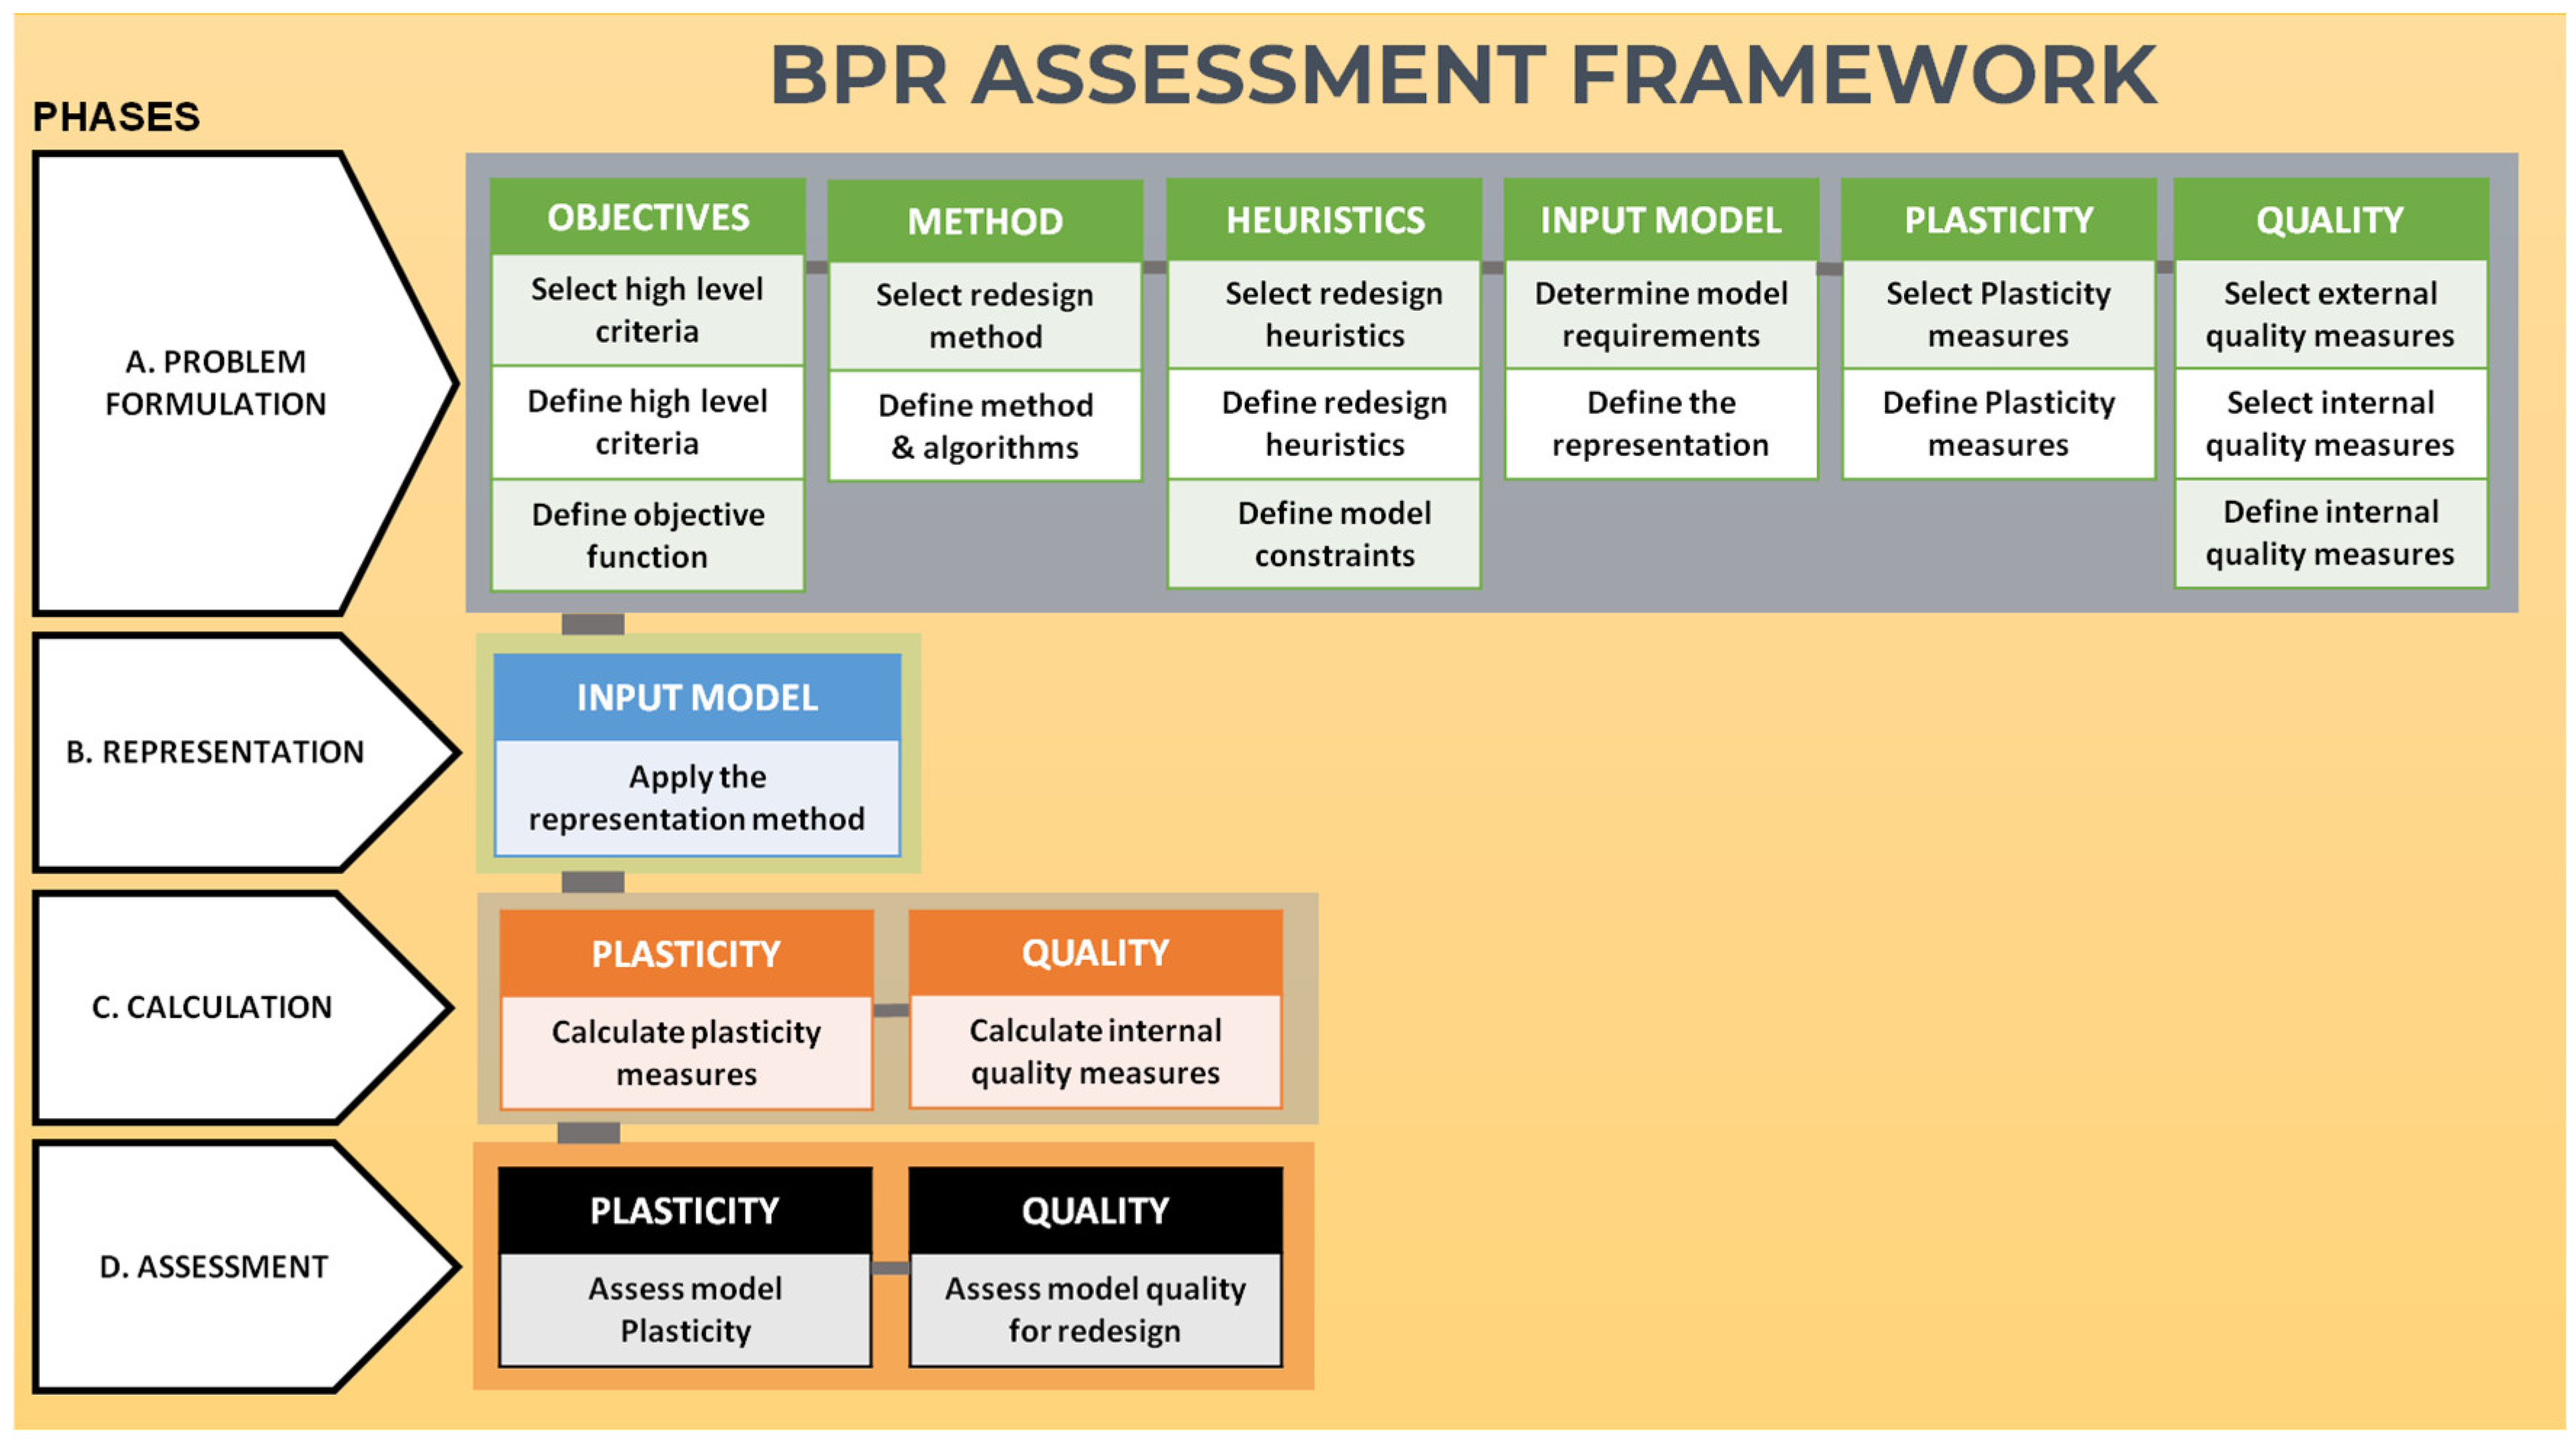
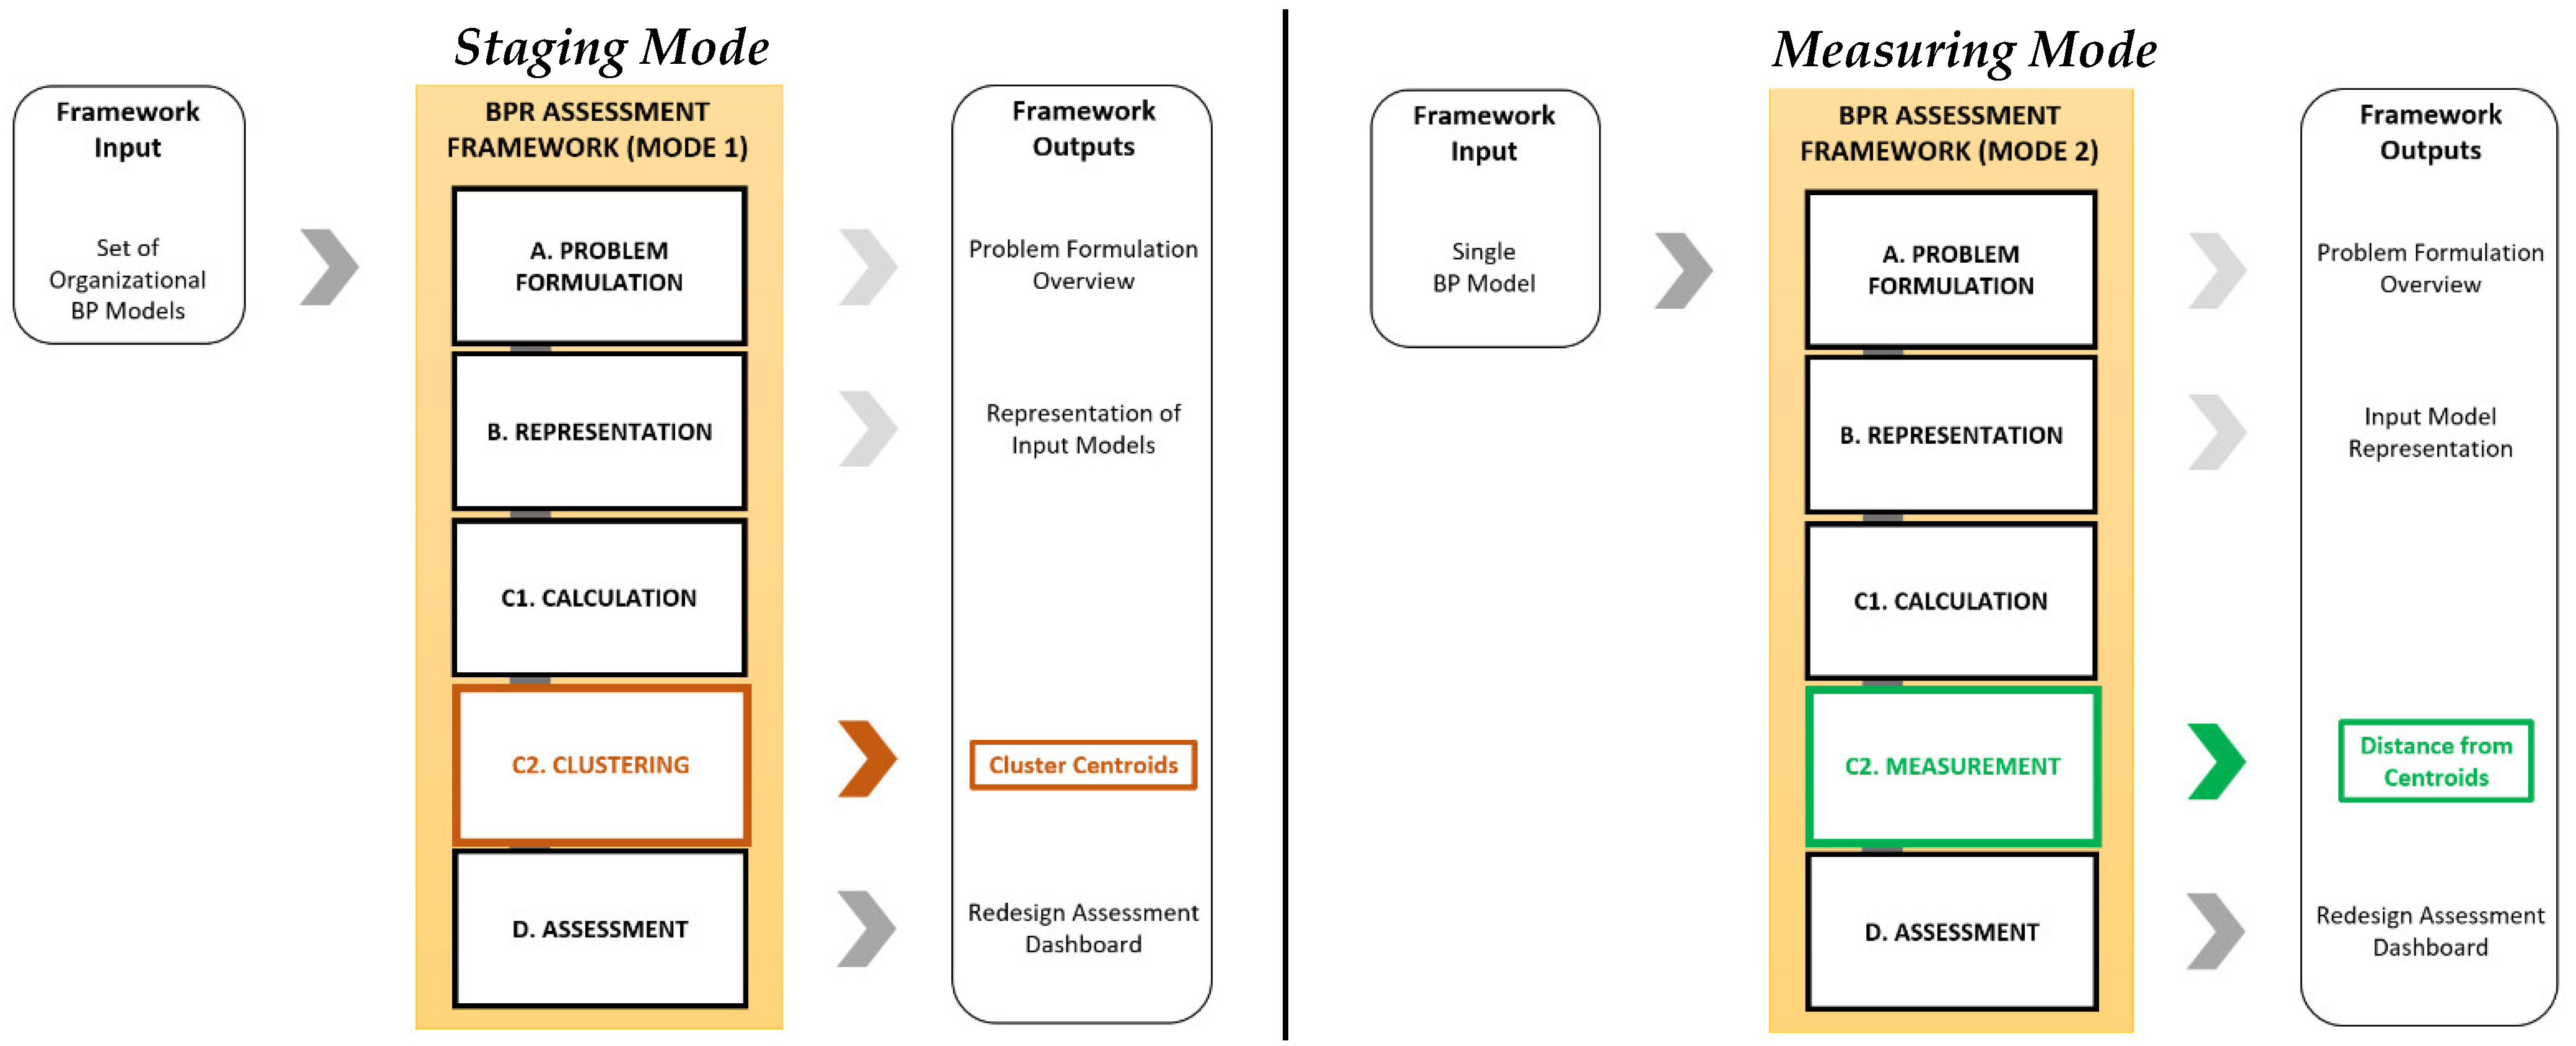
The BPR Assessment Framework [3] builds on this lineage by integrating robust metric-based evaluations with clustering techniques. Earlier studies applying the framework demonstrated its effectiveness in controlled environments, where pre-existing repositories of process models were used to test its theoretical underpinnings. These applications confirmed the framework’s capacity to classify processes into Low, Moderate, and High redesign capacity, linking structural characteristics to practical decision-making. However, much of the existing research has been conducted in controlled settings, limiting its applicability to real-world scenarios [32]. While controlled environments are valuable for refining methodologies and testing theoretical assumptions, they often fail to capture the complexities and constraints inherent in operational settings. For example, organizational culture, regulatory compliance, and resource limitations are factors that can critically influence the success of BPR initiatives but are rarely accounted for in theoretical models [33]. This gap underscores the need for research that bridges the divide between theoretical development and practical application. Real-life testing of BPR frameworks, particularly in complex domains such as PFM, offers a unique opportunity to validate their utility and address challenges that arise in operational contexts [21,34]. By applying the BPR Assessment Framework to real-life processes in the PFM domain, this study aims to extend its applicability beyond controlled settings and explore its practical relevance in achieving efficiency, compliance, and standardization in public sector workflows.

3. Methodology

This section outlines the step-by-step approach used to apply the BPR Assessment Framework to real-life processes within the PFM context. The methodology ensures a comprehensive and systematic evaluation while tailoring the framework’s application to meet the unique requirements of public sector workflows. This study follows a structured, framework-driven approach to evaluating BPs in PFM. Rather than conducting hypothesis-driven statistical testing, we apply the BPR Assessment Framework to real-life workflows to demonstrate its applicability and practical insights. The focus is on systematically categorizing processes based on their redesign potential using predefined metrics and clustering techniques. While quantitative validation through hypothesis testing could be a valuable extension, the current study aims to establish a methodological foundation for future empirical research.
  • Overview of the Framework: The BPR Assessment Framework combines process measurement techniques with clustering methods to categorize processes based on their redesign capacity. The framework’s main phases include problem formulation, metric calculation, clustering, and practical evaluation. A schematic representation of the framework (Figure 1) is provided to offer a clear visualization of its components and interactions.
  • Selection of Input Models: The input models for this study were derived from operational processes documented within the Customs Service and the S.D.O.E. Agency of the Greek Ministry of Finance. These processes were modeled using the BPMN 2.0 standard to ensure interoperability and adherence to widely accepted modeling practices. Selection criteria focused on diversity in process complexity, relevance to public sector objectives, and the availability of detailed process documentation. The selected processes include routine administrative workflows and specialized investigative tasks, representing a broad spectrum of operational activities.
  • Metric Calculation: The evaluation of each process model involved calculating a set of predefined internal and external quality metrics. Internal metrics, such as Degree of Activity Flexibility (DoAF), Control Flow Complexity (CFC), and Token Split (TS), were used to assess model plasticity. External quality metrics included measures of modifiability and correctness, providing insights into the practical feasibility of process redesign. These metrics were computed using standardized formulas to ensure consistency and comparability with previous studies.
  • Clustering and Categorization: The calculated metrics were used as inputs for a clustering analysis, enabling the categorization of processes into groups based on their redesign potential. The K-means clustering algorithm was selected for its effectiveness in grouping data based on similarity [35]. The number of clusters was pre-defined to represent Low, Moderate, and High redesign capacity. Cluster centroids were analyzed to identify representative processes within each category, facilitating targeted recommendations for redesign.
  • Practical Evaluation: Representative processes from each cluster were subjected to a detailed practical evaluation to validate the clustering results and assess the framework’s applicability. This step involved examining the feasibility of redesigning these processes and identifying potential improvements in efficiency, compliance, and resource utilization. The practical evaluation provided actionable insights into the benefits and challenges associated with applying the framework in real-world settings.
  • Analysis and Reporting: The results of the clustering and practical evaluation phases were synthesized to identify trends and key findings. This analysis highlighted the relationship between process complexity and redesign feasibility, offering valuable guidance for public sector practitioners seeking to implement BPR initiatives.
The BPR Assessment Framework operates in two distinct modes (Figure 2) to address different organizational needs:
  • Staging Mode: Regarding the first Staging Mode, the framework is operated for a large set or library of organizational BPs and involves the implementation of a clustering method after the calculation phase to characterize BPs based on their similarity. In this case, the similarity refers to their ability to be redesigned, as presented in this thesis. The method, initially introduced in [31] and further applied in [36], contributes towards indicating which of the BP models should be selected for BPR based on the calculated values of the internal measures. Using clustering techniques, processes are grouped into categories (Low, Moderate, and High redesign capacity) based on their internal and external quality metrics. Staging Mode is particularly beneficial for organizations seeking to prioritize redesign efforts across a portfolio of processes.
  • Measuring Mode: The second Measuring Mode requires the previous Staging Mode since the assessment of unique BP models is based on measuring the proximity (Euclidean distance) of each model from the previously extracted cluster centroids. After measuring the Euclidean distance, the input model is classified according to the corresponding plasticity and external quality, providing the practitioner with the necessary information for deciding on the BPR application. In this chapter, the author initially operates the first Staging Mode of the BPR Assessment framework by applying cluster analysis to a repository of BPs from the literature and creating clusters that refer to model sets with varying BPR capacity. Right after that, the Measuring Mode is operated to demonstrate how the proximity of single models is measured to categorize their BPR capacity. This allows practitioners to make informed decisions about the redesign feasibility of a specific process, leveraging insights from the broader process landscape.

4. Application

The application of the BPR Assessment Framework within the PFM domain represents a critical step in exploring its practical utility. By systematically applying the framework to real-life processes, this study examines its ability to provide actionable insights for redesign initiatives in the public sector. This section describes the implementation of the framework, detailing how the selected processes were analyzed and the complexity metrics were calculated.

4.1. Selection of Input Models

The selected BP models derive from the official documentation of the Greek Customs Service and from the applied investigation processes of the S.D.O.E. agency of the Greek Ministry of Finance. The BPs were created by the authors in collaboration with MSc students. They were modeled in the BPMN 2.0 standard with the SAP Signavio Process Manager, and they are publicly available at the following link: https://drive.google.com/drive/folders/1WYr_k6RCWRgDtR5fQF4gkU3C9irOT0j6 (accessed on 21 January 2025).

4.1.1. Benefits from Adopting BPs in Greek PFM

The application of real-life BPs provides a multitude of benefits for agencies, their employees, and investigators [37]. The act of modeling and applying BPs is a typical example of digital transformation [38] in the Greek PFM since it fulfills (a) the need for compliance with the Digital Transformation Strategy 2020–2025 of Greece, (b) the obligation of public agencies to index their administrative processes to the National Process Registry (Law N.4727/2020), and, most importantly, (c) the need to standardize the administrative and investigation processes of the agencies and to enhance the efficiency and situational awareness of the ones that are tasked with this authority. The employees and investigators become accustomed to the different scenarios that can emerge, they know beforehand which official documents to complete, and they are aware of the applying laws and rules. By using the processes, they examine more cases in the same time periods, a fact that has provably reduced the operating expenses of the agency, both monetary and in human resources. Lastly, the principal advantage of the BPMN processes is that they can be readily applied by (a) the employees of all Customs Service Agencies and (b) the investigators of the Operational Directorate S.D.O.E. of Attica and other Law Enforcement Agencies that have the same authority.

4.1.2. Customs Service—General Directorate of Customs and Excise Duty

The General Directorate of Customs and Excise Duty with its executive Customs Directorates and its Special Decentralized and Regional Customs Authorities constitute a set of institutional units of the Greek Ministry of Finance that form the Customs Service [39]. The A.A.D.E. authority issued an official report in November 2020 under the title “Manual of selected operational processes of the General Directorate of Customs and Excise Duty of A.A.D.E.” (Available in http://elib.aade.gr/elib/view?d=/gr/egk/2020/D__ORG__G_1137484_EKs_2020/, accessed on 21 January 2025). The report aimed to provide a set of optimal practices to the customs employees and officials aimed towards amplifying public benefit and improving the quality of services to citizens and companies. The manual consisted of detailed documentation of sixty operational BPs that were identified and recorded for the first time by the A.A.D.E. authority (further details in Supplementary Materials).

4.1.3. S.D.O.E.—Greek Ministry of Finance

The Financial and Economic Crime Unit (S.D.O.E.) serves as the primary law enforcement agency under the Ministry of Finance, tasked with combating financial crime and corruption. One of the authors of this study, as a financial crime investigator within S.D.O.E., has modeled key investigative processes using the BPMN 2.0 standard with SAP Signavio Process Manager. These processes, focusing on intellectual property rights infringements and cyber-related offenses, are included in the framework’s analysis (see Supplementary Materials). This real-life application emphasizes the role of systematic process modeling in improving investigative efficiency and compliance.

4.2. Calculation of Internal Measures

This step involves the calculation of the internal measures for the sixty-four real-life BPs. In particular, the authors have already selected the DoAF, Ξ, CLA, CFC, NOA, NSFA, NSFG, NoAJS, TNG, and TS for predicting the plasticity of input models and GM, GH, AGD, and MGD for Modifiability and Correctness. This selection is justified in prior research work [3,36,40]. Prior to the calculation of these metrics, the input models have been represented during the Representation phase (see Figure 1) with the use of the BPD-Graph.
The values of the internal measures are presented in Table 1. The models’ size varies from 2 to 27 activities and from 0 to 23 gateway nodes. Given the observation that both process models in the literature and applied administrative processes in Greek PFM are, in general, from small to moderate in size, the experimental material has a sufficient variation in size. Their structural complexity also has a sufficient variation since there are models with from CFC = 0 to CFC = 26 and they are comprised of from 0 to 40 sequence flows from gateways. The values are rounded to three decimal places and their variability was also analyzed by considering the standard deviation (SD) of each metric. The results of the DOAF metric showed an SD close to zero (0.124), which indicates that the data points tend to be very close to the mean, which is also considered very low (0.162). This small variability indicates that most of the diagrams have a very low DOAF value ranging between 0.038 and 0.286.

5. Presentation of Findings

The authors use the cluster analysis evaluation method presented in [3] to group the BP models into categories, based on the metric values indicating plasticity and external quality. Since the number of clusters is meant to partition the BP models into categories of plasticity and quality, essentially representing the number of categories, that number is set to three (Low, Moderate, and High). Based on the number of instances in the dataset, more clusters would partition the models into very small groups that would not allow for trustworthy interpretation. Another significant parameter for centroid-based clustering methods is the proximity measure. Towards establishing similarity in a data set, a proximity (or distance) measure needs to be selected and formally defined before clustering. This step is fundamental as the lack of a properly defined proximity measure will render the cluster analysis incorrect or scientifically invaluable [41]. According to Amelio and Tagarelli [42], proximity measures are classified into two main categories, Euclidean and non-Euclidean measures. Euclidean measures are based on the concept of Euclidean space, which is defined by a set number of dimensions and “dense” points, while non-Euclidean measures take into consideration other properties of the data points and not the location of the points in space to establish similarity. In the clustering process of this research, the selected measure is Euclidean distance, which is a very popular method commonly used as the default distance metric for many cluster analysis tools [43]. Lastly, the K-means algorithm requires an initialization method to assign the first three centroid values. Random initialization, during which the initial centroids are randomly placed in the Euclidean space, is chosen, since during the experiments no need for a more sophisticated initialization method was revealed. The cluster analysis was performed separately for plasticity and external quality, by using the IBM SPSS Statistics 25.0 software.

5.1. Clustering of Input Models Based on Plasticity

The clustering of the set of sixty-four real-life BPs based on their plasticity revealed three discrete clusters—categories—of models. Convergence was achieved due to no change in cluster centers with a maximum absolute coordinate change for any center being zero after two iterations. Table 2 presents the final cluster centers for each of the selected internal measures and the Analysis of Variance (ANOVA) table, which shows how the sum of squares is distributed according to the source of variation, and hence the mean sum of squares. The F-value in the ANOVA is calculated as the fraction of the variation between sample means to the variation within the samples. As is evident, the F-values of the NSFA and DOAF metrics are very low (1.833 and 1.466), which indicates that these variables contribute the least to the cluster solution. This is also indicated by their large sig. values, 0.169 and 0.239, respectively, which are not close to the acceptable <0.05 significance level. On the other hand, CLA, NOAJS, NSFG, and TNG are the variables with large F values that provide the greatest separation between the three clusters.
Figure 3 presents a bar chart from the pivot table with the three clusters and an indication of their center values. What is evident is that, for almost all measures, cluster 2 refers to low values, cluster 3 to moderate values, and cluster 1 to high values.
As is presented in [3], the plasticity of models refers to the applicability of the RESEQ and PAR heuristics, and, based on the conducted experiments, there is a positive or negative correlation, as presented in Table 2. This correlation indicates that the applicability of RESEQ is more efficient for models with high values of Ξ, NOA, NSFA, CFC, and DOAF, and low CLA, while the applicability of PAR is more efficient for low values of TS, NSFG, NOAJS, TNG, CLA, and CFC and high NSFA. Since the metrics depicting plasticity are not contradicting in nature—except in the case of CFC—the authors assume that the correlation of the metrics with overall plasticity is the one presented in Table 2. Regarding CFC, a low value denotes a more efficient application of the PAR heuristic, while a high value denotes the high applicability of RESEQ.
By observing how each metric evolves between the three clusters and by considering the correlation of the metrics with the overall plasticity in Table 3, the authors assume that cluster 1 refers to the models with low plasticity, cluster 3 to the models with moderate plasticity, and cluster 2 to the models with high plasticity. This cluster sequence is confirmed by the fact that the correlation of all metrics is consistent, except for the NOA metric, as indicated in the last column of Table 3. In Table 3, the plus sign (+) denotes a positive correlation, the minus sign (−) a negative correlation and a shaded cell means that the metric has no correlation with either RESEQ or PAR.
According to the results, which are further presented in Table S3 (Cluster Membership) of the Supplementary Materials, most of the cases have the necessary capacity for BPR, and there is a high possibility that the application of RESEQ or PAR heuristics would be efficient. This entails that they are considered good candidate models for BPR, except for models 2.11, 1.3, 1.5, 1.12, 2.10, 2.16, 3.3, 3.8, 4.13, 5.1, 5.3, and 5.4, which have from low to moderate plasticity. The same procedure was followed for classifying the BP models according to their external quality.

5.2. Clustering of Input Models Based on External Quality

The clustering of the set of sixty-four real-life BPs based on their external quality also revealed three discrete clusters of models. Table 4 presents the final cluster centers for each of the selected internal measures and the ANOVA table. The F-values in the ANOVA indicate that all four metrics contributed to the cluster solution, where GM (108.517) had the biggest and GH (7.308) had the smallest contribution to the separation of the clusters. All sig. values are under the acceptable <0.05 significance level.
Figure 4 presents a bar chart from the pivot table with the three clusters and an indication of their center values. What is evident is that, for almost all measures, cluster 1 refers to low values, cluster 3 to moderate values, and cluster 2 to high values.
As presented in [27], the external quality measures of modifiability and correctness have a negative correlation to all four selected internal measures, namely, AGD, MGD, GH, and GM. This means that low metric values entail high modifiability and correctness. By observing how each metric evolves between the three clusters in Table 4 and by considering the negative correlation of the metrics with modifiability, correctness, and, therefore, external quality, the authors assume that cluster 2 refers to the models with low quality, cluster 3 to the models with moderate quality, and cluster 1 to the models with high quality. This cluster sequence is consistent with the correlation of AGD, MGD, and GH metrics, except for the GM metric, where it is not evident how the metric evolves between clusters. In total, it is observed that most of the process models are considered to have a high external quality for BPR since they are both easy to modify and have a low probability of containing semantic and syntactical errors. This fact renders them good candidates for BPR, except for the models labelled 3.8, 1.3, 2.5, 2.6, 2.11, 2.16, and 4.13, which have from low to moderate external quality.

6. Practical Evaluation of Models

This section presents the practical evaluation of real-life BP models by using the two operational modes of the BPR Assessment Framework.

6.1. Staging Mode: Practical Evaluation of Models

The repository of real-life BP models from the Greek Customs Service and the S.D.O.E. authority of the Greek Ministry of Finance was classified in the previous sections regarding the plasticity and external quality of BPR. In total, the models were categorized differently in terms of plasticity or quality. Nevertheless, both clustering procedures proved to be consistent with each other, leading to similar results. The authors introduce three discrete categories for BPR Capacity, i.e., “Low”, “Moderate”, and “High”, for cases that were categorized accordingly in both plasticity and external quality. The two intermediate categories, “Low to Moderate” and “Moderate to High” BPR Capacity, account for BP cases that had either of the two scorings for plasticity and the other scoring for external quality (Table 5). Regarding the set of models, fifty out of sixty-four models proved to have a high BPR capacity, nine models had a moderate to high score, four models had a moderate score, and, lastly, two models had the worst scores, having from low to moderate BPR capacity. Right after, a small presentation of two BP cases with low and high BPR capacity is provided to demonstrate how this categorization facilitates decision-making.

6.1.1. Case Study with Low BPR Capacity

Due to the fact that no BP case had a low scoring in both model plasticity and external quality, the authors assume that model 2.11 can serve as a typical example of low BPR capacity from the available real-life BP cases. The BP case refers to the “Submission of a request for intervention by Customs Authorities in the context of customs enforcement of Intellectual Property Rights” (a more visible image is available at https://drive.google.com/file/d/1XcRe82CToyCBpwi300_0wB1jHg_da-Zw/view, accessed on 21 January 2025) (Figure 5). The process accounts for different applications regarding Application for Action (AFA) by Intellectual Property Rights (IPR) holders and there are discrete subprocesses in the form of XOR gateway branches. This fact denotes that the process has its activities distributed along different XOR branches which entails that in many cases these activities are bound to implicit constraints.
The metric values of this BP model are presented in Table 6 in contrast to the thresholds presented in [27,36]. The table uses a colour gradient to represent applicability and quality levels, ranging from very low to very high. Specifically, red indicates highly inefficient applicability or very low quality, followed by orange for inefficient applicability or low quality, yellow for moderate applicability or quality, light green for efficient applicability or high quality, and dark green for highly efficient applicability or very high quality. This progression visually highlights the transition from very low to very high results, aiding quick interpretation of the data. The values visibly denote that the model is not a good candidate for BPR. Four out of six metrics show that the application of RESEQ would be highly inefficient and, at the same time, four out of seven metrics indicate a highly inefficient and two out of seven metrics an inefficient PAR applicability. Also, three out of four metrics denote a high probability of errors in the model, while the only good measures refer to the modifiability of the model in general.
In total, the model has been categorized through cluster analysis to have a low BPR capacity, a fact that is confirmed by the overall view of the model’s metric values. A process modeler would be discouraged from proceeding with BPR, as it would most probably be inefficient, leading to unnecessary time and resource consumption.

6.1.2. Case Study with High BPR Capacity

Many BP cases of the repository had a high scoring in both plasticity and external quality and model 4.6 is a typical example of high overall BPR capacity. The BP case refers to the “Authorization Process for the Operation of Small (two-day) Distilleries” (a more visible image is available at https://drive.google.com/file/d/1ZrUk5ZAhzY552gOabyTsuMDH49CdrLA1/view, accessed on 21 January 2025) (Figure 6).
The model is relatively small in size, having 14 activities and four gateways, all of which are parallel nodes (GH = 0). There is a low control flow complexity (CFC = 2) since only two AND split gateways exist in the model and only six sequence flows from gateways. The model is highly structured with a GM equal to zero, and more than half of the activities are ordered sequentially (Ξ = 0.526), a fact that reduces the possibility of implicitly constrained activities and conversely increases the applicability of RESEQ or PAR.
The metric values are presented in Table 7, where the model is a good candidate for BPR. The table uses a colour gradient in the same sense as in Table 6 to represent applicability and quality levels, ranging from very low to very high. Specifically, half of the metrics indicate a very efficient applicability of RESEQ, while one metric shows a moderately efficient applicability and two metrics show a rather inefficient one. Regarding the PAR heuristic, the results are even clearer, since four out of seven metrics indicate a moderately efficient applicability, and the other three metrics show a rather too-efficient applicability. As for the external quality, the model is either easy or very easy to modify and, at the same time, all of the metrics denote a small probability of errors. In total, the metric values clearly indicate that the BP case has a high plasticity and external quality, which entails that it is considered a very good candidate model for BPR.

6.2. Measuring Mode: Practical Evaluation of Models

In the selection step, two real-life BPs from the Greek PFM are used as input models for assessing their BPR capacity. The BP cases have been documented by the General Directorate of Tax Administration of the A.A.D.E. authority and published in December 2021 in an Official Report under the title “Manual of selected operational processes of the General Directorate of Tax Administration” (available at https://www.aade.gr/sites/default/files/2021-12/5-2021-gdfd_teliko.pdf, accessed on 21 January 2025).

6.2.1. Case Study with Low BPR Capacity

The case study used as an example of a BP model with low BPR capacity is retrieved from the report of A.A.D.E. authority; it is enumerated as 2.3 and titled “Composition of Audit Reports and Issuance of Tax Imposition” (Figure 7).
The selected internal measures were calculated for the model and are presented in Table 8 in comparison to the thresholds of each measure. The table uses a colour gradient in the same sense as in Table 6 to represent applicability and quality levels, ranging from very low to very high. The model is relatively large with 35 activities and 16 gateways. Even though it has many gateways, the control flow complexity is relatively moderate (CFC = 9) due to high structuredness since only two AND split gateways are not followed by merging nodes. Based on the report that the case was retrieved, almost all activities are bound to precedence constraints, a fact that is evident in the very low DOAF value.
What is also observed is that AGD has a value very close to 3 (3.125), which, in combination with the high TNG, entails that most of the gateways have two ingoing and one outgoing arc, or vice versa. The MGD is valued at 4 and the GM is 6, which is due to the three AND split gateways that are not followed by merge nodes. Lastly, the GH is 0.511 since the model is composed of 12 XOR and 4 AND gateways. Based on the methodology of the Measuring Mode, the authors calculate the Euclidean distance of the model from the three cluster centroids of Plasticity and External Quality presented in Table 2 and Table 4. The distances are given in Table 9.
Regarding plasticity, it is shown with an underline in Table 9 that the proximity of the model to the centroid of cluster 1 (d = 37.402) is smaller, which means that the model is categorized as having low plasticity. Given the two other calculated distances, the model is closer to the cluster of moderate plasticity (d = 38.468). In the same sense, measuring the distance of the model from the clusters of external quality resulted in appointing the model to cluster 3 (d = 0.908) (see respective underline in Table 9), which includes the models with moderate quality. From the two other distances, the model is closer to the cluster with the models of high external quality (d = 6.161). In total, the case model is categorized as having a low plasticity and moderate external quality for BPR.
The classification of the model into categories of plasticity and external quality is consistent with the comparison of the model’s metric values to the thresholds in [4,27,44]. What one can observe is that half of the measures indicate inefficient and the other half efficient applicability of RESEQ, and at the same time most of the measures (5 out of 7) indicate inefficient applicability of PAR. Thus, the model is considered to have low plasticity, which is in accordance with the classification from the Measuring Mode. Regarding external quality, the measures indicate that the model is easy or very easy to modify, and, at the same time, all metric values indicate a high probability of errors in the model. These contradicting results are in accordance with the classification of the model as a cluster of moderate external quality.

6.2.2. Case Study with High BPR Capacity

The case study used as an example of a BP model with high BPR capacity is enumerated as 2.9 and titled “Registry to the Fiscal Records and Initiation of Personal Company Operation” (a more visible image is available at https://drive.google.com/file/d/1acf12e4BIDpma1UwtLYMkYVxq9PNZk0o/view, accessed on 21 January 2025) (Figure 8).
The internal measures were calculated for the model and are presented in Table 10. The table uses a colour gradient in the same sense as in Table 6 to represent applicability and quality levels, ranging from very low to very high. The model is small, with seven activities and six gateways. The control flow complexity is very low (CFC = 3) due to the existence of three XOR split gateway nodes, with each one having two branches. The model has a very low Sequentiality (Ξ = 0.066) ratio, which indicates that the model has the minimum number of sequential activities. This is also evident by the high CLA value (CLA = 7), which is the ratio of NOA to NSFA and indicates that only one sequence flow exists between the seven activities of the model. What is also observed is that all gateways have a degree of three, meaning that they either split or merge two branches (AGD = 3, MGD = 3). Lastly, GH equals zero since all gateway nodes are XOR, and GM also equals zero, indicating a highly structured model. The authors calculate the Euclidean distance of the model from the three cluster centroids of Plasticity and External Quality.
Regarding plasticity, it is shown in Table 11 that the proximity of the model is smaller to the centroid of cluster 2 (d = 10.540), which means that the model is categorized as having high plasticity. Given the two other calculated distances, the model is closer to the cluster of moderate plasticity (d = 19.369). In the same sense, measuring the distance of the model from the clusters of external quality resulted in appointing the model to cluster 1 (d = 2.017), which includes the models with high quality. From the two other distances, the model is closer to the cluster with the models of moderate external quality (d = 6.877). In total, the case model is categorized as having a high plasticity and external quality for BPR.
The classification of the model is relatively consistent with the comparison of the model’s metric values to the metric thresholds. Regarding plasticity, we obtain contradicting results due to the low sequentiality of activities. Specifically, in all measures, the model seems to have a rather inefficient applicability of RESEQ, and, at the same time, a highly efficient applicability of the PAR heuristic. In total, the plasticity of the model is regarded as high despite having a low proximity to the cluster of moderate plasticity. A modeler could potentially focus more on the application of the PAR heuristic in the case that BPR is chosen to be implemented. Regarding external quality, the classification is very clear since all measures indicate a very easily modifiable model and, at the same time, a low probability of errors. The classification clearly denotes that the model has the necessary external quality to be redesigned.

7. Discussion

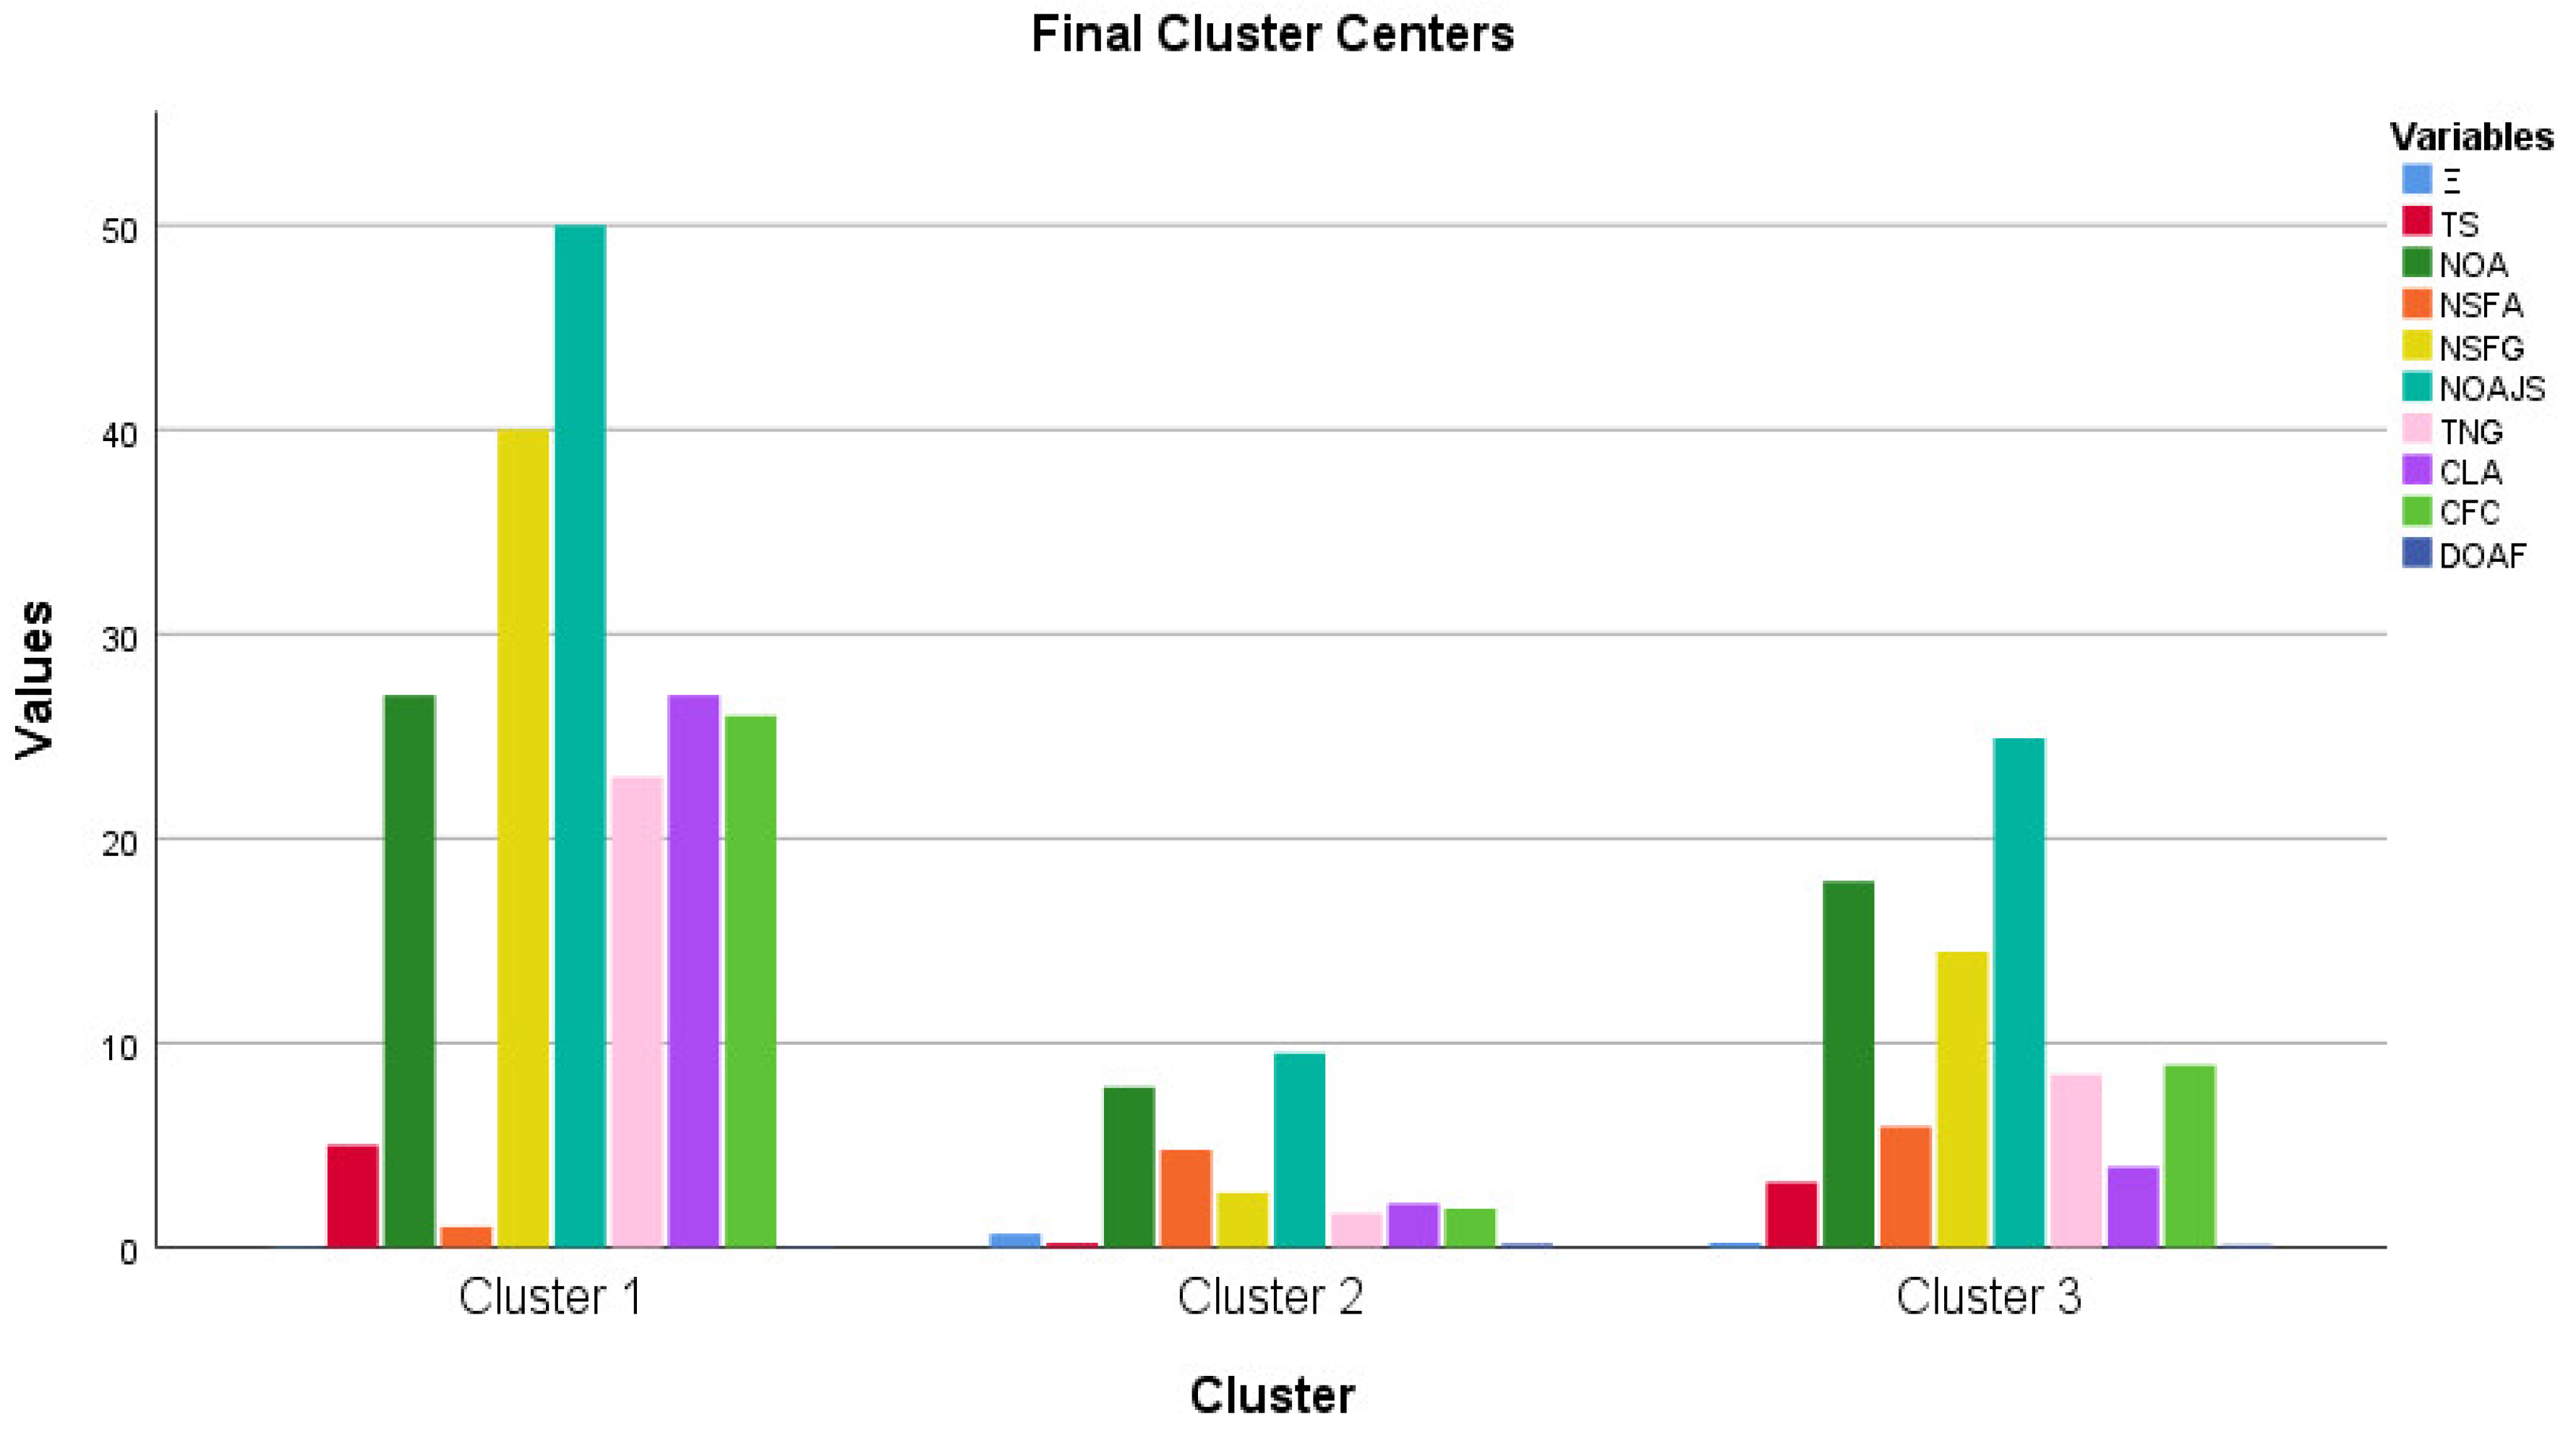
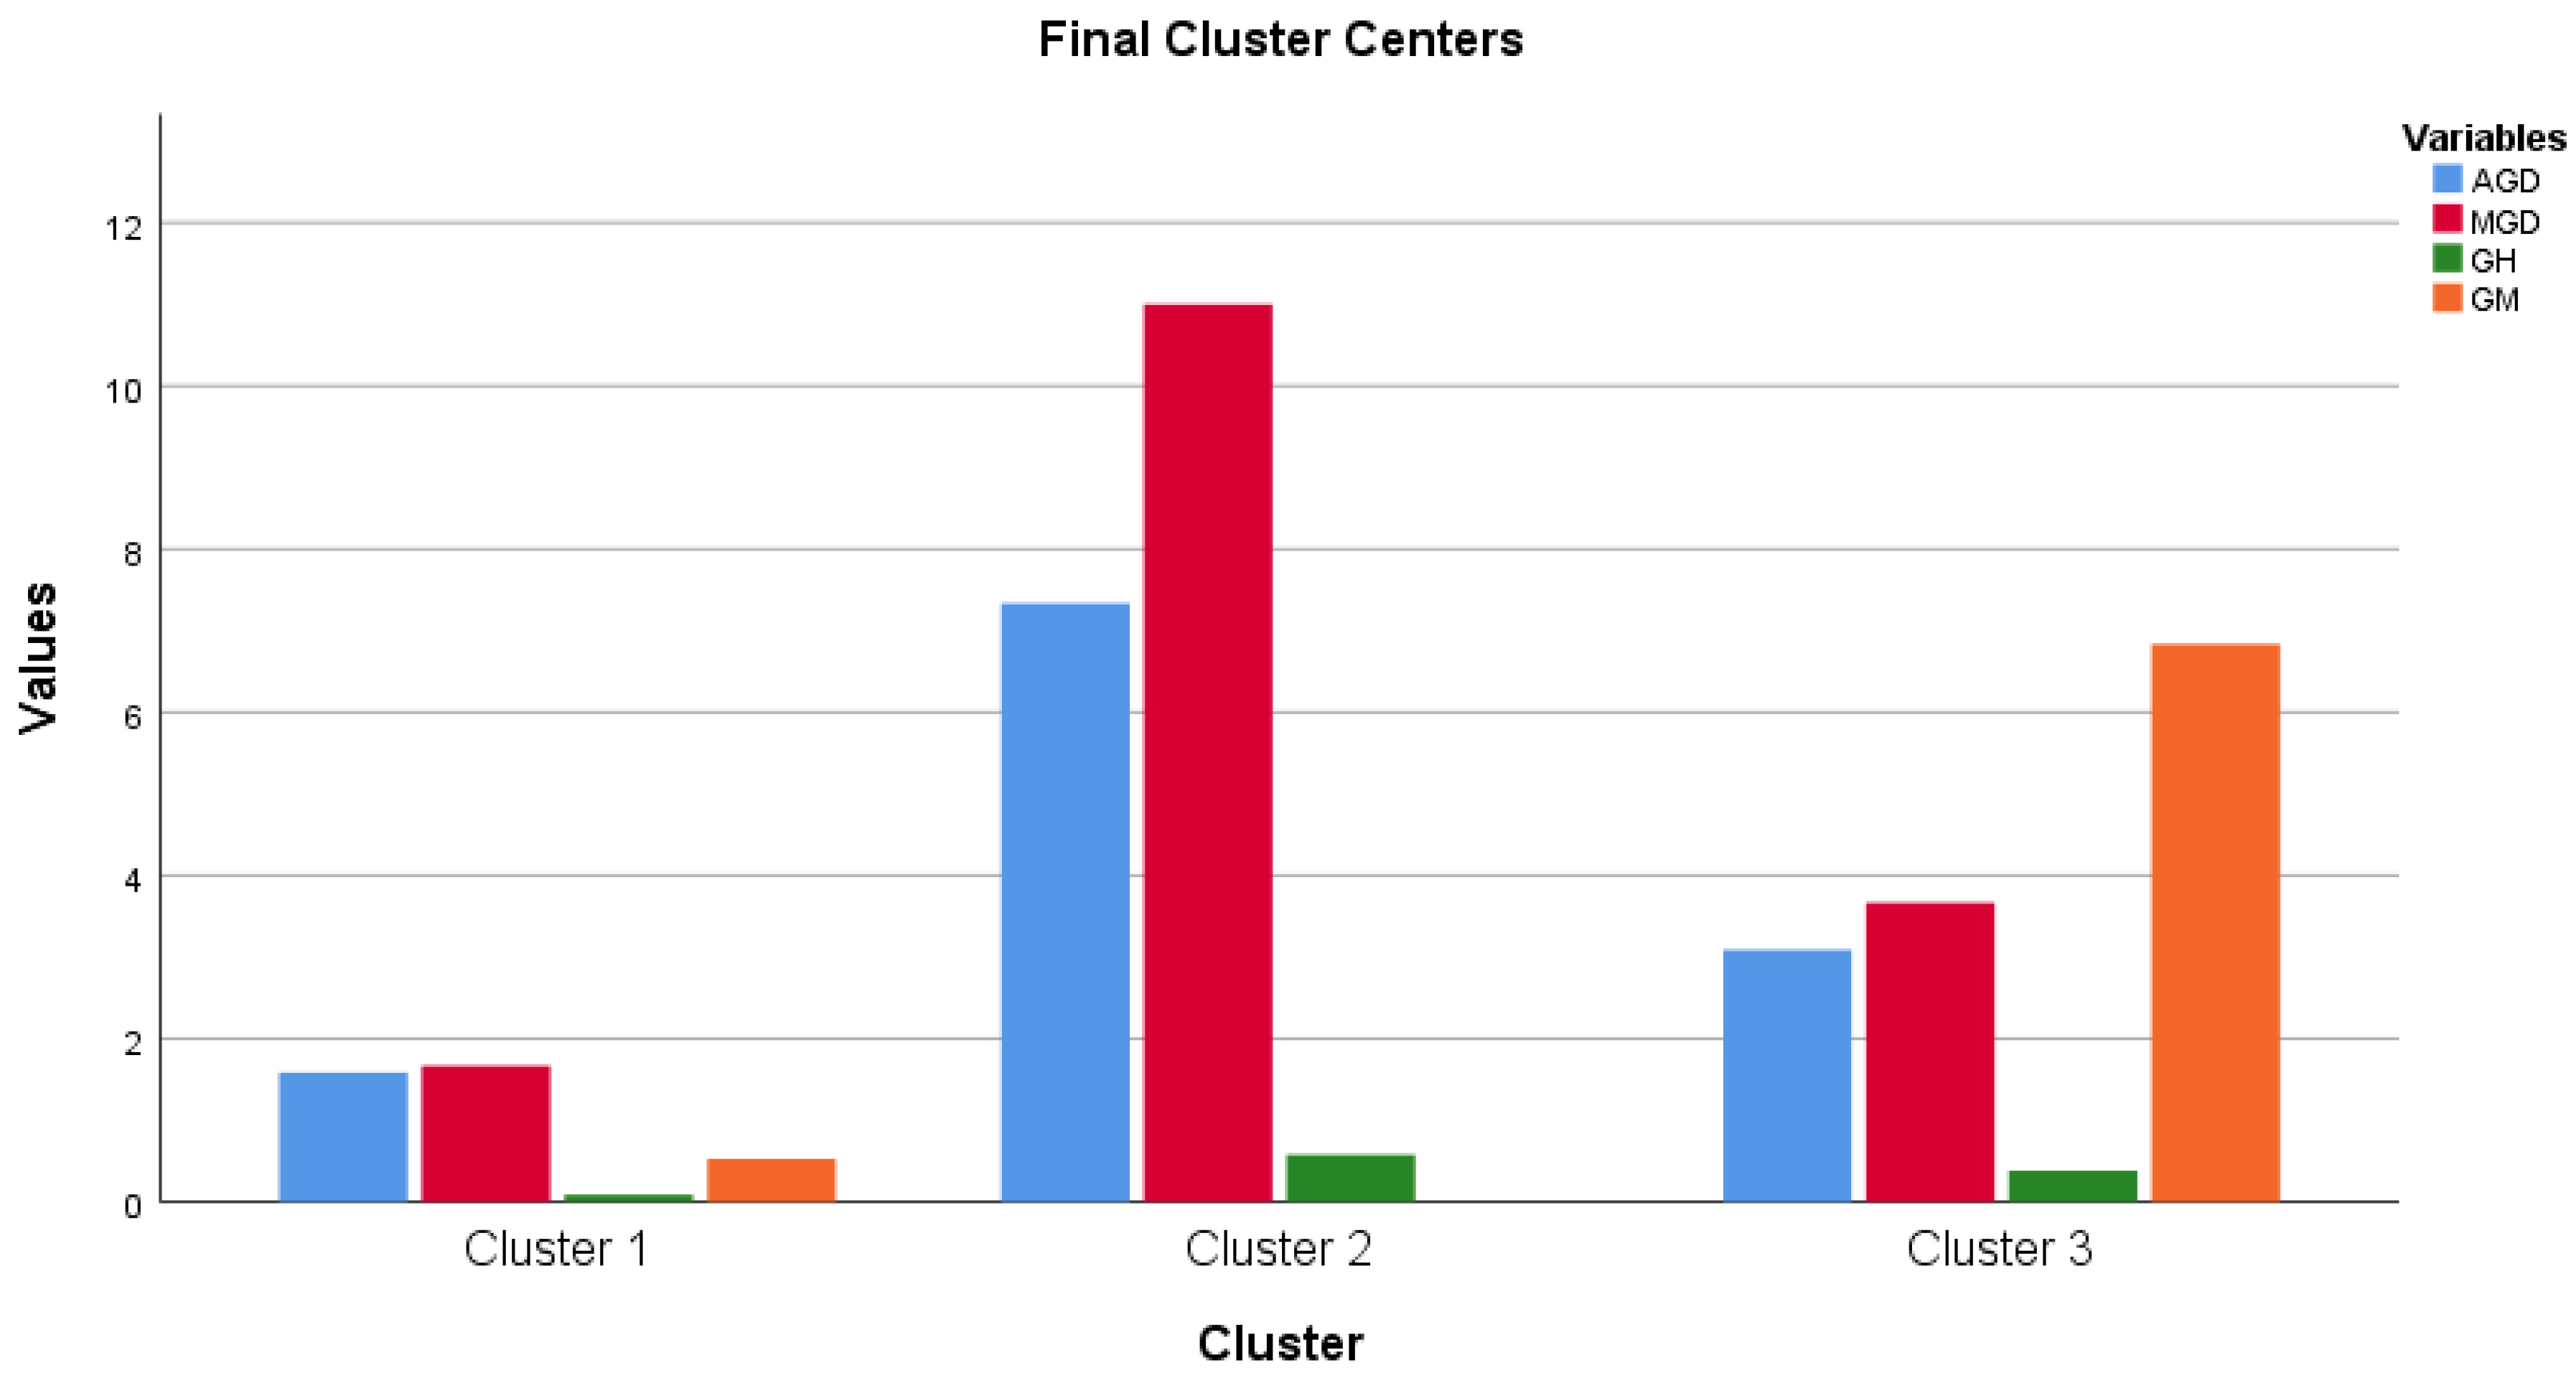
This study set out to answer the question: “How can a structured framework systematically assess and categorize business processes in public financial management to guide effective redesign initiatives?”. The findings from the application of the BPR Assessment Framework to real-life processes in the PFM domain provide valuable insights into its practical relevance and challenges. The framework successfully classified processes based on their redesign capacity, allowing for targeted improvements in efficiency, compliance, and digital transformation. The clustering methodology proved effective in distinguishing processes with high redesign potential from those requiring alternative interventions, thereby providing a structured decision-making tool for PFM.
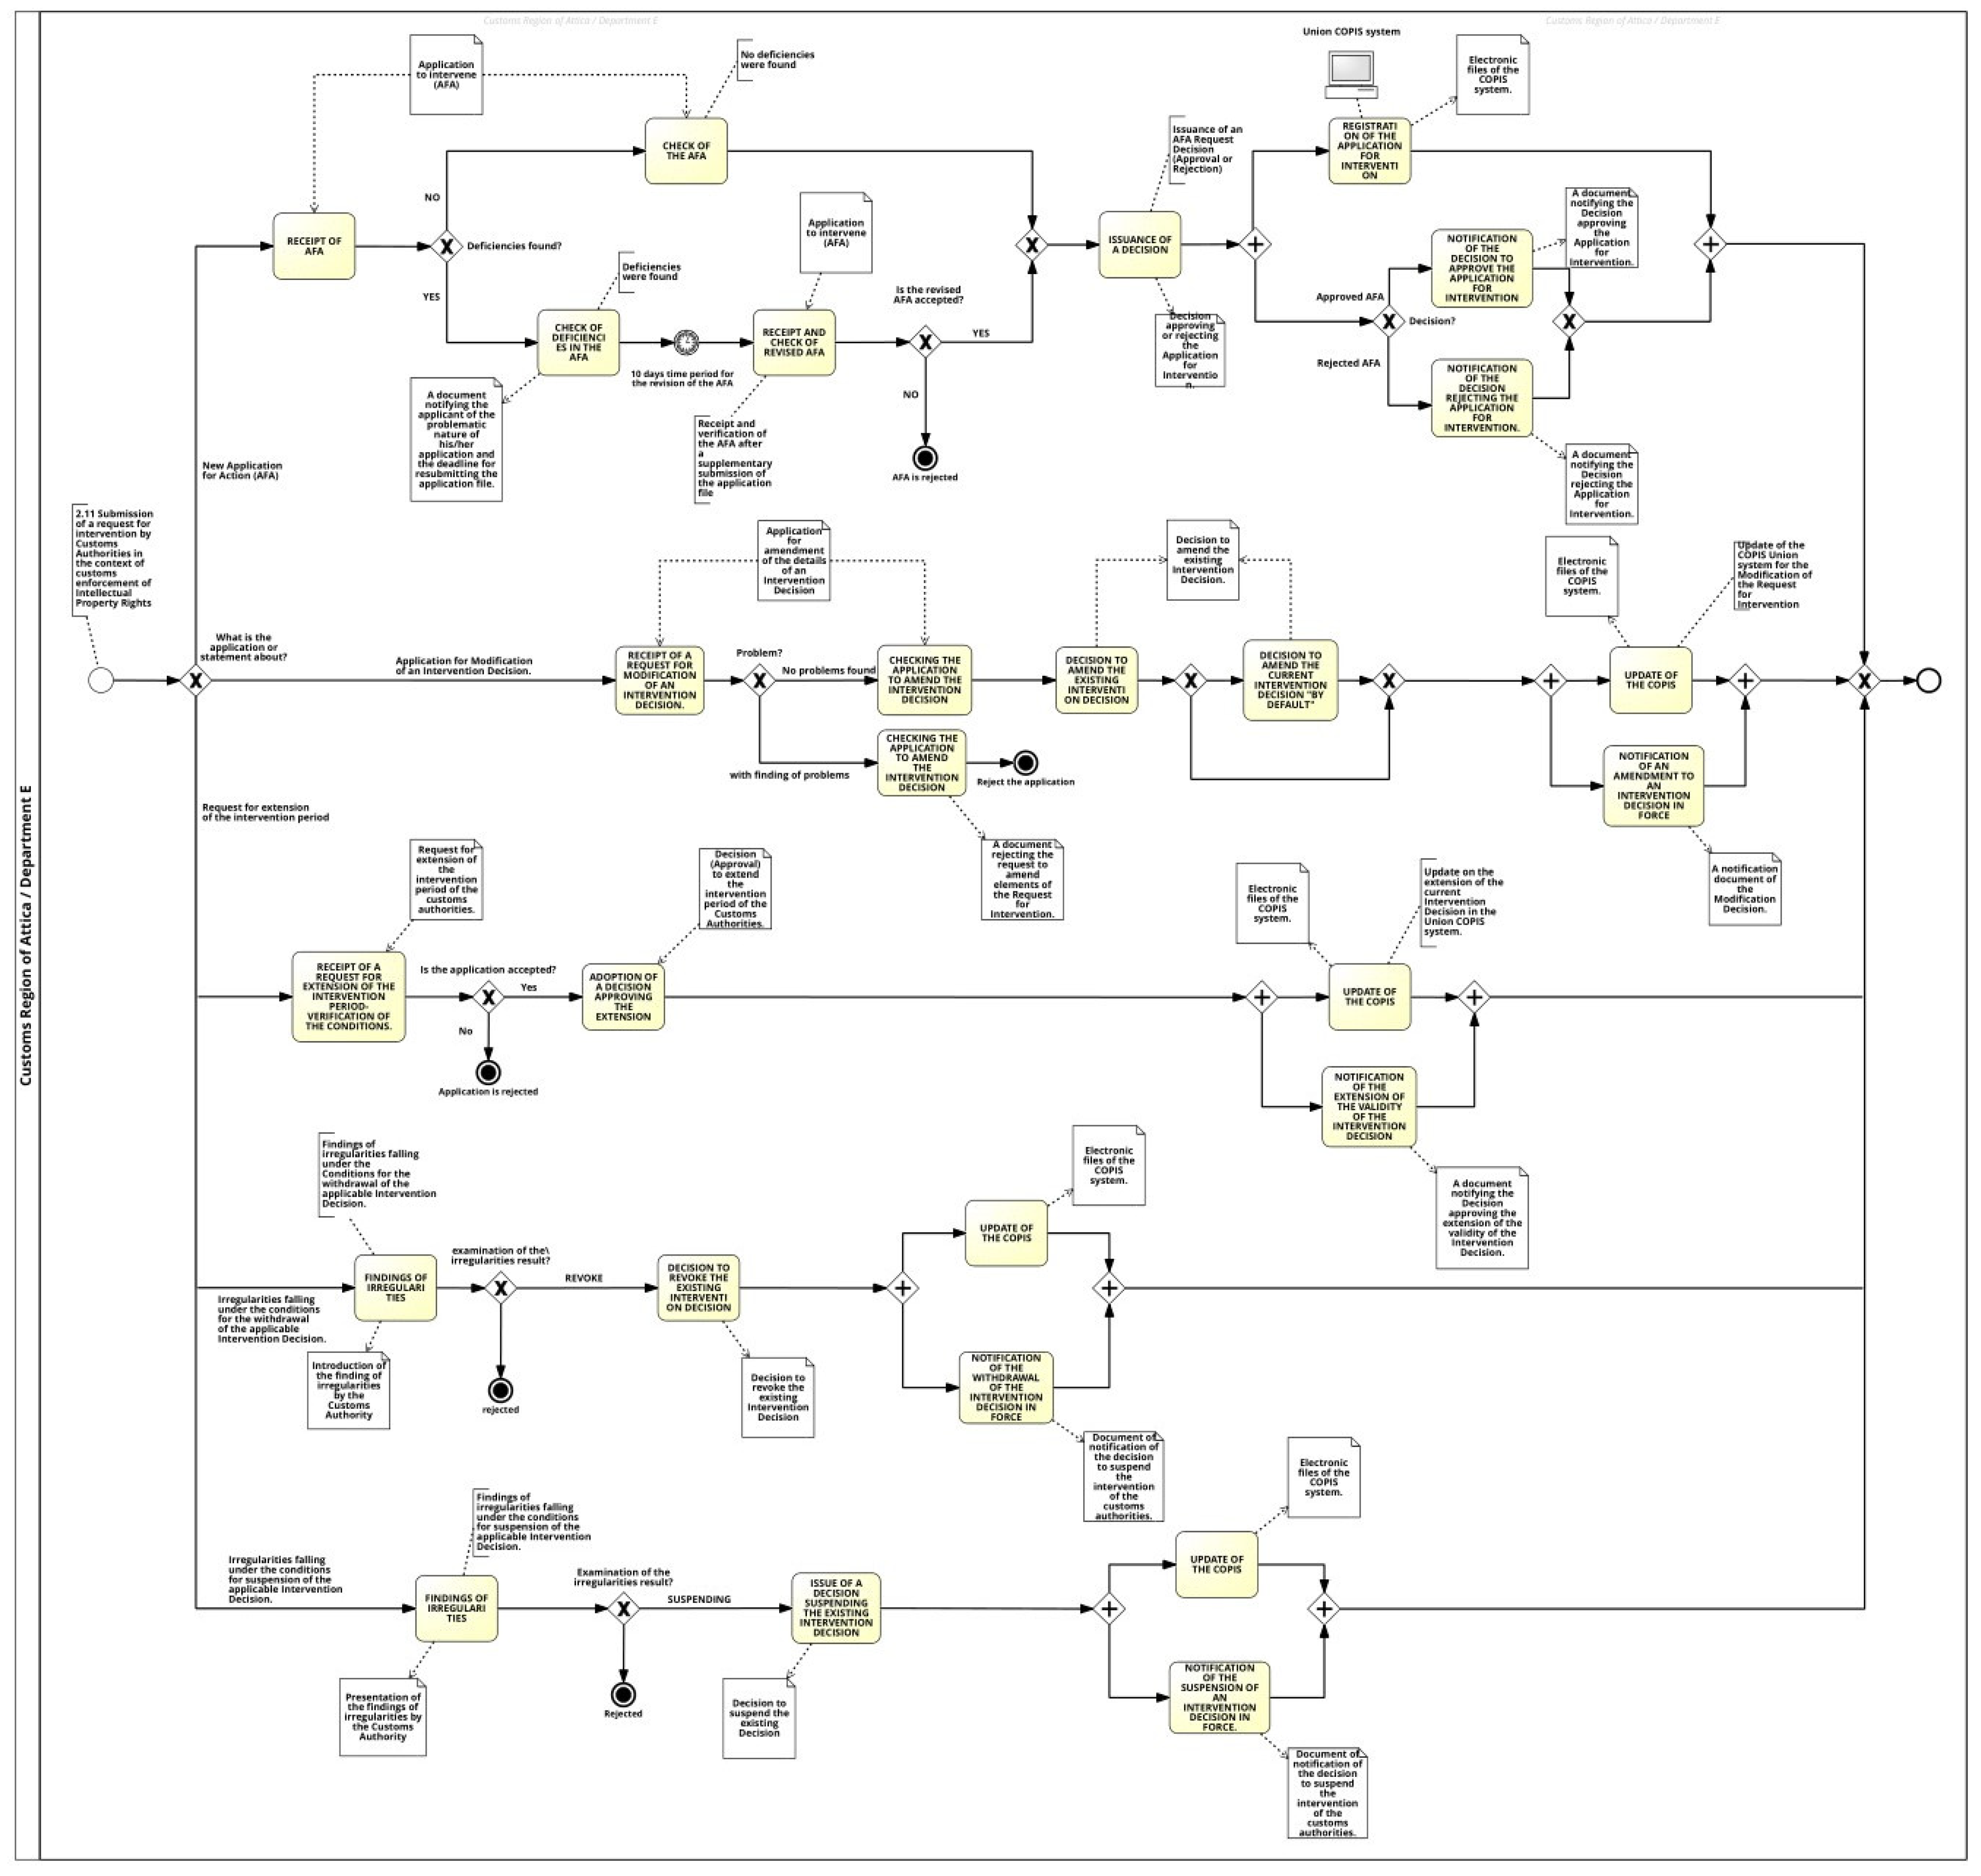
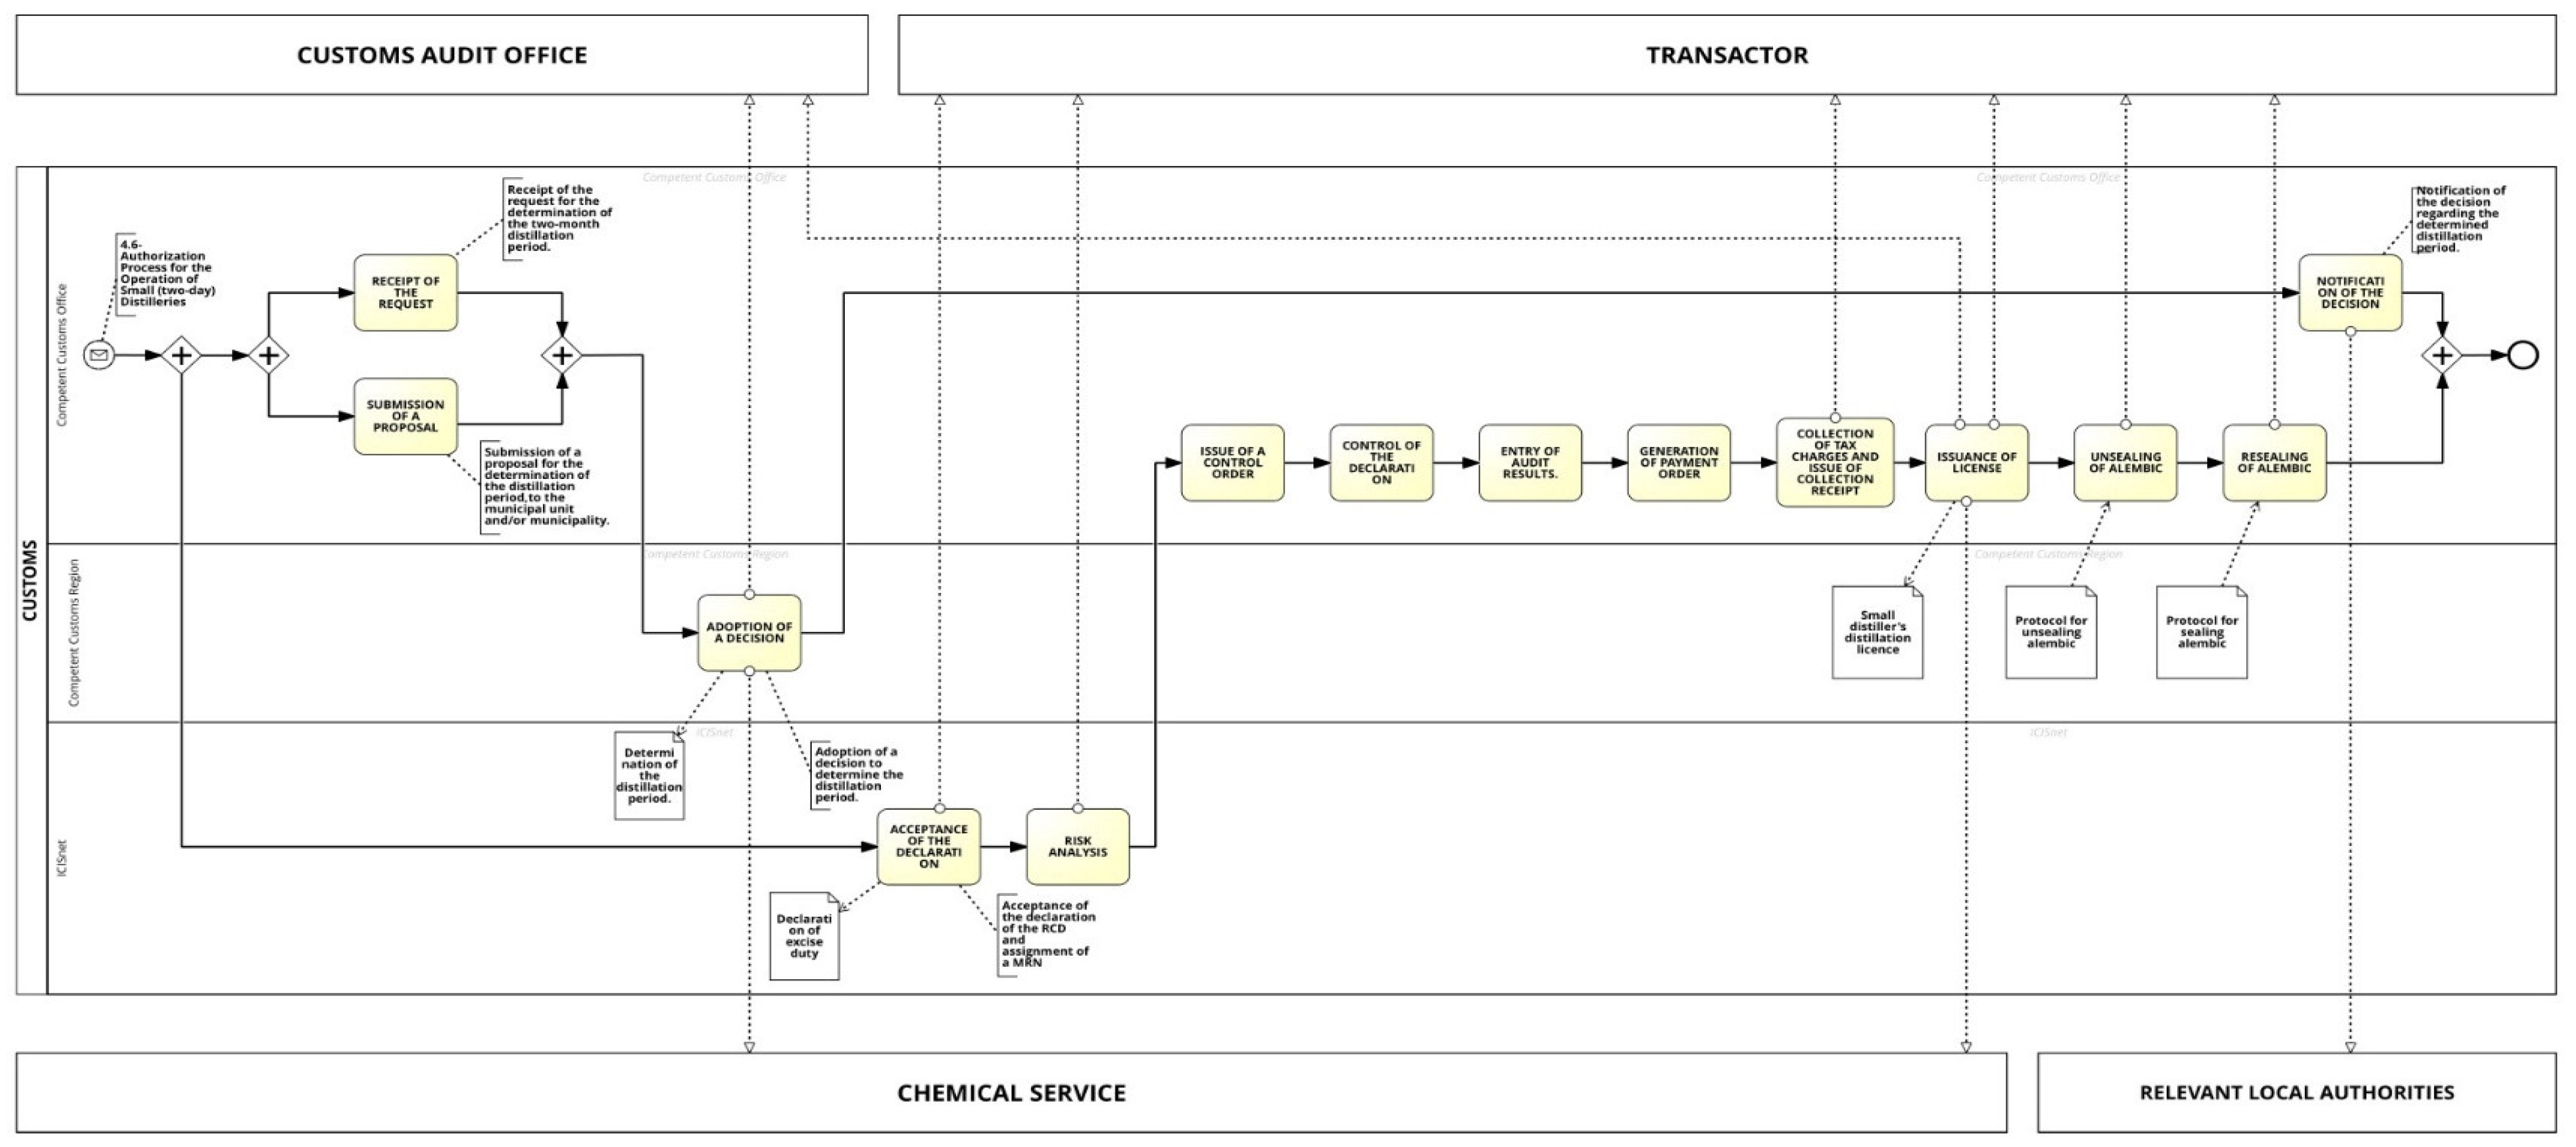
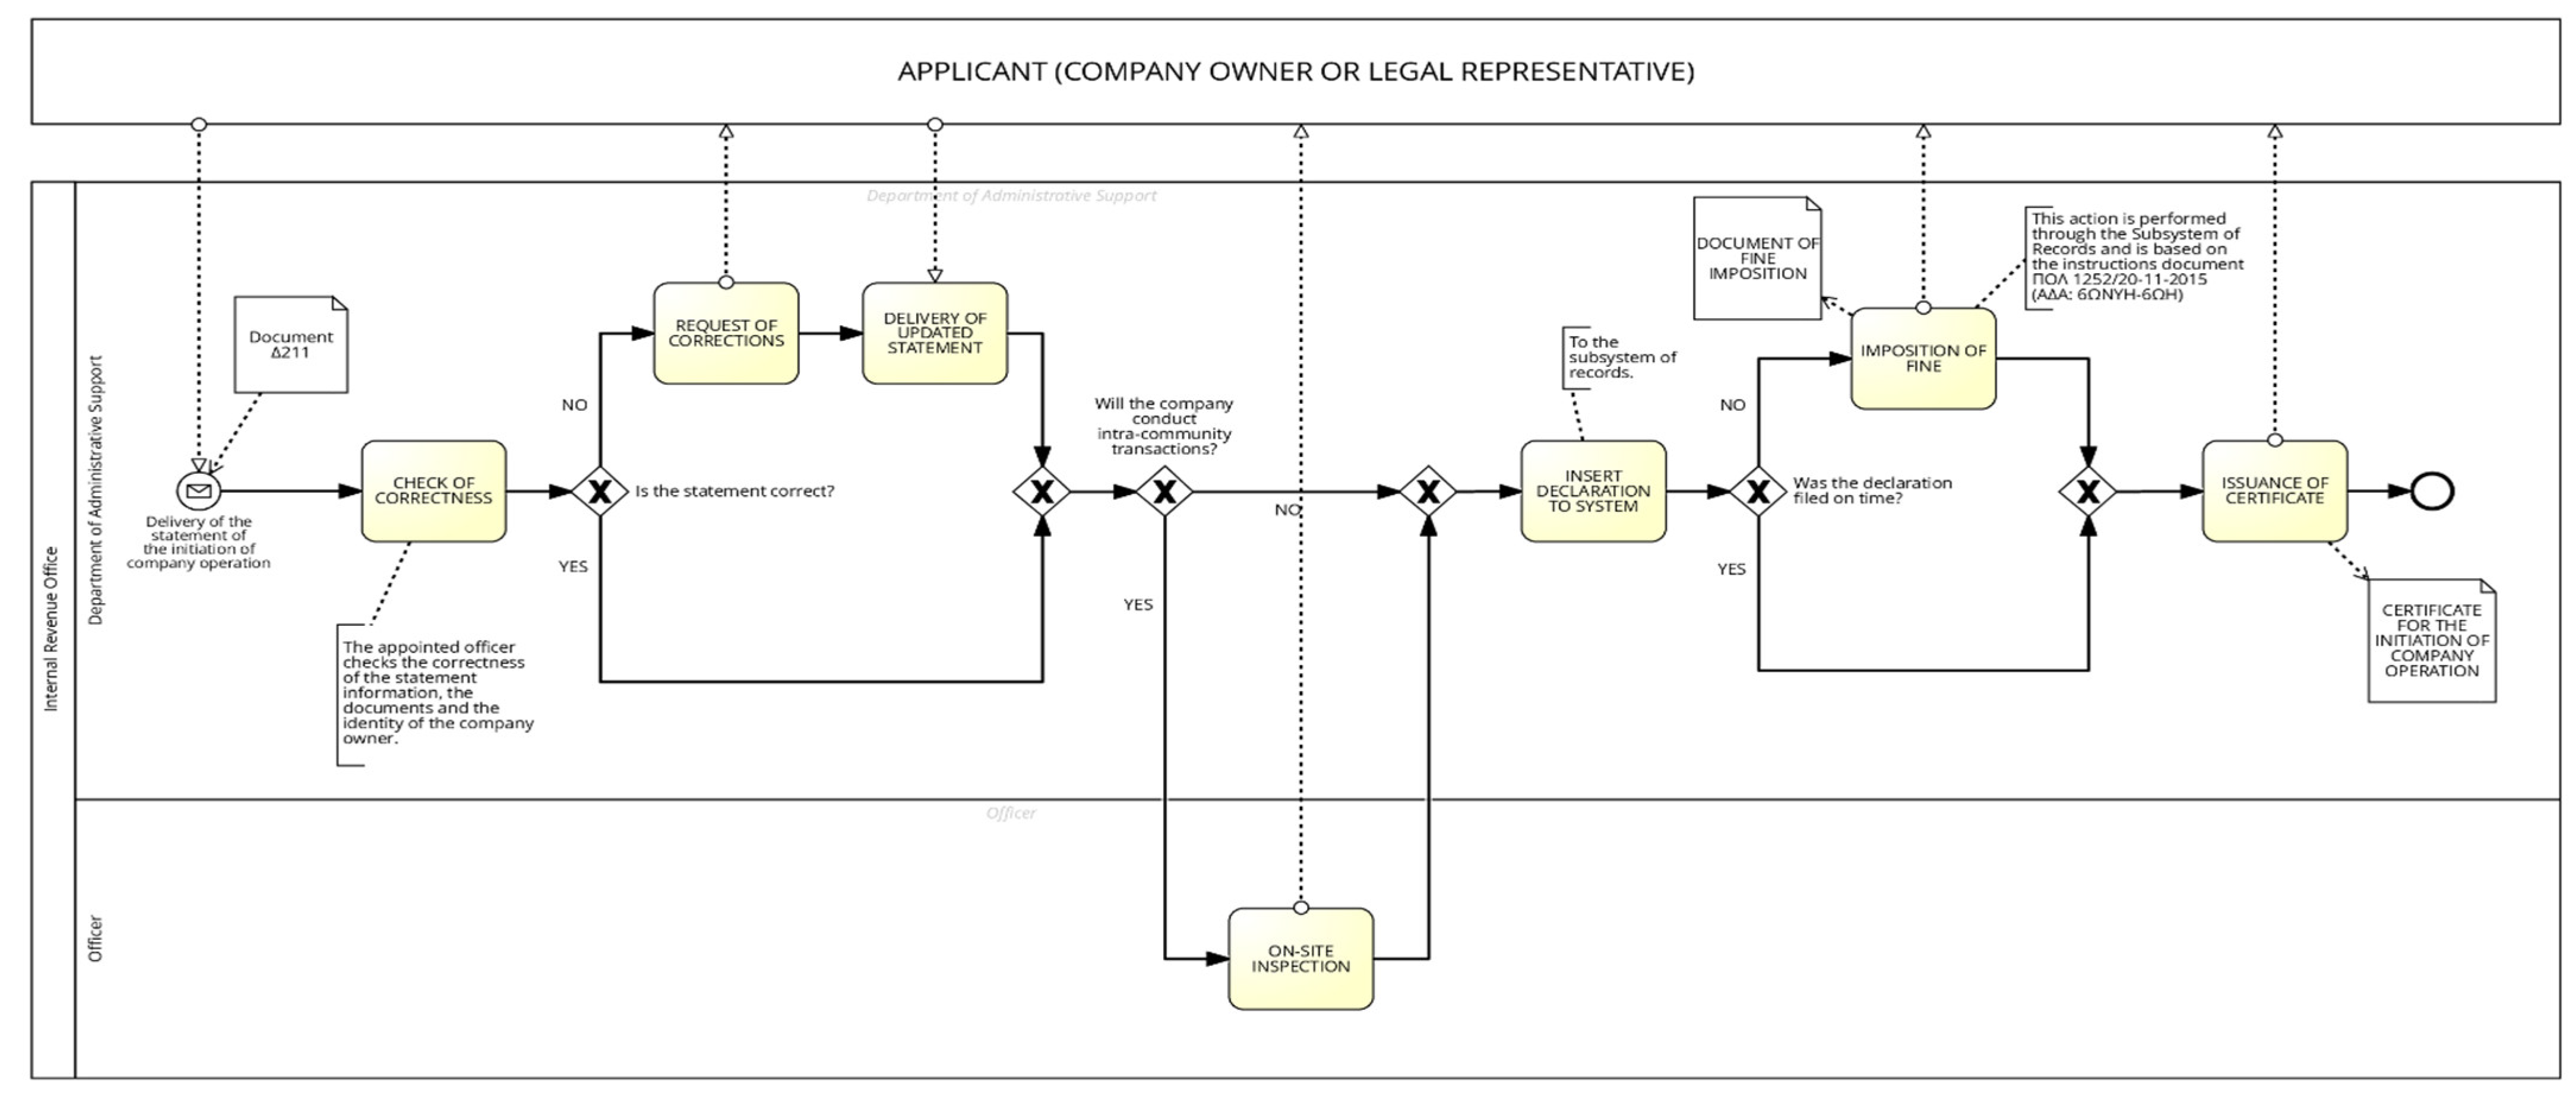
One important strength of the framework lies in its systematic use of internal and external quality metrics. Metrics such as Degree of Activity Flexibility (DoAF) and Control Flow Complexity (CFC) have proven instrumental in assessing the structural characteristics of processes. By integrating these metrics with clustering techniques, the framework offers a robust mechanism for identifying processes that are most suitable for redesign. The practical evaluation of representative processes highlights the tangible benefits of applying the framework. For example, processes categorized as having a high redesign capacity demonstrated opportunities for significant improvements in efficiency and compliance. Additionally, the ability to analyze complex workflows, such as those within the Customs Service and S.D.O.E., underscores the framework’s adaptability to diverse operational contexts.
While the findings of this study demonstrate the effectiveness of the BPR Assessment Framework in identifying redesign opportunities, the real-world adoption of BPR in PFM is not without challenges. One of the most significant barriers is organizational resistance to change. Employees and administrators often view process redesign initiatives with skepticism, particularly when they fear increased workload, job restructuring, or unfamiliarity with new workflows. Overcoming this resistance requires strong leadership, clear communication, and well-structured training programs to ensure smooth implementation. Beyond human factors, bureaucratic and regulatory constraints also pose challenges. PFM processes are heavily governed by legal frameworks, compliance requirements, and audit mechanisms that can limit the flexibility of redesign efforts. Unlike private sector organizations, where process changes can be more agile, government agencies must navigate complex approval processes and administrative oversight, which can slow down implementation. Another critical issue is technological readiness. Many public sector agencies still rely on legacy IT systems that are not easily adaptable to redesigned processes. The integration of redesigned workflows often requires significant investment in digital transformation, including system upgrades and data migration. However, budgetary limitations and slow procurement cycles frequently delay such initiatives, making it difficult to fully realize the benefits of BPR. Lastly, skill gaps and training needs present practical obstacles. Successful implementation of redesigned processes depends on the ability of employees to adapt to new ways of working. Without adequate training and capacity-building efforts, even the most well-designed BPR initiatives may struggle to achieve their intended impact. Recognizing these challenges, future research should explore strategies for mitigating resistance to change, developing more flexible regulatory approaches, and ensuring smoother technological integration. Addressing these real-world constraints will be crucial in maximizing the practical impact of BPR in PFM.
Apart from the challenges of real-world adoption of BPR in PFM, this study also bears certain limitations related to the proposed framework. The framework’s reliance on pre-defined metrics and clustering algorithms may not fully capture the nuances of all process types. Furthermore, the application in the PFM domain, while comprehensive, does not account for potential variations in other sectors or international contexts. Future work should address these limitations by expanding the framework’s scope and refining its metrics to enhance its applicability across broader domains. This study also highlights the importance of process documentation and modeling standards. The consistent use of BPMN 2.0 facilitated the seamless application of the framework, emphasizing the need for standardized practices in process management. Furthermore, the clustering results point to a strong correlation between structural complexity and redesign feasibility, providing actionable insights for practitioners. Beyond these challenges, it is important to recognize that the framework’s applicability may not extend uniformly across all domains. While it has demonstrated effectiveness in structured public financial workflows, its use in more dynamic or less standardized environments (e.g., emergency response operations, healthcare crisis management, or real-time fraud detection) may require further adaptation. Future research could explore alternative methodological approaches, such as expert-driven assessments or AI-based process mining, to complement the framework and enhance its applicability in diverse settings.
In conclusion, the BPR Assessment Framework demonstrates significant potential for enhancing BPR efforts in the public sector. Its systematic methodology, grounded in robust metrics and clustering techniques, offers a valuable tool for practitioners seeking to optimize organizational workflows. While challenges remain, the findings from this study provide a strong foundation for future research and practical applications.

8. Conclusions

This study explored the application of the BPR Assessment Framework to real-life processes within the PFM domain. By systematically evaluating and categorizing processes based on their redesign potential, the framework demonstrated its utility as a practical tool for guiding BPR initiatives. The results underscore the framework’s ability to identify processes with high potential for redesign, providing actionable insights that can enhance organizational efficiency and compliance. The use of internal and external quality metrics, combined with clustering techniques, proved effective in assessing the structural characteristics of processes. These findings highlight the importance of a data-driven approach to BPR, emphasizing the role of systematic methodologies in decision-making. The practical evaluation of representative processes further reinforced the framework’s applicability, showcasing its capacity to address the complexities of real-world workflows. While this study focused on the PFM domain, the framework’s principles are broadly applicable to other sectors and contexts. Future research should explore its scalability and adaptability, refining its metrics and methodologies to meet the needs of diverse organizational environments. By doing so, the framework can become a cornerstone of modern BPR practices, driving continuous improvement and innovation across industries.
In conclusion, the BPR Assessment Framework represents a significant advancement in the field of process management. Its systematic approach, grounded in robust theoretical foundations, provides a valuable resource for practitioners and researchers alike. By bridging the gap between theory and practice, this study contributes to the ongoing evolution of BPR methodologies, paving the way for more effective and efficient organizational processes.

Supplementary Materials

The following supporting information can be downloaded at: https://www.mdpi.com/article/10.3390/info16030179/s1, Table S1. Real-life BPs of the Greek Customs Service. Table S2. Real-life BPs of S.D.O.E.—Greek Ministry of Finance. Table S3. Cluster Membership (SPSS)—Plasticity. Table S4. Cluster Membership (SPSS)—External Quality.

Author Contributions

Methodology, G.T.; Validation, K.V.; Formal analysis, G.T.; Writing—original draft, G.T.; Writing—review & editing, K.V.; Supervision, K.V. All authors have read and agreed to the published version of the manuscript.

Funding

This research received no external funding.

Institutional Review Board Statement

Not applicable.

Informed Consent Statement

Not applicable.

Data Availability Statement

The original contributions presented in this study are included in the article. Further inquiries can be directed to the corresponding author.

Conflicts of Interest

The authors declare no conflicts of interest.

References

  1. Sidorova, A.; Isik, O. Business Process Research: A Cross-Disciplinary Review. Bus. Process Manag. J. 2010, 16, 566–597. [Google Scholar] [CrossRef]
  2. Wang, C.-N.; Vo, T.T.B.C.; Hsu, H.-P.; Chung, Y.-C.; Nguyen, N.T.; Nhieu, N.-L. Improving Processing Efficiency through Workflow Process Reengineering, Simulation and Value Stream Mapping: A Case Study of Business Process Reengineering. Bus. Process Manag. J. 2024, 30, 2482–2515. [Google Scholar] [CrossRef]
  3. Tsakalidis, G.; Nousias, N.; Vergidis, K. BPR Assessment Framework: Staging Business Processes for Redesign Using Cluster Analysis. In Proceedings of the Decision Support Systems XIII. Decision Support Systems in An Uncertain World: The Contribution of Digital Twins, Albi, France, 30 May–1 June 2023; Liu, S., Zaraté, P., Kamissoko, D., Linden, I., Papathanasiou, J., Eds.; Springer Nature: Cham, Switzerland, 2023; pp. 97–110. [Google Scholar]
  4. Tsakalidis, G.; Vergidis, K.; Tambouris, E. Business Process Model Plasticity: Measuring the Capacity to Redesign Prior to Implementation. In Proceedings of the 2021 IEEE 23rd Conference on Business Informatics (CBI), Bolzano, Italy, 1–3 September 2021; IEEE: Piscatawa, NJ, USA, 2021; Volume 1, pp. 31–41. [Google Scholar]
  5. Fetais, A.; Abdella, G.M.; Al-Khalifa, K.N.; Hamouda, A.M. Business Process Re-Engineering: A Literature Review-Based Analysis of Implementation Measures. Information 2022, 13, 185. [Google Scholar] [CrossRef]
  6. Reijers, H.A. Business Process Management: The Evolution of a Discipline. Comput. Ind. 2021, 126, 103404. [Google Scholar] [CrossRef]
  7. Christin Jurisch, M.; Palka, W.; Wolf, P.; Krcmar, H. Which Capabilities Matter for Successful Business Process Change? Bus. Process Manag. J. 2014, 20, 47–67. [Google Scholar] [CrossRef]
  8. Grover, V.; Markus, M.L. Business Process Transformation; ME Sharpe: Armonk, NY, USA, 2008. [Google Scholar]
  9. Mansar, S.L.; Reijers, H.A. Best Practices in Business Process Redesign: Validation of a Redesign Framework. Comput. Ind. 2005, 56, 457–471. [Google Scholar] [CrossRef]
  10. Mendling, J.; Weber, I.; Aalst, W.V.D.; Brocke, J.V.; Cabanillas, C.; Daniel, F.; Debois, S.; Ciccio, C.D.; Dumas, M.; Dustdar, S. Blockchains for Business Process Management-Challenges and Opportunities. ACM Trans. Manag. Inf. Syst. (TMIS) 2018, 9, 1–16. [Google Scholar] [CrossRef]
  11. Nousias, N.; Tsakalidis, G.; Vergidis, K. Not yet Another BPM Lifecycle: A Synthesis of Existing Approaches Using BPMN. Inf. Softw. Technol. 2024, 171, 107471. [Google Scholar] [CrossRef]
  12. Tsakalidis, G.; Vergidis, K.; Kougka, G.; Gounaris, A. Eligibility of BPMN Models for Business Process Redesign. Information 2019, 10, 225. [Google Scholar] [CrossRef]
  13. Hammer, M.; Champy, J. Reengineering the Corporation: A Manifesto for Business Revolution. Bus. Horiz. 1993, 36, 90–91. [Google Scholar] [CrossRef]
  14. Dumas, M.; Rosa, M.L.; Mendling, J.; Reijers, H.A. Fundamentals of Business Process Management, 2nd ed.; Springer: Berlin/Heidelberg, Germany, 2018; ISBN 978-3-662-56508-7. [Google Scholar]
  15. Davenport, T.H. Process Innovation: Reengineering Work Through Information Technology; Harvard Business Press: Boston, MA, USA, 1993; ISBN 978-1-4221-6066-4. [Google Scholar]
  16. Melão, N.; Pidd, M. A Conceptual Framework for Understanding Business Processes and Business Process Modelling. Inf. Syst. J. 2000, 10, 105–129. [Google Scholar] [CrossRef]
  17. Reijers, H.A.; Mansar, S.L. Best Practices in Business Process Redesign: An Overview and Qualitative Evaluation of Successful Redesign Heuristics. Omega 2005, 33, 283–306. [Google Scholar] [CrossRef]
  18. Tsakalidis, G.; Vergidis, K. Business Process Redesign: A Systematic Review of Evaluation Approaches. Decis. Mak. Appl. Manag. Eng. 2024, 7, 79–98. [Google Scholar] [CrossRef]
  19. Cherni, J.; Martinho, R.; Ghannouchi, S.A. Towards Improving Business Processes Based on Preconfigured KPI Target Values, Process Mining and Redesign Patterns. Procedia Comput. Sci. 2019, 164, 279–284. [Google Scholar] [CrossRef]
  20. Pérez-Castillo, R.; Fernández-Ropero, M.; Piattini, M. Business Process Model Refactoring Applying IBUPROFEN. An Industrial Evaluation. J. Syst. Softw. 2019, 147, 86–103. [Google Scholar] [CrossRef]
  21. Cho, M.; Song, M.; Comuzzi, M.; Yoo, S. Evaluating the Effect of Best Practices for Business Process Redesign: An Evidence-Based Approach Based on Process Mining Techniques. Decis. Support Syst. 2017, 104, 92–103. [Google Scholar] [CrossRef]
  22. Tsakalidis, G.; Vergidis, K. A Roadmap to Critical Redesign Choices That Increase the Robustness of Business Process Redesign Initiatives. J. Open Innov. Technol. Mark. Complex. 2021, 7, 178. [Google Scholar] [CrossRef]
  23. Mukherjee, K.K.; Reka, L.; Mullahi, R.; Jani, K.; Taraj, J. Public Services: A Standard Process Model Following a Structured Process Redesign. Bus. Process Manag. J. 2021, 27, 796–835. [Google Scholar] [CrossRef]
  24. Sánchez-González, L.; García, F.; Ruiz, F.; Piattini, M. A Case Study about the Improvement of Business Process Models Driven by Indicators. Softw. Syst. Model. 2017, 16, 759–788. [Google Scholar] [CrossRef]
  25. Mohapatra, S. Change Management Approach in Implementing BPR. In Business Process Reengineering; Springer: Berlin/Heidelberg, Germany, 2013; pp. 163–190. [Google Scholar]
  26. Khan, M.A.A.; Butt, J.; Mebrahtu, H.; Shirvani, H.; Sanaei, A.; Alam, M.N. Integration of Data-Driven Process Re-Engineering and Process Interdependence for Manufacturing Optimization Supported by Smart Structured Data. Designs 2019, 3, 44. [Google Scholar] [CrossRef]
  27. Sánchez-González, L.; García, F.; Ruiz, F. BPMIMA: Business Process Model Improvement Based on Measurement Activities; University of Castilla-La Mancha: Ciudad Real, Spain, 2015. [Google Scholar]
  28. Zur Muehlen, M.; Ho, D.T.-Y. Risk Management in the BPM Lifecycle. In Proceedings of the BPM’05: Proceedings of the Third International Conference on Business Process Management, Nancy, France, 5 September 2005; Springer: Berlin/Heidelberg, Germany, 2005; pp. 454–466. [Google Scholar]
  29. Al-Anqoudi, Y.; Al-Hamdani, A.; Al-Badawi, M.; Hedjam, R. Using Machine Learning in Business Process Re-Engineering. Big Data Cogn. Comput. 2021, 5, 61. [Google Scholar] [CrossRef]
  30. Vergidis, K.; Tiwari, A.; Majeed, B. Business Process Analysis and Optimization: Beyond Reengineering. IEEE Trans. Syst. Man Cybern. Part C Appl. Rev. 2007, 38, 69–82. [Google Scholar] [CrossRef]
  31. Fotoglou, C.; Tsakalidis, G.; Vergidis, K.; Chatzigeorgiou, A. Complexity Clustering of BPMN Models: Initial Experiments with the K-Means Algorithm. In Proceedings of the Decision Support Systems X: Cognitive Decision Support Systems and Technologies, Zaragoza, Spain, 27–29 May 2020; Moreno-Jiménez, J.M., Linden, I., Dargam, F., Jayawickrama, U., Eds.; Springer International Publishing: Berlin/Heidelberg, Germany, 2020; pp. 57–69. [Google Scholar]
  32. Lohrmann, M.; Reichert, M. Effective Application of Process Improvement Patterns to Business Processes. Softw. Syst. Model. 2016, 15, 353–375. [Google Scholar] [CrossRef]
  33. Trkman, P. The Critical Success Factors of Business Process Management. Int. J. Inf. Manag. 2010, 30, 125–134. [Google Scholar] [CrossRef]
  34. Satyal, S.; Weber, I.; Paik, H.; Di Ciccio, C.; Mendling, J. Business Process Improvement with the AB-BPM Methodology. Inf. Syst. 2019, 84, 283–298. [Google Scholar] [CrossRef]
  35. Ahmed, M.; Seraj, R.; Islam, S.M.S. The K-Means Algorithm: A Comprehensive Survey and Performance Evaluation. Electronics 2020, 9, 1295. [Google Scholar] [CrossRef]
  36. Tsakalidis, G.; Nousias, N.; Madas, M.; Vergidis, K. Systematizing Business Process Redesign Initiatives with the BPR: Assessment Framework; IEEE: Amsterdam, The Netherlands, 2022. [Google Scholar]
  37. Tsakalidis, G.; Vergidis, K. Mitigating Financial Cybercrime with BPMN-Based Standardised Investigation Procedures. ERCIM News 2022, 48, 11–12. [Google Scholar]
  38. Baiyere, A.; Salmela, H.; Tapanainen, T. Digital Transformation and the New Logics of Business Process Management. Eur. J. Inf. Syst. 2020, 29, 238–259. [Google Scholar] [CrossRef]
  39. Independent Authority for Public Revenue (A.A.D.E.) Customs Service—General Directorate of Customs and Excise Duty. Available online: https://www.aade.gr/en/teloneia/customs-service-general-directorate-customs-and-excise-duty-0 (accessed on 21 January 2025).
  40. Tsakalidis, G. A Framework for Systematic Evaluation of Business Process Redesign (BPR) Initiatives Using the Notion of Model Plasticity. Ph.D. Thesis, University of Macedonia, Thessaloniki, Greece, 2022. [Google Scholar]
  41. Yang, X.-S. Introduction to Algorithms for Data Mining and Machine Learning; Elsevier: Amsterdam, The Netherlands, 2019. [Google Scholar]
  42. Amelio, A.; Tagarelli, A. Data Mining: Clustering. Encycl. Bioinform. Comput. Biol. ABC Bioinform. 2018, 437, 437–448. [Google Scholar]
  43. Kassambara, A. Practical Guide to Cluster Analysis in R: Unsupervised Machine Learning; SCreateSpace Independent Publishing Platform: Scotts Valley, CA, USA, 2017; Volume 1. [Google Scholar]
  44. Kokkinis, V. Business Process Model Plasticity: Inclusion and Evaluation of the PAR Heuristic. Master’s Thesis, University of Macedonia, Thessaloniki, Greece, 2022. [Google Scholar]
Figure 1. BPR Assessment Framework [3].
Information 16 00179 g001
Figure 2. Staging and measuring operation modes.
Information 16 00179 g002
Figure 3. Bar chart presenting the final cluster centers of plasticity.
Information 16 00179 g003
Figure 4. Bar chart presenting the final cluster centers of quality.
Information 16 00179 g004
Figure 5. BP case (2.11)—submission of a request for intervention.
Information 16 00179 g005
Figure 6. BP case (4.6)—authorization process for distilleries.
Information 16 00179 g006
Figure 7. BP case (2.3)—composition of audit reports (a more visible image is available at https://drive.google.com/file/d/1p_QmI1cPEKuzir4ktDy60vMSALPwqNlR/view, accessed on 21 January 2025).
Information 16 00179 g007
Figure 8. BP case (2.9)—process for initiation of personal company operation.
Information 16 00179 g008
Table 1. Internal measure values of real-life BPs.
Input ModelΞTSNOANSFANSFGNoAJSTNGCLACFCDOAFAGDMGDGHGM
1.10.18107261143.50040.1433300
1.20.2500412514.00020.2503302
1.30.2702146102062.33370.0713.16640.5794
1.40.5000422512.00020.2503302
1.50.1813134112073.25050.077330.3722
1.61010801001.25000.1000000
1.710870801.14300.1250000
1.810760701.16700.1430000
1.90.2500623823.00020.1673300
1.100.30007351032.33340.1433302
1.110.222212481753.00040.083330.4552
1.120.2380125111972.40080.0833302
1.130.7140752811.40020.1433302
1.140.058081111578.00080.1253302
1.150.08307161147.00040.1433300
1.160.09005181055.00060.2003302
2.10.315012681752.00050.7503.200401
2.20.235012481753.00060.0833302
2.310870801.14300.1250000
2.410320301.50000.3330000
2.50.400013661632.16760.0773306
2.60.400013661632.16760.0773306
2.71011901101.22200.0910000
2.810750701.40000.2860000
2.90.384110551332.00030.000330.582
2.100.35442211102862.00030.0453.333400
2.110.032527140502327.000260.0373.08040.6210
2.120.36308451132.00040.1253302
2.1310870801.14300.1250000
2.1410870801.14300.1250000
2.151010901001.11100.1000000
2.160.38422041830105.000190.0503.20040.4558
2.1710650601.20000.1670000
2.1810540501.25000.2000000
2.190.45419531121.80030.1113300
3.110760701.16700.1430000
3.210320301.50000.3330000
3.30.5601201462441.42930.050330.6300
3.41012901201.33300.0830000
3.51010901001.11100.1000000
3.610970901.28600.1110000
3.710650601.20000.1670000
3.80.048152022226610.00040.0007.333110.5790
3.910320301.50000.3330000
3.1010210202.00000.5000000
3.1110320301.50000.3330000
4.10.50010631221.66720.1003300
4.210870801.14300.1250000
4.310760701.16700.1430000
4.40.40018631021.33310.1253300
4.50.17629391563.00040.111330.5790
4.60.5262141051841.40020.1433300
4.710760701.16700.1430000
4.80.1110102101665.00080.1003.333401
4.910650601.20000.1670000
4.100.1421513725.00010.2003300
4.1110540501.25000.2000000
4.120.15307261143.50040.1433300
4.130.15332262119133.667150.0453.07640.6287
4.1410860801.33300.1250000
5.10.16642561935104.167100.3603.70050.6131
5.20.389113761741.85730.385330.6310
5.30.11101852333153.600150.3333.066401
5.40.087111282095.50090.182220.4822
MIN0.0320210201.111000000
MAX115271440502327260.7507.333110.63110
MEAN0.5810.8009.8604.9105.28012.7803.1702.8473.4700.1621.8152.0000.1221.111
SD0.3822.1325.4622.7647.3758.7594.2753.5504.9500.1241.6602.0160.2362.102
Table 2. Final cluster centers and ANOVA table for Plasticity.
Final Cluster CentersANOVA Table
ClusterClusterErrorFSig.
123Mean SquaredfMean Squaredf
Ξ0.0320.6650.2321.00520.118618.5510.001
TS50349.02523.0876115.8810.000
NOA27818610.691210.7936156.5840.000
NSFA15613.64927.445611.8330.169
NSFG403141242.384215.4456180.4370.000
NOAJS5010251781.514220.8186185.5750.000
TNG2328408.47025.4786174.5630.000
CLA27.0002.1473.941310.99422.81861110.3590.000
CFC2629481.86029.5126150.6590.000
DOAF0.0370.1740.1180.02220.015611.4660.239
Table 3. Correlation between plasticity and the internal measures.
MetricRESEQPAROverall PlasticityCluster Sequence (1→3→2)
Ξ+ ++
TS
NOA+ +
NSFA++++
NSFG
NOAJS
TNG
CLA
CFC++/−
DOAF+ ++
Table 4. Final cluster centers and ANOVA table for External Quality.
Final Cluster CentersANOVA Table
ClusterClusterErrorFSig.
123Mean SquaredfMean Squaredf
AGD1.5847.3333.08721.59622.1386110.1010.000
MGD211452.00022.4926120.8680.000
GH0.0870.5790.3810.34020.047617.3080.001
GM107108.59521.00161108.5170.000
Table 5. BPR capacity of the real-life BP repository.
Final Categories of BPR Capacity
LowLow to ModerateModerateModerate to HighHigh
2.111.31.51.12.73.10
3.82.162.51.22.83.11
3.32.61.42.94.1
4.132.101.62.124.2
1.121.72.134.3
5.11.82.144.4
5.31.92.154.5
5.41.102.174.6
1.112.184.7
1.132.194.8
1.143.14.9
1.153.24.10
1.163.44.11
2.13.54.12
2.23.64.14
2.33.75.2
2.43.9
024850
Table 6. Metric values of a BP case with low BPR capacity.
MetricΞTSNOANSFANSFGNoAJSTNGCLACFCDOAF
Plasticity TypeRESEQPARRESEQRESEQPARPARPARPARRESEQPARRESEQPARRESEQ
Value0.0325271140502327.00027.00026260.037
MetricAGDMGDGHGM
Quality TypeMODCORMODCORMODCORMODCOR
Value3.0803.080440.620.621010
Table 7. Metric values of a BP vase with high BPR capacity.
MetricΞTSNOANSFANSFGNoAJSTNGCLACFCDOAF
Plasticity TypeRESEQPARRESEQRESEQPARPARPARPARRESEQPARRESEQPARRESEQ
Value0.526214101061841.4001.400220.143
MetricAGDMGDGHGM
Quality TypeMODCORMODCORMODCORMODCOR
Value33330000
Table 8. Metric values of a BP case with low BPR capacity.
MetricΞTSNOANSFANSFGNoAJSTNGCLACFCDOAF
Plasticity TypeRESEQPARRESEQRESEQPARPARPARPARRESEQPARRESEQPARRESEQ
Value0.2153519193151162.6922.692990.029
MetricAGDMGDGHGM
Quality TypeMODCORMODCORMODCORMODCOR
Value3.1253.125440.5110.51166
Table 9. Distance of case study from cluster centroids.
PlasticityExternal Quality
Centroid 1 (Low)Centroid 3 (Moderate)Centroid 2 (High)Centroid 2 (Low)Centroid 3 (Moderate)Centroid 1 (High)
Distance37.40238.46861.19610.1340.9086.161
Table 10. Metric values of a BP case with high BPR capacity.
MetricΞTSNOANSFANSFGNoAJSTNGCLACFCDOAF
Plasticity TypeRESEQPARRESEQRESEQPARPARPARPARRESEQPARRESEQPARRESEQ
Value0.0660711913677330.143
MetricAGDMGDGHGM
Quality TypeMODCORMODCORMODCORMODCOR
Value33330030
Table 11. Distance of case study from cluster centroids.
PlasticityExternal Quality
Centroid 1 (Low)Centroid 3 (Moderate)Centroid 2 (High)Centroid 2 (Low)Centroid 3 (Moderate)Centroid 1 (High)
Distance63.03219.36910.5409.1166.8772.017
Disclaimer/Publisher’s Note: The statements, opinions and data contained in all publications are solely those of the individual author(s) and contributor(s) and not of MDPI and/or the editor(s). MDPI and/or the editor(s) disclaim responsibility for any injury to people or property resulting from any ideas, methods, instructions or products referred to in the content.

