Article

Reconciling Livelihood and Tourism: A Data-Driven Diagnosis of Spatial Vitality in Small-Town China’s Historic Districts


1
School of Architecture and Urban Planning, Beijing University of Civil Engineering and Architecture, Beijing 100044, China
2
School of Civil Engineering, Jiaying University, Meizhou 514015, China
*
Authors to whom correspondence should be addressed.
Information 2025, 16(11), 963; https://doi.org/10.3390/info16110963
Submission received: 23 September 2025 / Revised: 29 October 2025 / Accepted: 3 November 2025 / Published: 6 November 2025
(This article belongs to the Special Issue Techniques and Data Analysis in Cultural Heritage, 2nd Edition)

Abstract

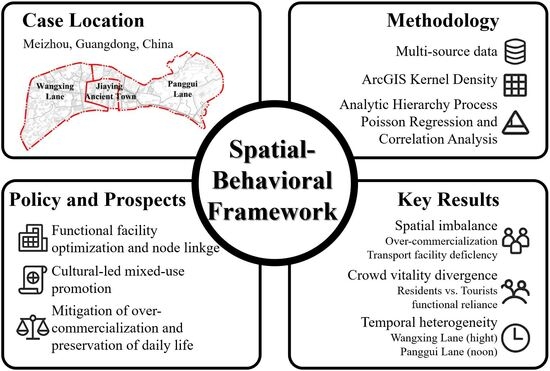
This study addresses the critical conflict between livelihood preservation and commercial tourism in the residential historic districts of small-town China—a context often overlooked in urban studies. Taking Meizhou’s “One Town, Two Lanes” as a case, we propose a novel multi-source data fusion framework integrating POIs, population heatmaps, and questionnaire surveys. By applying Analytic Hierarchy Process (AHP), Poisson regression, and spatial correlation analysis, we quantitatively diagnose spatial disorders. The results reveal a dual-suppression mechanism: residential vitality, reliant on public services, is suppressed by commercial tourism, while tourist vitality is diminished by experience–quality gaps. This conflict manifests as pronounced vitality fractures. Our methodology and findings provide a replicable framework for diagnosing and resolving spatial conflicts in similar historic districts, emphasizing the imperative of prioritizing residential continuity.

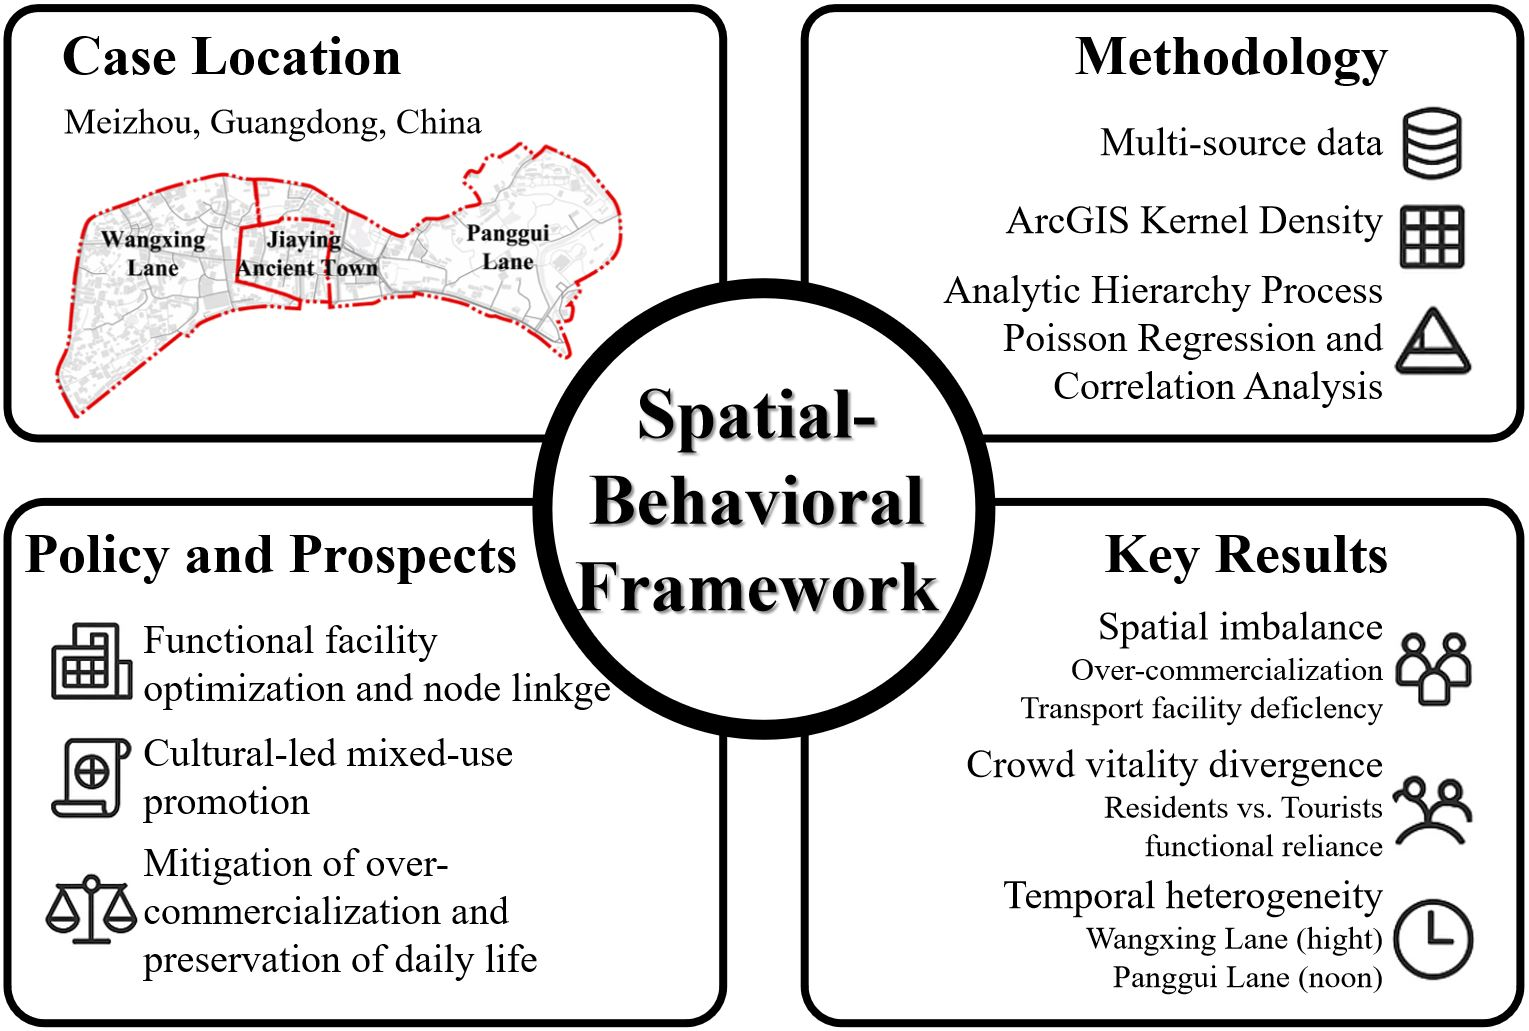
Graphical Abstract

1. Introduction

Throughout China, historic districts possess significant value, encompassing historical, commercial, aesthetic, and residential dimensions. However, many developers prioritize commercial and aesthetic gains over residents’ needs and historical authenticity, leading to homogenization and gentrification. As essential components of urban spatial structure, these districts serve as core carriers of urban function and local culture, each exhibiting distinctive morphological features [1,2]. Yet they increasingly face “hollowing out,” driven by poor building conditions and inadequate infrastructure [3]. This is especially critical in smaller counties with weak oversight, where outmigration and unregulated renovations disrupt architectural coherence and undermine public space vitality.
From socio-spatial and cultural perspectives, current renovation models often neglect local culture, accelerating the loss of spatial identity and vitality. Modern functional demands frequently conflict with the historical built environment [4], resulting in behavioral–spatial mismatches that dilute everyday authenticity. Economically, preservation remains imbalanced, favoring tourism over integrated value development. As original residents are displaced by tourists and commercial operators, spatial conflicts intensify. While commercial renovations can stimulate localized prosperity, excessive redevelopment often fractures living spaces and causes uneven vitality distribution [5,6]. Ultimately, profit-driven renewal practices simplify and reconstruct cultural heritage, diminishing place attachment [7] and contributing to the increasing uniformity of historic districts nationwide.
The theory of spatial behavior has evolved over many years, forming a multi-dimensional research framework, while notable disparities exist in the types of regions scholars focus on. Kevin Lynch emphasized the interaction between spatial functions and behavioral activities [8]; Jan Gehl argued that social vitality constitutes the core of public space vitality [9]; and Chen Zhe’s classification theory of vitality points offers analytical tools for addressing discontinuous vitality patterns [10]. Furthermore, prior research has predominantly concentrated on areas with high commercial value, such as commercial districts and city centers [11,12], as well as residential historic districts within major metropolitan areas [13,14]. Overall, while a robust theoretical foundation has been established, significant geographical and typological imbalances persist in current scholarly attention [15].
Building upon prior research on spatial perception and cultural identity, this study proposes three hypotheses regarding the drivers of spatial vitality in historic districts and examines them through the case study of Meizhou’s “One Town, Two Lanes”. By constructing a multidimensional “space–behavior” framework and integrating multi-source data with subjective evaluations, this research aims to clarify how spatiotemporal crowd activity and functional distribution affect spatial vitality. It further seeks to address intergenerational perspective gaps in current studies and provide empirical support for renewal strategies in China’s small-town historic districts:
H1. 
The degree of commercialization in historic districts significantly influences spatial vitality.
H2. 
Diverse usage demands result in uneven spatial vitality distribution.
H3. 
Different user groups generate extreme variations in spatial vitality.

2. Literature Review

Academic discourse on residential historic district conservation has evolved considerably, increasingly focused on preserving historical and cultural heritage. This literature review addresses three key areas: the development of conservation frameworks, renewal approaches, and research methodologies.

2.1. The Establishment and Development of the Protection System

International conservation philosophy has evolved from “preservation, protection, and maintenance” to more dynamic approaches. The 1931 Athens Charter established foundational principles, later advanced by the Venice Charter’s emphasis on preserving original fabric. The 1975 Amsterdam Declaration promoted a shift from “static preservation” to “dynamic utilization” [16], further reinforced by the Washington Charter’s integration of conservation with urban planning. The Nara Document highlighted cultural diversity and context-dependent authenticity, complemented by the Hoi An Draft’s regional standards for Asian heritage. Key policies such as the 2007 UN Declaration on the Rights of Indigenous Peoples and UNESCO’s 2011 Recommendation on Historic Urban Landscapes integrated socioeconomic development into conservation. The Valletta Principles subsequently formalized “safeguarding” as a key concept.
Academic contributions further advanced the discourse. Jane Jacobs (1961) emphasized small-scale, incremental regeneration [17]; Christopher Alexander (1975) advocated community participation [18]; and David Adams et al. (2001) framed renewal as balancing development and heritage [19]. Later scholars addressed issues such as marginalization of local voices [20], elite versus local heritage discourses [21], comparative governance models [22], participatory methods [23], and small-scale interventions [24].

2.2. Exploring the Protection Update Model

Protection models have increasingly emphasized residential continuity and community involvement. Bologna’s 1907 policy required retaining over 90% of original residents [25], while France’s 1977 “Improved Housing Programme” enhanced living conditions [26]. Japan institutionalized resident-led planning, as seen in Imaimachi. In China, conservation efforts since the late 1980s incorporated social concerns, leading to people-centered strategies. The first phase promoted “organic renewal” for social and contextual continuity [27,28]; the second critiqued gentrification and emphasized micro-renewal [29,30]; and the third embedded indigenous perspectives into planning [31]. This evolution reflects growing recognition of the importance of social fabric to sustainable conservation.

2.3. Research Focus

International research often adopts macro-level approaches, focusing on community participation [32,33,34], urban structures [35], functional replacement [36,37,38], and intrinsic values [39,40]. While “vitality” studies internationally concentrate on urban scales, Chinese researchers often examine “spatial vitality” at finer scales, such as districts or neighborhoods [41,42]. Studies vary in focus: some analyze spatial form and living patterns [43,44]; others urban fabric [45]; revitalization through functional replacement [46,47,48]; or neighborhood vitality [49]. Overall, current research combines macro-level participatory processes with micro-scale spatial vitality, using diverse methods to address both community and structural dimensions.

2.4. Advances in Multi-Source Data for Spatial Vitality Research

Regarding the application of multi-source data in spatial vitality research, academia has recently explored multi-perspective [50,51,52] and multi-object [53,54,55] approaches. This paper systematically reviews relevant research progress across two dimensions: first, the practical application of multi-source data in urban studies; second, existing findings on behavioral differences between residents and visitors.
At the data application level, big data technologies such as POIs [56,57], heatmaps [58], and questionnaire [59] surveys have been widely adopted in urban research. However, existing studies are often limited to single data types or simple combinations of two data types, with few scholars achieving systematic integration and analysis of multi-source data. In the field of historical heritage preservation, commercial value has consistently been the primary focus of developers [60], as evidenced by extensive research on tourist attraction quality evaluation and visitor spatiotemporal distribution patterns. In contrast, systematic preservation of historical and cultural value has only recently garnered academic attention: some scholars have begun exploring residents’ environmental protection behaviors within tourist settings [61,62], while others focus on behavioral pattern differences between residents and tourists [63,64]. Additionally, some researchers approach historic district studies through spatial perception evaluation [65,66]. Current research has widely adopted big data technologies such as POIs and heatmaps, yet the systematic integration of multi-source data remains inadequate. Meanwhile, in the field of historical heritage conservation, commercial value has long dominated research priorities, while systematic preservation of historical and cultural value, along with related behavioral studies, has only recently begun to attract scholarly attention.
Notably, existing research generally suffers from a limitation of single-perspective analysis: it neither delves into the formation mechanisms of spatiotemporal differentiation in spatial vitality from the dimension of user behavioral differences, nor proposes a systematic strategic framework for the coordinated preservation of both tangible cultural heritage (such as buildings and streets) and intangible cultural heritage (such as residents) within historic districts. This research gap represents the key area this study aims to address.

3. Materials and Methods

3.1. Study Area

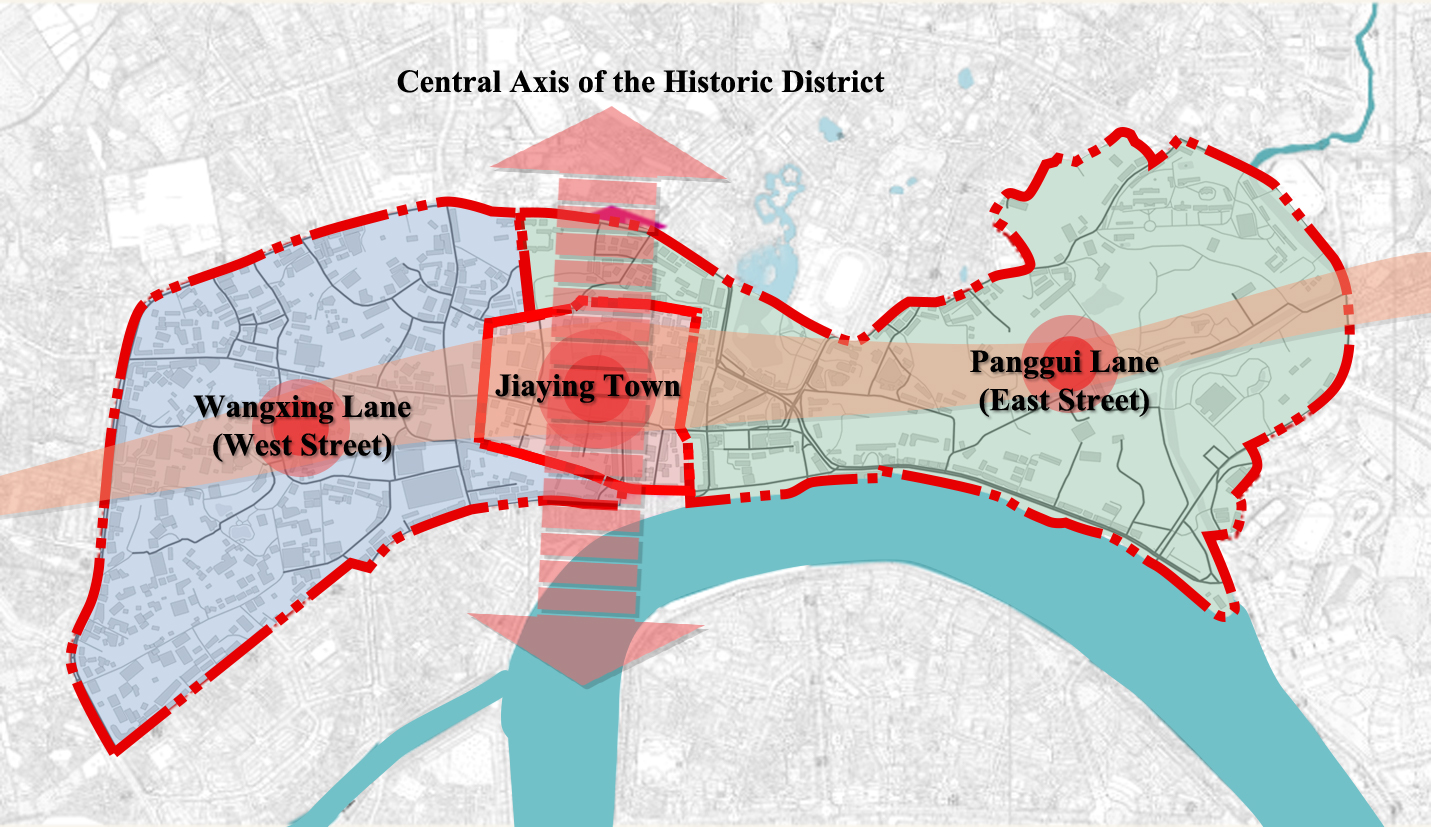
This study focuses on the “One Town, Two Lanes” historic district in Meizhou City, Guangdong Province, China. The spatial layout of this area originated from the Tang Dynasty’s li-fang system, which separated residential and commercial districts to enhance governance efficiency. As illustrated in Figure 1, “One Town” refers to Jiaying Town while “Two Lanes” comprise Pangui Lane and Wangxing Lane. The selection of this case study is based on its exceptional typicality, representativeness, and the prominence of its challenges.
As the core birthplace of Hakka culture, Meizhou possesses immense historical and cultural value. Unlike historic districts in metropolitan areas like Beijing and Shanghai, this medium-sized city faces more acute conflicts between hollowing out, over-commercialization, and authenticity preservation in its historic neighborhoods—challenges often overlooked in academic research due to weak regulatory capacity. Therefore, this case study effectively reveals the common dilemmas faced by numerous small and medium-sized towns in China during preservation and development processes, making the research findings highly transferable. Figure 2 clearly illustrates the structure of the “One Town, Two Lanes” area.
Through research on historical images, it is revealed that the core structure of the “One Town” and “Two Lanes” has been preserved, demonstrating the stability of this neighborhood’s historical value. Simultaneously, subtle changes reflect the impact of urban development on the historic district, providing a basis for understanding the historical roots of current spatial conflicts in this study. This study takes this site as its subject to explore the spatial vitality manifested in its modern applications.

3.2. Data Sources

This study integrates three data sources: spatial data, behavioral data, and subjective evaluation data (Table 1).
Using these, it constructs a vitality assessment framework for historic residential districts from both subjective and objective perspectives. This approach overcomes the limitations of relying on a single methodology by comparing the differing impacts of residents and visitors on spatial vitality.

3.3. Data Analysis Methods

This study employed a combined approach of multi-source data and quantitative analysis to systematically evaluate the spatial vitality of neighborhoods in Meizhou City from multiple subjective and objective dimensions. Using POIs and road data, spatial patterns of commercial formats were analyzed with kernel density estimation and Moran’s I. Population activity and vitality were quantified via heatmaps and surveys, with POI impacts assessed through incidence rate ratios. Spearman’s rank correlation explored function–vitality relationships. All analyses were conducted on a unified grid to ensure reproducibility and comparability. Crucially, the core analysis of POI impacts on vitality was conducted using Poisson regression, a model specifically chosen for its rigor in modeling count-based data and providing the statistical foundation for the incidence rate ratios. The specific analytical methods, along with their corresponding tools, objectives, and the statistical formulas employed, are detailed in Table 2.

3.4. Methodology

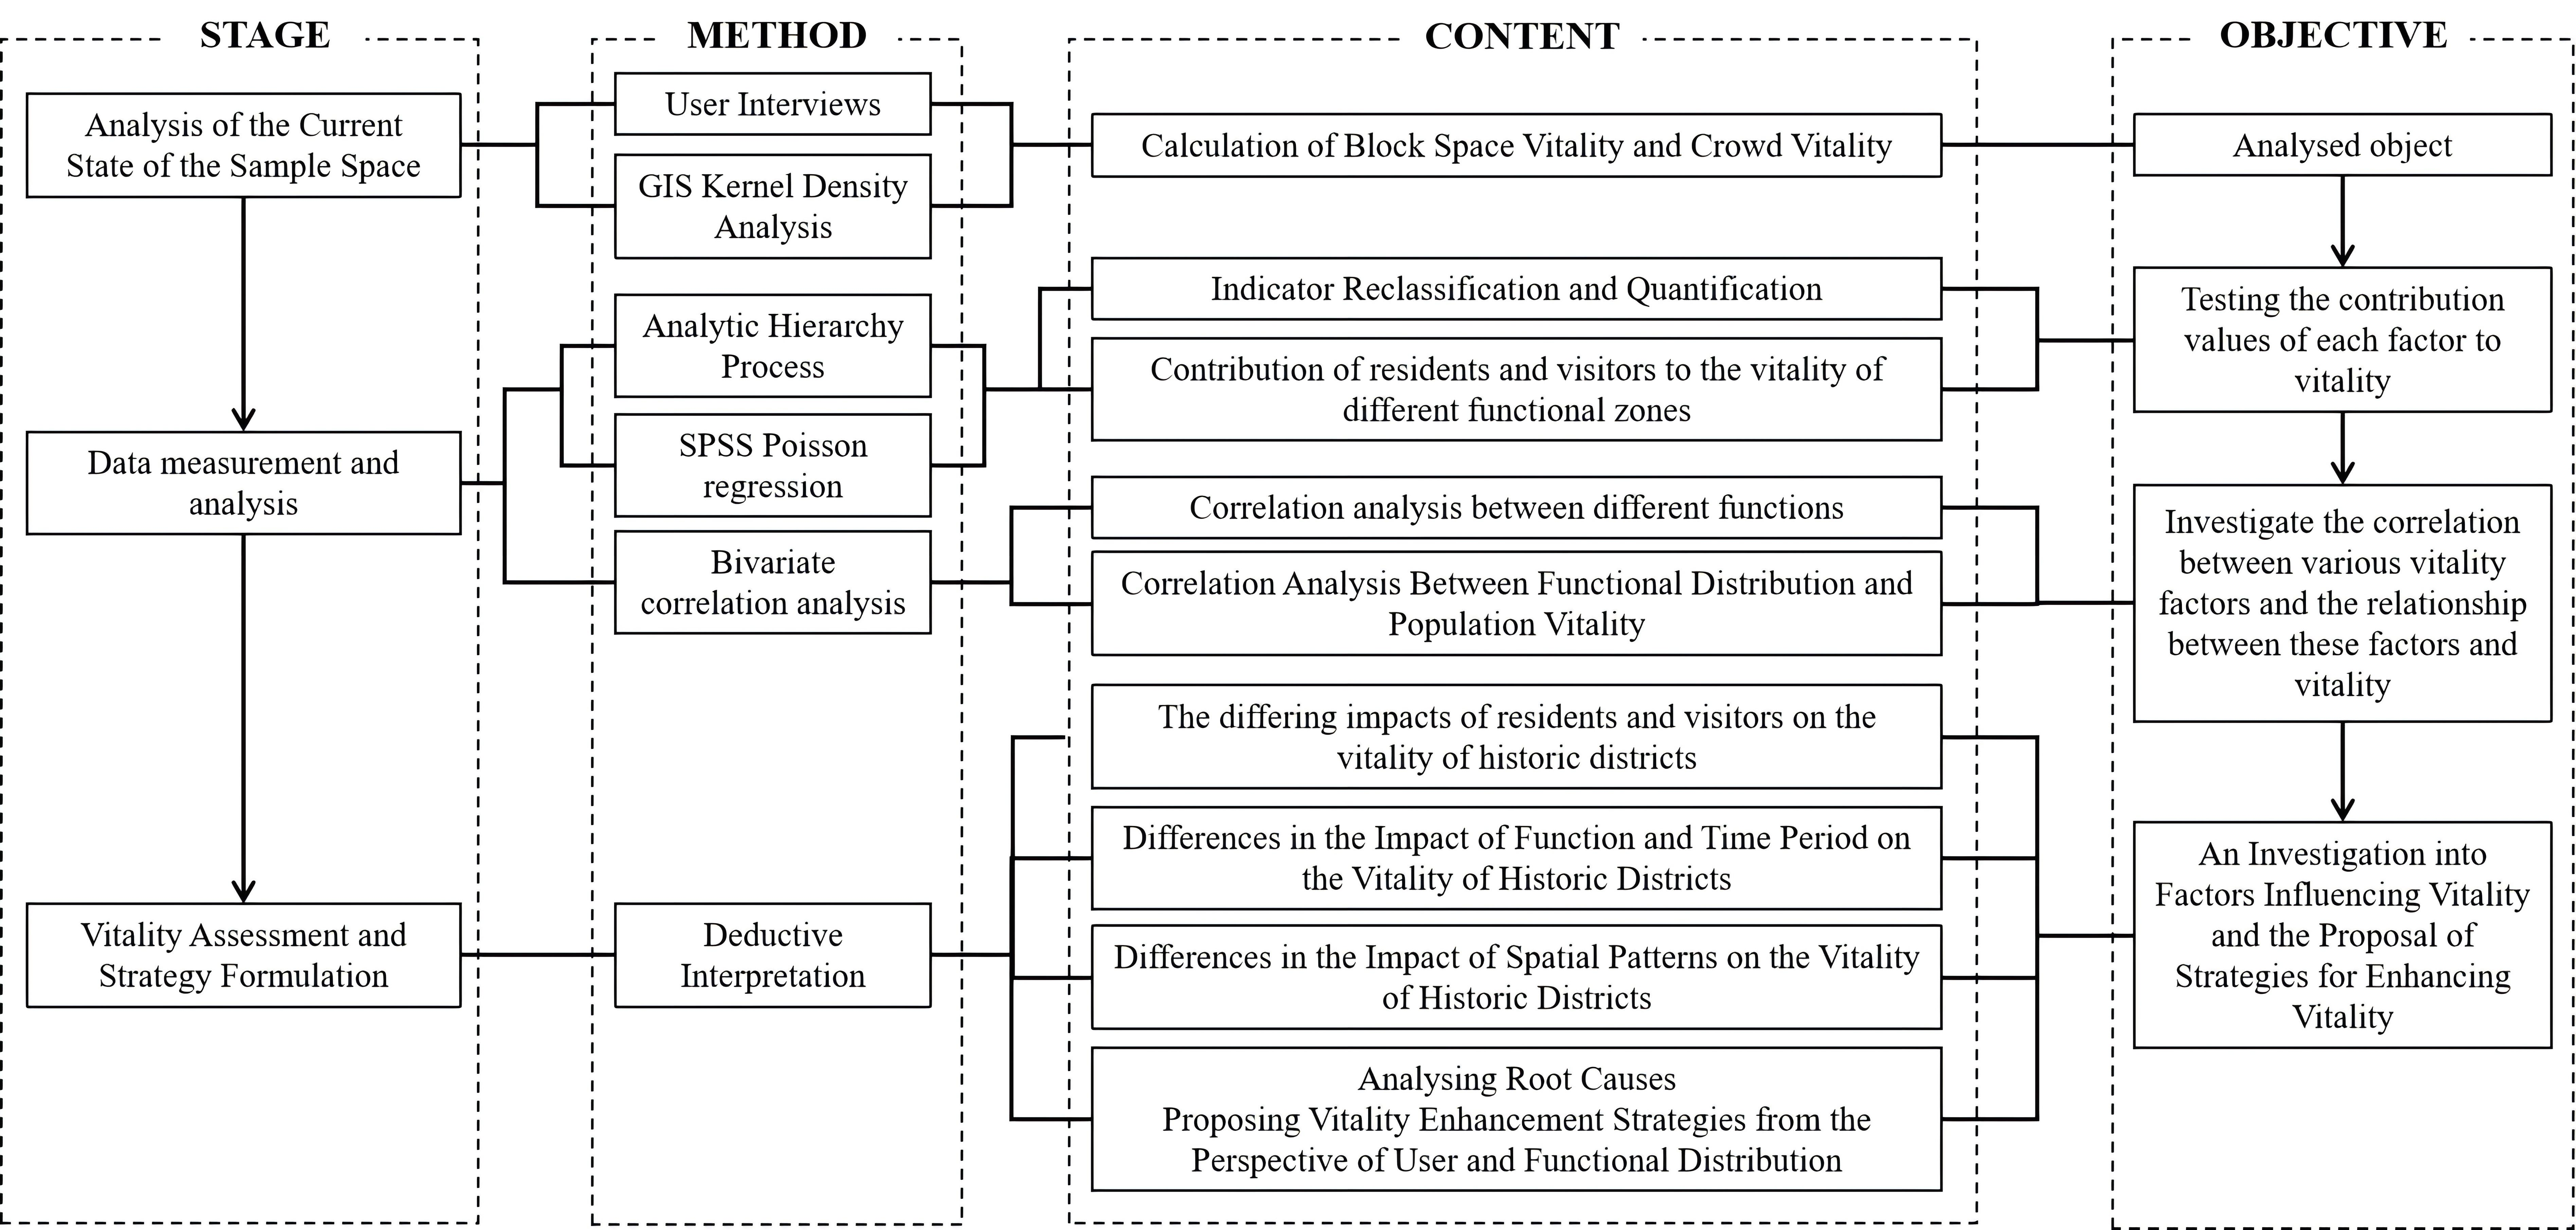
As shown in Figure 3, this study employed a systematic and reproducible analytical framework. The methodological details for each component are as follows:
  • Spatial and Crowd Vitality Metrics: Spatial vitality was quantified using 2024 Amap POI data classified into functional categories. Crowd vitality was derived from Baidu Heatmap data (June 2024), with relative population density values normalized and reclassified into Low, Medium, and High levels based on defined percentile thresholds for comparative analysis.
  • Analytic Hierarchy Process (AHP): Subjective weights for spatial functions were determined from resident and tourist perspectives using 40 valid questionnaires. Pairwise comparison matrices were constructed, with weights calculated through eigenvector resolution and validated by a consistency check (CR < 0.1).
  • Poisson Regression: A Poisson regression model was applied to analyze the relationship between POI counts and non-negative crowd vitality scores. Results were interpreted using Incidence Rate Ratios (IRR), where IRR > 1 indicates a positive effect and IRR < 1 indicates a suppressive effect.
  • Spatial and Correlation Analysis: Spatial patterns were examined through kernel density analysis in ArcGIS using a 200 m search radius and 10 m cell size, while global spatial autocorrelation (Moran’s I) in GeoDa confirmed spatial dependency between POIs and crowd activity, complemented by Spearman’s rank correlation analysis in SPSS to assess monotonic relationships between functional distribution and vitality levels across different spatiotemporal contexts.
In summary, we employ a systematic methodology to address three research hypotheses through cross-validation of multi-source data. Specifically, H1 (commercialization impacts vitality) was validated using Poisson regression and Spearman correlation analysis to examine relationships between commercial POI distribution and vitality scores; H2 (demand drives vitality disparities) was tested through comparative analysis of heatmap distributions across weekdays versus weekends using kernel density techniques; and H3 (user groups drive activity disparities) was investigated by applying AHP and contribution calculations to identify and compare vitality drivers between residents and tourists. Further analysis of temporal variations and spatial patterns revealed how functional and spatiotemporal factors differentially influence historic district vitality, with deductive reasoning employed to interpret underlying causes. Ultimately, targeted revitalization strategies were developed from user behavior and functional distribution perspectives, providing both empirical evidence and theoretical support for sustainable renewal and spatial optimization of historic districts.

3.5. The Mutual Influence of Behavior and Space in Historic Districts

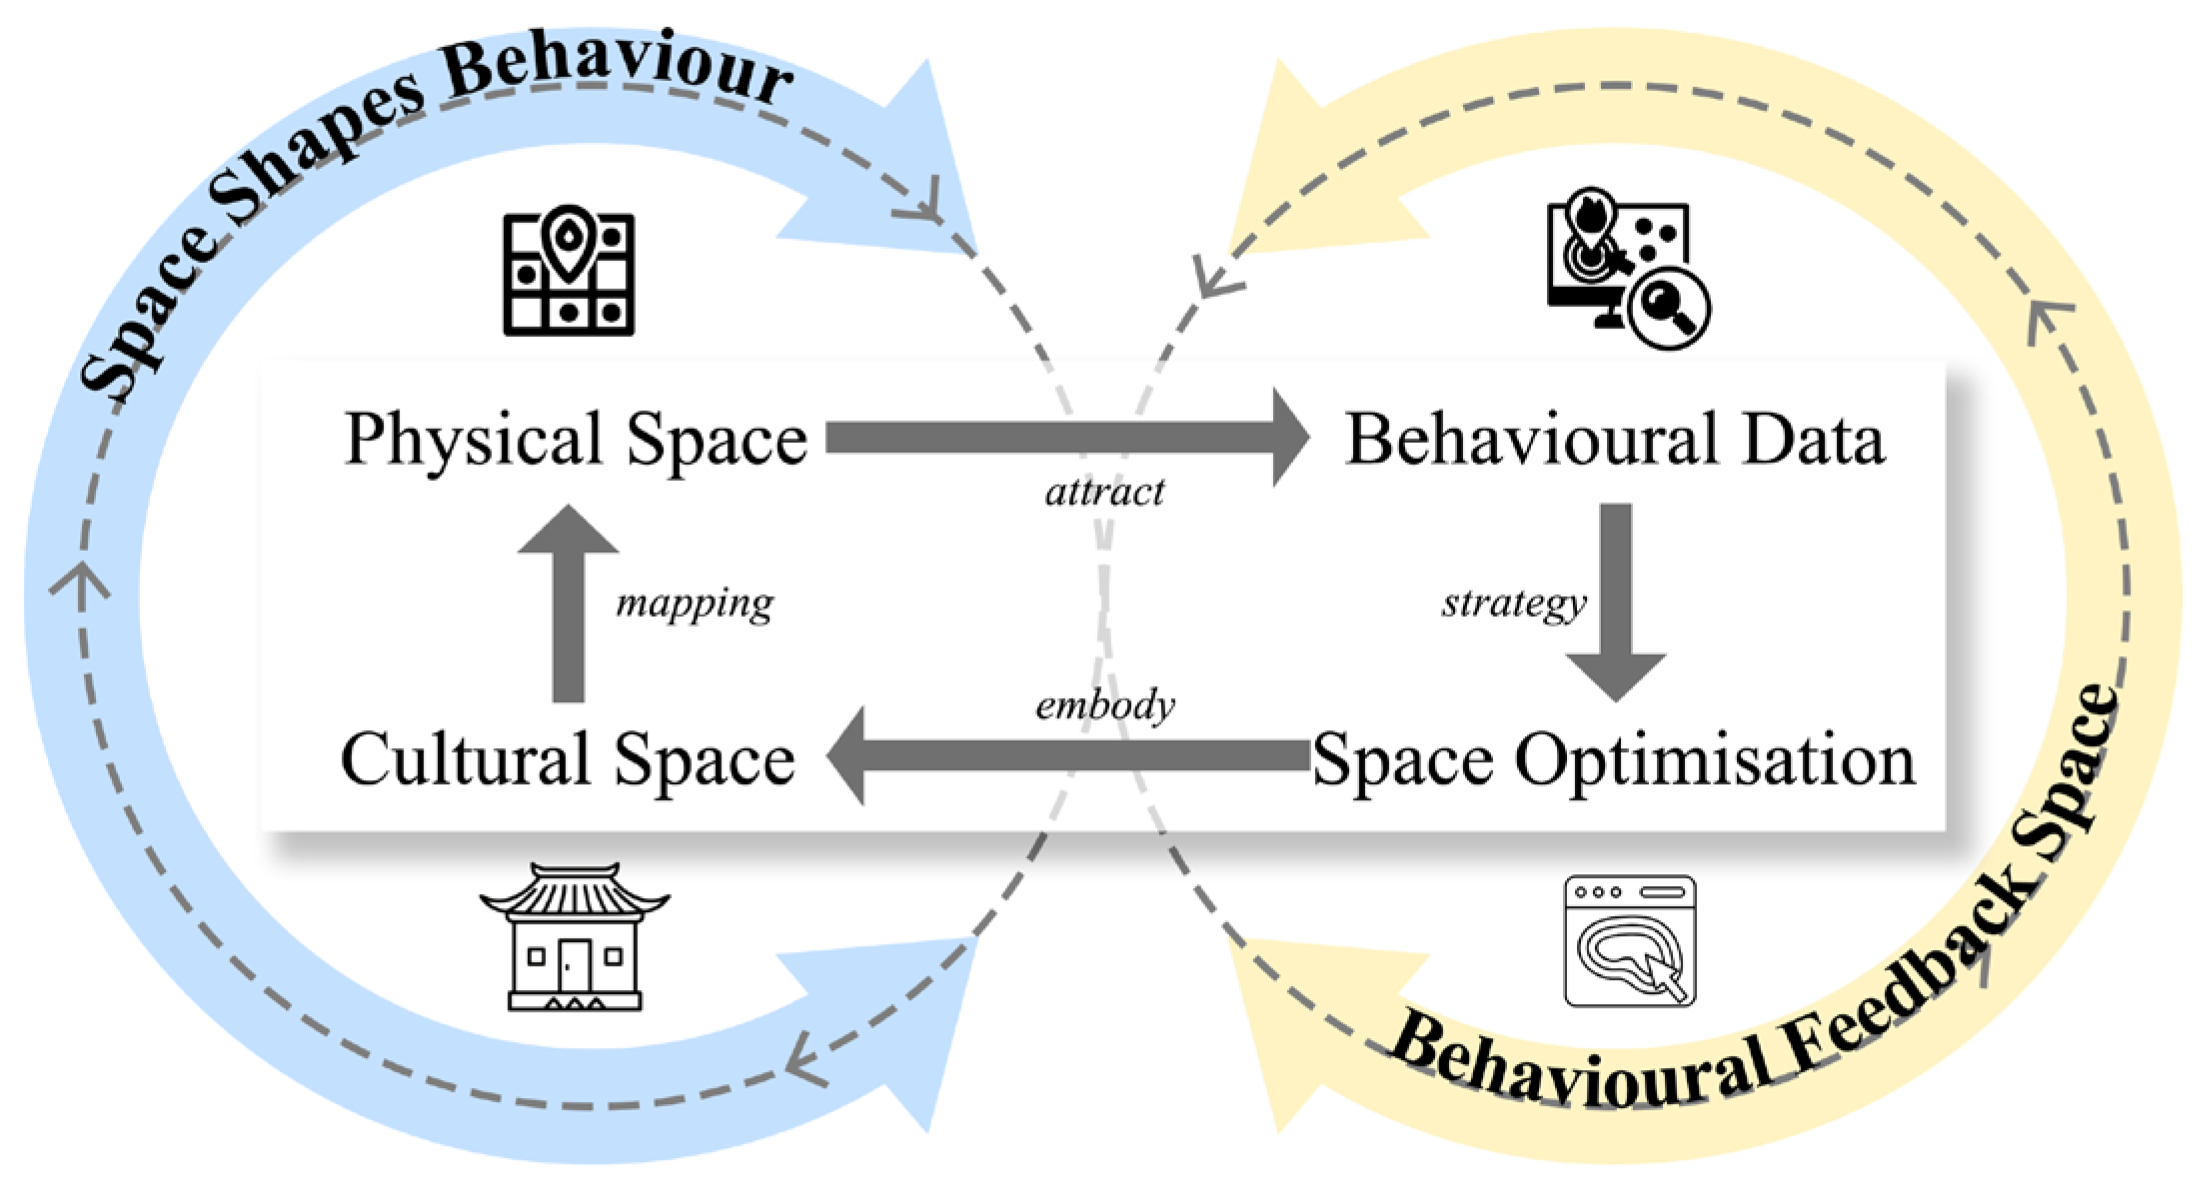
This study develops a new indicator system based on its theoretical framework (Figure 4), focusing on the behavior-space relationship within historic districts through three dimensions: physical space, cultural space, and behavioral activity. By integrating and mapping multi-source data, the system ultimately aims to formulate and implement spatial optimization strategies. Historical document analysis is employed to trace cultural evolution, events, and traditional behavior patterns, revealing how cultural space shapes public activity. At the physical level, Amap POI and OSM road network data delineate functional distribution, spatial structure, and accessibility, illustrating how the built environment guides and constrains behavior. Meanwhile, Baidu heatmaps capture spatiotemporal pedestrian flows, reflecting actual public behavior and aggregation patterns to support data-informed spatial interventions.
These three data types interact through a bidirectional mechanism of “attraction” and “manifestation,” collectively constituting a “behavioral feedback space” that offers an empirical basis for spatial optimization. Through integrated multidimensional analysis, targeted spatial strategies are formulated to simultaneously preserve cultural heritage and enhance spatial quality, thereby establishing a sustainable cycle of positive “space–behavior” interaction.

4. Analysis of Factors Influencing the Vitality of Historic District

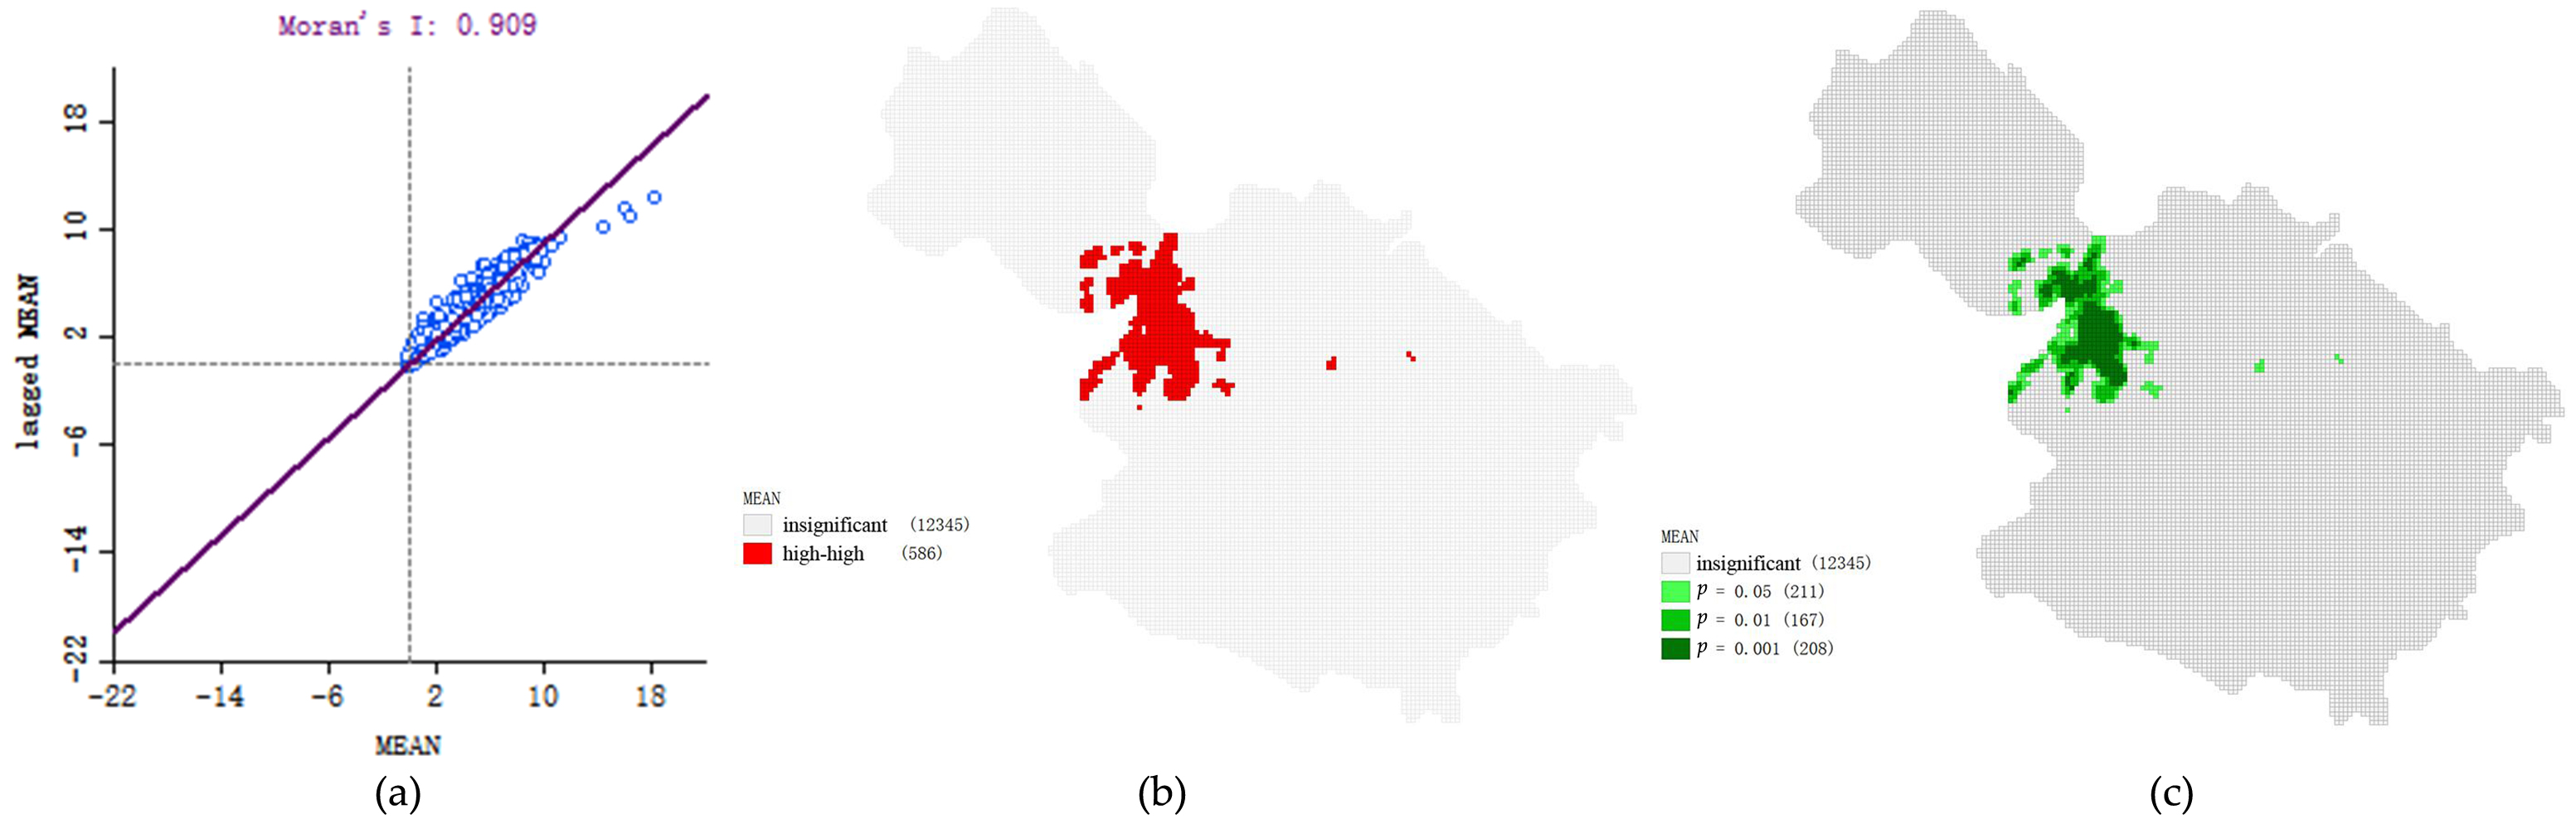
Using kernel density analysis in ArcGIS, POI data and population activity data were calculated and compared within the same spatial scope [74]. The global Moran’s I statistic was computed using GeoDa to evaluate their spatial interdependence.
Figure 5 presents the results of this global spatial autocorrelation analysis. A very high Moran’s I value of 0.9 (p < 0.01) indicates a strong, statistically significant positive spatial correlation between the distribution of POIs and population activity. The cluster distribution diagram (b) and significance map (c) visually confirm that this relationship is characterized by a pronounced high-high clustering pattern—meaning areas with high POI density tend to coincide with areas of high population activity, and vice versa. This result is critical for our subsequent analysis as it validates that the two key datasets are not randomly distributed but are spatially dependent. This justification allows us to proceed with confidence in using spatial statistics (like regression and correlation analysis) to model the factors influencing activity levels, as these methods rely on the premise that spatial autocorrelation exists.

4.1. Calculation of Spatial Vitality Values for Historic Districts

ArcGIS kernel density analysis was employed to examine the distribution patterns of various functional sectors. The results reveal an uneven development across different facility types: infrastructure, while sufficient in quantity, shows a patchy distribution with higher concentration in the central area and lower density peripherally. Transport facilities are severely lacking, especially in Wangxing Lane and Pangui Lane, where they appear only in scattered, isolated points. Although service and tourism/cultural facilities are adequate in number and form clusters, they are primarily concentrated in Jiaying Ancient Town and the outer periphery, failing to establish a connective role between Wangxing Lane and Pangui Lane.
Figure 6 visually summarizes these spatial clustering characteristics through kernel density maps of four functional sectors: (a) infrastructure, (b) transport, (c) service, and (d) tourism and culture. This figure is essential for our subsequent analysis as it provides a visual basis for understanding the imbalance in functional distribution. It clearly illustrates the disparities in density and connectivity among sectors, allowing us to correlate these spatial patterns with vitality data in later sections. These insights help explain why certain areas exhibit low spatial vitality and support the planning strategies proposed in the conclusion.

4.2. Calculation of Crowd Vitality in Historic Districts

4.2.1. Typical Time Periods and Vitality Value Classification

Population activity data was collected on a weekday (13 June 2024) and a weekend day (16 June 2024) at three-hour intervals. Total heat values were extracted from four representative time periods—morning (7:00~9:00), lunchtime (11:00~13:00), afternoon (17:00~19:00), and evening (20:00~22:00)—to quantitatively assess neighborhood crowd activity [75].
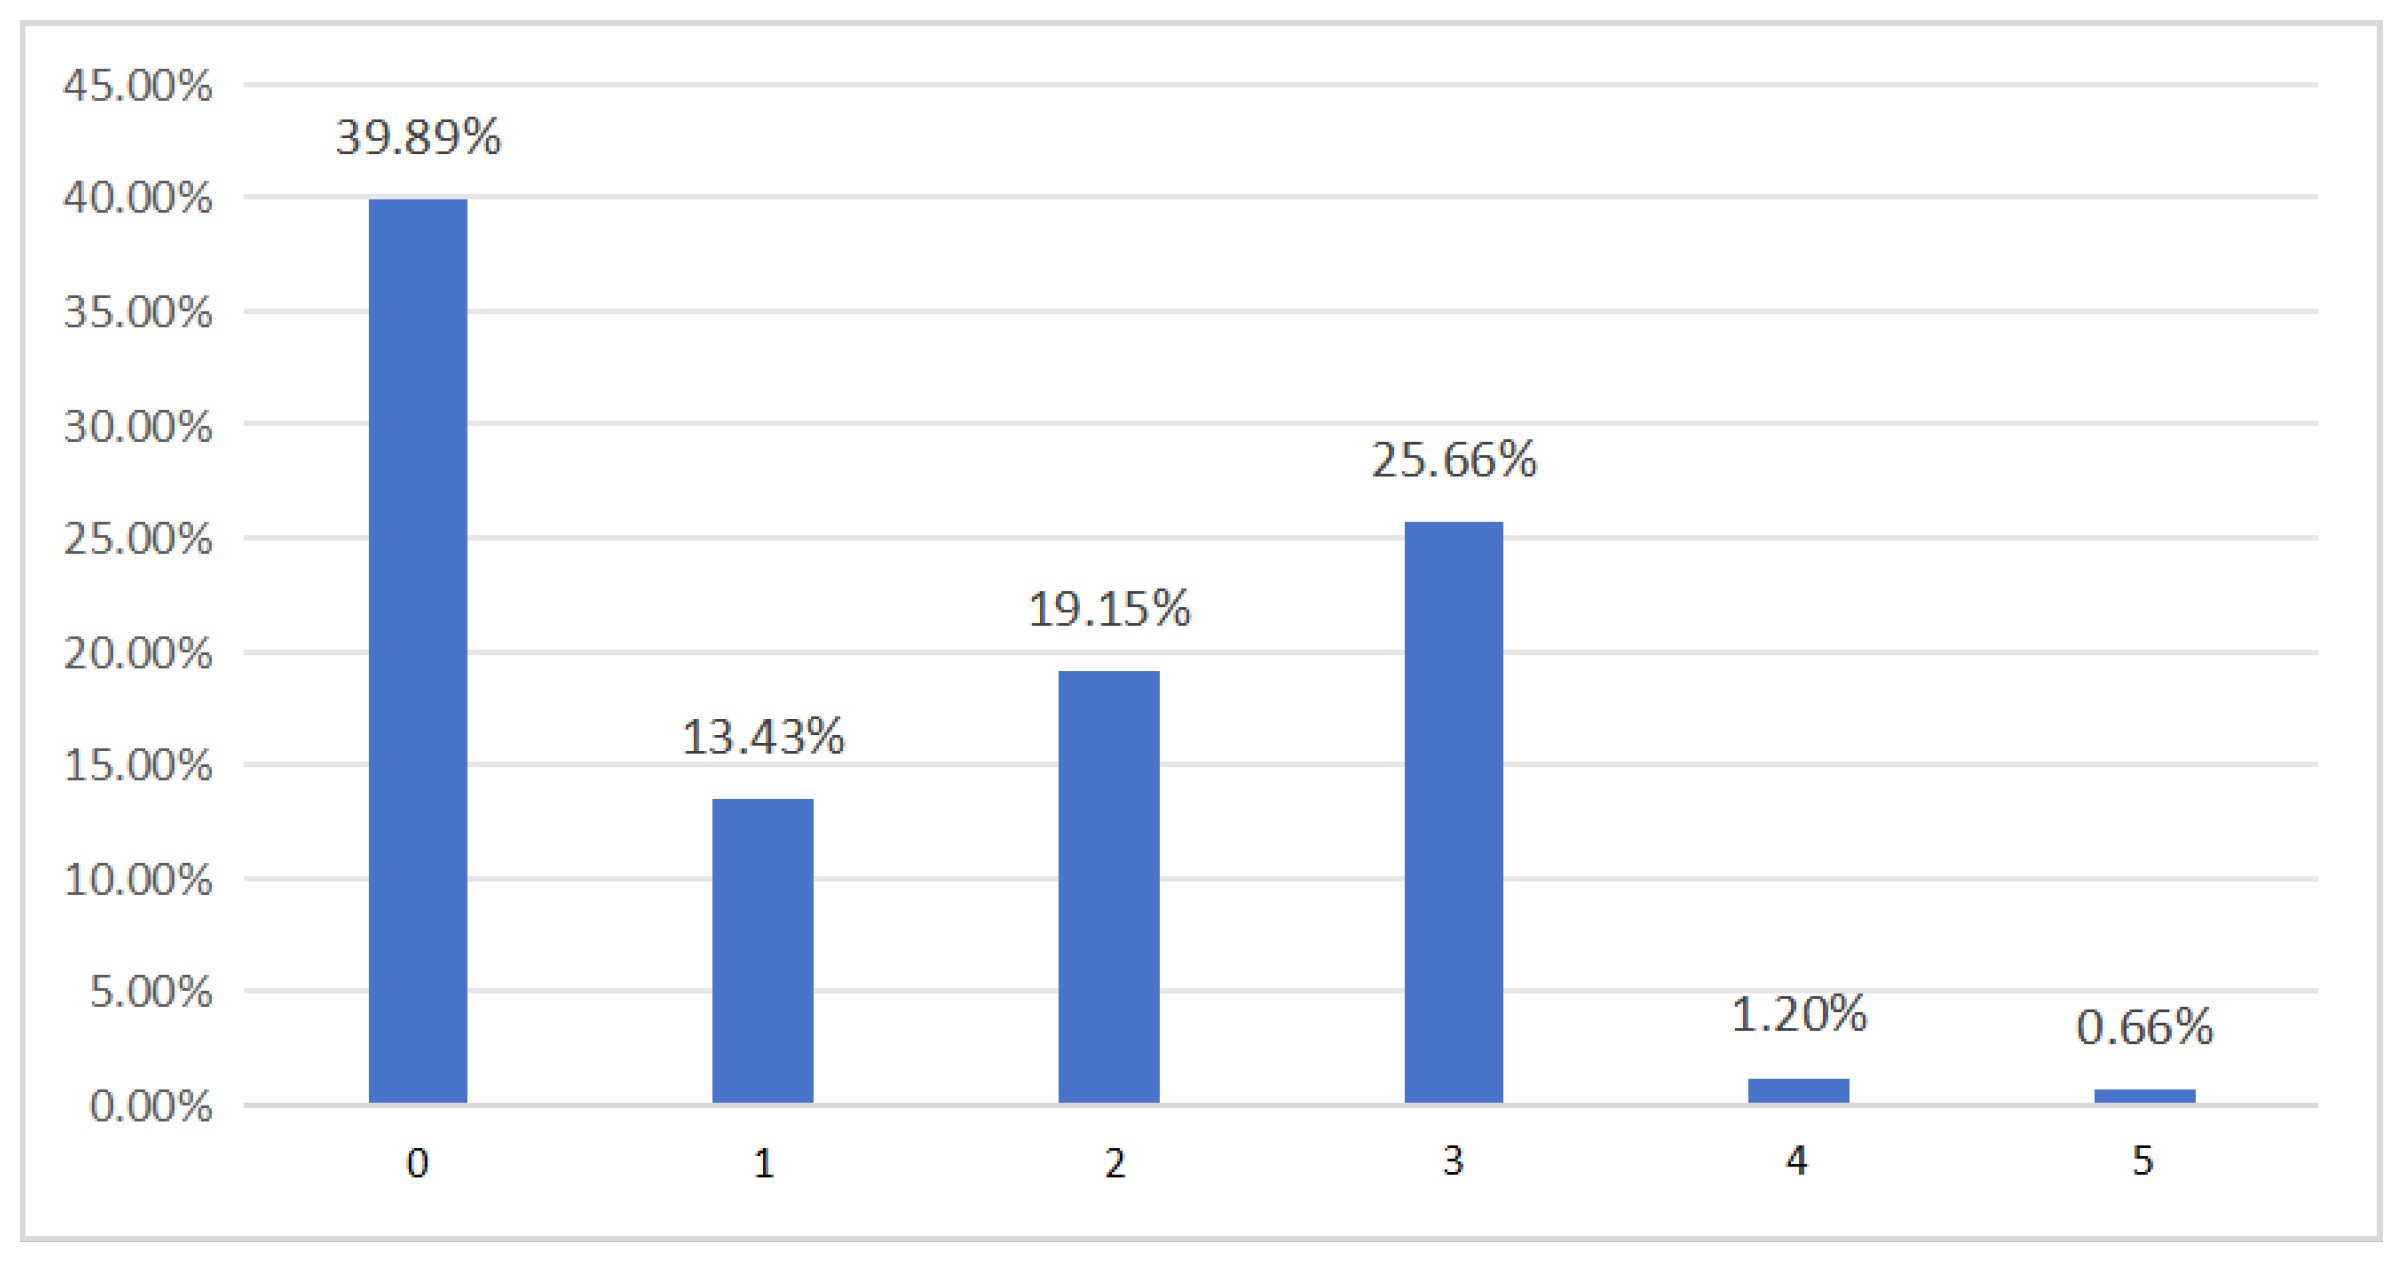
To visually illustrate the fundamental characteristics of the data, statistical analysis was conducted on the overall distribution of vitality values after dividing the data into typical time periods. The frequency and proportion of each vitality value are summarized in Figure 7.
Figure 7 clearly shows that the distribution of population activity values within the study area exhibits significant skewness. The cumulative proportion of activity values between 0 and 1 is 53.3%, representing the most common baseline activity state in the study and thus classified as “low activity.” The cumulative proportion for activity values 2–3 is 44.8%, forming another major cluster representing a regular active state, thus classified as “medium activity.” Observations with activity values ≥4 account for only 1.9% of the data, constituting a statistical “tail event” that represents an exceptionally active peak state, hence classified as “high activity.” This classification ensures homogeneity within each category and significant heterogeneity between categories. Following this scheme, the raw data was categorized to obtain the overall distribution of activity types, as shown in Table 3. This result will serve as the baseline for subsequent spatiotemporal analysis in later sections.

4.2.2. Calculation of Crowd Vitality

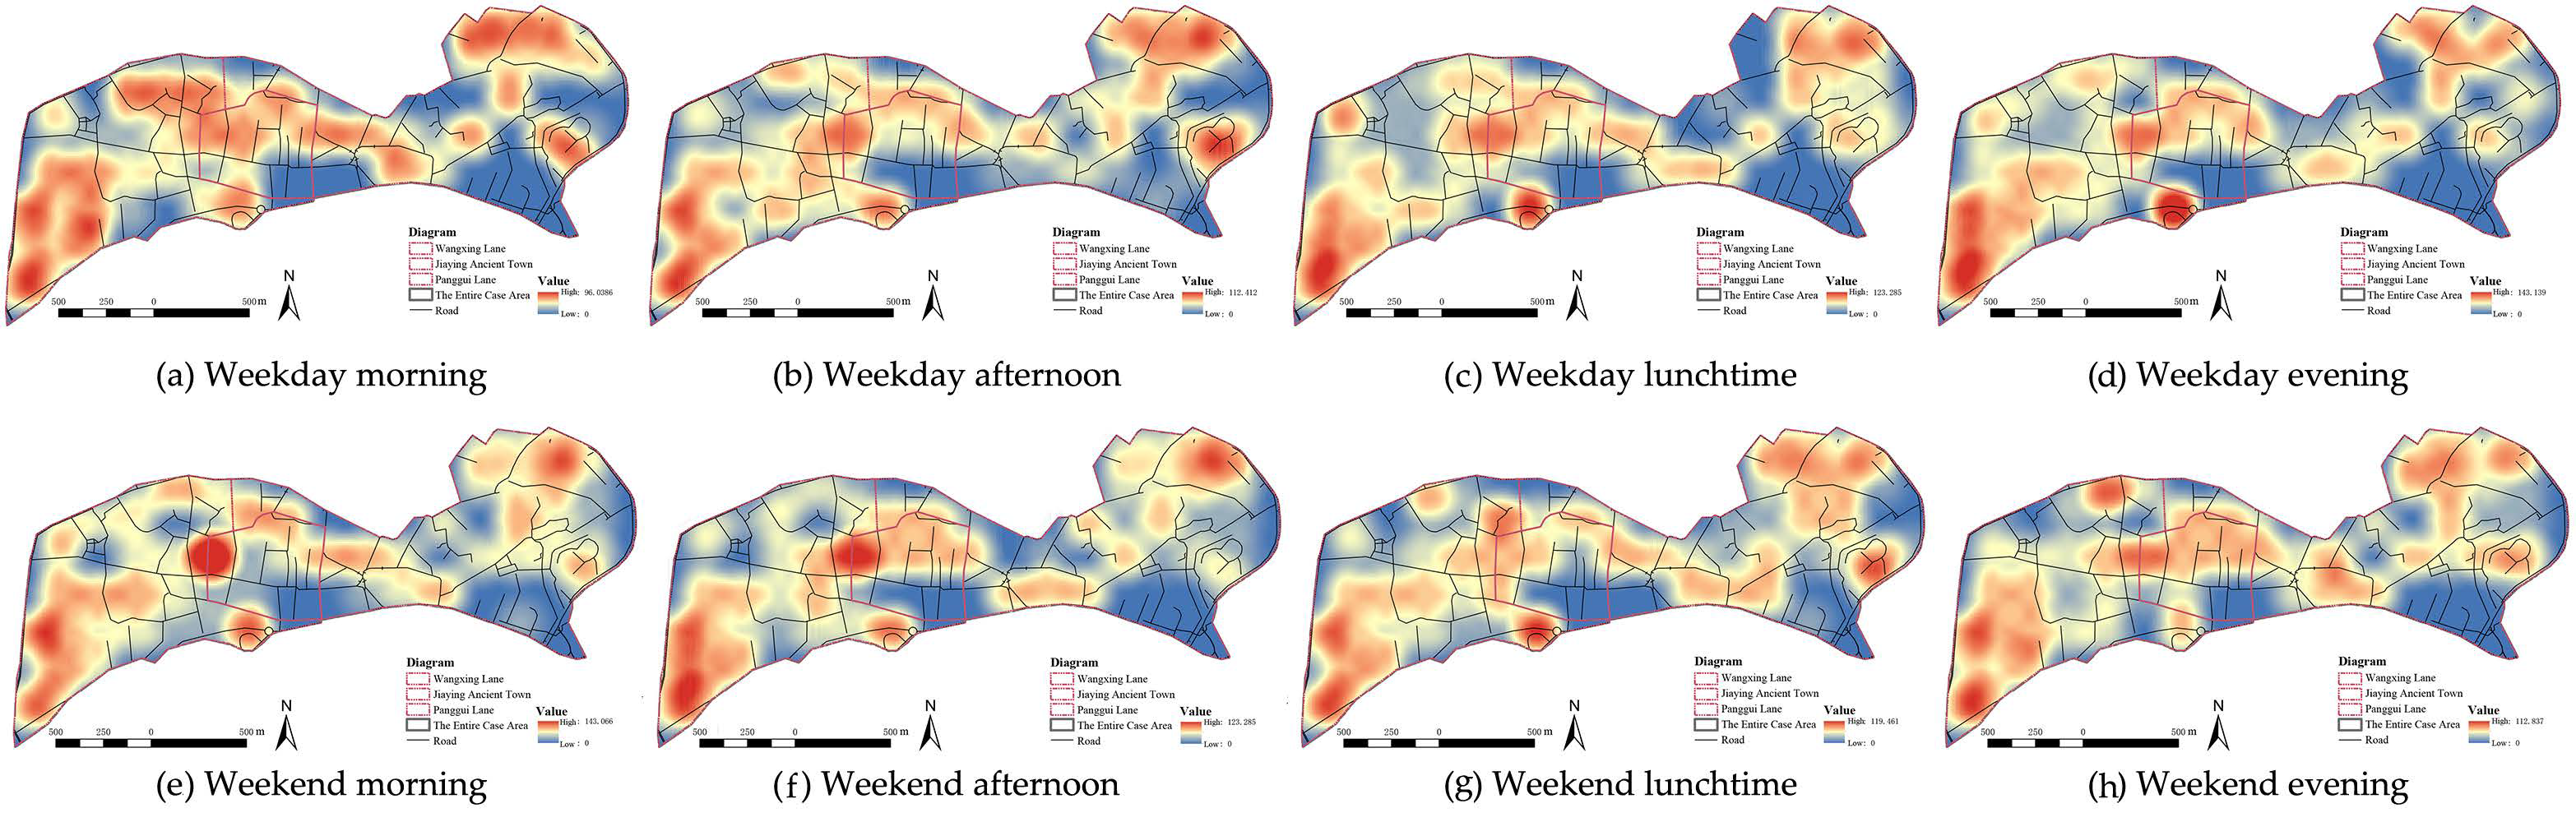
Temporally, overall crowd vitality is higher on weekends than on weekdays, with the activity peak shifting two hours later from 18:00 to 20:00, indicating clear temporal variations. Spatially, the distribution of crowd vitality is highly uneven across the study area, exhibiting a “central peak with peripheral lows” pattern that reflects the negative impact of functional sector imbalance.
As visually summarized in Figure 8, kernel density maps compare the spatial distribution of population activity across eight typical time periods: (a)~(d) weekday morning, lunchtime, afternoon, and evening, and (e)~(h) the corresponding periods on weekends. This figure is essential to our analysis as it provides a spatiotemporal visualization of activity patterns, directly supporting the identification of vitality peaks, temporal shifts, and central-peripheral disparities discussed above. These insights form the basis for further correlation analysis between functional layout and crowd dynamics.
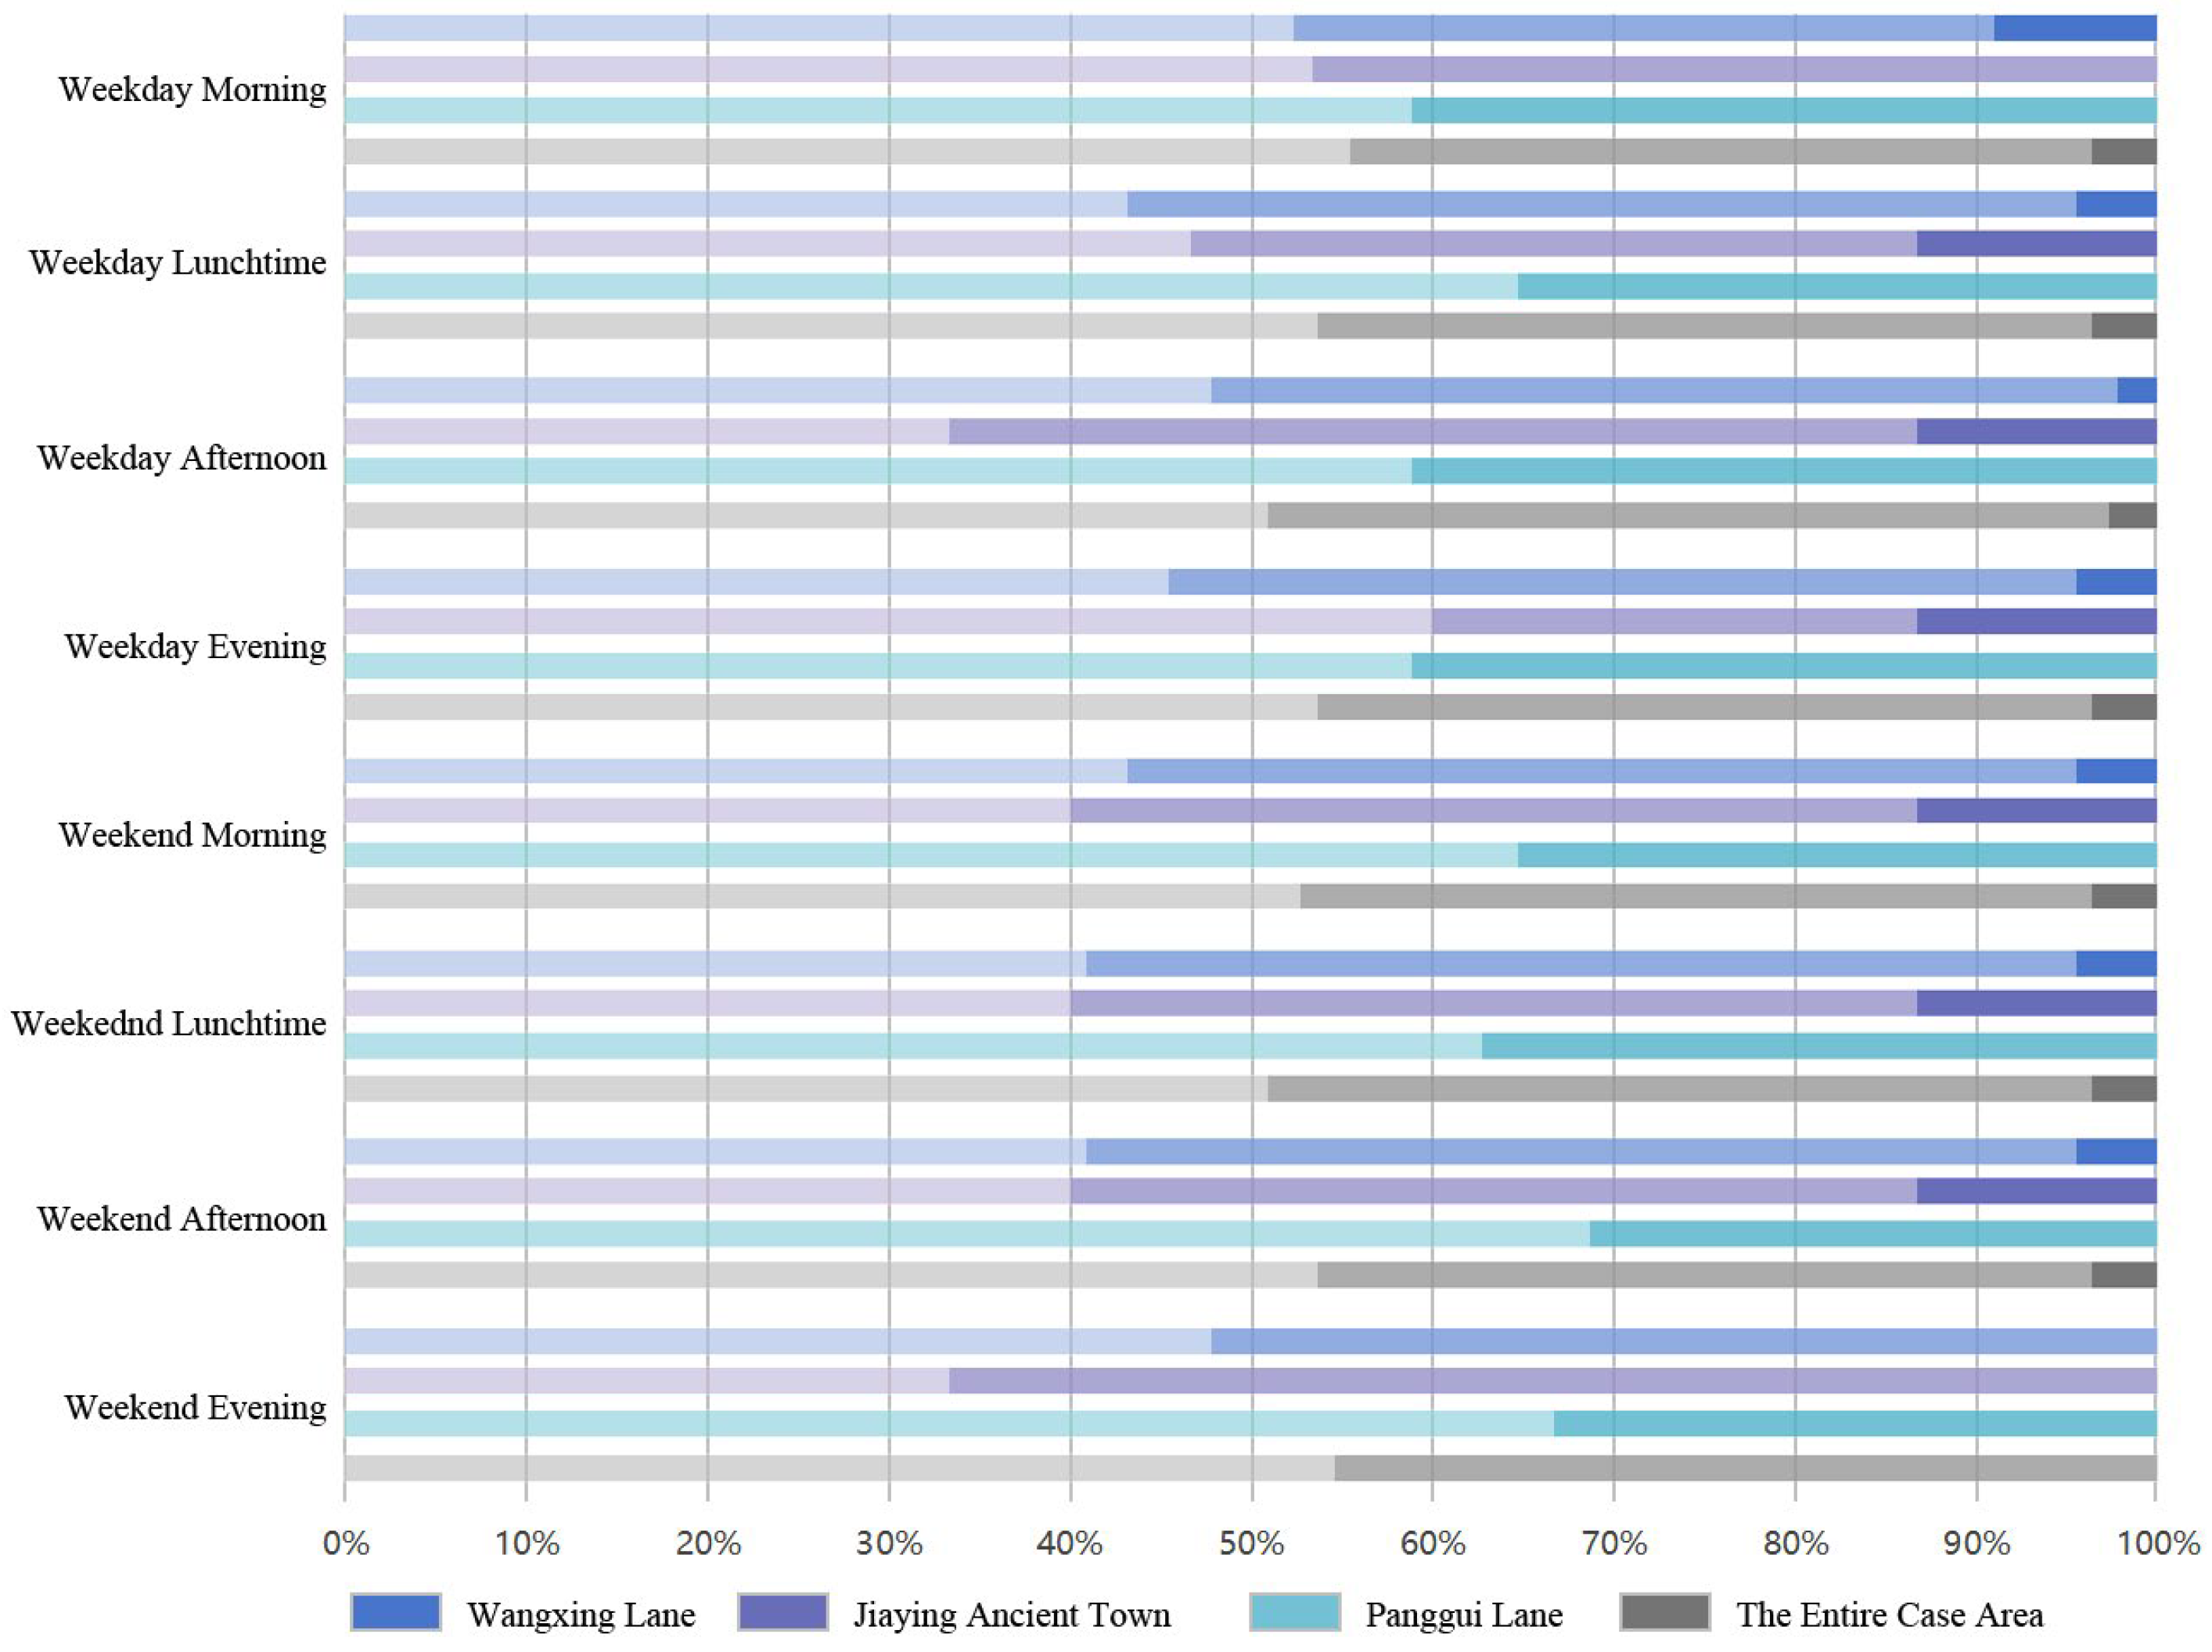
Vitality levels were categorized as low (score = 0~1), medium (score = 2~3), and high (score > 4). Analysis of these scores across the three districts reveals significant spatial heterogeneity in vitality distribution. Wangxing Lane maintains a consistently moderate vitality profile without pronounced peaks, with medium activity accounting for approximately 50% of all time slots on both weekdays and weekends, while high vitality remains rare (below 5%). Jiaying Ancient Town shows a similar pattern but with a lower proportion of medium activity (approximately 30~45%). High activity occurs only sporadically, primarily during weekday lunchtimes and evening rush hours (around 13%), resulting in a relatively flat vitality curve. In contrast, Pangui Lane exhibits consistently low activity, with low vitality accounting for 60~70% of the time and no occurrence of high vitality throughout all observed periods.
As summarized in Figure 9, the spatial and temporal distribution of population activity across typical time periods is visualized, illustrating the proportion of each vitality level within the three districts. This figure provides essential empirical support for the described vitality patterns, clearly highlighting the pronounced disparities among Wangxing Lane, Jiaying Ancient Town, and Pangui Lane. These visual comparisons reinforce the quantitative findings regarding temporal persistence and spatial imbalance of activity levels, forming a crucial basis for subsequent correlation and regression analyses of the factors influencing vitality.

4.3. Calculation of Vitality Contribution Levels Among Different Users

4.3.1. Quantification of Indicators

Based on the AHP, separate interviews were conducted with residents and visitors. POIs obtained from Amap were reclassified and, combined with user ratings, were used to construct a weighting table for the spatial vitality evaluation system of the historic district. The comprehensive weight (W) derived from the AHP and the IRR obtained from Poisson regression were applied to calculate the contribution of each function to population vitality.
A total of 44 questionnaires were collected. After consistency checks and removal of highly divergent responses, stratified sampling yielded 40 valid questionnaires—20 from residents and 20 from visitors—ensuring coverage of core stakeholders. The resident group consisted of 10 academics, 5 government officials, and 5 local residents. A resident scoring standard (Table 4) was established based on participants’ educational background and familiarity with Meizhou to determine assessment weights objectively. Tourist questionnaires were distributed across core scenic areas, commercial districts, and undeveloped zones to ensure geographic representation within the study area. Weights for each stratum were calculated using the square root method and normalized, as expressed in Equation (1):
W i = j = 1 m A i j m j = 1 m W ¯ j ,
Among them, W i denotes the weight assigned to each indicator; m represents the number of dimensions; A signifies the score value; W ¯ j indicates the sum of the weights for each indicator.
The weighted arithmetic mean was calculated for both the decision-level and indicator-level integration matrices using the residents’ scoring weights to determine the weighted average integration weights, as expressed in Equation (2). These comprehensive weights were then applied to each indicator within the corresponding decision level to derive the overall weight of different influencing factors.
W ¯ = W i x i W i i = 1 , 2 , , n ,
Based on the Poisson regression model outlined in Section 3.3, we obtained regression coefficients (Beta) for various functional facilities. The Beta coefficient represents the change in the log-expectation of the dependent variable (population vitality score) for each one-unit increase in the independent variable (POI count). To enhance interpretability of the results, we exponentiated these coefficients to derive the incidence rate ratio (IRR) using Equation (3):
I R R = e B ,
Among them, e is the natural constant, and B (Beta) is the coefficient value output from the Poisson regression analysis.
The contribution of each influencing factor to spatial vitality is determined by integrating the comprehensive weight of the factor with its incidence rate ratio, as calculated in Equation (4):
F a c t o r   C o n t r i b u t i o n = W × I R R
Taking the comparison of the importance of key indicators by Resident 20 as an example, we first constructed a judgment matrix. Experts were invited to conduct pairwise comparisons of each indicator (using a 1–9 point rating scale). The judgment matrix for the service facilities section is shown in Table 5:
The eigenvectors of this matrix were subsequently calculated, yielding approximate weight values for each dimension: “Leisure and Entertainment”, 0.09; “Lifestyle Services”, 0.73; and “Business Services”, 0.18. Finally, a consistency check was performed, yielding a consistency ratio CR = 0.006 < 0.1. This result indicates that the expert ratings exhibit good consistency. Simultaneously, the internal rate of return (IRR) was calculated using Poisson regression in IBMSPSSStatistics 27. Integrating the primary and secondary indicator weights from 20 residents, we derived the evaluation of residents’ contribution to the vitality of service facilities, as shown in Table 6.

4.3.2. Comparison of Vitality Contributions Between Residents and Tourists

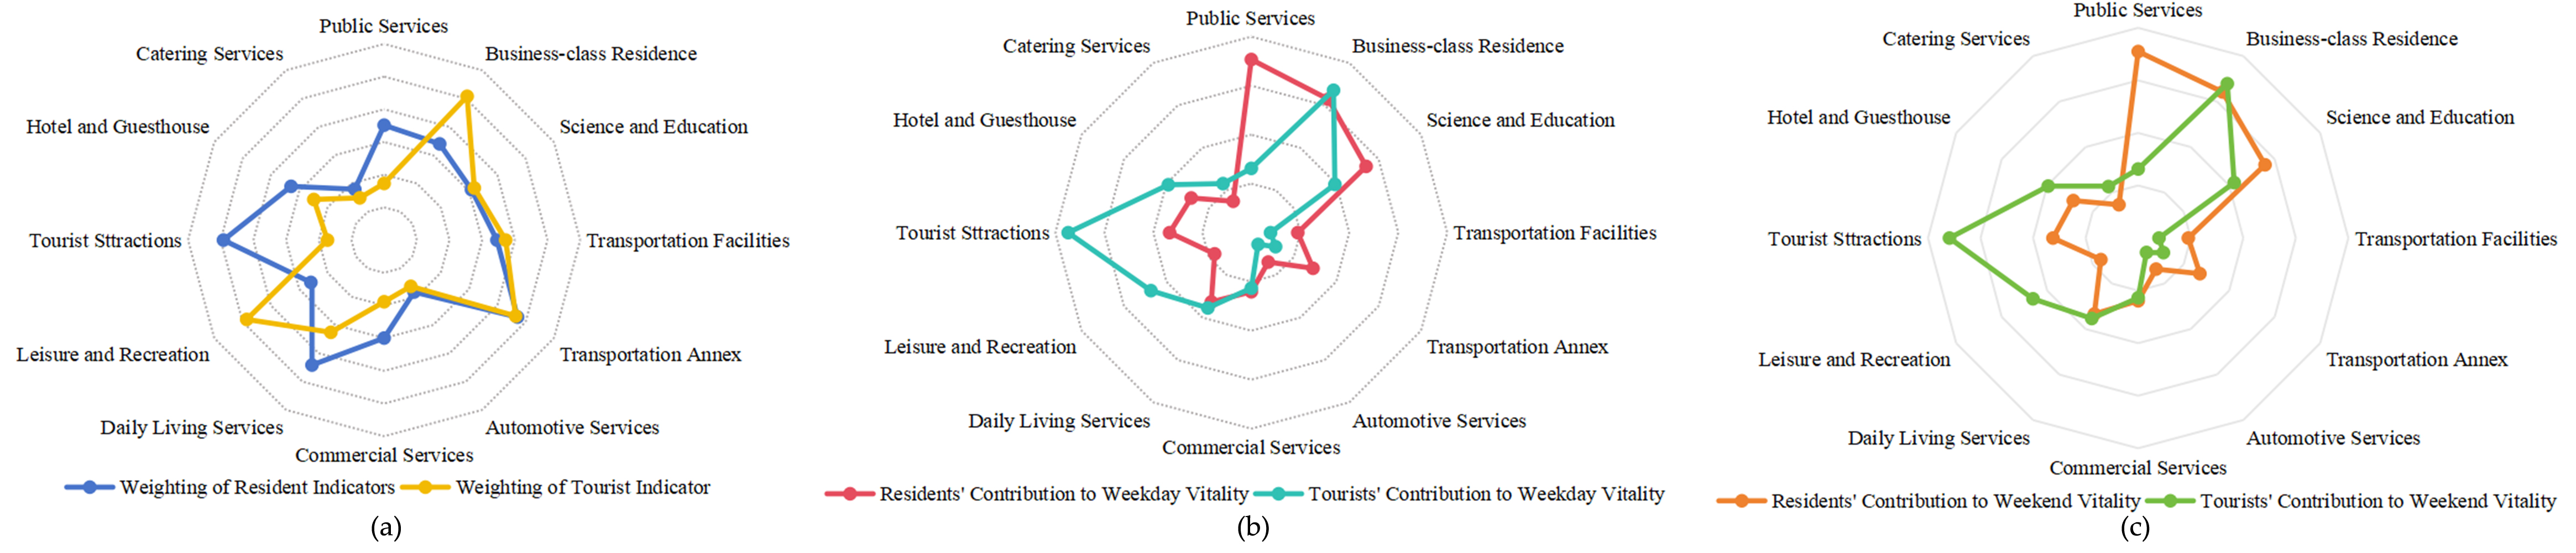
Based on the composite weighting of ratings from residents and tourists, analyze the contribution of these two user groups to the vitality of different functional zones on weekdays and weekends (Figure 10).
For residents, public service facilities play a core supporting role, with a weekend factor contribution of 17.75%—the highest among infrastructure indicators. This underscores the fundamental impact of public service accessibility on community vitality, indicating that the spatial configuration quality of basic service facilities directly shapes residents’ daily activity intensity. The contribution rate of the leisure factor in commercial-residential facilities (16.05%) exceeds that of the weekday factor (15.72%), reflecting the neighborhood’s life–work dynamics. Tourist attraction facilities show a negative contribution rate (−8.34%), indicating residents’ avoidance behavior toward tourism-oriented spaces. Combined with their high weighting (49.16%), this reveals significant functional conflict between tourist and residential uses.
For tourists, commercial-residential facilities contribute 16.96% to vitality, highlighting the Town’s role as a key tourism service node. Tourist attraction facilities, however, exhibit a strongly negative contribution (−18.69%), suggesting a misalignment between visitor expectations and onsite experience quality. Leisure and entertainment facilities also show a marked contrast, with a weight of 12.31% but a negative contribution of −11.56%, reflecting diminished marginal utility resulting from functional homogenization within the historic district.

4.4. Correlation Between Historic District Functions and Population Vitality

Given the scale of the study area, a 200 m × 200 m grid was adopted. All datasets were integrated in ArcGIS and subsequently imported into SPSS for bivariate correlation analysis to examine the relationship between functional distribution and population vitality across different areas and time periods. Finally, correlation heatmaps were visualized using Origin.

4.4.1. Correlation Analysis Among Different Functions

Correlation analysis of functional distribution within the “One Town, Two Lanes” framework reveals three key issues in urban functional allocation: pronounced commercial clustering, isolated culture–tourism development, and fragmented transportation services.
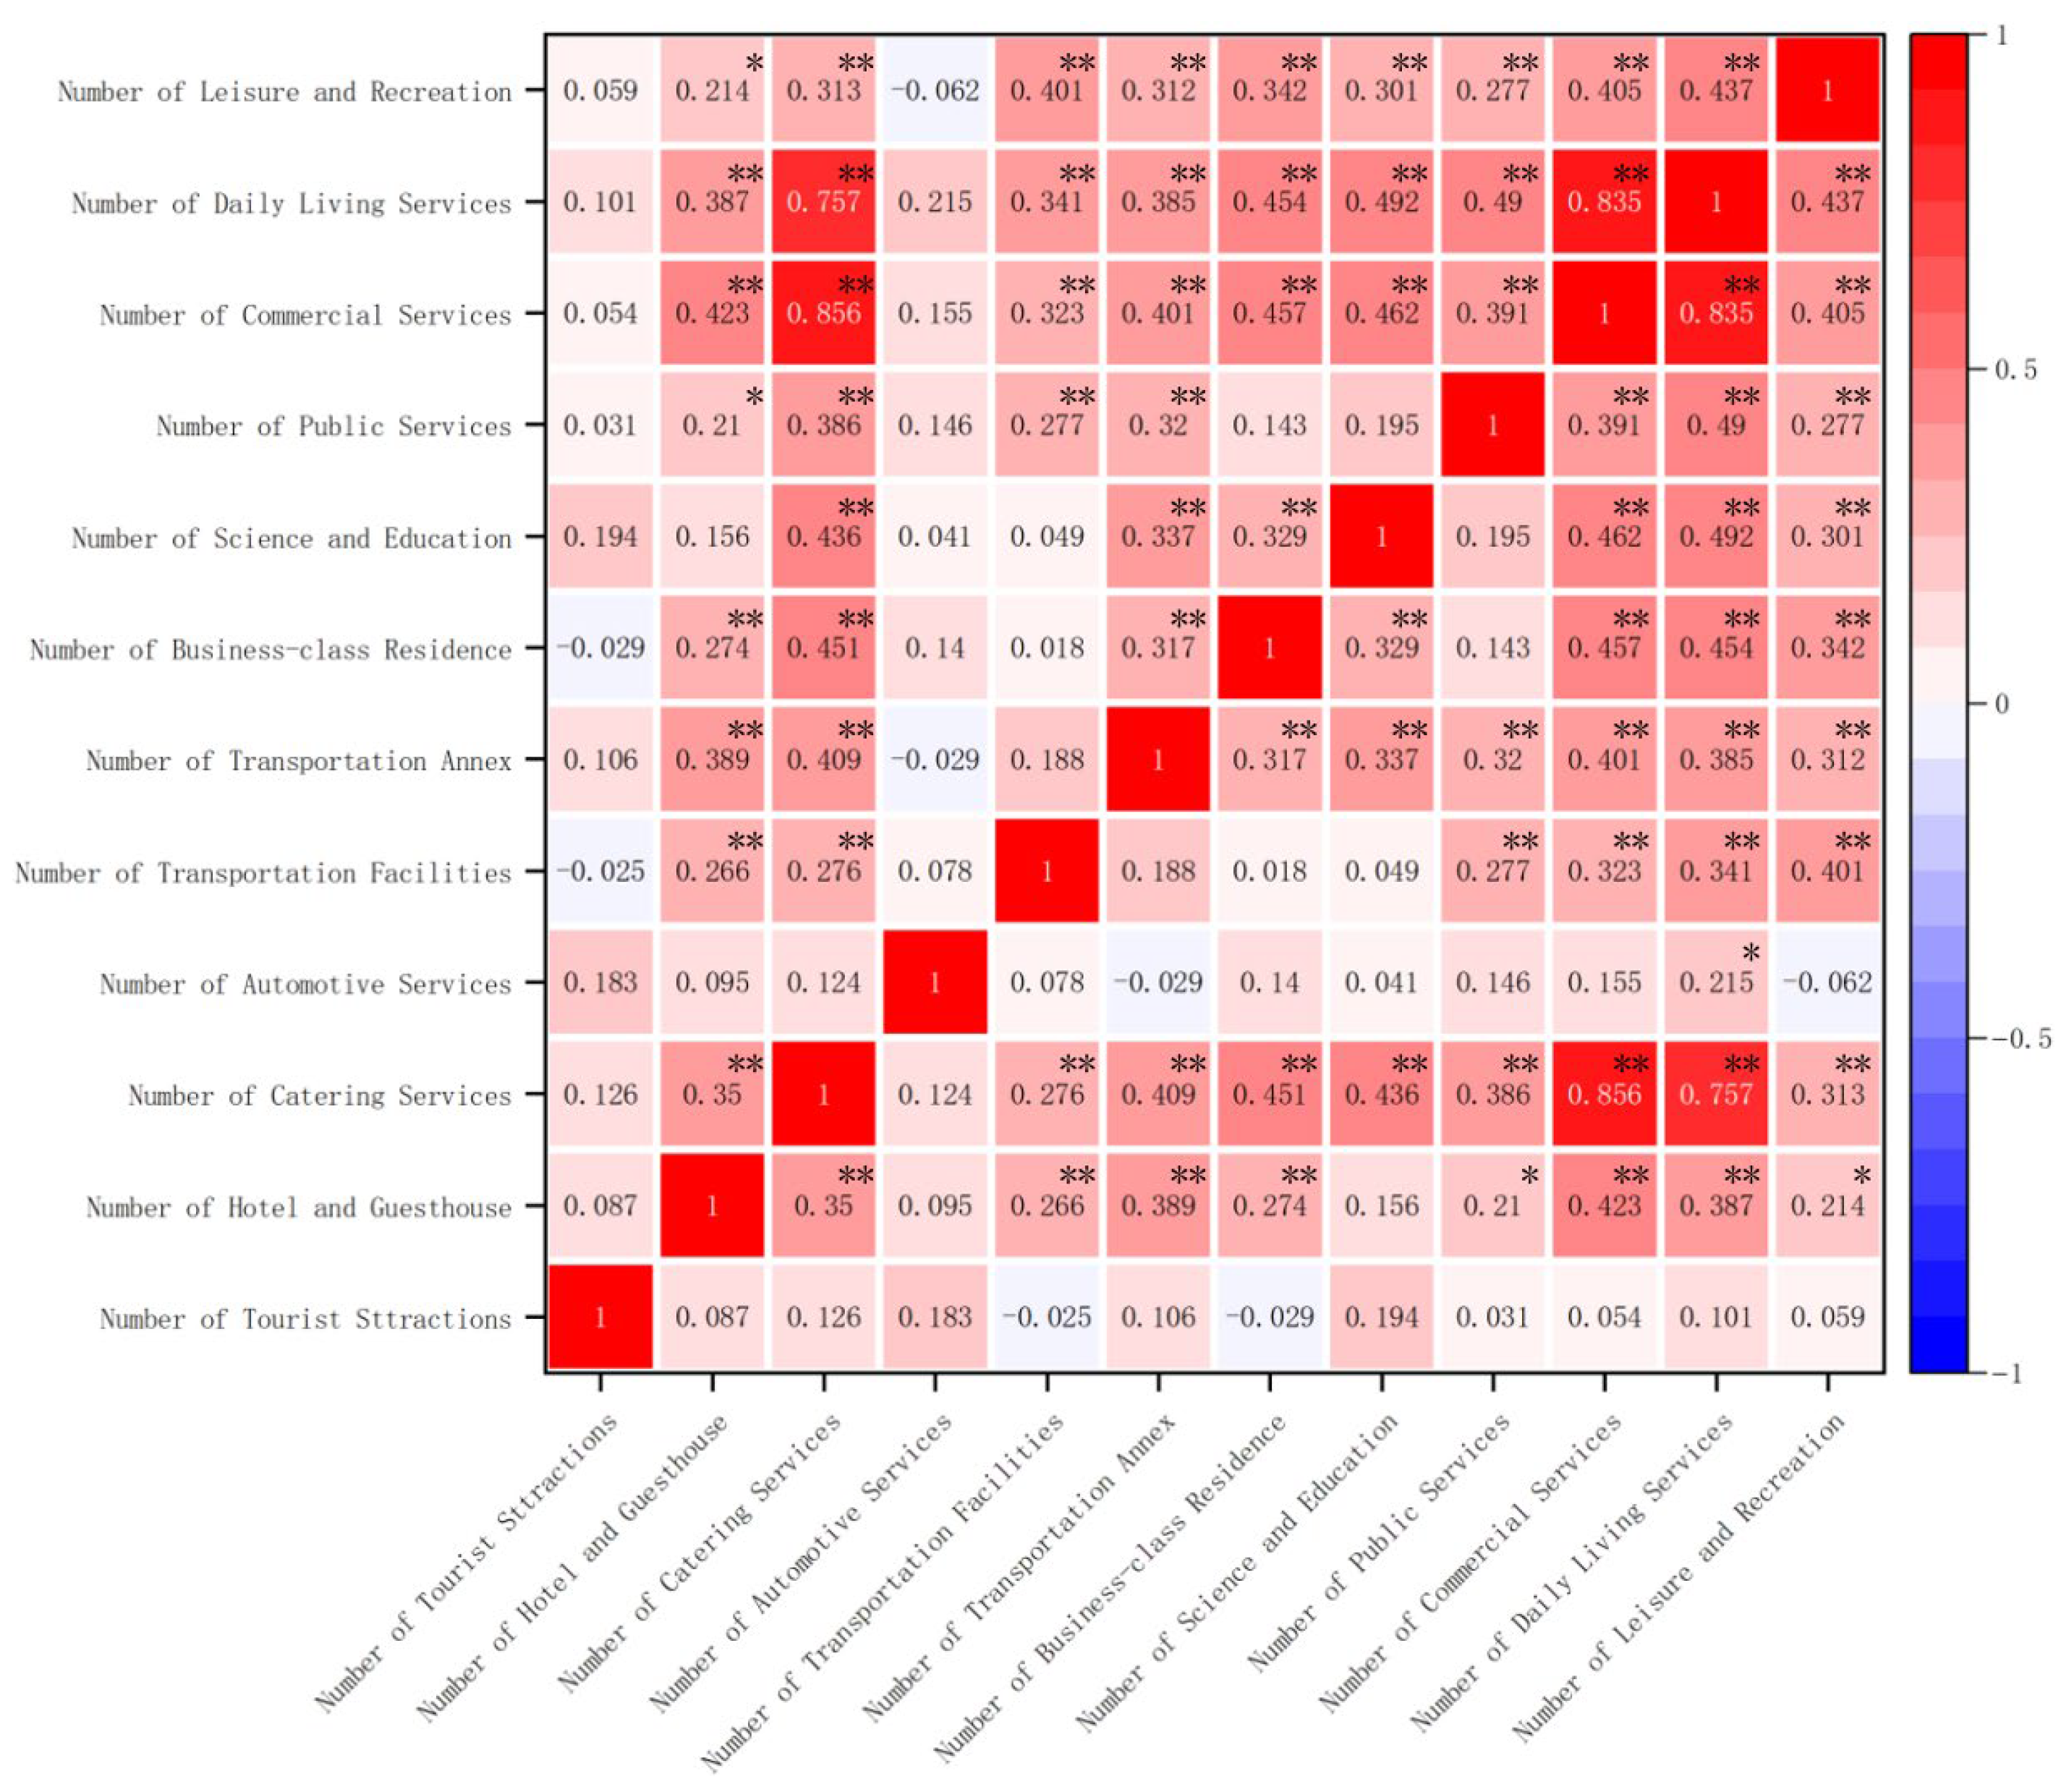
As empirically visualized in Figure 11, the correlation heatmap provides critical evidence for these issues. Specifically:
  • Excessive Commercial Clustering: Catering and commercial services exhibit a strong correlation (ρ = 0.856, p < 0.01), indicating a high degree of functional agglomeration. This suggests an over-concentration of commercial activities that may compromise the diversity of urban functions and lead to spatial monotony.
  • Isolated Culture–Tourism Development: Tourist attractions show weak correlations with other urban functions (ρ < 0.2), reflecting their poor integration into the broader functional system. This isolation limits the synergistic potential between culture–tourism resources and daily urban activities, reducing overall district vitality.
  • Fragmented Transportation Services: While transportation facilities correlate moderately with commercial areas (ρ = 0.389–0.409, p < 0.05), basic transport infrastructure remains inadequately connected. The negative correlation between automotive services and leisure facilities (ρ = −0.062) further highlights functional conflicts within the transportation network, indicating a lack of coordinated spatial planning.
These spatial-functional patterns underscore the need for an integrated approach to rebalancing commercial distribution, enhancing culture–tourism connectivity, and resolving transportation conflicts in historic district planning.

4.4.2. Wangxing Lane: Functional Distribution and Population Vitality

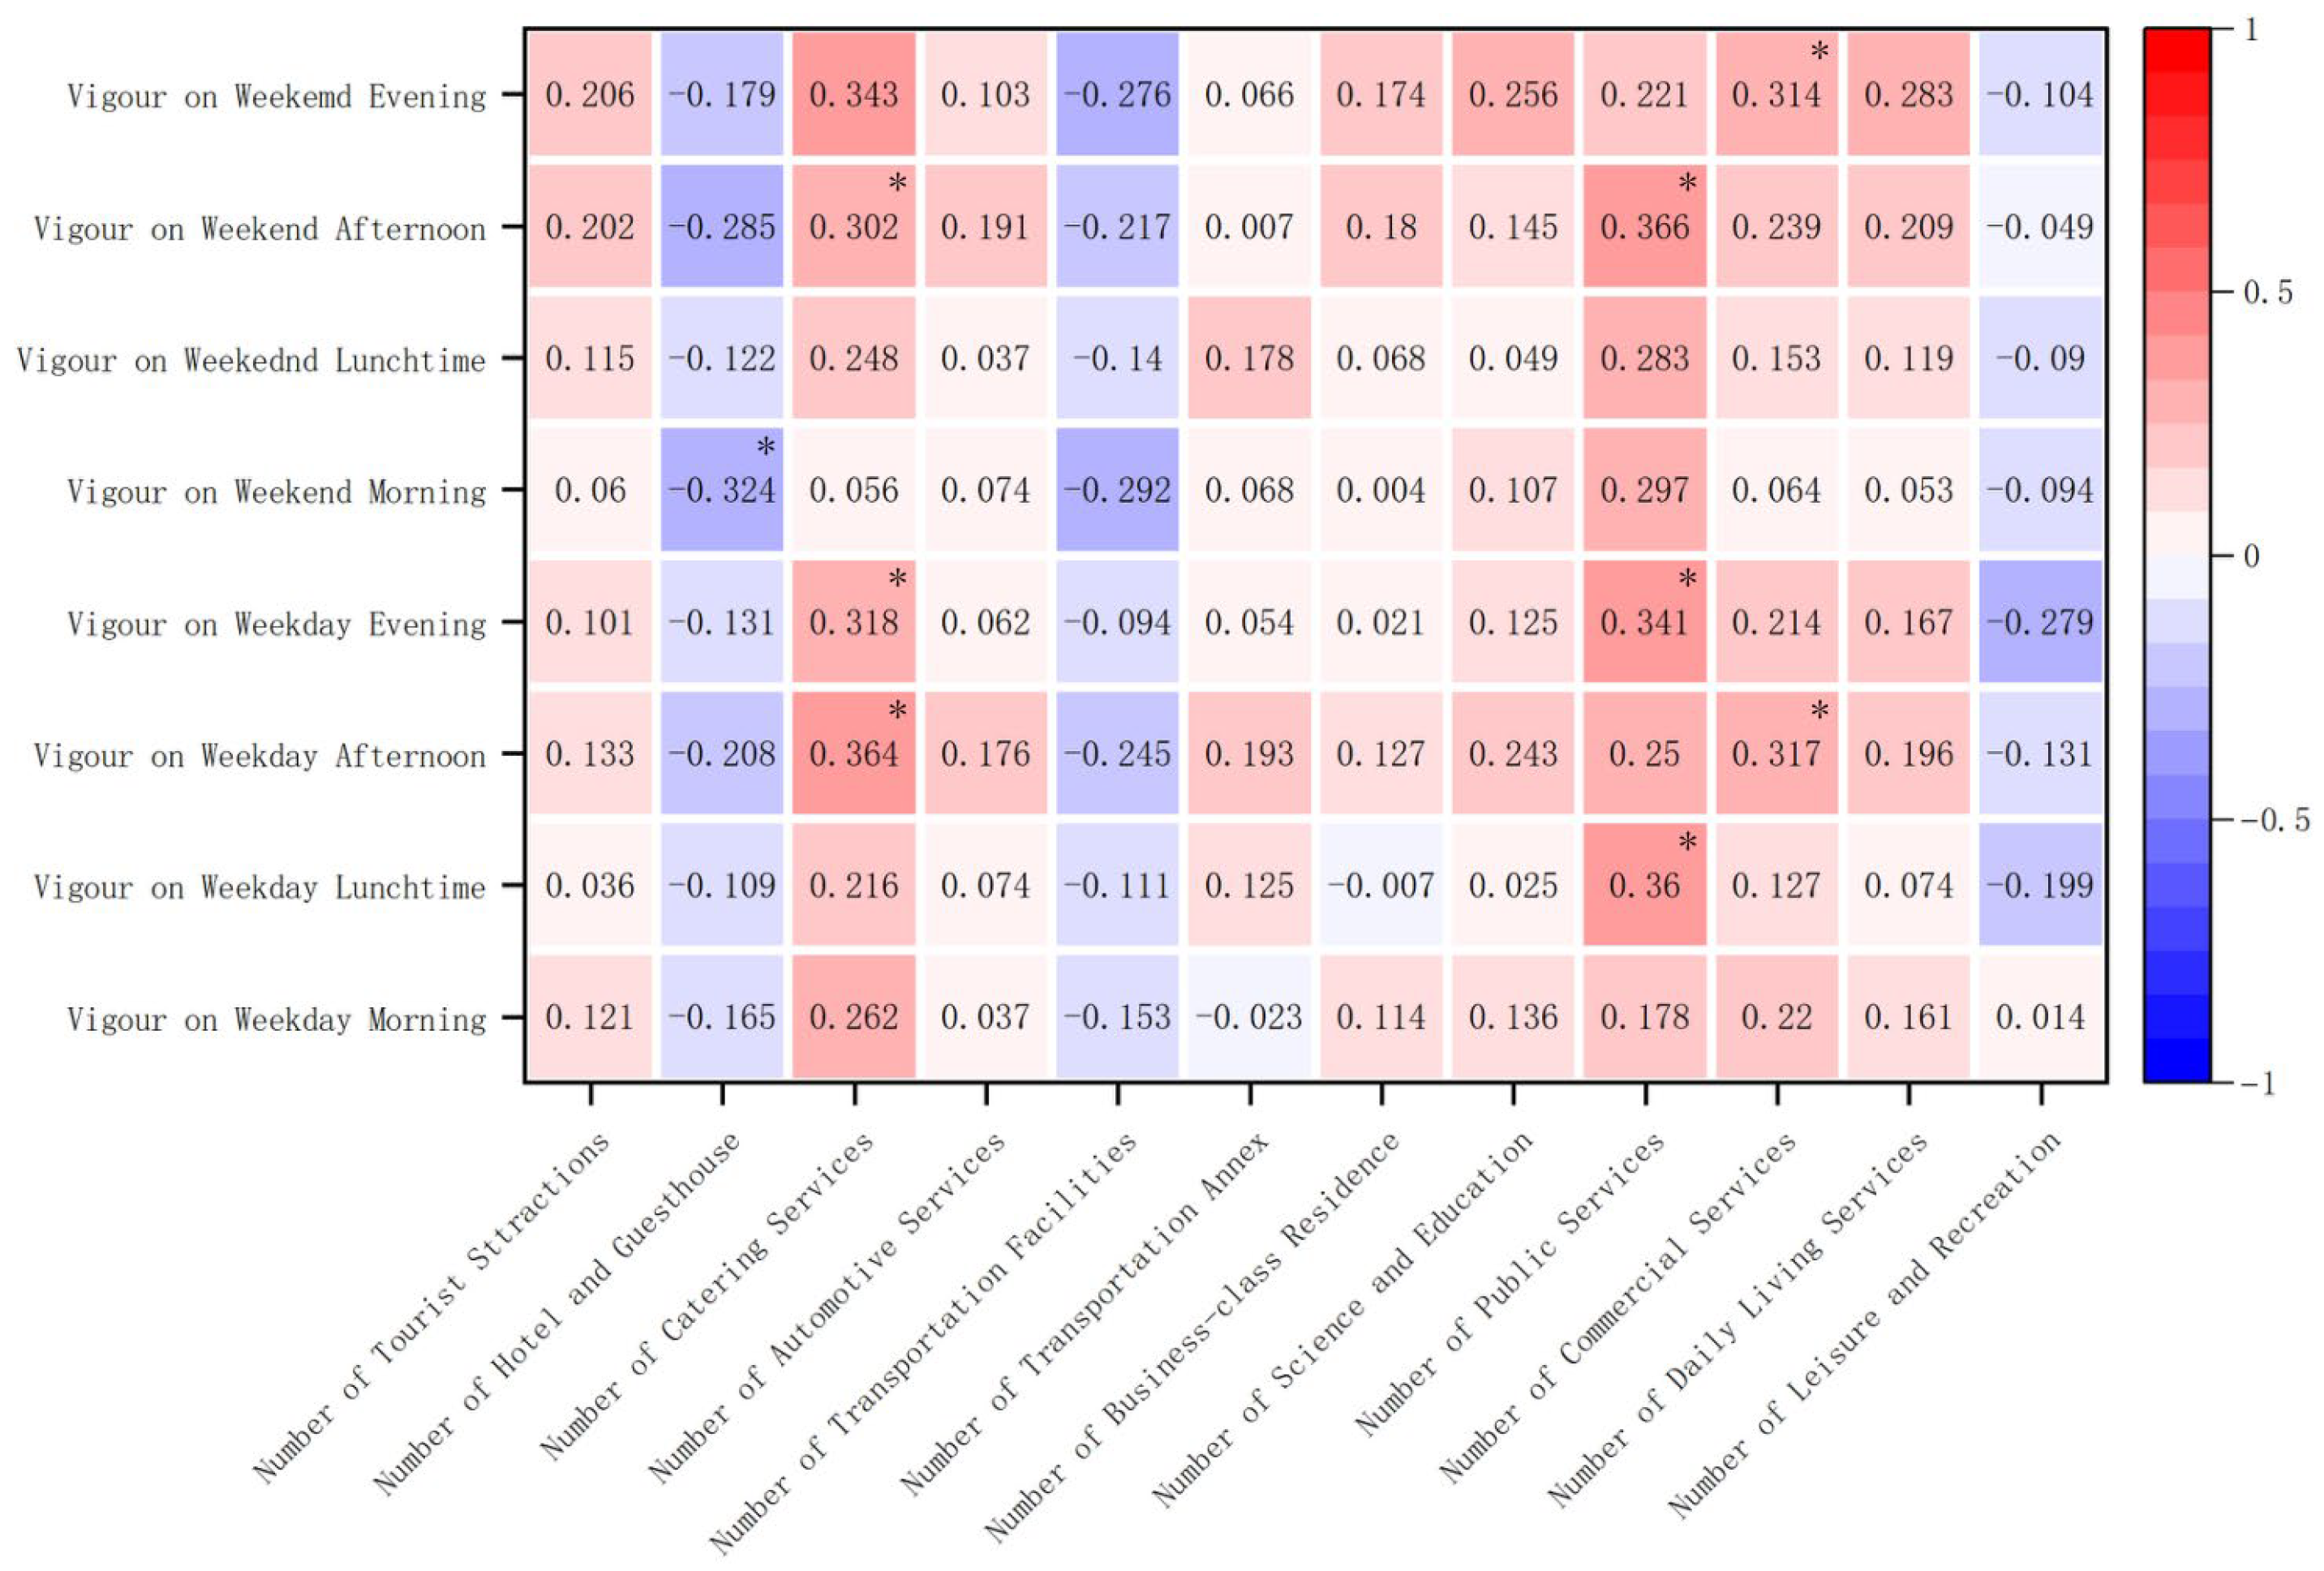
Correlation analysis between POI distribution and crowd vitality in Wangxing Lane reveals systemic contradictions in the current functional zoning, characterized by significant spatiotemporal mismatch and poor facility coordination. As empirically summarized in Figure 12, the heatmap visually delineates these functional–behavioral relationships across different time periods.
A systematic analysis of the correlations identifies the following critical spatial–temporal discrepancies:
  • Spatiotemporal Discontinuity in Basic Services: Dining and cuisine (ρ = 0.262–0.364) and public services (ρ = 0.36 on weekday afternoons) function as pillars of daytime vitality but contribute minimally during morning peak hours, reflecting a failure to align service provision with temporal rhythms of use.
  • Vitality-Suppressing Facility Types: Transportation services (ρ = −0.276 on weekend evenings) and lodging facilities (e.g., ρ = −0.324 on weekend mornings) exhibit consistent negative correlations across all observed periods, indicating fundamental inefficiencies in spatial resource allocation.
  • Performance Gap in Leisure Facilities: Leisure and entertainment facilities show a significant negative correlation on weekday evenings (ρ = −0.279), revealing a substantial disparity between planned function and actual usage, likely due to mismatched operational patterns or contextual incompatibility.
These results provide quantitative evidence of a spatiotemporal mismatch between functions and vitality, offering a clear basis for targeted spatial and management interventions to better align facility distribution with actual crowd activity patterns.

4.4.3. Jiaying Ancient Town: Functional Distribution and Population Vitality

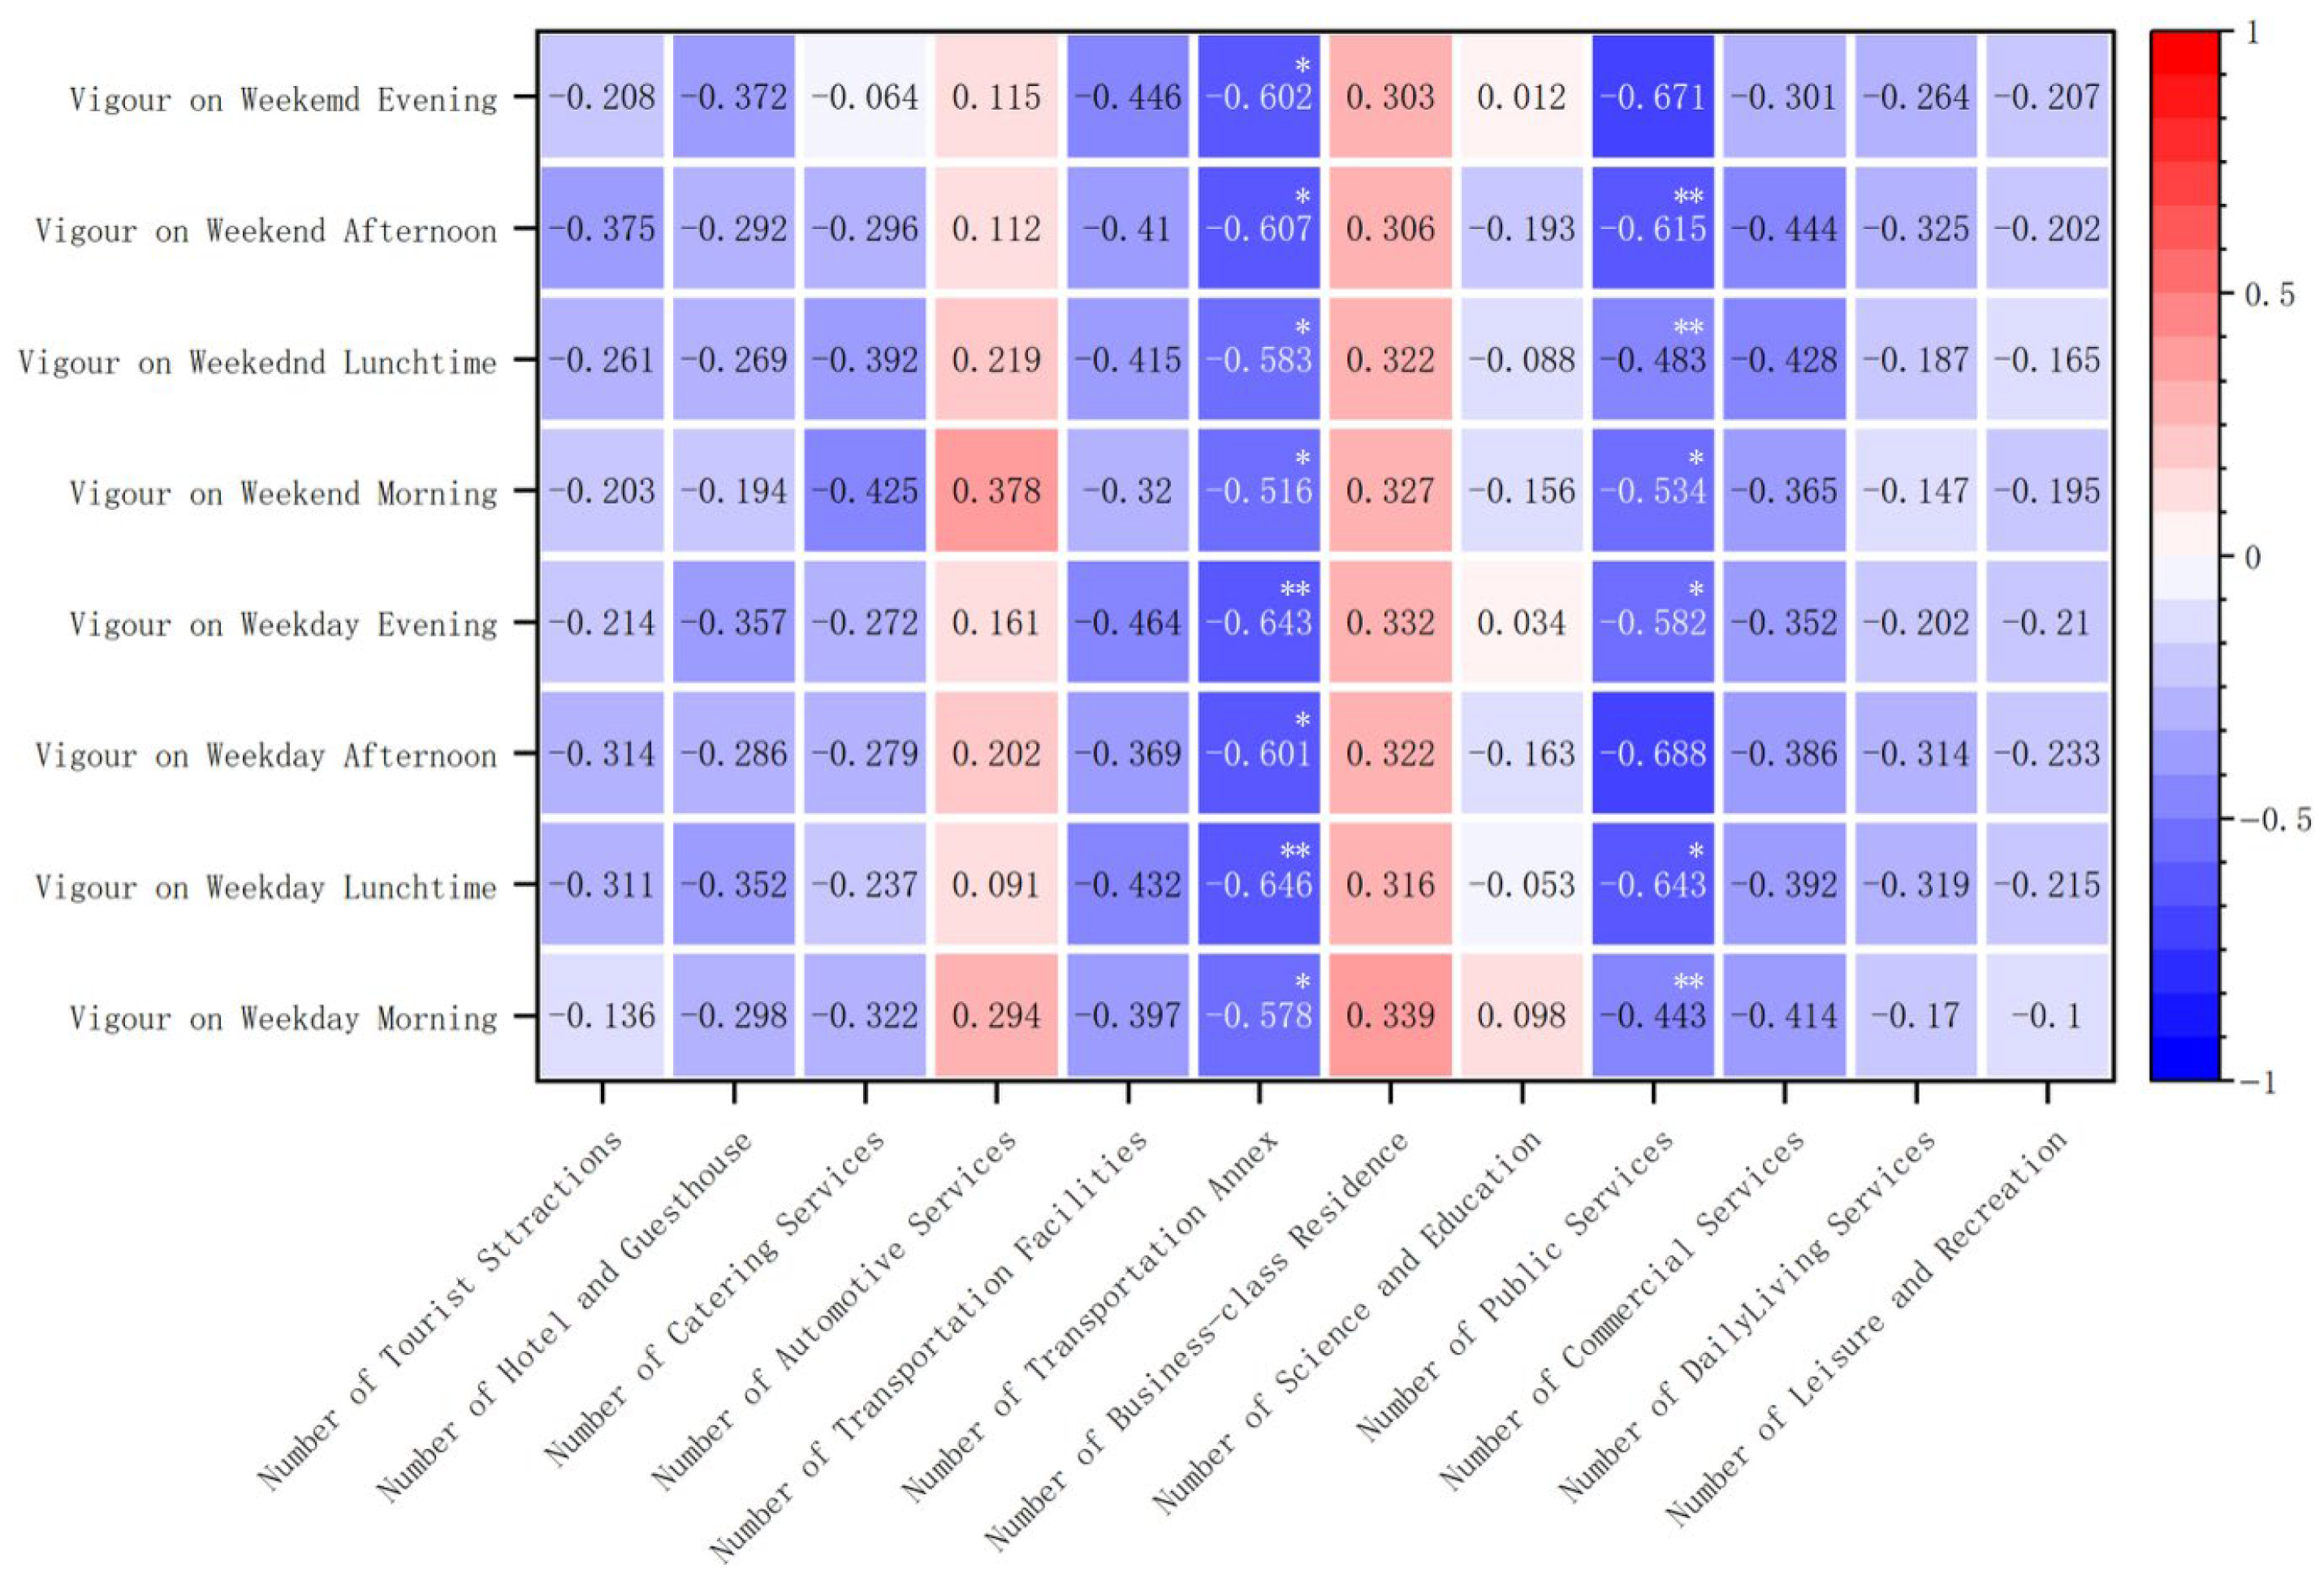
Correlation analysis between POI distribution and crowd activity in Jiaying Ancient Town reveals a fundamental structural imbalance in spatial resource allocation relative to actual usage patterns. As empirically summarized in Figure 13, the heatmap illustrates pronounced functional–temporal mismatches across facility types.
A systematic analysis of the correlations identifies the following critical spatial–temporal discrepancies:
  • Ineffective Transportation Provision: Both ancillary (ρ = −0.646, p < 0.01) and primary transportation facilities (ρ = −0.464, p < 0.05) exhibit significant negative correlations across all time periods, indicating that current traffic organization actively impedes pedestrian gathering and vitality.
  • Misaligned Public Service Scheduling: Public service facilities correlate most negatively with weekday evening peak activity (ρ = −0.688, p < 0.01), highlighting a severe temporal disconnect between operating hours and periods of high public demand.
  • Underutilized Educational and Cultural Facilities: Educational and cultural facilities show no significant correlation with any time period (|ρ| < 0.2), suggesting their spatial distribution or programming fails to align with actual user behavior.
Inefficient Leisure Facility Operation: Leisure and entertainment facilities demonstrate a slight but consistent negative correlation, indicating operational or contextual shortcomings in service delivery.
These results quantitatively confirm systemic flaws in the ancient town’s functional configuration, offering a clear evidence base for recalibrating spatial allocation and temporal management strategies to better support urban vitality.

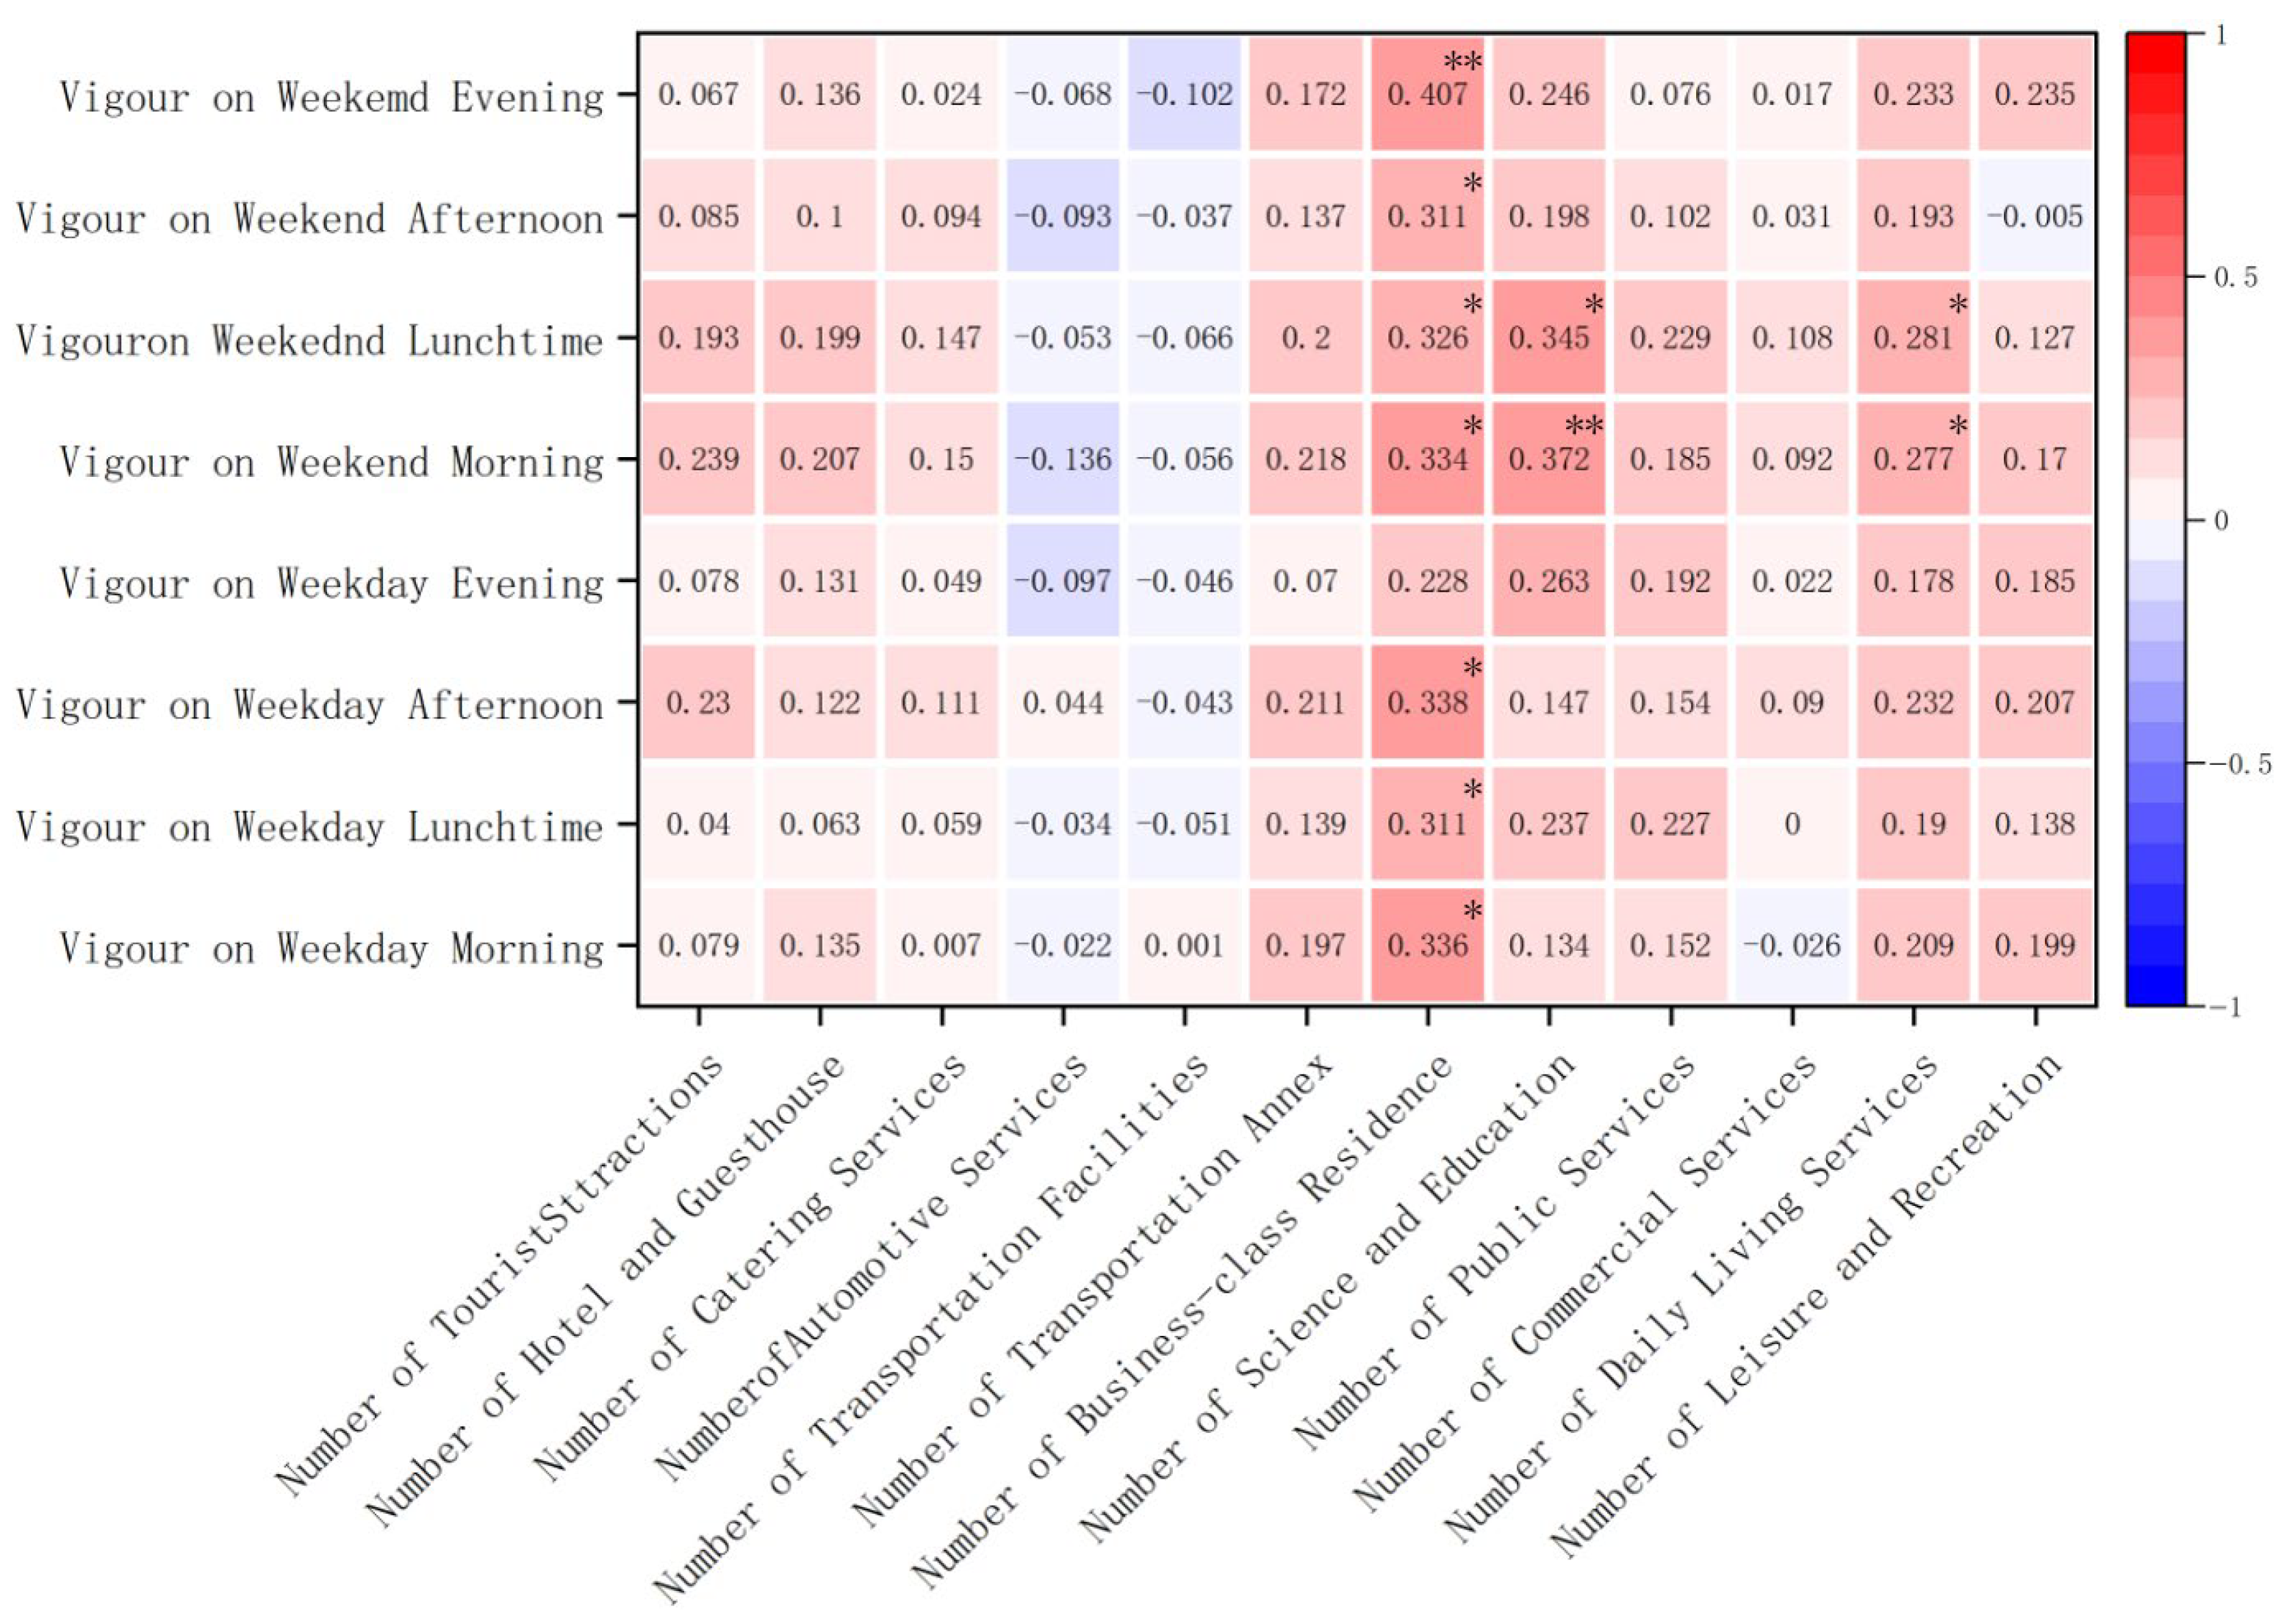
4.4.4. Pangui Lane: Functional Distribution and Population Vitality

Correlation analysis between POI distribution and crowd vitality in Pangui Lane reveals a distinct pattern of spatial resource allocation characterized by monocentric residential dominance, inefficient commercial services, and poor internal transportation coordination. As empirically visualized in Figure 14, the correlation heatmap underscores these systemic functional imbalances.
A systematic analysis of the correlations identifies the following critical spatial–temporal discrepancies:
  • Monocentric Dominance of Residential Functions: Business residences (ρ = 0.407, p < 0.05) and daily living services (ρ = 0.281) function as the primary drivers of vitality, whereas commercial services (ρ < 0.1) and automotive services (|ρ| < 0.1) contribute minimally, reflecting a structurally unbalanced functional composition.
  • Ineffective Commercial Service Provision: Commercial service facilities exhibit consistently low correlations across all time periods, indicating a pronounced misalignment between existing business formats and actual activity patterns.
  • Poor Internal Transportation Integration: Transportation ancillary facilities correlate negatively with vitality (ρ = −0.197), signaling a lack of functional synergy within the transportation network.
Anomalous Leisure Facility Performance: Leisure and entertainment facilities show an unexpected negative correlation during weekend evenings (ρ = −0.005), suggesting operational or contextual inefficiencies during peak usage periods.
These findings quantitatively validate the suboptimal allocation of spatial resources in Pangui Lane, providing a clear evidentiary basis for prioritizing functional diversification, transportation integration, and commercial reactivation in future renewal strategies.

5. Discussion

5.1. Differences in the Impact of Various Users on the Vitality of Historic Districts

Residential vitality depends primarily on public service networks (factor contribution = 17.75%) and life–work-balanced spaces (16.05%), reflecting stable daily rhythms. However, commercial intensification has suppressed local activity, particularly near scenic areas. Tourist vitality, while positively influenced by attraction density, is undermined by poor experience quality (negative contribution: 18.69%). Leisure facilities, despite high planning weighting (48.55%), contribute negatively (−11.56%) due to functional homogenization. A mere 31% overlap in spatial usage between residents and tourists highlights severe functional imbalance.

5.2. Differences in the Impact of Function and Time Period on the Vitality of Historic Districts

Temporal patterns reveal distinct district identities: Wangxing Lane shows higher nighttime vitality (avg. 2.659), indicating residential use, while Pangui Lane peaks at midday (avg. 2.06), reflecting commercial traits. Jiaying Ancient Town exhibits consistently low vitality. Living services sustain positive effects across periods, whereas transportation facilities reduce activity, indicating poor functional synergy. Tourist attractions yield opposite effects between districts (ρ = 0.172 in Pangui Lane; ρ = −0.602 in Jiaying), revealing uneven development.

5.3. Differences in the Impact of Spatial Patterns on the Vitality of Historic Districts

Jiaying Ancient Town displays low overall vitality (mean = −0.427) with poor internal connectivity, particularly in its core. Tourist and leisure facilities show statistically irrelevant impacts (p > 0.05), while transport and commercial interfaces correlate negatively (p < 0.01). Most areas fail to achieve optimal functional mix ratios. Pangui Lane exhibits north–south vitality polarization, and Wangxing Lane shows significant cross-street gradients, violating spatial equity principles and reducing facility.

5.4. Summary of Hypothesis Verification

The three hypotheses initially proposed in this study were verified through the aforementioned multi-method, multi-data analysis as follows:
H1: The hypothesis that “the degree of commercialization in historic districts significantly impacts spatial vitality” is partially supported. Analysis indicates that commercialization does significantly affect vitality, but its mechanism is a complex “dual inhibition.” Moderate commercial services positively contribute to vitality (contribution rate = 16.05%). However, excessive and homogenized tourism-oriented commerce not only displaces resident vitality (contribution rate = −8.34%) but also suppresses visitor vitality due to poor experiential quality (contribution rate = −18.69%). This reveals that the relationship between commercialization and vitality is not a simple linear one.
H2: The hypothesis that “diverse usage demands lead to uneven spatial vitality distribution” holds true. Spatio-temporal vitality analysis (Figure 8 and Figure 9) clearly shows significant temporal and spatial vitality differences between Wangxing Lane (residential-dominated), Pangui Lane (single-function), and Jiaying Town (tourism-dominated). The correlation between functional zones and vitality also exhibits substantial variation across different streets/lanes and time periods (Figure 12, Figure 13 and Figure 14), strongly confirming that diverse demands lead to fragmented and uneven vitality distribution.
H3: The hypothesis that “different user groups generate extreme variations in spatial vitality” holds true. AHP and contribution analysis results (Figure 10) provide the most direct evidence. Resident vitality centers on public service networks and balanced commercial-residential functions, while tourist vitality is driven by commercial services. Their attitudes toward tourism facilities are diametrically opposed, with only 31% spatial overlap. This clearly demonstrates that residents and tourists, as distinct user groups, exhibit extreme differences in behavioral patterns and spatial demands. This fundamental divergence is the root cause of spatial conflicts and vitality fragmentation within historic districts.

6. Conclusions

6.1. The Fundamental Cause of Low Vitality in Residential Historic Districts

Current urban renewal often prioritizes spatial reorganization to revitalize historic districts, yet rapid urbanization has led to fragmented vitality, characterized by coexisting prosperity and decline. Unlike the purely commercial model of Kunming’s Wenming Street, Meizhou’s “One Town, Two Lanes” district integrates residential areas, where excessive commercialization disrupts functional order and undermines vitality. Case analysis identifies three primary causes of vitality loss: (1) unbalanced commercial layouts that fail to serve diverse user needs, (2) fragmented transportation infrastructure that disrupts pedestrian flow, and (3) temporally misaligned operations that reduce spatial efficiency. To sustain authentic living environments, renewal must resist over-commercialization, accommodate diverse users, and enhance functional diversity and mixed-use density [76] to raise average vitality levels.

6.2. Enhance Functional Facilities and Connect Vibrant Hubs

Wangxing Lane exhibits a “scattered, polarized” vitality pattern, with activity concentrated in daily service zones such as parks and schools, while tourist attractions lack supporting amenities. Overreliance on basic living services results in monofunctional areas with limited interactive hubs. Interviews highlight traffic issues—narrow roads and poor signage—while the 2024 pedestrianization of Lingfeng East–West Roads improved tourism experience at the cost of local accessibility. Proposed interventions include repurposing vacant lots into cultural plazas, as seen in Tianjin’s Muslim Community model [5], to link northern and southern activity clusters and implementing one-way circulation with smart parking guidance along Chengxi Avenue, in line with the Meizhou regulatory plan for a “diverse mixed-use vibrant district”.
Pangui Lane’s activity remains confined to residential, educational, and cultural zones, with tourism and transport facilities underdeveloped. Low functional diversity and weak transport links perpetuate suboptimal vitality. Current renovations focus on superficial landscaping rather than revitalizing historic resources. A thorough analysis of business formats is needed to adjust the commercial mix [77], supplement missing functions, and strengthen spatial connectivity between key nodes.

6.3. Enhance Adaptability for Use and Create a Dynamic Environment

Jiaying Ancient Town shows persistently low vitality, with polarized business density and sparse distribution of leisure, dining, and entertainment venues—hindering vibrant hub formation and spatial efficiency. Regeneration efforts remain physical and cultural (e.g., arcade facade repairs, museum construction), offering limited recreational variety and underutilizing cultural assets. Emphasis should shift toward cultural-led development, integrating diverse heritage into the real economy to achieve culture–tourism synergy. Establishing a Hakka cultural zone centered on Jiaying Ancient Town and extending to the “Two Lanes” would align with the local government’s comprehensive tourism strategy [78].

6.4. Limitations of the Study and Future Directions

This study employed ArcGIS, SPSS, and Origin to analyze the relationships among POI distribution, crowd vitality, and survey data, examining how user groups and functional distribution influence historic district vitality across temporal periods. However, the explanatory power of the evaluation model remains limited. It is important to note that although the AHP questionnaire targeted core stakeholders, the sample size (n = 40) remains relatively small, which may affect the statistical robustness and generalizability of the subjective weightings. While this scale of data cannot represent all regions of China or global contexts, it establishes a methodological foundation that enables subsequent researchers to expand the scope of inquiry using this approach. Future studies should incorporate additional influencing factors—such as micro-environmental quality, behavioral trajectories, and socio-economic variables—and validate the derived weights through larger-scale surveys to enhance the model’s robustness, explanatory power, and practical applicability.

Author Contributions

Conceptualization, W.D. and W.-L.H.; Data curation, W.D. and W.-L.H.; Formal analysis, W.D. and W.O.; Investigation, W.D.; Methodology, W.D., W.O. and W.-L.H.; Resources, W.D.; Software, W.D.; Supervision, W.O. and W.-L.H.; Writing—review and editing, W.D., W.-L.H. and W.O. All authors have read and agreed to the published version of the manuscript.

Funding

Beijing University of Civil Engineering and Architecture Postgraduate Innovation Project (PG2025012); Guangdong Science and Technology (grant number: 2024A0505050031); Meizhou City Philosophy and Social Sciences Planning Project 2025 (grant number: mzsklx2025045).

Data Availability Statement

The original contributions presented in the study are included in the article; further inquiries can be directed to the corresponding author.

Acknowledgments

We would like to thank the anonymous reviewers for their valuable comments and suggestions for improving this paper.

Conflicts of Interest

The authors declare no conflicts of interest.

Abbreviations

The following abbreviations are used in this manuscript:
POIPoint of Interest
AHPAnalytic Hierarchy Process
IRRIncidence Rate Ratio
SPSSStatistical Product and Service Solutions
WWeight

References

  1. Fan, L.; Zhang, D.Y. Research on the Influence Mechanism and Spatial Heterogeneitycharacteristics of Block Vitality in Beijing: Based on Multi-Scalegeographically Weighted Regression. City Plan. Rev. 2022, 46, 27–37. [Google Scholar] [CrossRef]
  2. Song, H.; Qiu, Y.R. Research on the Architectural Space of the Folk Houses in Yuan Dynasty Under the Living Behavior Pattern: Taking the Folk Houses in the Murals of Yongle Palace as an Example. Des. Community 2023, 5, 69–73. [Google Scholar] [CrossRef]
  3. Wu, Z.Q. Research on the Design of Improving the Vitality of Public Space in Residential Historic Districts—A Case Study of Xiliulichang District in the Old City of Beijing. Master’s Thesis, Inner Mongolia University of Technology, Inner Mongolia Autonomous Region, China, 2023. [Google Scholar] [CrossRef]
  4. Qiu, Y.N. Inevitable Disappearance—Whether the Original Protection of Historical Blocks is a False Proposition. Archit. Cult. 2019, 8, 207–209. [Google Scholar] [CrossRef]
  5. Mao, Z.R.; Chen, X.K.; Xiang, Z.H.; Chen, Y. Research on the Measurement and Influencing Factors of Street Vigour in Historic Districts: A Case Study of Wenming Street Historic District in Kunming. South Archit. 2021, 4, 54–61. [Google Scholar] [CrossRef]
  6. Wang, M.; Yang, J.; Hsu, W.-L.; Zhang, C.; Liu, H.-L. Service Facilities in Heritage Tourism: Identification and Planning Based on Space Syntax. Information 2021, 12, 504. [Google Scholar] [CrossRef]
  7. Ma, X.W.; Li, B. From Space Production to Place-Making: Enlightenment from the Renewal Process of Zhongshan Road Historical District in Qingdao. Mod. Urban Res. 2024, 10, 53–59. [Google Scholar] [CrossRef]
  8. Lynch, K. Reconsidering the image of the city. In Cities of the Mind. Environment, Development, and Public Policy; Springer: Boston, MA, USA, 1984. [Google Scholar] [CrossRef]
  9. Gehl, J.; Kaefer, L.J.; Reigstad, S. Close encounters with buildings. Urban Des. Int. 2006, 11, 29–47. [Google Scholar] [CrossRef]
  10. Chen, Z.; Ma, S.J. Research on The Vitality of Urban Streets. Archit. J. 2009, S2, 121–126. [Google Scholar] [CrossRef]
  11. Yang, X.Y. Research on the Measurement and Influence Mechanism of Urban Commercial District Vitality Based on Multivariate Data. Master’s Thesis, Huazhong University of Science and Technology, Wuhan, China, 2021. [Google Scholar] [CrossRef]
  12. Ji, Y. Research on Spatial Vitality Evaluation and Influence Mechanism of Urban Center District Based on Multi-source Data—Taking Suzhou as an Example. Master’s Thesis, Dalian University of Technology, Dalian, China, 2024. [Google Scholar] [CrossRef]
  13. Chen, Y. Social Impact Assessment on the Conservation of Residential Historic Districts. Ph.D. Thesis, Southeast University, Nanjing, China, 2020. [Google Scholar] [CrossRef]
  14. Huang, J. Research on vitality measurement of Xi’an Huifang Living Street Based on multi-source big data. Master’s Thesis, Xi’an University of Architecture and Technology, Xi’an, China, 2021. [Google Scholar] [CrossRef]
  15. Wang, Z.Q.; Hu, Y.L.; Wang, L. Micro Renewal of Community Street Space from the Perspective of Spatial-behavioral Relevance—A Case Study of the Northwest Corner Hui Nationality Community, Tianjin City. Landsc. Archit. 2018, 25, 98–103. [Google Scholar] [CrossRef]
  16. Smith, M.K.; Robinson, M. Cultural Tourism in a Changing World: Politics, Participation and (Re)presentation. Channel View Publications: Bristol, UK, 2006. [Google Scholar]
  17. Jacobs, J. The Death and Life of Great American Cities; Random House: New York, NY, USA, 1961. [Google Scholar]
  18. Alexander, C. The Oregon Experiment. Center for Environmental Structure; Oxford University Press: Oxford, UK, 1975. [Google Scholar]
  19. Adams, D.; Hastings, E. Urban renewal in Hong Kong: Transition from development corporation to renewal authority. Land Use Policy 2001, 18, 245–258. [Google Scholar] [CrossRef]
  20. Smith, L.S. Religion, Politics, and the Establishment Clause: Does God Belong in American Public Life? Chapman Law Rev. 2006, 10, 299. Available online: https://digitalcommons.chapman.edu/chapman-law-review/vol10/iss2/2 (accessed on 11 October 2025).
  21. Harrison, R. Heritage: Critical Approaches; Routledge: London, UK, 2012. [Google Scholar] [CrossRef]
  22. Tawab, A.G.A. Area-based conservation: The strengths and weaknesses of the Egyptian emerging experience in area-based conservation. Alex. Eng. J. 2012, 51, 137–152. [Google Scholar] [CrossRef]
  23. Kobayashi, M. Regenerating Historic Districts; Tsinghua University Press: Beijing, China, 2015. [Google Scholar]
  24. Tighe, J.R.; Opelt, T.J. Collective memory and planning: The continuing legacy of urban renewal in Asheville, NC. J. Plan. Hist. 2016, 15, 46–67. [Google Scholar] [CrossRef]
  25. Shan, J.J. Historic City Conservation and Regeneration: International Experiences and Lessons Learned. Urban Insight 2011, 2, 5–14. [Google Scholar] [CrossRef]
  26. Pan, Y. The Conservation Methods and Practical Significance of Imaichoof “Conservation Area of Traditional Buildings” in Japan. China Anc. City 2022, 36, 47–55. [Google Scholar] [CrossRef]
  27. Liu, C.H.; Liu, D.W.; Xia, Q. Organic Renewal and Sustainable Development of Historic Districts: A Conceptual Design Study for the Former French Concession Qing Postal Bureau Block on Jiefang North Road, Tianjin. Archit. J. 2006, 12, 34–36. [Google Scholar] [CrossRef]
  28. Wu, L.; Shen, D. Research on Organic Renewal and Vitality Revitalization of Historic Districts: A Case Study of the Conservation Plan for the Minzhu Shangjie Historic District in Tongren, Qinghai. Urban Dev. Stud. 2007, 2, 110–114. [Google Scholar] [CrossRef]
  29. Xue, D.S. Implications of Western Gentrification Studies for Research on Urban Social Spaces in China. Planners 1999, 3, 109–112. [Google Scholar] [CrossRef]
  30. Qiu, J.H. Implications of the Gentrification Movement for Urban Renewal in China. Trop. Geogr. 2002, 2, 125–129. [Google Scholar] [CrossRef]
  31. Xia, J.; Wang, Y. From Reset to Rebirth: Safeguarding the Authenticity of Life in Historic Residential Districts. Urban Dev. Stud. 2010, 17, 134–139. [Google Scholar] [CrossRef]
  32. Natividade-Jesus, E.; Almeida, A.; Sousa, N.; Coutinho-Rodrigues, J. A case study driven integrated methodology to support sustainable urban regeneration planning and management. Sustainability 2019, 11, 4129. [Google Scholar] [CrossRef]
  33. Vroom, K. Antwerp: A modern city with a significant historic heritage. GeoJournal 1991, 24, 277–284. [Google Scholar] [CrossRef]
  34. Berta, M.; Bottero, M.; Ferretti, V. A mixed methods approach for the integration of urban design and economic evaluation: Industrial heritage and urban regeneration in China. Environ. Plan. B Urban Anal. City Sci. 2018, 45, 208–232. [Google Scholar] [CrossRef]
  35. Rivero, J.J. “Saving” Coney Island: The construction of heritage value. Environ. Plan. A Econ. Space 2017, 49, 65–85. [Google Scholar] [CrossRef]
  36. Yung, E.H.K.; Zhang, Q.; Chan, E.H. Underlying social factors for evaluating heritage conservation in urban renewal districts. Habitat Int. 2017, 66, 135–148. [Google Scholar] [CrossRef]
  37. Caroupapoullé, A. Creating balance between transformation and preservation within UNESCO World Heritage Sites: A case study of Belper, UK. WIT Trans. Ecol. Environ. 2019, 238, 395–405. [Google Scholar]
  38. Yang, Y.; Xia, Y.; Zhao, J.; Liu, C. Participatory Renewal of Historic Districts Based on Bayesian Network. Information 2024, 15, 628. [Google Scholar] [CrossRef]
  39. Zhai, B.; Ng, M.K. Urban regeneration and social capital in China: A case study of the Drum Tower Muslim District in Xi’an. Cities 2013, 35, 14–25. [Google Scholar] [CrossRef]
  40. Nyseth, T.; Sognnæs, J. Preservation of old towns in Norway: Heritage discourses, community processes and the new cultural economy. Cities 2013, 31, 69–75. [Google Scholar] [CrossRef]
  41. Zhang, F.; Liu, Q.; Zhou, X. Vitality evaluation of public spaces in historical and cultural blocks based on multi-source data, a case study of Suzhou Changmen. Sustainability 2022, 14, 14040. [Google Scholar] [CrossRef]
  42. Wang, F.; Liu, Z.; Shang, S.; Qin, Y.; Wu, B. Vitality continuation or over-commercialization? Spatial structure characteristics of commercial services and population agglomeration in historic and cultural areas. Tour. Econ. 2019, 25, 1302–1326. [Google Scholar] [CrossRef]
  43. Tong, P.Y. Protection and renewal strategies of residential historical and cultural blocks from Shanghai road to Wuding Road in Qingdao with analysis of spatial characteristics. Master’s Thesis, Qingdao University of Technology, Qingdao, China, 2022. [Google Scholar] [CrossRef]
  44. Zhang, Y.; Mo, N.; Liang, J. Youth Visual Engagement and Cultural Perception of Historic District Interfaces: The Case of Kuanzhai Alley, Chengdu. Buildings 2025, 15, 3224. [Google Scholar] [CrossRef]
  45. Liu, L. Research on The Dynamic Monitiring of Residential Historical and Cultural Districts Spatial Texture: Taking the Historical and Cultural Area of Nanbuting in Nanjing as an example. Master’s Thesis, Southeast University, Nanjing, China, 2022. [Google Scholar] [CrossRef]
  46. Su, G.X. Study on functional replacement in protection and reuse of residential historic buildings in fuzhou. Master’s Thesis, Fuzhou University, Fuzhou, China, 2019. [Google Scholar] [CrossRef]
  47. Sun, Y. Research on the Coupling and Coordination Evaluation System of the Protection and Commercial Utilization of Residential Historical and Cultural Blocks. Master’s Thesis, Zhengzhou University, Zhengzhou, China, 2020. [Google Scholar] [CrossRef]
  48. Cao, D. Research On Functional Implantation And Activated Utilization Of Historic Districts—A Case Study On Qingdao Shibei District. Master’s Thesis, Southeast University, Nanjing, China, 2019. [Google Scholar] [CrossRef]
  49. Yang, Y.M. Research on regeneration of historic Residential Blocks in old City from the perspective of Vitality Construction—Take the reconstruction of the four courtyards, No. 22 and No. 24, at the gate of the Palace and the surrounding areas as an example. Master’s Thesis, Jilin Jianzhu University, Changchun, China, 2021. [Google Scholar] [CrossRef]
  50. Wu, S.; Li, Y.; Fang, C.; Ju, P. Energy Literacy of Residents and Sustainable Tourism Interaction in Ethnic Tourism: A Study of the Longji Terraces in Guilin, China. Energies 2023, 16, 259. [Google Scholar] [CrossRef]
  51. Kutlu, D.; Kasalak, M.A.; Bahar, M. Assessing Climate Change Impacts on Outdoor Recreation: Insights from Visitor and Business Perspectives. Sustainability 2025, 17, 3400. [Google Scholar] [CrossRef]
  52. Zhang, G.; Chen, X.; Law, R.; Zhang, M. Sustainability of Heritage Tourism: A Structural Perspective from Cultural Identity and Consumption Intention. Sustainability 2020, 12, 9199. [Google Scholar] [CrossRef]
  53. Wan, S.; Liu, L.; Chen, G.; Wang, P.; Lan, Y.; Zhang, M. Low-Carbon Transformation of Tourism in Characteristic Towns Under the Carbon Neutral Goal: A Three-Dimensional Mechanism Analysis of Tourists, Residents, and Enterprises. Sustainability 2025, 17, 5142. [Google Scholar] [CrossRef]
  54. Zhang, T.; Jiang, Y.; Liu, D.; Zeng, S.; Sheng, P. Natural or Human Landscape Beauty? Quantifying Aesthetic Experience at Longji Terraces Through Eye-Tracking. J. Eye Mov. Res. 2025, 18, 15. [Google Scholar] [CrossRef]
  55. Wang, P.; Fu, H. The Influence of Different Visual Elements of High-Density Urban Observation Decks on the Visual Behavior and Place Identity of Tourists and Residents. Appl. Sci. 2025, 15, 3875. [Google Scholar] [CrossRef]
  56. Miao, X.; Wei, N.; Yang, D. Integrating POI-Driven Functional Attractiveness into Cellular Automata for Urban Spatial Modeling: Case Study of Yan’an, China. Buildings 2025, 15, 3624. [Google Scholar] [CrossRef]
  57. Xu, X.; Zhang, B.; Wang, Y.; Wang, R.; Li, D.; White, M.; Huang, X. Evaluating and Optimizing Walkability in 15-Min Post-Industrial Community Life Circles. Buildings 2025, 15, 3143. [Google Scholar] [CrossRef]
  58. Li, R.; Liu, X.; Li, M. Spatial Vitality Assessment of Urban Post-Industrial Landscapes Using Multi-Source Data: A Case Study of Beijing Shougang Park. Land 2025, 14, 1859. [Google Scholar] [CrossRef]
  59. Hsu, W.-L.; Shen, X.; Xu, H.; Zhang, C.; Liu, H.-L.; Shiau, Y.-C. Integrated Evaluations of Resource and Environment Carrying Capacity of the Huaihe River Ecological and Economic Belt in China. Land 2021, 10, 1168. [Google Scholar] [CrossRef]
  60. Li, H.; Calder, C.A.; Cressie, N. Beyond Moran’s I: Testing for Spatial Dependence Based on the Spatial Autoregressive Model. Geogr. Anal. 2010, 39, 357–375. [Google Scholar] [CrossRef]
  61. Zhang, Y.; Zhang, J.; Ye, Y.; Wu, Q.; Jin, L.; Zhang, H. Residents’ Environmental Conservation Behaviors at Tourist Sites: Broadening the Norm Activation Framework by Adopting Environment Attachment. Sustainability 2016, 8, 571. [Google Scholar] [CrossRef]
  62. Elshaer, I.A.; Azazz, A.M.S.; Fayyad, S. Residents’ Environmentally Responsible Behavior and Tourists’ Sustainable Use of Cultural Heritage: Mediation of Destination Identification and Self-Congruity as a Moderator. Heritage 2024, 7, 1174–1187. [Google Scholar] [CrossRef]
  63. Lan, T.; Zheng, Z.; Tian, D.; Zhang, R.; Law, R.; Zhang, M. Resident-Tourist Value Co-Creation in the Intangible Cultural Heritage Tourism Context: The Role of Residents’ Perception of Tourism Development and Emotional Solidarity. Sustainability 2021, 13, 1369. [Google Scholar] [CrossRef]
  64. Sánchez-Sánchez, M.-D.; de Pablos-Heredero, C.; Montes-Botella, J.L. Contributions of Sustainable Tourist Behavior in Food Events to the Cultural Identity of Destinations. Tour. Hosp. 2025, 6, 93. [Google Scholar] [CrossRef]
  65. Chi, X.; Lee, S.K.; Ahn, Y.-J.; Kiatkawsin, K. Tourist-Perceived Quality and Loyalty Intentions towards Rural Tourism in China. Sustainability 2020, 12, 3614. [Google Scholar] [CrossRef]
  66. Yao, X.; Sun, Y.; Sun, B.; Huang, Y. The Impact of the Urban Forest Park Recreation Environment and Perceived Satisfaction on Post-Tour Behavioral Intention—Using Tongzhou Grand Canal Forest Park as an Example. Forests 2024, 15, 330. [Google Scholar] [CrossRef]
  67. Mara, F.; Anselmi, C.; Deri, F.; Cutini, V. The Divergent Geographies of Urban Amenities: A Data Comparison Between OpenStreetMap and Google Maps. Sustainability 2025, 17, 9016. [Google Scholar] [CrossRef]
  68. Silverman, B.W. Density Estimation for Statistics and Data Analysis; Routledge: London, UK, 2018. [Google Scholar]
  69. Moran, P.A.P. Notes on Continuous Stochastic Phenomena. Biometrika 1950, 37, 17–23. [Google Scholar] [CrossRef] [PubMed]
  70. Seo, J.; Shneiderman, B. Knowledge discovery in high-dimensional data: Case studies and a user survey for the rank-by-feature framework. IEEE Trans. Vis. Comput. Graph. 2006, 12, 311–322. [Google Scholar] [CrossRef]
  71. Saaty, T.L. How to Make a Decision: The Analytic Hierarchy Process. Eur. J. Oper. Res. 1994, 48, 9–26. [Google Scholar] [CrossRef]
  72. Waller, L.A.; Gotway, C.A. Applied Spatial Statistics for Public Health Data; John Wiley & Sons, Inc.: Hoboken, NJ, USA, 2004. [Google Scholar] [CrossRef]
  73. Diaconis, P.; Graham, R.L. Spearman’s footrule as a measure of dissarray. J. R. Stat. Soc. Ser. B Methodol. 1977, 39, 262–268. [Google Scholar] [CrossRef]
  74. Gao, W.X.; Yi, M.Y.; Wang, J.; Quan, L. Research on Construction Effectiveness and InfluencingFactors of Urban Public Centers in Shenzhen: From thePerspective of Matching Relationship Between ServiceFacilities and Crowd Activities. Mod. Urban Res. 2025, 3, 60–67. [Google Scholar] [CrossRef]
  75. Lin, Z.Z.; Su, P. A Multidimensional Vitality Analysis Model for Urban Streets: The Case of Enning Road Neighborhood. World Archit. 2024, 9, 88–97. [Google Scholar] [CrossRef]
  76. Zhang, Z.; Huang, C.H. Research on Measuring and Enhancing the Vitality of Historic Streets. Mod. Urban Res. 2025, 2, 74–81. [Google Scholar] [CrossRef]
  77. Gao, T.; Jiang, Y.; Zhang, J.J. Quantitative Research and Strategy Enhancement of Spatial Activation in Universities: A Case Study of the Jiangpu Campus of Nanjing Tech University. Mod. Urban Res. 2025, 1, 91–97. [Google Scholar] [CrossRef]
  78. Xie, Y. Research on the Function of Local Government in theProtection and Development of Historic Urban Area—Take Meizhou as An Example. Master’s Thesis, South China University of Technology, Guangzhou, China, 2021. [Google Scholar] [CrossRef]
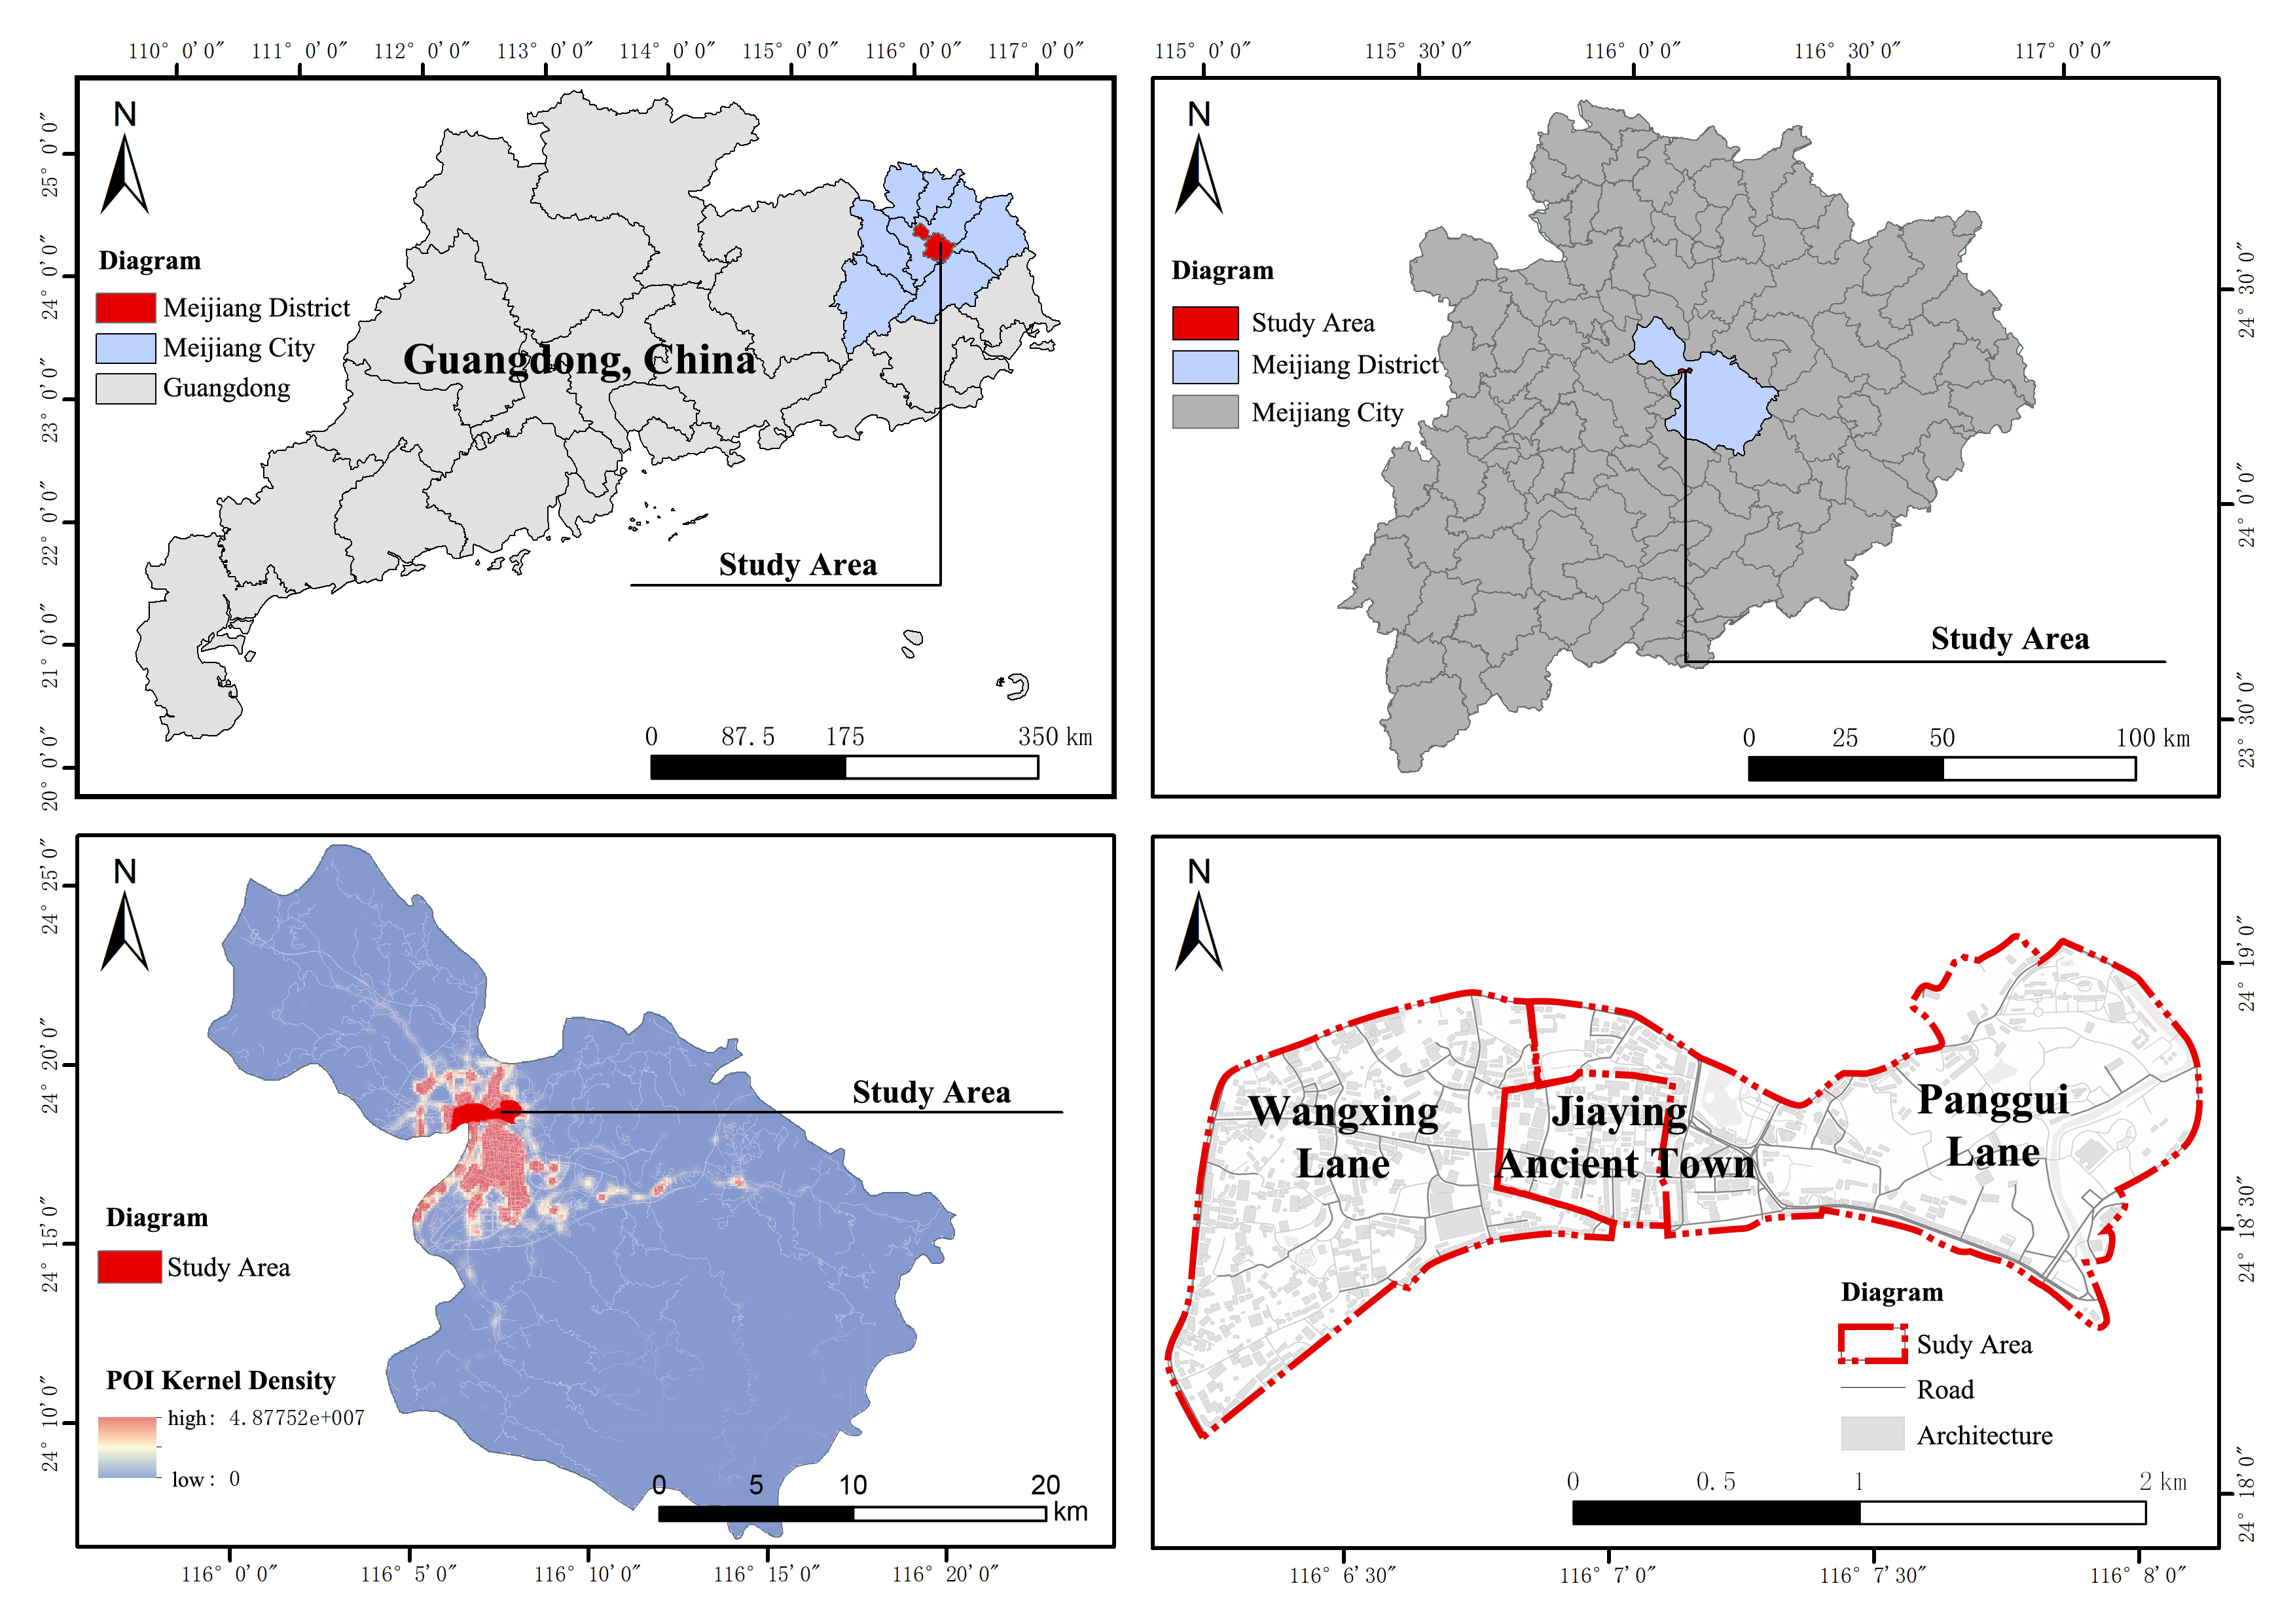
Figure 1. Study Area.
Information 16 00963 g001
Figure 2. Current distribution map documented in the “Meizhou Historical and Cultural City Conservation Plan”.
Information 16 00963 g002
Figure 3. The Flow Diagram of The Study.
Information 16 00963 g003
Figure 4. The Reciprocal Influence Between Behavior and Space.
Information 16 00963 g004
Figure 5. Global Spatial Autocorrelation Analysis. (a) Moran’s I index results. (b) Cluster distribution diagram. (c) Significance Map.
Information 16 00963 g005
Figure 6. Business Density Analysis. (a) Infrastructure. (b) Transport. (c) Service. (d) Tourism and culture.
Information 16 00963 g006
Figure 7. Frequency Distribution of Each Vitality Value.
Information 16 00963 g007
Figure 8. Characteristics of Population Activity Space Distribution During Typical Time Periods. (a~d) Weekday morning, lunchtime, afternoon, and evening, and (e~h) the corresponding periods on weekends.
Information 16 00963 g008
Figure 9. Characteristics of Population Activity Distribution During Typical Time Periods.
Information 16 00963 g009
Figure 10. Comparison of Vitality Contributions Between Residents and Tourists. (a) Composite Weighting. (b) Weekday Vitality Contribution. (c) Weekend Vitality Contribution.
Information 16 00963 g010
Figure 11. Correlation Heatmap Between Different Functions. Note: ** Significant at the 0.01 level (two-tailed). * Significant at the 0.05 level (two-tailed).
Information 16 00963 g011
Figure 12. Heatmap of Correlation Between Functional Distribution and Population Activity in Wangxing Lane. Note: * At the 0.05 level (two-tailed), the correlation is significant.
Information 16 00963 g012
Figure 13. Heatmap of Correlation Between Functional Distribution and Population Activity in Jiaying Town. Note: ** Significant at the 0.01 level (two-tailed). * Significant at the 0.05 level (two-tailed).
Information 16 00963 g013
Figure 14. Heatmap of the Correlation Between Functional Distribution and Population Activity at Pangui Lane. Note: ** Significant at the 0.01 level (two-tailed). * Significant at the 0.05 level (two-tailed).
Information 16 00963 g014
Table 1. Data sources.
DimensionData NameFunction and BasisSourcesYear
Spatial dataPoints of Interest (POIs)Used to quantify the functional density, types, and distribution patterns of blocks, it serves as the foundation for analyzing the relationship between function and vitality [56].Amap2024
Road Network Basic DataAs a foundational base map, it serves as a key morphological indicator influencing population mobility [67].OpenStreetMap2024
Behavioral dataBaidu HeatmapDirectly reflects the real-time distribution and clustering intensity of crowds across spatiotemporal dimensions, serving as the objective core data for quantifying spatial vitality [58].Baidu Maps2024
Subjective evaluation dataAnalytic Hierarchy Process (AHP)
Expert Questionnaire Data
To quantify residents’ and tourists’ importance ratings for different spatial functions, converting subjective preferences into computable weights to compensate for insufficient objective data [59].Questionnaire survey2024
Table 2. Research Methodology.
Data TypeMethodToolObjectiveFormula
Spatial AnalysisKernel
Density [68]
ArcGIS Version 10.3 software (Esri, Redlands, CA, USA)Estimate the density distribution of POIs and roads to analyze the spatial patterns of commercial formats. f x = 1 n h i = 1 n K ( x x i h )
Among them, f(x)is the density estimate at point x, n is the number of points, h is the bandwidth, K is the kernel function, x i is the coordinate of the i-th point.
Moran’s I [69,60]GeoDa software (subversion 1.22.0.20) (GeoDa Center, Arizona State University, Tempe, AZ, USA)Examine the spatial autocorrelation of commercial formats to assess their clustering or dispersion patterns. I = n i = 1 n j = 1 n w i j i = 1 n j = 1 n w i j ( x i x ¯ ) ( x j x ¯ ) i = 1 n ( x i x ¯ ) 2
Among them, n is the number of spatial units, x i and x j are the values of units i and j, x ¯ is the mean value, is the spatial weight matrix. The resulting values range between −1 and 1, w i j indicating positive or negative autocorrelation.
Crowd
Activity Analysis
Heatmap Data [70]Baidu Heatmap online service (Baidu, Inc., Beijing, China)Quantifying spatio-temporal vitality by calculating activity intensity based on Baidu heatmap data. V = 1 T t = 1 T H t
Among them, V is the average activity value, T is the number of time points, H t is the thermodynamic value at time t.
Questionnaire SurveyAHP [71]Develop a composite indicator for subjective evaluation and collect data on residents’ or users’ perceptions. W i = j = 1 m A i j m j = 1 m W ¯ j
Among them, W i denotes the weight assigned to each indicator; m represents the number of dimensions; A signifies the score value; W ¯ j indicates the sum of the weights for each indicator.
GLM
Poisson [72]
IBM SPSS Statistics 27 software (IBM Corp., Armonk, NY, USA)Analyze the impact of POIs on vitality and model count data. E Y = β 0 + β 1 X 1 + β 2 X 2 +
Among them, E(Y) is the expected vitality value, β is the coefficient, X is the POI variable.
Incidence Rate Ratio (IRR)Derived from the Poisson modelQuantify the magnitude of POI impact on vitality and calculate the incidence ratio of variables. I R R = e B
Among them, e is the natural constant, and B (Beta) is the coefficient value output from the Poisson regression analysis.
Correlation AnalysisSpearman’s ρ [73]Origin Version 2024b software (OriginLab Corp., Northampton, MA, USA)Evaluating the Monotonic Relationship Between Function and Vitality. ρ = 1 6 d i 2 n ( n 2 1 )
Among them, d i is the rank difference, n is the sample size, and ρ is a value between −1 and 1, indicating the strength of the correlation.
Table 3. Distribution of Vitality Values.
Vitality TypeVitality RangeTotal Observation FrequencyPercentage
Low vitality0~140153.3%
medium vitality2~333744.8%
High vitality≥4141.9%
Total 752100%
Table 4. Resident Rating Assignment Criteria.
IdentityUniversity facultyGovernment employeeArchitecture studentsResident
Score5423
Educational BackgroundMaster’s degree and aboveUndergraduateSpecialistHigh school and below
Score4321
Length of stayLess than 1 year1~5 year6~10 yearOver 10 years
Score2345
Table 5. Calculation of Lever 1 Indicator Weights for Resident No. 20.
Level 1 IndicatorInfrastructureTransportation FacilitiesService Facilities
Infrastructure153
Transportation facilities0.210.333333333
Cultural Tourism153
Table 6. Residents’ Assessment of the Contribution of Service Facilities to Neighborhood Vitality.
Level 1 IndicatorLevel 1
Weighting WC
Level 2
Indicator
Level 2
Weighting
WP
Composite Weighting
W
Weekday IRRWeekday ContributionWeekend IRRWeekend Contribution
Service Facilities0.1766Leisure and Recreation0.25880.04570.9454.32%0.8984.10%
Daily Living Services0.44150.07801.0468.16%1.0698.34%
Commercial Services0.29970.05291.1396.03%1.1295.97%
Disclaimer/Publisher’s Note: The statements, opinions and data contained in all publications are solely those of the individual author(s) and contributor(s) and not of MDPI and/or the editor(s). MDPI and/or the editor(s) disclaim responsibility for any injury to people or property resulting from any ideas, methods, instructions or products referred to in the content.