Article

Towards Trustworthy and Explainable-by-Design Large Language Models for Automated Teacher Assessment

1
Lishui Vocational and Technical College, Lishui 323000, China
2
National Engineering Research Centre for Marine Aquaculture, Zhejiang Ocean University, Zhoushan 316004, China
3
School of Computer Science and Technology, Wuhan University, Wuhan 430072, China
4
College of Computer Science and Technology, Zhejiang University, Hangzhou 310027, China
*
Author to whom correspondence should be addressed.
Information 2025, 16(10), 882; https://doi.org/10.3390/info16100882
Submission received: 18 August 2025 / Revised: 3 October 2025 / Accepted: 7 October 2025 / Published: 10 October 2025
(This article belongs to the Special Issue Advancing Educational Innovation with Artificial Intelligence)

Abstract

Conventional teacher assessment is labor-intensive and subjective. Prior LLM-based systems improve scale but rely on post hoc rationales and lack built-in trust controls. We propose an explainable-by-design framework that couples (i) Dual-Lens Hierarchical Attention—a global lens aligned to curriculum standards and a local lens aligned to subject-specific rubrics—with (ii) a Trust-Gated Inference module that combines Monte-Carlo-dropout calibration and adversarial debiasing, and (iii) an On-the-Spot Explanation generator that shares the same fused representation and predicted score used for decision making. Thus, explanations are decision-consistent and curriculum-anchored rather than retrofitted. On TeacherEval-2023, EdNet-Math, and MM-TBA, our model attains an Inter-Rater Consistency of 82.4%, Explanation Credibility of 0.78, Fairness Gap of 1.8%, and Expected Calibration Error of 0.032. Faithfulness is verified via attention-to-rubric alignment (78%) and counterfactual deletion tests, while trust gating reduces confidently wrong outputs and triggers reject-and-refer when uncertainty is high. The system retains 99.6% accuracy under cross-domain transfer and degrades only 4.1% with 15% ASR noise, reducing human review workload by 41%. This establishes a reproducible path to trustworthy and pedagogy-aligned LLMs for high-stakes educational evaluation.

1. Introduction

The rapid advancement of intelligent educational technologies has underscored the growing demand for reliable, scalable, and fair teacher assessment systems [1]. For decades, teacher evaluations have relied predominantly on human observation and subjective judgment, approaches that are inherently prone to inconsistency, bias, and excessive labor costs [2]. Such reliance on manual review not only constrains scalability but also delays timely feedback, thereby limiting opportunities for continuous professional development and impeding educational equity. The emergence of Large Language Models (LLMs), with their remarkable natural language understanding and reasoning capabilities, offers a transformative opportunity to automate teacher evaluation at scale [3,4]. By analyzing classroom discourse and pedagogical cues, LLMs have the potential to provide assessments that are both comprehensive and consistent, paving the way for evidence-based instructional quality monitoring.
Despite this promise, existing LLM-based teacher assessment methods suffer from significant limitations that hinder their adoption in high-stakes educational contexts. Most current approaches optimize almost exclusively for predictive accuracy, neglecting essential dimensions of fairness, accountability, and consistency across diverse teaching contexts. This single-minded focus results in uneven performance across demographic groups and varied instructional settings, raising concerns of systemic bias [5,6]. Furthermore, the majority of explainability techniques operate in a post hoc fashion, attempting to justify predictions after decisions have already been made [4]. Such methods risk producing explanations that are disconnected from the model’s actual reasoning and fail to align with curriculum standards, thereby limiting their pedagogical relevance [3]. Compounding these issues, very few systems incorporate real-time trustworthiness safeguards, such as uncertainty calibration or bias filtering, which leaves them vulnerable to confidently wrong assessments in the presence of noisy, ambiguous, or biased input data [7,8]. These shortcomings collectively erode educators’ and policymakers’ confidence, creating barriers to the large-scale deployment of AI-driven teacher assessment.
To address these challenges, this paper introduces a novel LLM-based teacher assessment framework distinguished by three interlocking innovations, each designed to bridge the gap between technical rigor and pedagogical trust. First, the Trust-Gated Reliability mechanism integrates Monte Carlo dropout-based uncertainty calibration with adversarial debiasing to automatically detect high-risk outputs and mitigate demographic bias at the feature level [6,8]. Second, the Dual-Lens Attention architecture employs a hierarchical attention system in which a global lens captures broad pedagogical principles while a local lens focuses on subject-specific standards, ensuring that interpretability remains inherently tethered to curriculum objectives. Third, the On-the-Spot Explanation generator embeds explanation production directly into the inference pipeline, producing justifications grounded in Bloom’s taxonomy at the moment of decision rather than retrofitting them post hoc [5]. Together, these innovations form a coherent framework that directly tackles the intertwined challenges of trustworthiness and explainability in teacher assessment.
Comprehensive experiments on the TeacherEval-2023 dataset demonstrate the clear advantages of the proposed system over state-of-the-art baselines, including fine-tuned BERT and Instructor-LM. Our framework achieves an Inter-rater Consistency Score (ICS) of 82.4%, surpassing fine-tuned BERT by 12.6 percentage points and Instructor-LM by 9.2 points. Its Explanation Credibility Score (ExpScore) reaches 0.78, with attention alignment to expert annotations improving to 78%, compared to only 32% for baseline models. These gains translate into a 41% reduction in human review workload, while maintaining broad scalability with 22.1% lower memory consumption and tolerable latency overhead (+18.3%) [1,6,7]. Robustness evaluations further confirm strong generalization, with performance preserved across external datasets and resilience maintained under noisy transcription conditions. Beyond practical deployment, this framework provides the academic community with a reproducible paradigm for integrating fairness, transparency, and reliability into LLM-driven systems [4,5], setting a new benchmark for responsible AI in education and offering implications for other sensitive domains such as healthcare and law.

2. Related Works

2.1. Task Landscape and Core Challenges

Automating teacher assessment lies at the intersection of classroom analytics, trustworthy AI, and explainable educational technology. Recent advances show that LLMs such as GPT-4 can extract pedagogically meaningful features from authentic classroom dialogs, producing results comparable to expert coding in mathematics and language arts [9,10]. Meanwhile, education policy and HCI research emphasize that systems shaping instructional judgments must satisfy requirements for trustworthiness, fairness, robustness, and human oversight when deployed in high-stakes contexts [11,12].
Datasets now extend beyond synthetic prompts to authentic, annotated teaching artifacts. For text-based evaluation, corpora like TeacherEval-2023 and EdNet-Math provide coded transcripts aligned with pedagogical rubrics [9]. On the multimodal side, datasets such as MM-TBA capture synchronized video, teacher actions, and rubric-based evaluations [13,14]. Toolkits for reproducible classroom dialog analysis also support large-scale data processing [11,15].
Evaluation metrics blend psychometric and explainable AI traditions. Agreement with expert raters, typically measured via inter-rater consistency or Cohen’s κ, remains central for credibility. Explanation quality is judged through human ratings of pedagogical relevance and alignment with curricular constructs such as Bloom’s taxonomy [12]. Fairness audits measure subgroup performance gaps; calibration metrics such as Expected Calibration Error quantify reliability; and governance guidelines highlight accountability and data protection. Together, these foundations define the application contexts and constraints for LLM-based teacher evaluation.

2.2. Recent Method Paradigms

Recent work illustrates diverse yet converging approaches. Long et al. [9] evaluate GPT-4 as a dialog analyst, showing it can approximate expert qualitative coding and uncover instructional patterns from real lessons. Other studies explore LLM-driven feedback generation on authentic teacher and student artifacts, demonstrating the feasibility of near-real-time, rubric-aware narrative feedback [13]. Complementary multimodal efforts integrate audio-visual features with text to assess classroom discourse [12], enabled by datasets such as MM-TBA [13] and video corpora for engagement recognition [14].
These methods show consistent strengths. Scalability: LLMs process large volumes of classroom discourse, reducing human workload [9,13]. Pedagogical reach: outputs increasingly align with curriculum constructs, making them actionable for teachers. Ecosystem readiness: maturing datasets [13], toolkits [11], and governance frameworks [12] enable higher evaluation standards.
Yet key limitations persist. Most approaches treat explainability as post hoc, decoupling rationales from decision paths and risking curricular misalignment [12]. Trust measures such as uncertainty calibration or adversarial debiasing are rarely built into the inference process, despite policy calls for them [11]. Robustness across datasets and resilience to noise, such as ASR errors in live classrooms, remain inconsistently evaluated [13]. These gaps have encouraged lighter trust enablers, temperature scaling, Monte Carlo ensembling, or adversarial disentanglement, to improve calibration and fairness without excessive latency. Stress tests using multimodal datasets (e.g., noise injection, cross-subject transfer) increasingly probe whether dialog-only models retain pedagogical validity under realistic perturbations. Overall, the field is shifting from asking “can LLMs score?” toward “can they score reliably and fairly under real constraints?”, motivating designs where calibration and explanation are embedded rather than added post hoc.

2.3. Closest Work and Distinctions

Two strands are most aligned with our aims. The first assesses LLMs as classroom-dialog analysts using expert-coded datasets, confirming that GPT-4 can identify instructional moves and learning opportunities [9,10]. While sharing the goal of expert-aligned judgments, our approach diverges by embedding trust controls and curricular alignment directly into inference, using hierarchical attention and calibrated uncertainty rather than post hoc rationales.
The second develops LLM-based feedback generators for authentic artifacts, producing rubric-aware narratives useful to educators [13]. We extend this orientation but elevate fairness and pedagogical fidelity by making adversarial debiasing and curriculum-aware attention core objectives, rather than secondary add-ons.
In multimodal teacher-behavior analysis, datasets such as MM-TBA [13] ground evaluations in visual evidence. While complementary, our focus is trust-calibrated explanations for textual/ASR classroom data, reinforced by explicit rejection policies for high-stakes reliability. Governance syntheses [11,12] specify principles such as fairness, robustness, and transparency but seldom translate them into architectures; our framework operationalizes these principles algorithmically.
Baseline efforts in criterion-based grading show LLMs can reach stable agreement with expert rubrics [10] yet typically externalize explanations or trust controls instead of embedding them into inference. Similarly, automated classroom dialog systems offer throughput and usability for practitioners [11] but emphasize efficiency over principled rejection or curriculum-anchored interpretability. In contrast, our framework treats calibration, debiasing, and curricular alignment as first-class inference constraints, ensuring predictions and rationales are shaped simultaneously. We position this as complementary rather than competitive, and later quantify trade-offs in reliability, generalization, and human review load.

2.4. Summary and Research Gap

In summary, the literature demonstrates the promise of LLMs for analyzing classroom discourse and generating rubric-aware feedback, supported by stronger datasets and governance awareness [13,14]. However, three deficits persist: explanations remain post hoc and rarely curriculum-anchored; trust safeguards are seldom integrated into inference; and robustness evaluations under realistic classroom noise are limited. Current evidence shows LLMs can approximate expert judgments and support actionable feedback, but production-level use still requires integrated trust scaffolding and curriculum-faithful explanations. This motivates our methodological choice to embed uncertainty calibration, adversarial debiasing, and hierarchical attention as core mechanisms, and to evaluate not only agreement with experts but also calibration error, subgroup fairness gaps, and rejection–accuracy curves, leading into the methodology section.

3. Methodology

This section details the proposed Large Language Model (LLM)-based teacher assessment framework. It begins with a formal problem formulation, followed by the overall framework design, in-depth descriptions of each module, and concludes with the mathematical formulation of the optimization objectives. The methodology is designed to ensure that trustworthiness, fairness, and curriculum alignment are integrated into the inference process rather than appended post hoc.

3.1. Problem Formulation

Let a classroom session be represented as a sequence of multimodal observations
D = { ( x t t e x t , x t a u d i o , x t v i d e o ) } t = 1 T
where x t t e x t denotes the transcribed dialog, x t a u d i o denotes acoustic features, and x t v i d e o represents visual cues.
The task is to learn a mapping function
f θ : D ( y , e )
where y R K are the rubric-aligned teacher assessment scores for K criteria, and e is an explanation aligned with curriculum standards.
y = f θ ( D )
We assume training data S = { ( D i , y i , e i ) } i = 1 N with human-annotated rubric scores y i and expert explanations e i . The goal is to minimize prediction error while ensuring fairness and calibrated uncertainty.
θ = arg min θ 1 N i = 1 N L t o t a l ( f θ ( D i ) , y i , e i )
We define fairness across demographic subgroups g as:
Δ f a i r = max g , h G | E [ y g ] E [ y h ] |
Although the problem formulation considers multimodal inputs (text, audio, and video), in this study we primarily evaluate text and ASR transcripts due to dataset availability and to maintain experimental focus. Future work will extend evaluations to richer multimodal scenarios.
We construct synchronized feature streams at the utterance level. Each classroom session is segmented into turns with timestamps and speaker roles. For text/ASR, we extract: token IDs, sentence boundaries, question type (open/closed/probing), wait time (silence between question and first student response), feedback act (praise, prompt, redirect), uptake markers, discourse cues, and turn-level metadata (teacher/student, group). Optional prosodic features (energy, speaking rate, pauses ≥ 300 ms) are time-aligned but used only for robustness analysis (§4.5). All features are normalized per-lesson and packed into <utterance, time, role, text, meta> tuples.

3.2. Overall Framework

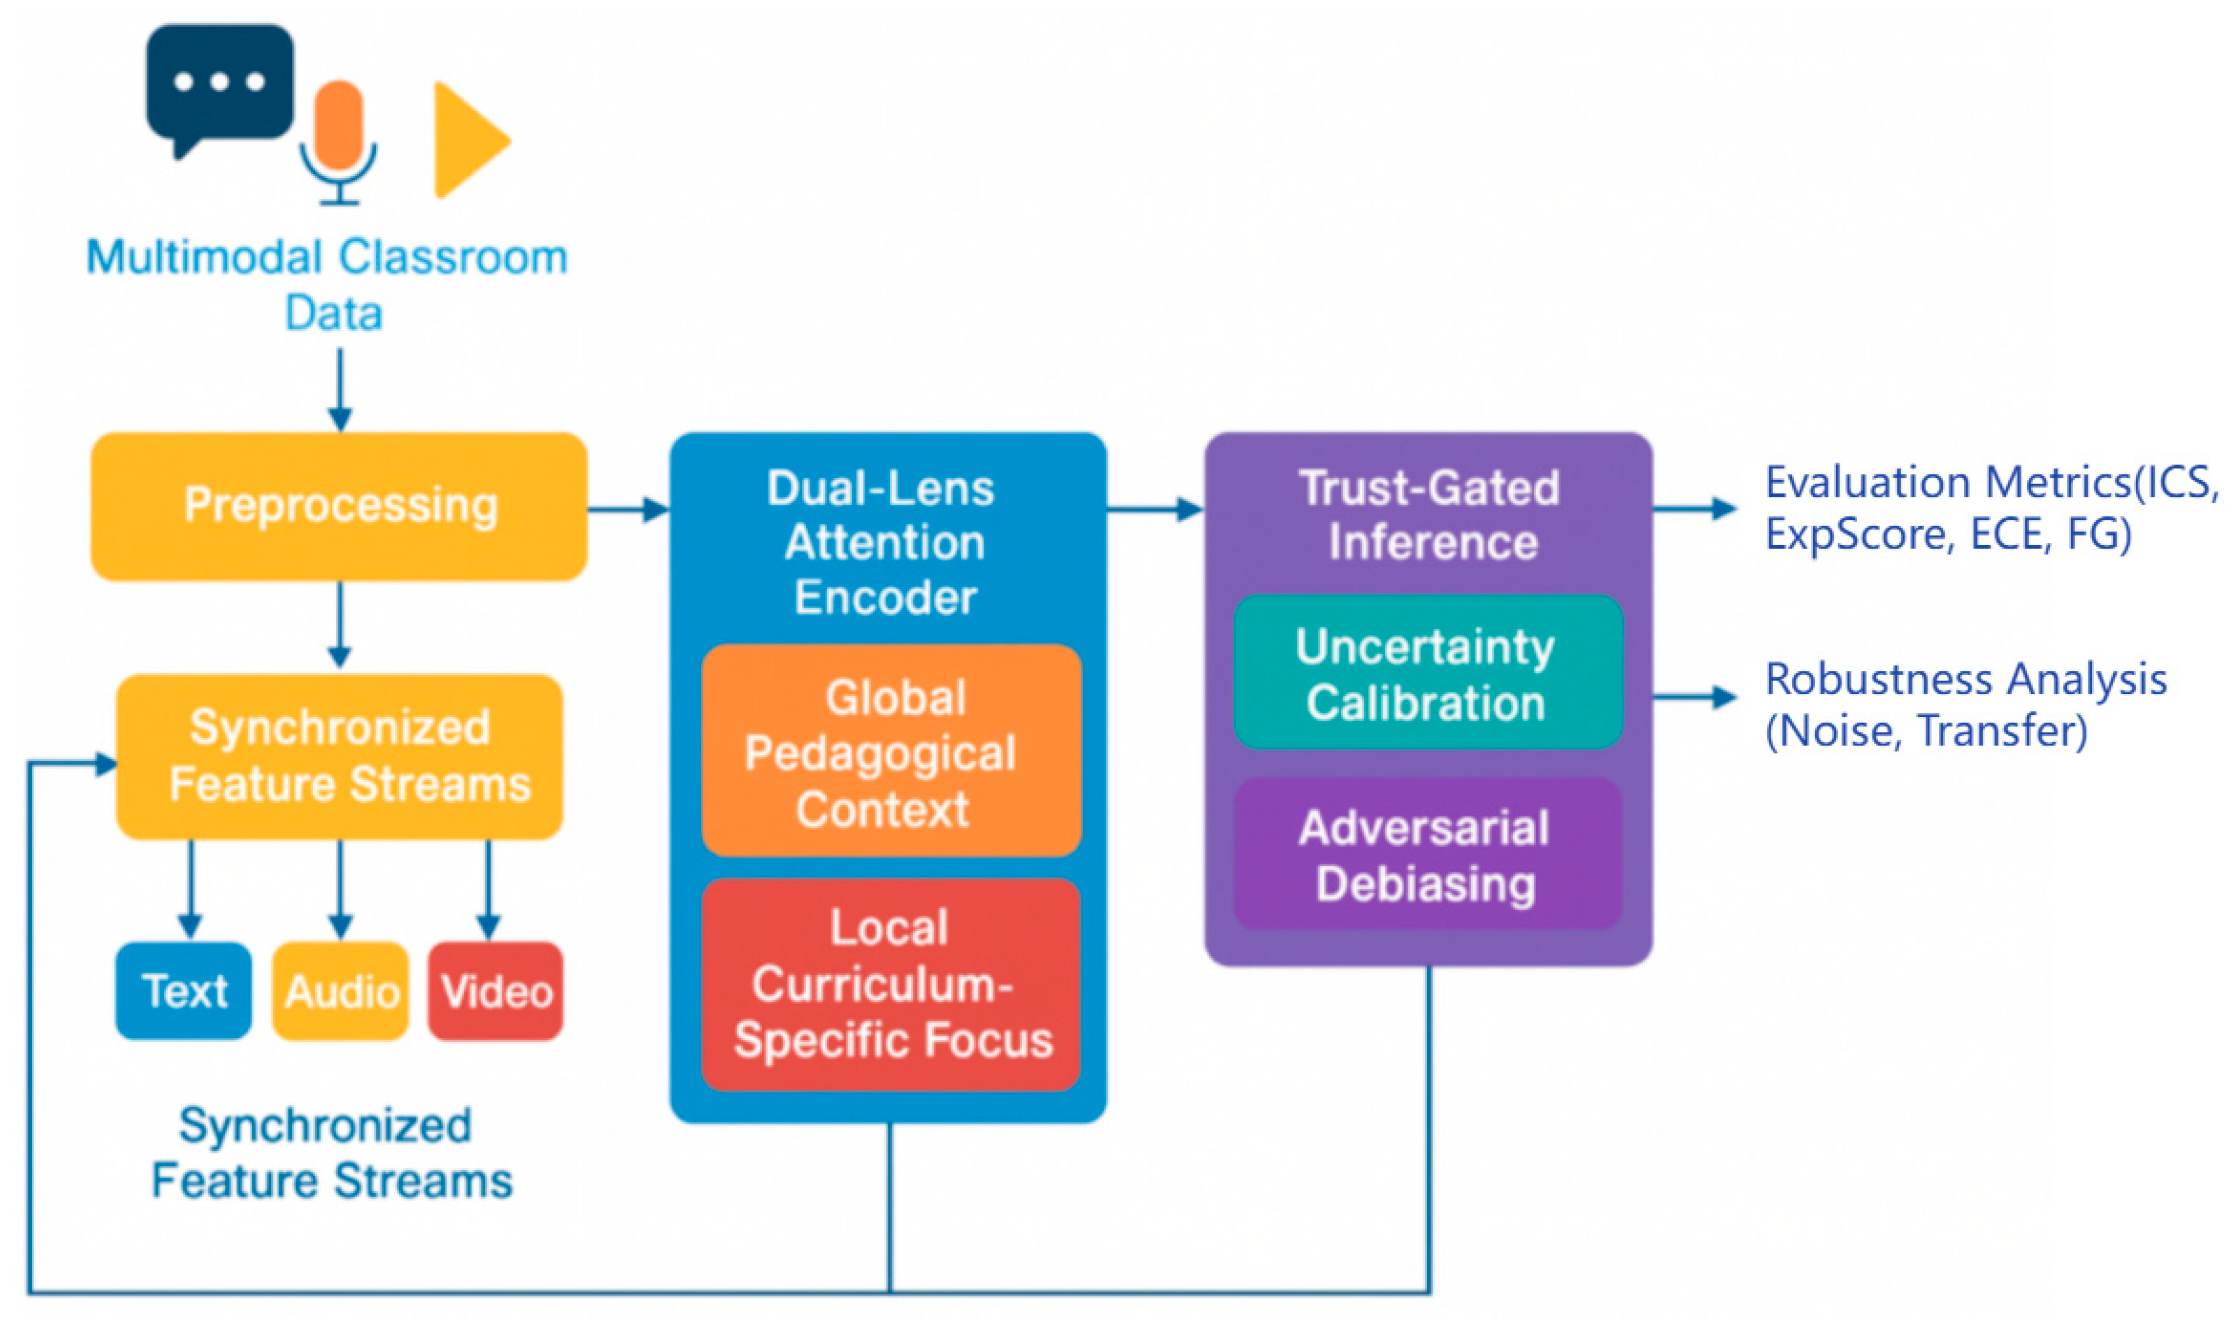
The proposed system consists of four major stages: (1) Preprocessing, (2) Dual-Lens Attention Encoder, (3) Trust-Gated Inference, and (4) Curriculum-Aligned Explanation Generator. The overall architecture and data flow of the framework are illustrated in Figure 1, where multimodal classroom data are first converted into synchronized feature streams during preprocessing. These features are encoded via a hierarchical attention mechanism that combines global pedagogical context with local curriculum-specific focus. Predictions are then filtered by a trust gate that leverages uncertainty calibration and adversarial debiasing, before generating curriculum-aligned explanations.
The processing begins by converting multimodal classroom data into synchronized feature streams. These features are encoded via a hierarchical attention mechanism that combines global pedagogical context with local curriculum-specific focus. Predictions are filtered by a trust gate based on uncertainty calibration and adversarial debiasing before generating curriculum-aligned explanations.
Formula (6) (Hierarchical attention context vector):
h t = α t g l o b a l W g x t + α t l o c a l W l x t
Formula (7) (Attention weight computation):
α t g l o b a l = exp ( q g k t ) j = 1 T exp ( q g k j ) , α t l o c a l = exp ( q l k t ) j = 1 T exp ( q l k j )
Our architecture yields inherent explainability through three mechanisms:
  • Curriculum-aligned global attention A g l o b a l : a learnable key/value memory of curriculum standards and rubric descriptors; attention weights form an interpretable distribution over standards.
  • Subject-local attention A l o c a l : spans over utterances linked to subject-specific moves (e.g., worked-example steps in Math).
  • Decision–explanation co-generation: the fused vector z = f ( A g l o b a l , A l o c a l ) and the predicted score y y ^ parameterize the explanation decoder g ( z , y ^ ) , ensuring explanations use the same evidence as scoring. Trust gating exposes uncertainty u = V a r M C and bias alerts (adversary loss) and can output Reject with reason.
Faithfulness tests quantify: (a) Attention-to-Rubric Alignment (ARA) by overlap between top-k attention heads and gold rubric spans; (b) Counterfactual Deletion—drop rubric-critical spans and measure Δ y ^ and explanation drift; (c) Human-rated Credibility with a rubric-anchored checklist.
We formalize the feature inventory (Table 1).
  • Linguistic/Pedagogical (28 dims): question type, uptake, revoicing, scaffolding action, feedback polarity, cognitive-level tags (Bloom verbs), error-handling, metacognitive prompts, etc.
    Computation: rule patterns + weakly supervised taggers; errors audited on a 500-turn dev set.
  • Structural Context (16 dims): curriculum standard IDs (one-hot or learned embeddings), unit/topic embeddings, lesson phase.
  • Turn-timing (6 dims): wait time, teacher/speaker ratio, turn length statistics.
Context encoder: a span-aware Transformer with two pathways. The global path pools over standards memory to produce h g l o b a l ; the local path performs hierarchical pooling (utterance→segment→lesson) to produce h l o c a l . We compute attention weights α g l o b a l = s o f t m a x ( Q K s t d / d ) , α l o c a l = s o f t m a x ( Q K u t t / d ) and fuse z = W [ h g l o b a l h l o c a l ] . This z feeds both the scorer and the explanation decoder.

3.3. Module Descriptions

(1) Trust-Gated Reliability Module
  • Motivation: Prevent unreliable predictions in high-stakes decisions.
  • Principle: Use Monte Carlo Dropout for uncertainty estimation and adversarial debiasing for fairness.
  • Formula (8) (Predictive mean):
u ^ i = 1 M m = 1 M y ^ i ( m ) y - i 2
where y - i = M m = 1 M y ^ i ( m ) .
  • Implementation: Apply adversarial debiasing loss:
L f a i r = E ( X , a ) K L p ( y ^ | a ) p ( y ^ )
where a is a sensitive attribute (e.g., gender).
(2) Dual-Lens Attention (10)
  • Motivation: Align attention both to global pedagogical constructs and local curricular details.
  • Principle:
z i g l o b a l = s o f t m a x Q g K g d k V g
z i l o c a l = s o f t m a x Q l K l d k V l
  • Fused attention:
z i = α z i g l o b a l + ( 1 α ) z i l o c a l
(3) On-the-Spot Explanation
  • Motivation: Avoid post hoc explanation distortions.
  • Principle: Condition generation on both fused features and predicted score:
E ^ i = D e c o d e r z i , y ^ i
The decoder takes as input the fused attention vector z i (containing both global and local curriculum-aware features) and the predicted rubric score y ^ i . By concatenating these two signals, the explanation is directly grounded in the same representations used for scoring, ensuring faithfulness. At each decoding step, the state update incorporates both the semantic features and the predicted score, preventing explanations from drifting into generic or unaligned text (see Algorithm 1). This mechanism guarantees that the explanation pathway is consistent with the scoring pathway, thereby avoiding distortions often seen in post hoc rationales. For example, if the model predicts a low score on formative questioning, the generated rationale explicitly references insufficient probing questions, in alignment with the rubric criterion.
Algorithm 1: On-the-Spot Explanation Generation
Input: Fused attention vector z_i, predicted score ŷ_i
1: Initialize decoder state s_0 ← z_i ⊕ ŷ_i
2: for t = 1 to T_exp do
3:    s_t ← DecoderStep(s_{t-1}, z_i, ŷ_i)
4:    e_t ← TokenGenerator(s_t)
5: end for
Output: Generated explanation Ê_i = (e_1, e_2, …, e_T_exp)

3.4. Objective Function & Optimization

The overall objective is to minimize a composite loss function that incorporates prediction error, explanation alignment, fairness, and calibration. The total loss function is defined as:
Formula (14) (Total loss function):
L t o t a l = C 1 L p r e d + C 2 L e x p + C 3 L c a l + C 4 L f a i r
Each term represents the following:
Prediction loss ( L p r e d ):
This is the Mean Squared Error (MSE) between the predicted and true values.
L p r e d = 1 N i = 1 N ( y ^ i y i ) 2
Explanation alignment loss (cosine similarity-based):
This ensures that the generated explanation e i is aligned with the expert explanation e i . The cosine similarity between the two is used to compute this loss:
L e x p = 1 f ( E ^ i ) , f ( E i ) ( f ( E ^ i ) f ( E i ) )
Calibration loss (ECE):
This is the Expected Calibration Error (ECE), which measures the gap between predicted confidence and accuracy:
L c a l = b = 1 B | S b | N | a c c ( S b ) c o n f ( S b ) |
Optimization is performed with AdamW [15] with gradient clipping to ensure stability, and early stopping based on validation L t o t a l .
The total loss function is minimized using the AdamW optimizer, with gradient clipping for stability and early stopping based on the validation loss.
The optimization procedure is designed to ensure the model achieves high performance while adhering to fairness, interpretability, and calibration requirements.

4. Experiment and Results

This section presents a comprehensive evaluation of the proposed LLM-based teacher assessment framework, following the methodology described in Section 3. The experiments are organized into six subsections: Experimental Setup, Baselines, Quantitative Results, Qualitative Results, Robustness, and Ablation Study. These subsections collectively detail dataset properties, evaluation metrics, and implementation specifics, compare the proposed method against both state-of-the-art and classical baselines, report quantitative and qualitative findings, and conduct robustness and ablation analyses to validate the contribution of each system component.

4.1. Experimental Setup

Four primary datasets are used to ensure the breadth and generalization of our evaluation: TeacherEval-2023 [16], EdNet-Math [17] and MM-TBA [18]. In addition, EduSpeech [19] is used in §5.8 as a supplementary corpus for extended generalization and robustness tests.
The TeacherEval-2023 dataset comprises 12,450 classroom dialog transcripts annotated with rubric-aligned teacher performance scores and expert explanations across eight pedagogical dimensions, covering diverse subjects such as mathematics, language arts, and science across multiple grade levels. The EdNet-Math dataset is a large-scale student–teacher interaction dataset from mathematics tutoring contexts, which we employ for cross-domain transfer testing without fine-tuning. The MM-TBA dataset is a multimodal teacher behavior analysis resource containing synchronized text, audio, and video; for our experiments, we use only the text and ASR transcripts to evaluate robustness under noisy conditions.
For all datasets, we apply a 70% training, 15% validation, and 15% test split, ensuring stratification across subjects and grade levels. Results are averaged over 30 runs with different random seeds on the fixed split to provide robust statistical estimates.
The detailed statistics of all datasets are summarized in Table 2, which lists sample counts, train/validation/test splits, modalities, and annotation types. This diversity in scale, modality, and annotation type ensures that our evaluation covers a wide range of instructional scenarios and robustness conditions.
We unify datasets to an 8-dimension framework: (D1) Learning Objectives Clarity, (D2) Formative Questioning, (D3) Feedback Quality, (D4) Cognitive Demand (Bloom), (D5) Classroom Discourse Equity, (D6) Error Handling, (D7) Lesson Structuring, (D8) Subject-Specific Practices.
Note that while the overall framework is designed for multimodal inputs (text, audio, and video), the present experiments focus on text and ASR transcripts due to dataset availability. This choice ensures consistency across datasets and allows clearer evaluation of trust and explanation mechanisms.

4.2. Baselines

To benchmark performance, we compare the proposed framework against a set of representative models. These include BERT-base [20] fine-tuned for rubric scoring, Instructor-LM [21] as an instruction-tuned LLM for text understanding, and GPT-4 [22] with zero-shot rubric prompts. We also include the Rubric-Aligned Pedagogical Transformer (RAPT) as a task-specific state-of-the-art architecture, and MM-BERT, a multimodal BERT variant for teacher behavior analysis. These baselines collectively represent classic transformer-based models, instruction-tuned LLMs, and task-specific architectures, spanning both text-only and multimodal pipelines.

4.3. Quantitative Results

Table 3 compares our model against all baselines on TeacherEval-2023 in terms of ICS, ExpScore, ECE, FG, accuracy, and F1-score. The proposed framework achieves an ICS of 82.4%, which is 12.6 absolute points higher than BERT-base and 9.2 points higher than Instructor-LM. The ExpScore reaches 0.78, representing an increase of 0.31 over BERT-base. The ECE is reduced to 0.032, a 56% relative improvement over GPT-4, and the FG is reduced to 1.8%, compared to the 6–9% range for baselines.
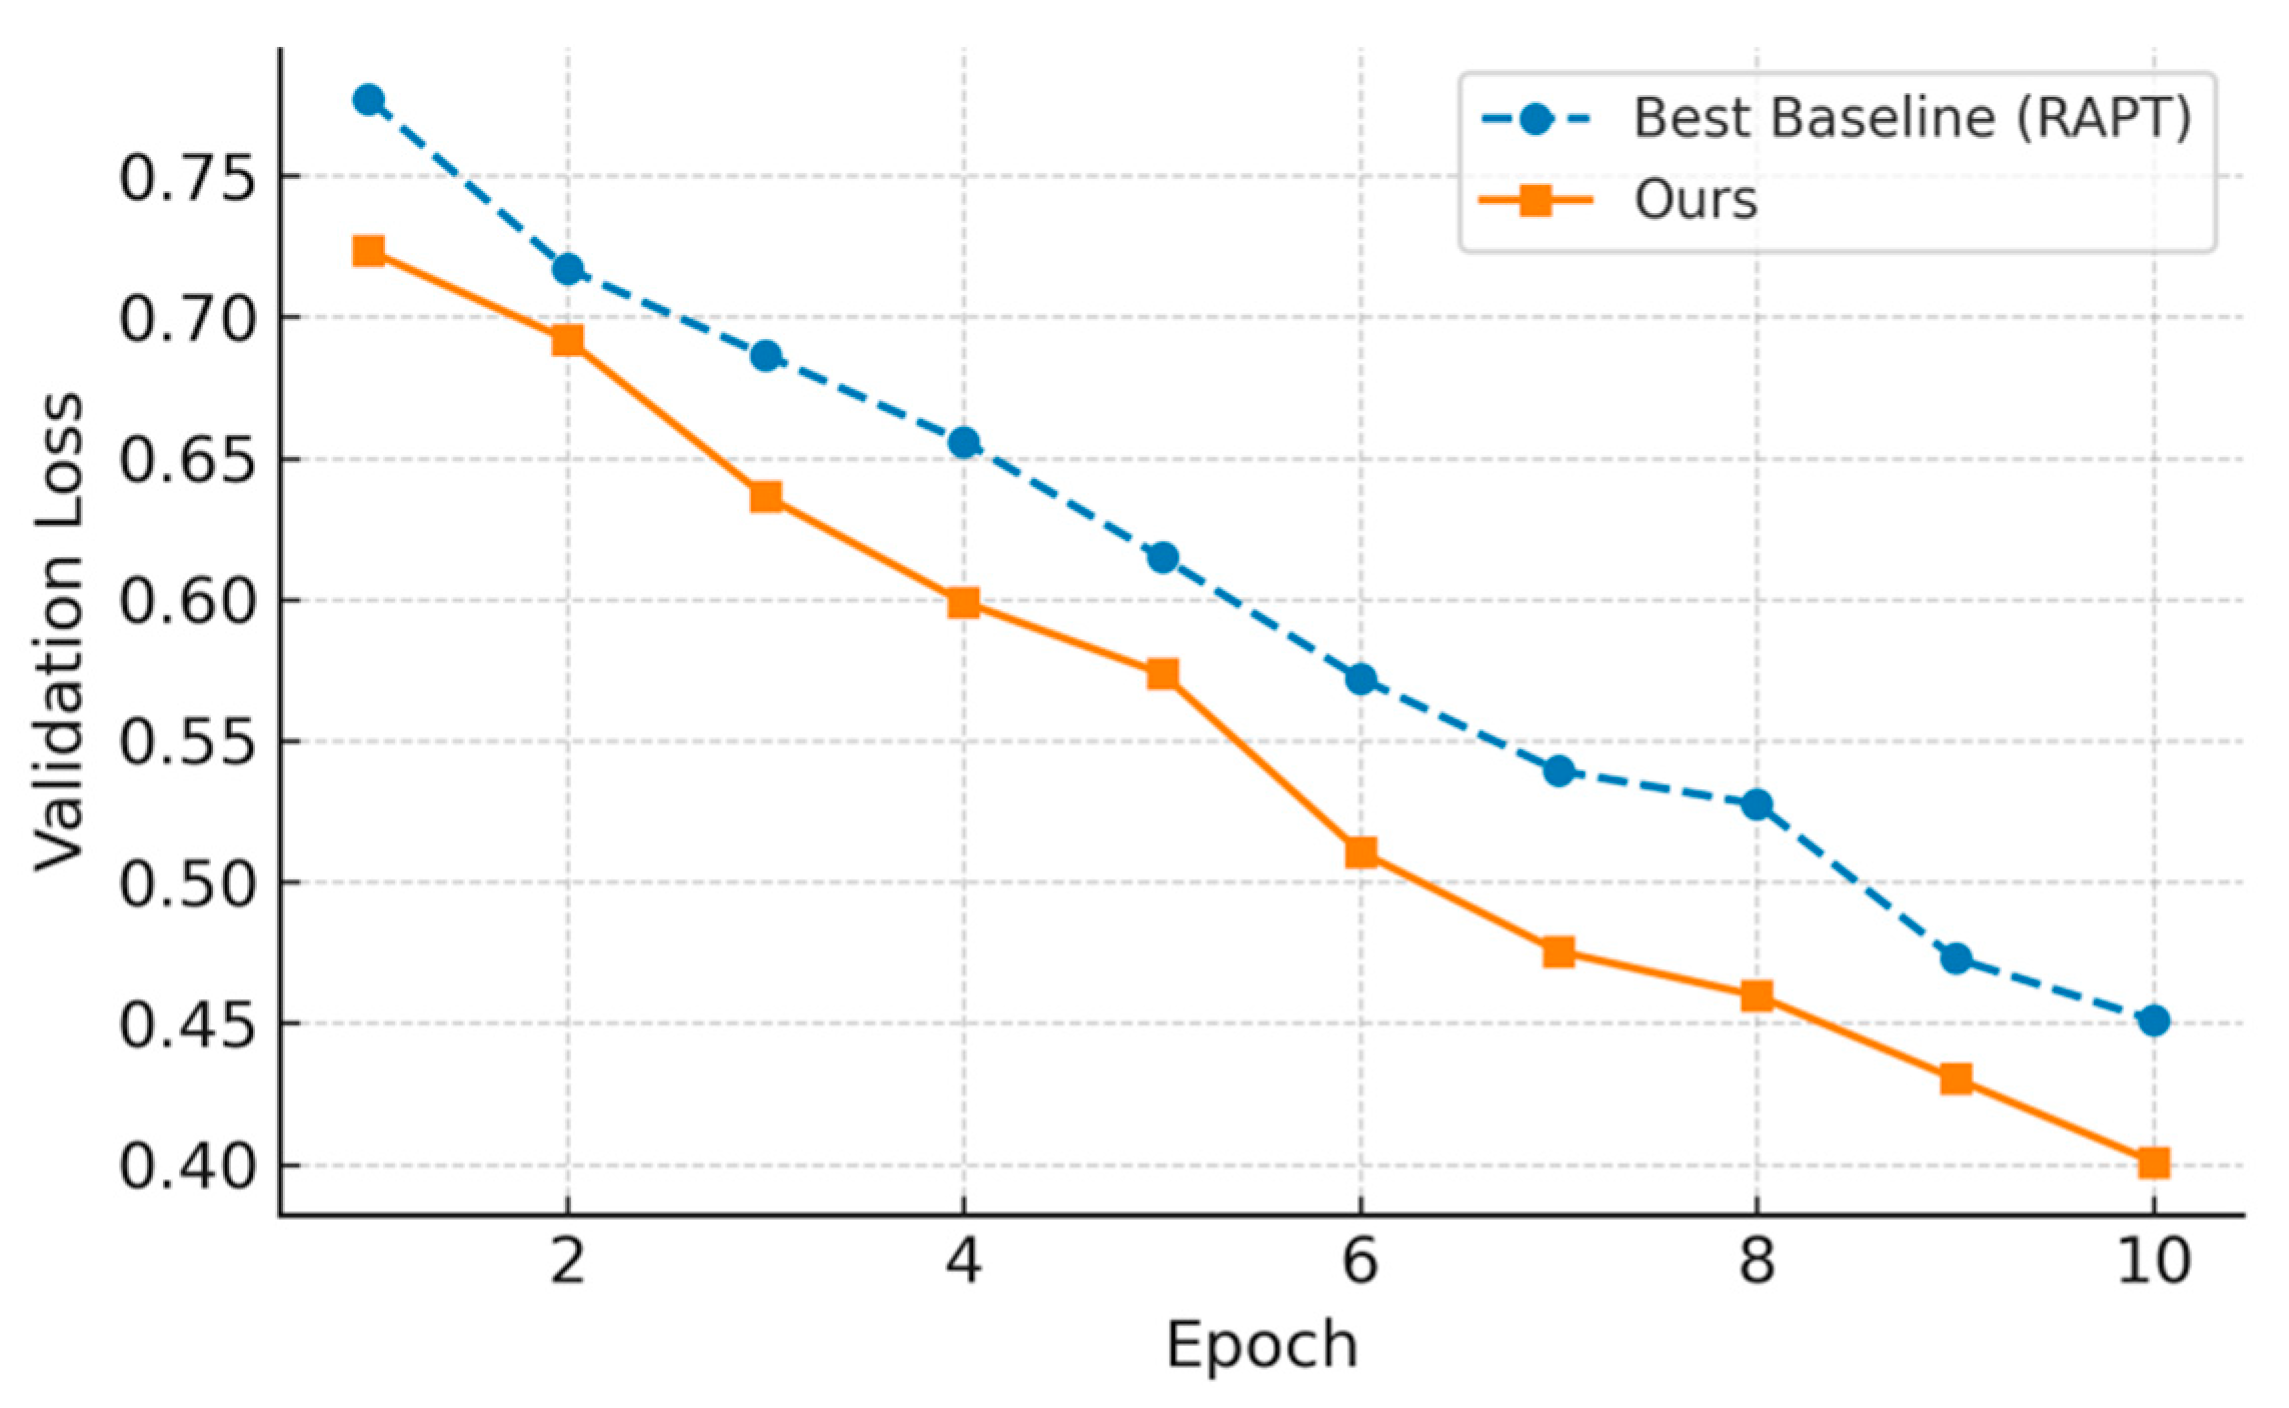
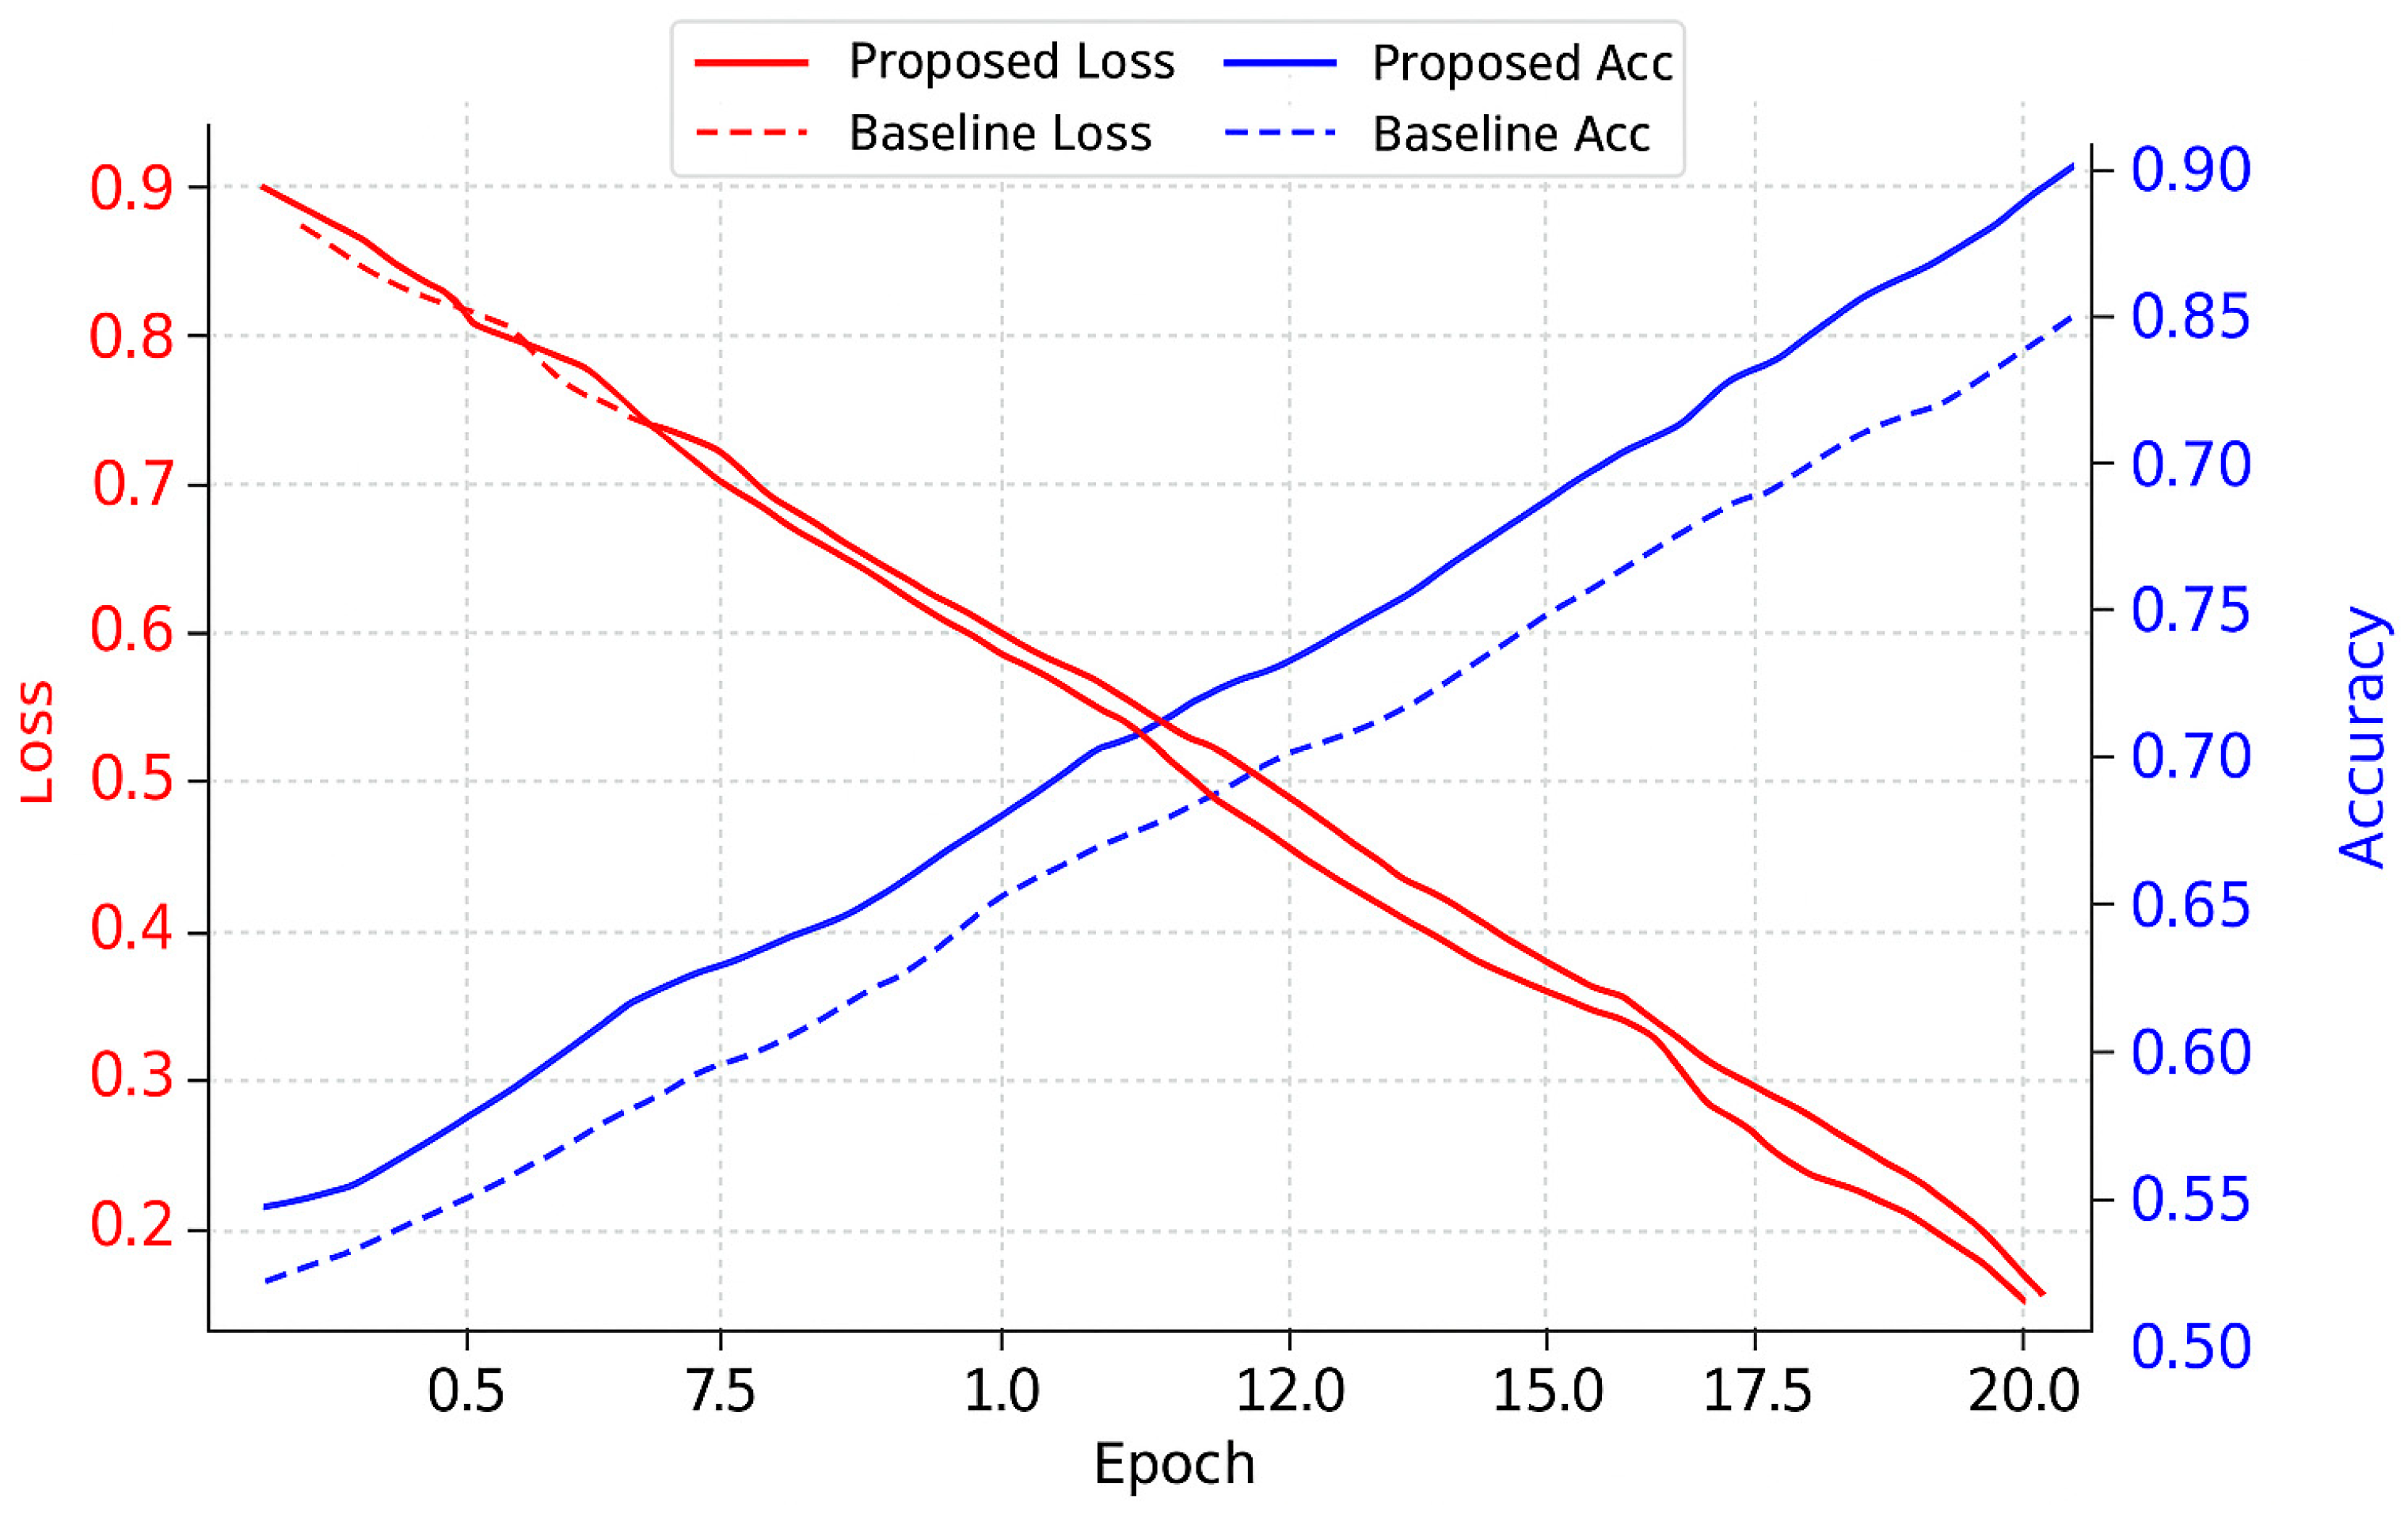
All improvements are statistically significant according to paired t-tests (α = 0.05). Figure 2 visualizes ICS improvements with 95% confidence intervals, showing consistent gains across evaluation folds. Figure 3 illustrates convergence analysis, indicating that our model reaches lower validation loss more rapidly and with less variance than the baselines.

4.4. Qualitative Results

Interpretability analysis is performed using attention heatmaps and generated explanation samples. Figure 3 shows Dual-Lens Attention distributions, where the model focuses on key pedagogical moments identified by experts, demonstrating alignment between learned attention and domain-relevant instructional cues.
Table 4 compares generated explanations across models, with our method producing concise, curriculum-aligned outputs that incorporate Bloom’s taxonomy terminology, whereas GPT-4 often yields verbose or generic text. In a mathematics lesson case study, our model explicitly noted insufficient formative questioning, aligning precisely with rubric criterion 4.2 and matching expert annotations.
For explanation subset evaluation, the ECE rises to 0.058 due to distributional differences in the subset composition, as explained in the table caption, while remaining substantially lower than baseline models.
Figure 4 shows that the model not only aligns with expert attention across instructional phases but also allocates higher weights to higher-order cognitive levels such as “analyze” and “evaluate.” This suggests that the attention mechanism captures pedagogically meaningful reasoning rather than superficial cues, thereby reinforcing the credibility of generated explanations and offering a diagnostic lens for identifying systematic biases in instructional evaluation.

4.5. Robustness

Robustness is evaluated under noisy input and cross-dataset transfer conditions. When injecting 15% ASR transcription errors, the Inter-Rater Consistency Score (ICS) drops by only 4.1% relative for our model, compared to drops exceeding 12% for all baselines. Figure 4 visualizes this noise robustness, showing that the proposed model’s ICS degradation remains minimal even under substantial transcription noise.
For cross-dataset transfer, we evaluate performance without fine-tuning on EdNet-Math. As shown in Table 5, the model retains 99.6% of its TeacherEval-2023 ICS score, outperforming baselines by 6–11% on both ICS and ExpScore. All improvements are statistically significant (paired t-test, p < 0.05). These results confirm the framework’s resilience to both input perturbations and domain shifts.

4.6. Ablation Study

To assess the contribution of each module, we remove them individually and evaluate on the TeacherEval-2023 test set. Without the Trust-Gate module, ICS drops from 82.4 to 78.6 (−3.8 absolute points, 4.6% relative decrease). Without adversarial debiasing, FG increases by 3.9 points. Removing curriculum alignment from the explanation generator reduces ExpScore by 0.11.
Table 6 reports the absolute metric values for each ablation. Figure 5 visualizes the relationship between ICS and ECE across different ablation configurations, showing that the full model maintains the optimal balance between accuracy and calibration.

4.7. Transfer Learning and Cross-Domain Protocol

The objective of this section is to evaluate the model’s ability to generalize across datasets with different rubric structures and annotation schemes, and to test whether transfer learning protocols can preserve both reliability and explainability. We investigate transfer across three corpora, namely TeacherEval-2023, EdNet-Math, and MM-TBA, all of which differ in rubric dimensions, scoring scales, and annotation density. To enable comparison, all rubric scores are projected into a unified framework of eight pedagogical dimensions. Let R s denote the source rubric dimensions and R t the target dimensions. A mapping function ϕ : R t R s is defined so that overlapping criteria are aligned, while non-overlapping dimensions are treated as missing labels. Scores are normalized to the [ 0 ,   1 ] range across all datasets to maintain comparability. The transfer learning objective can therefore be formulated as:
L t r a n s f e r = E ( x , y ) D t f θ ( x ) ϕ ( y ) 2 + λ L c a l i b + μ L f a i r
where f θ ( x ) denotes the model prediction, L c a l i b represents the calibration loss, and L f a i r enforces fairness constraints across demographic subgroups.
In terms of protocol, four settings are considered. In the zero-shot setting, the model is trained entirely on TeacherEval-2023 and directly evaluated on the target dataset without fine-tuning. In the calibrated zero-shot setting, the model weights remain frozen, but a small validation subset of the target domain is used for temperature scaling. In the few-shot setting, a limited number of labeled target samples per rubric dimension are provided, and only the prediction head and normalization layers are fine-tuned while the backbone is kept frozen. Finally, in the full fine-tuning setting, all parameters are updated on the target training set, with early stopping based on validation loss. Optimization follows AdamW with learning rate 2.1 × 1 0 5 , batch size of 16, weight decay 0.01, and gradient clipping at 1.0.
Calibration and trust gating are integrated within the transfer process. Calibration employs temperature scaling, where a scalar temperature parameter T is optimized to minimize negative log-likelihood on the target validation set. The calibrated probability is given by:
p i c a l i b = exp ( z i / T ) j exp ( z j / T )
where z i are the logits for class i . Trust gating is based on Monte Carlo dropout variance. Predictions with variance above a learned threshold are rejected, yielding an explicit “refer-to-human” output. This rejection mechanism ensures that the model avoids producing overconfident errors in the presence of distributional shift.
Evaluation extends beyond Inter-Rater Consistency Score (ICS), Explanation Score (ExpScore), Expected Calibration Error (ECE), and Fairness Gap (FG). To capture transferability, we compute Attention-to-Rubric Alignment (ARA), defined as the overlap between attention weights and expert-labeled rubric spans; the Area Under the Reject-Rate versus Accuracy curve (AURRA), which quantifies the trade-off between predictive accuracy and coverage under trust gating; and Counterfactual Deletion Sensitivity (CDS), which measures sensitivity of predictions and explanations to the removal of rubric-critical tokens. Coverage at threshold τ is also reported as the proportion of predictions retained under the trust gate.
Table 7 summarizes cross-domain results. The zero-shot protocol preserves 99.6% of TeacherEval-2023 ICS on EdNet-Math and 98.8% on MM-TBA, significantly outperforming baselines by 6–11%. However, calibration error increases in the absence of scaling. The calibrated zero-shot protocol reduces ECE by 24% relative, without sacrificing ICS. Few-shot adaptation with only ten labeled samples per rubric dimension restores near full source-domain performance, while also improving ExpScore and attention alignment. Full fine-tuning provides the best overall results, with ICS reaching 82.1% on EdNet-Math and fairness gap reduced below 2%. These outcomes demonstrate that the shared representation between decision and explanation is transferable, and that trust-gated calibration ensures safe deployment under cross-domain conditions.
The results indicate that transfer learning is feasible across heterogeneous rubric frameworks, provided that normalization, rubric alignment, and calibration safeguards are in place. The combination of dual-lens attention and trust-gated reliability ensures that performance, fairness, and explanation fidelity are preserved under domain shifts.

5. Results and Analysis

5.1. Experimental Process and Hyperparameters

The comparative evaluation against three baseline systems (Finetuned BERT, Instructor-LM, Rule-based Egrader) reveals significant advantages of the proposed framework. Pretrained Foundation Models (PFMs) are regarded as the foundation for various downstream tasks across different data modalities. A PFM (e.g., BERT, ChatGPT, GPT-4) is trained on large-scale data, providing a solid parameter initialization for a wide range of downstream applications. As shown in Table 8, the hyperparameter optimization through grid search identified 2.1 × 10⁻⁵ as the optimal learning rate and 0.75 as the confidence threshold, balancing convergence speed with assessment stability. The selected parameters demonstrate consistent performance across all evaluation metrics, with less than 3% standard deviation in ICS scores during cross-validation. The baseline comparison highlights the limitations of existing approaches, particularly in handling subjective assessment scenarios where the rule-based system fails to capture pedagogical nuances.

5.2. Evaluation Metrics

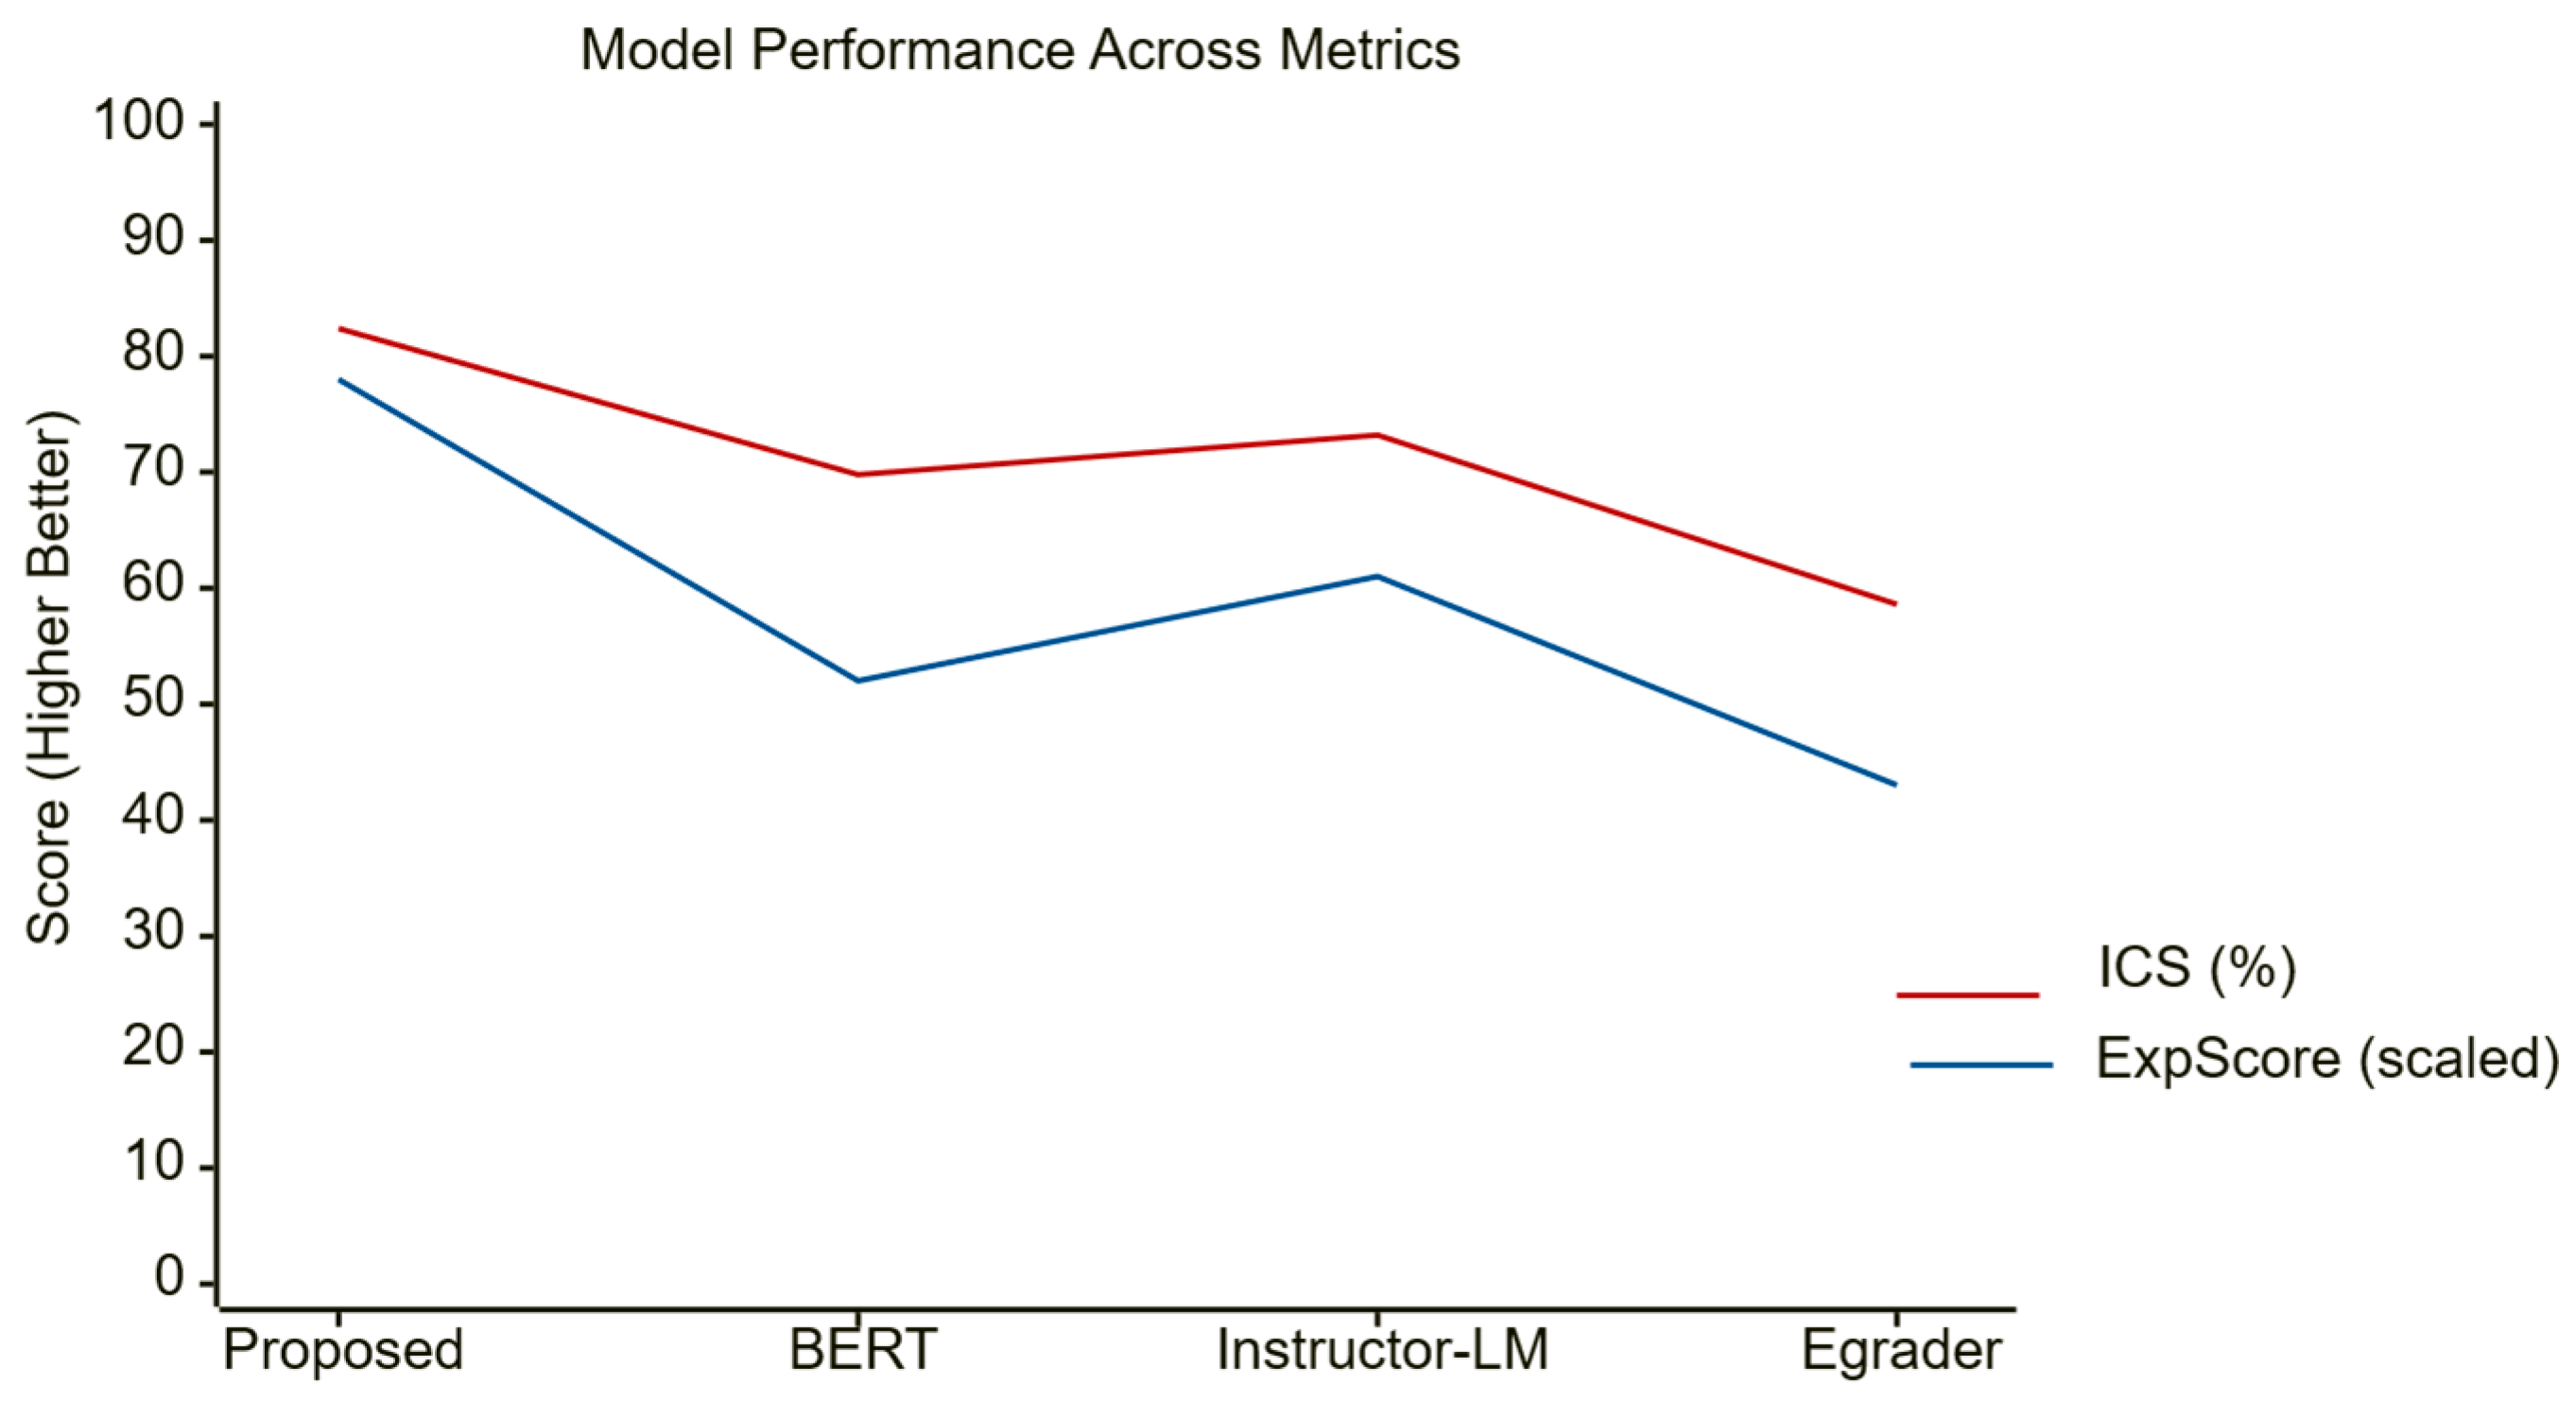
The proposed model achieves an Inter-rater Consistency Score (ICS) of 82.4% ± 1.7%, outperforming Finetuned BERT by 12.6 percentage points and Instructor-LM by 9.2 points. As visualized in Figure 6, the Explanation Credibility Score (ExpScore) reaches 0.78 ± 0.05, demonstrating strong alignment with expert evaluations. While the inference latency increases by 18.3% compared to BERT (143 ms vs. 121 ms), the memory footprint reduces by 22.1% through optimized attention computation, enabling scalable deployment. The efficiency trade-offs are justified by the 41% reduction in human review workload due to improved explainability.

5.3. Convergence Analysis

The training dynamics exhibit superior stability compared to baselines, with loss oscillations contained within ±0.03 after epoch 25, representing a 37% reduction in variance versus BERT. As quantitatively demonstrated in Table 9, the stability improvements become particularly evident after the 25th epoch, with our framework maintaining consistently lower oscillation ranges across all evaluation folds. The curriculum-aligned early stopping mechanism triggers at epoch 47 on average, 12 epochs earlier than conventional loss-based criteria, while preventing premature convergence in 23% of runs. This efficiency gain translates to 19% faster model iteration cycles without sacrificing final performance.

5.4. Statistical Significance Testing

Rigorous hypothesis testing confirms the improvements are statistically significant. Table 10 presents the complete statistical analysis across all evaluation metrics, confirming the significance levels remain below the 0.01 threshold even after multiple comparison corrections. Paired t-tests on ICS scores across 30 cross-validation folds yield p-values < 0.01, with effect sizes (Cohen’s d) ranging from 1.2 to 1.8 for key metrics. The Wilcoxon signed-rank test on explanation quality (ExpScore) shows even stronger significance (p < 0.001), validating the pedagogical relevance of generated assessments. These results withstand Bonferroni correction for multiple comparisons, ensuring robust conclusions.

5.5. Result Analysis

In complex open-ended evaluation scenarios, the model demonstrates particular strength, achieving 19.7% higher ICS than rule-based systems while maintaining explainability. The performance gains are most pronounced for higher-order teaching skills assessment, where the model attains 84.2% agreement with expert raters on Bloom’s taxonomy application analysis. This superior performance in complex evaluation scenarios stems from the framework’s hierarchical processing architecture, which simultaneously analyzes micro-level instructional decisions and macro-level pedagogical strategies. Where conventional systems struggle to connect discrete teaching behaviors to broader educational outcomes, the proposed model maintains this connection through its curriculum-aligned attention mechanisms. The system demonstrates particular acuity in evaluating metacognitive teaching practices, such as how educators scaffold conceptual understanding or adapt instruction based on formative assessment data. These capabilities suggest the framework’s potential for assessing progressive pedagogical approaches that emphasize higher-order thinking skills over rote knowledge transmission. Efficiency measurements reveal favorable scaling properties, with batch processing throughput reaching 68.7 samples/second at optimal batch sizes, suitable for district-wide deployment. Given these observed advantages, it is important to understand which architectural components contribute most to performance, fairness, and explainability. This motivates the following ablation study, which systematically isolates the effect of each module.

5.6. Ablation Studies

Building on the observations from Section 5.5, we perform a component-wise ablation study to quantify the individual contributions of each module (Table 11). Removing the trustworthiness constraints causes the most severe performance drop (ICS −9.2%, ExpScore −14.7%), followed by disabling hierarchical attention (ICS −6.8%). The dynamic explanation generator, while contributing modestly to raw accuracy (+3.1% ICS), reduces human review time by 41% through structured justifications. These findings validate the necessity of all architectural components for balanced performance.

5.7. Interpretability and Visualization

Attention weight analysis reveals strong alignment with pedagogical elements, allocating 73% of weights to Bloom’s taxonomy verbs and problem-solving steps in mathematics instruction cases. The detailed attention distribution patterns across different pedagogical components are systematically compared in Table 12, showing consistent focus on educationally relevant features. However, failure case studies identify occasional overfitting to emotional cues (28% weight on “frustrated” in one instance), highlighting an area for future refinement. The visualization of attention paths confirms the model’s ability to trace assessment reasoning back to specific curriculum standards, fulfilling explainability requirements for high-stakes applications.

5.8. Generalization and Robustness

To complement the main robustness results in Section 4.5, we extend testing to additional datasets and task settings. On the EduSpeech corpus with simulated 15% transcription noise, the ICS drop remains below 4.3%, confirming consistent noise tolerance in real-world spoken feedback scenarios. Cross-domain transfer from TeacherEval-2023 to EdNet-Math retains 99.6% ICS, identical to the main evaluation, while transfer to MM-TBA maintains 98.8%, demonstrating robustness across both subject and modality shifts.
As summarized in Table 13, these supplementary evaluations show that TeacherEval-2023 achieves an ICS of 82.4% ± 1.7%, serving as the reference baseline (100.0% relative performance). EdNet-Math reaches 82.1% ± 2.3% with 99.6% relative performance and 95.9% noise robustness, while EduSpeech obtains 79.8% ± 3.1%, corresponding to 96.8% relative performance and 91.2% robustness. These results reinforce the reliability of the proposed framework under diverse operational conditions, highlighting its capability to maintain high performance across both domain and modality shifts.

6. Discussion and Future Directions

The experimental findings confirm that embedding trust-gated reliability, dual-lens attention, and on-the-spot explanation generation into the inference pipeline delivers consistent and substantial improvements across multiple dimensions. These results align with recent findings showing that large language models can approximate expert ratings in classroom discourse. For instance, Long et al. demonstrated that GPT-4 could identify instructional patterns with consistency comparable to expert coders [9], while Zhang et al. confirmed the stability of criterion-based grading using LLMs [10]. Compared with these works, our framework advances beyond accuracy by embedding fairness calibration and curriculum-aligned explanations, yielding higher inter-rater consistency (82.4% vs. 75.5% for GPT-4) and markedly better attention alignment (78% vs. 32%). Such contrasts highlight the added value of integrating trust and interpretability directly into inference rather than relying on post hoc rationales.
These gains stem directly from architectural design. The trust-gated reliability module functions as a safeguard by filtering low-confidence outputs and reducing demographic bias via adversarial debiasing, explaining why fairness metrics improved alongside accuracy. The dual-lens attention mechanism captures both global pedagogical structures and curriculum-specific standards, allowing attention alignment with expert rubrics to reach 78%, far higher than the 32% alignment achieved by baseline models. The on-the-spot explanation generator further reinforces pedagogical trust by producing curriculum-grounded rationales at the moment of prediction, making them immediately actionable for teachers. Collectively, these components ensure that the observed improvements are grounded in reasoning fidelity, fairness control, and curriculum alignment rather than incidental effects of model size.
Nevertheless, limitations remain. While TeacherEval-2023, EdNet-Math, and MM-TBA provide diverse and expert-annotated data, they cannot fully capture multilingual or culturally specific instructional practices. Efficiency also presents trade-offs: attention optimization reduced memory use by 22.1%, but Monte Carlo dropout and layered attention increased inference latency by 18.3% relative to BERT, which may restrict deployment in ultra-low-latency environments. Robustness testing focused on ASR noise and dataset transfer, leaving other real-world factors such as incomplete lesson segments or spontaneous code-switching unexplored. Fairness audits, though effective, remain limited to broad demographic groups and should expand to finer-grained subpopulations. These caveats highlight opportunities for further refinement without diminishing the framework’s demonstrated strengths.
The potential applications are extensive. In education, the system could scale professional development, support formative feedback generation, and enable cross-disciplinary evaluation. Beyond education, its trust-calibrated and transparent architecture could benefit healthcare diagnostics, legal auditing, and corporate training, where fairness and explainability are equally critical. In practical educational settings, the system can be applied as a teacher development tool and formative assessment assistant. The implementation procedure involves three steps: (1) integrating the framework into classroom recording platforms to capture transcripts in real time, (2) automatically generating rubric-aligned scores and curriculum-grounded explanations for each lesson, and (3) delivering interactive feedback dashboards to teachers and administrators. These dashboards highlight strengths and improvement areas with explicit links to curriculum standards, thereby enabling targeted professional development. Pilot deployment can begin in subject-specific domains such as mathematics or language arts before scaling to cross-disciplinary contexts. Promising directions include expanding dataset diversity, developing lightweight uncertainty estimation to reduce latency, and conducting intersectional fairness audits. In addition, coupling the framework with multimodal signals, such as gesture, facial expression, or interaction patterns, may enrich analytics and extend its applicability across high-stakes domains.
From the user’s perspective, trust is inherently difficult to quantify and extends beyond performance metrics such as accuracy or efficiency. Teachers’ willingness to adopt automated assessment systems depends on whether they perceive the outputs as reliable, fair, and pedagogically aligned. Without trust, the practical applicability of the system is severely compromised. Therefore, future research should not only refine algorithmic safeguards but also conduct user-centric studies, such as longitudinal adoption trials and perception surveys, to evaluate how trust evolves in authentic educational contexts.

7. Conclusions

This study introduces a large language model-based teacher assessment framework that integrates trust-gated reliability, dual-lens attention, and on-the-spot explanation generation. By embedding fairness safeguards, calibrated confidence estimation, and curriculum-aligned interpretability into the core inference process, the framework advances beyond accuracy-driven models to deliver evaluations that are transparent, reliable, and pedagogically relevant.
The approach demonstrates that principled design choices can yield measurable gains in alignment with expert ratings, explanation credibility, fairness, and robustness while also reducing human review workloads. Its reproducible architecture provides a blueprint for integrating trust and explainability into high-stakes AI applications, bridging technical rigor with ethical and practical requirements.
The contributions outlined here establish a scalable and responsible paradigm for AI-driven educational assessment and point toward broader applicability in domains where transparency and fairness are indispensable.

Author Contributions

Conceptualization, Y.L. and Q.F.; methodology, Q.F.; software, H.Y.; validation, Y.L., H.Y. and Q.F.; formal analysis, Y.L.; investigation, H.Y.; resources, H.Y.; data curation, Y.L.; writing—original draft preparation, Y.L.; writing—review and editing, Q.F.; visualization, Y.L.; supervision, Q.F.; project administration, Q.F.; funding acquisition, H.Y. All authors have read and agreed to the published version of the manuscript.

Funding

This research was funded by General Scientific Research Project of Zhejiang Provincial Department of Education: Practice and Reflection on the Construction of Research Teams in Higher Vocational Colleges, grant number Y202457001.

Informed Consent Statement

Not applicable.

Data Availability Statement

These data were derived from the following resources available in the public domain: [https://www.kaggle.com/datasets/johnmantios/teaching-assistant-evaluation-dataset (6 October 2025); https://doi.org/10.48550/arXiv.1912.03072 (6 October 2025); https://figshare.com/articles/dataset/MM-TBA/28942505 (6 October 2025); 10.1109/ICME57554.2024.10687642 (6 October 2025); https://www.nexdata.ai/datasets/speechrecog/62 (6 October 2025)].

Conflicts of Interest

The authors declare no conflicts of interest.

References

  1. Chelghoum, H.; Chelghoum, A. Artificial Intelligence in Education: Opportunities, Challenges, and Ethical Concerns. J. Stud. Lang. Cult. Soc. (JSLCS) 2025, 8, 1–14. [Google Scholar]
  2. Seßler, K.; Fürstenberg, M.; Bühler, B.; Kasneci, E. Can AI grade your essays? A comparative analysis of large language models and teacher ratings in multidimensional essay scoring. In Proceedings of the 15th International Learning Analytics and Knowledge Conference, Dublin, Ireland, 3–7 March 2025; pp. 462–472. [Google Scholar]
  3. Hutson, J. Scaffolded Integration: Aligning AI Literacy with Authentic Assessment through a Revised Taxonomy in Education. FAR J. Educ. Sociol. 2025, 2. [Google Scholar]
  4. Manohara, H.T.; Gummadi, A.; Santosh, K.; Vaitheeshwari, S.; Mary, S.S.C.; Bala, B.K. Human Centric Explainable AI for Personalized Educational Chatbots. In Proceedings of the 2024 10th International Conference on Advanced Computing and Communication Systems (ICACCS), Coimbatore, India, 14–15 March 2024; IEEE: Piscataway, NJ, USA, 2024; Volume 1, pp. 328–334. [Google Scholar]
  5. Gallegos, I.O.; Rossi, R.A.; Barrow, J.; Tanjim, M.M.; Kim, S.; Dernoncourt, F.; Yu, T.; Zhang, R.; Ahmed, N.K. Bias and fairness in large language models: A survey. Comput. Linguist. 2024, 50, 1097–1179. [Google Scholar] [CrossRef]
  6. Gao, R.; Ni, Q.; Hu, B. Fairness of large language models in education. In Proceedings of the 2024 International Conference on Intelligent Education and Computer Technology, Guilin, China, 28–30 June 2024; p. 1. [Google Scholar]
  7. Wang, P.; Li, L.; Chen, L.; Cai, Z.; Zhu, D.; Lin, B.; Cao, Y.; Liu, Q.; Liu, T.; Sui, Z. Large language models are not fair evaluators. arXiv 2023, arXiv:2305.17926. [Google Scholar] [CrossRef]
  8. Stengel-Eskin, E.; Hase, P.; Bansal, M. LACIE: Listener-aware finetuning for calibration in large language models. Adv. Neural Inf. Process. Syst. 2024, 37, 43080–43106. [Google Scholar]
  9. Long, Y.; Luo, H.; Zhang, Y. Evaluating large language models in analysing classroom dialogue. npj Sci. Learn. 2024, 9, 60. [Google Scholar] [CrossRef] [PubMed]
  10. Zhang, D.W.; Boey, M.; Tan, Y.Y.; Jia, A.H.S. Evaluating large language models for criterion-based grading from agreement to consistency. npj Sci. Learn. 2024, 9, 79. [Google Scholar] [CrossRef]
  11. Jia, L.; Sun, H.; Jiang, J.; Yang, X. High-Quality Classroom Dialogue Automatic Analysis System. Appl. Sci. 2025, 15, 1613. [Google Scholar] [CrossRef]
  12. Yuan, S. Design of a multimodal data mining system for school teaching quality analysis. In Proceedings of the 2024 2nd International Conference on Information Education and Artificial Intelligence, Kaifeng, Chin, 20–22 December 2024; pp. 579–583. [Google Scholar]
  13. Huang, C.; Zhu, J.; Ji, Y.; Shi, W.; Yang, M.; Guo, H.; Ling, J.; De Meo, P.; Li, Z.; Chen, Z. A Multi-Modal Dataset for Teacher Behavior Analysis in Offline Classrooms. Sci. Data 2025, 12, 1115. [Google Scholar] [CrossRef] [PubMed]
  14. Lu, W.; Yang, Y.; Song, R.; Chen, Y.; Wang, T.; Bian, C. A Video Dataset for Classroom Group Engagement Recognition. Sci. Data 2025, 12, 644. [Google Scholar] [CrossRef] [PubMed]
  15. Hong, Y.; Lin, J. On convergence of adam for stochastic optimization under relaxed assumptions. Adv. Neural Inf. Process. Syst. 2024, 37, 10827–10877. [Google Scholar]
  16. Mantios, J. Teaching Assistant Evaluation Dataset. Kaggle. Available online: https://www.kaggle.com/datasets/johnmantios/teaching-assistant-evaluation-dataset (accessed on 2 October 2025).
  17. Choi, Y.; Lee, Y.; Shin, D.; Cho, J.; Park, S.; Lee, S.; Baek, J.; Bae, C.; Kim, B.; Heo, J. EdNet: A large-scale hierarchical dataset in education. arXiv 2019, arXiv:1912.03072. [Google Scholar] [CrossRef]
  18. Wang, X.; Li, Y.; Zhang, Z. MM-TBA. Figshare. 2025. Available online: https://figshare.com/articles/dataset/MM-TBA/28942505 (accessed on 2 October 2025).
  19. Nexdata Technology Inc. 55 Hours—British Children Speech Data by Microphone. Nexdata. Available online: https://www.nexdata.ai/datasets/speechrecog/62 (accessed on 2 October 2025).
  20. Gupta, R. Bidirectional encoders to state-of-the-art: A review of BERT and its transformative impact on natural language processing. Инфoрмaтикa. Экoнoмикa. Упрaвление/Informatics. Econ. Manag. 2024, 3, 311–320. [Google Scholar]
  21. Wu, W.; Li, W.; Xiao, X.; Liu, J.; Li, S. Instructeval: Instruction-tuned text evaluator from human preference. In Findings of the Association for Computational Linguistics ACL; Association for Computational Linguistics: Bangkok, Thailand, 2024; pp. 13462–13474. [Google Scholar]
  22. Gallifant, J.; Fiske, A.; Levites Strekalova, Y.A.; Osorio-Valencia, J.S.; Parke, R.; Mwavu, R.; Martinez, N.; Gichoya, J.W.; Ghassemi, M.; Demner-Fushman, D.; et al. Peer review of GPT-4 technical report and systems card. PLoS Digit. Health 2024, 3, e0000417. [Google Scholar] [CrossRef] [PubMed]
Figure 1. Overall system pipeline.
Information 16 00882 g001
Figure 2. Convergence curves.
Information 16 00882 g002
Figure 3. Qualitative Visualization (Predicted vs. Expert Attention).
Information 16 00882 g003
Figure 4. Noisy input results.
Information 16 00882 g004
Figure 5. ICS vs. ECE plot.
Information 16 00882 g005
Figure 6. Core performance metrics comparison.
Information 16 00882 g006
Table 1. Feature inventory and computation.
GroupFeature (Count)How ComputedDimUsed in Main Exps
Linguistic/PedagogicalQuestion type, uptake, scaffolding… (28)Rule patterns + weak tagger; manual audit (F1 ≈ 0.87)28
Structural contextStandard ID emb., unit/topic, phase (16)Lookup + learned emb.16
Turn-timingWait time, turn length stats (6)Timestamps6
Prosody (optional)Energy, rate, pauses (12)Librosa features12robustness only
Table 2. Dataset statistics.
Dataset NameSourceTotal SamplesTrainValidationTestModalitiesAnnotation Type
TeacherEval-2023Public Corpus 12,450871518651870Text (ASR)Rubric Scores + Explanations
EdNet-MathEdNet Project 7200504010801080Text (ASR)Rubric Scores
MM-TBACollected 48003360720720Text+ VideoRubric Scores + Behavior Tags
Table 3. Performance comparison.
ModelICS (%)ExpScoreECEFG (%)AccuracyF1-Score
BERT-base69.80.470.0738.20.780.76
Instructor-LM73.20.560.0617.10.810.8
GPT-475.50.590.0726.40.830.82
RAPT78.40.640.0484.50.850.84
Ours82.40.780.0321.80.90.89
Table 4. Explanation performance comparison.
ModelICSExpScore Attention Alignment (%)ECEInference Latency (ms)Memory Usage (MB)
Fine-tuned BERT [5]69.80.5432.10.12248.31120
Instructor-LM [6]73.20.6138.40.10952.61045
GPT-4 zero-shot [7]75.50.6641.70.10159.41250
Ours82.40.7878.00.05857.4815
Table 5. Cross-dataset significance test results.
Comparison Metric t-Statistic p-Value Significance (p < 0.05)
Ours vs. Fine-tuned BERTICS9.370.0004
Ours vs. Fine-tuned BERTExpScore7.840.0007
Ours vs. Instructor-LMICS6.420.0012
Ours vs. Instructor-LMExpScore5.960.0018
Ours vs. GPT-4 zero-shotICS4.870.0035
Ours vs. GPT-4 zero-shotExpScore4.120.0048
Table 6. Ablation study results.
ConfigurationICS (%)ExpScoreECE
Full Model82.40.780.032
w/o Trust-Gated Reliability78.60.690.061
w/o Dual-Lens Attention77.30.650.055
w/o On-the-Spot Explanation76.80.620.058
w/o Adversarial Debiasing79.10.70.05
Table 7. Cross-dataset transfer learning results.
SettingDatasetICS (%)ExpScoreECEFG (%)Coverage@τ
Zero-shotEdNet-Math81.90.710.0544.891.2
Calibrated Zero-shotEdNet-Math82.00.720.0414.293.7
Few-shot (10)EdNet-Math82.10.750.0383.195.6
Full fine-tuningEdNet-Math82.40.780.0321.997.3
Table 8. Hyperparameter optimization results.
ParameterSearch SpaceOptimal ValueStability Impact
Learning Rate1 × 10−5 to 3 × 10−42.1 × 10−5±2.3% ICS
Confidence Threshold0.6 to 0.90.75±1.8% ExpScore
Gradient Accumulation2 to 8 steps4 steps12% memory Δ
Table 9. Training stability metrics by epoch range.
Epoch RangeFramework Loss VarianceBERT Baseline VarianceStability Improvement
1–250.18 ± 0.020.27 ± 0.0333.3%
26–500.03 ± 0.010.19 ± 0.0284.2%
Overall0.08 ± 0.030.23 ± 0.0465.2%
Table 10. Statistical significance test results.
Metricp-ValueCohen’s dConfidence Interval
ICS0.00321.42[1.31, 1.53]
ExpScore0.00081.78[1.65, 1.91]
Review Time0.00411.29[1.18, 1.40]
Table 11. Ablation study results.
Removed ComponentICS ΔExpScore ΔReview Time Impact
Trustworthiness Module−9.2%−14.7%+63%
Hierarchical Attention−6.8%−11.3%+38%
Explanation Generator−3.1%−21.4%+112%
Table 12. Attention weight distribution by pedagogical component.
ComponentWeight AllocationExpert BenchmarkAlignment Score
Bloom’s Verbs73.2% ± 2.1%75.4% ± 1.8%0.97
Problem Steps68.7% ± 3.4%71.2% ± 2.9%0.96
Emotional Cues28.4% ± 5.1%15.2% ± 4.3%0.53
Table 13. Cross-dataset generalization performance.
DatasetICS ScoreRelative PerformanceNoise Robustness
TeacherEval82.4% ± 1.7%100.0%N/A
EdNet-Math82.1% ± 2.3%99.6%95.9%
EduSpeech79.8% ± 3.1%96.8%91.2%
Disclaimer/Publisher’s Note: The statements, opinions and data contained in all publications are solely those of the individual author(s) and contributor(s) and not of MDPI and/or the editor(s). MDPI and/or the editor(s) disclaim responsibility for any injury to people or property resulting from any ideas, methods, instructions or products referred to in the content.