Article

Radar-Based Invisible Biometric Authentication

by
Maria Louro da Silva
1,*,
Carolina Gouveia
2,3,4,
Daniel Filipe Albuquerque
2,3,5 and
Hugo Plácido da Silva
1,6,7
1
Department of Bioengineering, Instituto Superior Técnico, University of Lisbon, 1049-001 Lisbon, Portugal
2
Institute of Electronics and Informatics Engineering of Aveiro, Department of Electronics, Telecommunications and Informatics, University of Aveiro, 3810-193 Aveiro, Portugal
3
Intelligent Systems Associate Laboratory, 3810-193 Aveiro, Portugal
4
AlmaScience Colab, Madan Parque, 2829-516 Caparica, Portugal
5
ESTGA—Águeda School of Technology and Management, University of Aveiro, 3810-193 Aveiro, Portugal
6
IT—Instituto de Telecomunicações, Instituto Superior Técnico, 1049-001 Lisbon, Portugal
7
LUMLIS—Lisbon Unit for Learning and Intelligent Systems, 1049-001 Lisbon, Portugal
*
Author to whom correspondence should be addressed.
Information 2024, 15(1), 44; https://doi.org/10.3390/info15010044
Submission received: 21 November 2023 / Revised: 7 January 2024 / Accepted: 9 January 2024 / Published: 12 January 2024

Abstract

:
Bio-Radar (BR) systems have shown great promise for biometric applications. Conventional methods can be forged, or fooled. Even alternative methods intrinsic to the user, such as the Electrocardiogram (ECG), present drawbacks as they require contact with the sensor. Therefore, research has turned towards alternative methods, such as the BR. In this work, a BR dataset with 20 subjects exposed to different emotion-eliciting stimuli (happiness, fearfulness, and neutrality) in different dates was explored. The spectral distributions of the BR signal were studied as the biometric template. Furthermore, this study included the analysis of respiratory and cardiac signals separately, as well as their fusion. The main test devised was authentication, where a system seeks to validate an individual’s claimed identity. With this test, it was possible to infer the feasibility of these type of systems, obtaining an Equal Error Rate (EER) of 3.48 % if the training and testing data are from the same day and within the same emotional stimuli. In addition, the time and emotion results dependency is fully analysed. Complementary tests such as sensitivity to the number of users were also performed. Overall, it was possible to achieve an evaluation and consideration of the potential of BR systems for biometrics.

1. Introduction

The term Biometrics is composed of two Greek words: bios, meaning life, and metrikos, meaning to measure [1]. Biometrics is defined as the recognition of a person’s identity based on their behavioural or biological characteristics. Since these cannot be misplaced nor forgotten, representing a tangible component of something that a user is, they are advantageous as a recognition method [2].
Nonetheless, conventional biometric systems are still vulnerable to attacks, the most common ones being spoofing, i.e., when an individual poses as another person, and subsequently gains illegitimate access [3]. Examples include the reproduction of anatomical features, such as the acquisition of facial images [4], or using gummy fingers [5], as well as the replica of behavioural features, such as the reproduction of voices [6] or handwritten signature [7]. Therefore, there is a need to explore other options less vulnerable to eavesdropping (i.e., stealthy trait measurement) or spoofing attacks [8]. Typically, the liveness information can be used as a countermeasure, since it is capable of detecting signs of life [3].
Radar systems are able to measure the chest wall displacement during the cardiopulmonary activity with the use of electromagnetic waves. These systems, henceforth referred to as the Bio-Radar (BR) systems, can not only be used as a diagnosis tool, but also contribute to lifestyle improvement [9]. BR monitoring can be seamlessly integrated into everyday routines; with the ability to map subjects to their identity, this approach could act as a health monitoring system, integrated into the context of “smart homes”. Moreover, these systems can be particularly beneficial in authentication applications, that is, in 1:1 matching.
Some authors have contributed to the field [10,11,12,13,14,15,16,17,18], nevertheless the results are often described in rest conditions, collected in a single session, and with few participants. Ergo, it is difficult to assess the true potential of BR-based biometrics, specifically as most studies fail to address one of the most important questions in biometrics: permanence, i.e., the temporal invariance of the templates. In this paper, we conducted the first study on intra- and inter-subject variability of BR signals on different dates, whilst subjected to different emotions, targeting biometric authentication. Moreover, to the best of the authors’ knowledge, this is the first work that explores a fusion of both BR components (respiratory and cardiac), as well as the individual analysis of each.
A dataset with 20 subjects was used, collected under an emotion inducing protocol with an average duration of 30 min, on different days. The signals extracted were used to perform biometric recognition and verify the ability to accurately authenticate a given subject. In this respect, a Support Vector Machine (SVM) algorithm was applied, using the BR signals (respiratory and cardiac) as well as ECG ones (for benchmarking purposes), acquired simultaneously. Moreover, different emotions were also considered, to understand the impact that neurophysiological changes, such as the emotional state, may have on the signal, and thus on the biometric recognition performance.
In essence, the main contributions to the field are:
  • Study the stability over time, with signal acquisition on sessions separated by days;
  • Understand the impact of emotional states on the system’s performance;
  • Assess the system’s sensitivity to the number of classes (subjects).
The remainder of this paper is organised as follows: Section 2 provides a brief background on biometrics and radar-based biosignal acquisition. Section 3 summarises the main methodologies proposed for ECG and radar-based biometrics. Section 4 explains the dataset used and describes the proposed methodology. Section 5 presents the obtained results, alongside a discussion. Finally, Section 6 summarises the overall conclusions.

2. Background

2.1. Biometrics and the Importance of the Bio-Radar

Biometric recognition can be done using two distinct approaches: authentication and identification. Authentication aims to answer the question “Am I who I claim to be?” whereas Identification answers “Who am I?”. The former’s objective is to verify a person’s claimed identity, and is the main focus of this work, whilst the latter seeks to establish a subject’s identity [2].
Typically, biometric systems are divided into two categories: biological and/or behavioural. Biological biometrics are based on data taken from a direct part of the human body, whereas behavioural characteristics are based on an action taken by a person. Examples of the first include the use of the ears, face, fingerprints, irises, palms, or even physiological signals such as the Electrocardiogram (ECG), whereas the second includes gait, keystroke dynamics, as well as signature and voice recognition. These can be collected through specialised image or video capturing devices, or by contact sensors [2].
Recently, research on biosignal-based approaches has been pursued to address the limitations of conventional biometric systems, as introduced in Section 1, within which the ECG has shown promising results [8]. Its nature makes it hard to capture, and the inherent liveness makes it useful for spoofing purposes [3,8,19]. Moreover, it has been shown to possess high inter-subject variability and low intra-subject variability [8]. Regardless, ECG-based biometrics require contact with the body, which may be unpractical and disruptive to the users. To mitigate these limitations, alternatives have been explored, paving the way towards invisible approaches, which can be integrated on the topic of “smart homes”, where sensors are incorporated into day-to-day objects, allowing data acquisition during the subject’s daily activities [20]. BR systems, due to their unobtrusive nature, are particularly interesting. They send a continuous electromagnetic signal towards a subject; when the subject’s chest moves as a consequence of the cardiorespiratory activity, there is a modulation resulting from the vital signals [18].
The use of such systems can lead to innovative applications. They have shown several employments with examples ranging from the ability to detect signals through barriers such as clothes, as well as insensibility to environment factors, to identifying sudden events, and contributing to lifestyle improvement, through continuous monitoring [9,10,21]. BR systems have proved to be able of being integrated into custom objects to meet market needs. Furthermore, in such applications, these frameworks may be shared among multiple people within the household, and consequently, the ability to match the recorded data to the individual that provided it is a necessary feature. For instance, regarding the topic of “smart homes”, a possible multimodal approach in sanitary installations alongside the ECG [22] may also be pursued. It is also important to take into consideration that, in these circumstances, there is a reduced number of subjects within the household. Furthermore, considering the integration of a BR system in a car seat [23,24], it may allow the personalisation of a car’s settings, or even car-sharing, all of which require the ability to know the driver’s identity [25].

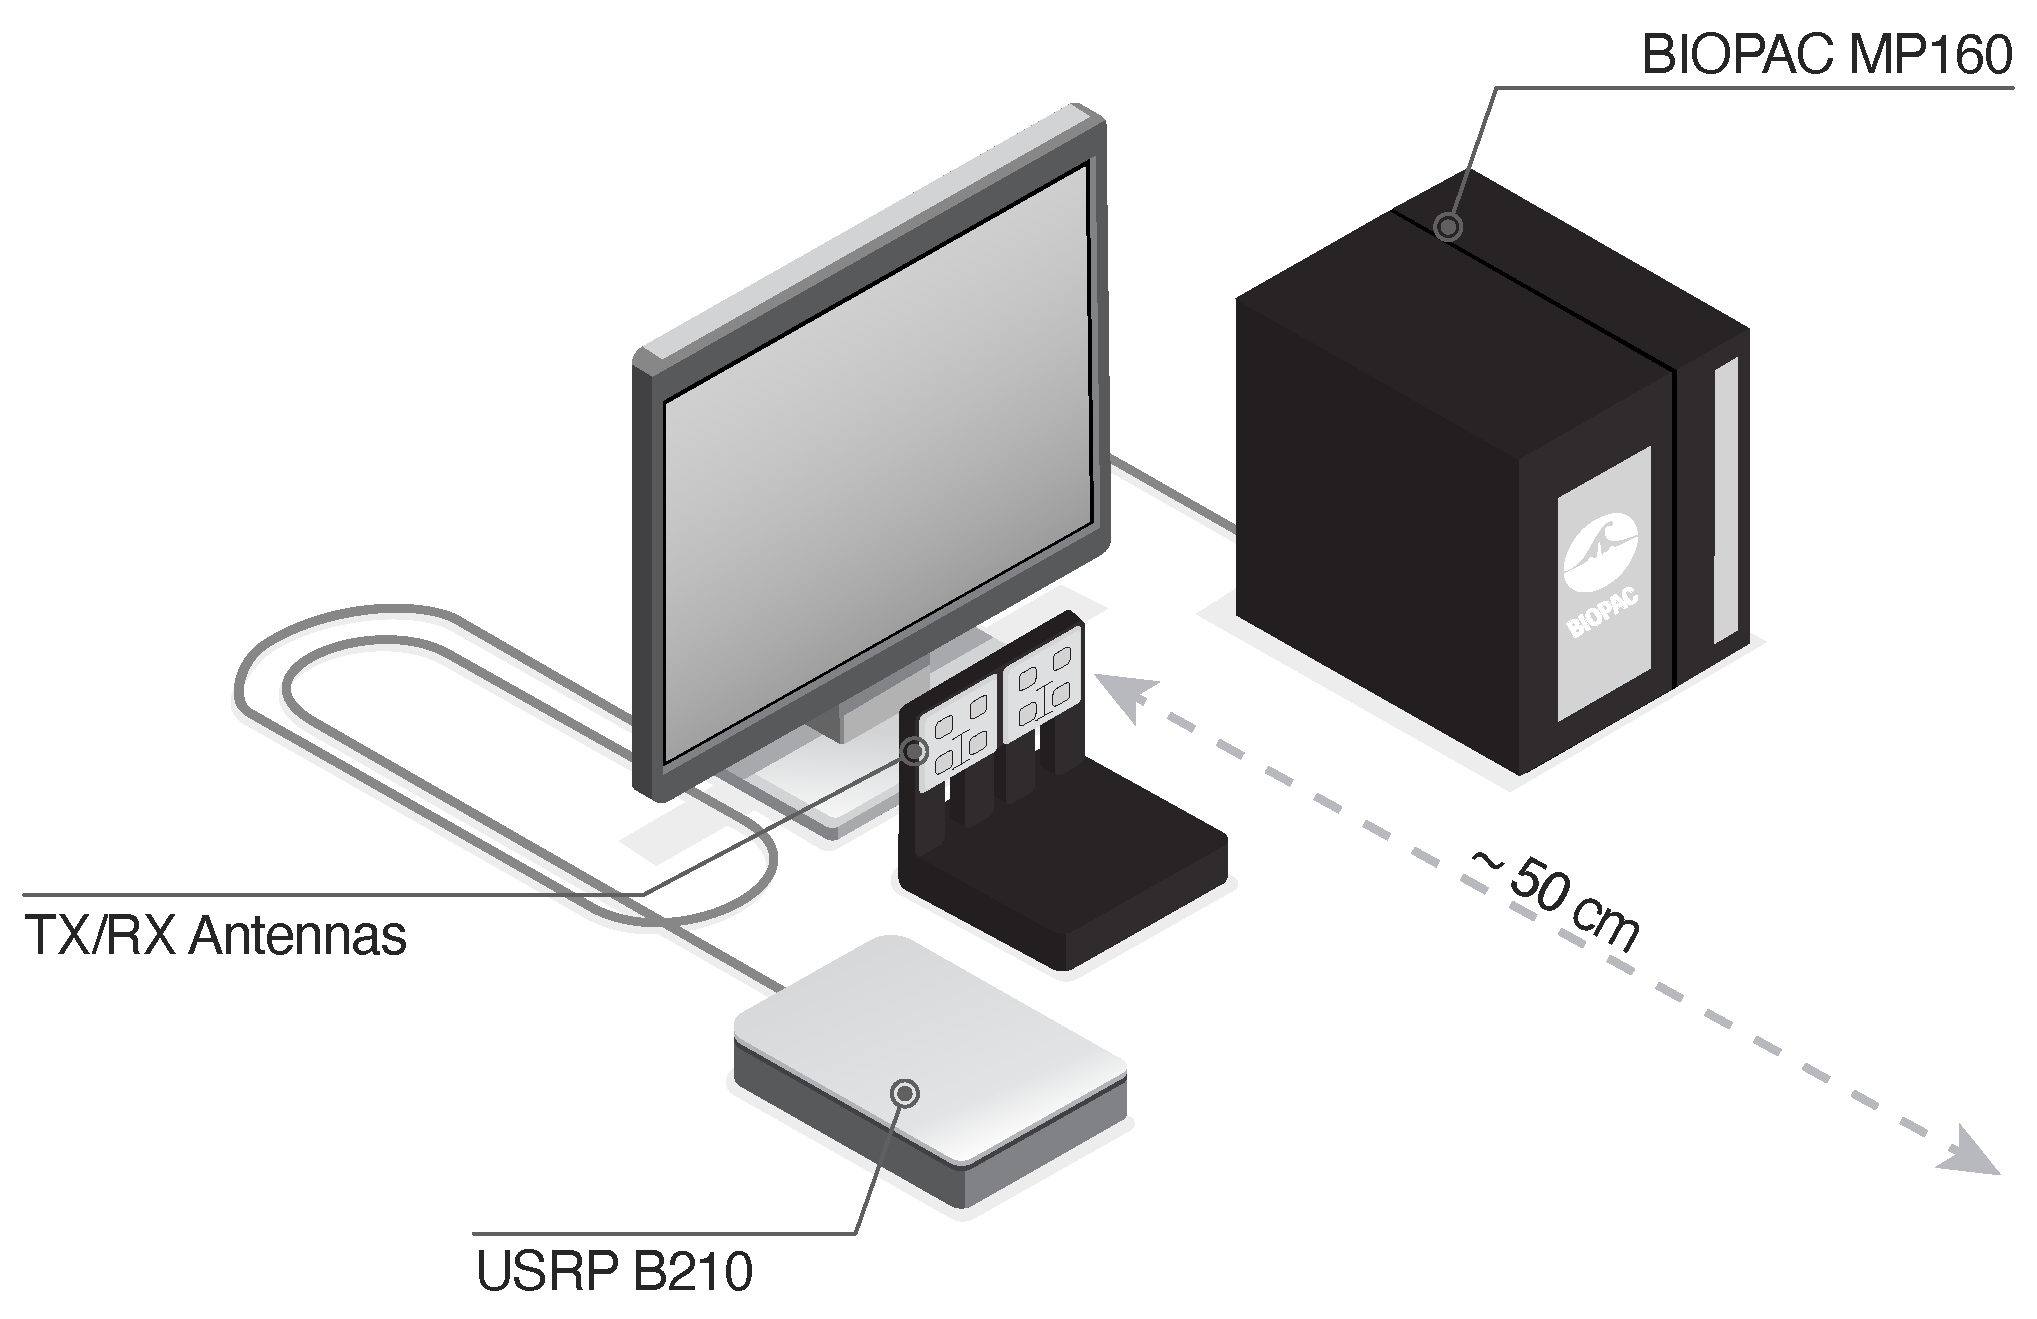
2.2. The Bio-Radar System

Radar stands for “Radio Detection And Ranging”, and it consists of a transmitter, a receiver, an antenna, and signal processing software [9,26]. The BR system uses the principles of radar technology; Figure 1a presents a schema of a general BR system.

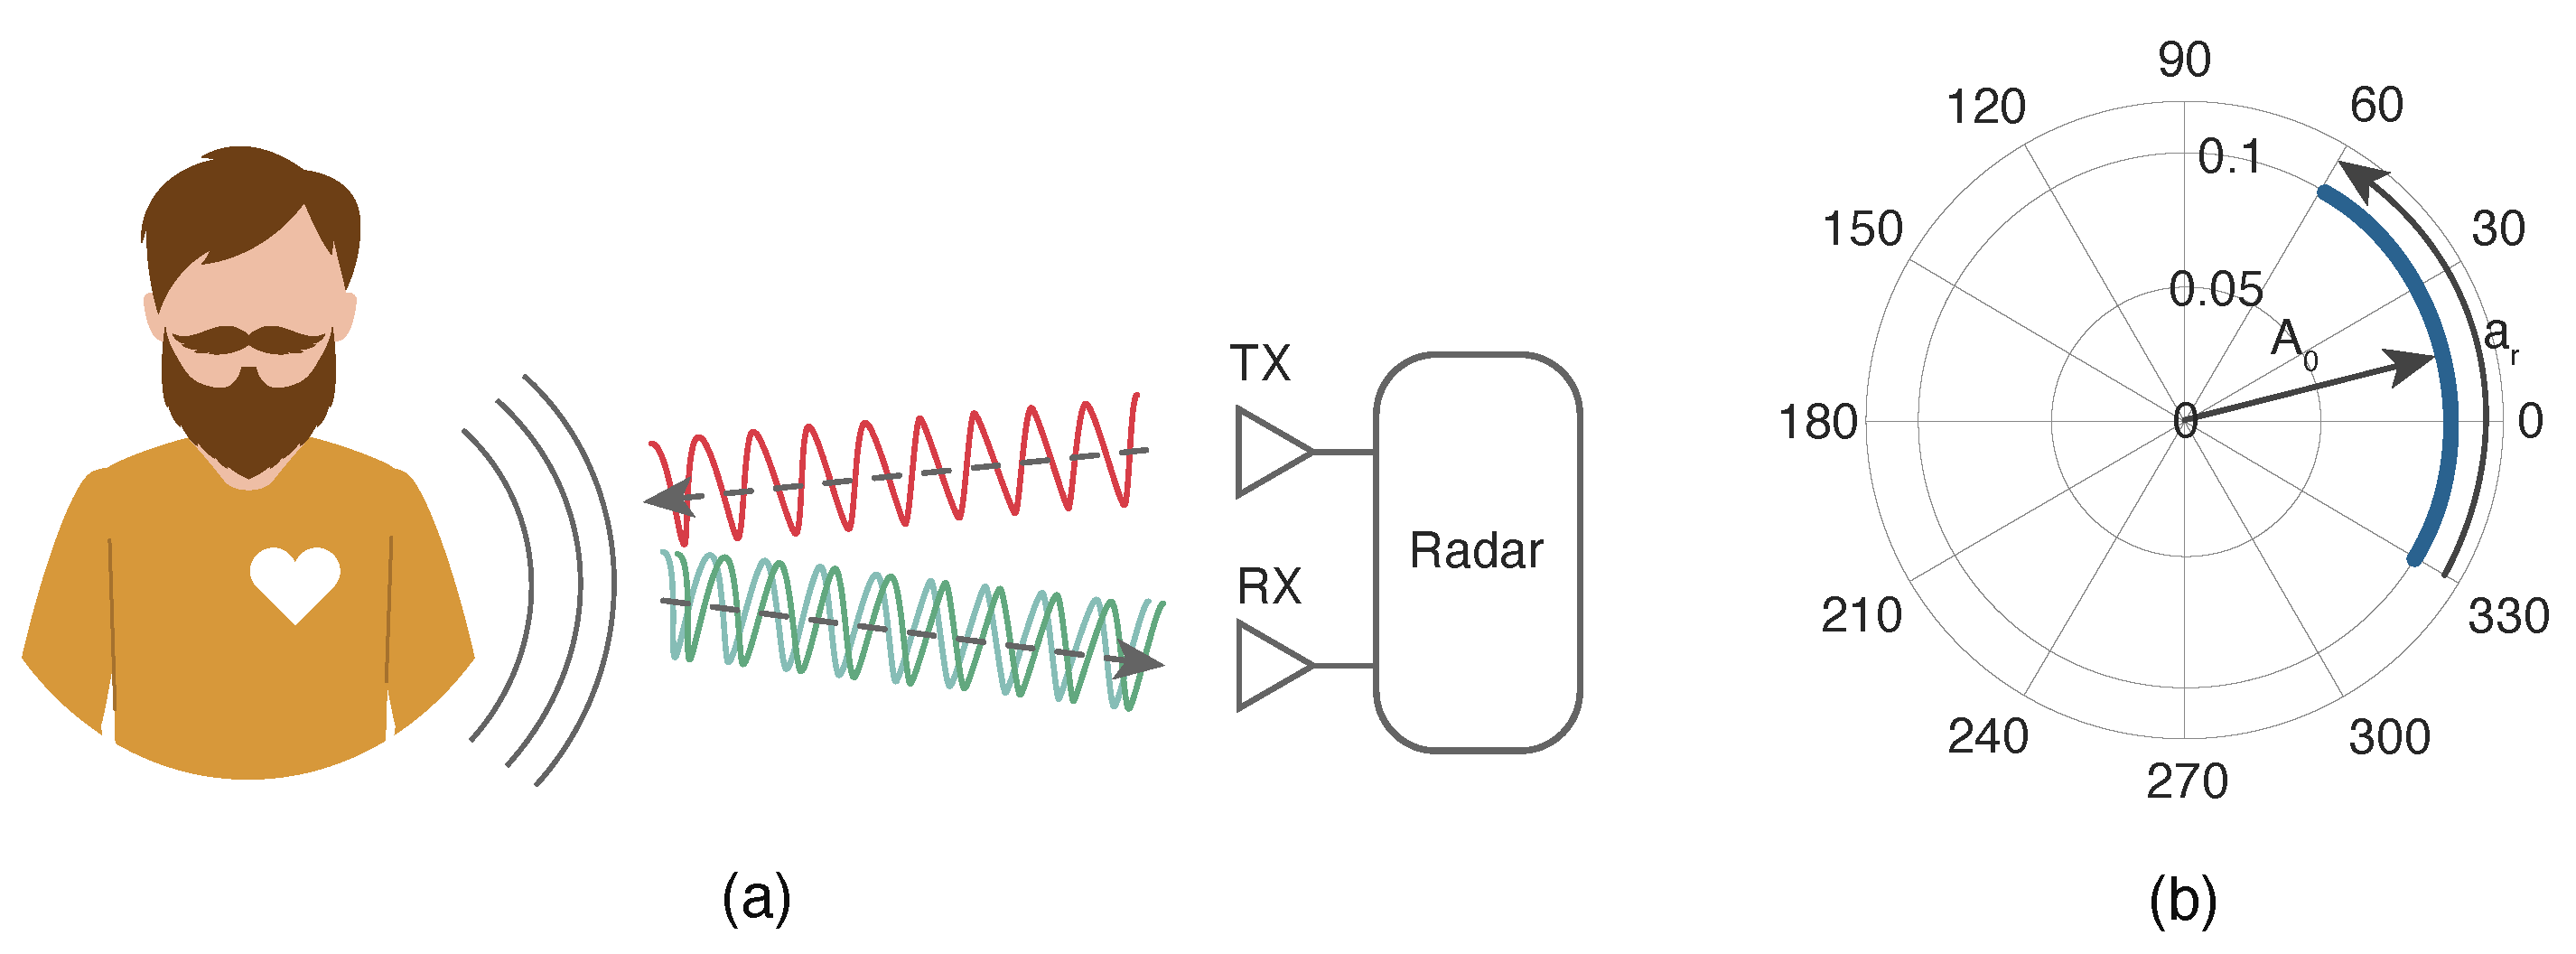
2.2.1. Doppler Radar

Based on the Doppler radar, the BR system allows the cardiorespiratory motion sensing, with precision and with no direct contact with the subject [9].
As an object undergoes motion, the radar signal reflected off the object experiences frequency shifts due to the Doppler effect [27]. Additionally, micro-Doppler analysis centres on extracting further information from the Doppler signature past the primary motion of the entire target. It investigates the smaller, modulated variations within the Doppler signature caused by the motion of internal body parts or other vibrating components within the target. For instance, in vital signs monitoring, micro-Doppler analysis can distinguish and analyse small Doppler shifts caused by chest wall movements amid breathing or heartbeats. By considering these micro-Doppler signatures, it is conceivable to estimate vital signs such as respiratory rate and heart rate [28]. Such detection depends on changes in the travelled path of the transmitted signal, which causes a phase modulation on the received signal, when reflected by the human body, more specifically due to displacements caused by both respiratory and cardiac mechanical activity [27].
There are several radar architectures based on the Doppler effect. The chosen architecture for this work is the Continuous Wave (CW) radar, a relatively simple architecture to implement. A CW radar constantly transmits and receives signals with a very narrow bandwidth [29], enabling the detection of the Doppler shift. It senses phase changes when a target is moving, allowing the target’s velocity to be calculated and even distinguish between stationary and moving objects [30].

2.2.2. Implications of Real-World Applications

As shown in Figure 1a, a sinusoidal signal is continuously transmitted towards the subject’s chest wall. In an ideal scenario, with no parasitic reflections, the physiological signals are perceived as an arc in the complex plane. This is shown in Figure 1b, where A 0 represents the received signal amplitude, and a r the phase variation, which is proportional to the amplitude of the motion of the chest wall [9].
Nonetheless, ideal scenarios do not exist. As such, it is important to consider the surrounding conditions. The received signal is the sum of the intended signal with parasitic reflections that occur in the surrounding objects, as depicted in Figure 2a. Parasitic reflections are addressed as Complex Direct Current (CDC) offsets since they cause a misalignment of the signal in respect to the origin, increasing the spectral component magnitude. These are depicted in Figure 2b, where A 1 is the parasitic component amplitude [9]. We refer the reader to the work by Gouveia et al. [9,31] for a more detailed description.

3. Related Work

There have been several studies performed on the use of the ECG as well as radar as a biometric system, in a myriad of contexts and applications.

3.1. ECG-Based Biometric Recognition

Since the ECG is used for benchmarking purposes in this paper, it is necessary to assess the main contributions. It is possible to divide ECG recognition into three approaches: fiducial, non-fiducial, and partially fiducial.
Fiducial methods are those that typically rely on the use of landmarks in the time domain [8]. As such, it is dependent on the exact detection of points of interest. Initially, pioneering research used predefined medical features as the feature space [32], however it was later proved that this feature space lacked the ability to fully characterise the waveform for biometric purposes, and so revisions were made [33]. Furthermore, to accommodate the users’ needs, it was necessary to turn towards off-the-person/invisible approaches [34].
Nonetheless, this accurate fiducial detection is a difficult task, since there is no universally acknowledged rule, i.e, no way to precisely establish where the limits of the wave lie. Consequently, non-fiducial approaches were created, characterised by the lack of reference detection. Non-fiducial methods are described as those able to extract information without the need of localising fiducial points [8,35]. Usually, these methods are further divided into transform domain approaches [36] and other approaches [37], where the former concerns, as the name implies, feature extraction in the frequency domain.
Even so, the detection of R-peak proved to be desirable, which led to the partially fiducial methods, also addressed as hybrid. These methods make use of the R-peak to segment the waveform, either adopting the full waveform or a subset of it [34].

3.2. BR-Based Biometric Recognition

In spite of this, ECG-based biometrics require contact with the body, thus being unpractical and disruptive to users’ regular interaction. Therefore, there was the need to explore a novel invisible approach, namely the use of BR systems. That said, the use of these radars for identity recognition is still in its inception.
The detection of cardiopulmonary signals using a radar system has already been made possible [38]; moreover, in 2004 it has been demonstrated that it is possible to measure the cardiac and respiratory activity through walls [39]. In 2006, the Doppler effect was used to estimate the amount of individuals in a room [40]. Additionally, these systems could also be used to study the different stages of the heart contraction cycle [41]. Furthermore, in the last few years, research has turned to the use of cardiopulmonary signals as a biometric modality. Table 1 shows a summary of these approaches and their performance.
In 2015, the first use of the cardiac radar signal as a biometric modality was described [10]. Shortly after, a continuous authentication system, the Cardiac Scan, was introduced. This system was based on the acquisition of geometric features of the cardiac motion, introducing the notion of “fiducial-based” identity descriptors in BR biometrics [11]. Moreover, “partially fiducial-based” features have also been pursued to establish a reproducible approach in the time domain [12]. Finally, a “non-fiducial” approach has also been described using spectrograms [13].
Unlike the former studies, other works have focused on the breathing patterns, instead of the cardiac signal [14]. These typically used “fiducial” descriptors to describe the breathing cycle [15], having been proved successful in identifying individuals under different conditions, as well as with obstructive sleep apnoea [16,17]. Nevertheless, the adopted algorithm produced false classifications, and so “non-fiducial approaches” have also been described, using the Fast Fourier Transform (FFT) [18].
The state of the art is lacking in multiple dimensions of radar biometrics. The feature extraction is mostly fiducial-based and with mostly a small number of participants recorded. This work intends to expand the state of the art by using a BR system acquired simultaneously with an ECG one, on different days, and with an increased number of subjects. Moreover, to the best of the authors’ knowledge, this is a pioneer work that explores fusing both BR components, respiratory and cardiac, as well as providing an analysis on each individually. Lastly, this paper aims to analyse the intra- and inter-subject variability on different dates, whilst subjected to different emotions.

4. Proposed Approach

There are three key processes in a biometric system: acquisition of the biometric data, extraction of the intended features, and lastly classification [42]. Figure 3 shows the organisation of our biometric recognition system.
The present section exposes the acquisition of the signals, alongside the methodology used to extract the features.

4.1. Dataset Description

In this work, we use a BR dataset (http://hdl.handle.net/10773/36291, accessed on 15 November 2023) unexplored in the context of biometrics. The data of 20 participants was acquired in 3 different sessions, with at least 2 days between sessions. This study was approved by the Ethics and Deontology Committee of the University of Aveiro, Portugal (No.29-CED/2021). The implemented procedure was in line with the Declaration of Helsinki, and an informed consent was obtained from all the participants.
The BR prototype operated in CW mode with a 5.8 GHz carrier frequency, and the setup was composed of a software-defined radio as radio-frequency front-end, namely the USRP B210 board from Ettus ResearchTM (https://www.ettus.com/all-products/ub210-kit, accessed on 15 November 2023), which uses the GNU Radio Companion software. The electromagnetic waves were transmitted and received using two 2 × 2 antenna arrays with circular polarisation. The setup was operated with a transmitted power equal to 2 dBm at the antenna input [9].
In addition to the BR prototype, a reference physiological data acquisition system was used, namely the BIOPAC MP160 Data Acquisition System (https://www.biopac.com/product/mp150-data-acquisition-systems, accessed on 15 November 2023), using the AcqKnowledge 5 software (https://www.biopac.com/product/mp150-data-acquisition-systems/#product-tabs, accessed on 15 November 2023). This enabled the simultaneous acquisition of the respiratory signal, through the RSP100C module with a transducer chest band attached around the chest wall, as well as the cardiac signal through a three-lead ECG.
The data collection consisted on recording the physiological signals whilst the subjects were stimulated with content designed to elicit different emotions, on different dates; fearfulness was induced via scary videos, happiness via comedy ones and documentaries were used to induce a neutral condition as well as the baseline. Each session had a baseline lasting 5 min, and an emotion inducing period lasting 25 to 30 min [43,44]. The sessions are referenced as N, H, and F according to the intended emotion: Neutrality, Happiness, and Fearfulness, respectively.
Figure 4 shows the setup disposition; the subjects were seated with their arms on top of a table, which allowed them to remain stable during the experiment. The radar antennas were located at a distance of half a meter, in front of the subjects. The signals recorded using the BR system, alongside the signals obtained using the BIOPAC system are illustrated in Figure 5.

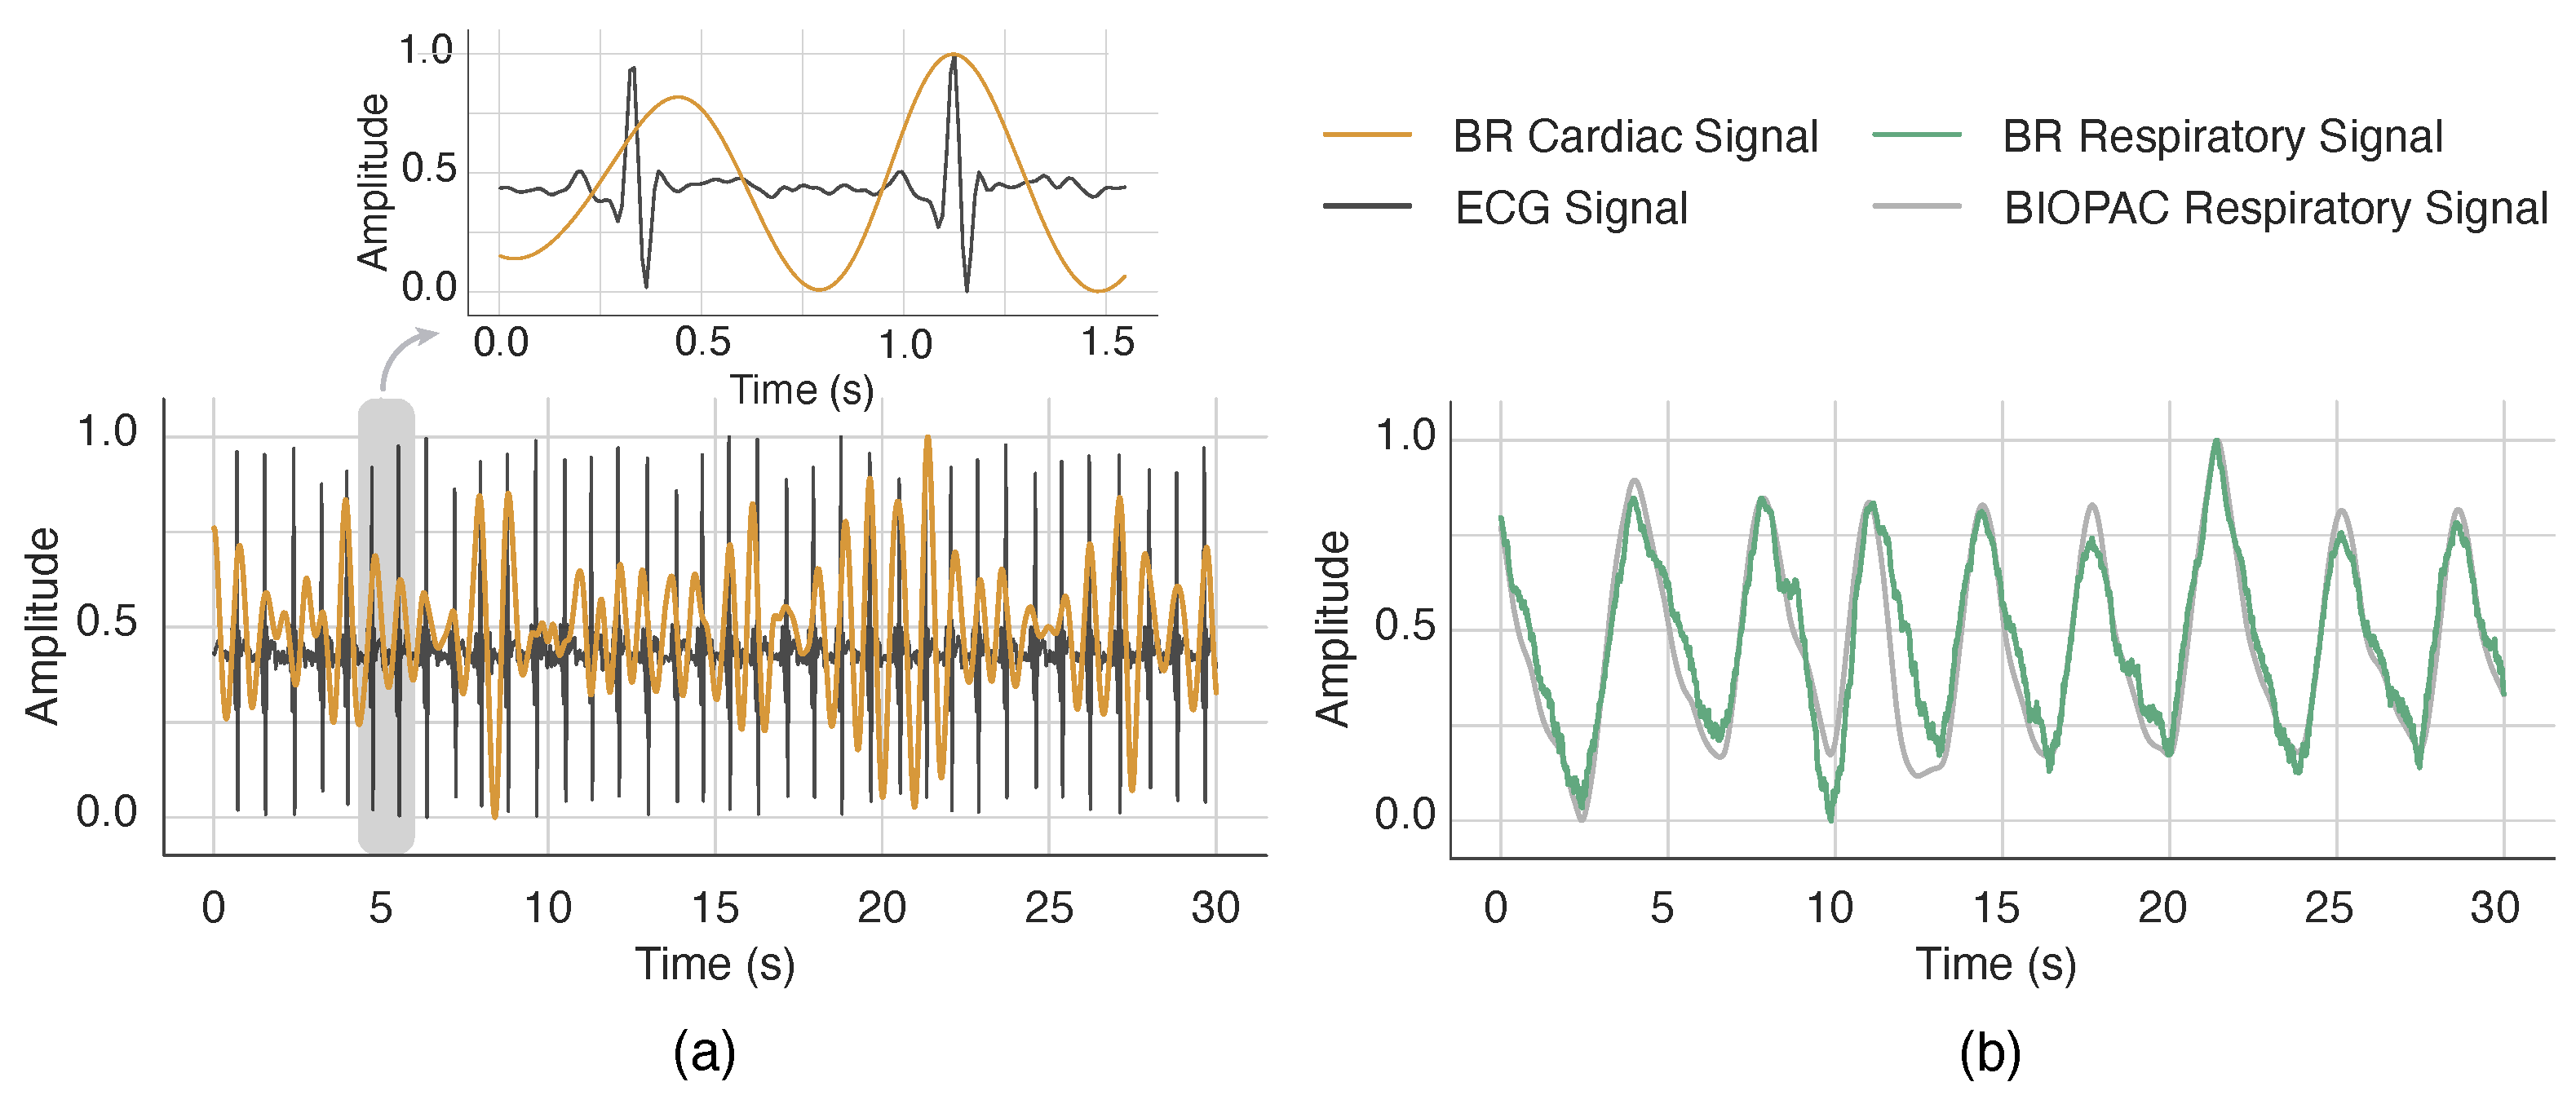
4.2. Physiological Signals Extraction

The signals were acquired synchronously using the BR and BIOPAC systems, as explained in Section 4.1. These signals have been preprocessed, in order to enable the extraction of the physiological signals’ waveform.
In this dataset, the parasitic components of the BR signals were compensated using the method proposed in [9], as it has been proved to be robust to low amplitude signals, and is able to take into account changes in the subject or in the setup. After the removal of the environment clutter, the arctangent was applied, enabling the extraction of a signal containing both respiratory and cardiac information, henceforth referenced as respiratory radar signal, and shown in Figure 5b in green.
Afterwards, by following the approach selected in [31], the BR cardiac signal was extracted. This method consisted in applying a Finite Impulse Response (FIR) band-pass filter of order 100 with cutoff frequency of 0.7–2 Hz, in order to attenuate the respiratory component. Following that, a multi-resolution analysis using the Discrete Wavelet Transform (DWT) was made, whose coefficients are obtained using the maximal overlap DWT considering 7 decomposition levels [45]. The chosen mother wavelet was the Daubechies with 4 vanishing moments, facilitating the isolation of the cardiac signal, as depicted in Figure 5a in yellow, using the wavelet coefficients with 5th and 6th decomposition levels [31].
Regarding the ECG signals, these were filtered by means of a FIR band-pass filter of order 15, with a cut-off frequency of 6–20 Hz to emphasise the R peak. This passband filter, inspired by the work in [46], is able to maximise the energy of the QRS complexes, while reducing the effect of the P and T waves, as well as powerline interference, motion artefacts, and muscle noise.
In Figure 5, it is possible to infer the similarity between the BIOPAC signals and the BR signals, as, in Figure 5a, the local maxima are almost a perfect match, which is emphasised in the magnification window, and in Figure 5b, there is a clear resemblance.

4.3. Feature Selection

In ECG biometrics, fiducial and partially fiducial methods usually have achieved the best results [8]. Despite that, the dependence on the exact detection of points of interest is a difficult task to replicate, or even to establish universally acknowledged rules [47]. On top of that, non-fiducial methods are simpler to compute as it is not necessary to determine fiducial points accurately nor wave boundaries. Non-fiducial based approaches are capable of extracting discriminative information without the need of reference points [48]. Thus, in this paper the spectral profile is explored. The features are obtained from transforming the signal from time to frequency domain representation by means of a FFT, using the resulting coefficients values as they represent how much a given spectral component is present in the original signal [49]. The FFT was applied on intervals of 30 s.
Figure 6 presents each of the signals in the frequency domain. By comparing Figure 5 and Figure 6, the respiratory and the cardiac BR signal notoriously have a sinusoidal shape in the time domain, resulting in a more prominent peak in the frequency domain. The cardiac BR signal has clearly a higher frequency than the respiratory one, seen in both the time and frequency domains. The ECG signal spreads across a wider range of frequencies, explained by its unique shape.
Figure 7 illustrates a comparison between different subjects. This figure shows that, even though the waveforms in some subjects are completely different, there are others in which they are similar, which corroborates that the FFT is a method with potential to distinguish participants. In Figure 7a there is a stark difference between the waveforms of Subjects 8 & 9, whereas the waveforms of Subjects 9 & 11 only differ slightly in their magnitude. Nonetheless, the cardiac signal (Figure 7b) remains relatively different between these subjects, which serves as a motivation towards the use of a fusion signal source.
To transform the features to be on a similar scale, the L2-norm was chosen, followed by a final step utilising a moving average. Here, the biometric templates are computed based on the mean of 4 consecutive waveforms, with overlap, which creates a smoothed version of the template [34].
There is some variability between the different sessions. This is clear in Figure 8, where three randomly chosen subjects (13, 18, and 20) are plotted for all the three sessions, illustrating the intra- and inter-subject variability. It is possible to infer that the signals do not remain the same across sessions.
Lastly, in biometrics there is the notion of multimodal systems, i.e., systems capable of integrating information provided by multiple biometric modalities [42]. Motivated by the results present in Figure 7, in this paper we also explored the fusion of both the respiratory and cardiac BR signals, which is going to be compared to the other signals separately in order to infer the possibility of this multimodal approach. This was achieved by concatenating the two vectors into a single one.

4.4. Classification

A novelty of this work is the evaluation of the BR biometric performance under the effects of emotional and temporal variability as a result of different stimuli and different acquisition dates, as well as the effects of varying the number of subjects.
Focusing on the premise that only a small amount of known users use the system, the rest being intruders, subsets containing solely 5 subjects of the original dataset were used, instead of all 20 participants. These 5 subjects were chosen at random, where one acts as the legitimate owner, and the rest as intruders, in turns. This process was as follows: one subject, Subject n, was the legitimate owner, n = 1 , 2 , , 20 ; the other 4 subjects were chosen randomly, acting as intruders. This selection is repeated 5 times for each subject as the owner, e.g., Subject 1 is the owner in 5 different instances, with 4 other users, chosen randomly, acting as intruders. The mean EER for each subject is computed. In this work, the focus was on having all the subjects equally represented, that is, having the same number of samples of each subject within the subset. As a result, there are more intruders than legitimate users. This test has the aim of inferring the system’s ability to generalise, and to simulate what is expected to happen in real conditions.
In order to study both the emotional and temporal effects, there were three testing scenarios devised; the first scenario uses training and testing biometric templates obtained from the same day, and the remaining two use a combination of templates from different days:
  • Scenario S1–Within each session: The BR and ECG recordings from each session, for each subject, were divided into two parts: D t r a i n and D t e s t . The training and testing windows comprise subsets of the recordings, using the first 2 3 of the recordings for training, and the last 1 6 for testing ( D t r a i n 2 3 , and D t e s t 1 6 ) as shown in Figure 9. The rationale for this partition is to ensure that the segments of the signal are not contiguous, in order to avoid a temporal relationship between the signals that could bias the result;
  • Scenario S2–Between sessions: The training and testing windows come from different sessions, e.g., using session H (where happiness was induced) as D t r a i n , H , and session F (fear being the intended emotion) for D t e s t , F . In this study, it is possible to infer the effects of time and emotion variability;
  • Scenario S3–Across sessions: Using two different sessions to train the classifier, and the remainder for testing, e.g., using session H and F as D t r a i n , H F , and session N (where there were no particular stimuli) for D t e s t , N . By doing so, the classifier is trained utilising windows from multiple days, which may improve the performance.
Furthermore, an extra test was devised. This final test has the purpose of evaluating the performance when different numbers of subjects were considered (2–19 subjects), the aim being to test the classifier sensitivity to the database size. This was done given that there are multiple scenarios in which the recognition is performed only for a limited number of subjects [22]. Subjects were randomly selected, where at each increment, a new member was added to the already existing group of participants. The process was repeated 10 times, and the mean accuracy as well as the standard deviation were computed.
The chosen classifier was a Support Vector Machine (SVM). Given that it is a method vastly supported by the literature [8], it is particularly advantageous for comparison purposes. The hyperparameters were chosen based on a grid search approach, which uses cross-validation to select the best parameters. Due to the number of experiments devised within this work, the focus was on finding the best kernel function, C, gamma, and degree values for each testing scenario.
Figure 10 presents a graphical overview of the extraction of features from the raw data obtained via BR sensors to the classifier used.

5. Results and Discussion

In this section, the results obtained in the scope of authentication are going to be exposed and discussed. Authentication is a one-to-one problem, where the system validates an individual’s claimed identity by means of comparing a given newly acquired biometric template with the biometric templates stored in the database [42,48].

5.1. Scenario S1–Within Session

In this scenario, signals of each subject collected on the same day are segmented into the training and testing sets, following the partition 2 3 1 6 . These are not contiguous so as to create a certain time gap between acquisitions, preventing temporal relationships that could impact the result.
The results obtained for this scenario are shown in Table 2, presenting the average EER results obtained for all subjects, as well as the standard deviation. These results are satisfactory, as the ECG’s EER results are comparable to those found in the state of the art, and the BR’s are better than those reported. Nevertheless, not all results are the same, as the worst results are close to an EER of 10%, indicative of a worse performance.
In this scenario, the results obtained using ECG signals validate this method of feature extraction. Moreover, the BR proves itself to be a competitive biometric system, with potential, as the fusion biometric template obtained results comparable even to the ECG literature. In BR biometrics there are not many studies accounting for authentication, in fact, to the best of the authors’ knowledge, only [11] pursued that information, ergo any comparison made will be limited, due to the different nature and objective between our studies. Nevertheless, the results obtained in both our studies are within the same order of magnitude. On the other hand, it is possible to compare the overall ECG results to the state of the art due to the extensive studies pertained to this matter.
It is also important to note that, the different emotions, and dates (each emotion was stimulated on different days for each subject) obtain good results to various degrees, with happiness consistently being the one that achieved the best results, for all the BR signals (fusion and individual). As such, happiness proved to be more idiosyncratic, especially when compared to the neutral conditions’ session. It is possible to assume that the stimuli lead to certain reactions on the subjects that made their waveform more unique, e.g., laughter due to the comic nature of the video, that could lead to shortness of breath or a rapid contraction of the heart. Another possible conclusion is that people experience emotions in different ways, eliciting different reactions, which are represented in the signal waveform.
Finally, there is an important reflection to be made. It is a must to understand how the signal changes within a session and even across sessions, as there is no guarantee when the following session may be. In this test, it was possible to train and test the classifier with signals that were 5 min apart, to understand if the system would reflect these changes. Nonetheless, studying how different time intervals, or even the subject’s emotional state, may affect the results, is essential.

5.2. Scenario S2–Between Sessions Evaluation: Single Training Session

If a user were to log out of a system only to return at a later point in time, would the system still be able to recognise him?
Due to the nature of authentication, it is important to understand the impact time and/or emotion variability has on the subjects’ physiological signals, and how the system reacts to the possible changes. The training and testing sets were acquired from different sessions, considering both the time and emotional state variability:
  • Using the entirety of session N as D t r a i n , N and session H or F as D t e s t , separately;
  • Session H as D t r a i n , H and the others as D t e s t , separately;
  • Finally, session F as D t r a i n , F and the remainder for test, separately.
Table 3 summarises the results obtained for both the BR and ECG signals.
There is a clear deterioration of the results when comparing them to the previous scenario. Nevertheless, these results prove that the waveforms are somewhat distinctive between subjects, remaining constant within each subject across different time intervals and emotional states, i.e, there is an inter-subject variability, while maintaining the intra-subject variability low.
It is important to note that even the ECG’s performance deteriorated as a function of time and/or emotions. It is not possible to isolate the specific reason behind this deterioration, that is, there is no precise information on whether time span or emotional state played the most important part in this signal distortion.
The analysis between sessions is an important one, as these type of systems may be used to validate a user’s claimed identity in a continuous use, but also recognise him after hours or days have spanned between uses. In this scenario, due to the characteristics of the dataset used, it is possible to make an effort towards understanding the classifier’s performance at different points in time. Ideally, these type of systems would be able to retrain themselves with the new information obtained after each use, as with more information about each user, the better the systems are expected to perform.

5.3. Scenario S3–Across Sessions Evaluation: Multiple Training Sessions

As explained previously, retraining the system after each session would be the optimum use case, as with more information about each individual subject, the system’s performance is expected to increase. In this dataset, there were three different data acquisition periods, and so it is possible to simulate this, to some extent, by training with two different sessions, and testing with the remaining one. As such, this scenario was devised as follows:
  • The data obtained on the sessions where neutral and happy emotions were stimulated were used for training the classifier ( D t r a i n , N H ), and the fear session is used for testing ( D t e s t , F );
  • The data obtained where the emotions intended were neutral and fear ones were used for training the classifier ( D t r a i n , N F ), and the happy session is used for testing ( D t e s t , H );
  • Finally, happiness and fearfulness were used as the training set ( D t r a i n , H F ), and neutrality is used for testing ( D t e s t , N ).
This partition allows the maximisation of the training set, utilising the entirety of two sessions, simulating the ability of retraining, where past information can be used to constantly train and update the model. Table 4 summarises the results obtained.
As expected, the results (shown in Table 4) are better than the ones obtained in the previous scenario S2 (Table 3). The fusion source is able to obtain results between 13 % and 16 % . These results show that the system does improve with the added information. Conversely, the ECG obtains satisfactory results, which are more in line with the state of the art. These are proof that this scenario is promising, because with the increased size of the training set there is an increase in the performance. Nonetheless, the results obtained with the BR system are still lacking and leave room for improvement.
Due to the invisible nature of a BR system, it is not unreasonable to think of it in authentication settings, especially to assure the identity of a user on a continuous use scenario. Nevertheless, any user will eventually log out of a certain system only to return at a later point in time. As such, it is imperative to understand how this type of system would fare in such time gaps between acquisitions, this being accomplished in scenario S2. However, the time gap as well as the different emotional states impact the physiological signals, obtaining subpar results. With that being the case, retraining the classifier with new information after each use is a possible solution. This section attempted to simulate this scenario with the information available. Thereby, the training set consisted of two different sections, with the remaining third used as the testing set.
The increase in performance is notable due to having more available information on each subject. As such, even though the results are not on par with those obtained when considering the same session, as in scenario S1, they are favourable to the possibility of using a BR system in such settings. It is noteworthy, however, that having to retrain the system after each use has computational costs associated, since with more information available, the classifier does take more time to tune the hyperparameters.
A biometric authentication system performance is assessed by measuring two misclassification error rates: mistakenly accepting an intruder’s identity claim (False Acceptance Rate (FAR)), or mistakenly rejecting a legitimate user’s identity claim (False Rejection Rate (FRR)). There is a trade-off between these: decreasing the threshold increases the FAR, making the system more tolerant to noise; analogously, increasing the threshold will in turn increase the FRR, making the system more secure. It is possible to infer the system’s performance at all thresholds (operating points) in the form of a Receiver Operating Characteristic (ROC) curve. Thus, the ROC curve plots the FAR against 1-FRR for different thresholds [42].
Figure 11 presents the ROC curve for the three scenarios devised. It presents the FAR plotted against the 1–FRR for the best results obtained within each scenario: H for S1, H-F for S2, and NH-F for S3. In Figure 11a, the ROC curve using ECG signals resembles one from a perfect classifier. Considering the BR, the increase in performance from the single parts to the fusion source is notable. There is a correlation between the ROC curve and the EER: the smaller the EER, the more perfect the ROC curve will be. In Figure 11b the toll in the curve is apparent: ECG no longer resembles a perfect classifier, and the BR outputs are significantly closer to the diagonal (where FAR = 1-FRR), implying that they are less accurate; out of these the cardiac results are the worst, whereas the fusion ones are the best. Finally, Figure 11c presents an increase in performance, as a consequence of the increase in the training set. Even the BR presents the same improvement: looking at the case when FAR = 0.2 , the fusion source has a 1-FRR above 0.8 , which did not happen before; the FAR is also faster at reaching the 1.0 value. All of this contributes to the notion that the system does, in fact, improve its recognition ability as the training set has more information on each subject.

5.4. Sensitivity to the Number of Subjects

The final test consisted in the evaluation of the system’s performance for cases where the database includes different numbers of subjects. For that, the number of subjects was incremented from 2 to 19. A new subject is randomly chosen from the pool, and added to the already existing set of subjects. Furthermore, within the random sample of subjects, at each iteration, each acted as a legitimate user, and the others as intruders, in turn, and thus the average EER was recorded.
Figure 12 presents the performance, expressed in terms of EER for each test, as a function of the population size for the fusion signal source. This figure presents the best and the worst results attained for this source with linear amplitude, that is, S1 H-H, S2 H-F, and S3 NH-F as the best combination, and S1 N-N, S2 N-H, and S3 HF-N as the worst one. At a first glance, in Figure 12a, the values barely increase past 20 % , whereas in Figure 12b they almost reach 30 % . Nevertheless, the increase in EER is present as the number of subjects increases; however, there are a few peculiar aspects.
In Figure 12b, initially the EER is disproportionately big, decreasing as the number of subjects increases, only to then increase once again. This is most likely a consequence of the random nature of the test. At a first instance, only two subjects are selected. These subjects may be apparently similar, especially given that neutral conditions are the worst case scenario, which has been shown to be less descriptive. As the number of subjects increases, the EER decreases as there is more information available to the classifier. In Figure 12a, this most likely does not happen, because we are considering the best case scenario—happy conditions—which proved to be better at distinguishing samples.
Despite these, the results do stabilise, easily seen by the nature of box plot graphs, as the box itself becomes smaller, as well as the “whiskers” denoting the variability of the data. So, the increase in EER is striking as the number of subject increases. It is important to note that the results stabilise despite the increase in the number of subjects, seen in scenario S1 stabilising below 10 % , as well as in the other two scenarios. These results support the fact that authentication is robust to the number of subjects. Despite that, the results are visibly affected by the time span and/or emotion variability.

5.5. Final Remarks

Scenario S1, with the source fusion, has shown promising results, reinforcing the potential of BR-based biometric systems in real-world applications, where resolving the identity of an individual may be necessary. Herein we have focused on authentication, with the results suggesting that it can be particularly useful, as a means to guarantee that the user remains the same all throughout a certain session (i.e., continuous authentication). Considering the sensitivity to the number of subjects, for the time being these systems appear to be most viable for use cases where the number of subjects is limited (e.g., a household [22] or in-vehicle passenger recognition [24,25]).
Permanence of the biometric template is still a challenge in BR-derived biometric templates. Nevertheless, we evaluated two scenarios that provide important insights, namely: the use of a single training session (S2), or the combination of multiple sessions (S3), all disjointed from the testing session. There is a clear increase in performance for the S3 case, as a direct consequence of training the classifier with more diverse information from the subjects; this suggests that periodically retraining/updating the classifier may significantly improve the performance (as the system becomes more knowledgeable about its users and their different states). This is also a possible solution to mitigate the effect of emotional state on the recognition performance.

6. Conclusions

Doppler radars for biometric recognition have already been analysed in previous studies. However the number of subjects was usually small, and without accounting for different stimuli. The present work explores a new BR dataset containing 20 subjects, exposed to content designed to elicit different emotions (happiness, fearfulness, and neutrality), in sessions separated by several days/weeks. The physiological signals obtained with the BR system were used, containing both respiratory and cardiac information. With these, it was possible to explore a novel source, a multimodal approach consisting of the fusion by concatenation of these signals. The signals obtained were segmented into 30 s windows, and transformed to the frequency domain by means of the FFT. Afterwards, normalisation and an extra filtering stages were applied.
To assess the biometric performance under the scope of authentication, there were three scenarios devised, with the aim of extracting as much information as possible about the BR system under different conditions. Within the session scenario S1, the fusion source set obtained an EER of 3.48 % for happy conditions, showing promising biometric authentication recognition rates in short-term data. Nonetheless, different time frames impact the signal. When considering the use of a single training session, the best results for the fusion source were an EER of 16.78 % , and when intending the combination of multiple sessions, different from the testing session, the best EER obtained was 13.52 % .
This study focused primarily on the evaluation of the performance of these type of systems in the scope of authentication, moreover a novel contribution of this work is the evaluation on whether a given emotional state of the user has an impact on the authentication performance. This is an aspect largely unexplored in literature describing identity recognition using physiological signals in general and, even more so, using BR systems. Despite the different experimental configurations explored herein, there are multiple aspects that should be considered in subsequent research. From our post-hoc reflection, the most relevant concerns are as follows:
  • The study of long term permanence, possibly by means of conducting a trial consisting of a few weeks or even months, with no emotion induced;
  • Further studies on emotion variability should be pursued in order to better understand the impact of this specific variable in the biometric template obtained, one option being the use of a broader set of emotions;
  • The analysis of the impact that distance has on the biometric recognition accuracy, possibly by collecting information from the same subject at different distances, as in real-world conditions the subjects may not be confined to a single 3D volume;
  • Considering the factor of motion artefacts, since BR sensors are vulnerable to movement, and evaluate how these impact the biometric template, and consequently, the classifier’s performance;
  • Understanding the features space’s information, in particular, determining which features are specific to emotion variation, or possess temporal locality characteristics, may be crucial from an authentication standpoint.
All things considered, one can state that the implementation of a BR biometric recognition system was effectively achieved. The experimental results imply that the BR signals are reasonably different across subjects. Moreover, with this work, it was possible to assess the time and emotional variability of these systems.

Author Contributions

Conceptualization, M.L.d.S., C.G., D.F.A. and H.P.d.S.; methodology, M.L.d.S., C.G., D.F.A. and H.P.d.S.; software, M.L.d.S.; validation, M.L.d.S., C.G., D.F.A. and H.P.d.S.; formal analysis, M.L.d.S.; resources, C.G.; writing—original draft preparation, M.L.d.S.; writing—review and editing, M.L.d.S., C.G., D.F.A. and H.P.d.S.; supervision, C.G., D.F.A. and H.P.d.S.; funding acquisition, H.P.d.S. All authors have read and agreed to the published version of the manuscript.

Funding

This research was funded by Fundação para a Ciência e Tecnologia (FCT)/MCTES through national funds and when applicable co-funded by EU funds under the project UIDB/50008/2020 and Scientific Employment Stimulus-Individual Call-2022.04901.CEECIND/CP1716/CT0004 grant (https://doi.org/10.54499/2022.04901.CEECIND/CP1716/CT0004) (accessed on 15 November 2023), by the European Regional Development Fund (FEDER) through the Operational Competitiveness and Internationalization Programme (COMPETE 2020), by National Funds through the FCT under the LISBOA-01-0247-FEDER-069918 “CardioLeather”, by the Ministry of Economy and Competitiveness of the Spanish Government (MEIC)/State Research Agency (AEI) under the project PID2021-123087OB-I00 “BISH-Biomarkerbased Intelligent Systems for Health”, and by the IT, whose support is greatly acknowledged.

Institutional Review Board Statement

This study used data collected in accordance with the Ethics and Deontology Committee of the University of Aveiro, Portugal (No.29-CED/2021), and conducted in accordance with the ethical principles for research involving human subjects set forth by the Declaration of Helsinki.

Informed Consent Statement

Informed consent was obtained from all subjects involved in the study.

Data Availability Statement

The data are not publicly available due to privacy restrictions. The data presented in this study are available upon reasonable request.

Conflicts of Interest

The authors declare no conflict of interest. The funders had no role in the design of the study; in the collection, analyses, or interpretation of data; in the writing of the manuscript; or in the decision to publish the results.

Abbreviations

The following abbreviations are used in this manuscript:
BRBio-Radar
CWContinuous Wave
CDCComplex Direct Current
CNNConvolutional Neural Network
DWTDiscrete Wavelet Transform
ECGElectrocardiogram
EEREqual Error Rate
FARFalse Acceptance Rate
FRRFalse Rejection Rate
FFTFast Fourier Transform
FIRFinite Impulse Response
NNNearest Neighbour
ROCReceiver Operating Characteristic
SVMSupport Vector Machine

References

  1. Prabhakar, S.; Pankanti, S.; Jain, A. Biometric recognition: Security and privacy concerns. IEEE Secur. Priv. 2003, 1, 33–42. [Google Scholar] [CrossRef]
  2. Jain, A.K.; Bolle, R.; Pankanti, S. Biometrics: Personal Identification in Networked Society; Kluwer Academic Publishers: Norwell, MA, USA, 2002; ISBN 978-0-7923-8345-1. [Google Scholar]
  3. Hadid, A. Face Biometrics under Spoofing Attacks: Vulnerabilities, Countermeasures, Open Issues, and Research Directions. In Proceedings of the IEEE Conference on Computer Vision and Pattern Recognition (CVPR) Workshops, Columbus, OH, USA, 23–28 June 2014. [Google Scholar]
  4. Noureddine, B.; Naït-ali, A.; Fournier, R.; Bereksi Reguig, F. ECG Based Human Authentication using Wavelets and Random Forests. Int. J. Cryptogr. Inf. Secur. 2012, 2, 1–11. [Google Scholar] [CrossRef]
  5. Matsumoto, T.; Matsumoto, H.; Yamada, K.; Hoshino, S. Impact of artificial “gummy” fingers on fingerprint systems. In Proceedings of the Optical Security and Counterfeit Deterrence Techniques IV, San Jose, CA, USA, 23–25 January 2002; Volume 4677, pp. 275–289. [Google Scholar] [CrossRef]
  6. Phillips, P.; Martin, A.; Wilson, C.; Przybocki, M. An introduction evaluating biometric systems. Computer 2000, 33, 56–63. [Google Scholar] [CrossRef]
  7. Singh, Y.N.; Gupta, P. ECG to Individual Identification. In Proceedings of the IEEE Second International Conference on Biometrics: Theory, Applications and Systems, Washington, DC, USA, 29 September–1 October 2008; pp. 1–8. [Google Scholar] [CrossRef]
  8. Ribeiro Pinto, J.; Cardoso, J.S.; Lourenço, A. Evolution, Current Challenges, and Future Possibilities in ECG Biometrics. IEEE Access 2018, 6, 34746–34776. [Google Scholar] [CrossRef]
  9. Gouveia, C.; Albuquerque, D.; Vieira, J.; Pinho, P. Dynamic digital signal processing algorithm for vital sign extraction in continuous-wave radars. Remote Sens. 2021, 13, 4079. [Google Scholar] [CrossRef]
  10. Rissacher, D.; Galy, D. Cardiac radar for biometric identification using nearest neighbour of continuous wavelet transform peaks. In Proceedings of the IEEE International Conference on Identity, Security and Behavior Analysis (ISBA), Hong Kong, China, 23–25 March 2015; pp. 1–6. [Google Scholar] [CrossRef]
  11. Lin, F.; Song, C.; Zhuang, Y.; Xu, W.; Li, C.; Ren, K. Cardiac Scan: A Non-Contact and Continuous Heart-Based User Authentication System. In Proceedings of the Annual International Conference on Mobile Computing and Networking, San Jose, CA, USA, 23–25 January 2017; pp. 315–328. [Google Scholar] [CrossRef]
  12. Shi, K.; Will, C.; Weigel, R.; Koelpin, A. Contactless person identification using cardiac radar signals. In Proceedings of the IEEE International Instrumentation and Measurement Technology Conference (I2MTC), Houston, TX, USA, 14–17 May 2018; pp. 1–6. [Google Scholar] [CrossRef]
  13. Cao, P.; Xia, W.; Li, Y. Heart ID: Human Identification Based on Radar Micro-Doppler Signatures of the Heart Using Deep Learning. Remote Sens. 2019, 11, 1220. [Google Scholar] [CrossRef]
  14. Rahman, A.; Yavari, E.; Lubecke, V.M.; Lubecke, O.B. Noncontact Doppler radar unique identification system using neural network classifier on life signs. In Proceedings of the IEEE Topical Conference on Biomedical Wireless Technologies, Networks, and Sensing Systems (BioWireleSS), Austin, TX, USA, 24–27 January 2016; pp. 46–48. [Google Scholar] [CrossRef]
  15. Rahman, A.; Lubecke, V.M.; Boric–Lubecke, O.; Prins, J.H.; Sakamoto, T. Doppler Radar Techniques for Accurate Respiration Characterization and Subject Identification. IEEE J. Emerg. Sel. Top. Circuits Syst. 2018, 8, 350–359. [Google Scholar] [CrossRef]
  16. Islam, S.M.M.; Sylvester, A.; Orpilla, G.; Lubecke, V.M. Respiratory Feature Extraction for Radar-Based Continuous Identity Authentication. In Proceedings of the IEEE Radio and Wireless Symposium (RWS), San Antonio, TX, USA, 26–29 January 2020; pp. 119–122. [Google Scholar] [CrossRef]
  17. Islam, S.M.M.; Rahman, A.; Yavari, E.; Baboli, M.; Boric-Lubecke, O.; Lubecke, V.M. Identity Authentication of OSA Patients Using Microwave Doppler radar and Machine Learning Classifiers. In Proceedings of the IEEE Radio and Wireless Symposium (RWS), San Antonio, TX, USA, 26–29 January 2020; pp. 251–254. [Google Scholar] [CrossRef]
  18. Islam, S.M.M.; Rahman, A.; Prasad, N.; Boric-Lubecke, O.; Lubecke, V.M. Identity Authentication System using a Support Vector Machine (SVM) on Radar Respiration Measurements. In Proceedings of the ARFTG Microwave Measurement Conference (ARFTG), Boston, MA, USA, 7 June 2019; pp. 1–5. [Google Scholar] [CrossRef]
  19. Komeili, M.; Armanfard, N.; Hatzinakos, D. Liveness Detection and Automatic Template Updating Using Fusion of ECG and Fingerprint. IEEE Trans. Inf. Forensics Secur. 2018, 13, 1810–1822. [Google Scholar] [CrossRef]
  20. da Silva, H.P. Biomedical Sensors as Invisible Doctors. In Regenerative Design in Digital Practice: A Handbook for the Built Environment; Eurac Research: Bolzano, Italy, 2019; pp. 322–329. [Google Scholar]
  21. Hu, W.; Zhao, Z.; Wang, Y.; Zhang, H.; Lin, F. Noncontact Accurate Measurement of Cardiopulmonary Activity Using a Compact Quadrature Doppler Radar Sensor. IEEE Trans. Biomed. Eng. 2014, 61, 725–735. [Google Scholar] [CrossRef]
  22. Silva, A.S.; Correia, M.V.; de Melo, F.; da Silva, H.P. Identity Recognition in Sanitary Facilities Using Invisible Electrocardiography. Sensors 2022, 22, 4201. [Google Scholar] [CrossRef]
  23. Schires, E.; Georgiou, P.; Lande, T.S. Vital Sign Monitoring Through the Back Using an UWB Impulse Radar With Body Coupled Antennas. IEEE Trans. Biomed. Circuits Syst. 2018, 12, 292–302. [Google Scholar] [CrossRef] [PubMed]
  24. Hui, X.; Kan, E.C. Seat Integration of RF Vital-Sign Monitoring. In Proceedings of the IEEE MTT-S International Microwave Biomedical Conference (IMBioC), Nanjing, China, 6–8 May 2019; Volume 1, pp. 1–3. [Google Scholar] [CrossRef]
  25. Lourenço, A.; Alves, A.P.; Carreiras, C.; Duarte, R.P.; Fred, A. CardioWheel: ECG biometrics on the steering wheel. In Proceedings of the Joint European conference on machine learning and knowledge discovery in databases, Porto, Portugal, 7–11 September 2015; pp. 267–270. [Google Scholar]
  26. Onoja, A.E.; Oluwadamilola, A.M.; Ajao, L.A. Embedded system based radio detection and ranging (RADAR) system using Arduino and ultra-sonic sensor. Am. J. Embed. Syst. Appl. 2017, 5, 7–12. [Google Scholar]
  27. Boric-Lubecke, O.; Lubecke, V.; Droitcour, A.; Park, B.K.; Singh, A. Doppler Radar Physiological Sensing; John Wiley & Sons, Inc.: Hoboken, NJ, USA, 2016; pp. 1–288. [Google Scholar] [CrossRef]
  28. Chen, V. The Micro-Doppler Effect in Radar; Artech House Radar Library, Artech House: Boston, MA, USA, 2019. [Google Scholar]
  29. Banks, D. Continuous wave (CW) radar. In Proceedings of the Electronics and Aerospace Systems Convention, Washington, DC, USA, 29 September–1 October 1975. [Google Scholar]
  30. Lin, J.C. Microwave sensing of physiological movement and volume change: A review. Bioelectromagnetics 1992, 13, 557–565. [Google Scholar] [CrossRef] [PubMed]
  31. Gouveia, C.; Albuquerque, D.; Pinho, P.; Vieira, J. Evaluation of Heartbeat Signal Extraction Methods Using a 5.8 Hz Doppler Radar System in a Real Application Scenario. IEEE Sensors J. 2022, 22, 7979–7989. [Google Scholar] [CrossRef]
  32. Biel, L.; Pettersson, O.; Philipson, L.; Wide, P. ECG analysis: A new approach in human identification. IEEE Trans. Instrum. Meas. 2001, 50, 808–812. [Google Scholar] [CrossRef]
  33. Israel, S.; Irvine, J.; Cheng, A.; Wiederhold, M.; Wiederhold, B. ECG to identify individuals. Pattern Recognit. 2005, 38, 133–142. [Google Scholar] [CrossRef]
  34. da Silva, H.P.; Fred, A.; Lourenço, A.; Jain, A.K. Finger ECG signal for user authentication: Usability and performance. In Proceedings of the IEEE International Conference on Biometrics: Theory, Applications and Systems (BTAS), Arlington, VA, USA, 23 September–2 October 2013; pp. 1–8. [Google Scholar] [CrossRef]
  35. Hassan, Z.; Gilani, S.; Jamil, M. Review of Fiducial and Non-Fiducial Techniques of Feature Extraction in ECG based Biometric Systems. Indian J. Sci. Technol. 2016, 9, 94841. [Google Scholar] [CrossRef]
  36. Odinaka, I.; Lai, P.H.; Kaplan, A.D.; O’Sullivan, J.A.; Sirevaag, E.J.; Kristjansson, S.D.; Sheffield, A.K.; Rohrbaugh, J.W. ECG biometrics: A robust short-time frequency analysis. In Proceedings of the IEEE International Workshop on Information Forensics and Security, Seattle, WA, USA, 12–15 December 2010; pp. 1–6. [Google Scholar] [CrossRef]
  37. Coutinho, D.P.; Fred, A.L.; Figueiredo, M.A. One-lead ECG-based personal identification using Ziv-Merhav cross parsing. In Proceedings of the International Conference on Pattern Recognition, Istanbul, Turkey, 23–26 August 2010; pp. 3858–3861. [Google Scholar]
  38. Hu, F.; Singh, A.; Boric-Lubecke, O.; Lubecke, V. Medical Sensing Using Doppler Radar. In Telehealthcare Computing and Engineering Principles and Design; CRC Press LLC: Boca Raton, FL, USA, 2013; Chapter 10; pp. 281–301. [Google Scholar]
  39. Petkie, D.T.; Bryan, E.; Benton, C.; Phelps, C.; Yoakum, J.; Rogers, M.; Reed, A. Remote respiration and heart rate monitoring with millimeter-wave/terahertz radars. In Millimetre Wave and Terahertz Sensors and Technology; Krapels, K.A., Salmon, N.A., Eds.; International Society for Optics and Photonics, SPIE: Bellingham, WA, USA, 2008; Volume 7117. [Google Scholar] [CrossRef]
  40. Zhou, Q.; Liu, J.; Host-Madsen, A.; Boric-Lubecke, O.; Lubecke, V. Detection of Multiple Heartbeats Using Doppler Radar. In Proceedings of the IEEE International Conference on Acoustics Speech and Signal Processing, Toulouse, France, 14–19 May 2006; Volume 2. [Google Scholar] [CrossRef]
  41. Droitcour, A.D. Non-Contact Measurement of Heart and Respiration Rates with a Single-Chip Microwave Doppler Radar. Ph.D. Thesis, Stanford University, Stanford, CA, USA, 2006. [Google Scholar]
  42. Jain, A.K.; Ross, A.; Prabhakar, S. An Introduction to Biometric Recognition. IEEE Trans. Circuits Syst. Video Technol. 2004, 14, 4–20. [Google Scholar] [CrossRef]
  43. Pinto, G.; Carvalho, J.M.; Barros, F.; Soares, S.C.; Pinho, A.J.; Brás, S. Multimodal Emotion Evaluation: A Physiological Model for Cost-Effective Emotion Classification. Sensors 2020, 20, 3510. [Google Scholar] [CrossRef] [PubMed]
  44. Barros, F.; Figueiredo, C.; Brás, S.; Carvalho, J.M.; Soares, S.C. Multidimensional assessment of anxiety through the State-Trait Inventory for Cognitive and Somatic Anxiety (STICSA): From dimensionality to response prediction across emotional contexts. PLoS ONE 2022, 17, 1–26. [Google Scholar] [CrossRef]
  45. Jang, Y.I.; Sim, J.Y.; Yang, J.R.; Kwon, N.K. The Optimal Selection of Mother Wavelet Function and Decomposition Level for Denoising of DCG Signal. Sensors 2021, 21, 1851. [Google Scholar] [CrossRef] [PubMed]
  46. Kathirvel, P.; Sabarimalai Manikandan, M.; Prasanna, S.R.M.; Soman, K.P. An Efficient R-peak Detection Based on New Nonlinear Transformation and First-Order Gaussian Differentiator. Cardiovasc. Eng. Technol. 2011, 2, 408–425. [Google Scholar] [CrossRef]
  47. Wang, Y.; Agrafioti, F.; Hatzinakos, D.; Plataniotis, K.N. Analysis of Human Electrocardiogram for Biometric Recognition. EURASIP J. Adv. Signal Process. 2007, 2008, 148658. [Google Scholar] [CrossRef]
  48. Hejazi, M.; Al-Haddad, S.A.R.; Singh, Y.; Hashim, S.; Aziz, A. ECG biometric authentication based on non-fiducial approach using kernel methods. Digit. Signal Process. 2016, 52, 8. [Google Scholar] [CrossRef]
  49. Chamatidis, I.; Katsika, A.; Spathoulas, G. Using deep learning neural networks for ECG based authentication. In Proceedings of the International Carnahan Conference on Security Technology (ICCST), Madrid, Spain, 23–26 October 2017; pp. 1–6. [Google Scholar] [CrossRef]
Figure 1. Basic model of a radar system applied to the measurement of vital signs. (a) represents the ideal scenario, where RX is the receiving antenna and TX the transmitting one; (b) represents the signal for an ideal scenario in the complex plane. Adapted from [9].
Information 15 00044 g001
Figure 2. Effect of the surrounding objects: (a) reflections schematics on the environment; (b) equivalent projection of the received signal on the complex plane. Adapted from [9].
Information 15 00044 g002
Figure 3. Implemented biometric identification system’s architecture.
Information 15 00044 g003
Figure 4. Data acquisition setup used.
Information 15 00044 g004
Figure 5. Example signals of the different modalities: (a) Cardiac signals extracted using the BR (in yellow), and the ECG signals (in dark grey); (b) respiratory signals extracted with the BR (in green), and with the BIOPAC (in light grey). The “minimum-maximum” normalisation was applied in these signals to obtain an amplitude between 0 and 1, so as to provide a better comparison. All signals were acquired from Subject 1, in neutral conditions.
Information 15 00044 g005
Figure 6. Spectral profile of the different signal sources. In darker colour the mean waveform is showcased for the segmented signal: the respiratory BR signal in yellow, the cardiac BR signal in green, and the ECG signal in red; the standard deviation is the area surrounding it. The signals shown were retrieved from Subject 1, in neutral conditions. Once more, the “minimum-maximum” normalisation was applied for comparison purposes. (a) represents a magnification into the first 3.0 Hz of the FFT signals where most BR frequencies are represented, whereas (b) represents the whole spectra.
Information 15 00044 g006
Figure 7. Spectral profile of different subjects. In colour the mean waveform is showcased for the segmented signal: yellow for Subject 8, green for Subject 9, and finally red is used to represent Subject 11. These signals were retrieved, in neutral conditions, after normalising, which is explained afterwards. In these pictures, the respiratory (a) and cardiac (b) BR signals are shown for comparison.
Information 15 00044 g007
Figure 8. Spectral profile of different subjects in different conditions. In the coloured line, the mean waveform is showcased for the segmented signal: yellow for Subject 13, green for Subject 18, and finally red is used to represent Subject 20; the standard deviation is portrayed and filled with colour. These signals were retrieved from the respiratory BR signal, in (a) neutral, (b) happy and (c) fear conditions.
Information 15 00044 g008
Figure 9. Train and Test split done for evaluation Scenario S1.
Information 15 00044 g009
Figure 10. Diagram illustrating the steps taken: (1) represents the extraction of the raw data; (2) the feature extraction, and (3) the classifier used.
Information 15 00044 g010
Figure 11. ROC curve with the best results for the three scenarios: (a) S1, (b) S2, and (c) S3. In it, the 1-FRR and FAR for the ECG as well as the BR signals are plotted in a coloured line: yellow for the ECG signal, green for the fusion source, red, and blue for the respiratory and cardiac BR signals, respectively.
Information 15 00044 g011
Figure 12. Best (a) and worst (b) case scenarios using the fusion signal source for different numbers of subjects.
Information 15 00044 g012
Table 1. Summary of state of the art approaches for BR biometrics. The Feature and Classifier columns present the feature method and classifier of choice. #Information 15 00044 i001 shows the number of subjects, and lastly Accuracy (Acc) (%) and Equal Error Rate (EER) (%) display the accuracy and equal error rate in percentage.
YearFeatureClassifier# Information 15 00044 i001Acc %EER %Refs.
2015DWTk-NN 22619.0[10]
2016Breathing energy,
frequency and patterns
Neural Network392.13[14]
2017Geometric FeaturesSVM7898.614.42[11]
2018Local HeartbeatSVM494.6[12]
2018SpectrogramCNN 3498.5[13]
2018Various 1k-NN695.0[15]
2019FFTSVM6100[18]
2020Various 1SVM1092[16]
2020Breathing energy,
frequency and patterns
k-NN593.75[17]
Data were collected in these experiments. Legend: 1 Breathing/heart rate; inhale/exhale speed, average distances and standard deviation of peaks; breathing depth; spectral entropy; and dynamic segmentation. Dynamic segmentation is the act of segmenting a breathing cycle episode with 30–70% amplitude and calculating the average area ratio of the inhale and exhale segment; 2 k-Nearest Neighbour; 3 Convolutional Neural Network.
Table 2. Results (in %) obtained for scenario S1. These results are shown for the BR signals (BR R is the respiratory BR signal, BR C the cardiac one, and BR RC the fusion), and the ECG signals. The best results are highlighted in yellow. In the first column, the train and test sets are presented as D t r a i n D t e s t . The letters indicate the emotion elicited: N stands for the neutral emotion, whereas H stands for happiness and F for fearfulness, e.g., when considering neutral conditions, N-N is used, representing D t r a i n 2 3 , N and D t e s t 1 6 , N .
BR RBR CBR RCECG
N-N 7.25 ± 4.80 9.64 ± 4.62 4.62 ± 2.97 0.55 ± 1.84
H-H 6.07 ± 4.37 8.26 ± 5.52 3.48 ± 4.89 0.15 ± 0.58
F-F 7.08 ± 4.51 9.13 ± 4.09 3.58 ± 2.92 0.78 ± 3.00
Table 3. Results (in %) obtained for scenario S2. These results are shown for the BR signals (respiratory, cardiac, and the fusion of these), as well as the ECG signals. The best results are highlighted in green. In the first column, the letters indicate the emotion elicited: N stands for the neutral emotion, whereas H stands for happiness, and F for fearfulness, e.g., when considering training with the neutral emotion and testing with happiness, N-H, representing D t r a i n , N and D t e s t , H .
BR RBR CBR RCECG
N-H 20.84 ± 5.17 28.97 ± 3.61 20.17 ± 5.22 9.82 ± 6.02
N-F 22.06 ± 3.89 27.47 ± 4.34 17.72 ± 4.84 8.67 ± 6.81
H-N 22.97 ± 4.15 27.55 ± 6.13 18.83 ± 3.77 11.32 ± 6.84
H-F 22.17 ± 5.41 25.03 ± 4.48 16.78 ± 4.83 6.69 ± 5.79
F-N 22.72 ± 3.94 26.30 ± 4.11 18.88 ± 3.78 11.31 ± 7.67
F-H 23.81 ± 3.88 24.52 ± 2.64 17.90 ± 3.99 9.79 ± 5.17
Table 4. Results (in %) obtained for scenario S3. These results are shown for both the BR signals, and the ECG ones. The best results are highlighted in red. In the first column, the letters indicate the emotion elicited: N stands for the neutral emotion, whereas H stands for happiness and F for fearfulness, e.g., when considering training with the junction of neutral and happy emotions, NH-F, representing D t r a i n , N H and D t e s t , F .
BR RBR CBR RCECG
NH-F 18.32 ± 3.65 20.11 ± 3.48 13.52 ± 4.63 2.89 ± 3.66
NF-H 18.81 ± 4.21 21.18 ± 3.76 15.46 ± 5.62 6.52 ± 4.66
HF-N 18.54 ± 3.16 24.17 ± 4.32 16.20 ± 4.11 6.43 ± 6.21
Disclaimer/Publisher’s Note: The statements, opinions and data contained in all publications are solely those of the individual author(s) and contributor(s) and not of MDPI and/or the editor(s). MDPI and/or the editor(s) disclaim responsibility for any injury to people or property resulting from any ideas, methods, instructions or products referred to in the content.

