Abstract
Signal modulation recognition is often reliant on clustering algorithms. The fuzzy c-means (FCM) algorithm, which is commonly used for such tasks, often converges to local optima. This presents a challenge, particularly in low-signal-to-noise-ratio (SNR) environments. We propose an enhanced FCM algorithm that incorporates particle swarm optimization (PSO) to improve the accuracy of recognizing M-ary quadrature amplitude modulation (MQAM) signal orders. The process is a two-step clustering process. First, the constellation diagram of the received signal is used by a subtractive clustering algorithm based on SNR to figure out the initial number of clustering centers. The PSO-FCM algorithm then refines these centers to improve precision. Accurate signal classification and identification are achieved by evaluating the relative sizes of the radii around the cluster centers within the MQAM constellation diagram and determining the modulation order. The results indicate that the SC-based PSO-FCM algorithm outperforms the conventional FCM in clustering effectiveness, notably enhancing modulation recognition rates in low-SNR conditions, when evaluated against a variety of QAM signals ranging from 4QAM to 64QAM.
1. Introduction
The recognition of modulation type in an unknown signal holds significant importance as it provides essential insights into its structure, origin, and properties. Automatic modulation classification serves various purposes, including spectrum surveillance and management, interference identification, military threat evaluation, electronic countermeasures, source identification, and numerous others. For instance, identifying the modulation type of an intercepted signal allows for more efficient jamming by focusing available resources on vital signal parameters. This is particularly relevant in wireless communications, where different services follow established modulation standards.
Modulation recognition is a crucial aspect of signal processing, entailing the determination of a signal’s modulation mode without prior knowledge. M-ary quadrature amplitude modulation (MQAM) is a widely used digital modulation technology employed in satellite communication and cable networks due to its commendable spectrum efficiency and robust interference resistance. The lack of prior information, such as signal parameters at the receiving end, can make it hard to figure out the modulation order of the QAM signal in non-cooperative communication situations, especially when the signal-to-noise ratio (SNR) is low [1].
Digital modulation identification algorithms can be categorized into two main groups: maximum likelihood hypothesis-based methods rooted in decision theory and statistical pattern recognition techniques relying on feature extraction [2,3]. These techniques are particularly valuable in uncooperative channel environments, and pattern recognition algorithms are often preferred in practical applications due to the absence of prior knowledge about received modulation signals [4]. Higher-order constellation (HOC)-based techniques are well-known pattern recognition methods that perform well at classifying digital modulation signals when the signal-to-noise ratio (SNR) is low. However, they might not work well for classifying higher-order MQAM modulation formats [5]. The constellation diagram varies between different modulation signal types and serves as a robust signature. Researchers have employed algorithms that utilize constellation diagram to identify the order of MQAM [6,7,8,9]. It is possible to recognize modulation in MQAM signals by putting together the constellation diagram using clustering algorithms [10].
The subtractive clustering (SC) algorithm constitutes a significant focus in the field of MQAM signal constellation reconstruction [11]. This algorithm considers each data point as a potential cluster center and calculates it based on the density index of the signal’s data points. Lu et al. [12] predefined the optimal clustering radius for MQAM signals and employed the SC algorithm to reconstruct the MQAM signal’s constellation diagram. However, this approach demands significant computational resources and exhibits poor clustering performance in low signal-to-noise ratio conditions. Cheng et al. [13] extracted characteristic parameters from the signal’s constellation diagram using the SC algorithm and compared them with those from the standard constellation diagram to figure out what kind of modulation it was. However, the method showed limited noise resilience and lacked a standardized approach for selecting clustering radii.
To improve the accuracy of clustering center coordinates within the signal’s constellation diagram, some studies integrate the fuzzy c-means (FCM) algorithm for secondary clustering. FCM is a clustering algorithm that assesses the degree to which each data point belongs to a specific cluster through a membership relationship [14,15]. However, FCM is sensitive to the values that are chosen at the start for the cluster centers, and its results often get stuck in local optima, making it harder to find the globally optimal clustering centers. To address this challenge, stochastic techniques such as particle swarm optimization (PSO) are employed to increase the likelihood of locating the global optimum [16]. Implementing PSO in the FCM algorithm has been successful in various areas, including image processing and engineering [17,18,19,20].
This paper introduces a PSO-FCM algorithm for the reconstruction of the MQAM modulation constellation diagram. This algorithm combines the FCM and PSO algorithms into a three-step process: initial cluster center computation using the subtractive clustering (SC) algorithm based on the signal-to-noise ratio (SN-SC); subsequent utilization of the PSO-FCM algorithm, leveraging the initially obtained cluster centers; and the combined benefits of FCM and PSO for improved cluster center accuracy. The PSO-FCM algorithm avoids getting stuck in local minima by utilizing the PSO global search method to find candidate solutions. The modulation type of the signal constellation can be found by finding the ratio of the largest and smallest cluster center radius.
The subsequent sections of this paper are organized as follows: Section 2 outlines the signal model employed; Section 3 provides a detailed explanation of the methodology used in this study, which includes the signal-to-noise ratio-based subtractive clustering (SN-SC) algorithm and the particle swarm optimization with fuzzy c-means (PSO-FCM) algorithm; Section 4 illustrates the simulation results; and Section 5 concludes the work.
2. Signal Model
In the receiver system, the sampled signal, denoted as , is represented as follows:
where denotes the baseband signal, shaped using a root-raised cosine pulse with a random roll-off factor. The sampling duration is represented by the variable , while the complex-valued channel fading gain, capturing the flat fading experienced by the signal, is represented by . The methodology that we have developed is specifically designed to be effective for narrowband signals, which have a bandwidth smaller than the coherence bandwidth of the channel. By narrowband, we refer to signals whose frequency span falls within a range where the channel exhibits consistent characteristics and a limited range of frequency-related variations. In this scenario, each frequency component undergoes the same block-fading coefficient, allowing for simplified representation using a single-tap channel filter . The term accounts for the carrier frequency offset, arising from a discrepancy between the RF signal frequency and local oscillator frequency. The term denotes zero mean Gaussian noise. The carrier frequency offset (CFO) in the received signal is estimated using an eighth-order non-linearity and corrected using the method proposed in [11]. After that, the signal that has been corrected for the CFO is resampled to an integer multiple of the estimated symbol rate for matched filtering. The system accommodates for the presence of additive white Gaussian noise (AWGN) and factors in slow and flat fading channels. The received symbol is expressed as
where represents the extracted symbol from one of the considered modulation schemes, and is Gaussian noise. The signal-to-noise ratio (SNR) for symbols with unit power can be defined as:
where =.
3. Methodology
Our proposed methodology (Figure 1) offers an approach for classifying single-carrier QAM modulations. This technique integrates two distinct algorithms: SN-SC and PSO-FCM. It focuses on the analysis of constellation shapes within the in-phase and quadrature (I-Q) diagrams associated with QAM modulations. To ensure a precise classification process, the methodology follows a systematic procedure. Initially, phase correction is applied to received signals. After that, the SN-SC algorithm quickly goes through the corrected constellation points to find and identify the cluster centers in each I-Q diagram. By utilizing the cluster centers obtained from the SN-SC block, the integration of PSO and FCM algorithms further refines the received signals, resulting in an accurate classification of the QAM modulation order.
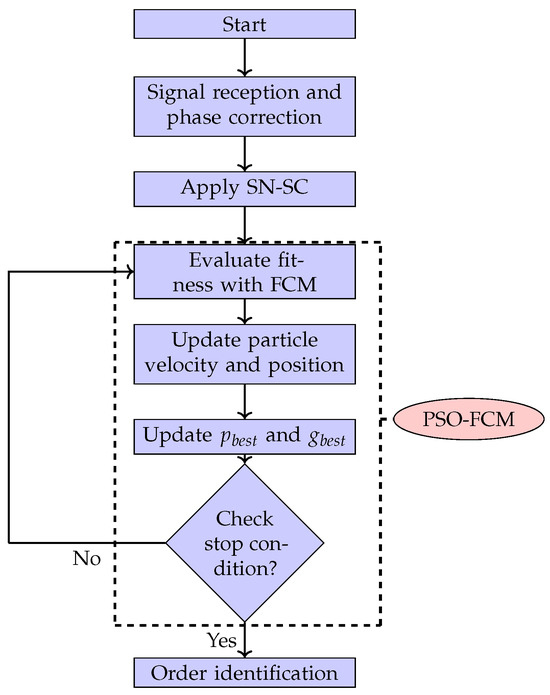
Figure 1.
Block diagram of the subtractive-clustering-based PSO-FCM algorithm.
3.1. Signal-to-Noise-Ratio-Based Subtractive Clustering Algorithm (SN-SC)
The SN-SC algorithm introduces a clustering approach that integrates considerations of both local density and SNR, as outlined in Algorithm 1. In the SN-SC method, each data point is considered a potential cluster center with the maximum local density, where the density measure is calculated as follows:
The SN-SC algorithm relies on the ‘density’ metric to identify initial cluster centers within a neighbourhood radius (), which is defined as . also represents the average noise power amplitude. If the radius is too small, potential data points near the cluster center may be overlooked. Conversely, setting the radius too high increases the contribution of all potential data points, including noise, which can distort the modulated signal and affect the density radius parameter of the constellation diagram. The coefficient represents the adjustment weighting of different types of modulated signals. Choosing an appropriate scaling factor, , enables the algorithm to attain a relatively stable density metric across the entire SNR range. Determining the optimal value of in practical engineering often involves conducting multiple experiments.
| Algorithm 1 SN-SC Algorithm | |
| Step | Operation |
| Input: x, λ, SNR | |
| Output: z | |
| Initialization | |
| cl = 1, Flag = 0 | |
| 1 | |
| for i = 1:N | |
| 2 | |
| end | |
| 3 | , |
| while Flag = 0 | |
| 4 | for each i data point |
| 5 | |
| 6 | repeat step 3 |
| 7 | if , |
| 8 | return |
Each data point updates its density based on the obtained center for the lth cluster () as follows:
where represents the density of the data point (), and is a value greater than one to avoid obtaining closely spaced centers. The algorithm selects the data point with the maximum density as the new center of the cluster, denoted as . The algorithm repeats the process until it meets the condition , signaling the termination of the cluster center decision. In this condition, is a given parameter ().
3.2. Proposed Integration of PSO and FCM Algorithms
In this section, we will provide a brief description of the FCM and PSO algorithms, followed by an introduction to the new version of the hybrid clustering method based on FCM and PSO integration.
3.2.1. FCM
Fuzzy c-means (FCM) is a clustering algorithm that assigns each data point to clusters with varying membership degrees. This approach effectively groups data into fuzzy subsets, which is crucial for applications in pattern recognition or data analysis. Notably, FCM requires a predefined cluster count to perform optimally, which is obtained from the cluster centers determined by the SN-SC algorithm.
Let represent a clustering dataset of N objects indexed by i, with each represented by a vector of quantitative variables. denotes the set of centers of C clusters listed by j and as a fuzzy partition matrix, where indicates the membership of the ith object to the jth cluster. The constraints on are as follows: , and . The FCM algorithm aims to minimize an objective function by finding the optimal cluster centers and their corresponding membership degrees, as defined in the following equation:
where is the fuzzy weighting exponent and represents the Euclidean distance. The dissimilarity between data and cluster center is indicated. To minimize J, clustering center and the membership degree are updated according to:
and
The update stops when the cluster centers from the previous iteration closely approximate those generated in the current iteration.
3.2.2. PSO
Inspired by the collective behavior of birds seeking food, the PSO algorithm is a population-based optimization technique. Potential solutions, termed particles, traverse the problem space by following the best particles. The fitness value referred to as assesses each particle’s coordinates in the problem space associated with the best solution achieved so far. The swarm progresses toward the best solution, the global best, denoted as . The search for and follows:
where
where and are uniformly distributed in . and represent acceleration parameters. The inertia weight is updated as . denotes the better position of the ith particle compared to its history up to the tth iteration, while represents the best position within the swarm up to the tth iteration.
3.2.3. Problem
FCM’s nonlinear optimization based on fuzzy set theory iteratively improves the initial cluster centers to approximate final cluster centers close to the actual ones. However, it might trap local minima due to local search methods. Deviation of the final cluster centers from the actual ones can compromise FCM’s clustering results. In contrast, population-based PSO is a global optimization algorithm that employs random search techniques but might have limited clustering performance.
3.2.4. PSO-FCM
To overcome FCM’s local minima trapping and achieve better clustering results, we harness the strengths of both FCM and PSO. In particular, the PSO-FCM algorithm uses FCM’s objective function (6) as the fitness function and PSO’s global search method to find cluster centers.
The PSO-FCM algorithm utilizes particles in PSO to represent potential solutions for FCM’s cluster centers. The positions of particles in a swarm of Q particles encode the cluster centers . Each particle q is defined as , representing candidates in the swarm (Q) for clustering the data. The updated dimension values representing cluster centers generate by decoding when PSO recognizes an accepted cluster center or reaches a predefined number of iterations. The convergence of both algorithms toward the same objective function for optimal clustering drives the minimization of fitness functions in PSO-FCM. This fusion of FCM and PSO, through PSO-FCM, capitalizes on the advantageous features of both. Below, Algorithm 2 summarizes the PSO-FCM algorithm.
| Algorithm 2 PSO-FCM algorithm |
| Input: , m, , , , . |
| Initialization |
| , |
| For each particle |
| Calculate the of particle. |
| Repeat until iterations are reached |
| Update and . |
| Calculate the membership |
| Update the of the particle; |
| If |
| ; |
| Update ; |
| if |
| . |
| Decode to obtain cluster centers . |
In computing the fitness of each particle q, we first derive the cluster center from the particle’s position representation. Subsequently, we calculate the membership degree for each data point using Equation (8). By utilizing these cluster centers and membership degrees, we evaluate the of each particle q using Equation (6). Notably, the minimization of the fitness function in PSO-FCM aligns with minimizing the objection function J in FCM. Both algorithms define the same objective function, thereby aiming for optimal clustering. PSO-FCM leverages the strengths of both FCM and PSO, utilizing their favorable features to minimize the fitness function in pursuit of achieving optimal clustering. Equations (9) and (10) update the velocity and position of each particle q.
3.3. Modulation Order Identification Using Circle Radius Ratio
Each point in an MQAM constellation diagram is surrounded by circles of varying diameters, which are determined by their distance from the constellation center. Different orders of QAM signals exhibit characteristic ranges of circle diameter values. This property allows us to utilize circle radii within the constellation map for the purpose of MQAM signal classification and identification. In the absence of noise interference, a noise-free 16QAM’s constellation map displays a point with the highest amplitude corresponding to a circle with radius , while the point with the lowest amplitude corresponds to a circle with radius , as shown in Figure 2. In a standard constellation plot, the ratio of the maximum to minimum circle radius is defined as .
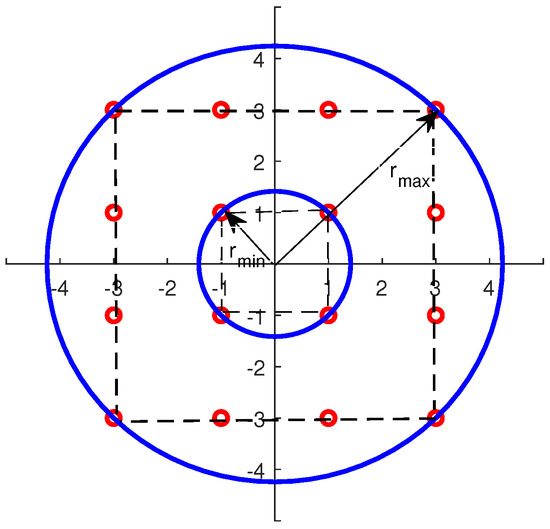
Figure 2.
16QAM modulation constellation with inner radius and outer radius .
After applying the clustering algorithm to obtain the reconstructed signal’s constellation diagram, we calculate and sort the distances between the cluster center and the starting point in descending order. The top W distances are averaged to determine the maximum circle radius, while the bottom W distances are averaged to determine the minimum circle radius. The values of different MQAM modulation signals are categorized into distinct ranges based on predefined standard values. The categorization is as follows:
Noise can lead to inaccuracies in the initial determination of cluster centers through adaptive subtractive clustering based on the signal-to-noise ratio. The update of semi-supervised fuzzy mean clustering affects the positions of cluster centers but not the number of cluster centers. Consequently, the number of cluster centers in the reconstructed constellation map may not correspond to the actual number of modulation points. By employing the radius method on different circles of the constellation map, we can calculate radius values, mitigating the impact of an incorrect number of cluster centers. This approach does not affect the final recognition result and enhances the classification accuracy.
4. Simulations Results
In this section, we present the numerical results obtained through MATLAB simulations of SN-SC, FCM, and PSO-FCM. Table 1 provides an overview of the simulation parameters employed in our study.

Table 1.
Parameter values used in the simulations.
In the low-SNR scenario (SNR dB), the FCM algorithm is susceptible to becoming trapped in local minima, as depicted in Figure 3. When the FCM algorithm, which relies on a fuzzy clustering objective function, is used, this tendency can cause some cluster centers to shift within the constellation. This sensitivity to initialization and the resulting misplacement can lead to substantial errors during the decision-making and demodulation processes. While the PSO-FCM algorithm demonstrates superior clustering performance compared to FCM, it still encounters challenges in fully mitigating the issue of local optimization, as shown by the presence of local optima in Figure 4.
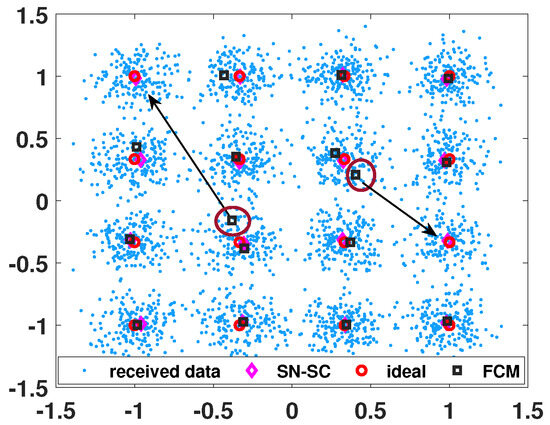
Figure 3.
16QAM received signal modulation at SNR = 4 dB with clustering centers for SN-SC and FCM.
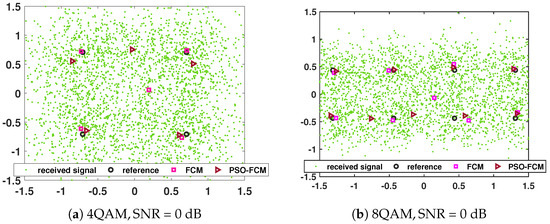
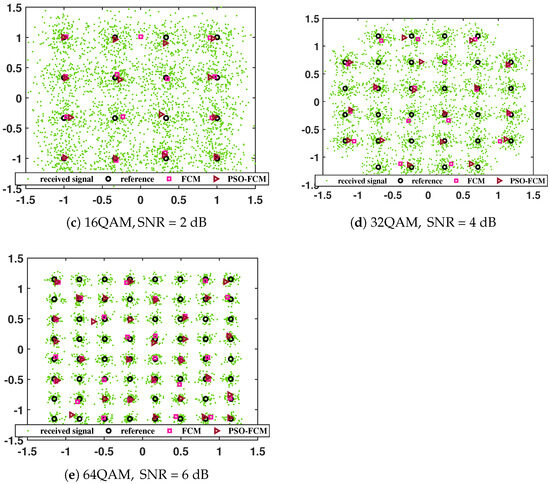
Figure 4.
The clustering performance of FCM and PSO-FCM; 4QAM with SNR = 0 dB, 8QAM with SNR = 0 dB, 16QAM with SNR = 2 dB, 32QAM with SNR = 4 dB, 64QAM with SNR = 6 dB.
In Table 2, we present the average number of cluster centers obtained by SN-SC (), SC with (), and SC with () for 4QAM, 16QAM, 32QAM, and 64QAM digitally modulated signals under varying SNR scenarios. Algorithms and based on the SC method perform well in clustering 16QAM and 4QAM signals; however, their reliable classification performance cannot be guaranteed for other modulation schemes. In contrast, algorithm demonstrates its suitability for diverse modulation signals and outperforms algorithms and in overall classification performance.

Table 2.
Comparison of clustering results for different-order QAM signals under various SNR situations using the SC algorithm and the SN-SC algorithm.
Table 3 presents the clustering performance of the FCM and PSO-FCM algorithms. The results demonstrate that the PSO-FCM exhibits a reduced number of occurrences of local optima compared to the FCM algorithm across all modulation schemes. This suggests that the PSO-FCM algorithm is more effective in identifying the global optimum compared to the FCM algorithm.

Table 3.
Clustering results of two clustering algorithms with various constellation datasets.
The studies used the PSO-FCM and FCM algorithms to find modulation in 4QAM, 8QAM, 16QAM, 32QAM, and 64QAM signals. Figure 5 illustrates the modulation recognition rates for MQAM signals, showing that PSO-FCM generally achieves a higher modulation identification rate compared to FCM. Moreover, upon analyzing the results depicted in Figure 6, it becomes apparent that the FCM algorithm converges more rapidly. PSO-FCM converges more slowly than FCM due to the simultaneous optimization of particle positions and membership values in the PSO-FCM hybrid.
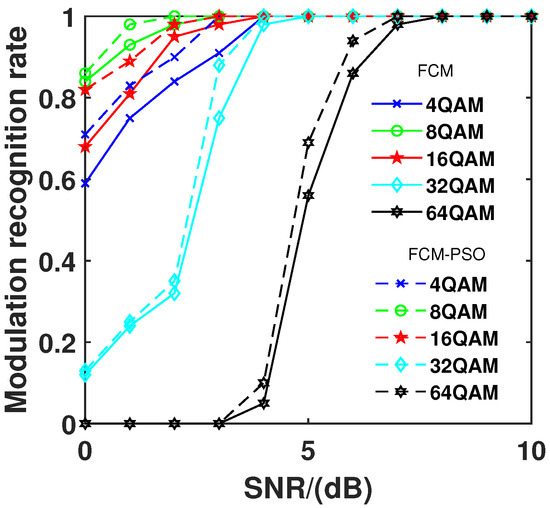
Figure 5.
Modulation recognition rate of FCM and PSO-FCM across varied SNRs for multiple QAM signals.
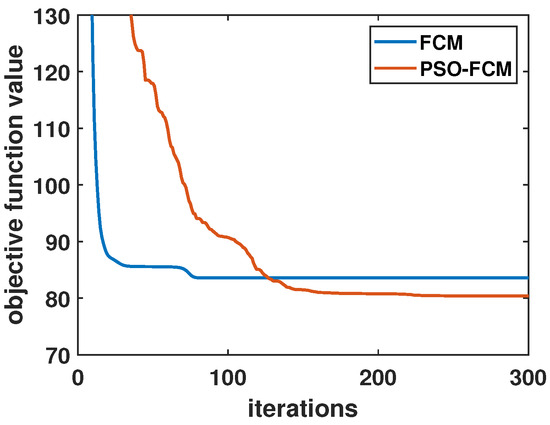
Figure 6.
Iterations vs. objective function value; 16QAM, SNR = 2 dB.
PSO introduces additional complexity in the PSO-FCM compared to the traditional FCM algorithm due to the augmented computational load per iteration. In PSO-FCM, there is an inclusion of supplementary complexity multiplication and addition operations. Specifically, each iteration in PSO necessitates complex multiplications and complex additions, where Q denotes the number of data points and C represents the number of dimensions. These extra computational operations in PSO-FCM potentially contribute to slower convergence compared to FCM. The objective function value of the PSO-FCM algorithm gradually diminishes and eventually falls below that of the FCM algorithm, indicating superior optimization performance to some extent. Consequently, the choice between algorithms requires consideration of the trade-off between additional complexity and optimization effectiveness.
5. Conclusions
This paper presents a novel PSO-FCM algorithm designed specifically for accurately identifying modulation orders within MQAM schemes. This hybrid approach integrates the SN-SC algorithm for initial cluster center obtainment and combines FCM and PSO techniques to enhance precision in determining modulation orders. By evaluating fitness using FCM’s objective function and analyzing the ratio between maximum and minimum cluster center radii, the algorithm effectively discerns various MQAM modulation schemes. The simulation results validate the algorithm’s superior performance, especially in accurately identifying modulation orders even in low-SNR scenarios. This robustness underscores its potential practical application in real-world communication systems where precise QAM modulation order identification is crucial.
Author Contributions
Conceptualization, Z.Q., H.Z., J.L. and H.S.; methodology, Z.Q. and H.S.; writing—original draft preparation, Z.Q.; writing—review and editing, H.Z., J.L. and H.S. All authors have read and agreed to the published version of the manuscript.
Funding
This research was funded by the National Natural Science Foundation of China under the grant number U1604160.
Institutional Review Board Statement
Not applicable.
Data Availability Statement
The original contributions presented in the study are included in the article, further inquiries can be directed to the corresponding authors.
Conflicts of Interest
The authors declare no conflict of interest.
References
- Ali, A.K.; Erçelebi, E. An M-QAM signal modulation recognition algorithm in AWGN channel. Sci. Program. 2019, 6752694. [Google Scholar] [CrossRef]
- Azzouz, E.E.; Nandi, A.K. Automatic identification of digital modulation types. Signal Process. 1995, 47, 55–69. [Google Scholar] [CrossRef]
- Abdelbar, M.; Tranter, W.H.; Bose, T. Cooperative cumulants-based modulation classification in distributed networks. IEEE Trans. Cogn. Commun. Netw. 2018, 4, 446–461. [Google Scholar] [CrossRef]
- Xu, J.L.; Su, W.; Zhou, M. Likelihood-ratio approaches to automatic modulation classification. IEEE Trans. Syst. Man Cybern. Part C (Appl. Rev.) 2010, 41, 455–469. [Google Scholar] [CrossRef]
- Hashim, I.A.; Sadah, J.W.A.; Saeed, T.R.; Ali, J.K. Recognition of QAM signals with low SNR using a combined threshold algorithm. IETE J. Res. 2015, 61, 65–71. [Google Scholar] [CrossRef]
- Mobasseri, B.G. Constellation shape as a robust signature for digital modulation recognition. In Proceedings of the IEEE Conference on Military Communications MILCOM 1999, Atlantic City, NJ, USA, 31 October–3 November 1999; pp. 442–446. [Google Scholar]
- Mobasseri, B.G. Digital modulation classification using constellation shape. Signal Process. 2000, 80, 251–277. [Google Scholar] [CrossRef]
- Yin, C.; Li, B.; Li, Y.; Lan, B. Modulation classification of MQAM signals based on density spectrum of the constellations. In Proceedings of the 2010 2nd International Conference on Future Computer and Communication ICFCC 2010, Wuhan, China, 21–24 May 2010; Volume 3, pp. 57–61. [Google Scholar]
- Fuchs, C.; Spolaor, S.; Nobile, M.S.; Kaymak, U. A Swarm Intelligence Approach to Avoid Local Optima in Fuzzy C-Means Clustering. In Proceedings of the 2019 IEEE International Conference on Fuzzy Systems (FUZZ-IEEE), New Orleans, LA, USA, 23–26 June 2019; pp. 1–6. [Google Scholar] [CrossRef]
- Zha, Y.; Wang, H.; Shen, Z.; Shi, Y.; Shu, F. Intelligent identification technology for high-order digital modulation signals under low signal-to-noise ratio conditions. IET Signal Process. 2023, 17, e12189. [Google Scholar] [CrossRef]
- Jajoo, G.; Kumar, Y.; Yadav, S.K. Blind signal PSK/QAM recognition using clustering analysis of constellation signature in flat fading channel. IEEE Commun. Lett. 2019, 23, 1853–1856. [Google Scholar] [CrossRef]
- Lu, F.; Shi, Z.; Su, R. Communication signal modulation mechanism based on artificial feature engineering deep neural network modulation identifier. Wirel. Commun. Mob. Comput. 2021, 9988651. [Google Scholar] [CrossRef]
- Cheng, Y.; Shao, S. Communication modulation recognition method based on clustering algorithm. J. Phys. Conf. Ser. 2021, 1827, 012153. [Google Scholar] [CrossRef]
- Askari, S. Fuzzy C-Means clustering algorithm for data with unequal cluster sizes and contaminated with noise and outliers: Review and development. Expert Syst. Appl. 2021, 165, 113856. [Google Scholar] [CrossRef]
- Li, G.; Qin, X.; Liu, H.; Jiang, K.; Wang, A. Modulation Recognition of Digital Signal Using Graph Feature and Improved K-Means. Electronics 2022, 11, 3298. [Google Scholar] [CrossRef]
- Nayak, J.; Swapnarekha, H.; Naik, B.; Dhiman, G.; Vimal, S. 25 Years of Particle Swarm Optimization: Flourishing Voyage of Two Decades. Arch. Comput. Methods Eng. 2022, 30, 1663–1725. [Google Scholar] [CrossRef]
- Ying, L.; Ning, L. Improved change detection method for flood monitoring. J. Radars 2017, 6, 204–212. [Google Scholar]
- Kao, Y.; Chen, M.H.; Hsieh, K.M. Combining PSO and FCM for dynamic fuzzy clustering problems. In Proceedings of the Swarm Intelligence Based Optimization: First International Conference, ICSIBO 2014, Mulhouse, France, 13–14 May 2014; Revised Selected Papers. Springer International Publishing: Berlin/Heidelberg, Germany, 2014; Volume 1, pp. 1–8. [Google Scholar]
- Ezugwu, A.E.S.; Agbaje, M.B.; Aljojo, N.; Els, R.; Chiroma, H.; Elaziz, M.A. A comparative performance study of hybrid firefly algorithms for automatic data clustering. IEEE Access 2020, 8, 121089–121118. [Google Scholar] [CrossRef]
- Gad, A.G. Particle swarm optimization algorithm and its applications: A systematic review. Arch. Comput. Methods Eng. 2022, 29, 2531–2561. [Google Scholar] [CrossRef]
Disclaimer/Publisher’s Note: The statements, opinions and data contained in all publications are solely those of the individual author(s) and contributor(s) and not of MDPI and/or the editor(s). MDPI and/or the editor(s) disclaim responsibility for any injury to people or property resulting from any ideas, methods, instructions or products referred to in the content. |
© 2024 by the authors. Licensee MDPI, Basel, Switzerland. This article is an open access article distributed under the terms and conditions of the Creative Commons Attribution (CC BY) license (https://creativecommons.org/licenses/by/4.0/).