Abstract
Public health is an important aspect of community activities, making research on health necessary because it is a crucial field in maintaining and improving the quality of life in society as a whole. Research on public health allows for a deeper understanding of the health problems faced by a population, including disease prevalence, risk factors, and other determinants of health. This work aims to explore the potential of hospital patient data analysis as a valuable tool for understanding community implications and deriving insights for effective community health interventions. The study recognises the significance of harnessing the vast amount of data generated within hospital settings to inform population-level health strategies. The methodology employed in this study involves the collection and analysis of deidentified patient data from a representative sample of a hospital in Indonesia. Various data analysis techniques, such as statistical modelling, data mining, and machine learning algorithms, are utilised to identify patterns, trends, and associations within the data. A program written in Python is used to analyse patient data in a hospital for five years, from 2018 to 2022. These findings are then interpreted within the context of public health implications, considering factors such as disease prevalence, socioeconomic determinants, and healthcare utilisation patterns. The results of the data analysis provide valuable insights into the public health implications of hospital patient data. The research also covers predictions for the patient data to the hospital based on disease, age, and geographical residence. The research prediction shows that, in the year 2023, the number of patients will not be considerably affected by the infection, but in March to April 2024 the number will increase significantly up to 10,000 patients due to the trend in the previous year at the end of 2022. These recommendations encompass targeted prevention strategies, improved healthcare delivery models, and community engagement initiatives. The research emphasises the importance of collaboration between healthcare providers, policymakers, and community stakeholders in implementing and evaluating these interventions.
1. Introduction
Public health is an important field in optimising the quality of life and overall well-being of a community. The approach is to prevent diseases, improve health, and reduce health disparities in society through various well-planned interventions, policies, and programmes. In the effort to achieve these goals, health data become a crucial element in identifying health challenges, measuring the impacts of interventions and informing policy decision making. One promising source of data is hospital patient data. These data include detailed information about patients, including medical diagnoses, treatments provided, length of hospital stay, and treatment outcomes. With a deep understanding of these data, we can analyse health trends, identify pressing health issues, evaluate treatment effectiveness, and identify high-risk population groups. During the 2018–2022 period, hospital patient data became more affordable and easily accessible due to the advances in information technology and health information systems [1]. These data are now documented electronically and available in large and heterogeneous amounts. The utilisation of hospital patient data to inform public health policies and interventions has great potential to enhance the effectiveness and efficiency of health efforts.
Several studies have explored the benefits of hospital patient data in the context of public health; however, challenges need to be overcome to maximise their potential. First, hospital patient data from 2018 to 2022 may encompass various medical record systems that are not always standardised, leading to complexity and difficulties in data integration and analysis due to the COVID-19 pandemic, which during the years 2020 to 2022 saw human movement control. Second, previous research has not fully optimised the utilisation of advanced data analysis techniques, such as cluster analysis and machine learning, to gain deeper insights from the available patient data in hospitals. Third, hospital patient data may only reflect populations seeking medical care, limiting information about populations not accessible to the formal healthcare system. Therefore, this research aims to address these challenges by conducting a comprehensive and in-depth analysis of hospital patient data from 2018 to 2022, with a focus on implications for public health and more effective interventions. The objective of the research analysing hospital patient data related to public health is to identify patterns, trends, and risk factors related to specific health issues within the patient population. In analysing patient data, this research aims to understand the geographic distribution of health problems, disease prevalence, and characteristics of populations more vulnerable to certain health conditions. The information generated from this research is expected to provide in-depth insights into existing public health challenges, thus aiding in formulating and designing more effective and targeted health interventions. The objectives of this research also include the use of data to support better clinical decision making and a more holistic understanding of public health in specific regions. By extracting information from hospital patient data, this research is expected to contribute positively to disease prevention efforts, improve the quality of healthcare, and develop more effective health policies for the overall community.
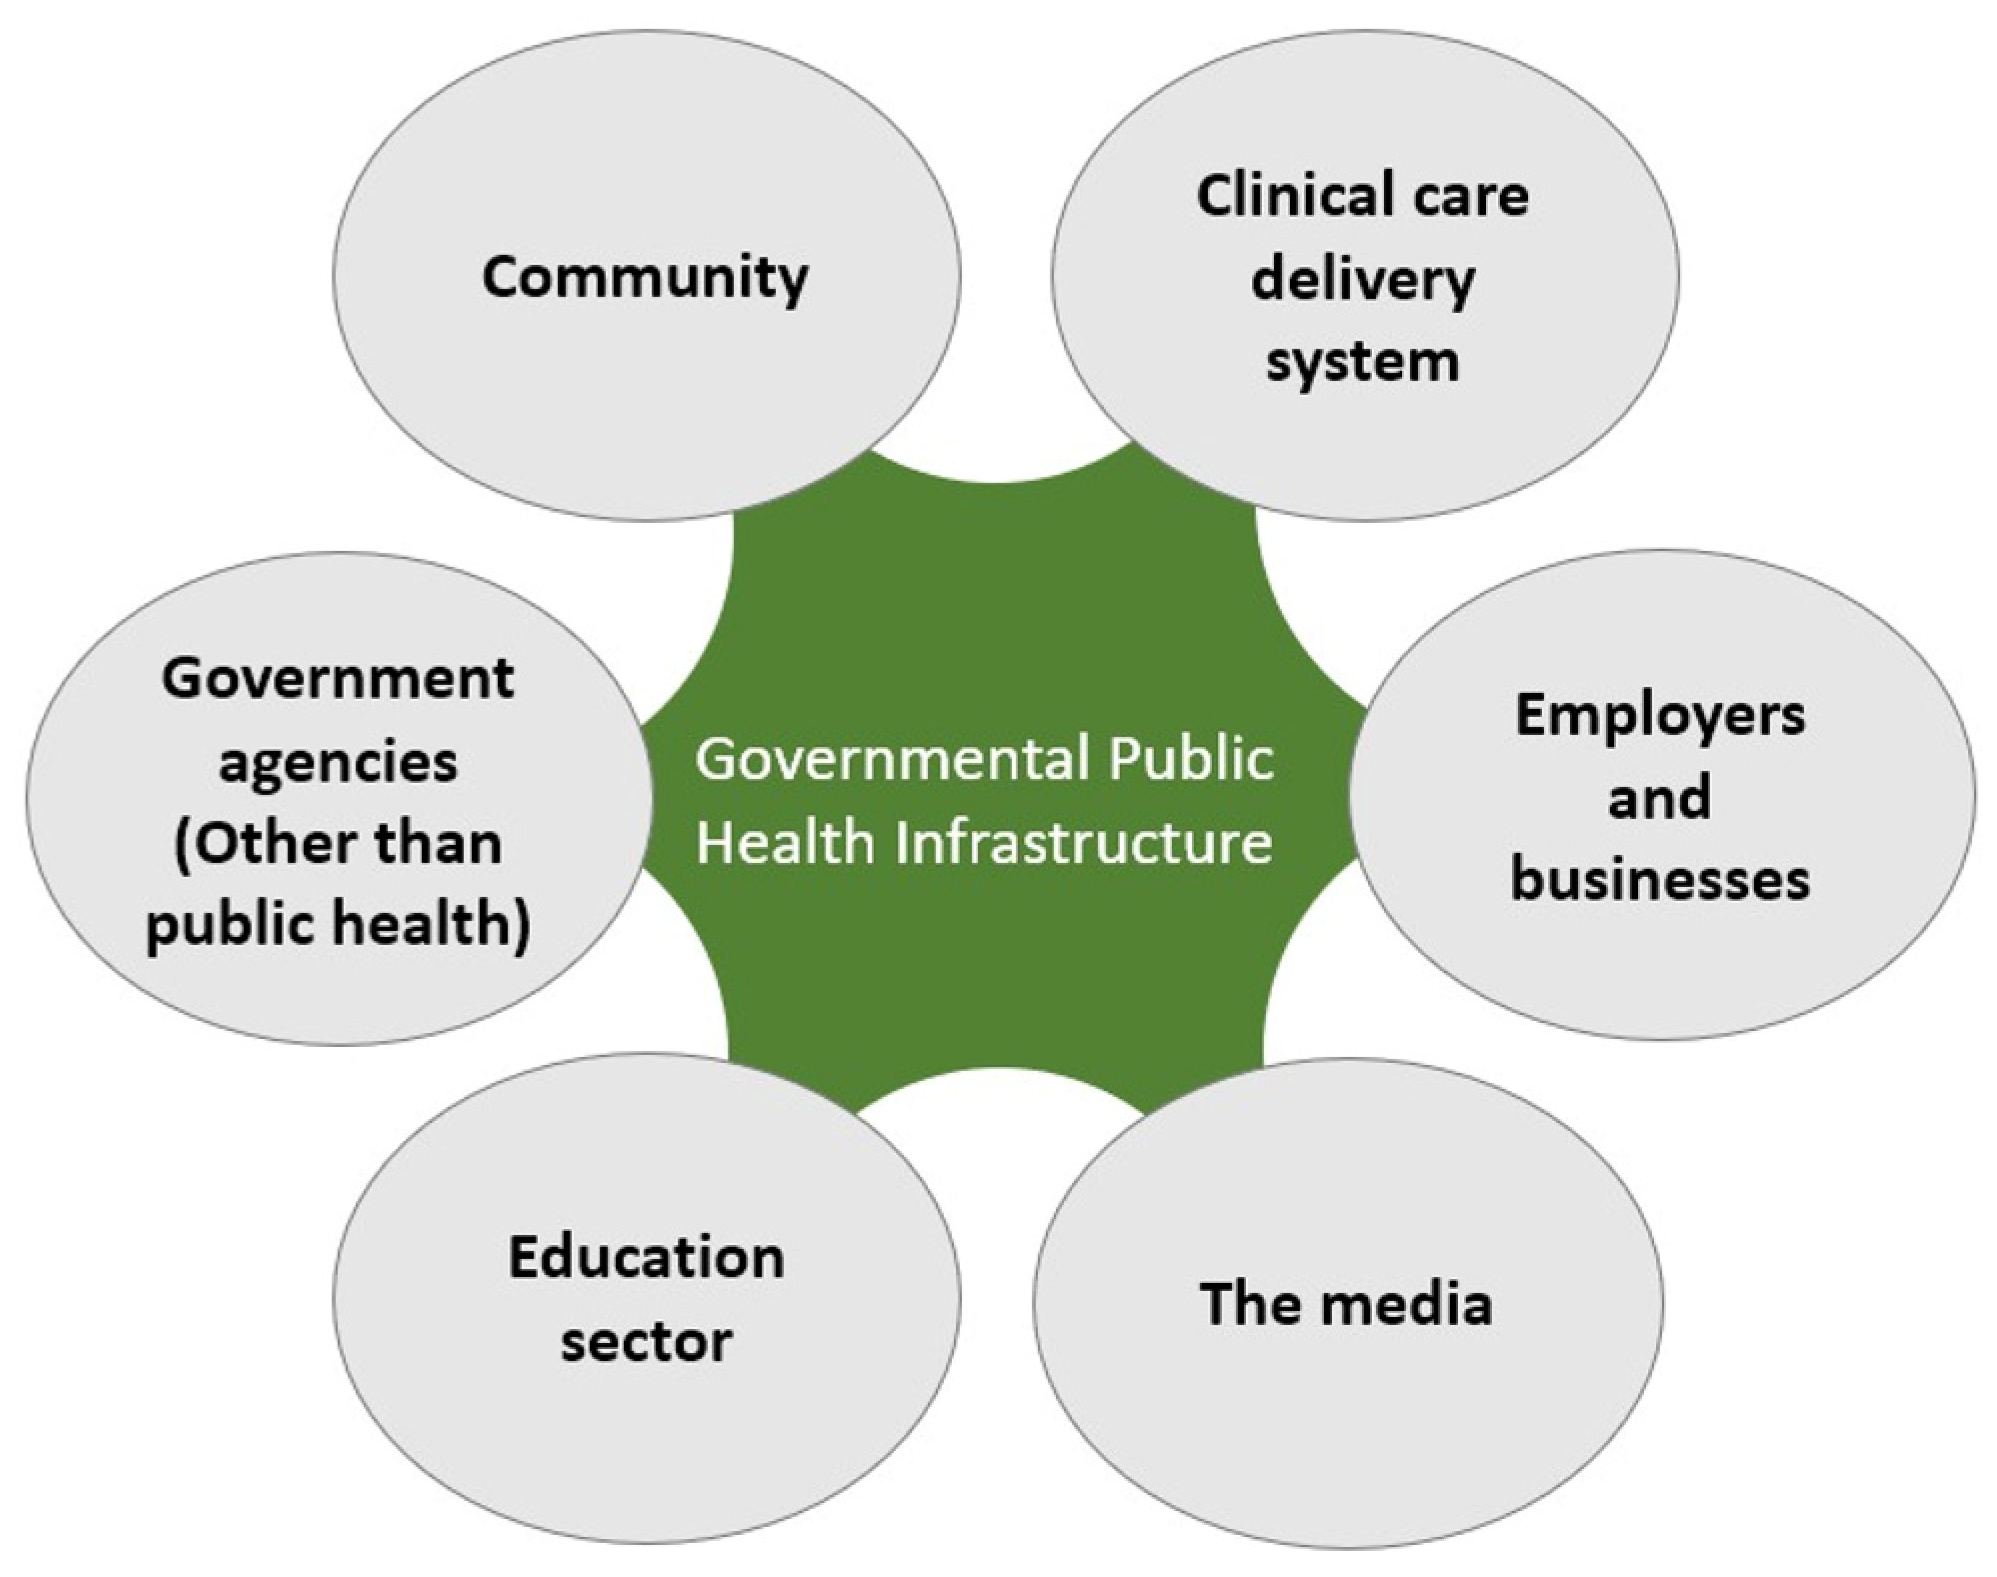
The overall aim of the research analysing hospital patient data related to public health is to gain in-depth insights into various aspects of public health based on existing data in electronic medical records. This work analyses patient data collected from different regions and populations to identify patterns, trends, and risk factors related to the health issues under investigation. Through data analysis, this research is expected to yield important information about the disease prevalence, geographic distribution of health problems, and characteristics of populations vulnerable to specific health conditions. The results of this research can contribute to a better understanding of public health challenges, aid in designing more effective health interventions, and support improved clinical decision making. The research analysing hospital patient data is also directed towards supporting disease prevention efforts, evidence-based health policy development, and the overall improvement of healthcare service quality, with the ultimate goal of enhancing the health and well-being of a community at large. The general objective of research analysing hospital patient data related to public health is to gain in-depth insights into various aspects of public health based on existing data in electronic medical records. This analyses patient data collected from different regions and populations to identify patterns, trends, and risk factors related to the health issues being investigated. In conducting data analysis, this research is expected to produce important information regarding the disease prevalence, geographic distribution of health problems, and characteristics of populations vulnerable to specific health conditions. The findings can contribute to an enhanced understanding of public health challenges, aid in designing more effective health interventions, and support improved clinical decision making. Additionally, the research analysing hospital patient data is also directed towards supporting disease prevention efforts, evidence-based health policy development, and overall improvement of healthcare service quality, with the ultimate goal of enhancing the health and well-being of a community at large. Figure 1 shows how the relationship of public health to several segments that have an impact on the community and individual or family support structures [1].
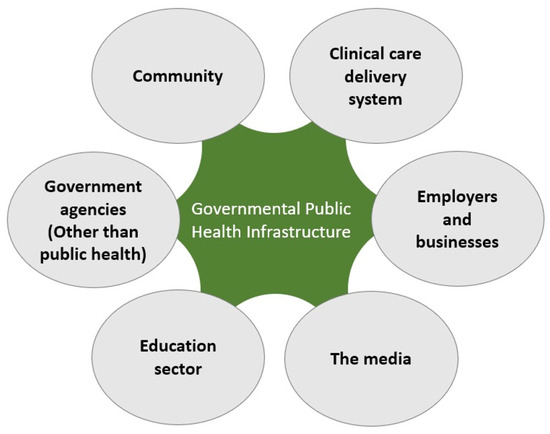
Figure 1.
A sample model relationship of public health.
In achieving these objectives, this research is expected to provide valuable contributions to evidence-based health policy development and enhance the effectiveness of public health interventions. With a deeper understanding of public health and its implications for interventions, we hope that public health efforts can be more targeted and have a positive impact on improving the overall quality of life and well-being of a community.
2. Literature Review
The study of public health includes the analysis of factors influencing the health of populations, disease prevention efforts and health promotion, as well as the development and evaluation of evidence-based health interventions. The work is an essential aspect in achieving the goals of sustainable development, which are centred around improving global health and well-being [2]. The study of public health faces complex and varied challenges. Global health issues, such as infectious diseases, non-communicable diseases, reproductive health, and health inequalities, require holistic and evidence-based interventions. Efforts in public health research include improving the access to and quality of healthcare services, health promotion and prevention, research and development of innovations, community-based interventions, and global collaboration. To address these challenges, the study of public health plays a crucial role in improving the health and well-being of communities worldwide [3,4]. Public health in Indonesia is an essential aspect of national development and the well-being of society. The research and efforts of community health in Indonesia involve various aspects, including disease prevention efforts, health promotion, improving access to healthcare services, and the management of healthcare resources. As an archipelagic country with cultural and geographical diversity, Indonesia faces diverse and unique health challenges [5].
Mapping the patterns of the geographic distribution of diseases using hospital patient data, as discussed, can be performed through spatial approaches in public health [6]. This work highlights the importance of spatial analysis in mapping the patterns of the geographic distribution of diseases using hospital patient data. This study conducted research with a spatial analysis approach to identify specific disease hotspots within geographical areas. The study utilised hospital patient data from several hospitals in a metropolitan city to map the spatial distribution of infectious and noncommunicable diseases. The research findings indicate that spatial analysis approaches can help identify areas with high health risks and guide public health policies in effectively allocating resources. The contributing factors to health disparities among population groups have been analysed using data from hospitals [7,8]; in other words, an analysis using hospital patient data to identify socioeconomic factors contributing to variations in health outcomes among population groups was conducted. The study includes patient data from various demographic and economic groups. The research findings indicate that income level, educational attainment, and healthcare accessibility are some of the significant factors influencing public health outcomes. The work provides important insights into the socioeconomic aspects that need to be considered in designing public health interventions focusing on high-risk groups.
Evaluating the effectiveness of public health interventions based on patient data available in hospitals [9,10,11]: In this article, the effectiveness of several public health interventions conducted based on hospital patient data was evaluated. The study also compares treatment outcomes between the intervention group and the control group for some critical diseases. The research shows that some interventions have a significant impact on reducing readmission rates to the hospital and improving health outcomes. The results of this evaluation provide valuable guidance for healthcare decision makers in designing and implementing more effective interventions that have a positive impact on public health. Advanced data analysis techniques have been used in analysing data from available hospital patient records [12,13]. The utilisation of advanced analysis techniques, particularly machine learning, in analysing hospital patient data is explored. The team has reviewed various studies that apply machine learning methods to identify patterns and trends in hospital patient data. These studies include disease classification, health risk prediction, and the identification of high-risk population groups. This work guides the potential use of advanced analysis techniques in conducting more in-depth research on public health using hospital patient data. Hospital patient data have been used in public health research in developing countries [14,15,16]. The study conducted presents an overview of the utilisation of hospital patient data in public health in developing countries. The other articles present several studies conducted in developing countries, including the analysis of disease patterns, social and economic factors contributing to public health, and the effectiveness of public health interventions based on hospital patient data. The work provides a different perspective on understanding the potential of hospital patient data in developing countries and their relevance to health policies and interventions.
Spatial analysis has been used to enhance the quality of public health interventions [17,18,19]. This work discusses the role of spatial analysis in improving the quality of public health interventions. The article explores various studies that use spatial analysis to identify areas with high health risks, link disease patterns to environmental factors, and design more targeted interventions. The research provides insights into the benefits of spatial analysis in public health and its potential to enhance intervention effectiveness. Hospital patient data have been used to design disease prevention programmes [20,21]. The results also explore various hospital patient data to identify disease risk factors and develop more effective prevention strategies. This highlights the importance of involving hospital patient data in comprehensive and evidence-based disease prevention planning. Hospital patient data have been integrated with public health data to support integrated health policies [22,23,24]. They showed that hospital patient data should be integrated with public health data to provide a more comprehensive understanding of public health issues and aid in designing integrated, holistic, and effective health policies. The analysis of hospital patient data supports policy decision making [24,25]. Several discussions also present various examples of how hospital patient data can be utilised to identify pressing health issues, monitor the effectiveness of health policies, and inform health programme planning. The literature provides valuable insights into how the use of hospital patient data can contribute to the development of effective and positively impactful health policies [26,27].
Machine learning has been used in analysing hospital patient data to enhance early disease detection and treatment [28], for which various examples of research are given that utilise machine learning algorithms to identify complex disease patterns, predict individual health risks, and assist in making more accurate clinical decisions. This work guides the potential of machine learning in enhancing healthcare diagnosis and treatment. Information technology has been applied in processing hospital patient data for public health [29,30,31]. This article highlights the application of information technology in the processing of hospital patient data for public health purposes. This study illustrates how integrated health information systems can be utilised to efficiently collect, store, and analyse hospital patient data. This work guides how the implementation of information technology can enhance the accessibility and quality of health data to support public health policies and interventions. The benefits of hospital patient data in supporting epidemiological research have been discussed in the literature [32,33]. The benefits of hospital patient data in supporting epidemiological research are discussed. The research team presents examples of studies that utilise hospital patient data to identify epidemiological trends, track the spread of infectious diseases, and inform public health interventions. The article provides insights into the potential of hospital patient data in supporting epidemiological research and overall public health.
Considering the diversity of the literature, the present study can strengthen the foundation of the knowledge and analysis methods used in understanding public health patterns, identifying factors contributing to health outcome variations and evaluating the effectiveness of public health interventions based on hospital patient data. This study can delve deeper into the use of hospital patient data, the role of information technology, and the application of machine learning techniques in supporting public health research. This research can provide a strong basis for optimising the utilisation of hospital patient data.
3. Methodology
The research methodology in public health serves as a strong foundation for data collection, information analysis, and decision making related to public health and well-being. One of the approaches used is a public health research plan (PHRP). This approach allows researchers to plan and conduct systematic, comprehensive research focused on relevant public health issues, especially during pandemics or major disease cases, after which preventive action has a guide for being enacted.
- Planning phase: In the planning phase of a PHRP, researchers will determine specific, relevant, and significant research topics in the context of public health. Here, research objectives must be clearly defined, and the research questions to be answered through the study must be formulated.
- Identifying scope and target population: Researchers must thoroughly understand the research scope and the population to be studied. In this regard, a PHRP requires identifying the health issues to be investigated and determining the relevant target population. Understanding the characteristics of this population is essential in designing data collection and analysis strategies.
- Data collection and measurement methods: After identifying the scope and target population, researchers need to plan appropriate data collection methods to gather the necessary information. Data collection methods may include surveys, interviews, observations, or the use of secondary data. Researchers also need to design valid and reliable measurement instruments with which to consistently collect data.
- Data analysis: Once data are collected, the data analysis phase becomes crucial in a PHRP. The collected data need to be analysed using appropriate statistical techniques to answer research questions. Data analysis helps identify patterns, relationships, and public health trends relevant to the research topic.
- Interpretation of results and implications for public health: After completing data analysis, researchers must interpret the research results carefully. Research findings should be connected back to the research objectives and research questions to draw valid and meaningful conclusions. Furthermore, the implications of research results for public health need to be clarified to make a real contribution to addressing existing health issues.
- Development of health interventions and policies: Based on research findings, a PHRP allows researchers to design evidence-based health interventions and policies. Consequently, research results can contribute to improving the quality and effectiveness of public health programmes.
The PHRP approach is a systematic research methodology for examining various relevant public health issues. Through this method, researchers can plan and conduct research with clear objectives, identify public health problems and formulate research questions that can be answered with appropriate methods. The research results can contribute to informing evidence-based public health policies and interventions, thereby enhancing overall public health and well-being.
3.1. Data Collection
The use of electronic systems or computers in patient data collection at hospitals, also known as electronic health records (EHRs), has become a common practice in healthcare. This system allows hospitals to store and access patient information digitally, improving data efficiency, accuracy, and interoperability. The process of patient data collection at hospitals using electronic systems or computers is as follows:
- Patient registration: The data collection process begins when patients come to the hospital for registration. Registration staff enter patient identification data, such as name, address, date of birth, and contact number, into the electronic system. This information serves as the starting point for creating a patient’s electronic health record.
- Medical history: Next, doctors or nurses will conduct a medical history interview to gather a patient’s health history. This includes complaints, past medical conditions, family history, allergies, and other relevant information. The collected data will be input into a patient’s EHR.
- Test results: When patients undergo physical examinations or diagnostic tests, the results will be uploaded onto the electronic system; for example, laboratory test results, radiology results, and other diagnostic test results will be recorded in a patient’s EHR digitally.
- Treatment notes: During a patient’s hospitalisation, daily treatment notes will be input into the electronic system. These notes include information about a patient’s condition, medical procedures performed, medications administered, and health progress during treatment.
- Specialist consultations: If necessary, patients may have consultations with specific specialists. The results of these consultations will also be uploaded onto a patient’s EHR, allowing the attending doctor to access this information.
- Electronic health record: All collected data, including medical history, test results, treatment notes, and specialist consultations, will be stored in a patient’s EHR. The EHR is integrated, enabling doctors and other medical staff to easily access and update the patient’s medical information.
- Data security: EHR systems must be secured to protect patient medical information. Only authorised medical personnel have access to patient data, and the data must be encrypted to prevent unauthorised access.
Table 1 shows that using EHRs makes patient data collection at hospitals more efficient and accurate. Electronically collected data can be easily accessed by medical teams, facilitating precise clinical decision making and providing better as well as safer patient care. This system also allows hospitals to integrate data and track patients’ complete health history, which are crucial for providing continuous and holistic care. The total number of patients was recorded within four years, resulting in more than 80,000 patients with complete data for analysis.

Table 1.
Patient indicator data from hospital records (1).
In this patient data collection, the classified ranges of patient age, from infant to senior, were as follows:
- Toddlers → (0–4 years).
- Children → (5–10 years).
- Teenagers → (11–19 years).
- Adults → (20–39 years).
- Elderly → (40–65 years).
- Seniors → (66 years and above).
3.2. Data Analysis Technique
The method of analysing patient data at hospitals using electronic data involves the utilisation of information technology, particularly the EHR system. Electronic data allow hospitals to collect, store, and access patient information digitally, replacing manual processes that are time-consuming and prone to errors. With the EHR system, data analysis can be carried out efficiently and accurately. Patient data, such as medical history, test results, prescriptions, and treatment notes, can be easily analysed using various statistical techniques and data visualisation. The integration of data from various hospital systems also enables more accurate as well as holistic clinical decision making and facilitates more in-depth public health research; however, patient data security and privacy must be the top priority in the use of electronic data, and appropriate data security measures must always be followed to protect patients’ personal information. The process of analysing patient data at hospitals using computer software applications involves several similar steps using the programming language Python. We will elaborate on the process of patient data analysis using computer programming, which is commonly used for data analysis and numerical processing. The steps in the process of analysing patient data at hospitals using Python programming are shown as follows (and in Figure 2):

Figure 2.
The process of analysing patient data from a hospital.
- Data collection: Patient data are collected from an EHR system or other data sources and entered into a hospital information system. Data may include clinical data such as test results, diagnoses, treatment history, and other patient information.
- Data pre-processing: Data pre-processing involves data cleaning, handling missing or invalid data, and converting the data format into a suitable form for analysis.
- Statistical analysis: All datasets provide various built-in information functions that can be used for data analysis. These functions include average, median, standard deviation, and others.
The following functions facilitate the calculation of basic statistics from numerical data:
- Data visualisation: Python also offers various types of charts and graphs that can be used to create data visualisations. Bar charts, line graphs, pie charts, and others can be used to visualise data interactively.
- Pivot table and chart: Pivots are highly useful features in Python for analysing and summarising data quickly. A pivot table allows us to arrange data in a dynamic table, while a pivot chart enables us to create charts based on the pivot table.
- Data filtering and sorting: Python programming provides filtering and sorting features that allow us to easily filter and sort data. These features help us quickly identify patterns and trends in the data.
- Data validation: To ensure valid data, we can use data validation features in the computer program. This feature allows us to set validation rules for specific data columns, ensuring that the entered data comply with these rules.
- Interpretation of results: After conducting data analysis and obtaining findings, the results must be interpreted carefully. The results of data analysis should be used to provide useful insights for clinical decision making and hospital management.
- Data security: In the data analysis process, the security of patient data must be ensured. Patient data must be kept confidential and accessed only by authorised parties.
Computer software applications are versatile and capable of analysing data from various sources, including hospital data analysis. They are simple and user-friendly while still allowing for complex data analysis; however, in inpatient data analysis, we must adhere to ethical principles and comply with privacy as well as data security regulations. In this research, referring to a hospital with many sections according to patient disease, the data and information kept in the hospital management system are supported with digital data.
3.3. Python Programming and Deep Learning Algorithms
Python is one of the most popular programming languages and has a simple syntax, developed by Guido van Rossum in 1991 [34]. Python is also equipped with several powerful libraries and frameworks, such as NumPy, Pandas, Matplotlib, and TensorFlow, which make it convenient for developers to build complex solutions and applications quickly and efficiently. Extensive Python community support also makes it a valuable resource for developers, providing numerous tutorials, documentation, and discussion forums that can help them understand and solve various programming challenges. In the era of information technology and computers, many techniques and algorithms have been developed, with good results and faster processing times.
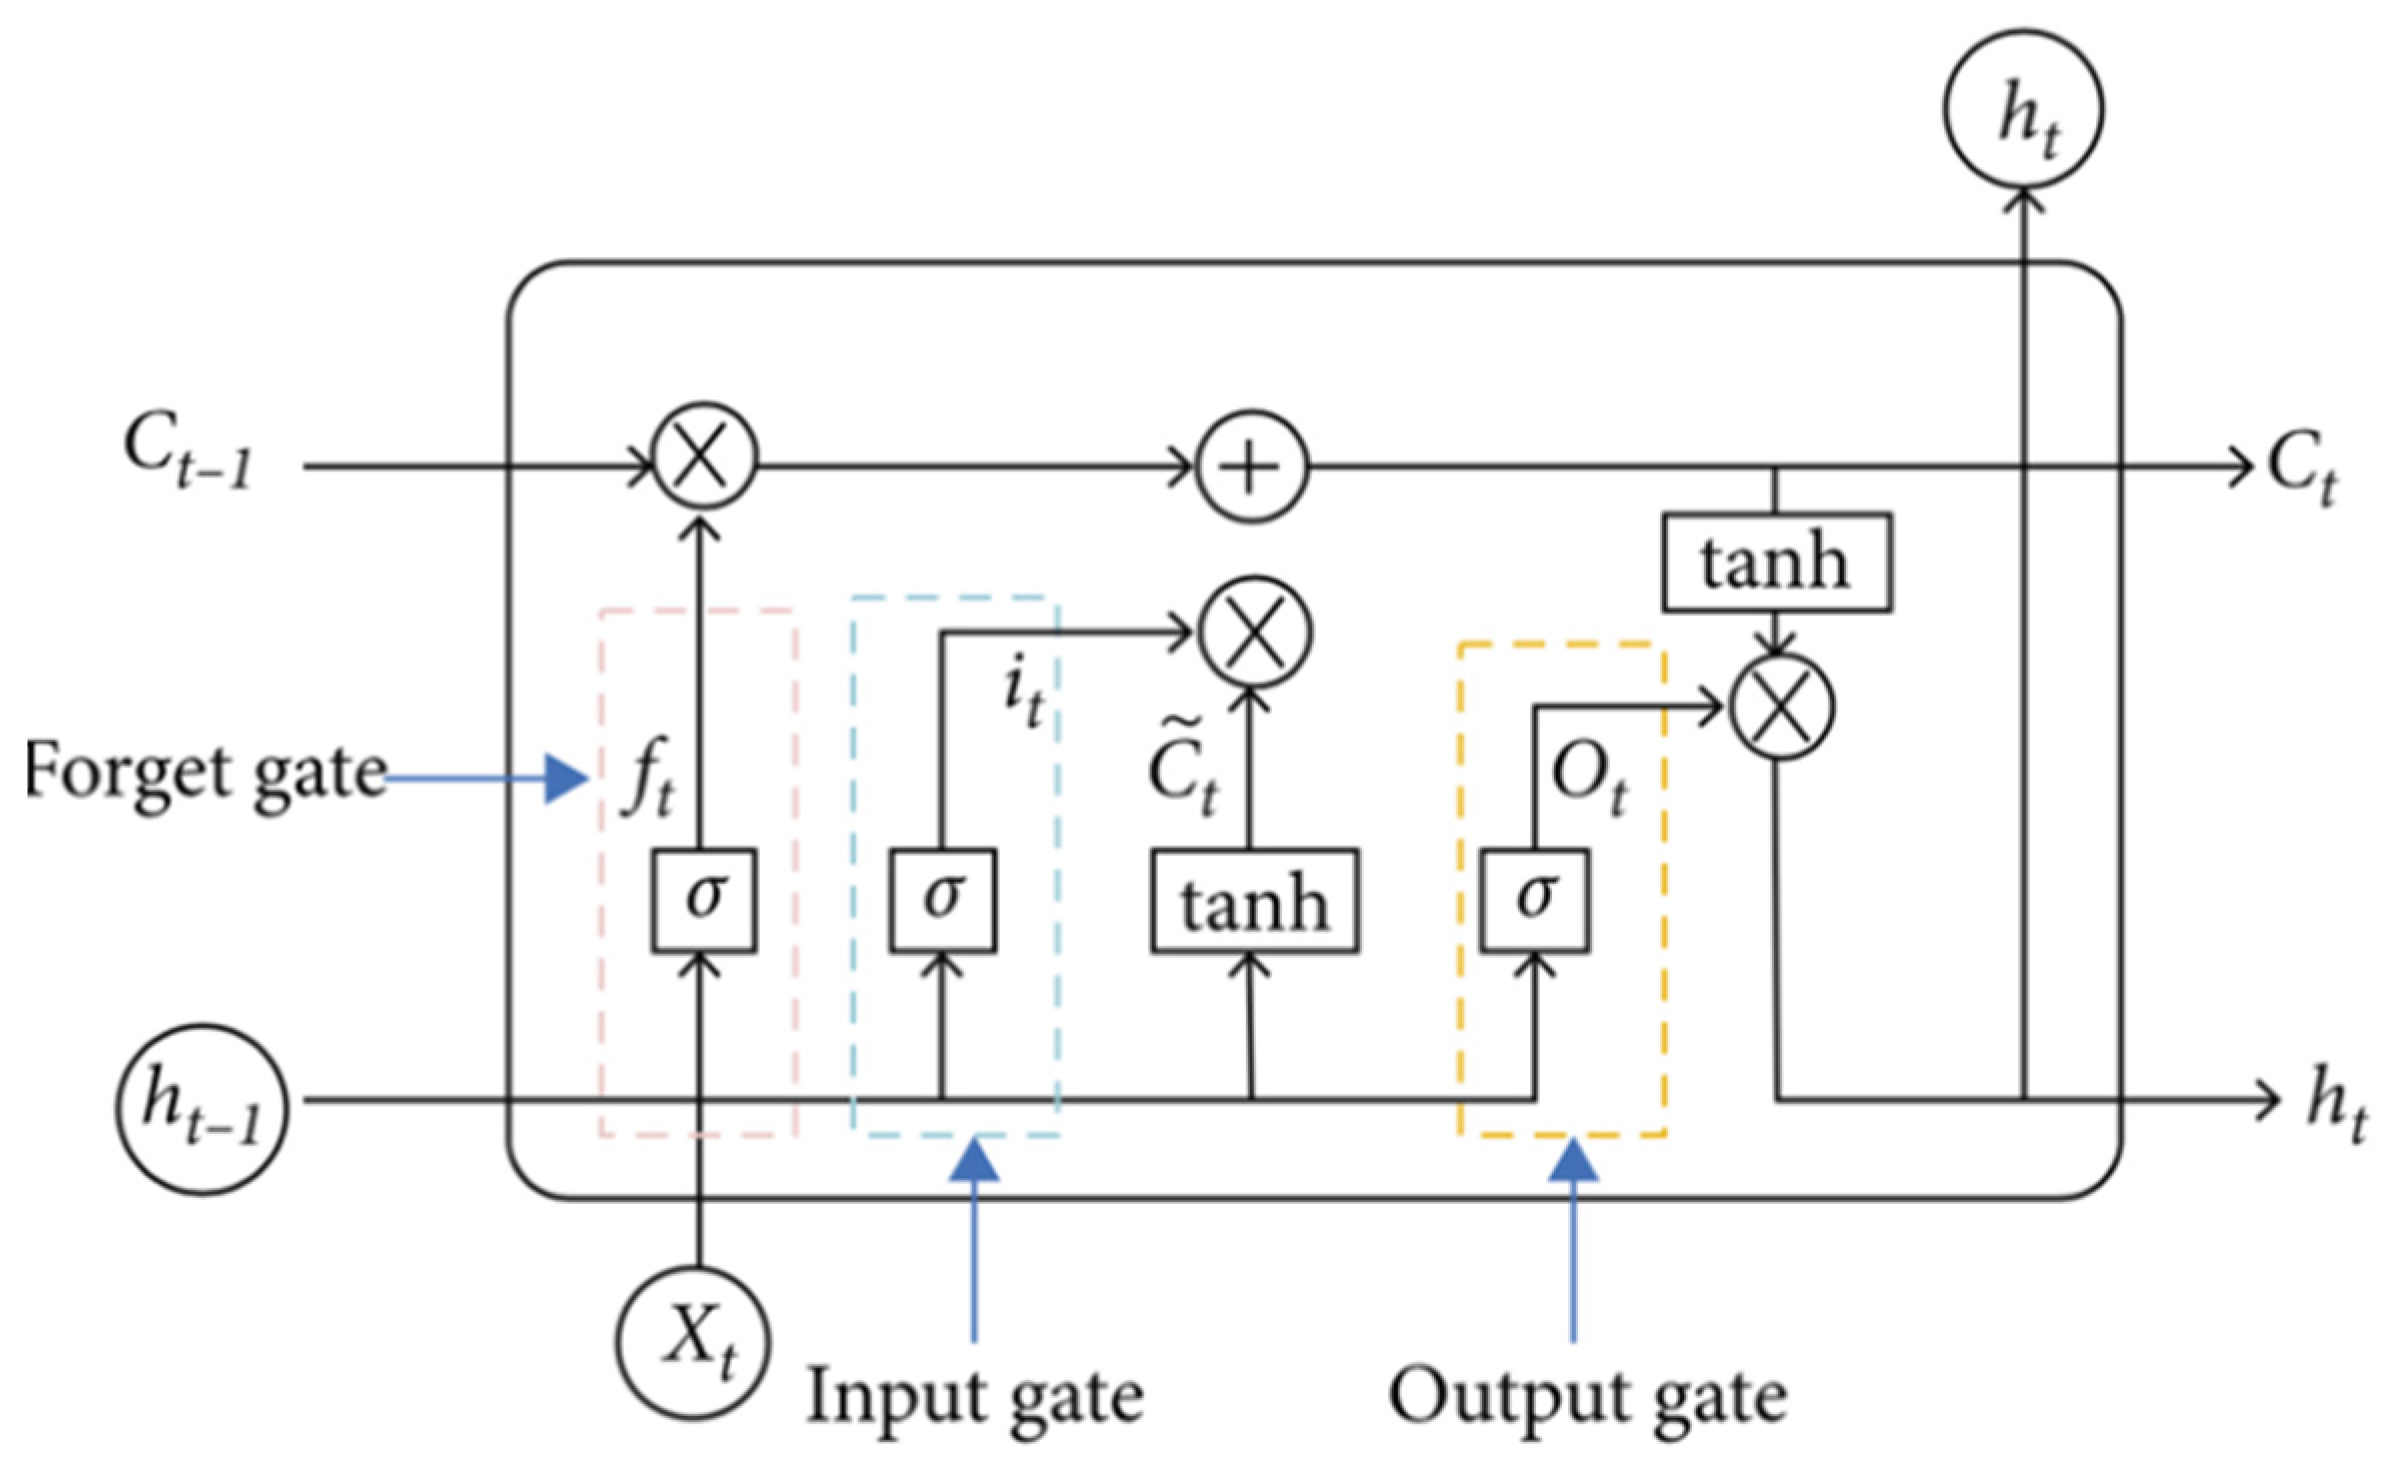
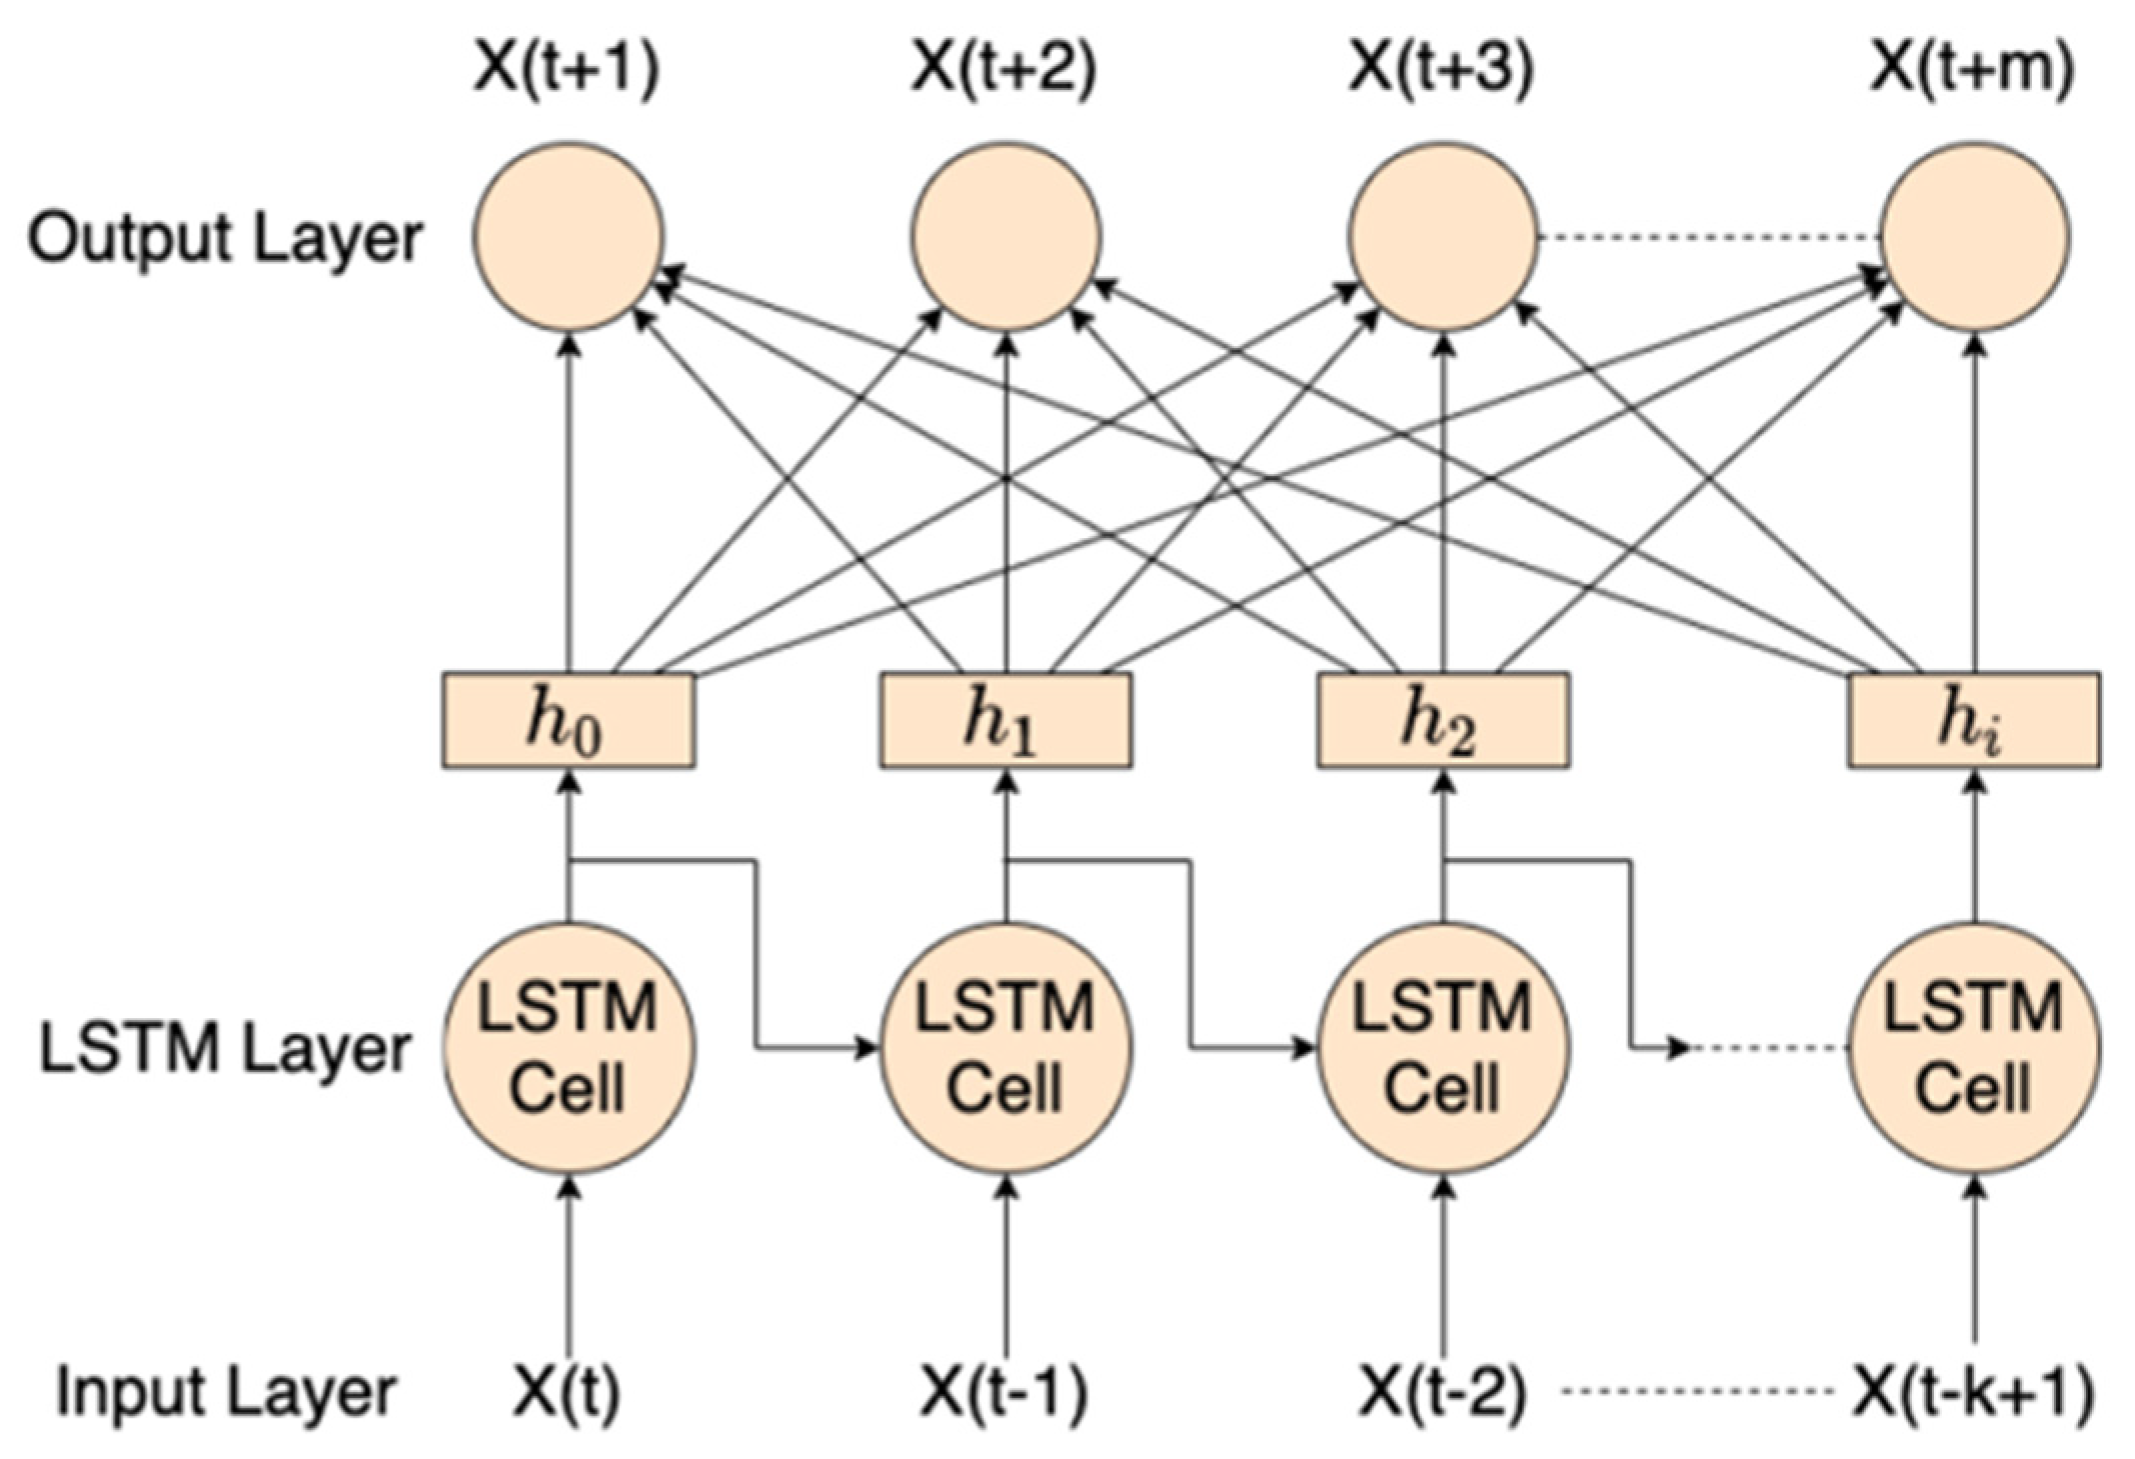
Deep learning algorithms are a method in artificial intelligence. One of the popular examples is long short-term memory (LSTM), which is an evolution of deep learning known as a recurrent neural network (RNN), first introduced by Sherstinsky [35]. The LSTM algorithm can analyse time series datasets to address problems. This algorithm is also capable of learning long-term dependencies in datasets and retaining information for extended periods by default. Figure 3 shows the basic architecture of a RNN–LSTM model, consisting of several main blocks called cells, such as the input gate, output gate, and forget gate. Figure 3 shows a sample of the RNN–LSTM algorithm structure in the Python programming application for this patient data in a hospital case.
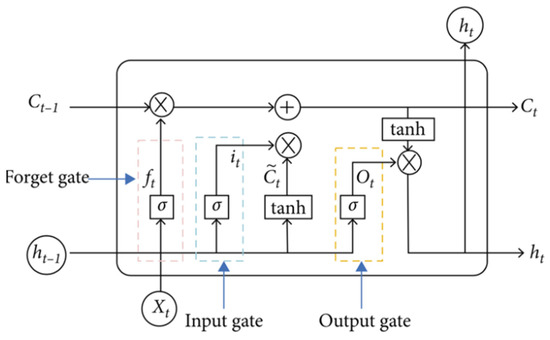
Figure 3.
Sample of RNN–LSTM algorithm structure.
An LSTM model can be elaborate as short-term memory, which acts when the information is being acquired, retains that information for a few seconds, and then destines it to be kept for longer periods or discards it. Long-term memory, which permanently retains information, allows its recovery or recall. It contains all of our autobiographical data and all of our knowledge. Referring to the architecture of the LSTM model, which consists of three major cells, the calculation of each cell and the process can be written as Equations (1)–(6), as referred to in this research and publication [32]:
The deep learning LSTM algorithm model has the ability to handle problems with long-term RNN dependencies, while some other algorithms fail to achieve accurate results due to long histories and data variations. With a large amount of data and variations, conventional algorithms cannot accurately process information stored in long-term memory, but LSTM can provide more accurate predictions based on historical information. LSTM can be applied as a default to store data in the long term. It is commonly used for predicting, processing, and classifying time series data. A prediction model is used to calculate the number of future fire points using the LSTM algorithm, and the errors need to be justified. Several models can be used for forecasting, such as mean square error (MSE) to calculate the error squared and mean average error (MAE) to calculate the average error in a dataset. An additional method is , which indicates the proportion of variance in a dataset. This method can be expressed as Equations (7)–(9) for MSE, MAE, and , respectively [33]:
where is the actual number of fire points at time i, is the predicted number of hotspots at time , and is the total number of samples in the dataset as training data, while error figures are used as regression model metrics. All of the models used to calculate errors are used to check the forecasting performance of the dataset and can be utilised for future predictions, as well as calculating the average error in the simulation.
The LSTM algorithm model has a sigmoid function from and , presenting the weight matrix and bias, respectively, for the forget gate. This process is a step to determine and decide the input dataset, which is the new information, , in the cell state, as well as to update the cell state. The next process of the sigmoid layer then determines whether the new dataset should be updated or ignored (0 or 1). The function gives weight to the values that passed by deciding their level of importance (1 to 1). Figure 4 shows the neuron process of the LSTM model [34].
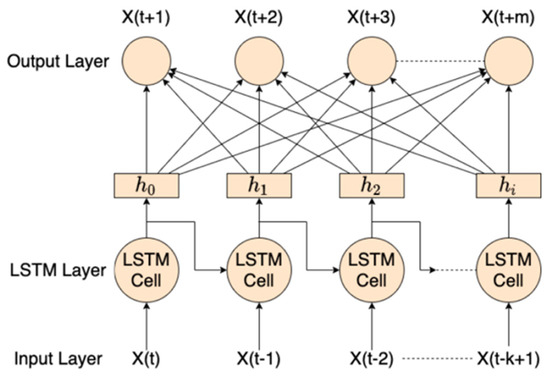
Figure 4.
LSTM algorithm for internal cells in modern neurons.
The final step is to calculate the error from the available dataset for the forecasting results to examine the percentage of error. Many techniques can be used to calculate the error. For example, root mean square error (RMSE) is one statistical-based technique that is commonly used to compare forecasts with actual data values. RMSE is often used to evaluate how accurately forecasting results fit historical data values based on the relative range of a dataset. Equation (10) explains that and present the actual hotspot dataset compared with the forecasted data at time t, is the mean actual value of the hotspot dataset, and N is the total number of data points. When the RMSE value changes from a small number to zero, it implies that the LSTM algorithm produces reliable results:
Among all of the methods for evaluating predictions or forecasting errors, RMSE and MAE evaluate based on short-term, hourly forecasts. The process of analysing patient data in a hospital using the Python computer program involves several important steps. The following are the steps in the process of patient data analysis in a hospital using Python.
3.4. Prediction Mathematical Modelling
The integration of LSTM with deep learning capability has the potential for the analysis of patient data by the permutation method, and the complex data on the hospital information system can be solved by numerical or approximate methods [36,37]. Once calculated, data simplification, calculation, and substitution can be obtained as in Equation (11):
where C and B are constants. In both sides of Equation (12), as an exponential function, L can be used to calculate the number of patient distribution data, as shown in Equation (6):
The differential equation refers to the Gompertz model of calculating human growth and development; it can be applied as a similar model to the growth of patient number visits and treatment in a hospital or medical centre, which describes the gradual contiguous rate of height with an increasing number of patients over time. Another model is the Bertalanffy model, which was proposed by the Austrian biologist and scientist Ludwig von Bertalanffy. It is a differential equation based on the growth model designed to describe the growth of a process in an institution that can comprise organisms or humans. This model assumes that the growth rate of patients with various backgrounds at different stages is influenced by several diseases during treatment. The specific differential equation of the Bertalanffy model is as follows:
where N denotes the number of patients registered in a medical centre or volumes of patients, t is the time, r is the growth rate constant, and is the final number of patients in a medical centre or hospital. This model is commonly used to describe the growth process of the number of objects in calculating the growth that has been widely used in medical data analysis or medicine, environmental science, agriculture, and other fields.
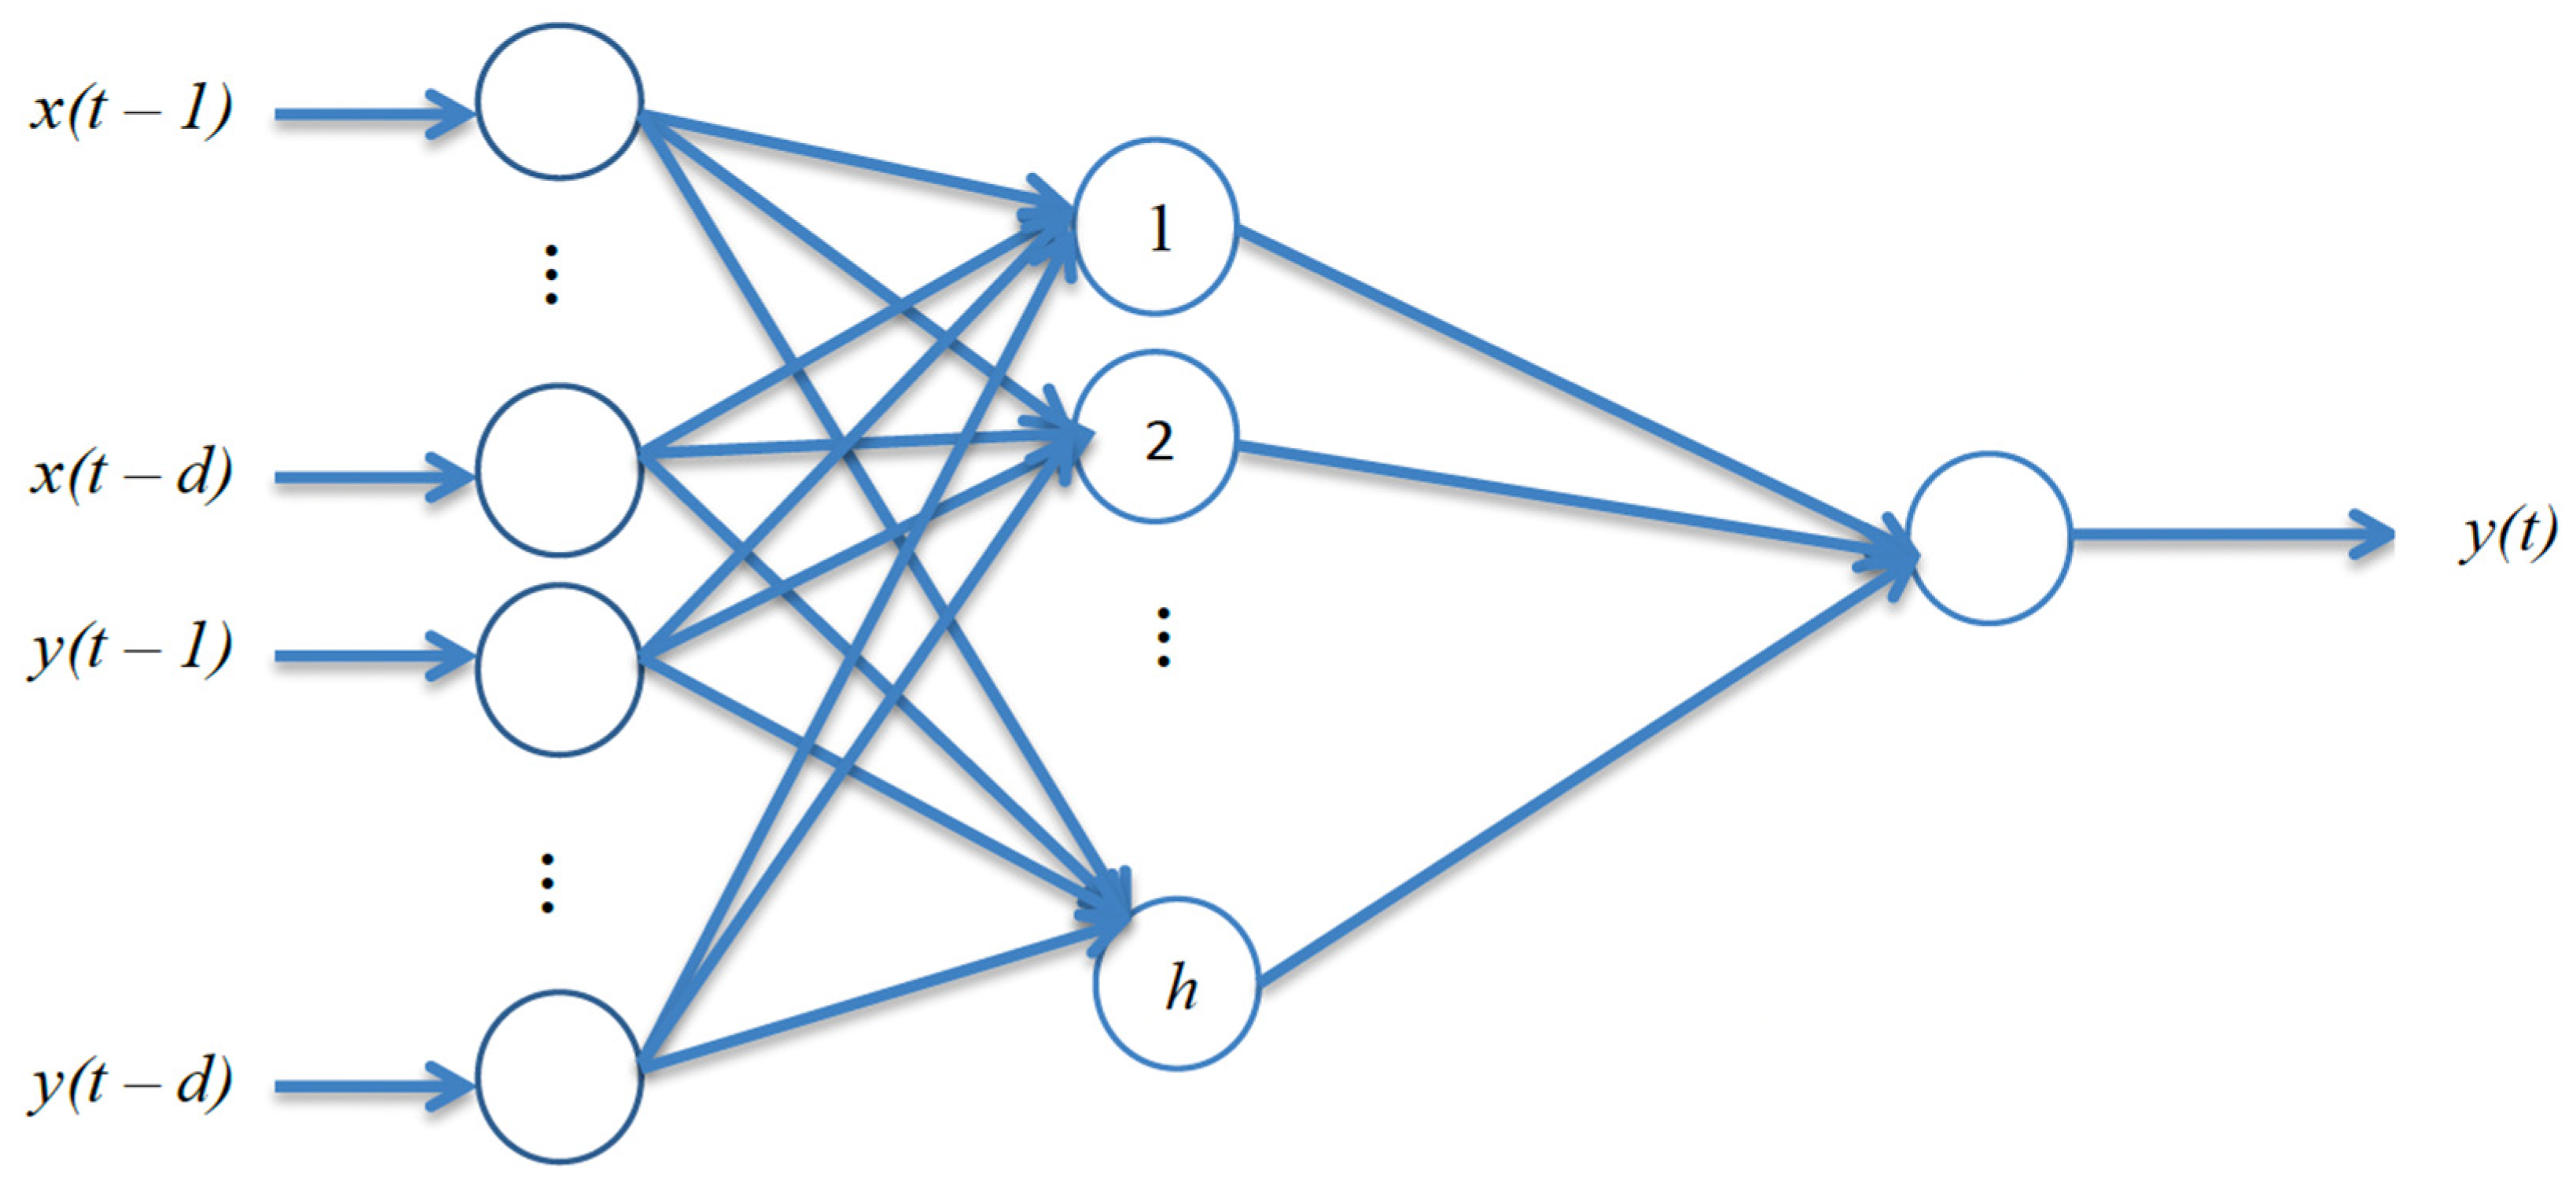
The basic concept of artificial intelligence to calculate human or patients’ data growth models takes into consideration many aspects, such as genetics, environments, clusters, and pandemics, of physical growth. These aspects can be modelled into sets to build differential equations with which to analyse and predict for the future indicators of mass pandemics and proportions of different kinds of disease. The models can also be applied to the studying of the changes in patient number development by the time points in medical centres and disease development, helping medical staff better analyse and diagnose diseases. The model has a significant impact on studying the development and prediction of disease infections in a community in an area. The mathematical models are very useful as a tool for predicting the growth and development of different types of environments and provide important reference information for medical scientists. Figure 5 shows a neural network model of artificial intelligence with a subset process to analyse patient data.
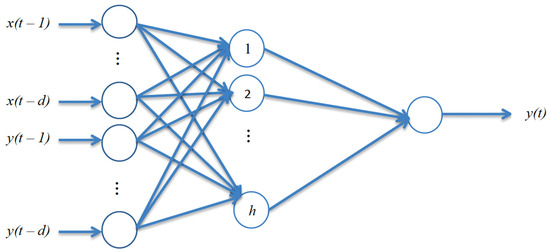
Figure 5.
The architecture of the neural network for data analysis.
The k-th input sample, x(k) = (, is randomly selected, and the corresponding expected outputs are . The input and output of each neuron in the hidden layer are calculated, and the output is calculated as Equation (14):
Then, the total error is computed as in Equation (9):
The partial derivatives of the error function to each neuron in the output layer are calculated by using the expected output of the network, then, the partial derivative of the error function to each neuron in the hidden layer is calculated by using the connection weights from the hidden layer to the output layer, , the output of the output layer, and , the output of the hidden layer [35]:
The algorithm terminates when the error reaches the present accuracy or the number of learning is greater than the pre-specified set maximum number of times as set out in Equation (10). Otherwise, we select the next learning sample as well as the corresponding expected output and return to enter the next round of learning.
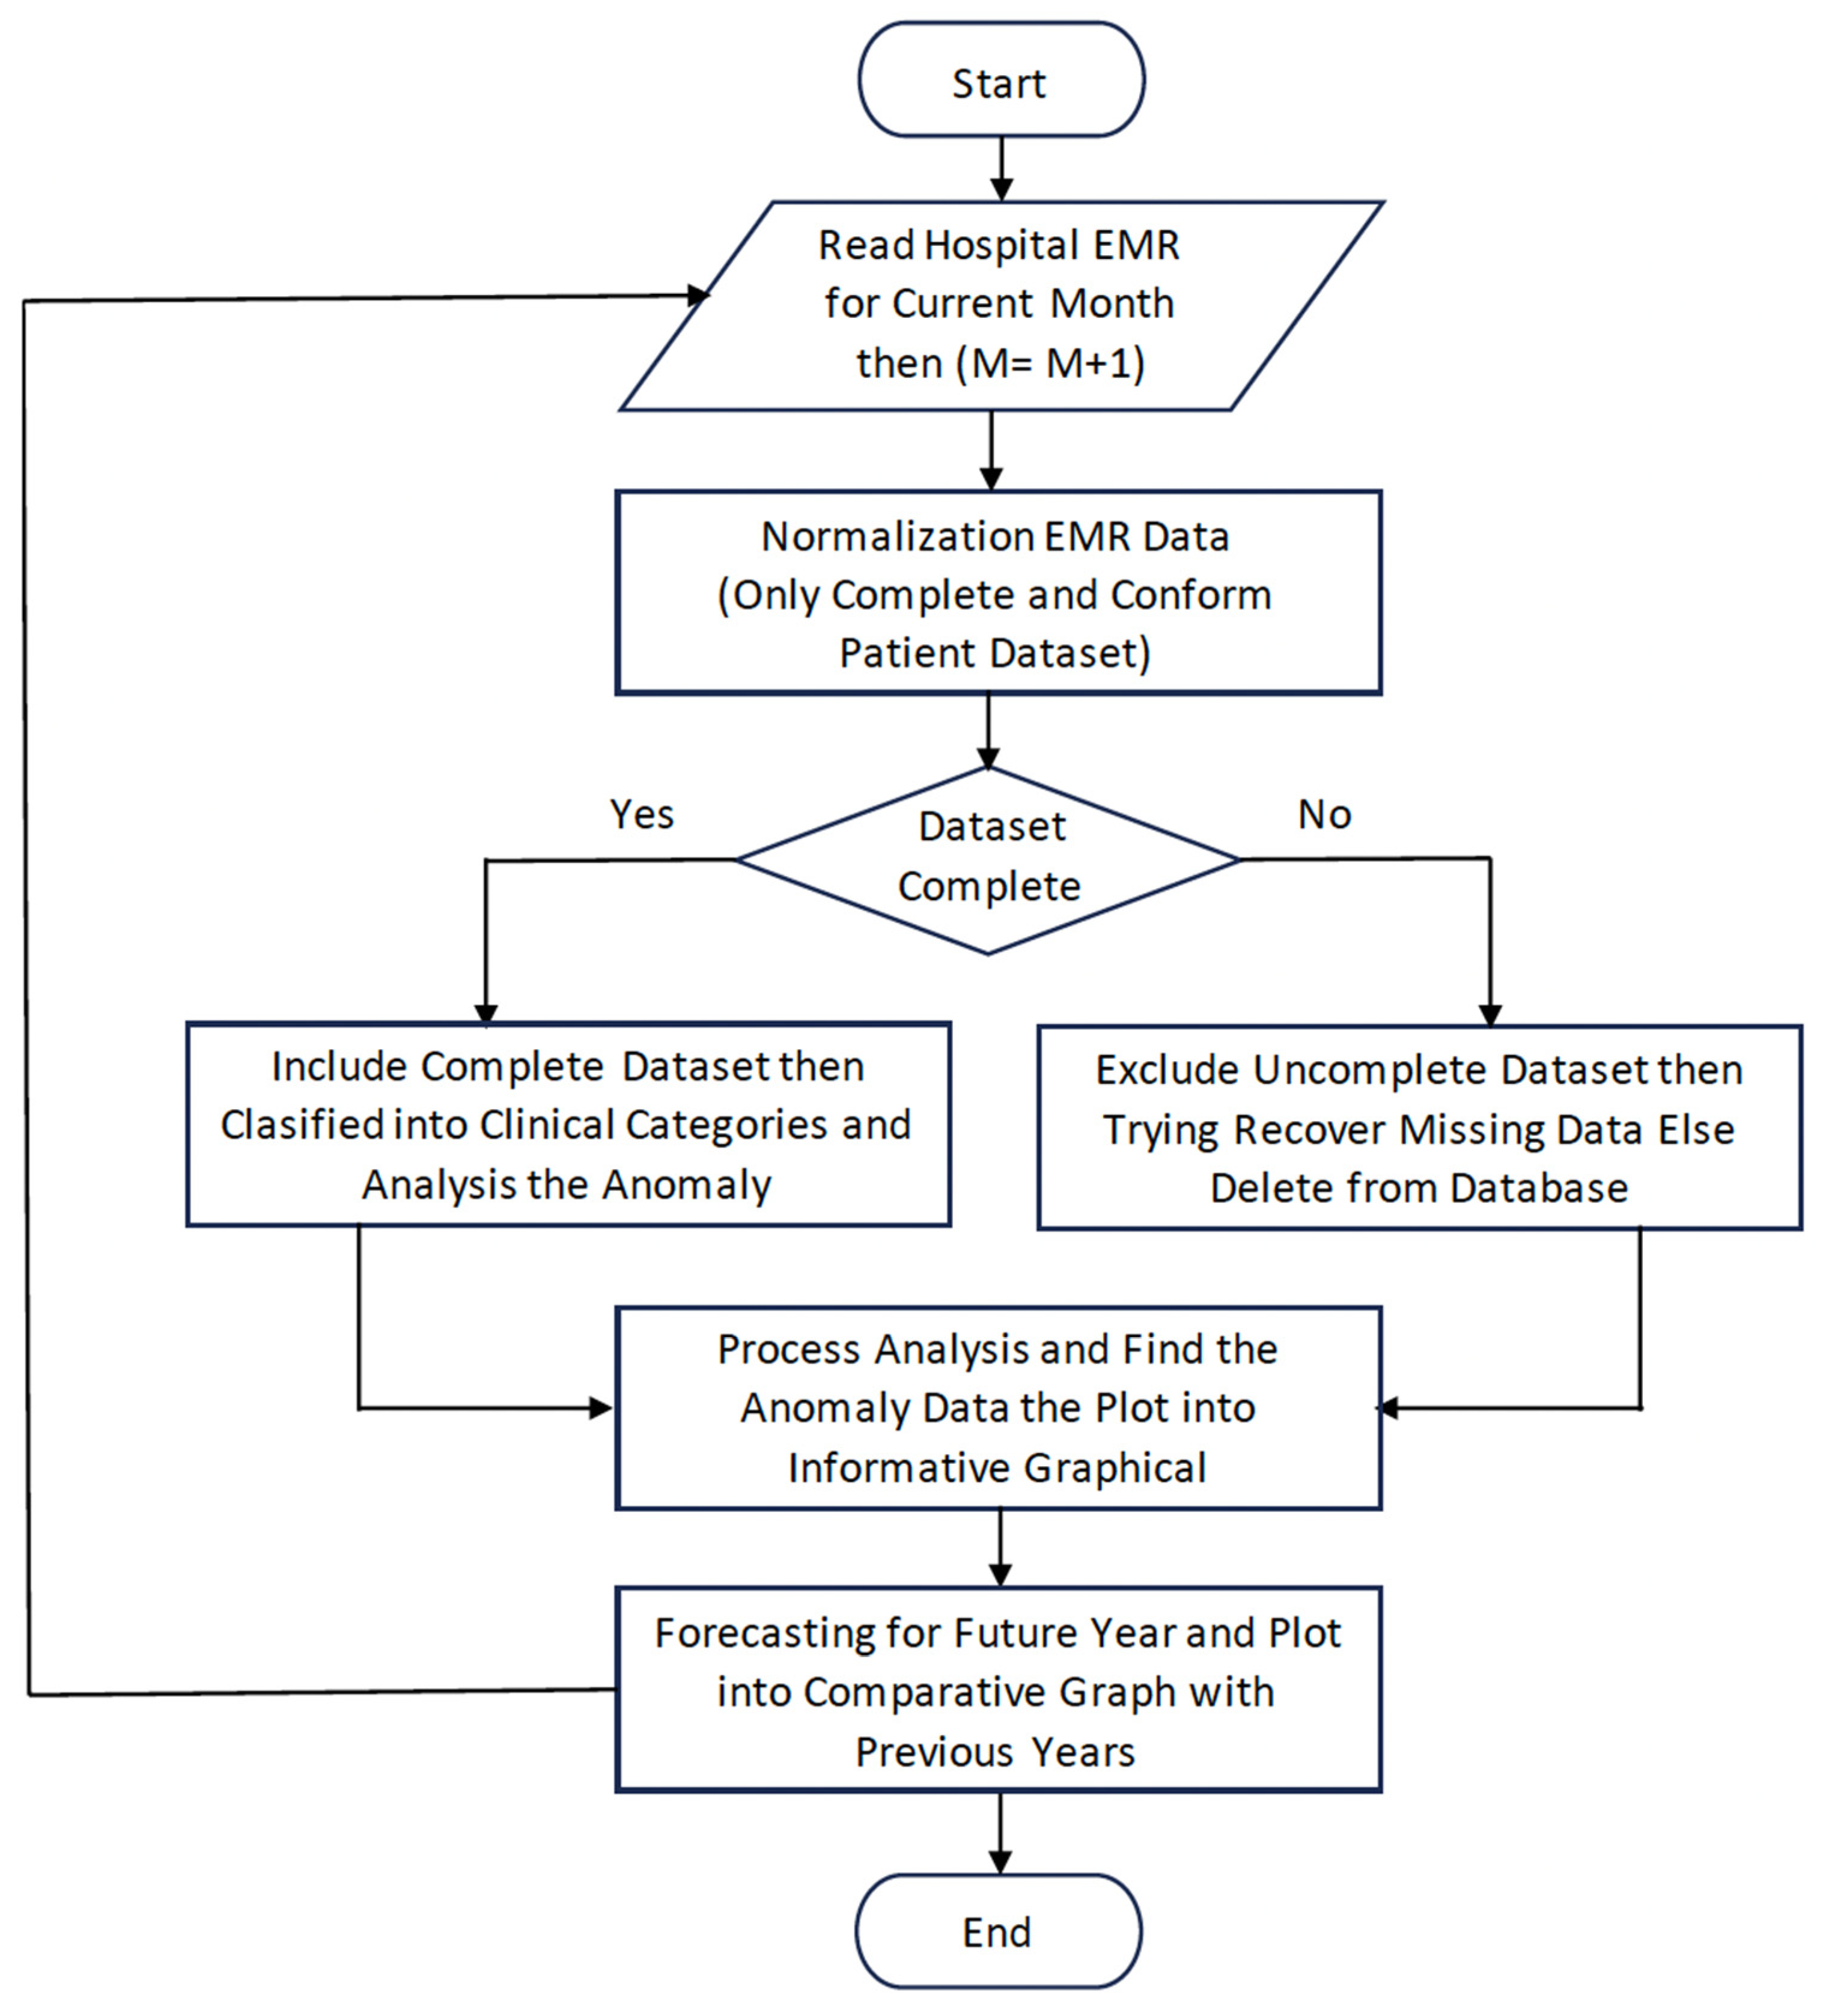
The process of retrieving electronic medical records (EMRs) from a hospital patient database involves a systematic flowchart that ensures efficient and secure access to patient information. The first step in this process is patient identification, where authorized personnel enter the system using secure login credentials. Once logged in, the system navigates to a central database where patient records are stored. The flowchart then branches into sections based on the type of information required, such as medical history, diagnostic reports, or treatment plans. Subsequently, the system validates the access rights of the user, ensuring that only authorized individuals can retrieve sensitive medical data. The flowchart includes encryption and security measures to safeguard patient confidentiality. Following this, the system retrieves the requested information and presents it to the authorized user in a comprehensible format. This comprehensive flowchart for EMR retrieval optimizes the efficiency of healthcare professionals while prioritizing the security and privacy of patient information. Figure 6 shows the flowchart of patient data retrieval, with the first step including the normalization that only valid and complete datasets transfer to the patient data analysis cloud system.
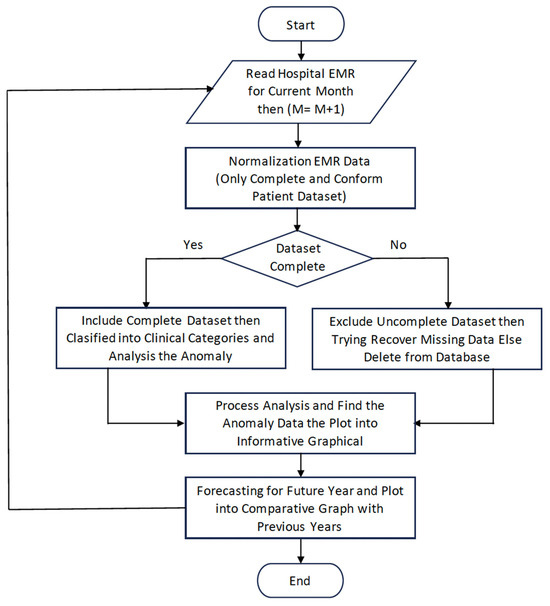
Figure 6.
Process flow of patient data retrieval with a normalization dataset.
3.5. Ethics in Health Research
Ethical considerations play a central role in public health research. When conducting health research, researchers must always prioritise the rights and well-being of research participants. First and foremost, clear and voluntary informed consent from participants should be emphasised, ensuring that they have a full understanding of the risks and benefits involved in their participation. Additionally, the confidentiality and privacy of patient data must be strictly maintained to protect the identities and personal information of participants. Special protection is also necessary for vulnerable groups, such as children and pregnant women, to minimise potential risks and ensure that the benefits outweigh them. Ethical involvement in public health research also involves the obligation to report findings with integrity and transparency, ensuring clear social benefits for the community. Public health research that adheres to these ethical considerations can significantly contribute to improving the overall health and quality of life of society.
In public health research, several important ethical considerations should be observed and respected. Examples are as follows:
- Informed consent: Research participants should be provided with clear and comprehensive information about the research’s purpose, procedures, potential benefits and risks, as well as their rights as participants. Participants should give voluntary consent after fully understanding the implications of their participation.
- Confidentiality and privacy: Participants’ personal data and information must be kept confidential. Participant identities should be securely protected, and data should be processed in a way that prevents individual identification if possible.
- Protection of children and vulnerable groups: If research involves children, pregnant women or other vulnerable groups, special measures are needed to protect them. The potential risks should be minimised and the benefits should outweigh them.
- Non-maleficence: Public health research should prioritise the principle of non-maleficence, meaning not causing harm or endangering research participants. Risks should be carefully considered and efforts made to avoid them.
- Social benefits: Public health research should provide benefits to the community as a whole. Research findings should be used to improve public health and well-being.
- Transparency and integrity: Research should be conducted with transparency and integrity. All data and findings should be disclosed honestly, without manipulation or misrepresentation.
- Commitment to safety: The safety and health of research participants should be a top priority in public health research. Preventive measures should be taken to reduce the risk of injury or illness to participants.
- Ethical approval: Before commencing research, ethical approval must be obtained from relevant ethics committees or institutions. Ethical approval ensures that the research complies with applicable ethical standards and safeguards the rights as well as well-being of research participants.
Respecting these ethical considerations in public health research is essential to maintain research integrity, public trust, and participant protection. By adhering to ethical principles, public health research can produce meaningful and beneficial results for the health and well-being of society as a whole.
4. Results and Discussion
Health data from a hospital in Indonesia reveal important information about the health profiles of patients treated at the hospital facility. These data include various variables such as a patient’s age, gender, diagnosed diseases, laboratory test results, and treatment history. The data description results show a diverse age distribution of patients, ranging from infants to the elderly, highlighting the importance of age-appropriate care for specific population groups. The health data also depict a comparison of the number of male and female patients, potentially providing insights into health conditions that may affect these gender groups differently. The most common diagnosed diseases recorded in the health data provide an overview of the disease burden faced by the hospital and the prevalent health conditions in the community in that area. The laboratory test results indicate the monitoring and in-depth evaluation of the patient’s health conditions, aiding the medical team in accurate diagnoses and appropriate treatments. Furthermore, patients’ treatment histories record medical procedures performed, medications given, and health developments during treatment.
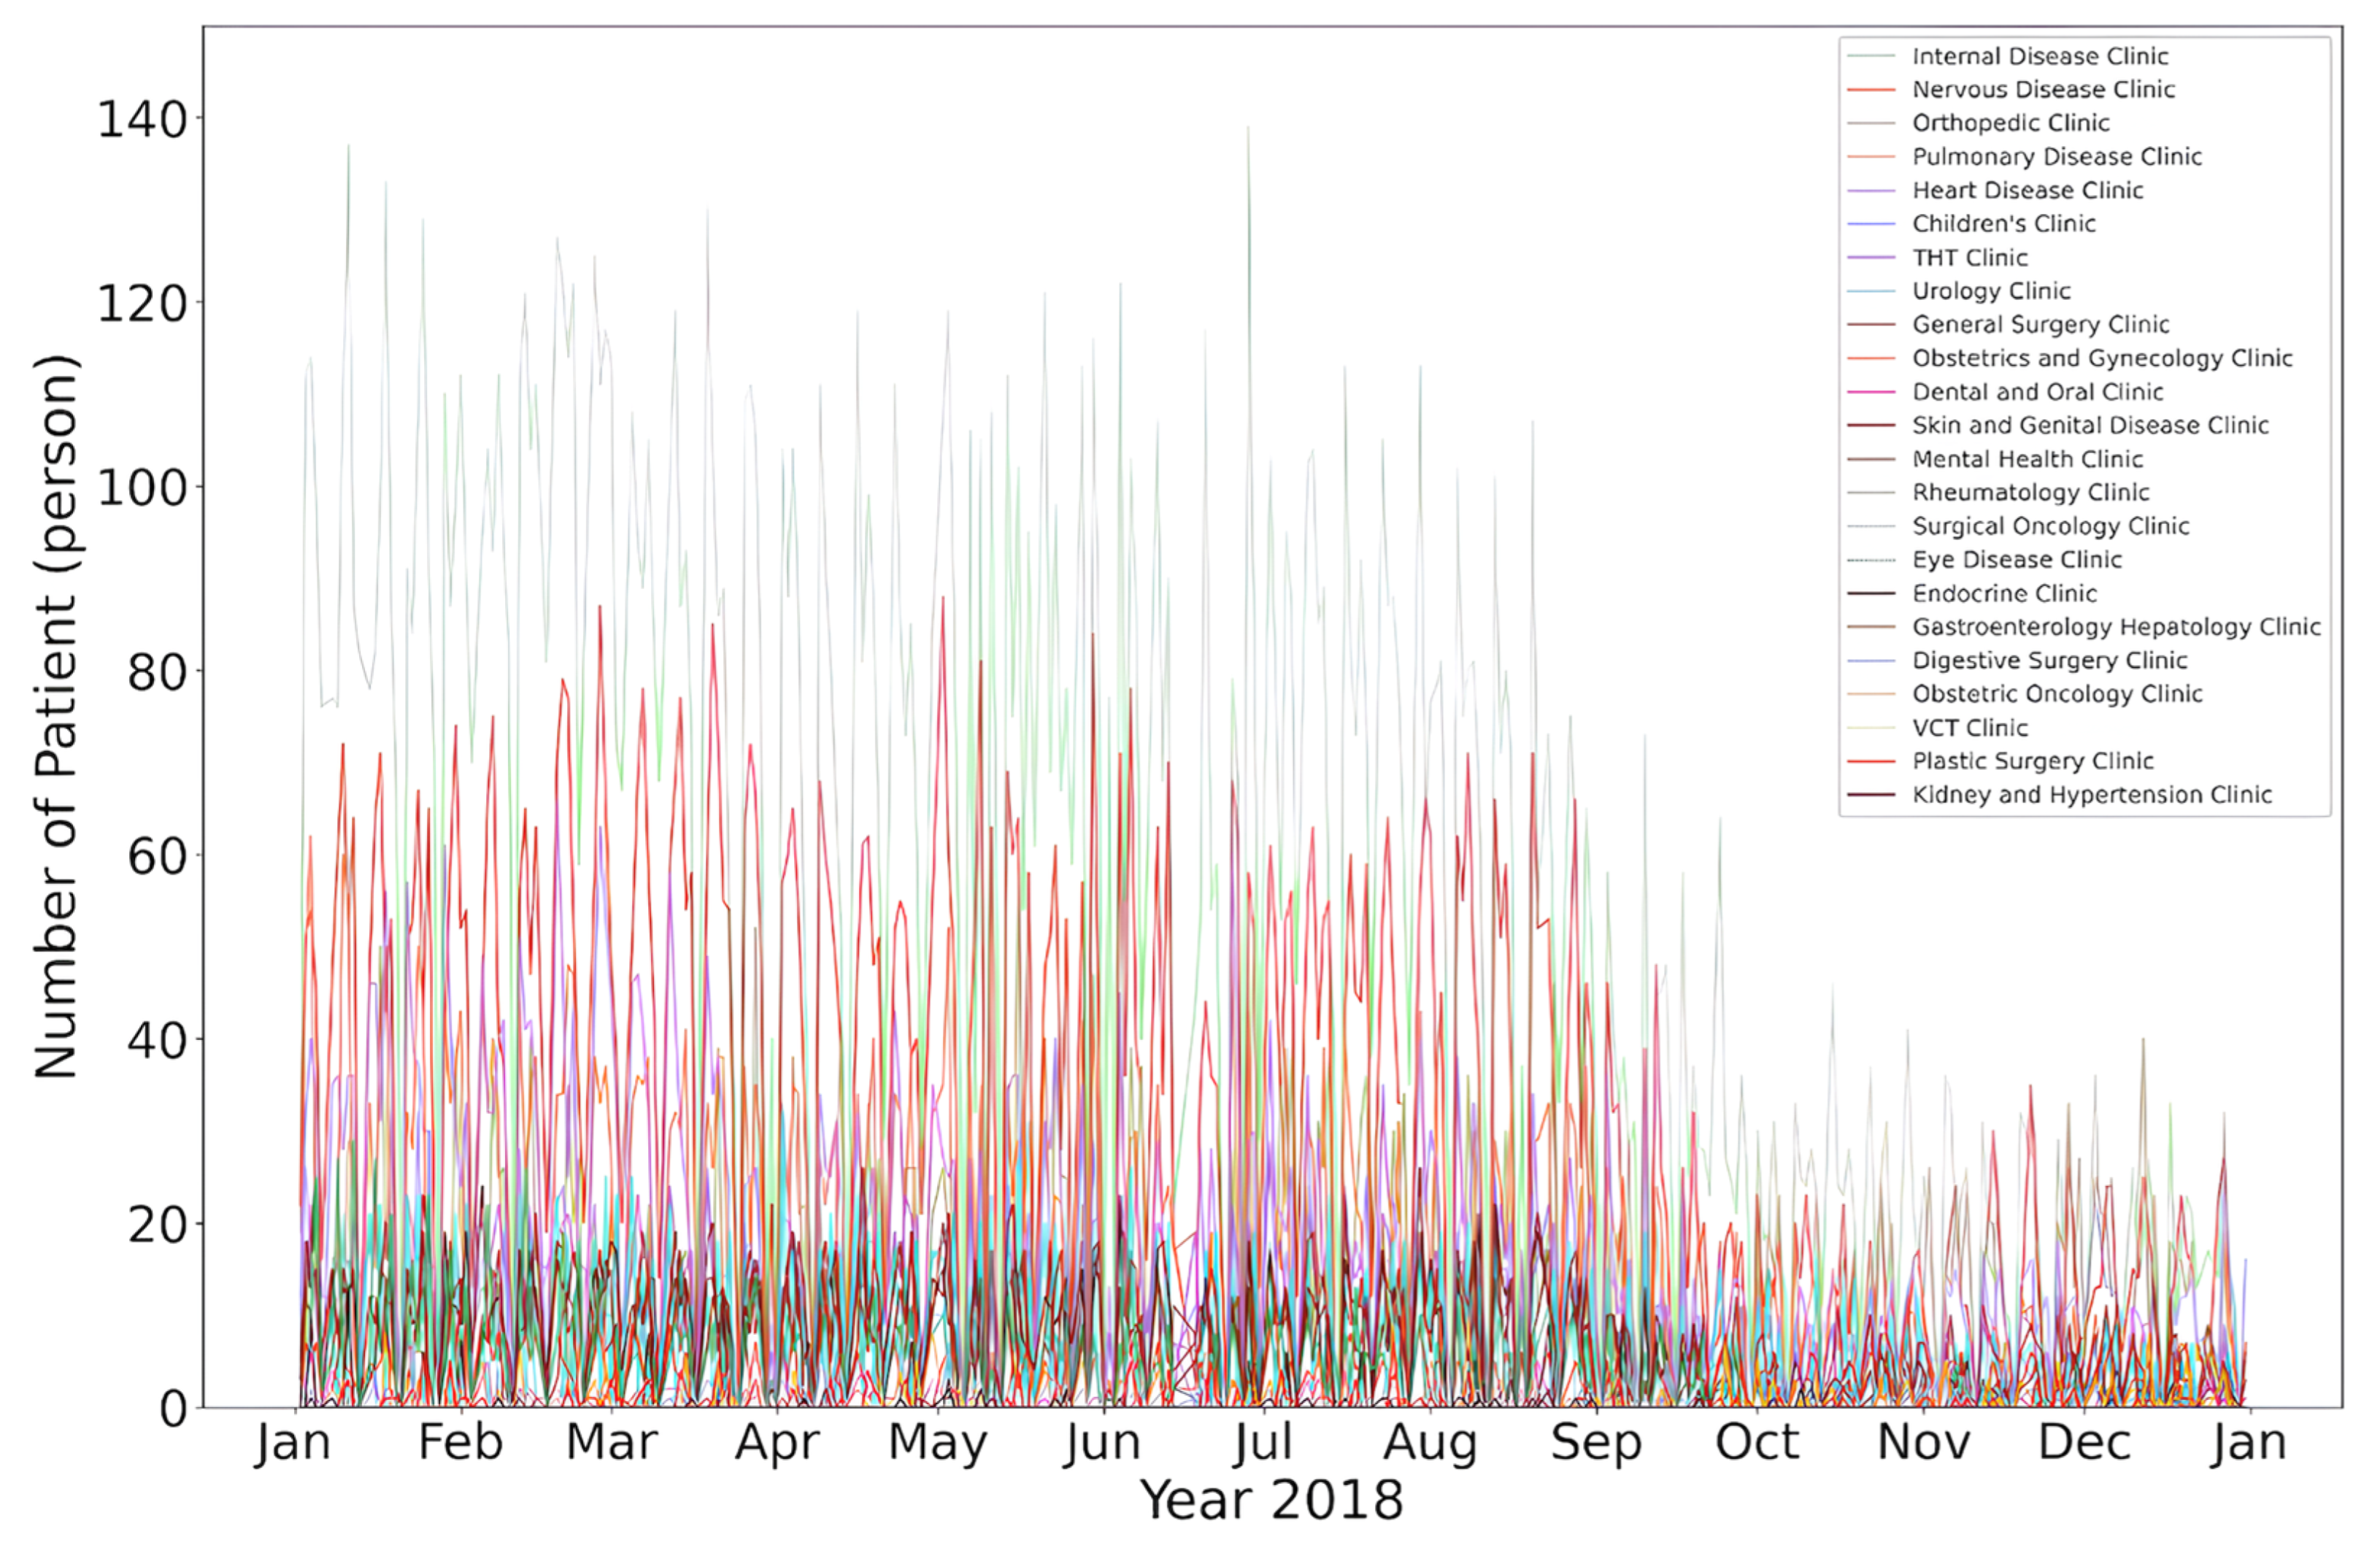
The results of this health data description hold significant value in enhancing the understanding of the public health profile in the North Sumatra region. These data can be used to plan more effective health interventions, identify emerging health trends, and support deeper public health research. Moreover, the data contribute to making informed clinical decisions and provide a strong foundation for evidence-based health policy formulation. Through analysing and understanding the results of this health data description, the hospital and relevant stakeholders can improve the quality of healthcare services and the well-being of the community in the North Sumatra region. Figure 7 shows the results of a hospital patient data analysis based on disease or clinic room visit for 2018. The results of the patient data analysis based on disease types in a hospital provide a comprehensive overview of the most common disease patterns in the area. Through this analysis, the most dominant types of diseases, their prevalence rates, and the age distribution of affected patients can be identified. Additionally, the data analysis can reveal disease trends over time, enabling the identification of changes in disease patterns in the past and future.
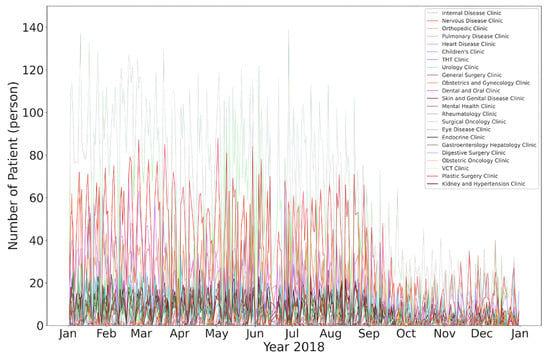
Figure 7.
Results of the patient data in an analysis for 2018.
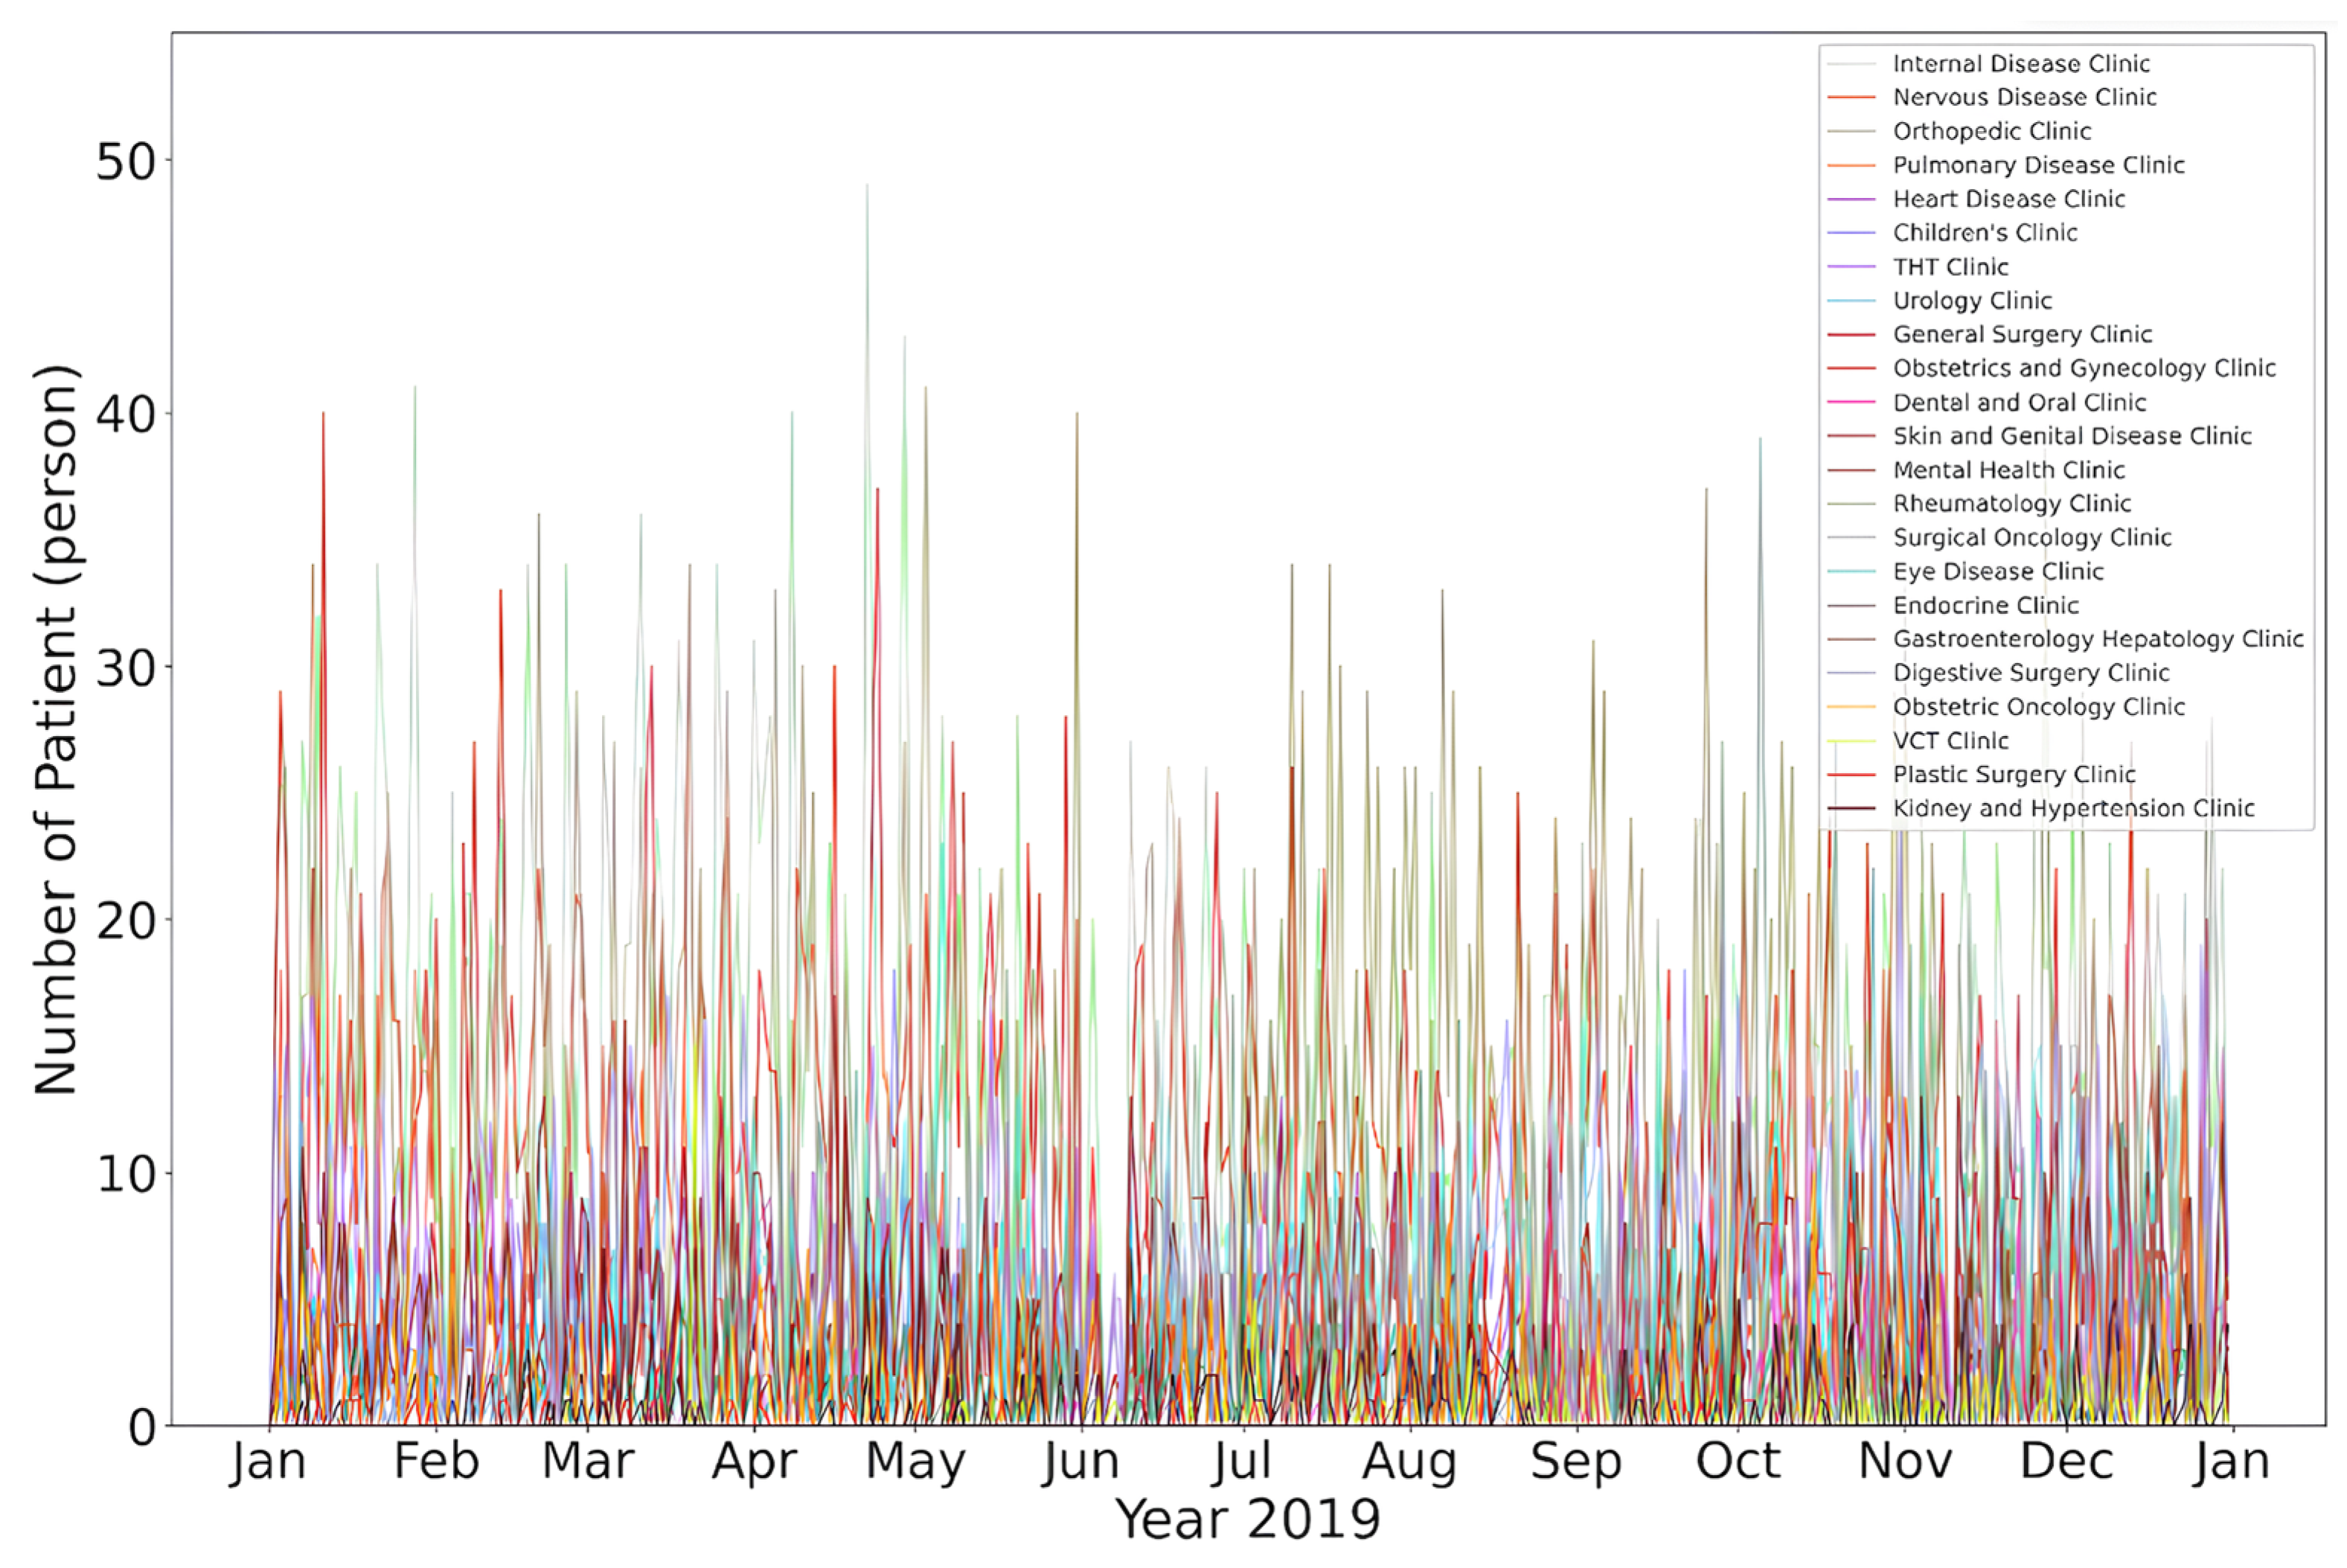
Information about the most common diseases and their prevalence is crucial for healthcare service planning and management. Hospitals and relevant stakeholders can use these data to allocate resources more efficiently and optimise patient care. The analysis results can also help formulate more effective prevention programmes and direct efforts to reduce the burden of specific diseases on the community. Figure 8 shows the data from the hospital’s analysis of patients based on the most frequently treated disease types in 2019. The 2018 data show a significant increase in patient visits to the hospital in the early months, from January to September.
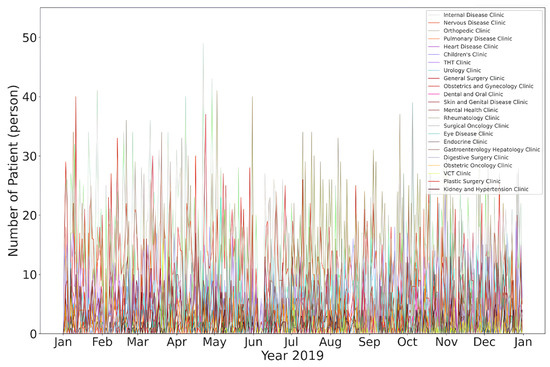
Figure 8.
Results of the patient data in an analysis for 2019.
Furthermore, a patient data analysis based on disease types can serve as a foundation for further research on health. These data can be a valuable source of information for researchers to identify disease risk factors, test the effectiveness of therapies and interventions, and gain a deeper understanding of health determinants. Leveraging the results of a patient data analysis based on disease types, hospitals and other relevant stakeholders can take strategic steps to improve the quality of healthcare services, implement more targeted prevention efforts, and enhance their overall understanding of public health. The more accurate and detailed the data analysis conducted, the greater the benefits for decision making and overall public health improvement.
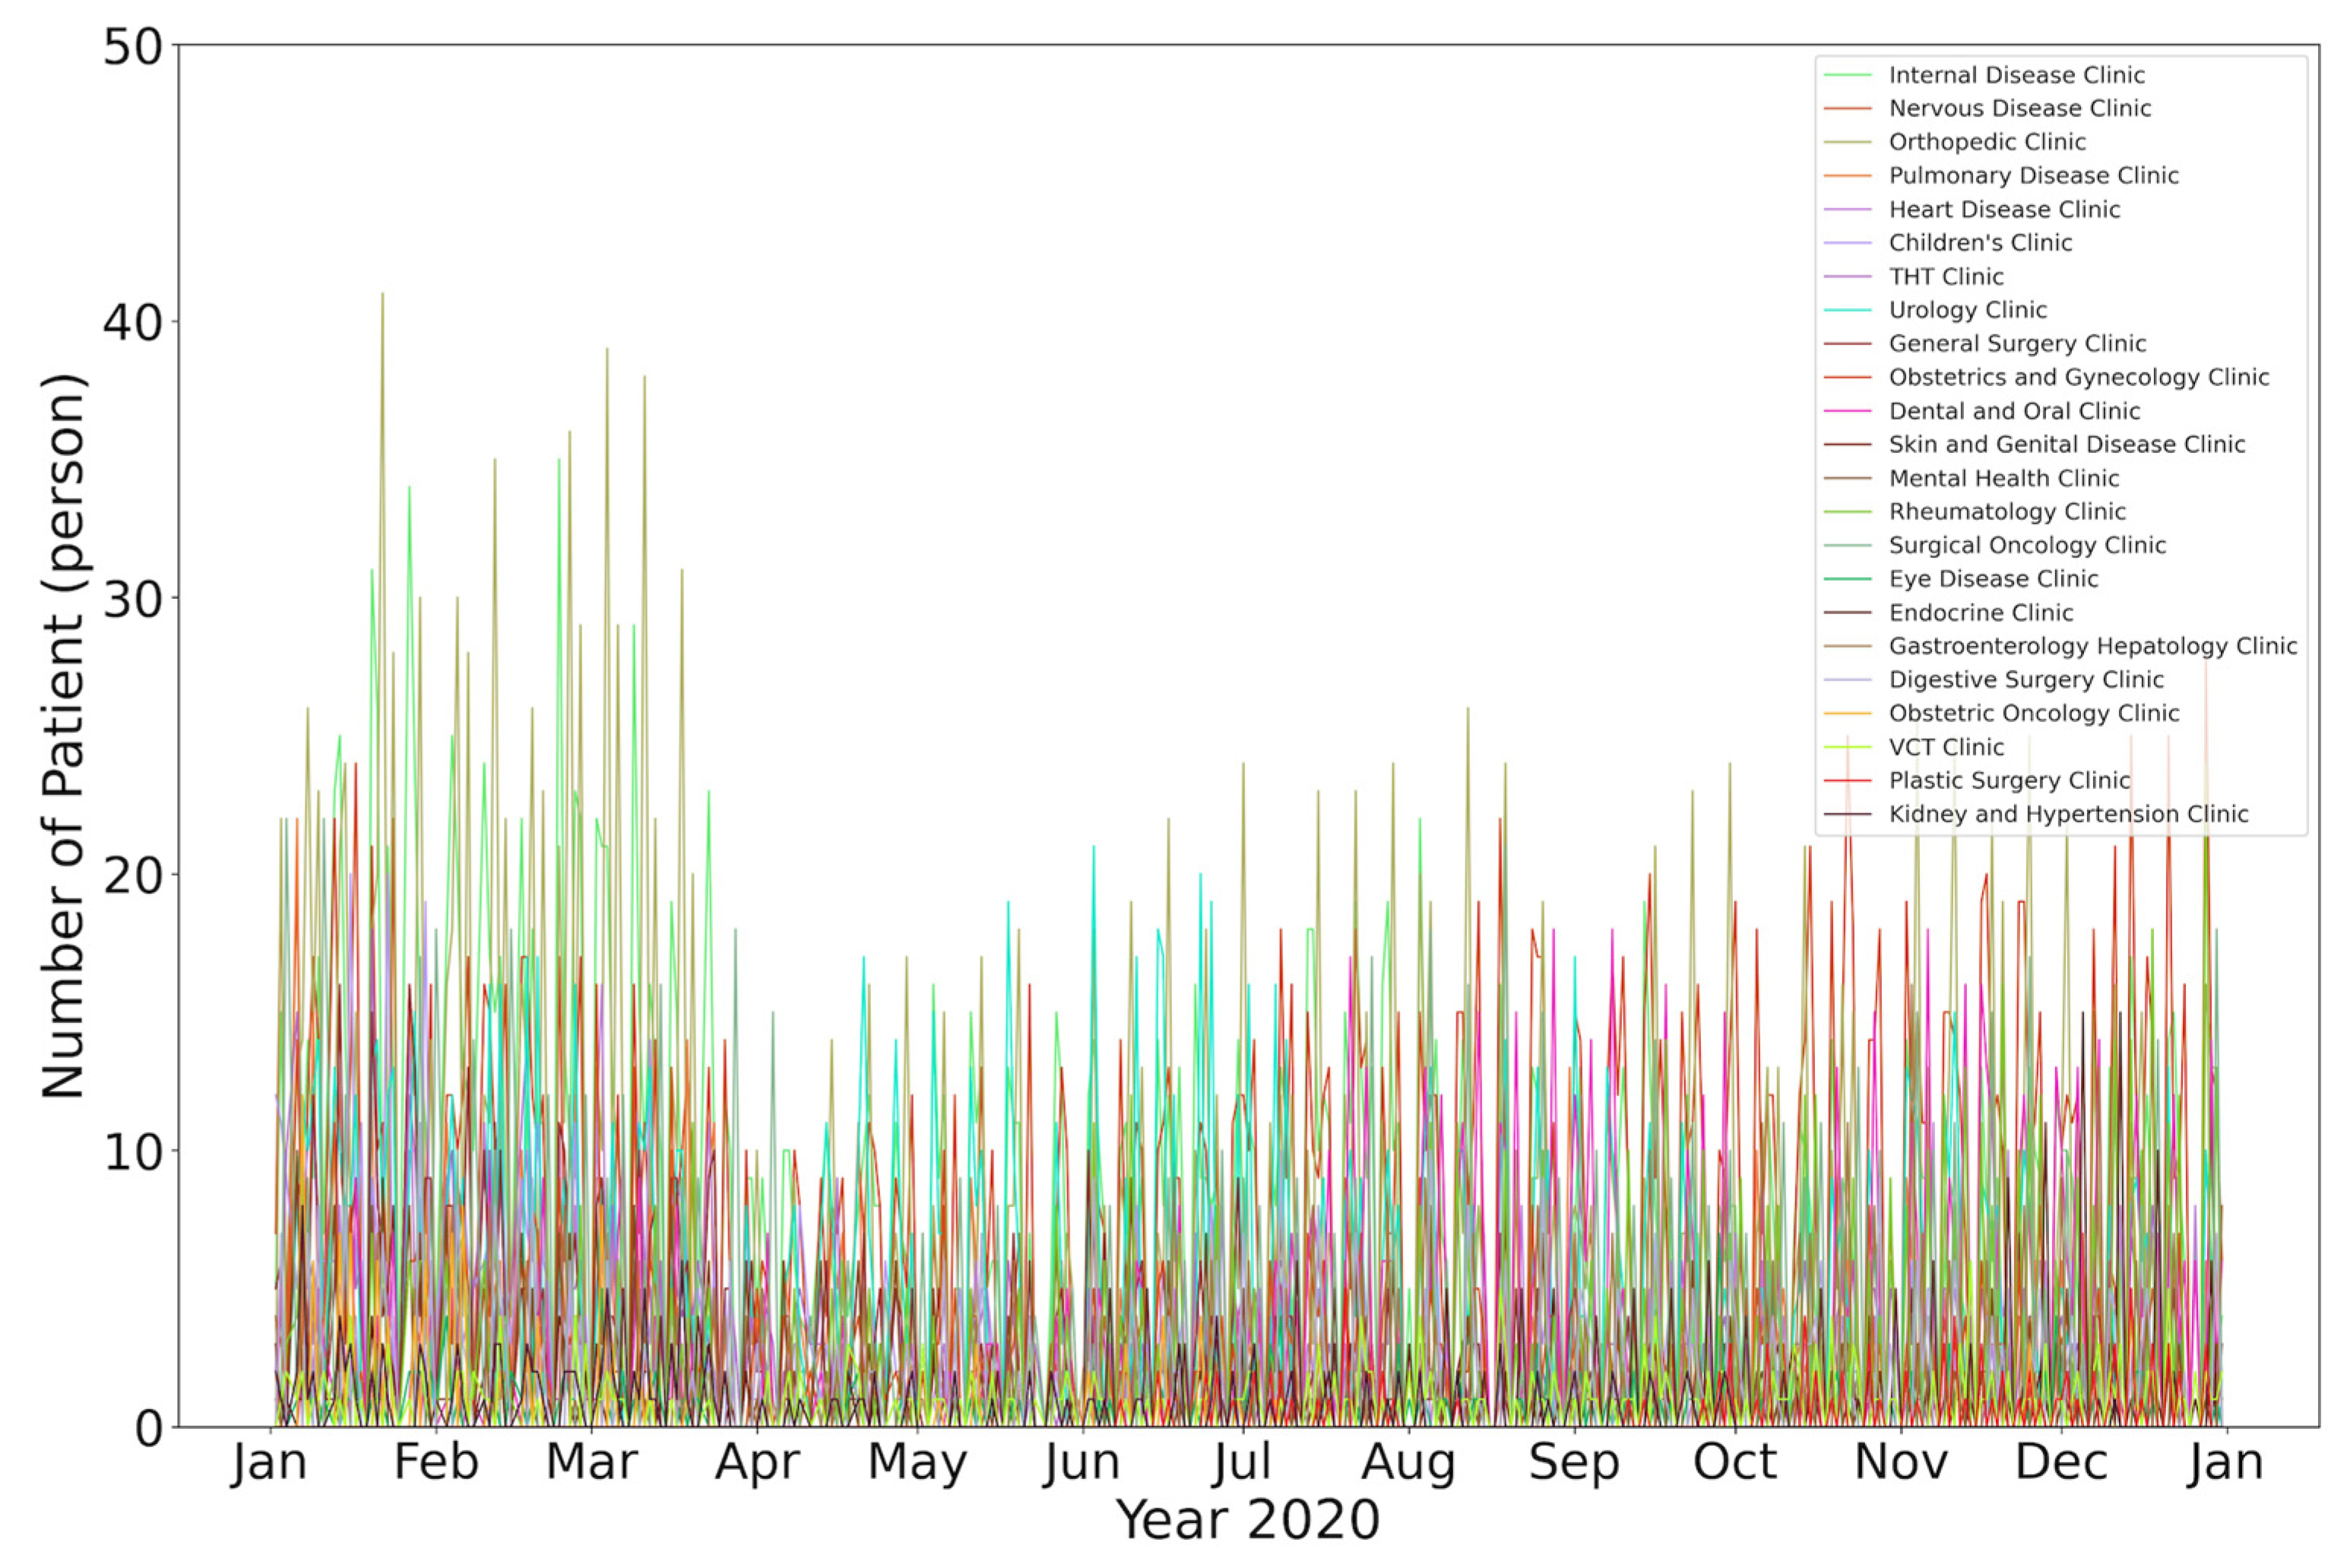
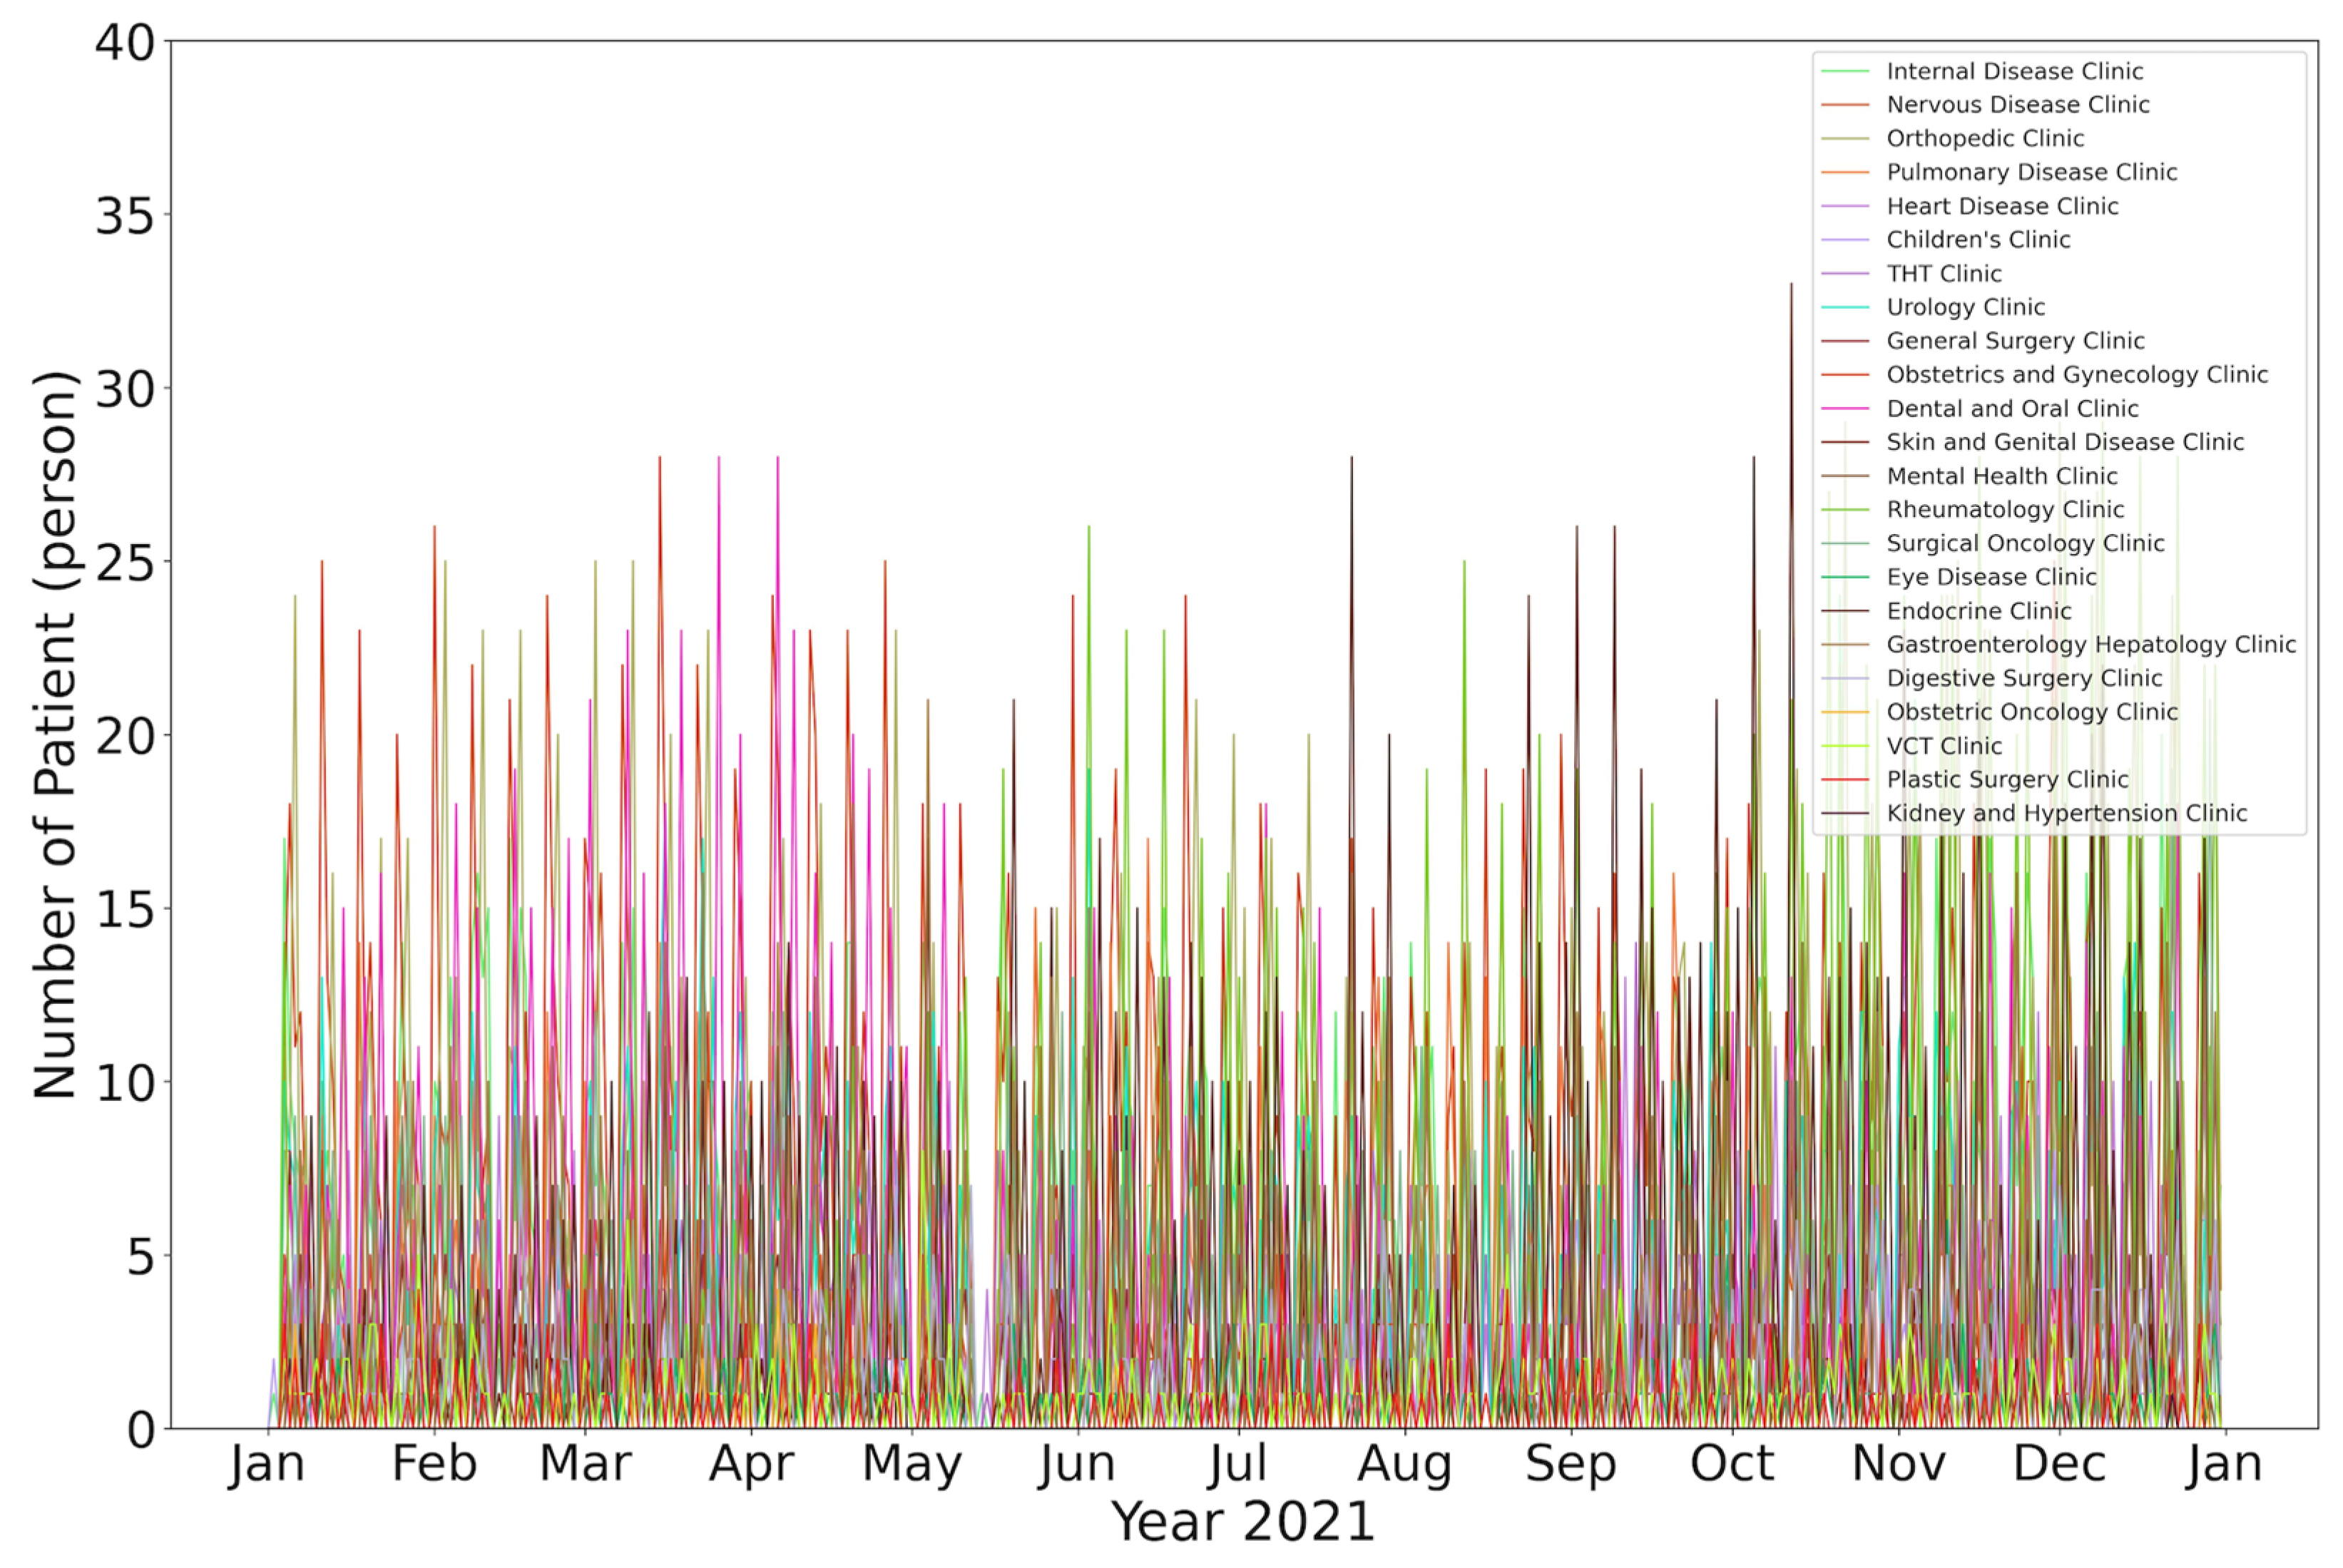
The data shown in Figure 9 indicate the number of patients who visited for disease analysis and consultation, which generally was not high and slightly decreased compared with the 2019 data, with an average of 20–30 people per day. This condition was influenced by the impact of the COVID-19 pandemic, which imposed travel restrictions and limitations on mobility, unlike the previous year. Figure 10 shows results in a graph of patient data in the hospital for 2021.
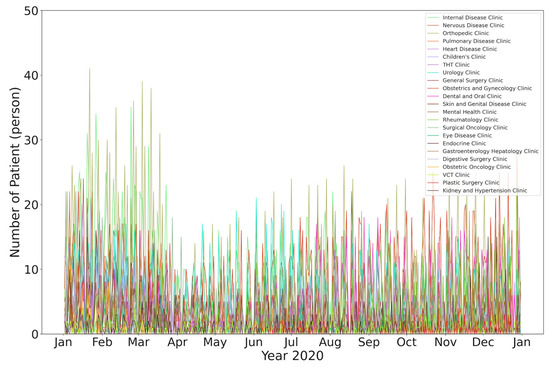
Figure 9.
Results of the patient data in an analysis for 2020.
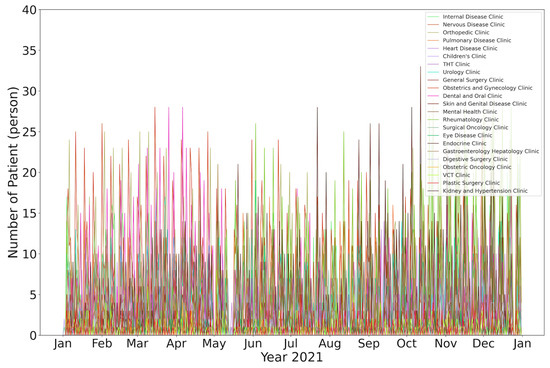
Figure 10.
Results of the patient data in an analysis for 2021.
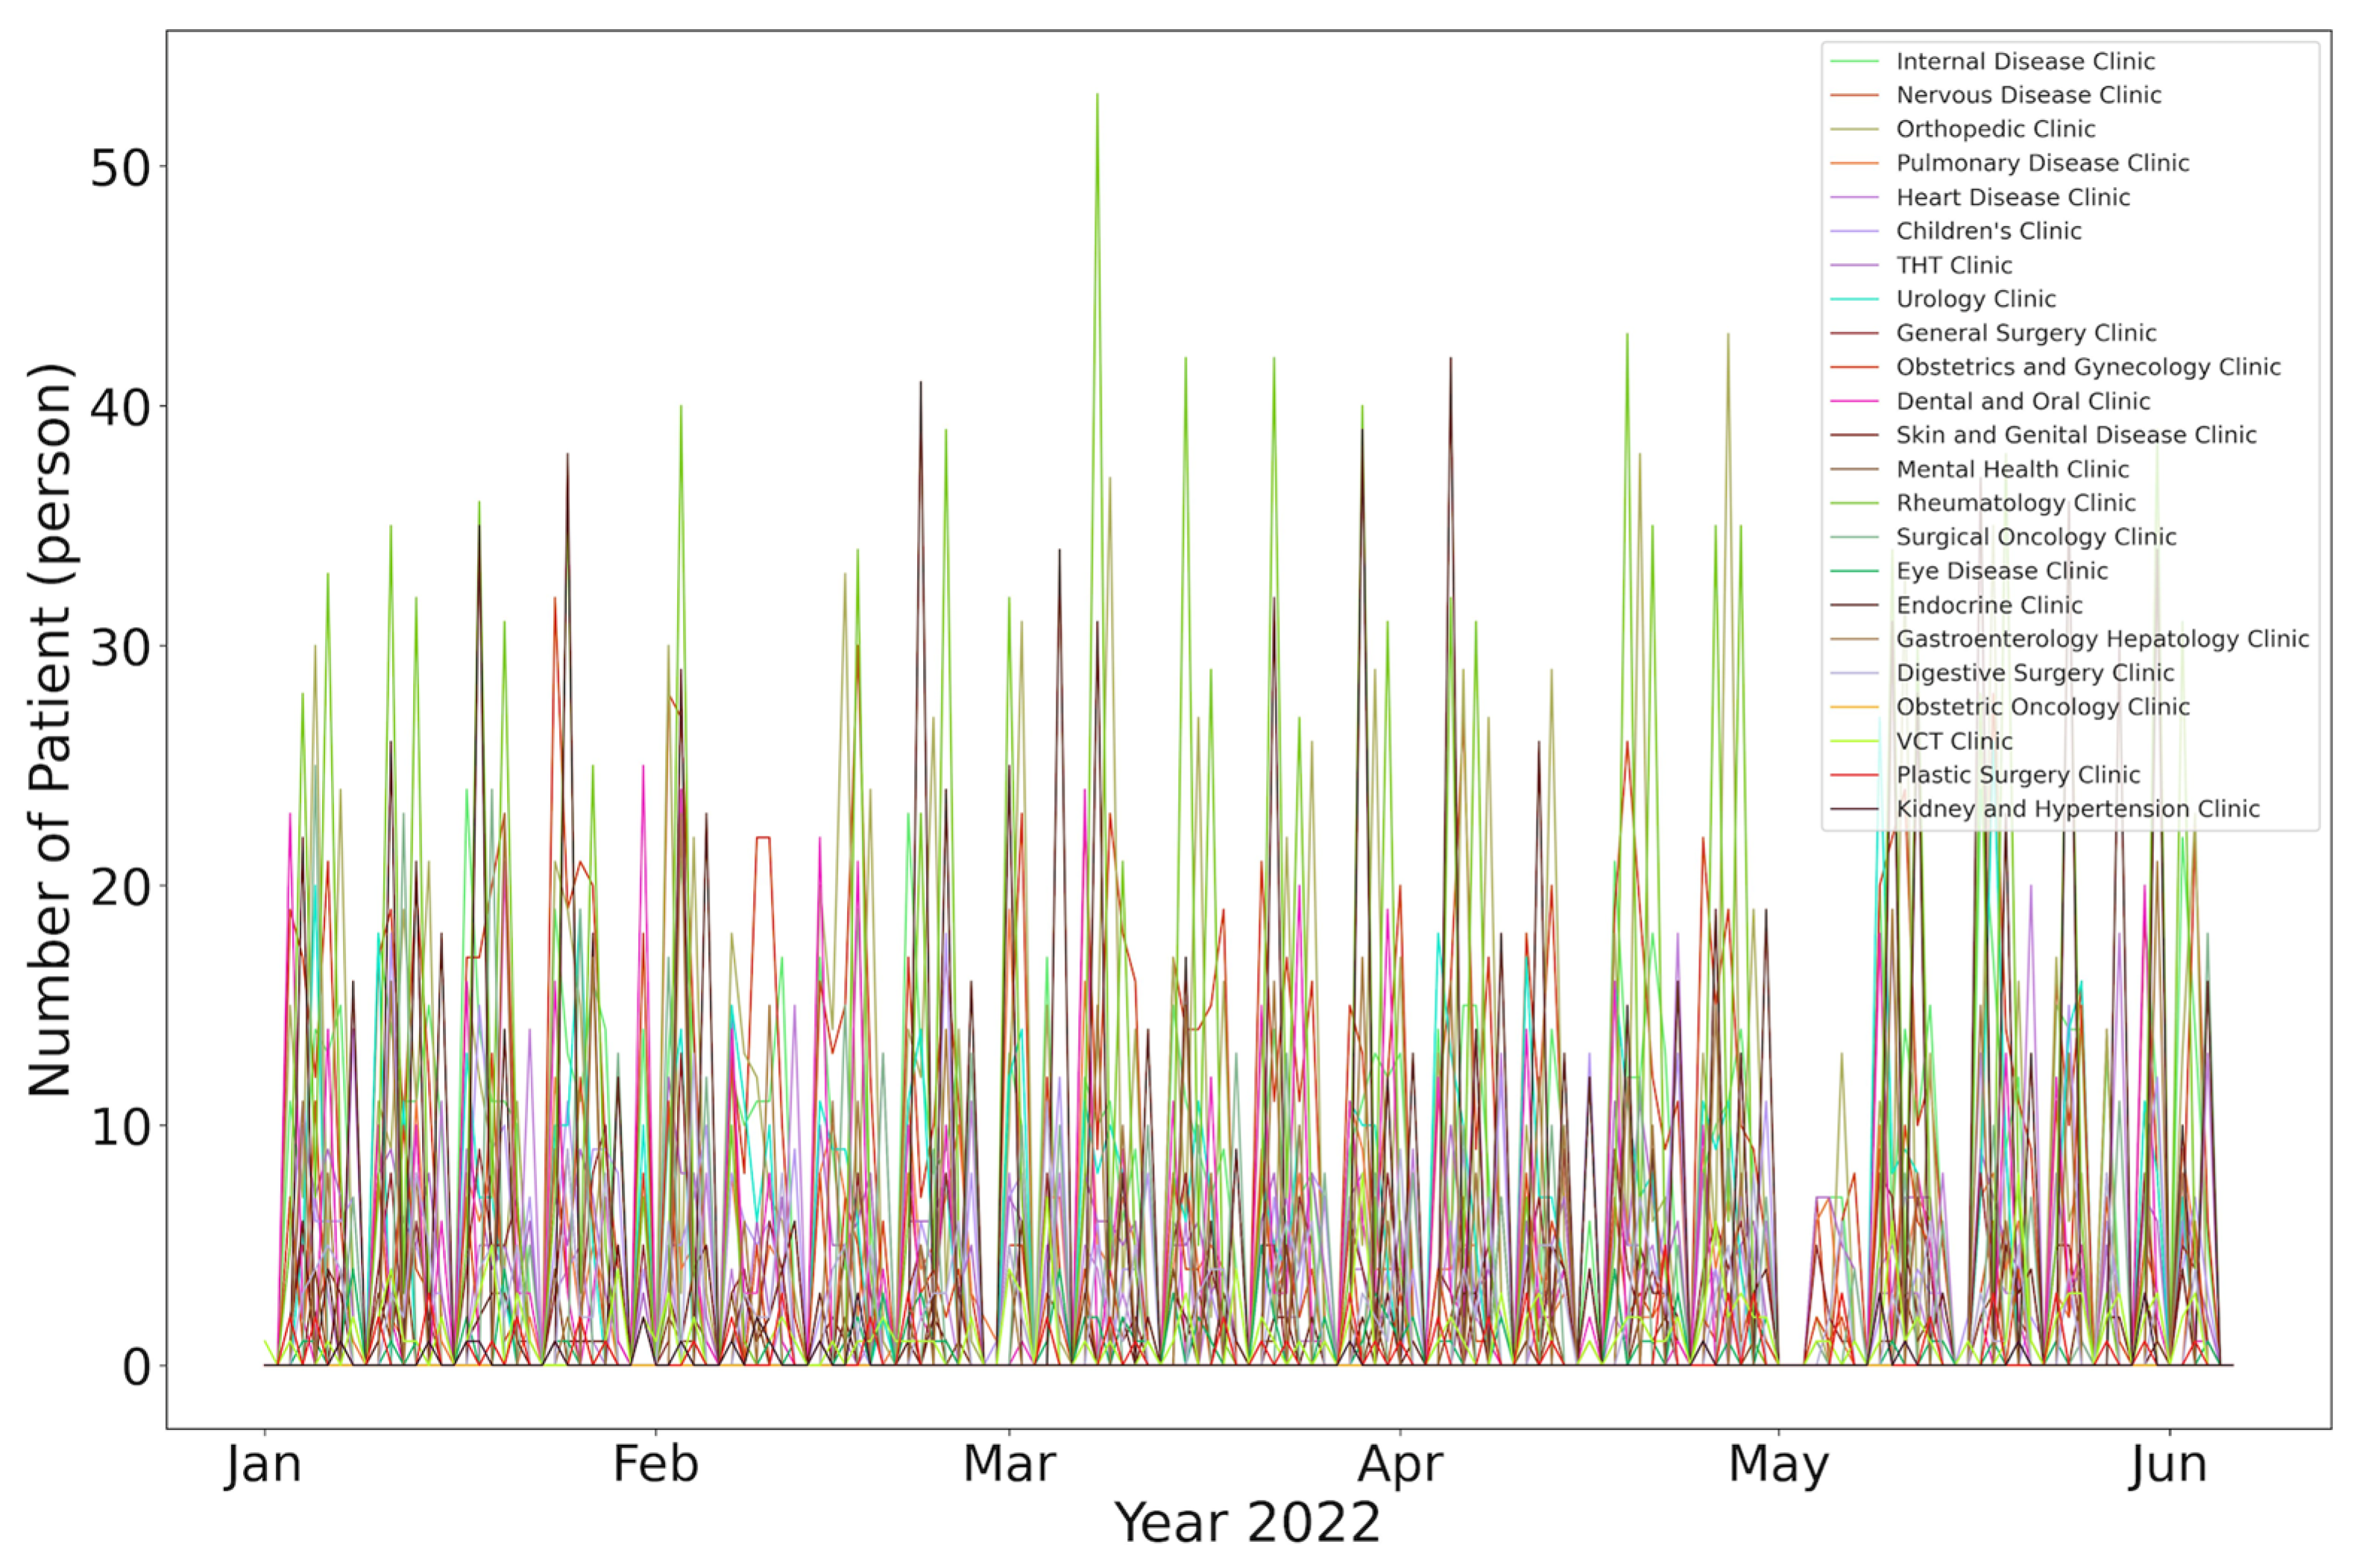
Overall, a patient data analysis based on disease types is an essential tool in managing and improving healthcare services at the hospital. Using these data, hospitals can provide more effective and targeted healthcare services to meet the needs of the community. Further research based on the results of this data analysis can provide deeper insights into the risk factors and determinants of health that influence disease patterns, thereby aiding in the development of more comprehensive and effective public health strategies. Figure 11 shows the data analysis results from 2022; however, the collected data of the patients in 2022 were limited to June because of a hospital system change and upgrade to another new computerisation system, as indicated by the six months of patient data increasing compared with the previous year.
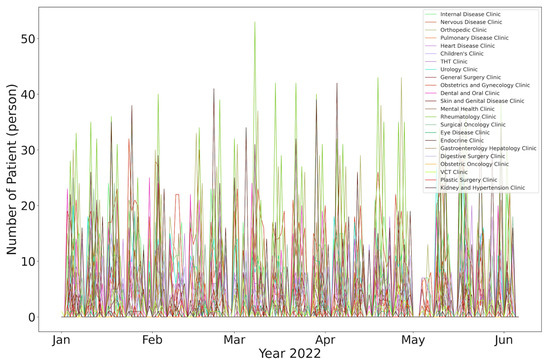
Figure 11.
Results of the patient data in an analysis for 2022.
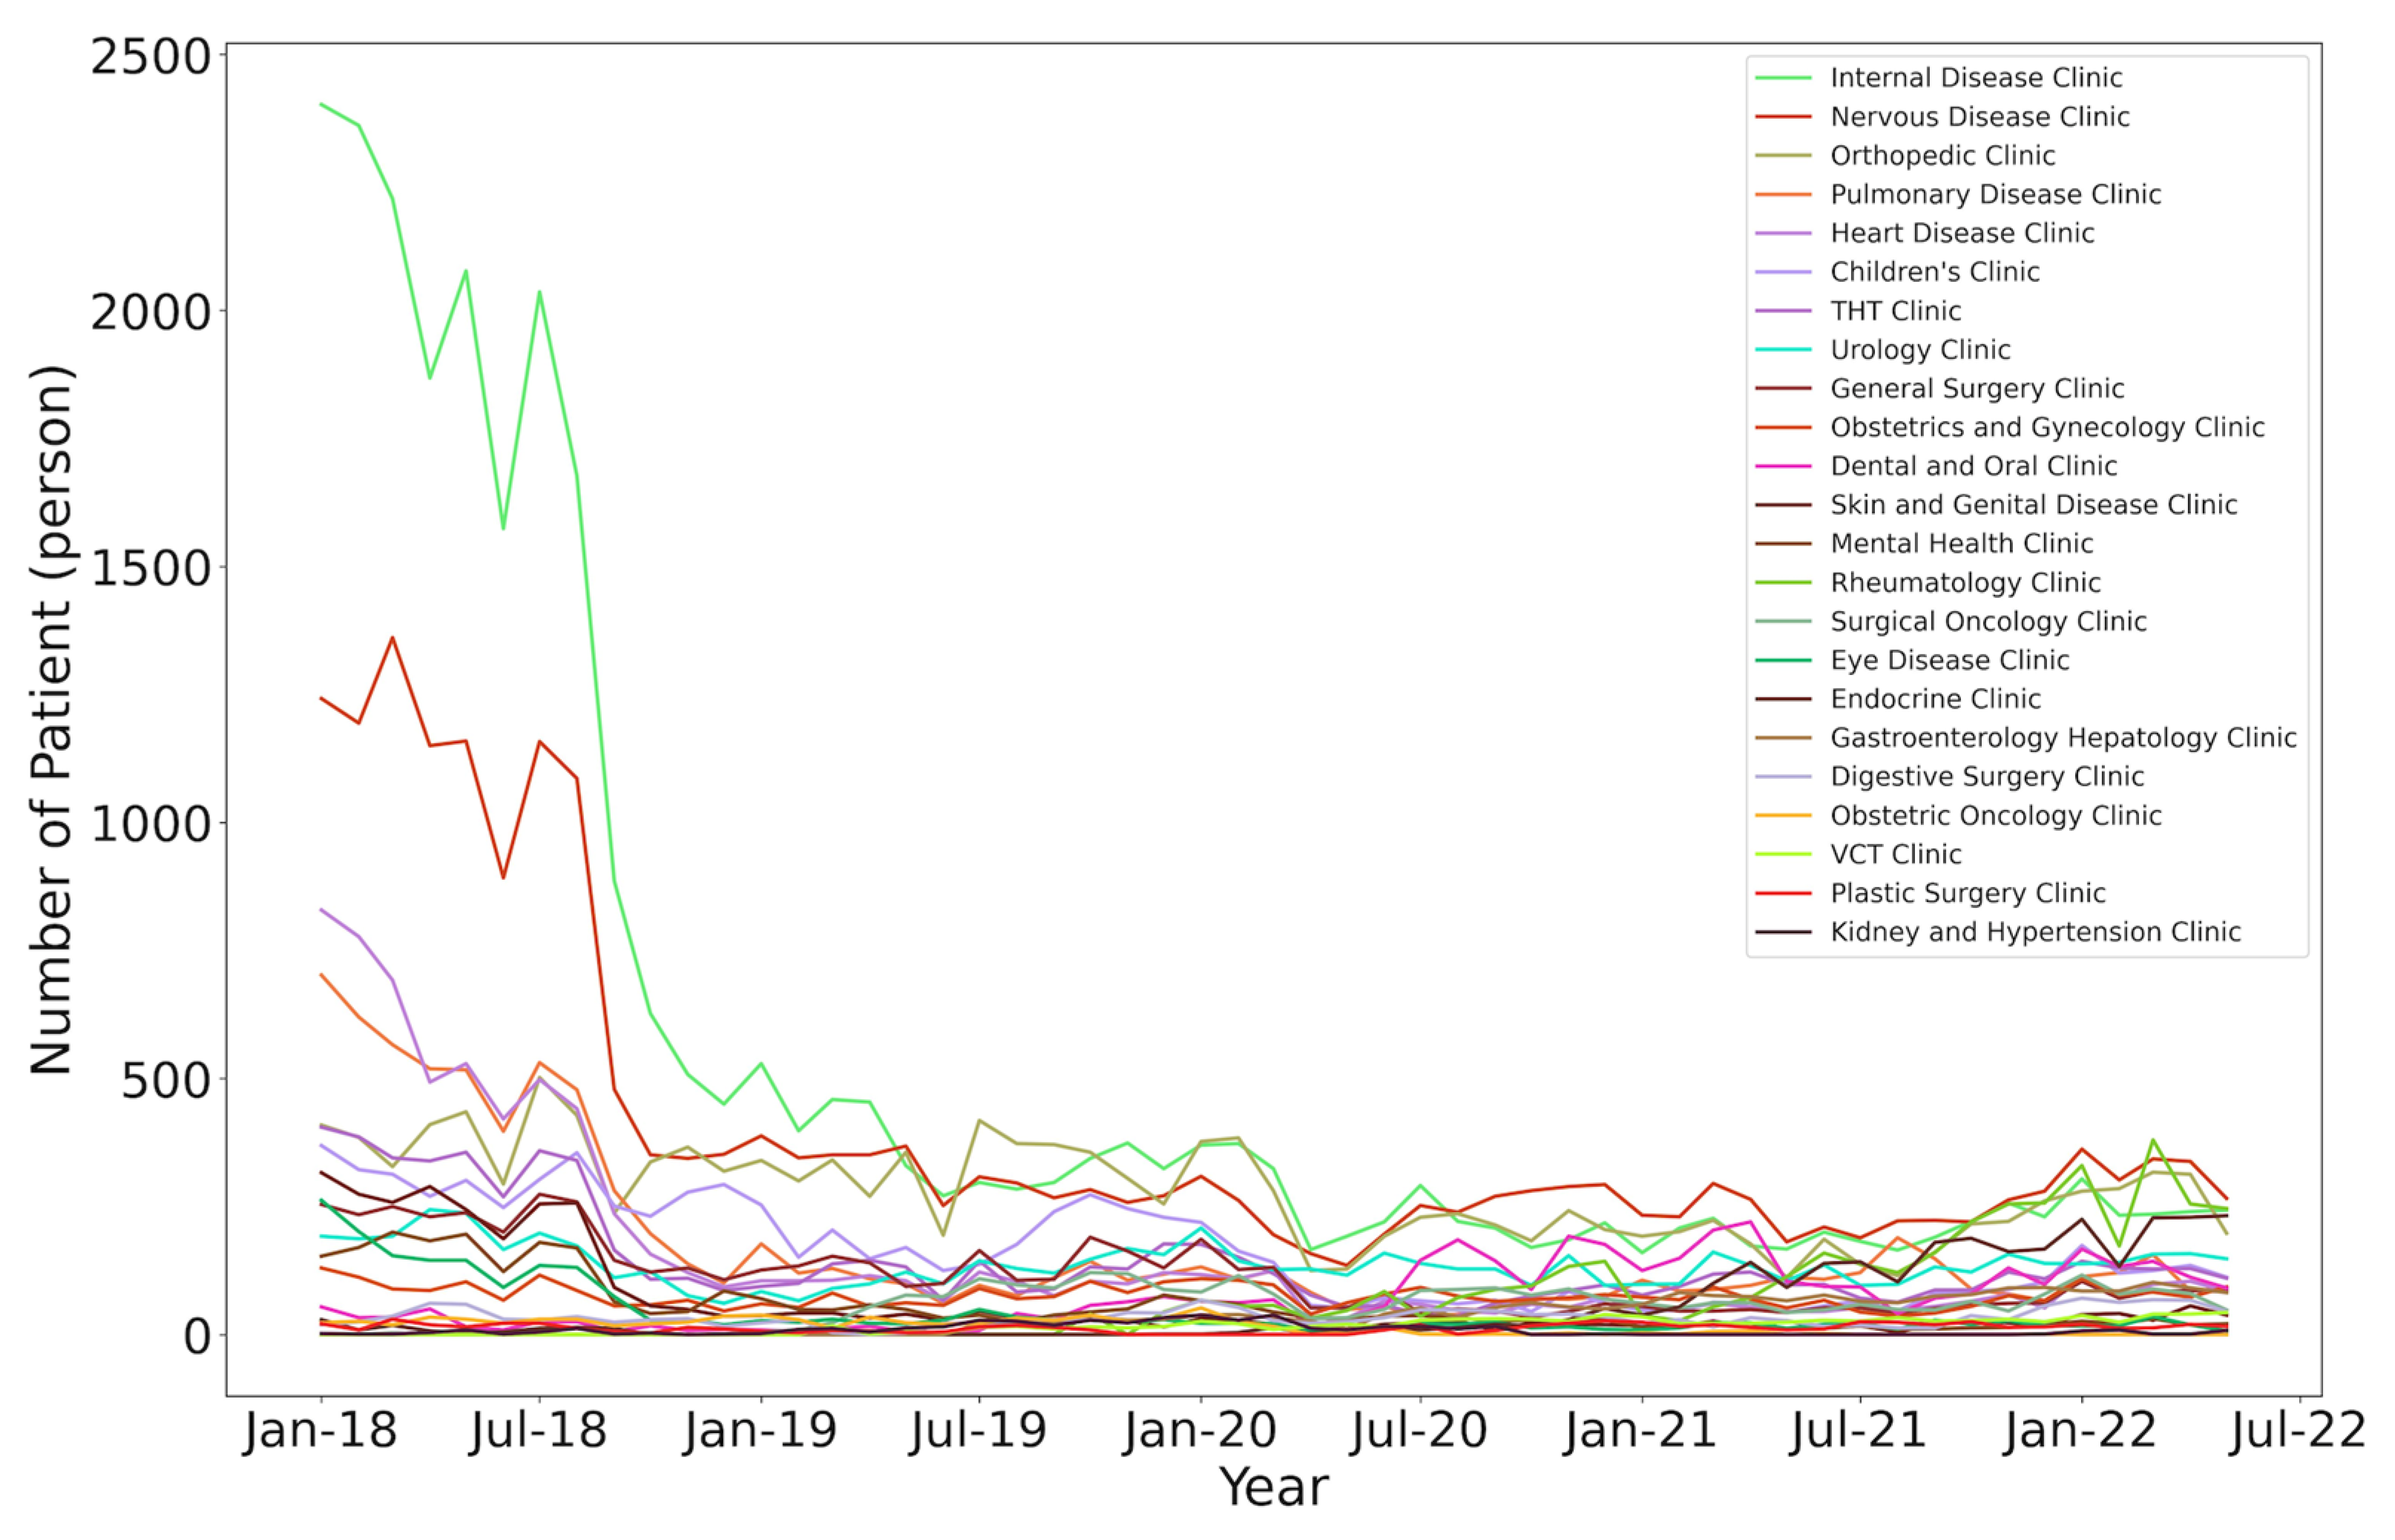
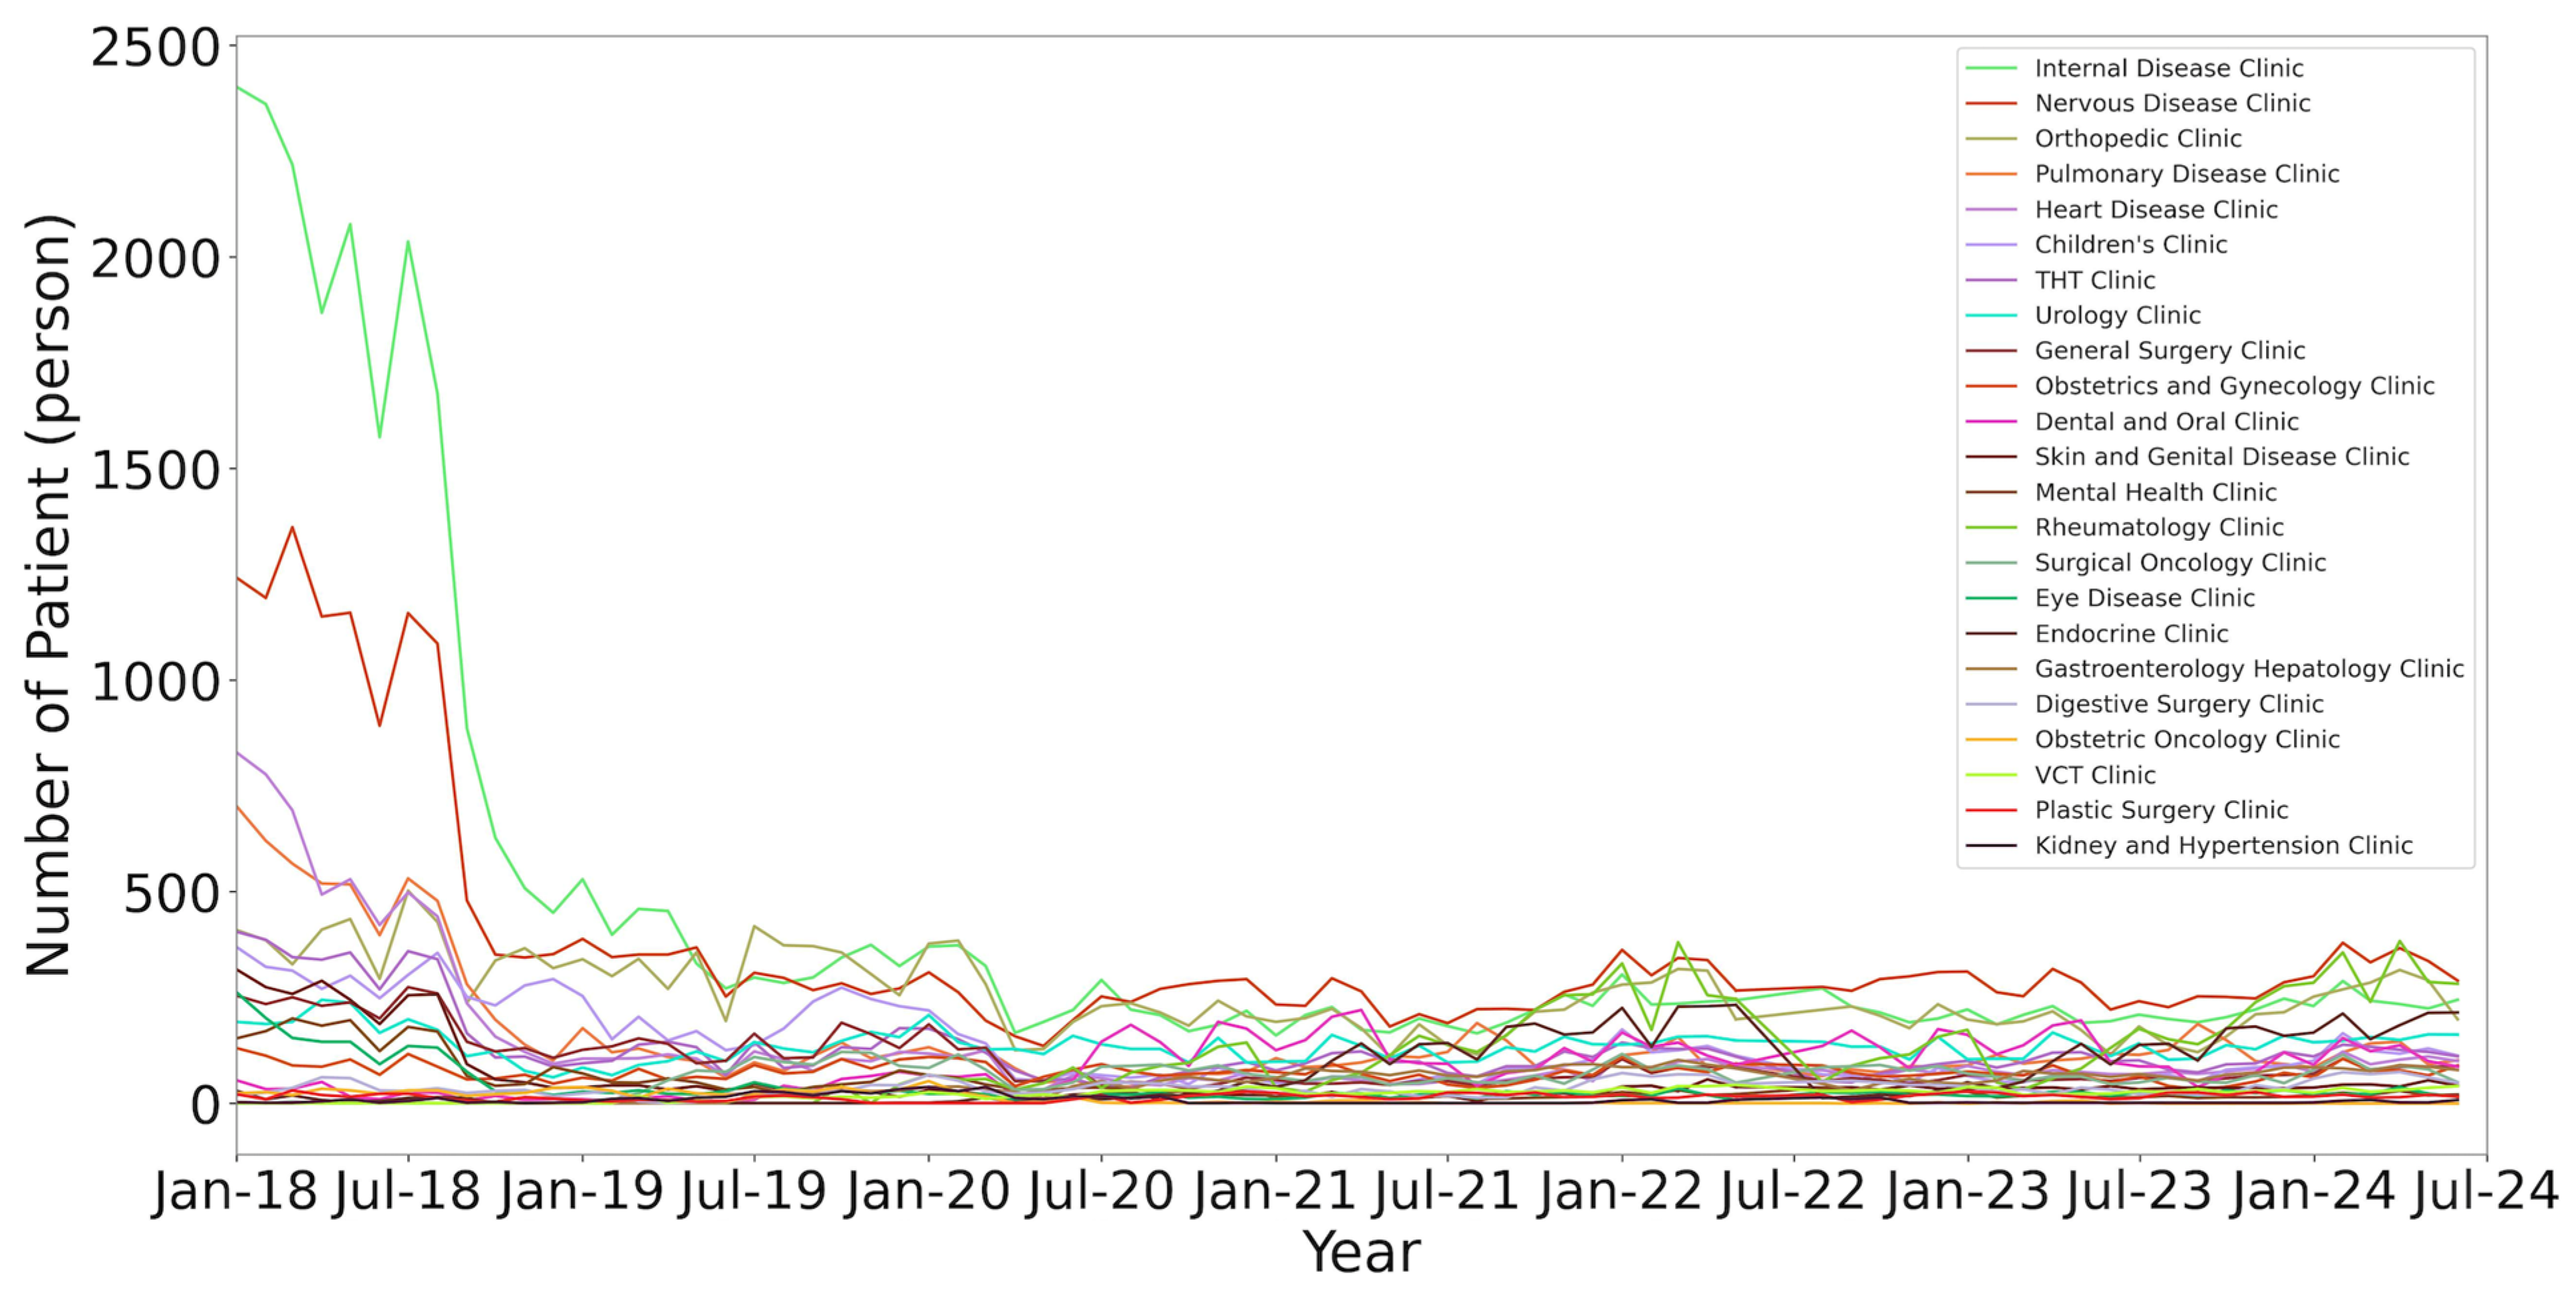
Figure 12 shows the data analysis results from 2018 to 2022. The conditions were still those of the COVID-19 pandemic in 2019–2022, resulting in minimal changes compared with 2018, when human mobility was freer.
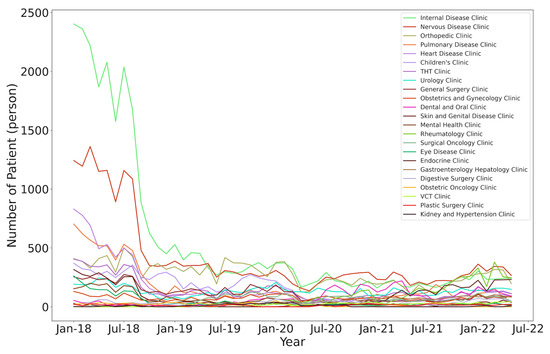
Figure 12.
Results of the patient data disease analysis for 2018–2022.
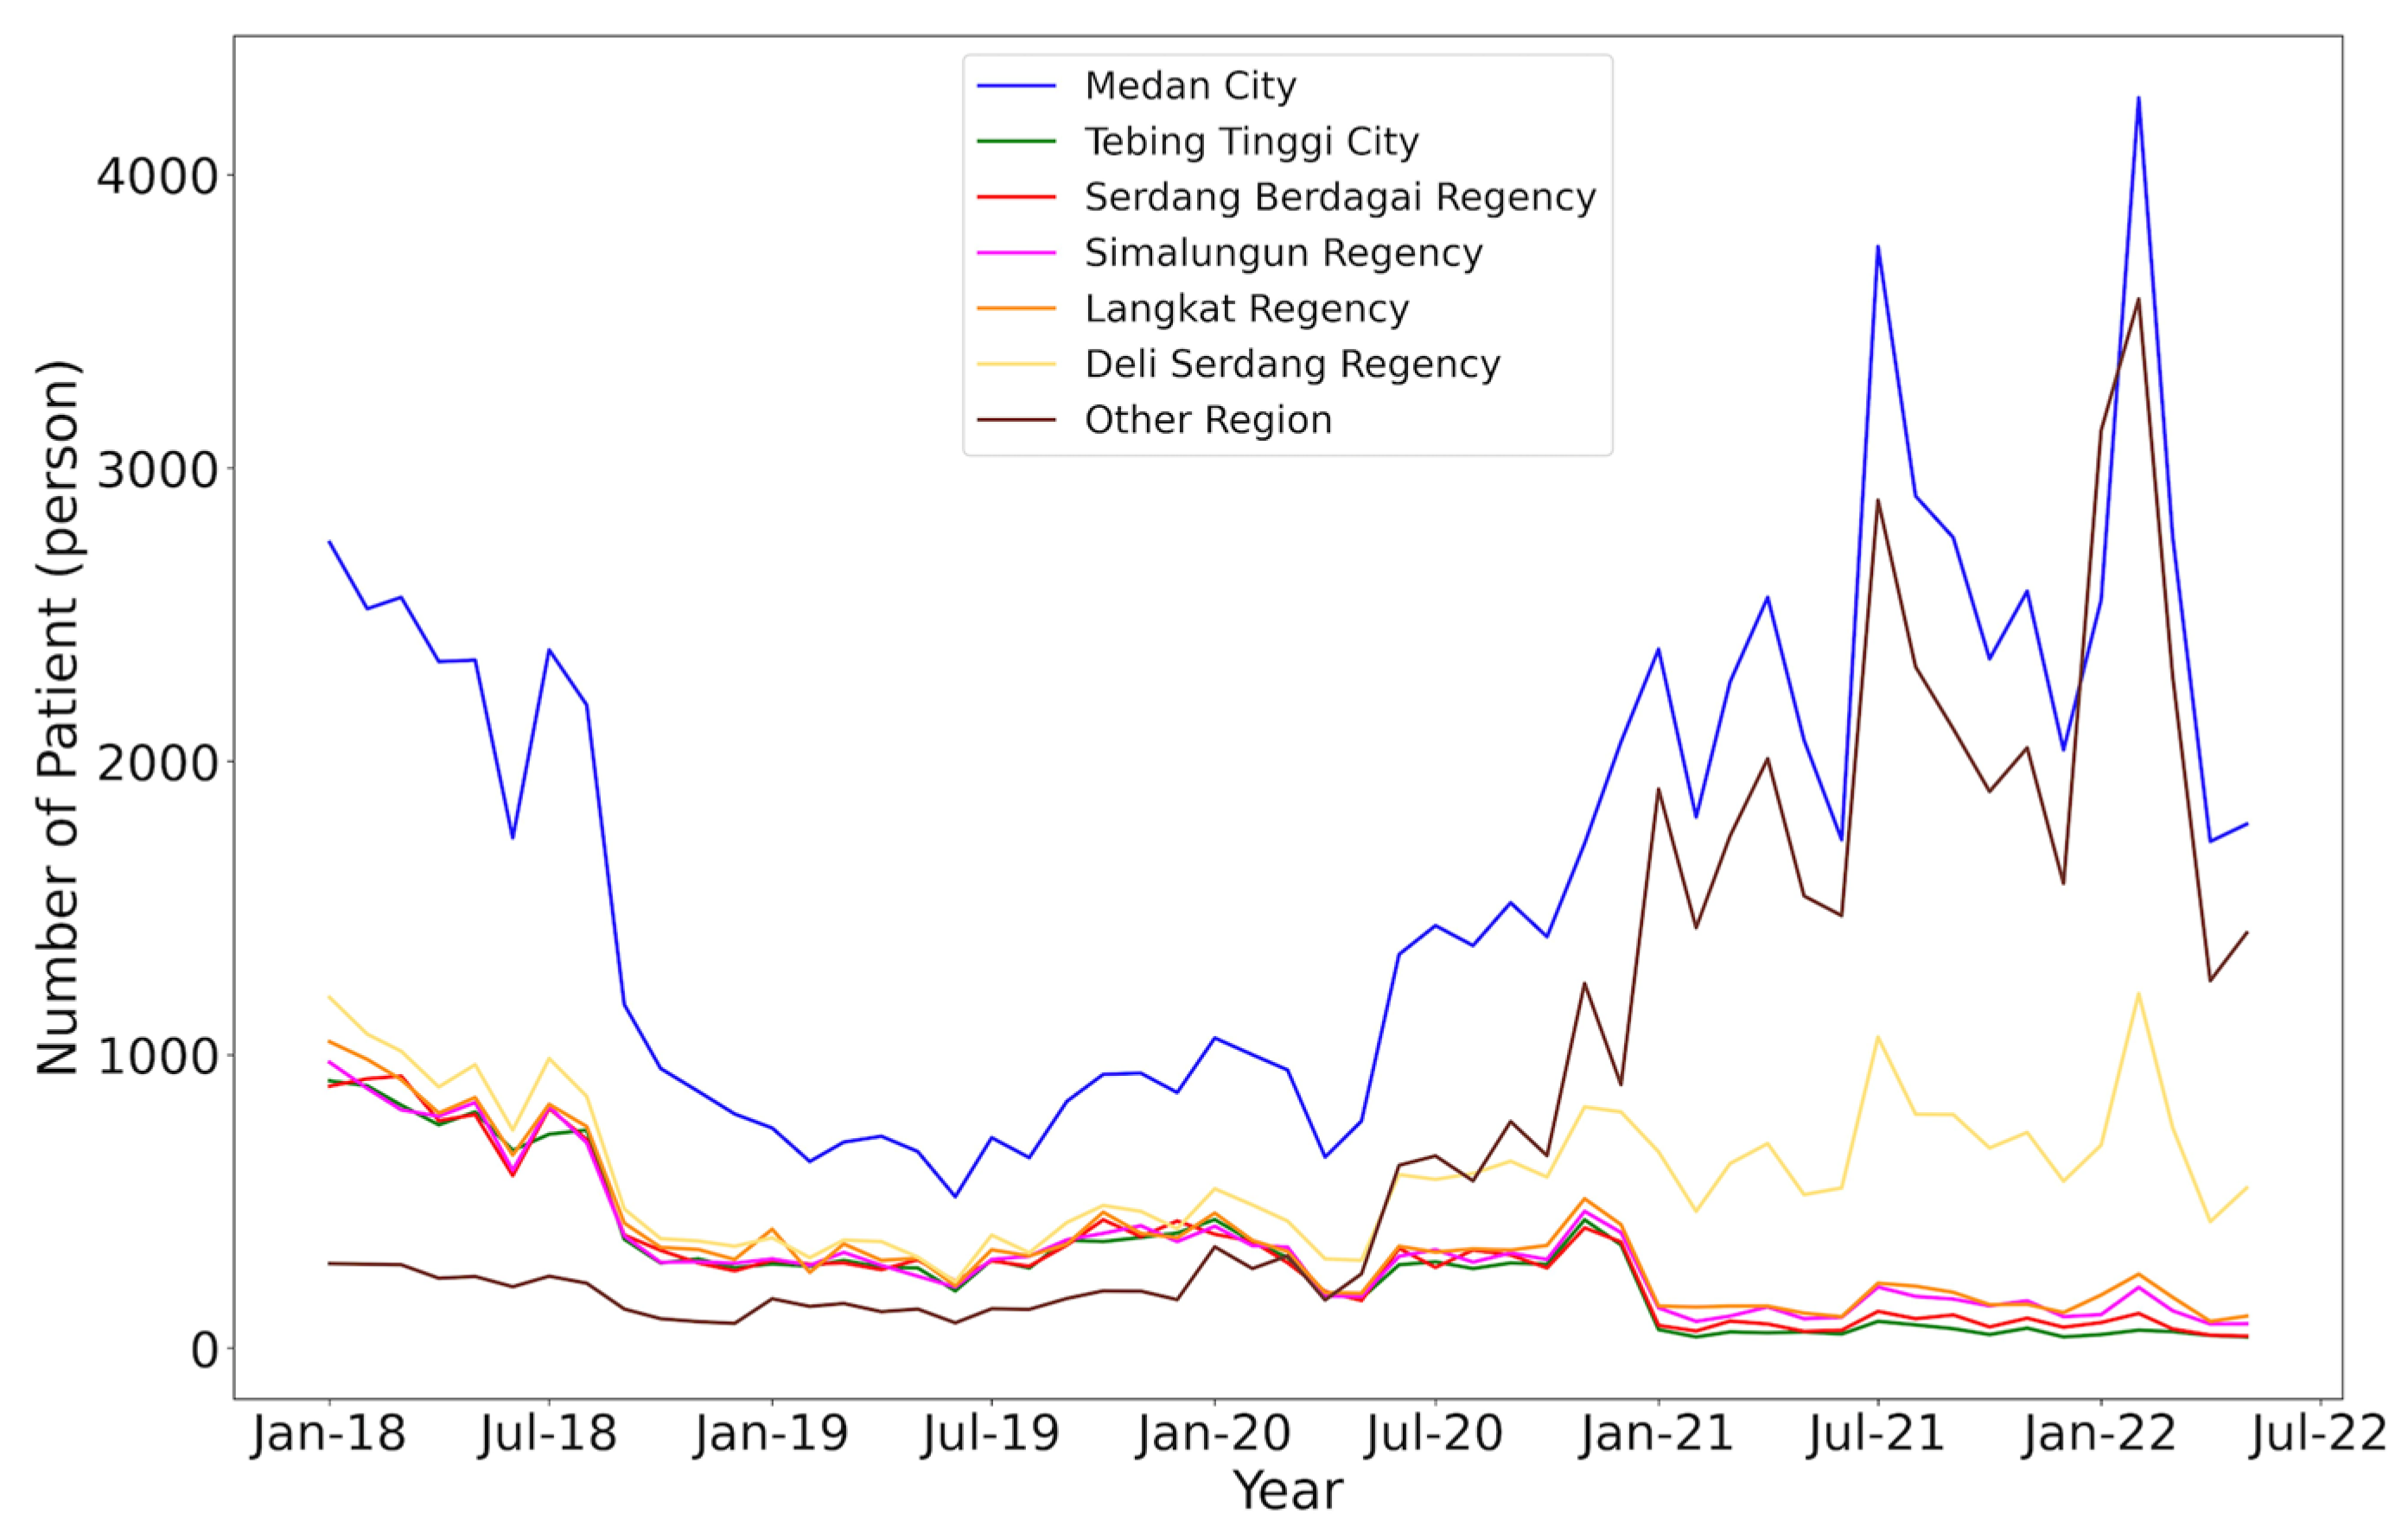
An analysis based on regional residence also provides information about variations in public health across different areas. Graphs and images have illustrated different disease patterns among specific regions (Figure 13). These results help identify areas with higher disease burdens and vulnerability, enabling relevant stakeholders to prioritise healthcare resources and interventions for these regions. An analysis based on gender also sheds light on differences in disease patterns between males and females. These results aid in designing gender-specific health programmes that align with the unique characteristics of each gender. For example, if certain diseases are more common in one gender, screening and health promotion programmes can be specifically directed towards preventing and managing these diseases in the vulnerable gender group.
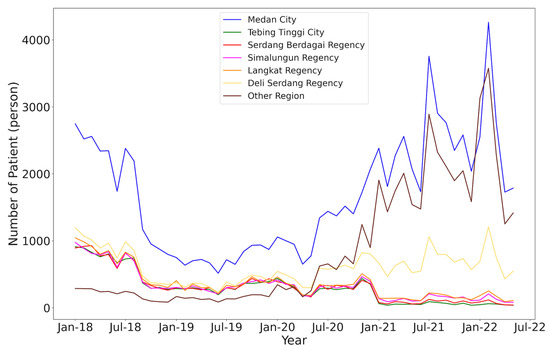
Figure 13.
Results of patients based on a region of living analysis for 2018–2022.
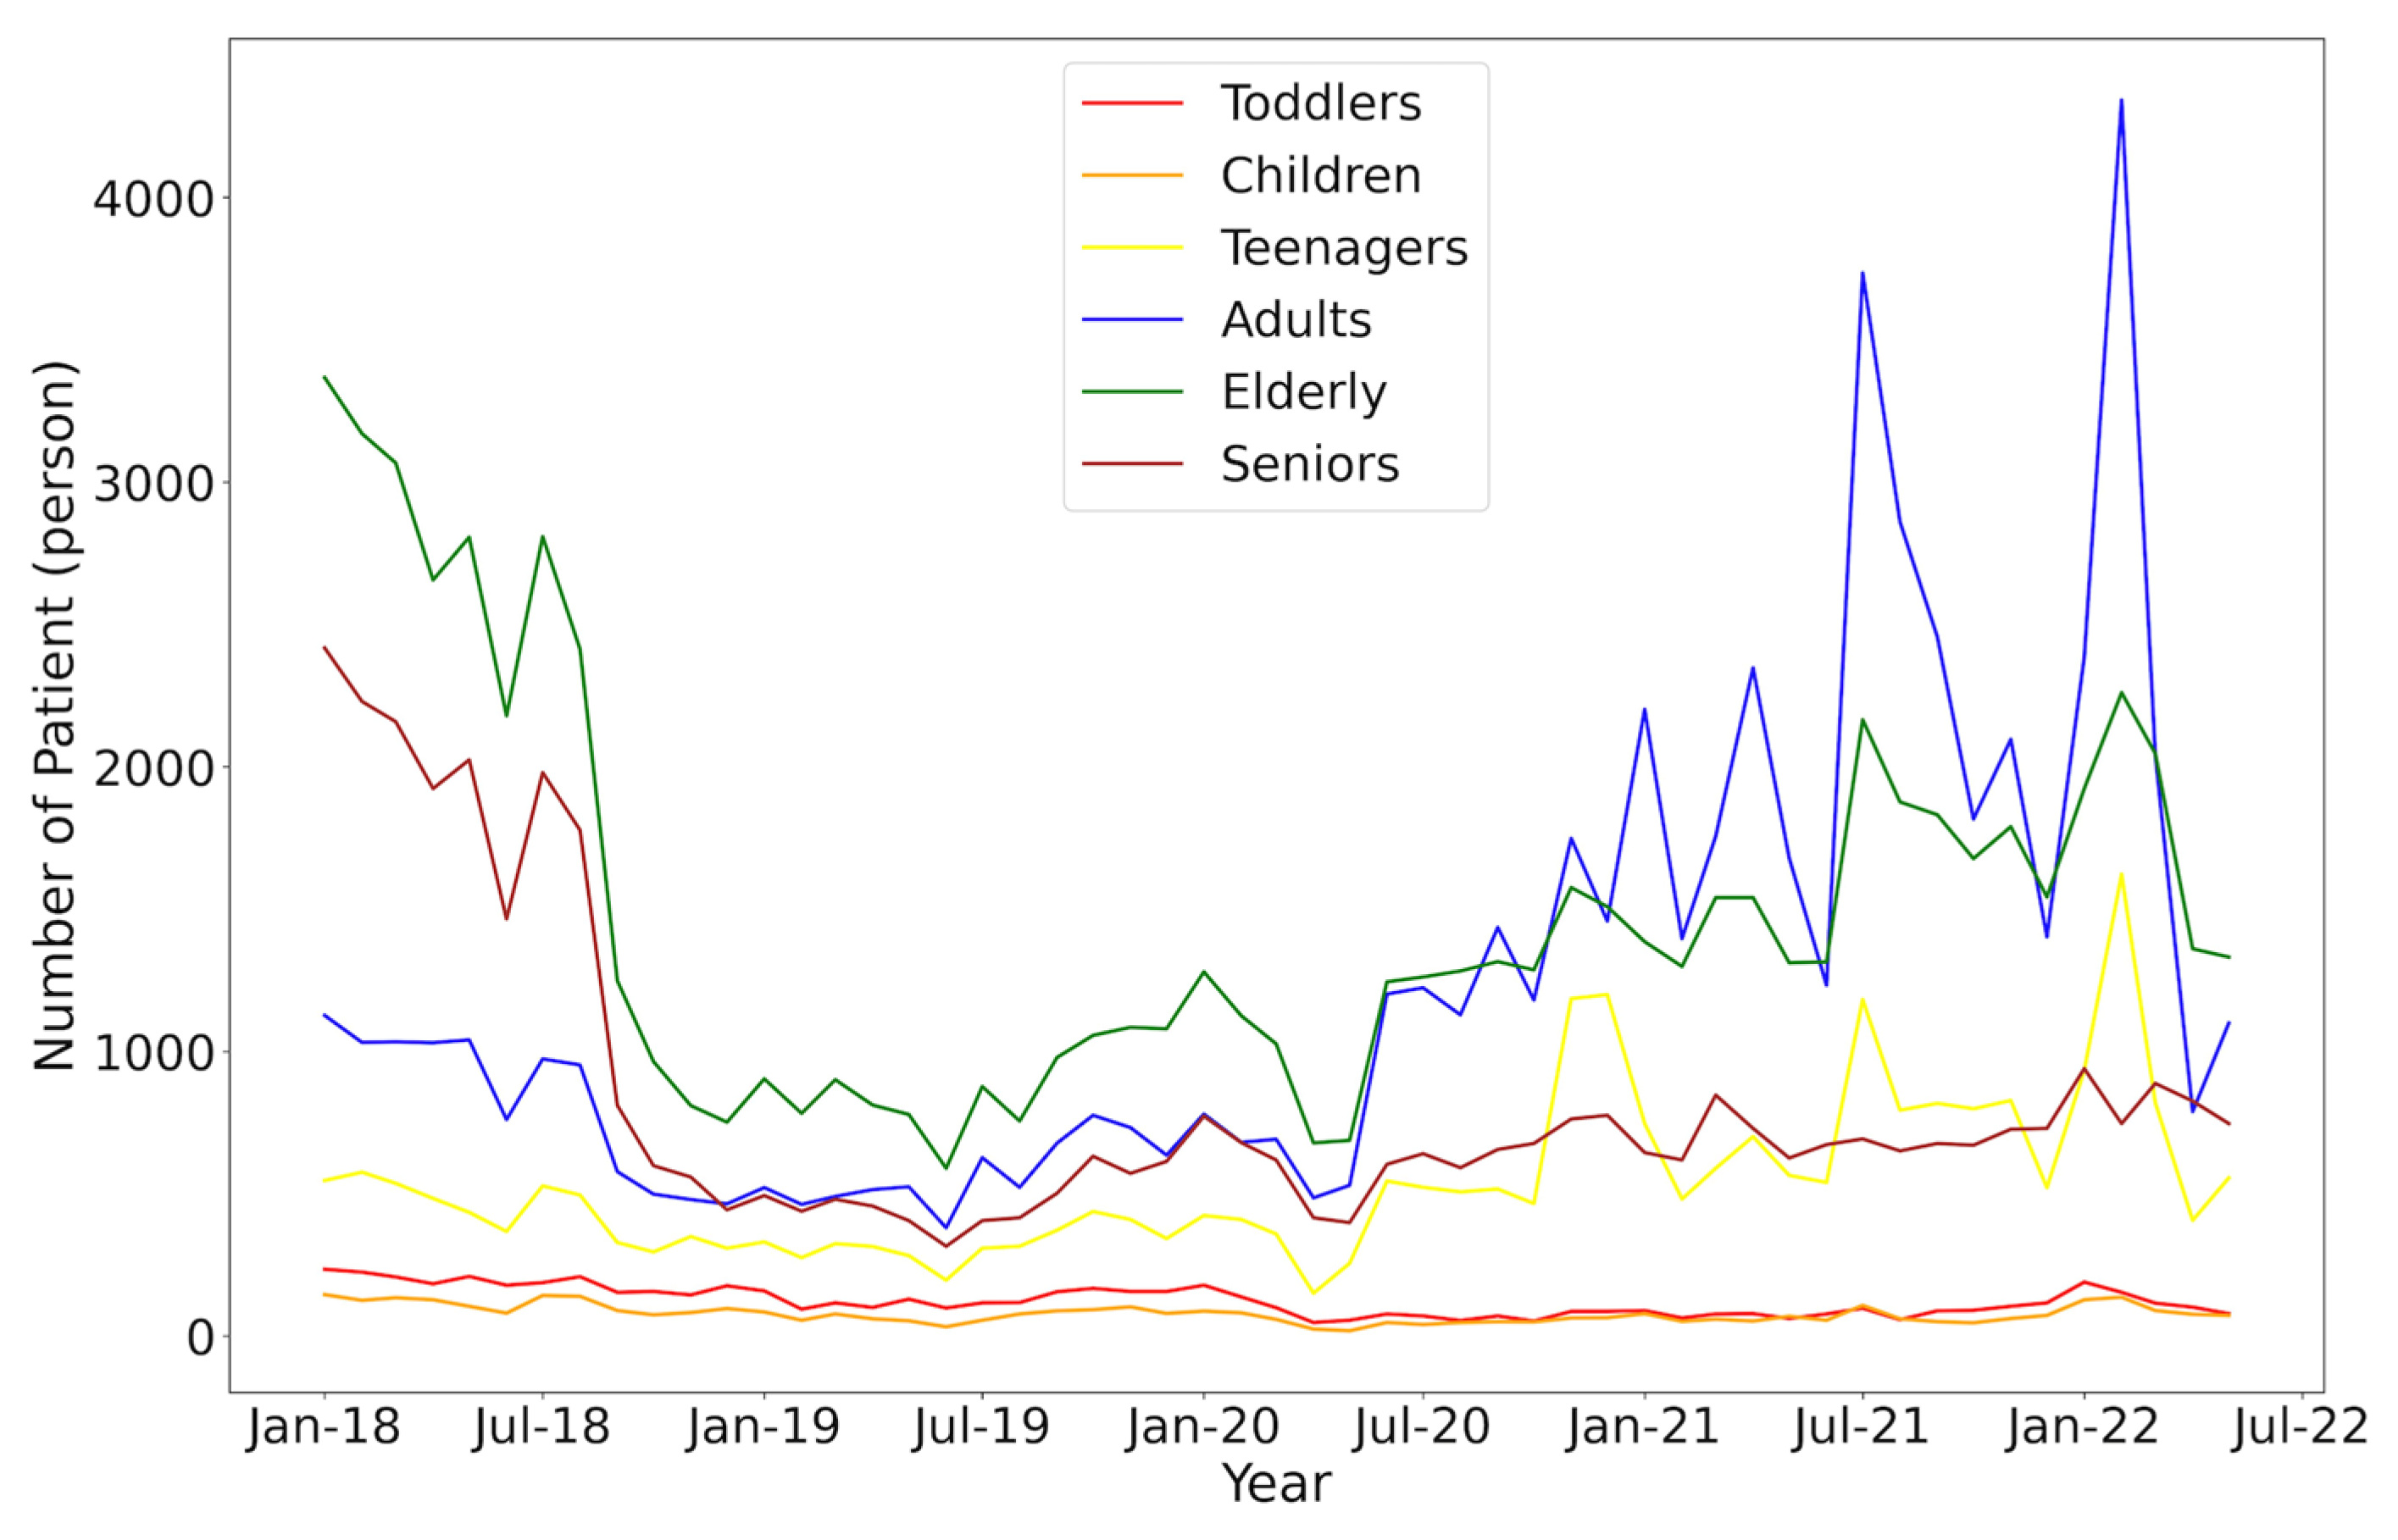
An analysis based on age provides an understanding of variations in disease patterns at different stages of life, as shown in Figure 12 for 2018–2022, which was used in the prediction for 2023 for the rate based on the residents of stay-in districts. Graphs have identified specific age groups that are more vulnerable to certain types of diseases. These findings can be utilised to develop more responsive and age-specific public health programmes that cater to the health needs of various age groups. Overall, the data analysis from the graphs has a positive impact on public health. These findings serve as a foundation for formulating effective prevention strategies, health promotion efforts, and targeted healthcare for various population groups. The results of this research also serve as a reference for hospitals and relevant stakeholders to improve the quality of healthcare services and design more holistic as well as inclusive policies to enhance the overall well-being of the community. Figure 14 shows the patient data referring to age for the 2018–2022 results, with 2018 having a high number of patients. This decreased in the intervening years and returned in 2022 due to human mobility being free in many locations.
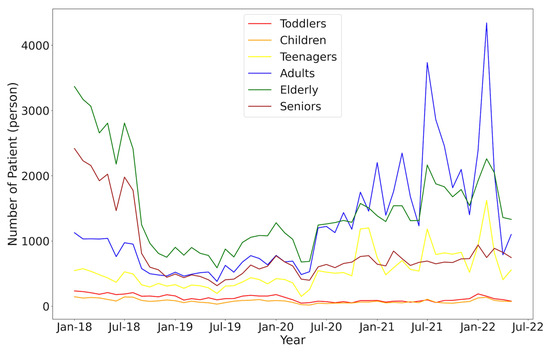
Figure 14.
Results of patient data based on an age analysis for 2018–2022.
The hospital health prediction data from 2018 to 2022 for the forecast years 2022 to 2024 have been processed and presented in terms of disease classified and, in particular, medical treatment centre, as shown in Figure 15, to provide an overview of potential health trends in the future. These graphs utilise historical data from previous years to identify patterns and trends emerging in the number of disease cases and disease distribution based on age, gender, and regional residence. The predictive data offer valuable insights for the hospital and stakeholders in planning and allocating healthcare resources more efficiently and effectively. By understanding the projected number of patients and types of diseases that may be encountered in the upcoming period, the hospital can anticipate the need for more targeted healthcare services. Overall, no significant increase in patients occurred in 2022–2024.
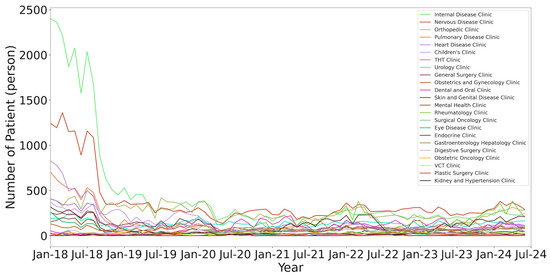
Figure 15.
Prediction of patients up to 2024 as plotted.
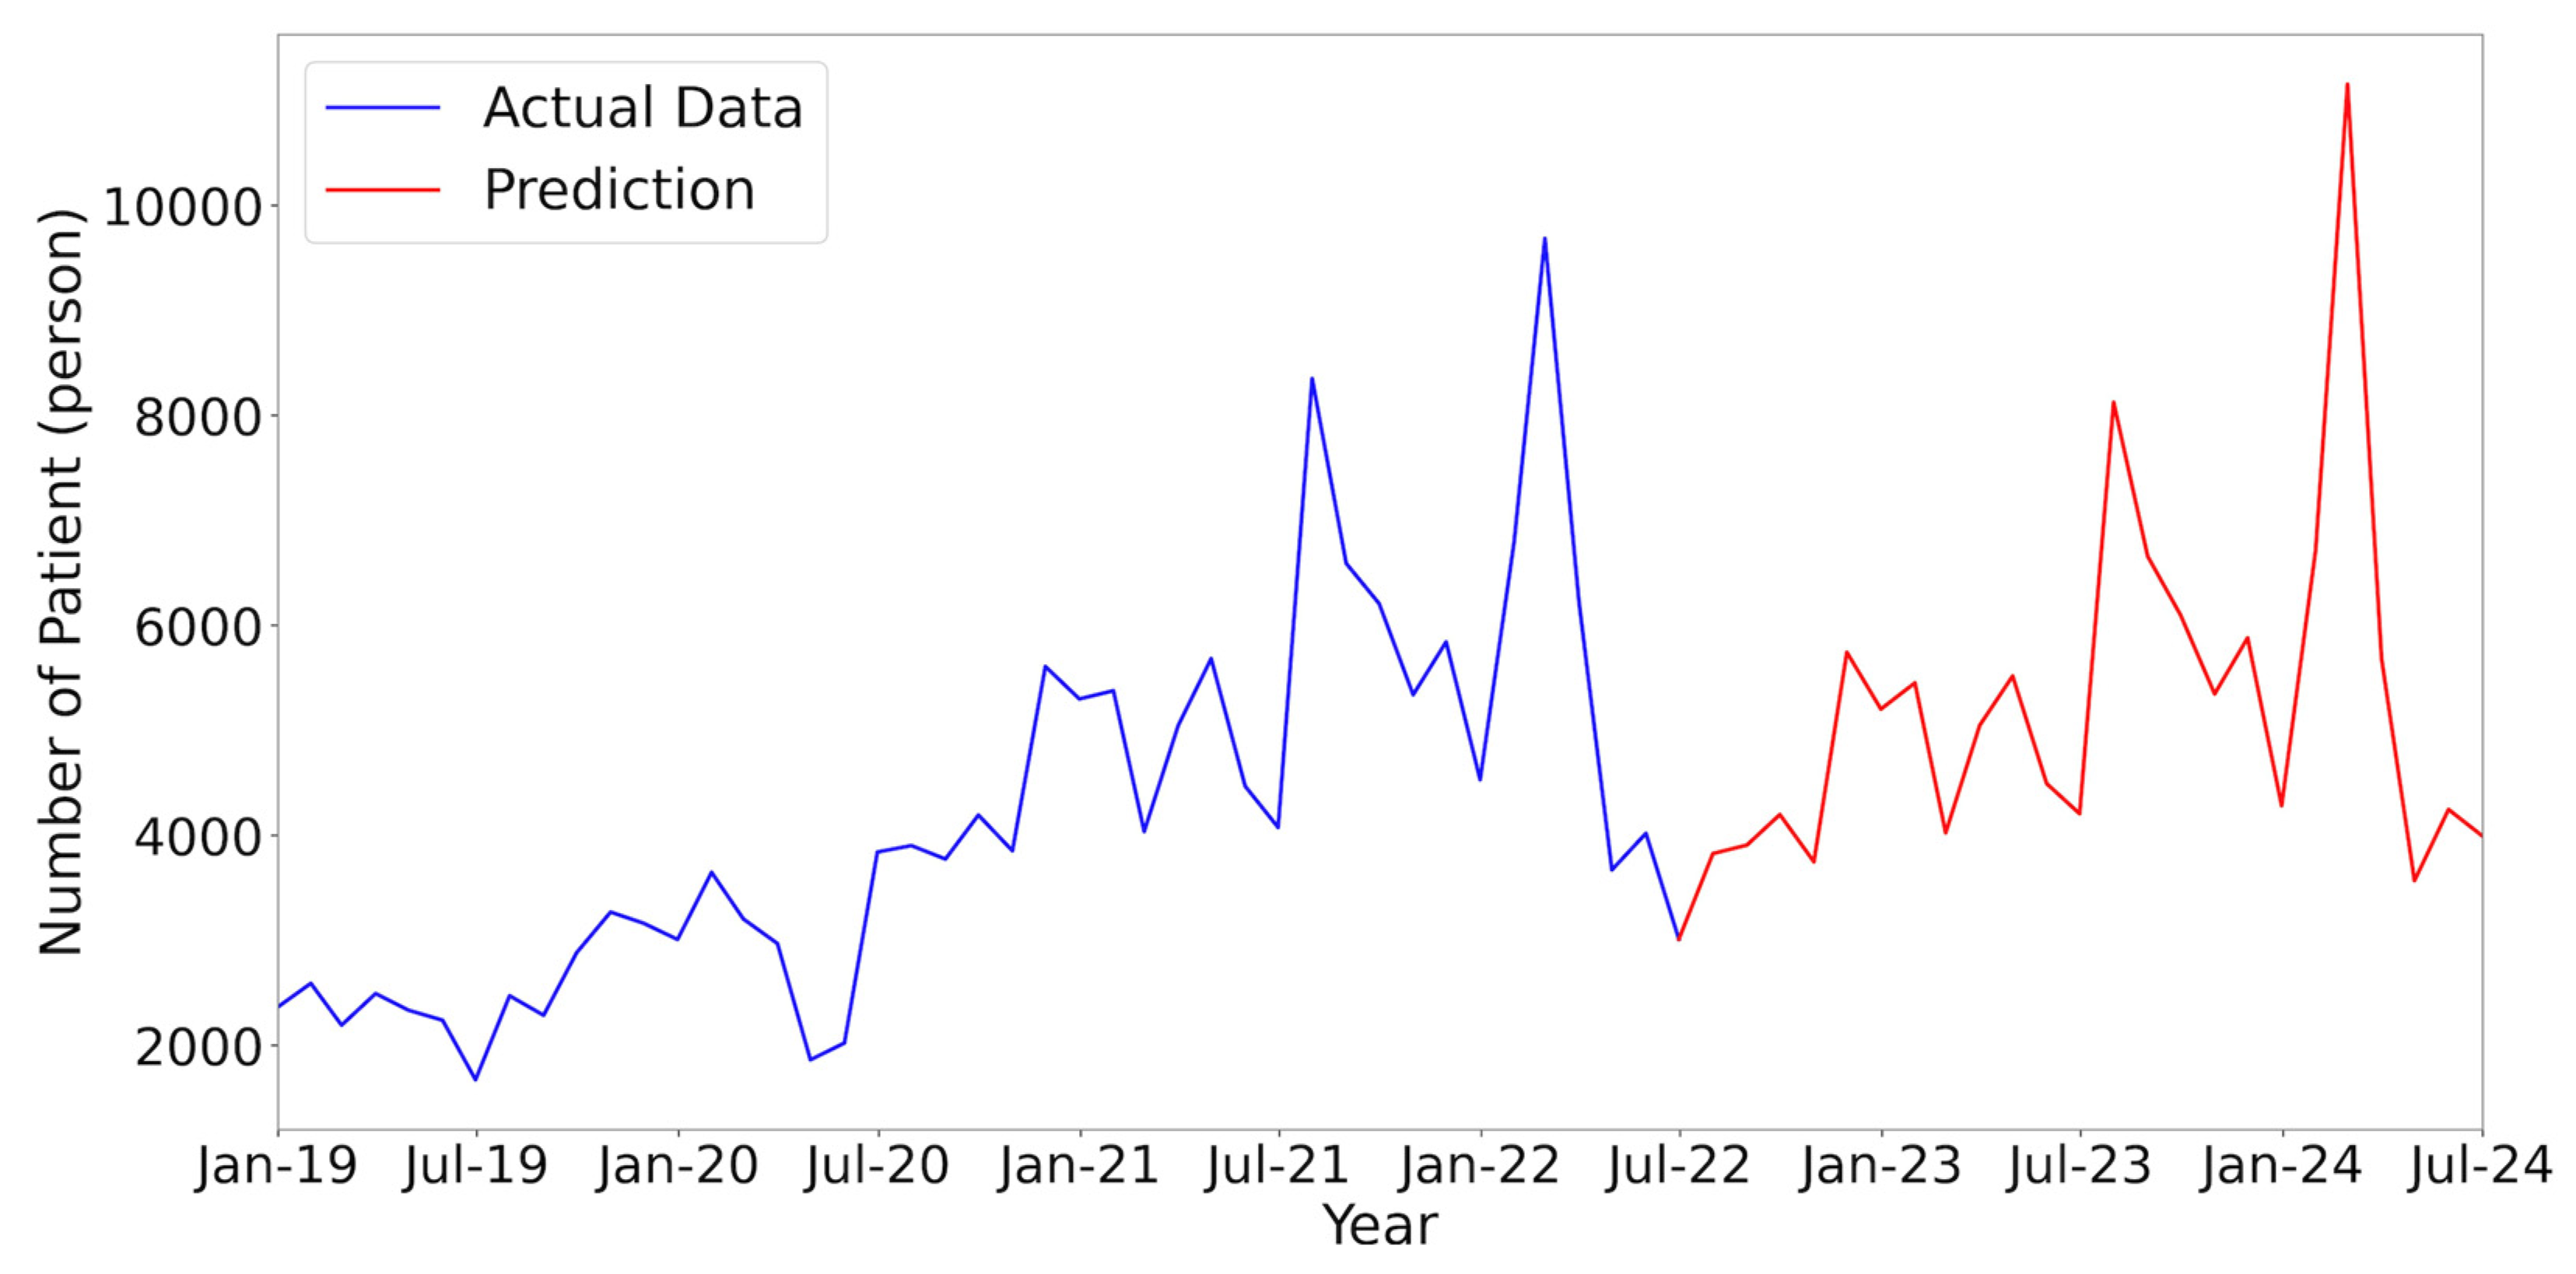
Images such as the prediction graphs also aid in identifying changes in epidemiology that may occur from year to year. An increase or decrease in the number of specific disease cases can serve as an indicator of specific health issues that need to be addressed more seriously and continuously. Furthermore, these health prediction data provide a foundation for formulating prevention programmes and health promotion initiatives that focus on high-risk groups and vulnerable regions. When specific age groups or genders that may be more susceptible to a particular disease are identified, preventive measures and health education can be targeted specifically towards them. In the overall patient prediction data, an increasing trend is observed towards the end of 2023, particularly from August to September 2023 well into 2024. The highest number of patients is in March, as shown in Figure 16 for the overall patient data in a hospital.
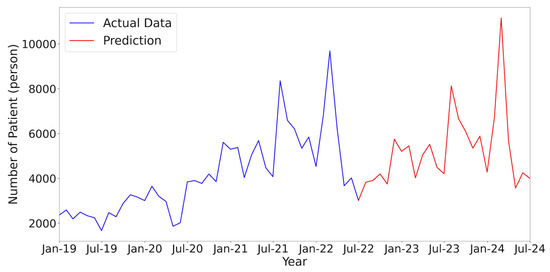
Figure 16.
Prediction of overall patient data up to 2024.
In an analysis that involves predicting from a dataset, there is a level of uncertainty that needs to be acknowledged. Health prediction data are estimations based on historical data and certain assumptions. Factors such as lifestyle changes, environmental influences, or unforeseen events can impact actual outcomes in the future. Therefore, predictions should be used as a reference, and precautionary measures in decision making and management need to be carefully considered. As a result, prediction graphs should be interpreted cautiously and supplemented with more in-depth data analysis and ongoing monitoring to update and correct predictions over time. Ultimately, all data and analyses are essential for providing an overview, and some results indicate a relatively low level of error, making them useful as references for more effective decision making in organisational management. The full collected and analysis data can refer to the supplementary materials attached.
The work of patient data analyses with real cases at a hospital in Indonesia, predicting the number of potential cases of disease for future years, is presented as results. The method used, deep learning with the LSTM algorithm, has limitations due to the small amount of data collected and then the amount of data affected by the result, because the method refers to the data learning for the previous years. High numbers and longer spans of data collected for previous time periods contribute to the accuracy in decision making. Data analyses use machine learning, and test datasets require a large number of patient data followed by good decisions for predictions with high accuracy. In some cases, the small amount of data collected from the direct analysis to plot the graph and check the trend may assist in the decision. The results may be a good recommendation and plotted into a similar trend to the previous data collected from the hospital.
5. Conclusions
The final patient data analysis in a hospital in the city of Medan, Indonesia, provides a deeper understanding of the public health situation in the North Sumatra region, Indonesia. Gaining insights from these data, we hope that public health efforts can be more targeted, effective, and sustainable in improving the overall quality of life and well-being of the community. Through collaboration between healthcare professionals, hospital management, and local government, the implications and conclusions from this data analysis can serve as a strong foundation for achieving better public health goals in the North Sumatra region. Despite some weaknesses, a patient data analysis in hospitals still provides valuable contributions to understanding public health and helps in formulating more targeted policies and interventions. Acknowledging these weaknesses allows for the improvement and enhancement of health studies in the future to make a more optimal contribution to the health and well-being of a community.
Based on the results of a patient data analysis in hospitals in the city of Medan, we make several recommendations to be considered for the future in an attempt to improve healthcare services in the region. First, health data sources must be enhanced and diversified. By integrating data from various hospitals and healthcare facilities in the region, we can have a more comprehensive and representative picture of public health. Additionally, the second recommendation is to involve healthcare professionals and researchers from various disciplines in the process of data analysis and interpretation. Collaboration across disciplines will bring together different perspectives and enrich the understanding of public health conditions, providing insights for more holistic healthcare system improvements. Furthermore, efforts are needed to improve the accuracy and quality of collected data. Training for healthcare personnel in proper documentation and data collection will minimise errors and potential biases. Future work advises integration not only in North Sumatra but also in larger areas covering all hospitals in Sumatra or Indonesia to obtain high-accuracy data analyses. The method proposed and used in this work can be used with any patient data from other hospitals or health centres, either in Indonesia or other countries. Analyses and scenarios with which to visualise results with abnormality concerns and make predictions for future years are the main objectives in checking disease trends before, during, and after the COVD-19 pandemic.
Supplementary Materials
The following supporting information can be downloaded at: https://www.mdpi.com/2078-2489/15/1/41/s1.
Author Contributions
Idea concept and writing—original draft preparation, L.D.P.; supervising, administration, funding, and conceptual, E.G.; facilities of project administration and funding, I.N.E.L.; methodology and review as well as software, H.T.K.; formal analysis, methodology, and software, E.A.K.; data collection and analysis, S.L.R. All authors have read and agreed to the published version of the manuscript.
Funding
This research and work were funded internally by the Universitas Prima Indonesia for the 2023 fiscal year, and were supported by collaborators for the facilities and labour.
Informed Consent Statement
In this research, there is no direct interaction or conflict of interest to the patient in hospital.
Data Availability Statement
Data are contained within the article.
Acknowledgments
This work was supported by Universitas Prima Indonesia in collaboration with the Universitas Islam Riau of Indonesia and Harvard University under university collaboration programmes.
Conflicts of Interest
All of the authors declare no conflicts of interest for this manuscript.
Correction Statement
This article has been republished with a minor correction to an affiliation number. This change does not affect the scientific content of the article.
References
- Hospital PI. Hospital Patient Data in South Sumatra; Hospital PI: Medan, India, 2022. [Google Scholar]
- Stoto, M.A. Population Health Measurement: Applying Performance Measurement Concepts in Population Health Settings. Public Health Syst. Serv. Res. 2014, 2, 1–27. [Google Scholar] [CrossRef] [PubMed][Green Version]
- Hirani, R.; Noruzi, K.; Iqbal, A.; Hussaini, A.S.; Khan, R.A.; Harutyunyan, A.; Etienne, M.; Tiwari, R.K. A Review of the Past, Present, and Future of the Monkeypox Virus: Challenges, Opportunities, and Lessons from COVID-19 for Global Health Security. Microorganisms 2023, 11, 2713. [Google Scholar] [CrossRef] [PubMed]
- Connerton, P.; Vicente de Assunção, J.; Maura de Miranda, R.; Dorothée Slovic, A.; José Pérez-Martínez, P.; Ribeiro, H. Air Quality during COVID-19 in Four Megacities: Lessons and Challenges for Public Health. Int. J. Environ. Res. Public Health 2020, 17, 5067. [Google Scholar] [CrossRef] [PubMed]
- Zhou, Y.; Chen, T.; Wang, J.; Xu, X. Analyzing the Factors Driving the Changes of Ecosystem Service Value in the Liangzi Lake Basin—A GeoDetector-Based Application. Sustainability 2023, 15, 15763. [Google Scholar] [CrossRef]
- Salamah, Y.; Asyifa, R.D.; Afifah, T.Y.; Maulana, F.; Asfarian, A. Thymun: Smart Mobile Health Platform for the Autoimmune Community to Improve the Health and Well-Being of Autoimmune Sufferers in Indonesia. In Proceedings of the 2020 8th International Conference on Information and Communication Technology (ICoICT), Yogyakarta, Indonesia, 24–26 June 2020; pp. 1–6. [Google Scholar]
- Bernasconi, A.; Grandi, S. A Conceptual Model for Geo-Online Exploratory Data Visualization: The Case of the COVID-19 Pandemic. Information 2021, 12, 69. [Google Scholar] [CrossRef]
- Monlezun, D.J. Percutaneous Coronary Intervention Mortality, Cost, Complications, and Disparities after Radiation Therapy: Artificial Intelligence-Augmented, Cost Effectiveness, and Computational Ethical Analysis. J. Cardiovasc. Dev. Dis. 2023, 10, 445. [Google Scholar] [CrossRef]
- Vazanic, D.; Kurtovic, B.; Balija, S.; Milosevic, M.; Brborovic, O. Predictors, Prevalence, and Clinical Outcomes of Out-of-Hospital Cardiac Arrests in Croatia: A Nationwide Study. Healthcare 2023, 11, 2729. [Google Scholar] [CrossRef]
- Montuori, P.; Gentile, I.; Fiorilla, C.; Sorrentino, M.; Schiavone, B.; Fattore, V.; Coscetta, F.; Riccardi, A.; Villani, A.; Trama, U.; et al. Understanding Factors Contributing to Vaccine Hesitancy in a Large Metropolitan Area. Vaccines 2023, 11, 1558. [Google Scholar] [CrossRef]
- Dalapati, T.; Nick, S.E.; Chari, T.A.; George, I.A.; Hunter Aitchison, A.; MacEachern, M.P.; O’Sullivan, A.N.; Taber, K.A.; Muzyk, A. Interprofessional Climate Change Curriculum in Health Professional Programs: A Scoping Review. Educ. Sci. 2023, 13, 945. [Google Scholar] [CrossRef]
- De Vito, A.; Moi, G.; Saderi, L.; Puci, M.V.; Colpani, A.; Firino, L.; Puggioni, A.; Uzzau, S.; Babudieri, S.; Sotgiu, G.; et al. Vaccination and Antiviral Treatment Reduce the Time to Negative SARS-CoV-2 Swab: A Real-Life Study. Viruses 2023, 15, 2180. [Google Scholar] [CrossRef]
- Tanumihardjo, J.P.; Davis, H.; Zhu, M.; On, H.; Guillory, K.K.; Christensen, J. Enhancing Chronic-Disease Education through Integrated Medical and Social Care: Exploring the Beneficial Role of a Community Teaching Kitchen in Oregon. Nutrients 2023, 15, 4368. [Google Scholar] [CrossRef] [PubMed]
- Swaney, R.; Jokomo-Nyakabau, R.; Nguyen, A.A.N.; Kenny, D.; Millner, P.G.; Selim, M.; Destache, C.J.; Velagapudi, M. Diagnosis and Outcomes of Fungal Co-Infections in COVID-19 Infections: A Retrospective Study. Microorganisms 2023, 11, 2326. [Google Scholar] [CrossRef] [PubMed]
- Khatri, S.; al-Sulbi, K.; Attaallah, A.; Ansari, M.T.; Agrawal, A.; Kumar, R. Enhancing Healthcare Management during COVID-19: A Patient-Centric Architectural Framework Enabled by Hyperledger Fabric Blockchain. Information 2023, 14, 425. [Google Scholar] [CrossRef]
- Sekiyama, M.; Roosita, K.; Ohtsuka, R. Locally Sustainable School Lunch Intervention Improves Hemoglobin andHematocrit Levels andBody Mass Index among Elementary Schoolchildren in Rural West Java, Indonesia. Nutrients 2017, 9, 868. [Google Scholar] [CrossRef] [PubMed]
- Abdul Kadir, E.; Listia Rosa, S.; Syukur, A.; Othman, M.; Daud, H. Forest fire spreading and carbon concentration identification in tropical region Indonesia. Alex. Eng. J. 2022, 61, 1551–1561. [Google Scholar] [CrossRef]
- Huang, L. Developing Place-Based Health during the COVID-19 Pandemic: A Case Study of Taipei City’s Jiuzhuang Community Garden. Sustainability 2023, 15, 12422. [Google Scholar] [CrossRef]
- Gan, D.R.Y.; Cheng, G.H.-L.; Ng, T.P.; Gwee, X.; Soh, C.Y.; Fung, J.C.; Cho, I.S. Neighborhood Makes or Breaks Active Ageing? Findings from Cross-Sectional Path Analysis. Int. J. Environ. Res. Public Health 2022, 19, 3695. [Google Scholar] [CrossRef]
- Gunawan, H.; Abdul Kadir, E. Integration protocol student academic information to campus RFID gate pass system. In Proceedings of the International Conference on Electrical Engineering, Computer Science and Informatics (EECSI), Yogyakarta, Indonesia, 19–21 September 2017. [Google Scholar]
- Kadir, E.A.; Shamsuddin, S.M.; Rahman, T.A.; Samad Ismail, A. Big Data Network Architecture and Monitoring Use Wireless 5G Technology. Int. J. Adv. Soft Comput. Appl. 2015, 7, 1–14. [Google Scholar]
- Chae, K.; Kim, M.; Kim, B.O.; Jung, C.Y.; Kang, H.-J.; Oh, D.-J.; Jeon, D.W.; Chung, W.Y.; Choi, C.U.; Han, K.R.; et al. Public Reporting on the Quality of Care in Patients with Acute Myocardial Infarction: The Korean Experience. Int. J. Environ. Res. Public Health 2022, 19, 3169. [Google Scholar] [CrossRef]
- Ramirez-Alcocer, U.M.; Tello-Leal, E.; Romero, G.; Macías-Hernández, B.A. A Deep Learning Approach for Predictive Healthcare Process Monitoring. Information 2023, 14, 508. [Google Scholar] [CrossRef]
- Kadir, E.A.; Siswanto, A.; Yulian, A. Home Monitoring System Based on Cloud Computing Technology and Object Sensor. In Proceedings of the Second International Conference on the Future of ASEAN (ICoFA) 2017, Kangar, Malaysia, 15–16 August 2017; Volume 2. [Google Scholar]
- Zeng, H.; Deng, S.; Zhou, Z.; Qiu, X.; Jia, X.; Li, Z.; Wang, J.; Duan, H.; Tu, L. Diagnostic value of combined nucleic acid and antibody detection in suspected COVID-19 cases. Public Health 2020, 186, 1–5. [Google Scholar] [CrossRef] [PubMed]
- Kadir, E.A. Development of information and communication technology (ICT) in container terminal for speed up clearance process. J. Commun. 2017, 12, 207–213. [Google Scholar] [CrossRef][Green Version]
- Kadir, E.A.; Kung, H.T.; AlMansour, A.A.; Irie, H.; Rosa, S.L.; Fauzi, S.S. Wildfire Hotspots Forecasting and Mapping for Environmental Monitoring Based on the Long Short-Term Memory Networks Deep Learning Algorithm. Environments 2023, 10, 124. [Google Scholar] [CrossRef]
- Shaikh, M.A. Prevalence and Correlates of Intimate Partner Violence against Women in Liberia: Findings from 2019–2020 Demographic and Health Survey. Int. J. Environ. Res. Public Health 2022, 19, 3519. [Google Scholar] [CrossRef]
- Taniguchi, Y.; Yamazaki, S.; Nakayama, S.F.; Sekiyama, M.; Michikawa, T.; Isobe, T.; Iwai-Shimada, M.; Kobayashi, Y.; Takagi, M.; Kamijima, M.; et al. Baseline Complete Blood Count and Chemistry Panel Profile from the Japan Environment and Children’s Study (JECS). Int. J. Environ. Res. Public Health 2022, 19, 3277. [Google Scholar] [CrossRef]
- Dierbach, C. Python as a First Programming Language. J. Comput. Sci. Coll. 2014, 29, 73. [Google Scholar]
- Sherstinsky, A. Fundamentals of Recurrent Neural Network (RNN) and Long Short-Term Memory (LSTM) network. Phys. D Nonlinear Phenom. 2020, 404, 132306. [Google Scholar] [CrossRef]
- Kadir, E.A.; Kung, H.T.; Rosa, S.L.; Sabot, A.; Othman, M.; Ting, M. Forecasting of Fires Hotspot in Tropical Region Using LSTM Algorithm Based on Satellite Data. In Proceedings of the 2022 IEEE Region 10 Symposium (TENSYMP), Mumbai, India, 1–3 July 2022; pp. 1–7. [Google Scholar]
- Wang, K.; Niu, D.; Sun, L.; Zhen, H.; Liu, J.; De, G.; Xu, X. Wind Power Short-Term Forecasting Hybrid Model Based on CEEMD-SE Method. Processes 2019, 7, 843. [Google Scholar] [CrossRef]
- Hochreiter, S.; Schmidhuber, J. Long Short-Term Memory. Neural Comput. 1997, 9, 1735–1780. [Google Scholar] [CrossRef]
- Ding, W.; Qie, X. Prediction of Air Pollutant Concentrations via RANDOM Forest Regressor Coupled with Uncertainty Analysis—A Case Study in Ningxia. Atmosphere 2022, 13, 960. [Google Scholar] [CrossRef]
- Liu, Y.; Wu, R.; Yang, A. Research on Medical Problems Based on Mathematical Models. Mathematics 2023, 11, 2842. [Google Scholar] [CrossRef]
- Bishop, C.M. Neural Networks for Pattern Recognition; Oxford University Press: New York, NY, USA, 1995; 504p. [Google Scholar]
Disclaimer/Publisher’s Note: The statements, opinions and data contained in all publications are solely those of the individual author(s) and contributor(s) and not of MDPI and/or the editor(s). MDPI and/or the editor(s) disclaim responsibility for any injury to people or property resulting from any ideas, methods, instructions or products referred to in the content. |
© 2024 by the authors. Licensee MDPI, Basel, Switzerland. This article is an open access article distributed under the terms and conditions of the Creative Commons Attribution (CC BY) license (https://creativecommons.org/licenses/by/4.0/).

