Article

Predicting Emergency Department Utilization among Older Hong Kong Population in Hot Season: A Machine Learning Approach

1
Department of Social Work and Social Administration, Faculty of Social Sciences, The University of Hong Kong, Hong Kong SAR, China
2
Department of Civil, Environmental and Natural Resources Engineering, Luleå University of Technology, SE-97187 Luleå, Sweden
3
School of Nursing, Li Ka Shing Faculty of Medicine, The University of Hong Kong, Hong Kong SAR, China
4
Department of Architecture, Faculty of Architecture, The University of Hong Kong, Hong Kong SAR, China
*
Author to whom correspondence should be addressed.
Information 2022, 13(9), 410; https://doi.org/10.3390/info13090410
Submission received: 7 July 2022 / Revised: 12 August 2022 / Accepted: 18 August 2022 / Published: 29 August 2022
(This article belongs to the Special Issue Advances in AI for Health and Medical Applications)

Abstract

:
Previous evidence suggests that temperature is associated with the number of emergency department (ED) visits. A predictive system for ED visits, which takes local temperature into account, is therefore needed. This study aimed to compare the predictive performance of various machine learning methods with traditional statistical methods based on temperature variables and develop a daily ED attendance rate predictive model for Hong Kong. We analyzed ED utilization among Hong Kong older adults in May to September from 2000 to 2016. A total of 103 potential predictors were derived from 1- to 14-day lag of ED attendance rate and meteorological and air quality indicators and 0-day lag of holiday indicator and month and day of week indicators. LASSO regression was used to identify the most predictive temperature variables. Decision tree regressor, support vector machine (SVM) regressor, and random forest regressor were trained on the selected optimal predictor combination. Deep neural network (DNN) and gated recurrent unit (GRU) models were performed on the extended predictor combination for the previous 14-day horizon. Maximum ambient temperature was identified as a better predictor in its own value than as an indicator defined by the cutoff. GRU achieved the best predictive accuracy. Deep learning methods, especially the GRU model, outperformed conventional machine learning methods and traditional statistical methods.

1. Introduction

Global warming is becoming an increasingly important concern worldwide. The global surface temperature rose by 1.09 °C in 2011–2020 as compared to 1850–1900 and the continuous rise was projected to exceed 2 °C during this century [1]. In metropolitan areas, the air temperature, especially at nighttime, is amplified by urban heat island (UHI) effect [2]. The older population is vulnerable to extreme heat due to their impaired physiological ability to regulate heat [3]. Previous studies have demonstrated the association between heat exposure and increased Emergency Department (ED) attendance risk. A United Kingdom (UK) study demonstrated a 0.6% increase in daily ED attendance risk in people aged 65–74 with 1 °C increase in mean ambient temperature [4]. In Asia, increased risk of ED visits due to cardiovascular diseases and respiratory diseases among older adults was also shown to be associated with high indoor temperatures (such as 31 °C lasting over one hour) during the hot season in Taiwan [5,6]. While temperature had been used as predictor for ED visits in many studies, its prediction performance varied. A previous study found that meteorological information, including daily mean temperature, improved the predictive performance of a hierarchical Bayesian model on daily ED visits [7]. In contrast, there were evidence showed that incorporating climatic factors (including mean, maximum, and minimum ambient temperature) did not improve the predictive performance [8,9]. A recent study using linear regression reported association between ED visits and heat stress defined by Universal Thermal Climate Index, which incorporated ambient temperature, humidity, wind speed, and radiant temperature into an index [10].
Globally, EDs face increasing emergency care demand, especially with an aging population. Older adults are reported as frequent users of EDs [11,12]. In the United States (US), the ED usage of older people aged 65 or over increased by 25% from 2001 to 2009 [13]. The growing demand accompanied by the shortage of healthcare resources might increase the workload of healthcare providers and adversely affect care quality, which may in turn decrease patients’ satisfaction and prognosis outcomes, or even increase the mortality rate [13]. Service providers have taken actions to address those issues by adopting strategies on regulating patient flow and improving the capacity of EDs. However, the effectiveness of these strategies relies heavily on reliable forecasts of ED visits and an early warning of the peaks of future patient flow. Therefore, there is a need to have an accurate prediction of healthcare utilization to help healthcare providers facilitate medical resources in advance, in case of summer surges.
Most previous studies have used conventional statistical models, such as time series models or regression models, to predict ED demand based on records of previous ED visits. Autoregressive integrated moving average (ARIMA) and its variations were a class of widely applied time-series data prediction models. The model eliminated the non-stationarity of data by initial differencing and made the prediction based on the history of time-series data. However, it was difficult to incorporate covariates and unstable to changes in observations and model specification [14]. Generalized linear models (GLMs) were simpler to implement compared to ARIMA. Previous studies demonstrated that GLMs outperformed ARIMA in predicting ED visits [8,15]. However, GLM were usually inefficient for big data volumes and prone to noise and overfitting. While conventional statistical models are more useful in inferring associations between variables, machine learning methods are superior in predictive tasks with capability of handling non-stationary data and robustness to outliers [16].
Machine learning methods have been applied to healthcare utilization prediction tasks since the last decade. For example, a previous study predicted hospital bed demand in ED attendances by support vector machine (SVM) and demonstrated 80% accuracy, which was comparable with experienced physicians [17]. Besides, ensemble learning methods, such as random forest (RF) and gradient boosting classifier (GBC), were also demonstrated as effective models for ED prediction [18]. Artificial neural network (ANN) was the most popular machine learning method used to predict ED visits. A US study applied an ANN classifier to forecast the peaks of ED demand due to respiratory diseases and achieved high classification accuracy [19]. A study from Hong Kong identified that ANN was superior to regression models in modelling the association between contributing predictors and daily non-critical patient arrivals at a local emergency department [20]. The ARIMA-ANN hybrid model, a variation of ANN, was demonstrated to outperform both linear regression and ARIMA in predicting the ED demand [21]. Advanced deep learning methods, such as deep neural network (DNN) and recurrent neural network (RNN), have been increasingly used to model massive electronic health records (EHRs). However, their application in prediction of healthcare utilization is scarce. Initial evidence showed that convolutional neural network (CNN), an advanced ANN with convolutional cells, and long short-term memory (LSTM), an efficient recurrent unit based on RNN architecture achieved better predictive performance than conventional machine learning models [16].
Over the past decade, there has been a significant increase in ED service demand accompanied by population growth and aging in Hong Kong. Meanwhile, global warming has taken its toll in the subtropical city Hong Kong. There was an average rise of 0.13 °C per decade from 1885 to 2021, with an accelerated growing trend reaching 0.31 °C per decade from 1992 to 2021 [22]. In addition, the urban heat island effect is prominent in Hong Kong, resulting from the high-density compact urban setting. The frequency, magnitude, and duration of extreme hot weather have been estimated to keep increasing during this century [23]. The extreme weather conditions have a noticeable negative effect on the residents’ health. Literature demonstrated that females and members of the older population were the most affected populations in Hong Kong during extremely hot weather [23]. Prior evidence also suggested that the help-seeking behavior of the older Hong Kong population significantly increased when they were exposed to hot weather, and females were even more sensitive to elevated temperature [24]. The public-funded healthcare providers in Hong Kong also encountered summer surges in recent years in addition to winter surges. It was reported that hospitalizations increased by 4.5% for every 1 °C increase in mean daily temperature above 29 °C [25]. There were always long queues in EDs of Hong Kong; the average waiting time ranged from 1 h to over 8 h. A reliable prediction model of ED attendance in Hong Kong remains lacking. Existing predictive models developed from other populations are specifically trained to serve the forecast needs in countries with different physical environments from Hong Kong and thus cannot be directly applied to Hong Kong. Hence, it is essential to develop a local model for application purpose in Hong Kong. Even though temperature was demonstrated to be associated with ED visits, its predictive ability and relative importance in the predictive model remains ambiguous. Besides, the choice of predictors is still a challenge in training predictive models especially when there are various measures of temperature. For instance, the predictor can be the daily minimum, maximum, or mean temperature at their own values, while the other option is to transfer these variables into indicators by a threshold. For own values, it is direct, but a possible U-shape may occur if the choice of the period under study is not starting with the tip of the U-shape. For the use of indicators, it can reduce the redundancy with the categorization, but the determination of the threshold is critical, and the information entropy decreases.
This study aimed to: (i) comprehensively compare the predictive performance of traditional statistical method, conventional machine learning approach, and advanced deep learning approach in predicting ED attendance rate; and (ii) identify the optimal predictive model that can be applied to Hong Kong. The findings of this study were of practical value. First, researchers around the world could repeat the algorithm with their local data and develop prediction models for their own settings. Second, service providers in Hong Kong could apply the prediction algorithm to better plan for ED resources. Third, the public could also be alerted with the high-risk period and initiate preventive measures.

2. Materials and Methods

2.1. Data Sources

Daily healthcare utilization data of ED admission for older people aged 65 and above from 1 January 2000 to 31 December 2016 were obtained from the Hong Kong Hospital Authority. Since the Hong Kong Hospital Authority manages all Accident and Emergency Departments under the public hospitals in Hong Kong, these data reflect all Hong Kong ED utilization at public hospitals. Population statistics were obtained from the Census and Statistics Department of Hong Kong. Daily maximum/mean/minimum ambient temperature data from the Hong Kong Observatory (HKO) Headquarter station were extracted from the HKO. Air quality data in terms of general Air Quality Health Index (AQHI) were obtained from the Environmental Protection Department of Hong Kong government [26].

2.2. Outcomes

The primary outcome of this study was the gender-specific daily ED attendance rate, which was measured as the daily ED attendance per 100,000 population.

2.3. Predictors

Previous works in the literature have reported predictors of ED utilization, including maximum, mean, and minimum ambient temperature [25,27,28]. We included the maximum, mean, and minimum ambient temperature from 1 to 14 days lag, resulting in 42 continuous variables. The lag of 1 to 14 days was chosen since the maximum number of lag studied in the literature was 13 [29], although shorter lags were considered elsewhere [23]. According to the HKO’s extreme hot weather warning system, Very Hot Day (VHD) was defined as daily maximum ambient temperature ≥ 33 °C and Hot Nights (HN) was defined as daily minimum ambient temperature ≥ 28 °C). We further included VHD and HN from 1 to 14 days lag, resulting in 28 binary indicators of extreme hot weather.
Apart from ambient temperature, we have a base variable set comprising 33 variables. We included ED attendance rates of lags 1 to 14 days, as there was evidence about autoregressive nature of the ED attendance [30]. AQHI was also included, since previous literature suggested that air pollution (ozone, nitrogen dioxide, sulfur dioxide, and particulate matter) was associated with short-term health risk, which may lead to hospital admissions [26]. We included lags 1 to 14 days of the daily general AQHI. A binary variable indicating whether the day was a holiday (including Sunday) was included to control the holiday effect. Finally, we exploited four sine- and cosine-transformed variables, two in a pair, to describe the cyclical patterns of month and day in the week across years [31]. An example of sine- and cosine-transformed month variables is visualized in Figure S1.
A total of 103 potential predictors, including the base set (33 variables), the ambient temperature set (42 variables), and the extreme hot weather indicator set (28 variables) were included (Table S1).

2.4. Statistical Analysis

We excluded data in 2003 to avoid the impact of the SARS outbreak in Hong Kong. A training data set comprising 10-years’ data (2000 to 2010, excluding 2003) was used to develop the models. A validation data set comprising three-years’ data (2011 to 2013) was used to select the optimal model. A testing data set comprising three-years’ data (2014 to 2016) was used to evaluate the performance of the model. Since the ED data is time-series data, we split the data in this way instead of random splitting.
We adopted typical models covering all of the three classes of predictive models (i.e., traditional statistics models, conventional machine learning models, advanced deep learning models). We applied linear regression (i.e., GLM with Gaussian distribution assumption) from traditional statistical models; decision tree, SVM and random forest from conventional machine learning models, and DNN and GRU from advanced deep learning models, based on their relative superior performance from literatures [16,17,32]. A detailed process of the analysis is presented in Figure 1.
We applied the least absolute shrinkage and selection operator (LASSO) regression to select significant predictors from the candidate ambient temperature variable set and the candidate extreme hot weather indicator set separately to identify the significant predictors within each set. In each gender subgroup, we applied 10-fold cross validation on the standardized data to find the optimal hyperparameter and substituted it back to the regression formula to shrink the scale of candidate variables. We removed variables with zero coefficient and kept the rest as selected variables. We then fit a linear regression model (Model 1) by including the base variable set (i.e., ED attendance rates and general AHQI at lags 1–14, the current holiday indicator, and paired month and week indicating variables). Then, Model 2 was built on Model 1 plus the selected ambient temperature variables; and Model 3 was built on Model 1 plus the selected extreme hot weather indicators. We applied linear regression to evaluate the performance of the three models on the test data set in terms of evaluation metrics (see Formula (2) and (3)). The model with the best performance was named as the baseline model. The variables in the baseline model were chosen to be used in the machine learning algorithm. Based on the variables in the baseline model, we applied 10-fold cross validation to decide the hyperparameters of conventional machine learning models: decision tree, support vector machine (SVM), and random forest. Then, we tested the predictive ability of each model from conventional machine learning and the baseline model from linear regression. This would inform us if conventional machine learning could have better prediction performance than the linear regression given the same set of predictors. On the other hand, deep learning methods could do the feature selection automatically without the need to go through the feature selection step, although the shortcoming is that the selected feature was not visualized. We tested the performance of deep learning models based on two methods, namely deep neural network (DNN) and gated recurrent unit (GRU), and compared with those from conventional machine learning models. For deep learning, an extended feature set had to be used as all of the features had to be on the same 14-day horizon (1–14 lags).
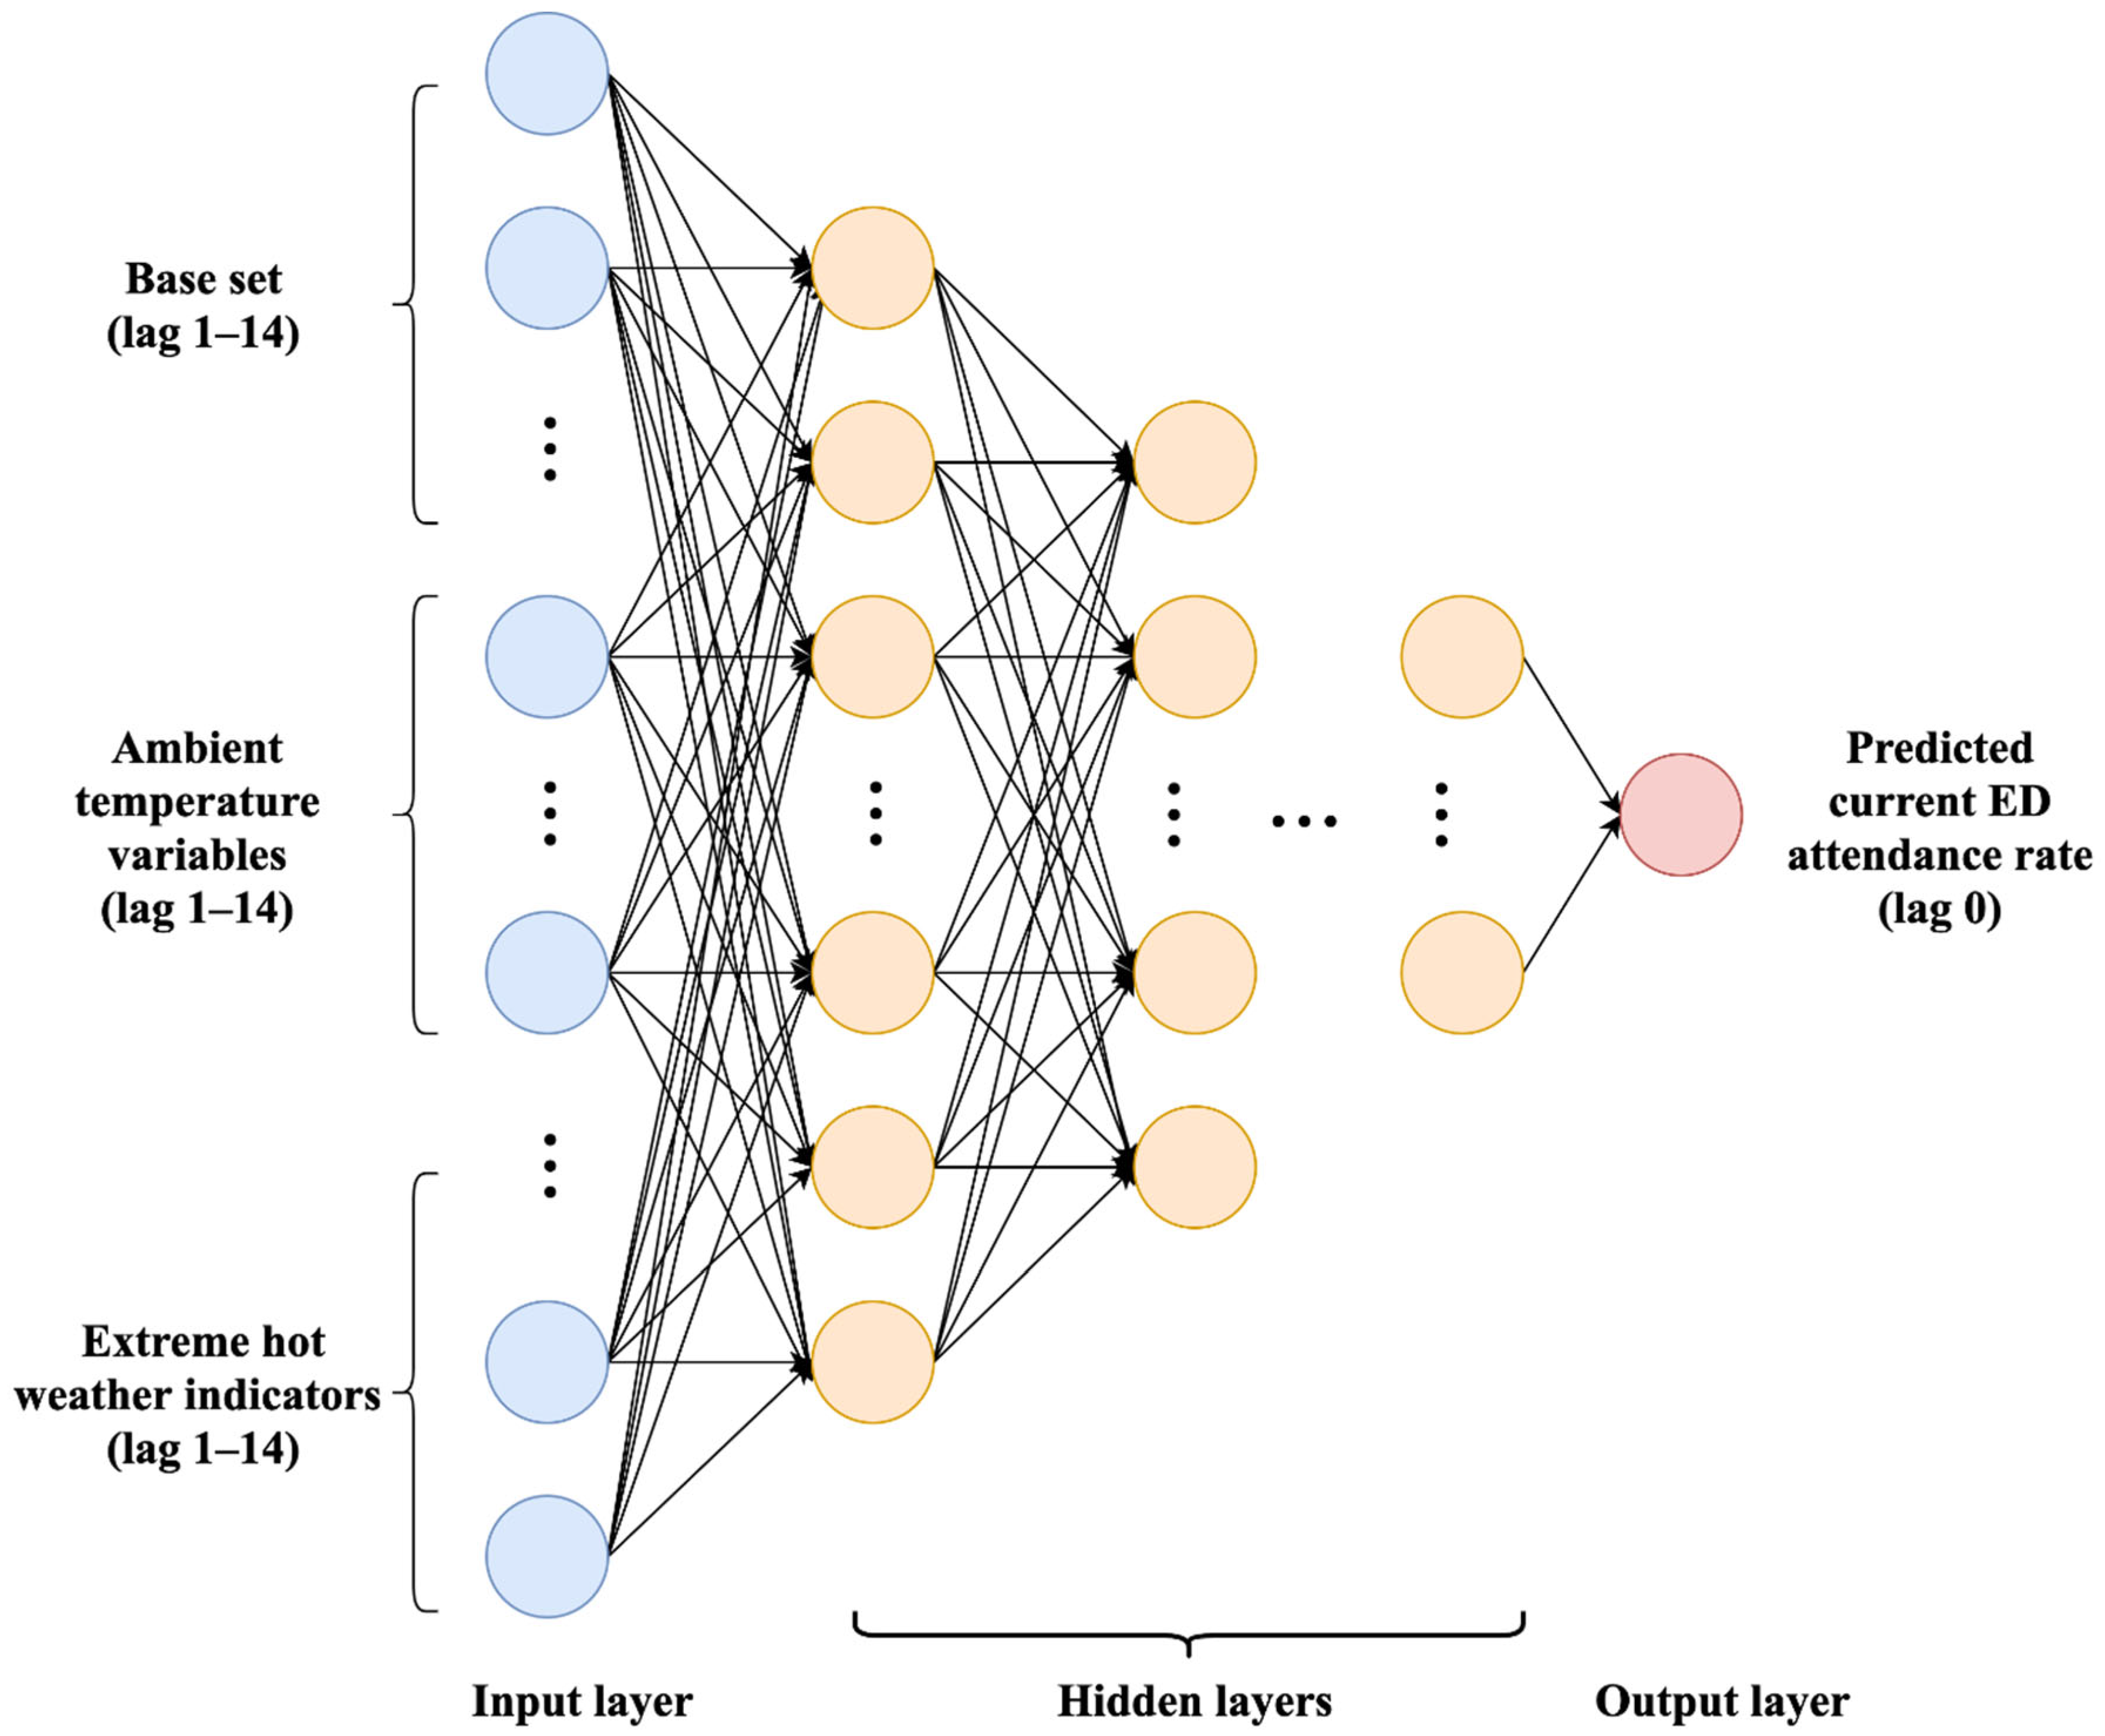
Decision trees and SVM are two conventional machine learning methods in regression and classification tasks. The decision tree generates the optimal tree structure by deciding the feature and the split at each node [33]. In contrast, SVM aims at optimizing a maximum-margin hyperplane to achieve the best prediction performance [33]. Compared with the ordinary least squares (OLS) method, decision trees and SVM support non-linear solutions. Random forest is an efficient ensemble learning method that operates by constructing many base learners (decision tree). It follows the bagging method and bootstrap sampling and is less prone to overfitting than the decision tree and gives a more generalized solution [34]. A deep neural network (DNN) is an extension of artificial neural network (ANN) with a minimum of three stacked hidden layers followed by a non-linear activation function [35]. Figure 2 describes the structure of DNN in our study. The blue circles denote the input vector containing previous 14-day ED attendance rate, general AQHI, calendar information (i.e., holiday, month, and week indicators), and extended chosen ambient temperature variables and extreme hot weather indicators from Model 1–3 comparison. Each orange circle is a neuron within the hidden layers (layers between the input layer and the output layer), which assigns weights to inputs and passes on the values through an activation function as outputs. We used a rectified liner unit (ReLU) activation function [36]. We fine-tuned the hyperparameters (including the hidden layer structure, learning rate, and batch size) based on the predictive performance on the validation data set. The red circle is the output where we generate the predicted ED attendance rate in our study.
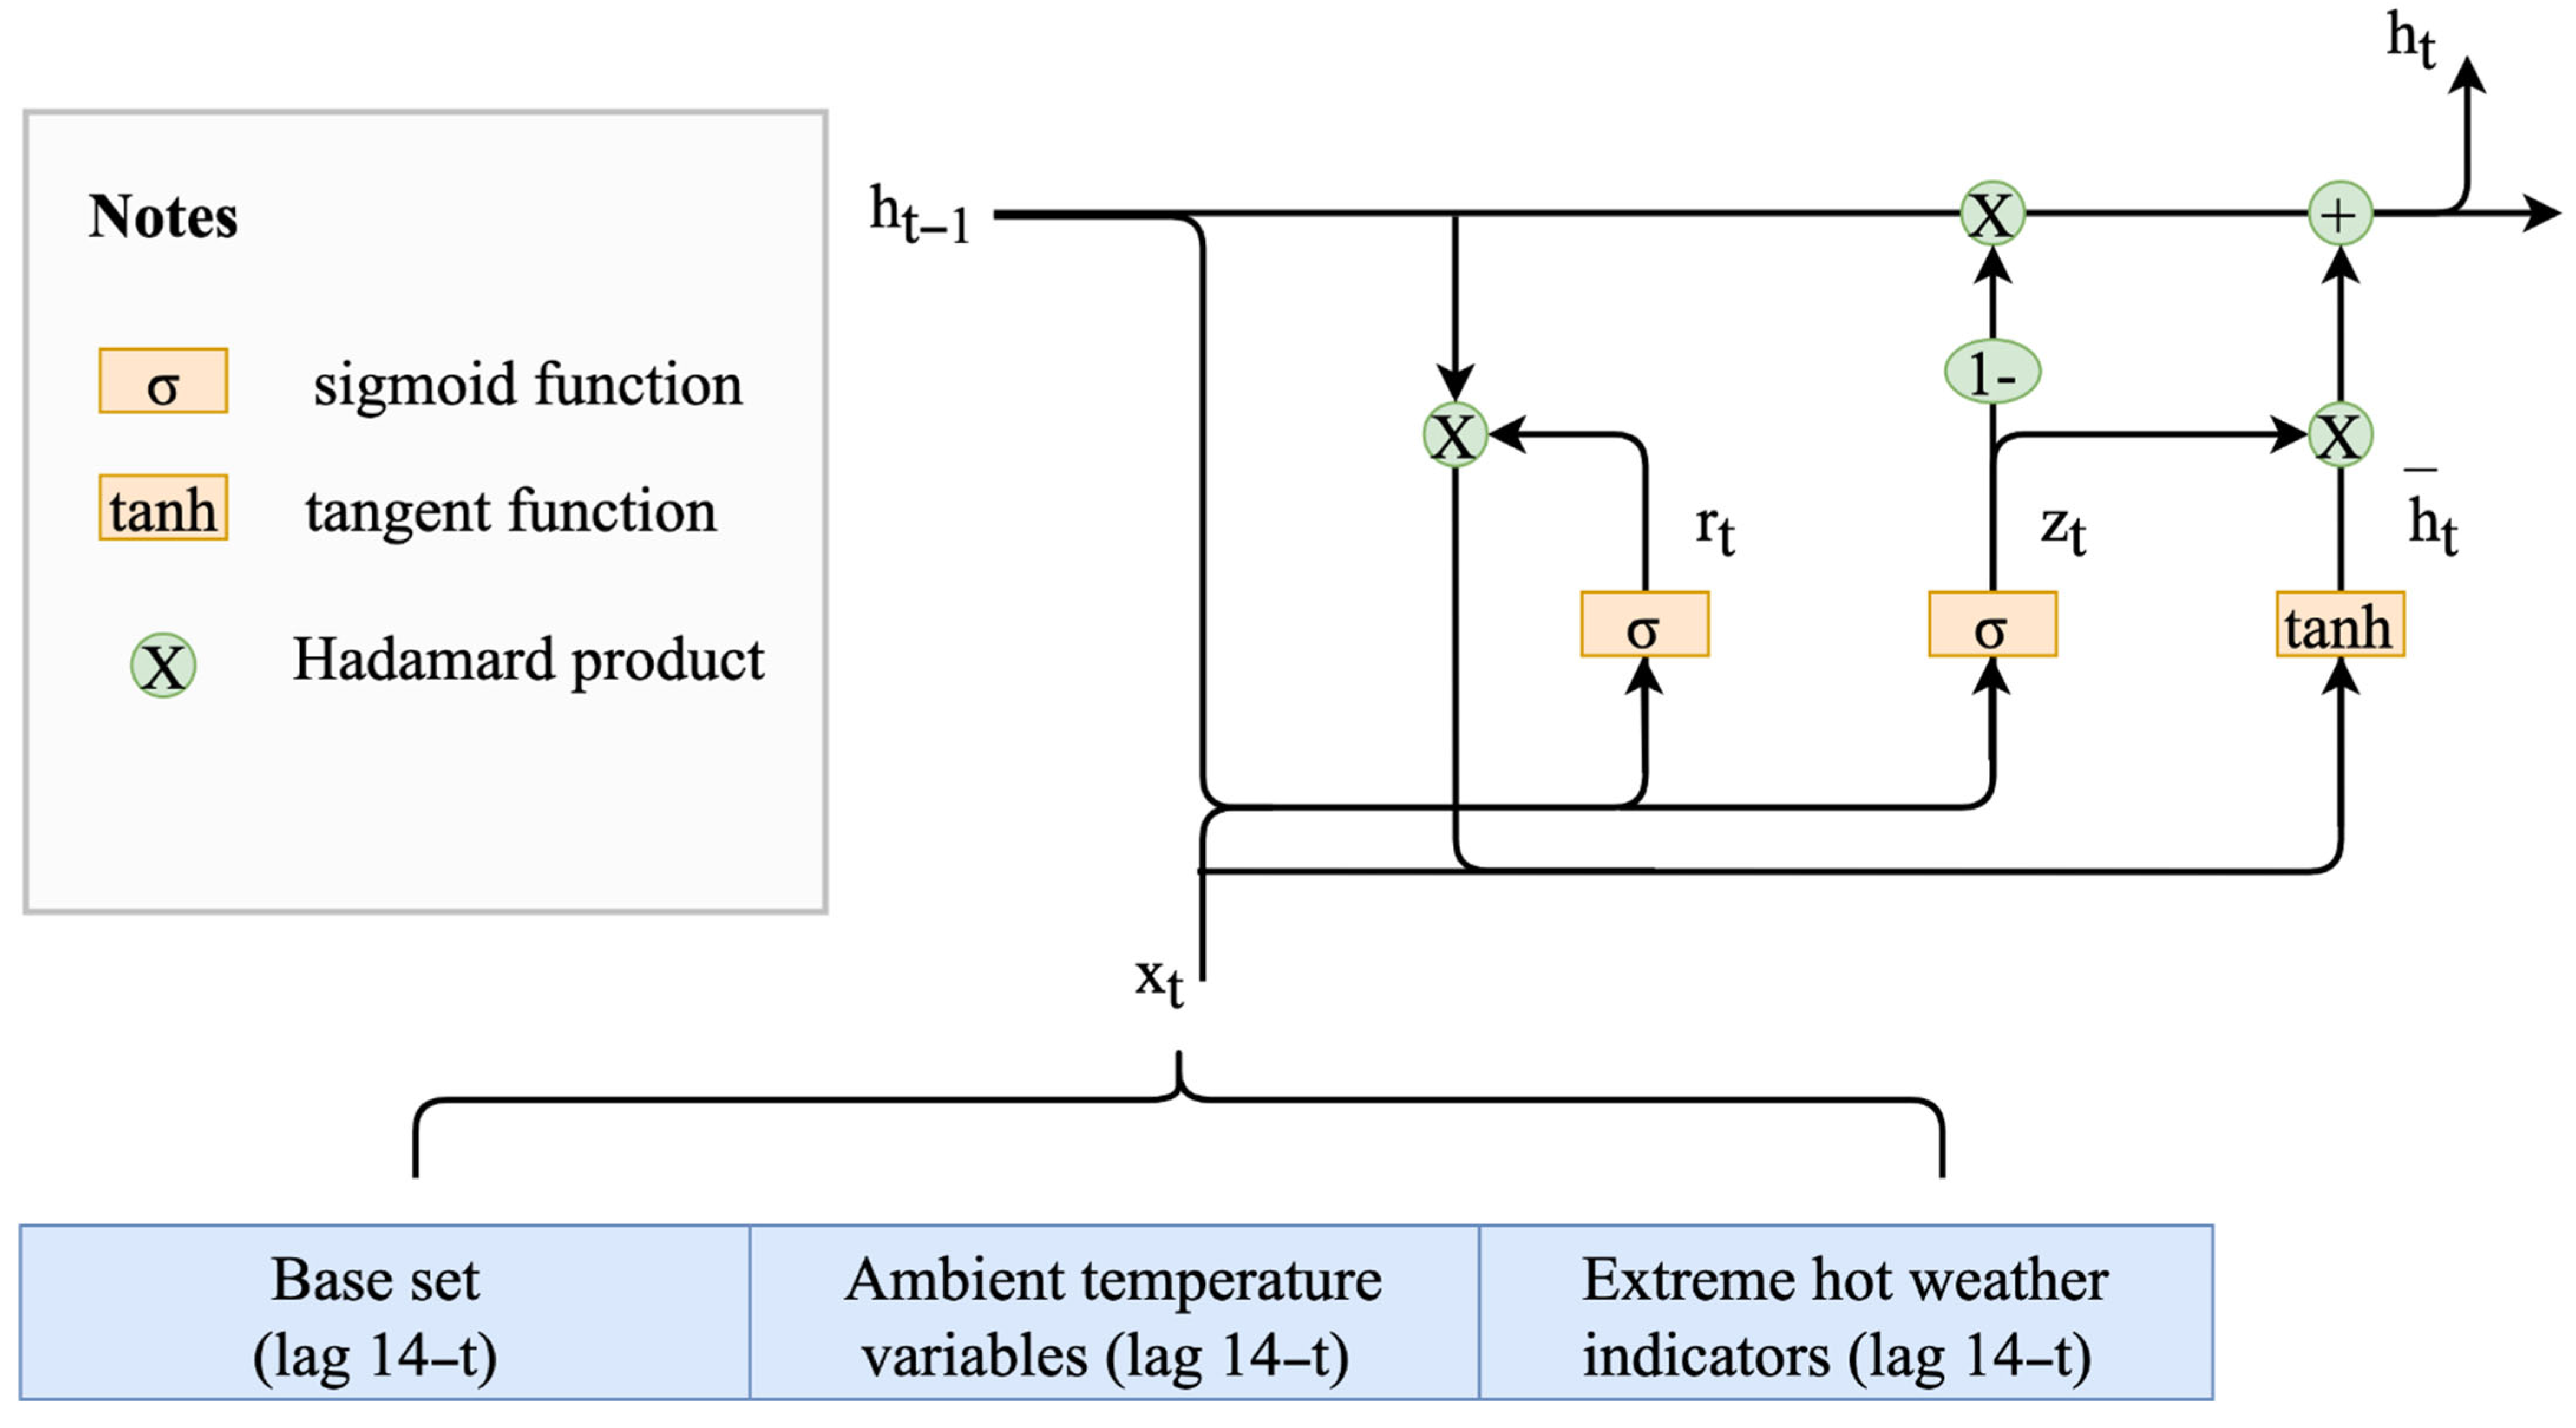
A GRU model is a transformed recurrent neural network (RNN) with a gating mechanism. Figure 3 shows the inner implementation of GRU, which is constructed by a reset gate (rt), an update gate (zt), and a candidate status ( h t ¯ ) to decide what information can be passed to the output [37]. xt denotes the input vector, which was composed by ED attendance rate, general AQHI, calendar information, ambient temperature variables, and extreme hot weather indicators at time t. ht is the output vector of current unit and it passes the kept information to another stacked GRU. The orange bricks denote a fully connected layer with activation function. The formula is presented as follows.
z t = σ W x z x t + W h z h t 1 + b z r t = σ W x r x t + W h r h t 1 + b r h t ¯ = t a n h W x h x t + r t h t 1 + b h h t = 1 z t h t 1 + z t h t ¯
where W denotes weight parameters, denotes elementwise product (Hadamard product) operator.
For model evaluations, we adopted two widely adopted evaluation metrics to compare the predictive performance of each model: root mean square error (RMSE) and normalized root mean square error (NMSE). The corresponding formulae are
R M S E = i = 1 n y i y i ^ 2 n    
and
N R M S E = R M S E y m a x y m i n    
where y i and y i ^ denote the observed and predicted current ED attendance rate in the test set, respectively; n denotes the number of observations; y m a x and y m i n denote the maximum and minimum values of observations separately.
The optimal value of RMSE is zero, with lower values indicating better predictive performance. NRMSE normalizes RMSE by the scale of observation and makes the result comparable across datasets and scales. It also indicates better fitting with minor value. In the public health area, a predictive model with a NRMSE less than 30% is regarded as an effective model [38].
All analyses were conducted in Python version 3.8.5 [39]. Linear regression, decision tree, SVM, random forest, and DNN were implemented using the Sklearn package [40]. GRU was developed using the PyTorch package [41].

3. Results

3.1. Data Descriptions

From May to September 2000 to 2016 (except 2003), the daily ED attendance rate varied, in general, between 140 to 200 per 100,000 population. A higher attendance rate was consistently observed in males (Figure 4).
In the hot seasons, the mean temperature generally varied between 25 °C and 35 °C. Substantially higher frequencies of VHD and HN were observed in 2009 and the most recent three years (2014–2016) than in previous years (see Figure S1). Hong Kong remained a low level of air pollution with the health risk straying moderate and lower (AQHI ≤ 6) most of the years (see Figure S2). After 2009, few days with very high health risk of air pollution (AQHI > 8) were observed (see Figure S3).

3.2. Selection of Predictors by LASSO

After LASSO selection, we identified 11 out of 42 ambient temperature variables (previous 14-day maximum/mean/minimum daily temperature) and 19 out of 28 extreme hot weather indicators (previous 14-day VHD and HN) for the female group. The numbers of selected ambient temperature variables and extreme hot weather indicators for the male group were 10 and 17, respectively. These selected variables are presented in Table 1. Among the ambient temperature variables, maximum daily temperature was most commonly selected. Among the extreme hot weather indicators, VHD was slightly more commonly selected than HN.
In Model 1 (ED attendance on previous 14-day ED attendance and general AQHI, with current calendar information), the predictive performance for the female group (RMSE: 8.53 × 10⁻⁵, NRMSE: 12.05%) and the male group (RMSE: 9.04 × 10⁻⁵, NRMSE: 12.47%) were both good. Model 2 (ED attendance on the same predictors as Model 1 plus those LASSO-selected ambient temperature variables) achieved better performance than Model 1 for both female (RMSE: 8.44 × 10⁻⁵, NRMSE: 11.93%) and male groups (RMSE: 8.87 × 10⁻⁵, NRMSE: 12.23%). Model 3 (ED attendance on the same predictors as Model 1 plus those LASSO-selected extreme hot weather indicators) had the worst performance among the three models for both female (RMSE: 8.68 × 10⁻⁵, NRMSE: 12.27%) and male groups (RMSE: 9.20 × 10⁻⁵, NRMSE: 12.69%). Detailed information is listed in Table 2. Hence, Model 2 was chosen as the baseline model, with the optimal variables composed by previous 14-day ED attendance and general AQHI, current calendar information, and the LASSO-selected ambient temperature variables presented in Table 1.

3.3. Predictive Performance of Machine Learning Methods

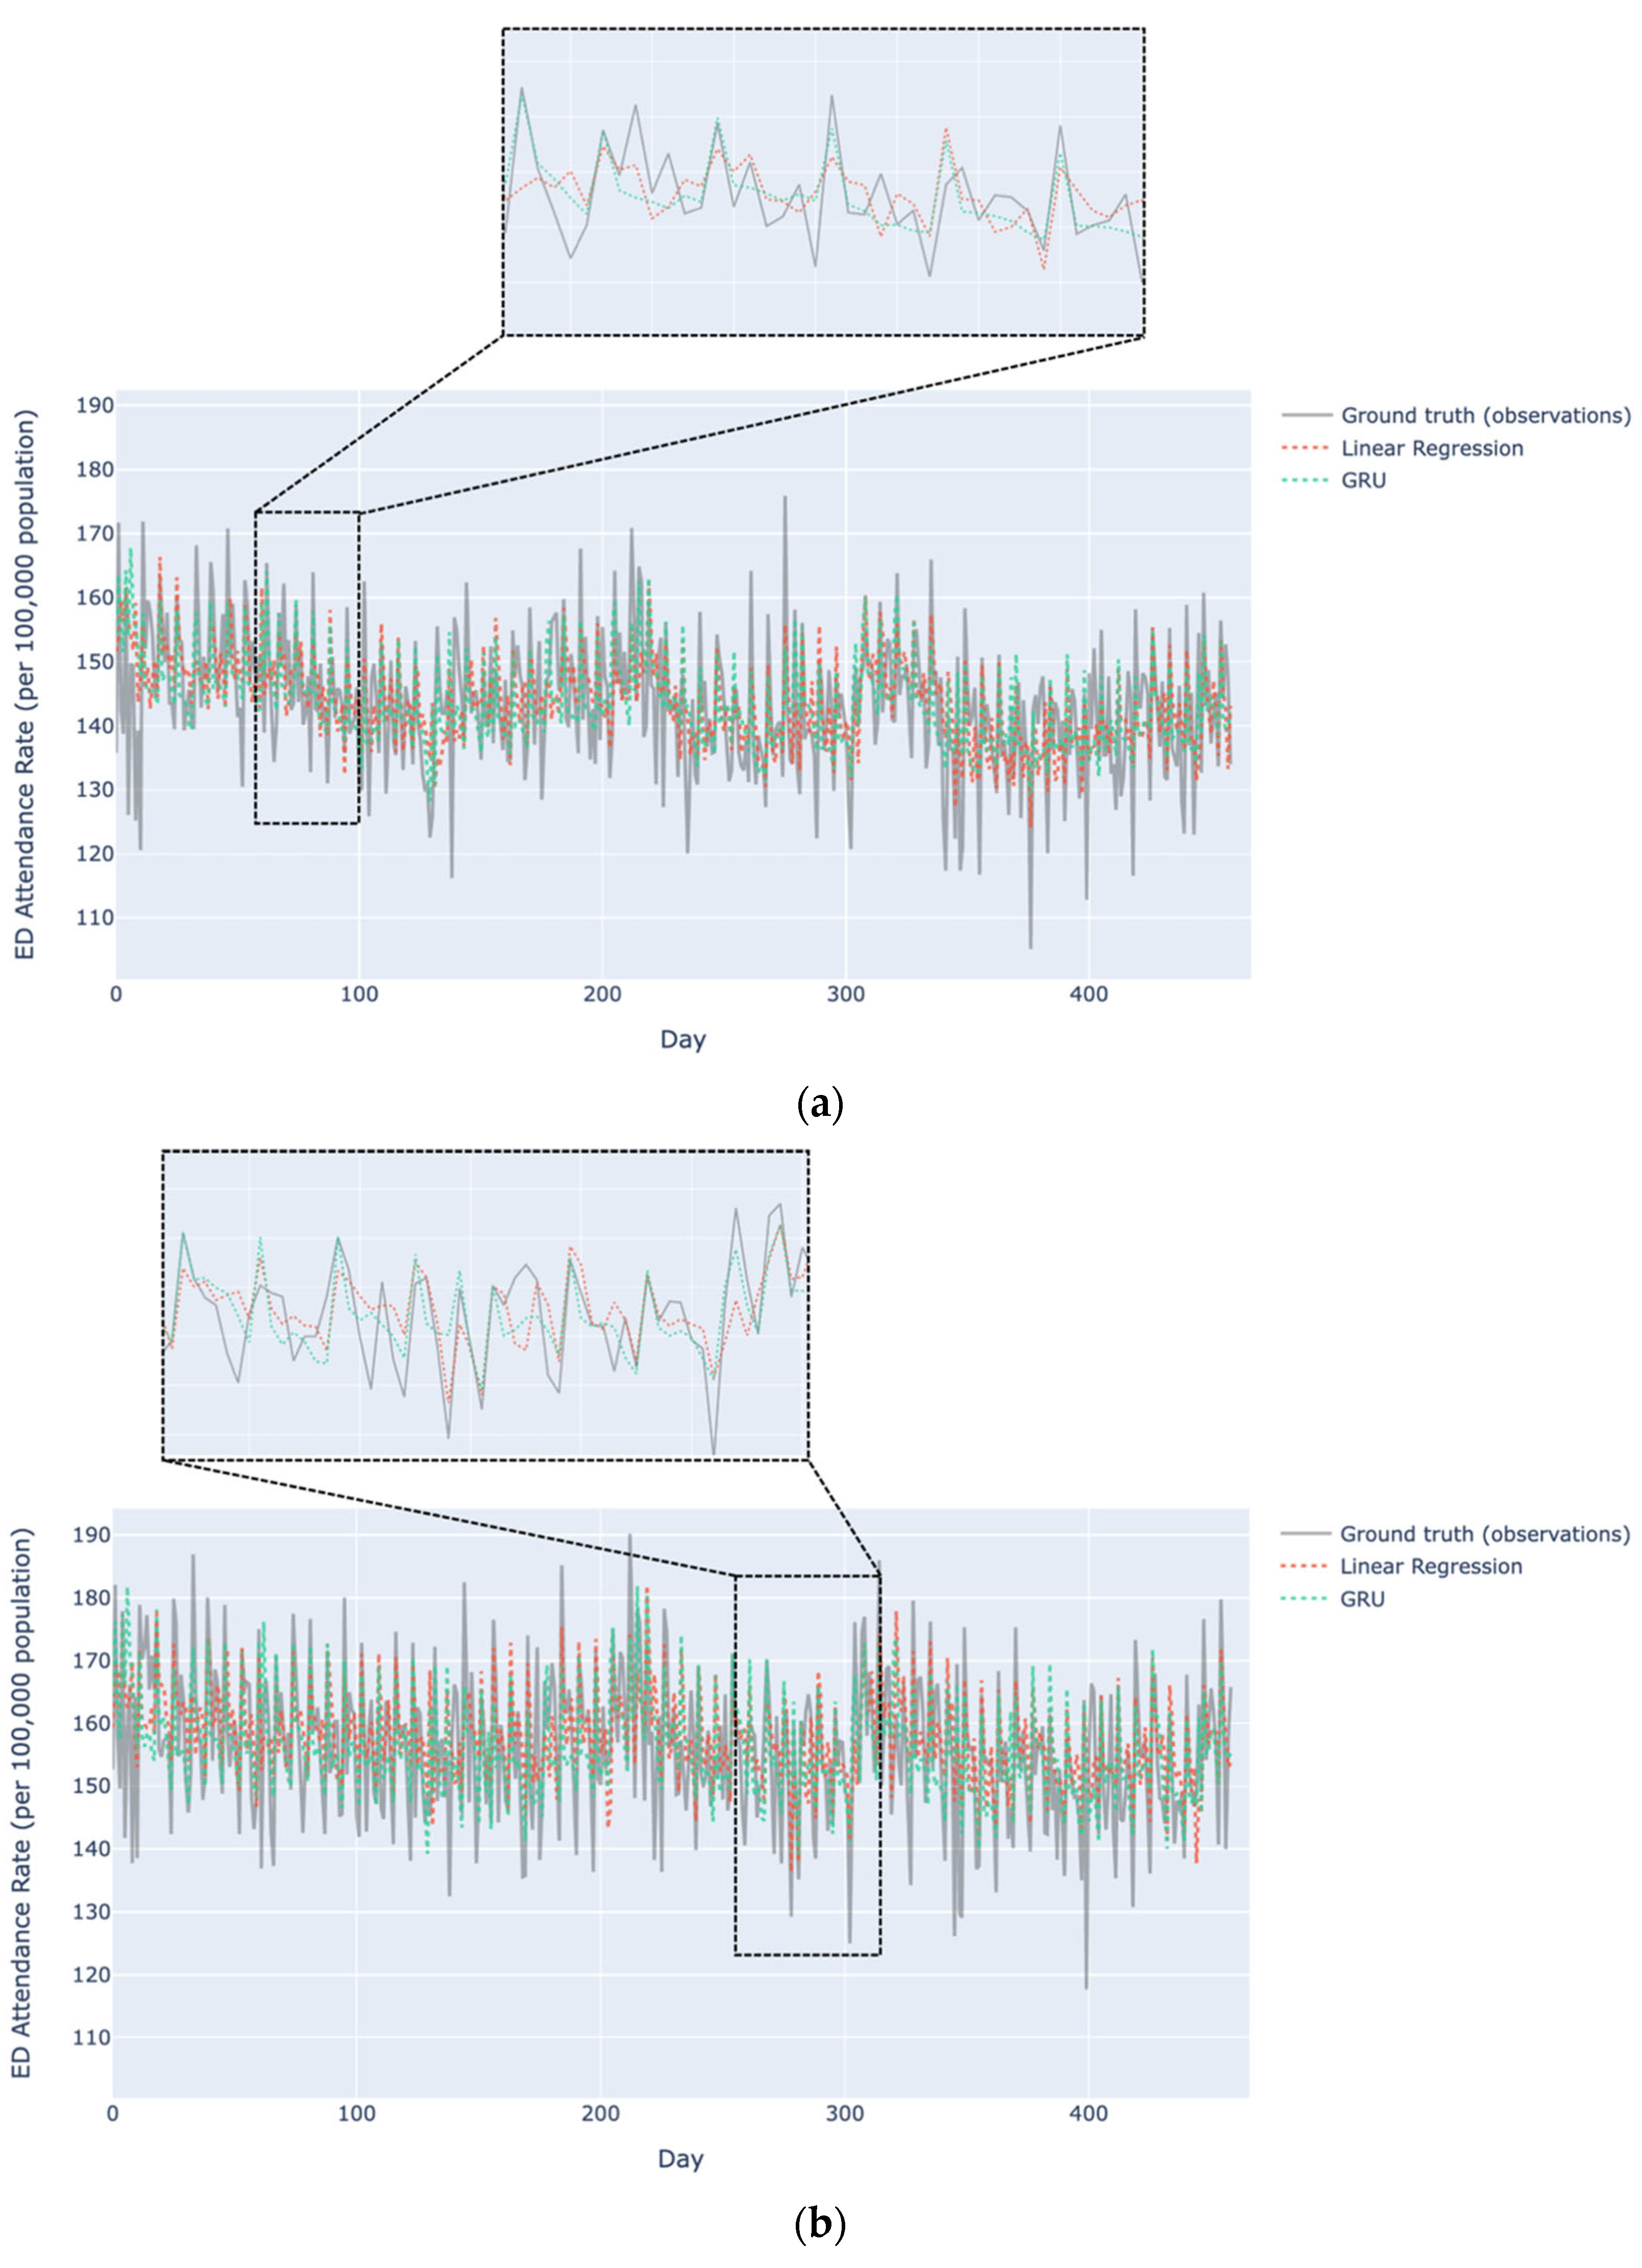
On the optimal variable combination, the performance of the conventional machine learning methods were tested on the same test dataset. The results show that random forest (Female: RMSE: 9.18 × 10⁻⁵, NRMSE: 12.97%; Male: RMSE: 10.23 × 10⁻⁵, NRMSE: 14.10%) achieved better performance than decision tree (Female: RMSE: 11.24 × 10⁻⁵, NRMSE: 15.88%; Male: RMSE: 11.66 × 10⁻⁵, NRMSE: 16.01%) and SVM (Female: RMSE: 21.62 × 10⁻⁵, NRMSE: 30.5%; Male: RMSE: 20.41 × 10⁻⁵, NRMSE: 28.15%) for both sexes (Table 3). However, none of these methods improved the predictive accuracy of the baseline model on this task. Then, deep learning methods DNN and GRU models were tested on the extended variable combination. The GRU model achieved the best performance in both female (RMSE: 7.98 × 10⁻⁵, NRMSE: 11.28%) and male (RMSE: 8.52 × 10⁻⁵, NRMSE: 11.75%) groups. DNN (Female: RMSE: 8.30 × 10⁻⁵, NRMSE: 11.73%; Male: RMSE: 8.75 × 10⁻⁵, NRMSE: 12.08%) also obtained slightly improved predictive accuracy than baseline but not better than the GRU model. (Table 3). The ground-truth observations, the linear regression (baseline), and the GRU predictions are shown in Figure 5. Compared with the baseline model, GRU showed a better ability in capturing the peaks.

4. Discussion

With the development of machine learning methods, many advanced methods have been developed and have achieved better performance than previous methods. This study compared the predictive performance of ambient temperature variables at their own value and those using these variables as indicators, as well as the predictive power among various models, including traditional statistical method (i.e., linear regression), three typical conventional machine learning approaches (i.e., decision tree, SVM, and RF), and two widely-adopted deep learning approaches (i.e., DNN and GRU) in predicting daily ED attendance rate, using Hong Kong as an example. Also, we were the first to compare the ability and shrink the candidate pool to a reasonable size by use of LASSO. We also applied state-of-the art deep learning methods in the ED prediction task and suggested how to apply the model in practice. It was found that ambient temperatures at their own values had better predictive power than those indicators defined by cutoffs, and the advanced deep learning approaches had better predictive performance than traditional statistical models and conventional machine learning with acceptable computational complexity.
Literature using ambient temperature at its own value or as an indicator defined by thresholds for prediction purpose were mixed. Some researchers reported that heat waves defined by VHD and HN were associated with excess mortality [42]. On the other hand, some researchers reported hospital admissions as a function of ambient temperature [25]. Another local study used thresholds of various meteorological variables to define extreme weather in the prediction of mortality among older adults [43]. In a local study using time series approach to study suicide death among older adults in summer, it was reported that minimum temperature at its own value had the best predictive power for violent method suicides, but maximum ambient temperature exceeding a threshold of 32.7°C was better at predicting non-violent method suicides [44]. In clinical studies, categorization of continuous variables is common and it also helps simplify analyses and leads to more interpretable results [45]. Moreover, binarization potentially conceals any non-linearity between the variable and the outcome [45]. However, dichotomizing a variable leads to excessive information loss, thus reducing its statistical power. The considerable within-group variability after categorization may be suppressed. Our results supported these conclusions with evidence that temperature variables at their own values had better predictive performance than extreme hot weather indicators. This implies that temperature variables at their own values are more effective predictors, as they contain essential information in predicting ED attendance rates. The data-driven predictor selection approach also showed that daily maximum ambient temperatures were more important than mean and minimum ambient temperatures in predicting ED attendance rates, which might be due to their ability to reflect the more extreme hot weather.
Most previous studies were limited to application of one kind of machine learning model and had mixed conclusions when comparing the predictive performance among different models [20,32]. Our study included state-of-the-art machine learning models, including base learner (i.e., decision tree and SVM), ensemble learning model (i.e., random forest) and deep learning models (i.e., DNN and GRU). We found that random forest outperformed decision tree and SVM with a maximum of 2.91% and 14.62% improvement regarding NRMSE, which was consistent with the previous literature that ensemble learning methods had better performance than base learners and supported the effectiveness of the dragging mechanism and the bootstrap sampling [34]. However, these three conventional machine learning methods did not outperform the linear regression model with a minimum of 1.04% lower regarding NRMSE. This is in agreement with a previous study [32], which also found that simple methods such as penalized linear regression models were better or at least comparable with ensemble learning methods such as GBC and random forest to predict ED demand in England. Decision tree, SVM and random forest were conventional machine learning models that were not designed for time-series predictive tasks, which did not fit well for the increasing or decreasing trends of time-series data. Besides, the increased algorithm complexity might decrease the performance when the number of variables was prominent, and when the data size was relatively small. A review also indicated that machine learning models were more suitable to pioneering fields with large data volume, such as radio diagnostics, precision medicine and omics [46]. Meanwhile, deep machine learning approaches, namely DNN and GRU, outperformed linear regression and conventional machine learning models studied in both female and male groups. Up to date, GRU is one of the state-of-the-art machine learning algorithms, in the way that the gating mechanism effectively handles data with timestamps by repeatedly updating gates and resetting gates to keep important information and remove irrelevant information [47]. LSTM has been applied to ED predictive tasks in a previous study and achieved better predictive accuracy for moderate-term prediction compared to CNN and random forest, with a 1.49% improvement of current day prediction than CNN and 2.06% improvement than random forest regarding mean absolute percentage error (MAPE) [16]. While the mechanism of LSTM indicates it can remember longer sequences theoretically, GRU usually had better performance than LSTM with faster training speed and lower memory cost on low complexity sequences in practice [48]. Still the application of GRU in predicting ED visits is in the nascent stage. Our study showed GRU achieved the best performance among all models with 0.71%, 1.69%, and 4.3% improvement over linear regression, random forest, and decision tree separately regarding NRMSE in the female group and similar results in the male group, supporting GRU as a suitable method for predicting ED visits regardless of gender. Even though the performance improvement of GRU was not considerable in value, its ability in capturing the peaks of ED visits revealed its potential application as an early signal of ED unit utilization.
As older people are vulnerable to hot weather, it is essential to develop a targeted predictive model for the older Hong Kong population. Although there are both winter and summer surges in ED visits, the summer surge was not given enough attention. Hence, our study filled a knowledge gap by focusing on the prediction of ED visits by older adults in the hot season in Hong Kong. As GRU showed the optimal prediction power, we attempt to apply GRU to build an ED visit forecast system, so that the healthcare providers can rely on the sequential predictions to allocate resources for the coming period. We first pre-train a GRU model, store it in a reliable server, and build portal links from the web or mobile devices. The healthcare providers can get access to the precise prediction of ED attendance rates in the coming period through the website, mobile app, or messages, and thus be able to plan for the potential surge. Although the prediction for the coming day is validated, based on the feature of GRU that the predictive period is extensible, we can also provide longer-term predictions (say, for one to two weeks in advance) for the healthcare providers. Although 9-day weather forecasts are available in Hong Kong, the sequential prediction does not require such input since the GRU can internally model the temperature pattern based on the data with 1–14 days lag and predict future ED visits. Thus, no extra information is needed to do the prolonged sequential prediction compared to traditional methods. Nevertheless, it is admitted that the predictive performance will decline as the prediction period gets longer and longer. Meanwhile, this study is a proof-of-concept study to demonstrate the feasibility of real-time predictions. Firstly, the dataset we used for training and testing spans more than a decade, whereas the predictive accuracy is still demonstrated competitive on the testing dataset. Thus, our model will likely be applicable for the future data. Secondly, the variables we selected are strictly based on previous literatures and robust selection algorithms, which are practical for real-time predictions. Lastly, the deep learning method, GRU we used to build our model, is of superior generalization ability, which extracts effective features and identifying patterns adaptively by approximating complex non-linear functions, and thus is robust for unobserved data over the time. Nevertheless, the COVID pandemic might affect the current pattern of ED admission. However, our model is convenient to adapt to the changes by retraining at low memory cost and fast speed. Therefore, for future studies, we may retrain the prediction rule regularly using the most updated data. Other variables such as the hospitalization of COVID confirmed cases and the trend of COVID need to be included in future model. A real time training and prediction model should also be explored to enhance the timeliness and thus the usefulness of the predictions. With the advancement in the machine learning techniques, more advanced models may perform more accurate predictions. Researchers should keep on investigating better models.
Apart from the ED healthcare providers, the general public and other health and social services providers should also get access to the forecast system and be informed of the sequential prediction results. A high predicted ED visit rate implies a higher health risk. Although we cannot claim causation with an observational study, the population, particularly the older adults, would still be well-advised to take preventive measures, such as staying in cool places and maintaining adequate fluid intake, to ameliorate adverse health risk from extreme hot weather. Future studies with more vigorous experimental designs should be conducted to facilitate health and social services providers to develop heat action plans to protect vulnerable populations.
The strength of our study includes the long-time data series used. We used a 10-year data for training and three-year data for validation and testing, respectively, which significantly increased the reliability of our predictive model. Although we achieved high predictive performance of ED attendance rate prediction, there was limitation related to the lack of the cause-specific or hospital-specific ED attendance information, limiting more efficient application to Eds. Further works are needed to develop cause-specific and hospital-specific prediction models for more targeted warnings. Secondly, we did not decide the optimal lag time, although we covered a moderate interval to balance the short-term and long-term effect. Prolonged lag effect or dynamic lag effect will be assessed in future studies. Further work will also include more meteorological variables such as relative humidity, wind speed, and sunshine duration as potential predictors. The data used in this study were only collected up to 2016. Future studies are needed to revisit the situation using the most updated, or even real time data. In this study, we only compared the machine learning methods with one type of traditional statistical methods, namely linear regression. Moreover, not all available machine learning methods were attempted in this study. Comparisons with other traditional statistical methods and other machine learning methods should be performed in future studies in order to complete the comparisons.

5. Conclusions

To our knowledge, this was the first study to comprehensively compare the predictive ability of linear regression, conventional machine learning methods, and advanced deep learning methods, with prediction of the ED attendance rates in Hong Kong as illustration. We found that deep learning methods, especially the GRU model, outperformed conventional machine learning methods and traditional statistical methods. Future robust predictive system for ED attendance could be developed based on GRU model with ambient temperatures at their own values as predictors. Such predictions could provide healthcare providers and the older Hong Kong population timely ED crowding forecasts.

Supplementary Materials

The following supporting information can be downloaded at: https://www.mdpi.com/article/10.3390/info13090410/s1, Figure S1: Visualization of sine and cosine transform of Month; Figure S2. Frequency of VHD and HN in hot season from 2000 to 2016; Figure S3. Frequency of general AQHI in hot season from 2000 to 2016. Table S1: A summary of potential predictors used in developing the prediction models.

Author Contributions

Conceptualization: P.C., K.K.-L.L., C.R. and H.L.; data curation: X.Q., K.K.-L.L. and C.R.; methodology and formal analysis: H.Z., H.L., P.C., K.K.-L.L. and C.R.; resources: K.K.-L.L., C.R. and P.C.; software: H.Z. and H.L.; writing—original draft preparation: H.Z. and P.C.; writing—review and editing: K.K.-L.L., X.Q., H.L. and C.R. All authors have read and agreed to the published version of the manuscript.

Funding

This work was supported by The University of Hong Kong [Project No. 201811159222].

Institutional Review Board Statement

The study was conducted in accordance with the Declaration of Helsinki and approved by the Institutional Review Board the University of Hong Kong/Hospital Authority, Hong Kong West Cluster (reference number UW19-388 and date of approval 28 May 2019).

Informed Consent Statement

Not applicable.

Data Availability Statement

Not applicable.

Conflicts of Interest

The authors declare that they have no known competing financial interest or personal relationships that could have appeared to influence the work reported in this paper.

References

  1. Masson-Delmotte, V.; Zhai, P.; Pirani, A.; Connors, S.L.; Péan, C.; Berger, S.; Caud, N.; Chen, Y.; Goldfarb, L.; Gomis, M.I.; et al. Climate Change 2021: The Physical Science Basis. Contribution of Working Group I to the Sixth Assessment Report of the Intergovernmental Panel on Climate Change; Cambridge University Press: Cambridge, UK, 2021. [Google Scholar]
  2. Houghton, J.T.; Ding, Y.; Griggs, D.J.; Noguer, M.; van der Linden, P.J.; Dai, X.; Maskell, K.; Johnson, C.A. Climate Change 2001: The Scientific Basis: Contribution of Working Group I to the Third Assessment Report of the Intergovernmental Panel on Climate Change; Cambridge University Press: Cambridge, UK, 2001. [Google Scholar]
  3. Balmain, B.N.; Sabapathy, S.; Louis, M.; Morris, N.R. Aging and thermoregulatory control: The clinical implications of exercising under heat stress in older individuals. BioMed Res. Int. 2018, 2018, 8306154. [Google Scholar] [CrossRef] [PubMed]
  4. Corcuera Hotz, I.; Hajat, S. The effects of temperature on accident and emergency department attendances in London: A time-series regression analysis. Int. J. Environ. Res. Public Health 2020, 17, 1957. [Google Scholar] [CrossRef] [PubMed]
  5. Jung, C.C.; Hsia, Y.F.; Hsu, N.Y.; Wang, Y.C.; Su, H.J. Cumulative effect of indoor temperature on cardiovascular disease-related emergency department visits among older adults in Taiwan. Sci. Total Environ. 2020, 731, 138958. [Google Scholar] [CrossRef]
  6. Jung, C.C.; Chen, N.T.; Hsia, Y.F.; Hsu, N.Y.; Su, H.J. Influence of Indoor Temperature Exposure on Emergency Department Visits Due to Infectious and Non-Infectious Respiratory Diseases for Older People. Int. J. Environ. Res. Public Health 2021, 18, 5273. [Google Scholar] [CrossRef]
  7. Sahu, S.K.; Baffour, B.; Harper, P.R.; Minty, J.H.; Sarran, C. A hierarchical Bayesian model for improving short-term forecasting of hospital demand by including meteorological information. J. R. Stat. Soc. Ser. A Stat. Soc. 2014, 177, 39–61. [Google Scholar] [CrossRef]
  8. Marcilio, I.; Hajat, S.; Gouveia, N. Forecasting daily emergency department visits using calendar variables and ambient temperature readings. Acad. Emerg. Med. 2013, 20, 769–777. [Google Scholar] [CrossRef]
  9. Calegari, R.; Fogliatto, F.S.; Lucini, F.R.; Neyeloff, J.; Kuchenbecker, R.S.; Schaan, B.D. Forecasting daily volume and acuity of patients in the emergency department. Comput. Math. Methods Med. 2016, 2016, 3863268. [Google Scholar] [CrossRef]
  10. Chau, P.H.; Lau, K.K.; Qian, X.X.; Luo, H.; Woo, J. Visits to the accident and emergency department in hot season of a city with subtropical climate: Association with heat stress and related meteorological variables. Int. J. Biometeorol. 2022, 2022, 1–17. [Google Scholar] [CrossRef]
  11. Moe, J.; O’Sullivan, F.; McGregor, M.J.; Schull, M.J.; Dong, K.; Holroyd, B.R.; Grafstein, E.; Hohl, C.M.; Trimble, J.; McGrail, K.M. Identifying subgroups and risk among frequent emergency department users in British Columbia. J. Am. Coll. Emerg. Physicians Open 2021, 2, e12346. [Google Scholar] [CrossRef]
  12. Soril, L.J.; Leggett, L.E.; Lorenzetti, D.L.; Noseworthy, T.W.; Clement, F.M. Characteristics of frequent users of the emergency department in the general adult population: A systematic review of international healthcare systems. Health Policy 2016, 120, 452–461. [Google Scholar] [CrossRef]
  13. Berchet, C. Emergency Care Services: Trends, Drivers and Interventions to Manage the Demand; OECD Health Working Papers; OECD Publishing: Paris, France, 2015. [Google Scholar]
  14. Chen, G.; Xie, J.; Li, W.; Li, X.; Hay Chung, L.C.; Ren, C.; Liu, X. Future “local climate zone” spatial change simulation in Greater Bay Area under the shared socioeconomic pathways and ecological control line. Build. Environ. 2021, 203, 108077. [Google Scholar] [CrossRef]
  15. Hertzum, M. Forecasting hourly patient visits in the emergency department to counteract crowding. Ergon. Open J. 2017, 10, 1–13. [Google Scholar] [CrossRef]
  16. Sudarshan, V.K.; Brabrand, M.; Range, T.M.; Wiil, U.K. Performance evaluation emergency department patient arrivals forecasting models by including meteorological and calendar information: A comparative study. Comput. Biol. Med. 2021, 135, 104541. [Google Scholar] [CrossRef]
  17. Lucini, F.R.; Dos Reis, M.A.; Da Silveira, G.J.C.; Fogliatto, F.S.; Anzanello, M.J.; Andrioli, G.G.; Nicolaidis, R.; Beltrame, R.C.F.; Neyeloff, J.L.; Schaan, B.D. Man vs. machine: Predicting hospital bed demand from an emergency department. PLoS ONE 2020, 15, e0237937. [Google Scholar] [CrossRef]
  18. Rahimian, F.; Salimi-Khorshidi, G.; Payberah, A.H.; Tran, J.; Ayala Solares, R.; Raimondi, F.; Nazarzadeh, M.; Canoy, D.; Rahimi, K. Predicting the risk of emergency admission with machine learning: Development and validation using linked electronic health records. PLoS Med. 2018, 15, e1002695. [Google Scholar] [CrossRef]
  19. Khatri, K.L.; Tamil, L.S. Early detection of peak demand days of chronic respiratory diseases emergency department visits using artificial neural networks. IEEE J. Biomed. Health Inform. 2017, 22, 285–290. [Google Scholar] [CrossRef] [PubMed]
  20. Xu, M.; Wong, T.C.; Chin, K.S. Modeling daily patient arrivals at emergency epartment and quantifying the relative importance of contributing variables using artificial neural network. Decis. Support Syst. 2013, 54, 1488–1498. [Google Scholar] [CrossRef]
  21. Yucesan, M.; Gul, M.; Celik, E. A multi-method patient arrival forecasting outline for hospital emergency departments. Int. J. Healthc. Manag. 2020, 13, 283–295. [Google Scholar] [CrossRef]
  22. Hong Kong Observatory. Climate Change in Hong Kong. Available online: https://www.hko.gov.hk/en/climate_change/obs_hk_temp.htm (accessed on 12 August 2022).
  23. Wang, D.; Lau, K.K.L.; Ren, C.; Goggins, W.B.I.; Shi, Y.; Ho, H.C.; Lee, T.-C.; Lee, L.-S.; Woo, J.; Ng, E. The impact of extremely hot weather events on all-cause mortality in a highly urbanized and densely populated subtropical city: A 10-year time-series study (2006–2015). Sci. Total Environ. 2019, 690, 923–931. [Google Scholar] [CrossRef]
  24. Chan, E.Y.Y.; Goggins, W.B.; Kim, J.J.; Griffiths, S.; Ma, T.K. Help-seeking behavior during elevated temperature in Chinese population. J. Urban Health 2011, 88, 637–650. [Google Scholar] [CrossRef] [Green Version]
  25. Chan, E.Y.; Goggins, W.B.; Yue, J.S.; Lee, P. Hospital admissions as a function of temperature, other weather phenomena and pollution levels in an urban setting in China. Bull. World Health Organ. 2013, 91, 576–584. [Google Scholar] [CrossRef] [PubMed]
  26. Wong, T.W.; Tam, W.W.S.; Yu, I.T.S.; Lau, A.K.H.; Pang, S.W.; Wong, A.H. Developing a risk-based air quality health index. Atmos. Environ. 2013, 76, 52–58. [Google Scholar] [CrossRef]
  27. Van Loenhout, J.A.F.; Delbiso, T.D.; Kiriliouk, A.; Rodriguez-Llanes, J.M.; Segers, J.; Guha-Sapir, D. Heat and emergency room admissions in the Netherlands. BMC Public Health 2018, 18, 108. [Google Scholar] [CrossRef] [PubMed]
  28. Thomas, N.; Ebelt, S.T.; Newman, A.J.; Scovronick, N.; D’Souza, R.R.; Moss, S.E.; Warren, J.L.; Strickland, M.J.; Darrow, L.A.; Chang, H.H. Time-series analysis of daily ambient temperature and emergency department visits in five US cities with a comparison of exposure metrics derived from 1-km meteorology products. Environ. Health 2021, 20, 55. [Google Scholar] [CrossRef]
  29. Luo, Y.; Zhang, Y.; Liu, T.; Rutherford, S.; Xu, Y.; Xu, X.; Wu, W.; Xiao, J.; Zeng, W.; Chu, C.; et al. Lagged effect of diurnal temperature range on mortality in a subtropical megacity of China. PLoS ONE 2013, 8, e55280. [Google Scholar]
  30. Sun, Y.; Heng, B.H.; Seow, Y.T.; Seow, E. Forecasting daily attendances at an emergency department to aid resource planning. BMC Emerg. Med. 2009, 9, 1–9. [Google Scholar] [CrossRef]
  31. Adams, A.; Vamplew, P. Encoding and decoding cyclic data. South Pac. J. Nat. Sci. 1998, 16, 54–58. [Google Scholar]
  32. Vollmer, M.A.; Glampson, B.; Mellan, T.; Mishra, S.; Mercuri, L.; Costello, C.; Klaber, R.; Cooke, G.; Flaxman, S.; Bhatt, S. A unified machine learning approach to time series forecasting applied to demand at emergency departments. BMC Emerg. Med. 2021, 21, 1–14. [Google Scholar] [CrossRef]
  33. Wu, X.; Kumar, V.; Quinlan, J.R.; Ghosh, J.; Yang, Q.; Motoda, H.; McLachlan, G.J.; Ng, A.; Liu, B.; Yu, P.S.; et al. Top 10 algorithms in data mining. Knowl. Inf. Syst. 2008, 14, 1–37. [Google Scholar] [CrossRef]
  34. Ali, J.; Khan, R.; Ahmad, N.; Maqsood, I. Random forests and decision trees. Int. J. Comput. Sci. Issues 2012, 9, 272. [Google Scholar]
  35. Liu, W.; Wang, Z.; Liu, X.; Zeng, N.; Liu, Y.; Alsaadi, F.E. A survey of deep neural network architectures and their applications. Neurocomputing 2017, 234, 11–26. [Google Scholar] [CrossRef]
  36. Xu, B.; Wang, N.; Chen, T.; Li, M. Empirical evaluation of rectified activations in convolutional network. arXiv 2015, arXiv:1505.00853. [Google Scholar]
  37. Chung, J.; Gulcehre, C.; Cho, K.; Bengio, Y. Empirical evaluation of gated recurrent neural networks on sequence modeling. arXiv 2014, arXiv:1412.3555. [Google Scholar]
  38. Chai, Y.; Luo, H.; Zhang, Q.; Cheng, Q.; Lui, C.S.; Yip, P.S. Developing an early warning system of suicide using Google Trends and media reporting. J. Affect. Disord. 2019, 255, 41–49. [Google Scholar] [CrossRef] [PubMed]
  39. Van Rossum, G.; Drake, F.L. The Python Language Reference Manual; Network Theory Ltd.: Godalming, UK, 2011. [Google Scholar]
  40. Pedregosa, F.; Varoquaux, G.; Gramfort, A.; Michel, V.; Thirion, B.; Grisel, O.; Blondel, M.; Prettenhofer, P.; Weiss, R.; Dubourg, V.; et al. Scikit-learn: Machine learning in Python. J. Mach. Learn. Res. 2011, 12, 2825–2830. [Google Scholar]
  41. Paszke, A.; Gross, S.; Massa, F.; Lerer, A.; Bradbury, J.; Chanan, G.; Killeen, T.; Lin, Z.; Gimelshein, N.; Antiga, L.; et al. Pytorch: An imperative style, high-performance deep learning library. Adv. Neural Inf. Processing Syst. 2019, 32, 8026–8037. [Google Scholar]
  42. Ho, H.C.; Lau, K.K.; Ren, C.; Ng, E. Characterizing prolonged heat effects on mortality in a sub-tropical high-density city, Hong Kong. Int. J. Biometeorol. 2017, 61, 1935–1944. [Google Scholar] [CrossRef]
  43. Chau, P.H.; Woo, J. The trends in excess mortality in winter vs. summer in a sub-tropical city and its association with extreme climate conditions. PLoS ONE 2015, 10, e0126774. [Google Scholar]
  44. Chau, P.H.; Yip, P.S.F.; Lau, E.H.Y.; Ip, Y.T.; Law, F.Y.W.; Ho, R.T.H.; Leung, A.Y.M.; Wong, J.Y.H.; Woo, J. Hot weather and suicide deaths among older adults in Hong Kong, 1976–2014: A retrospective study. Int. J. Environ. Res. Public Health 2020, 17, 3449. [Google Scholar] [CrossRef]
  45. Altman, D.G.; Royston, P. The cost of dichotomising continuous variables. BMJ 2006, 332, 1080. [Google Scholar] [CrossRef]
  46. Rajula, H.S.R.; Verlato, G.; Manchia, M.; Antonucci, N.; Fanos, V. Comparison of conventional statistical methods with machine learning in medicine: Diagnosis, drug development, and treatment. Medicina 2020, 56, 455. [Google Scholar] [CrossRef] [PubMed]
  47. Cho, K.; Van Merriënboer, B.; Gulcehre, C.; Bahdanau, D.; Bougares, F.; Schwenk, H.; Bengio, Y. Learning phrase representations using RNN encoder-decoder for statistical machine translation. arXiv 2014, arXiv:1406.1078. [Google Scholar]
  48. Cahuantzi, R.; Chen, X.; Güttel, S. A comparison of LSTM and GRU networks for learning symbolic sequences. arXiv 2021, arXiv:2107.02248. [Google Scholar]
Figure 1. Process of the statistical analysis. Note: LASSO denotes least absolute shrinkage and selection operator, LR denotes linear regression, SVM denotes support vector machine, DNN denotes deep neural network, and GRU denotes gated recurrent unit.
Information 13 00410 g001
Figure 2. Proposed DNN structure.
Information 13 00410 g002
Figure 3. Proposed GRU structure.
Information 13 00410 g003
Figure 4. Distribution of daily ED attendance rate across year. Distributions are presented in form of box plots.
Information 13 00410 g004
Figure 5. Visualization of ground truth and predictions from linear regression model (baseline) and GRU. (a) Female group; (b) male group.
Information 13 00410 g005
Table 1. LASSO selected ambient temperature variables for each group.
FemaleMale
Ambient Temperature
Variables
Extreme Hot Weather IndicatorsAmbient Temperature
Variables
Extreme Hot Weather Indicators
Max 2VHD 1Max 1VHD 1
Max 8VHD 2Max 4VHD 3
Max 10VHD 3Max 6VHD 4
Max 11VHD 4Max 7VHD 5
Max 12VHD 5Max 9VHD 6
Max 13VHD 6Mean 2VHD 7
Max 14VHD 7Min 6VHD 9
Mean 6VHD 9Min 7VHD 11
Min 1VHD 12Min 10VHD 13
Min 12VHD 13Min 12HN 3
Min 13VHD 14 HN 4
HN 1 HN 5
HN 2 HN 6
HN 3 HN 7
HN 6 HN 8
HN 7 HN 12
HN 11 HN 14
HN 13
HN 14
Count11191017
Note. Max denotes maximum temperature; Mean denotes mean temperature; Min denotes minimum. Temperature; VHD denotes very hot day; HN denotes hot night, and the numbers denote lags.
Table 2. Predictive performance of three linear regression models with different predictor combinations.
Methods
GroupsMetricModel 1Model 2Model 3
FemaleRMSE (10−5)8.538.448.68
NRMSE12.05%11.93%12.27%
MaleRMSE (10−5)9.048.879.20
NRMSE12.47%12.23%12.69%
Note. Model 1 denotes base set; Model 2 denotes base set plus candidate ambient temperature variables; Model 3 denotes base set plus candidate extreme hot weather indicators. RMSE denotes root mean square error and NMSE denotes normalized root mean square error.
Table 3. Predictive performance of model comparison among baseline model, conventional machine learning methods and deep learning methods.
Methods
GroupsMetricLinear Regression (Baseline)Decision TreeRandom ForestSVMDNNGRU
FemaleRMSE (10−5)8.4411.249.1821.628.307.98
NRMSE11.93%15.88%12.97%30.5%11.73%11.28%
MaleRMSE (10−5)8.8711.6610.2320.418.758.52
NRMSE12.23%16.01%14.10%28.15%12.08%11.75%
Note. RMSE denotes root mean square error and NMSE denotes normalized root mean square error.
Publisher’s Note: MDPI stays neutral with regard to jurisdictional claims in published maps and institutional affiliations.