Abstract
Augmented Reality (AR) could provide key benefits in education and create a richer user experience by increasing the motivation and engagement of the students. To this end, the current paper presents a system with three AR applications for teaching physics in the fifth and sixth grades of primary school and in the first grade of secondary school, and the ultimate goal is the development of a unified platform that covers the subject of physics in all classes of K-12 education. The platform provides a useful tool to familiarize both teachers and pupils with AR technologies, aiming to improve the learning and teaching experience and to enhance their skills. The developed system is evaluated in terms of usability, gamification and willingness of the teachers to incorporate this technology into the teaching process. A total of 314 users participated in the research, where they were divided into three user groups: (i) teachers (N = 15), (ii) pupils (N = 189) and (iii) computer science students (N = 110). The outcomes were satisfactory, revealing that the gamified AR applications are easy to use, and teachers are interested in using these AR applications in their classrooms.
1. Introduction
Augmented Reality (AR) has become very popular in the last few years. It is estimated that, by 2024, there will be 1.7 billion mobile AR users worldwide [1]. Initially, AR was used as a science-oriented tool, but after its acceptance by students and teachers, it evolved into a modern pedagogical tool that was adopted into the classroom to enhance the educational process [2]. The main benefit of this evolution is that AR technology is fostering motivation in learning environments [3]. It is widely accepted, as well as pedagogically correct, that learning motivation is more likely to engage students and increase learning performance [4,5]. Apart from that, AR cultivates skills, such as problem solving, observation and exploration, and it also stimulates engagement [6]. Therefore, it aims to become an integral part of modern teaching methods.
Given the combination of interactivity and immediate feedback, AR has the potential to reshape some modern learning models, such as the student-centered learning model. It is important to note that plenty of educational AR-based tools use game-based design principles which are important for the learning process and, in addition, could influence students’ motivation and knowledge [7,8,9]. AR technology has the potential to become a must-have aid tool for modern classrooms, due to providing learning experiences that are contextual and embodied [10], which can be achieved by overlaying the real world with virtual data, which is one of AR’s most important features [11].
Therefore, AR may be an innovative teaching method that efficiently promotes learning, and this has led to a growing number of studies being conducted recently in the field of education. Nevertheless, a limited number of studies have been conducted about AR in K-12 education in the field of physics [3,6,12]. Taking the above into consideration, the ultimate goal of this work is to propose and develop a platform for teaching physics in all the classes of primary and secondary school. Since this is an ongoing project, in the current paper, we present the implementation and functionality of three AR applications. These AR applications are based on the current curriculum and address the fifth and sixth grades of primary school and the first grade of secondary school. All of the applications are specially designed, including game-based features and focusing on interactivity and providing proper feedback to the pupils according to their age. To evaluate the proposed system, an experiment was conducted to investigate (i) whether each one of the AR applications satisfies usability levels, (ii) whether students found the AR applications playful, and finally, (iii) whether teachers are willing to adopt these AR applications with their pupils.
The rest of the paper is organized as follows. In Section 2, the incorporation of AR in K-12 education is presented in different domains (such as English, computational thinking and science education). Next, in Section 3, the description of the system is introduced, and three different applications are analytically described. In Section 4, the evaluation of the system is presented, and in Section 5, its results are discussed. We conclude the paper in Section 6, and finally, Section 7 presents limitations and future work.
2. Background
AR in K-12 Education
Recently, several studies have been conducted to explore the use and benefits of AR in various domains. Particularly, in teaching English courses in secondary school, Kucuk et al. [13] conducted a study that examined the motivations, attitudes and achievements when using AR technology combined with traditional textbooks. The findings revealed that students have positive attitudes towards the combination of AR and traditional textbooks. Moreover, the combination increased learning motivation, improved learning performance, and finally, students exerted a lower amount of effort to conquer the knowledge. In the domain of visual art, Serio et al. [14] performed a related course and a study in which an AR-based tool helped to present images of art from the Italian Renaissance. The results showed that the attention, relevance, confidence and satisfaction of the students were enhanced in the AR approach in relation to the traditional learning environment. Additionally, Huang et al. [2] explored the feasibility of integrating AR technology in early art education. The outcomes indicated that AR applications, from the children’s point of view, promoted their engagement, enjoyment and imagination, and from the teachers’ point of view, it was a useful and motivating tool that improved the teaching process, as expressed by their willingness to use and adopt the AR application in their daily teaching.
It is known that AR has recently become popular in science, technology, engineering and mathematics (STEM), especially in K-12 education. The common mechanisms, design patterns and features of STEM applications are based on knowledge discovery through interaction with augmented 3D objects. More specifically, in mathematics education, historically the usage of physical objects such as rules was accepted by the plenary sessions of the class. Similarly, the AR-based tools were easily adopted in the learning environment. In geometry, for example, AR technologies can provide a plethora of features such as augmented 3D geometric shapes and objects, as well as real-time reshaping, thus enhancing participants’ exploratory learning. Based on these concepts, Kaufmann and Schmalstieg [15] developed a 3D geometric construction tool called Construct3D, targeted at high school. Using a kinesthetic learning style, the AR tool is used to improve students’ spatial skills, which is the main goal of geometry.
Another popular usage of AR in education belongs to the programming section, where there are plenty of AR-based tools whose main goal is to teach either procedural or object-oriented programming [16]. Fuste and Schmandt [17] developed an AR platform, called Hypercubes, to foster computational thinking and to improve the understanding of the procedural programming model. The combination of AR with paper cubes as AR marks enhanced students’ spatial skills and successfully introduced them to the concepts of instructions and sequences. Regarding robotics, AR technology can help students to easily program robots and “see the unseen” when a robot operates. The students could “see” through the sensors of the robot, resulting in adapting their code depending on the robot’s behavior [18].
Several studies have also been conducted in the field of science education (such as astronomy, chemistry and physics). More specifically, for teaching astronomy, Fleck and Simon [19] conducted an experiment in elementary school to help pupils to construct scientific knowledge about the solar system and to eliminate the usual misconceptions about fundamental astronomical concepts. This exploratory study was performed on inquiry-based science education principles, upon which pupils should learn by investigating and manipulating the concept to acquire knowledge. The experiment consists of the comparison of two 3D astronomical tangible models. One model was augmented with an AR model, whereas the other was a traditional physical model. The AR model was more acceptable by pupils than the old-school 3D model because they were able to virtually move the celestial bodies and manipulate them according to their perception. The findings showed that AR users mastered more of these scientific conceptions and improved their learning. Another approach on kinesthetic learning style was made by Zhang et al. [20], in which they constructed an AR-based mobile digital armillary sphere for astronomical observation. Despite the fact that astronomy is a difficult topic to implement inside the classroom due to various reasons (e.g., limited by location or time), the AR-based observation tool assisted astronomical observations in which fifth-grade pupils could manipulate and examine the astronomical concepts in order to identify constellations. The findings indicated that the participants cultivated scientific conceptions and learning motivations, and their learning experience and observation skills were improved.
For teaching chemistry, Cai et al. [21] implemented an AR simulation system targeted at junior high school students. The students could control and combine 3D models of micro-particles in a simulated micro-world, and they could conduct experiments and compose substances. This inquiry-based learning approach is capable of conquering the fundamentals of micro-worlds. The results showed that AR combined with inquiry-based learning approaches can provide improved learning outcomes and positive attitudes towards the concepts and can cultivate problem-solving skills.
Regarding the domain of physics, Enyedy et al. [22] created an integrated AR learning environment. They were primarily aimed at pupils between the ages of 6 and 8 years old, and they focused on Newtonian force and motion concepts. Throughout the study, students were required to predict how specific forces affected the movement of an object. The findings showed that, by using this embodied learning activity in which pupils played the role of the moving object, cognitive concepts were more easily assimilated. Additionally, researchers showed that most children made significant learning progress in the fundamental concepts of the specific forces. Significant improvement was also achieved as students engaged more with the augmented forces concepts because they explored and re-constructed their conceptual knowledge through two-way interactions with AR. Additionally, Cai et al. [12] conducted a convex imaging experiment containing complex physics concepts such as image distance and focal imaging, as well as abstract concepts such as what happens when an object approaches a lens. Eighth-grade students participated in the experiment, and the results showed that engagement with AR tools created a constructive connection between their responses and their knowledge. Moreover, students assimilated the content more easily with AR as the use of technology stimulated their interest. They also concluded that AR-based scenarios increase learning performance and promote students’ activity levels. Finally, Zafeiropoulou et al. [6] proposed an AR game-based learning system for teaching physics in the fifth grade of primary school. They developed a treasure hunt game for pupils to conduct physics experiments. The results, although preliminary, showed that the AR system was usable and interesting for both pupils and teachers.
AR technology can also be combined with other technologies, such as natural interaction technology, to produce even more attractive learning tools and content in physics. Using the motion-sensing device Kinect, Cai et al. [3] implemented an AR system to teach magnetic fields in eighth grade. Using a Kinect depth camera, the students could trigger the magnetic field by moving their hands in real time. The results showed that students’ experiences were more nature-like than other flash-based computer-simulated programs. Furthermore, the authors supported the idea that the participants’ learning was enhanced in a more intuitive way by obtaining real-time feedback on their actions. An increase in motivation was also observed through the whole time process. Finally, Pittman and LaViola [23] conducted a qualitative study to determine the effects and attitudes on potential AR utility in secondary physics courses. They created a prototype application, PhyAR, which was based on Unity3D and used a Microsoft HoloLens device. PhyAR provided self-contained demonstrations from secondary physics courses such as Coulomb’s law, elastic collision, parallel circuits, volume, magnetic fields, and the Doppler ffect. The findings showed a clear desire for all new AR-based physics-oriented tools.
Leveraging the aforementioned studies, the use of AR technologies combined with pedagogical methods could provide an advantageous learning experience that can enhance learning outcomes. Nevertheless, these technologies pose some limitations due to the required technology literacy. According to Tobar-Muñoz et al. [24], there is usually a gap between the collaborated members (e.g., game developers and teachers) in using AR applications due to different expertise in creating learning experiences. Professional game developers are usually isolated from the real classroom environment, and they do not know the educational approaches in teaching. In addition, teachers usually lack the expertise and time to construct AR applications. These barriers, from the teachers’ perspective, could result in their unwillingness to adopt AR in their class [25]. Therefore, it should be made clear that, in order to construct an appropriate pedagogical AR-based tool, all stakeholders should be trained on how to use and construct effective and efficient learning experiences.
In summary, AR-based technology has become a popular topic in educational fields in the last decade as well as in educational research [26]. Taking into consideration various modern educational disciplines, technologies such as AR must be included in the learning environment in science education; otherwise, the absence of them could possibly negatively affect productivity and learning achievements [27]. However, the educational values of AR in the domain of physical science are not exclusively based on the use of AR technologies themselves. These educational values are more likely connected to how AR is designed, implemented and integrated into formal and informal learning settings [28].
3. Materials and Methods
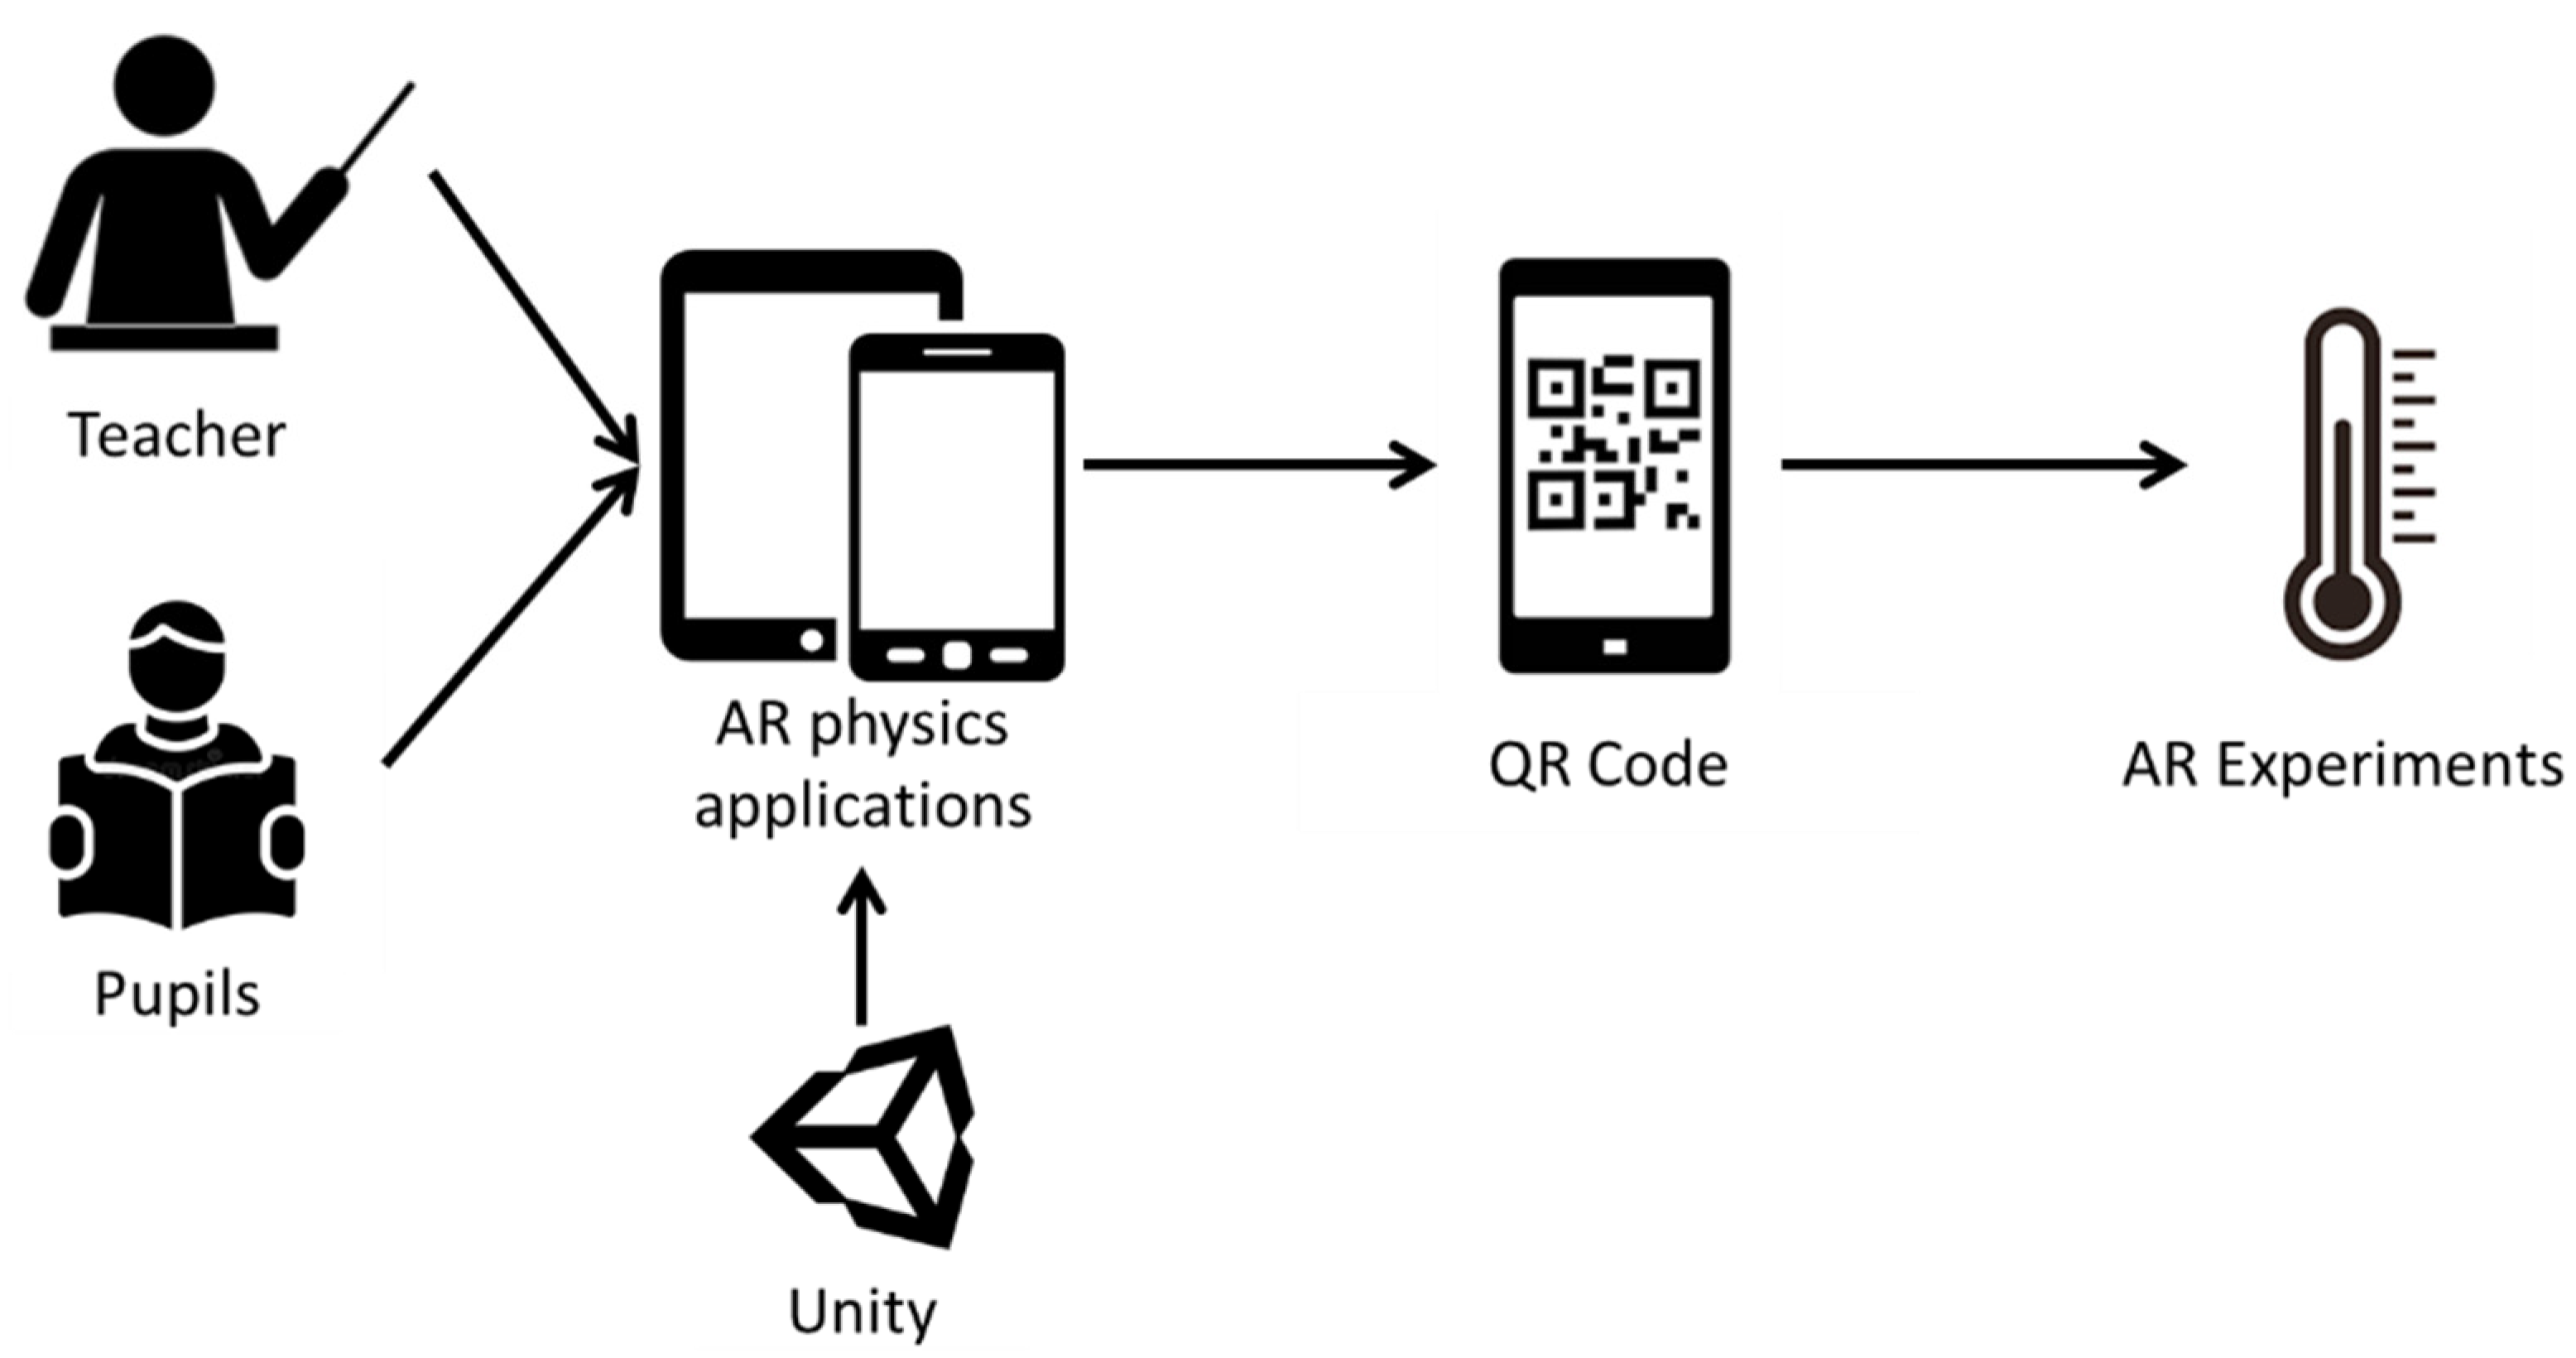
In this section, the proposed system, which consists of three AR applications for teaching physics, is analytically described in the Supplementary Materials. The AR applications were designed and developed based on the Greek curriculum for conducting physics experiments in the fifth and sixth grades of primary school, as well as in the first grade of secondary school. AR can be a beneficial way to develop and improve the educational process. Therefore, the aim is not only to improve teaching by developing a user-friendly educational application but also to enhance the learning of complex and abstract concepts by positively affecting pupils’ motivation and engagement. As a result, the system can be easily used by both teachers and pupils. First, all the AR applications are implemented using the Unity game engine [29]. Pupils should use either a smartphone or tablet for the physics experiments. Then, by using the device’s camera, a QR code is scanned, and the augmented and virtual world is displayed on the device’s screen in order to conduct the experiment. The proposed methodology is described in Figure 1, and the analytical description of each AR physics application is presented in the following sections.

Figure 1.
System Overview.
3.1. AR Application for the 5th Grade of Primary School
The first application was designed and developed for conducting physics experiments in the fifth grade of Greek primary school (the average age is 10 years). Due to the pupils’ young age, the application was designed to be a treasure hunt game to enhance its entertainment aspect. Pupils must follow the instructions, collect all the required materials and conduct the AR experiment.
The AR application was developed using the Unity platform and C# as the programming language. The project includes the following elements: 41 scenes, 88 scripts, 17 packages, hundreds of assets and thousands of 3D objects and prefabs. Moreover, the following packages were installed to ensure the best AR experience: AR Foundation 2.1.4, AR Subsystems 2.1.1, Vuforia Engine AR 8.5.9, XR Interaction Subsystems 1.0.1, ProBuilder 4.2.3 and TextMesh Pro 2.0.1. Moreover, it works on all Android devices with a minimum API Level “Android 5.0-Lollipop (API Level 21)”, because it is the lowest allowed operating system level that can support the Vuforia Engine AR.
Description of Experiments
The application starts with a home screen where there are six (6) buttons that correspond to the six (6) chapters of the fifth-grade physics textbook. According to the curriculum of the 2019–2022 school year, the chapters are: (a) material bodies, (b) energy, (c) the digestive system, (d) heat, (e) electricity and (f) light. By selecting a chapter, instructions on the way the experiment should be conducted as well as on how the pupil should interact with the application are presented. Then, the camera of the pupil’s device is activated to scan the textbooks’ QR codes. Above the QR code, an AR door appears. Entering the door, the pupil is immersed in a virtual environment. There are hidden virtual objects, which are the materials of the experiment, that must be collected (treasure hunt game) to implement the educational experiment. At the bottom of the screen, there is a list of all the materials, which are hidden behind the door of AR. In order for the pupil to proceed with the experiment, s/he must first collect all the materials by clicking on them. When a material is found, a “tick” sound effect is activated, and the name of the material is also automatically “ticked” on the list. Once all objects have been found, instructions for conducting the following experiment are displayed, as well as a list of all the materials that have just been found. Then, the experiment is conducted. The six (6) experiments are available online (Part 1: https://www.youtube.com/watch?v=0ST0fkDIFEY, accessed on 14 May 2022, and Part 2: https://www.youtube.com/watch?v=8jnbmKPim5U, accessed on 14 May 2022). At the end of each experiment, a fruitful discussion takes place, under the guidance of the teacher; therefore, the pupils can draw a conclusion. To better support pupils to receive feedback on their answers, there is a “Conclusion” button at the bottom of the screen that takes the pupil to the next and final screen of the application. This scene consists of the completed conclusion; therefore, pupils can check the accuracy of their answers.
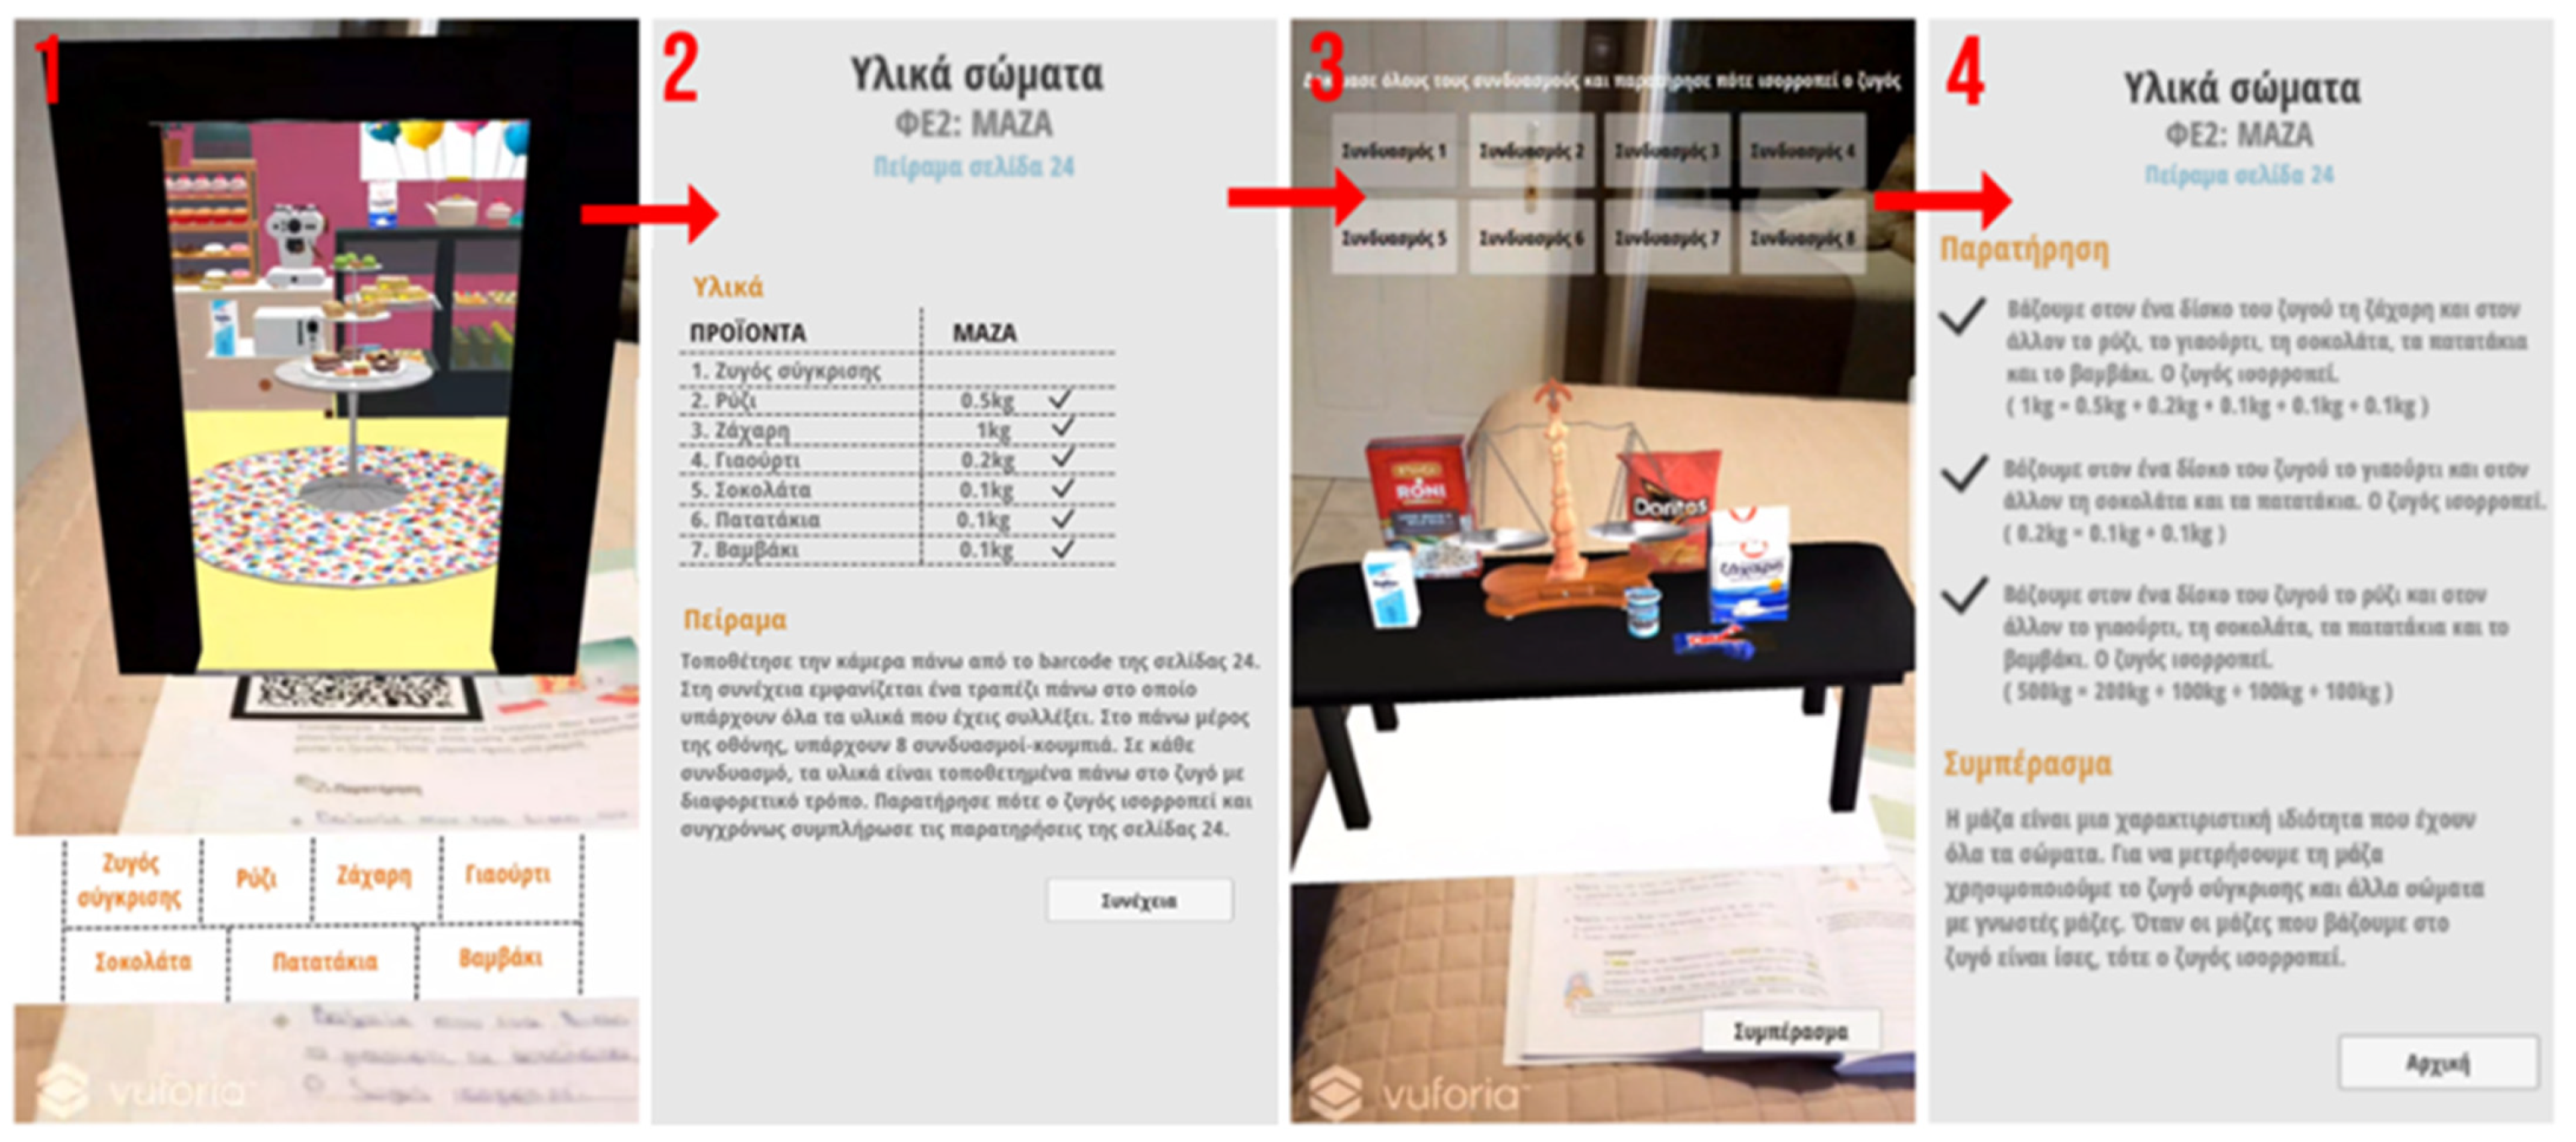
The first experiment is from the chapter “Material bodies” and refers to the section of “Mass”. It begins with an introductory stimulus and is followed by an experimental approach. In the introductory stimulus, the pupils are asked to read the mass of some products, noticing that each product has a different mass. Therefore, pupils become familiar with the usual mass measurement units. Specifically, the AR experiment is carried out with the guidance of the textbook and the teacher. At first, an AR table is displayed above the QR code of the textbook. On the table, some products with specific masses (rice 500 g, sugar 1000 g, yogurt 200 g, chocolate 100 g, crisps 100 g and cotton 100 g) and a scale have been placed in order to compare the masses of the products. At the top of the screen, eight buttons correspond to eight product combinations. At the top of the screen, there is a prompt for the pupil, which says: “Try all the combinations and observe when the scale is balanced”. The pupil must find three out of eight combinations with which the scale is balanced and note them in the textbook observations. This experimental approach helps pupils discover that mass is a characteristic property of all material bodies and that the comparison scale is used to compare different material bodies with known masses, so when the masses on the scale are equal, the scale is balanced. The process of the experiment is shown in Figure 2.
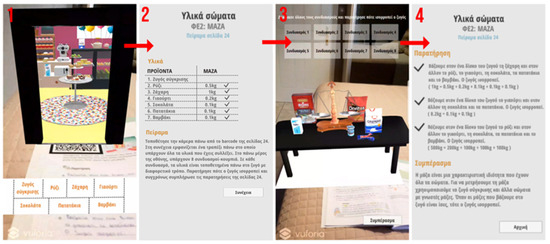
Figure 2.
The process of the “Material bodies” experiment.
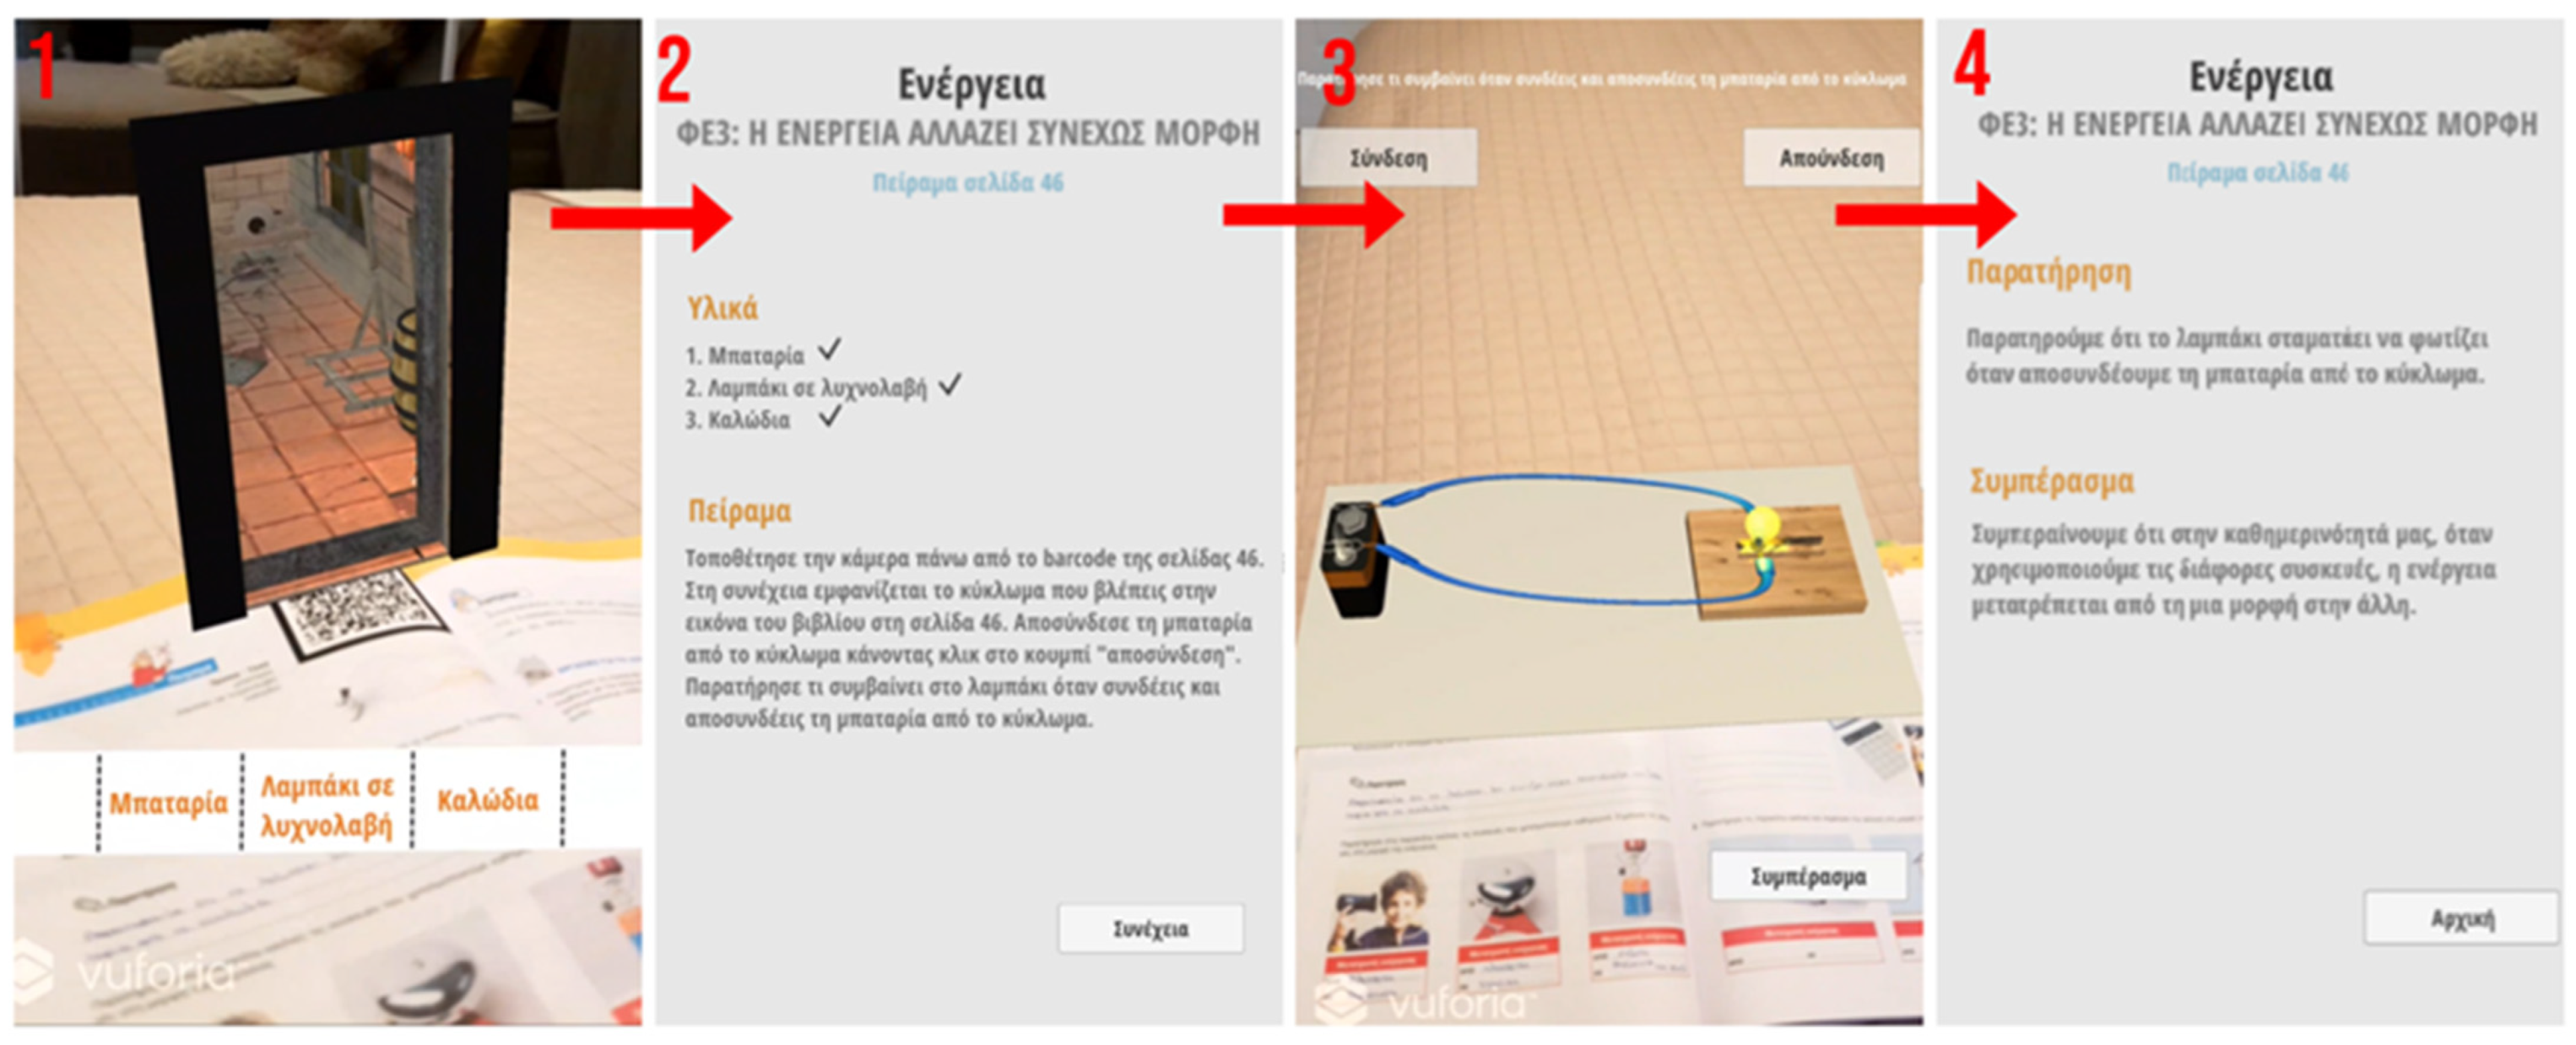
The second experiment is from the chapter “Energy” and the section “The various forms of energy”. In this experiment, pupils observe, through a simple electrical circuit with a battery and a light bulb, that the light illuminates as the stored chemical energy of the battery is converted into electricity. When the battery is disconnected from the circuit, the light stops illuminating. This happens as the conversion of energy from one form to another stops. When scanning the QR code of a textbook, an AR circuit is displayed as well as two buttons corresponding to two modes: the “Connect” and the “Disconnect”. In the “Connect” mode, the two connectors rest on the positive and negative poles of the battery respectively, thus allowing the passage of electricity. Therefore, the electrical circuit is closed, and the light is on. In contrast, in the “Disconnect” mode, one of the two connectors does not rest on a pole of the battery, thus preventing the passage of electricity. In this condition, the electrical circuit is on, and the light does not illuminate. After the pupils interact with the augmented reality electrical circuit and observe the light bulb in both situations, they generalize their observations and understand how energy is converted from one form to another. The process of the experiment is described in more detail in Figure 3.

Figure 3.
The process of the “Energy” experiment.
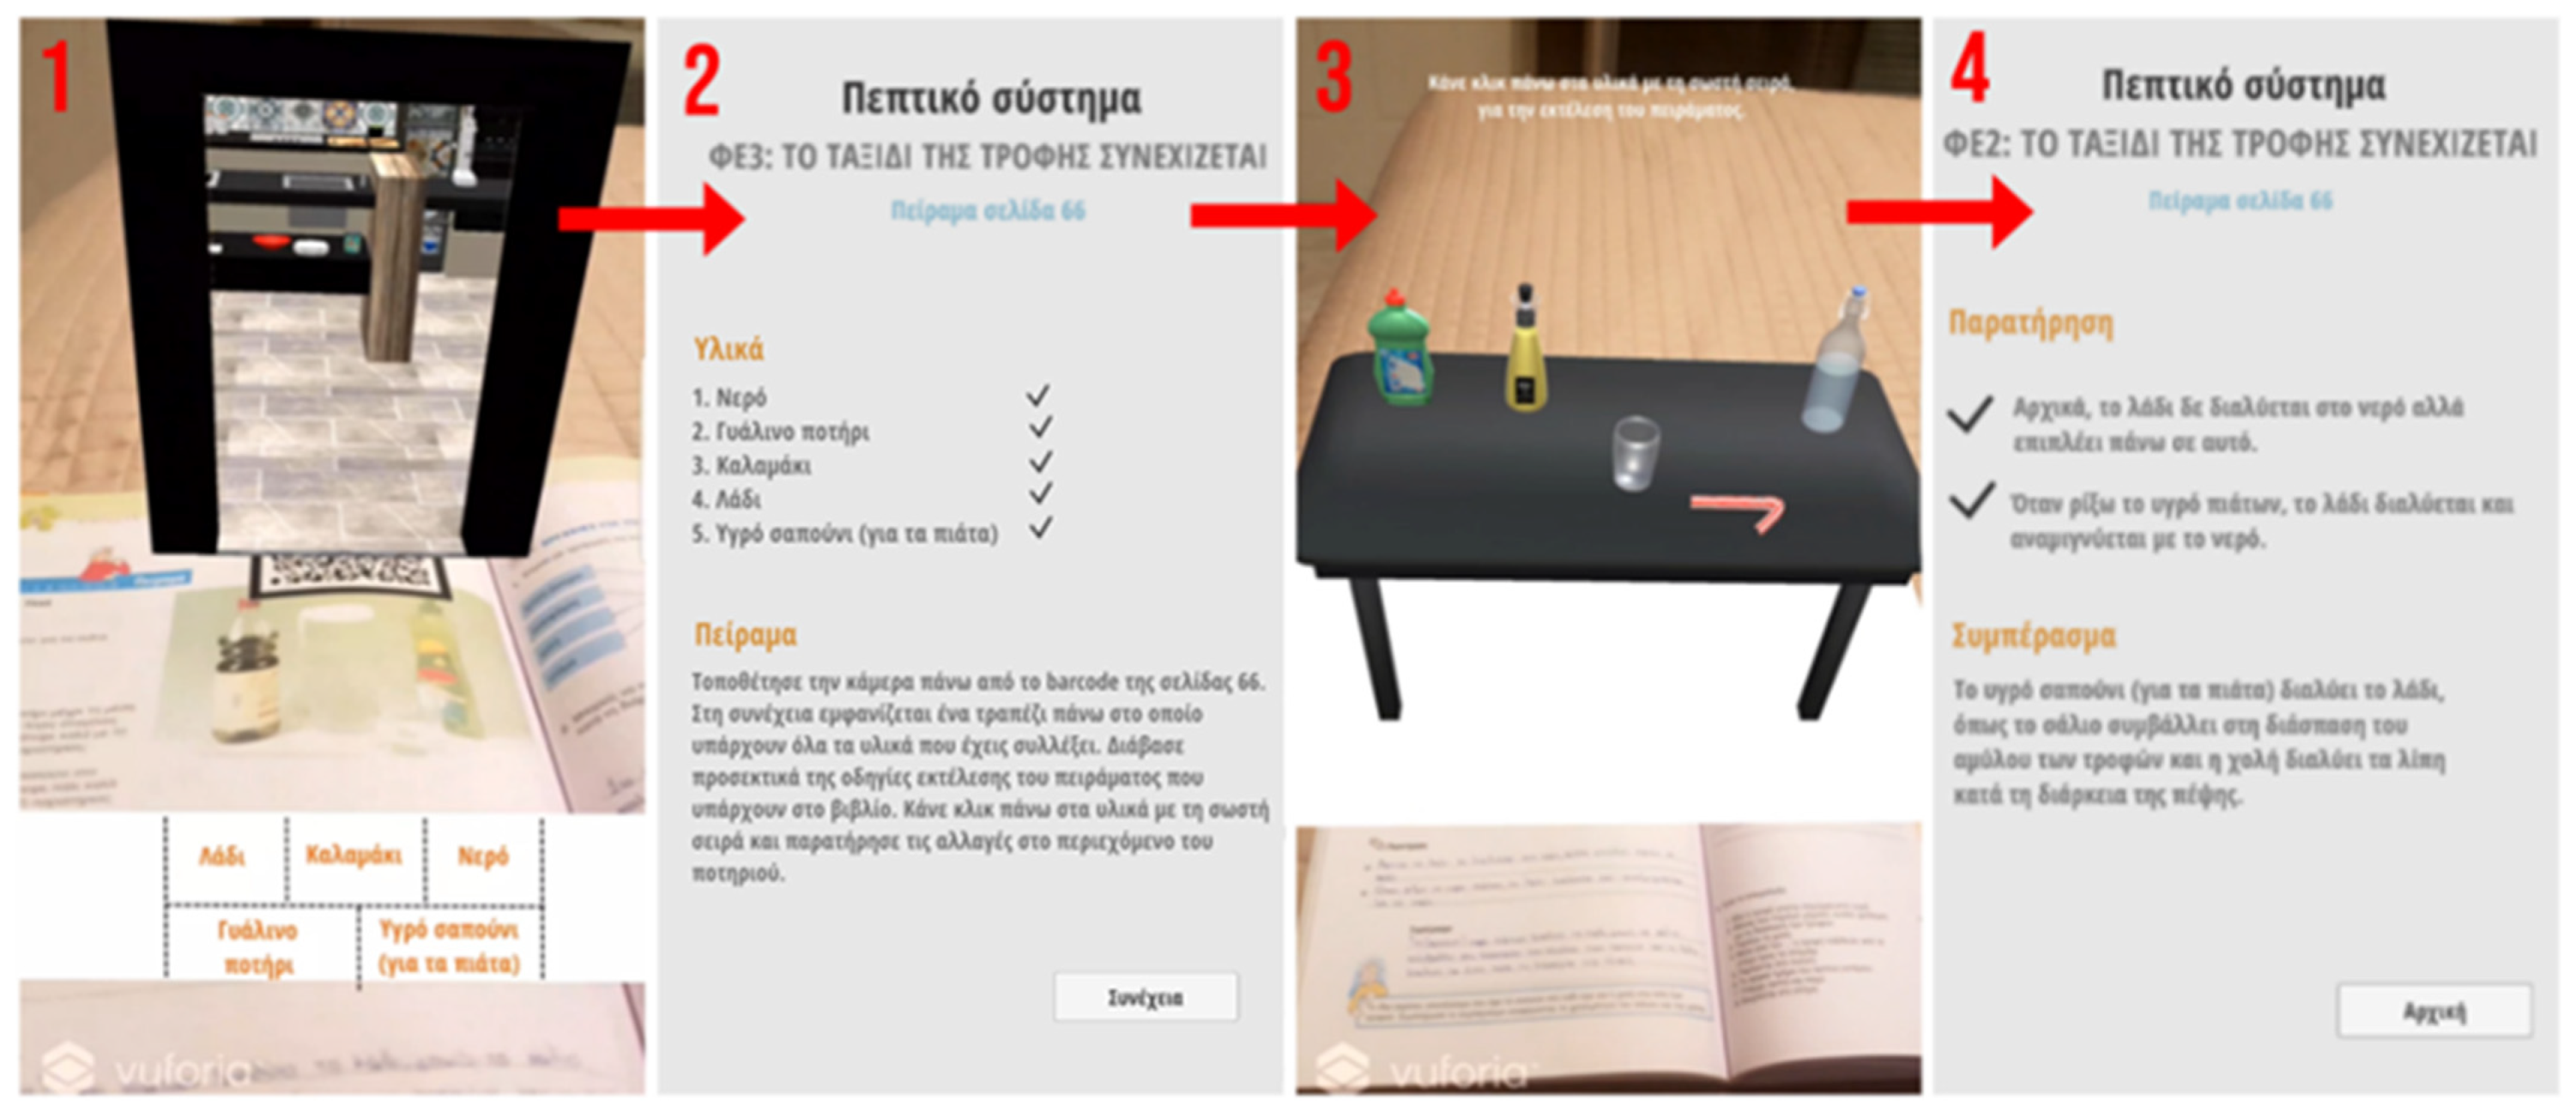
The third experiment is from the chapter “Digestive system” and the section “The food journey”. This experiment includes two parts: (a) the stimulus, and then (b) the experiment. In the first part, the pupils are asked to chew bread in order to observe that bread is dissolved by saliva. After that, the teacher explains the role of a substance that is contained in bread and is called “starch”. The saliva in the mouth dissolves bread starch. The above introductory stimulus becomes more understandable through the experiment that follows, in which pupils find that oil is dissolved by liquid dish soap, like starch by saliva. At first, a table in which all the materials of the experiment are placed is displayed, using the technology of AR. At the top of the screen, there is text prompting the pupil to “Click on the materials in the correct order to perform the experiment”. The goal of the experiment is for pupils to “click” on the materials, placed on the AR table, correctly. The right order is (a) water, (b) oil, (c) straw, (d) liquid dish soap and (e) straw. The experiment consists of the following steps: 1. a glass is filled halfway with water; 2. a few drops of oil are added to the glass of water; 3. the mixture is stirred, so the pupils should notice that the oil does not dissolve in the water, but floats on it; 4. a small amount of liquid soap is poured into the glass with water and oil; and 5. the new mixture is stirred, and it should be observed by the pupils that, after adding the dishwashing liquid, the oil dissolves and mixes with the water. After completing the above experiment, and through discussion with the teacher’s guidance, pupils should fully understand the food journey in the digestive system and conclude about the role of bile in the function of digestion. Figure 4 shows the steps of the experiment.

Figure 4.
The process of the “Digestive system” experiment.
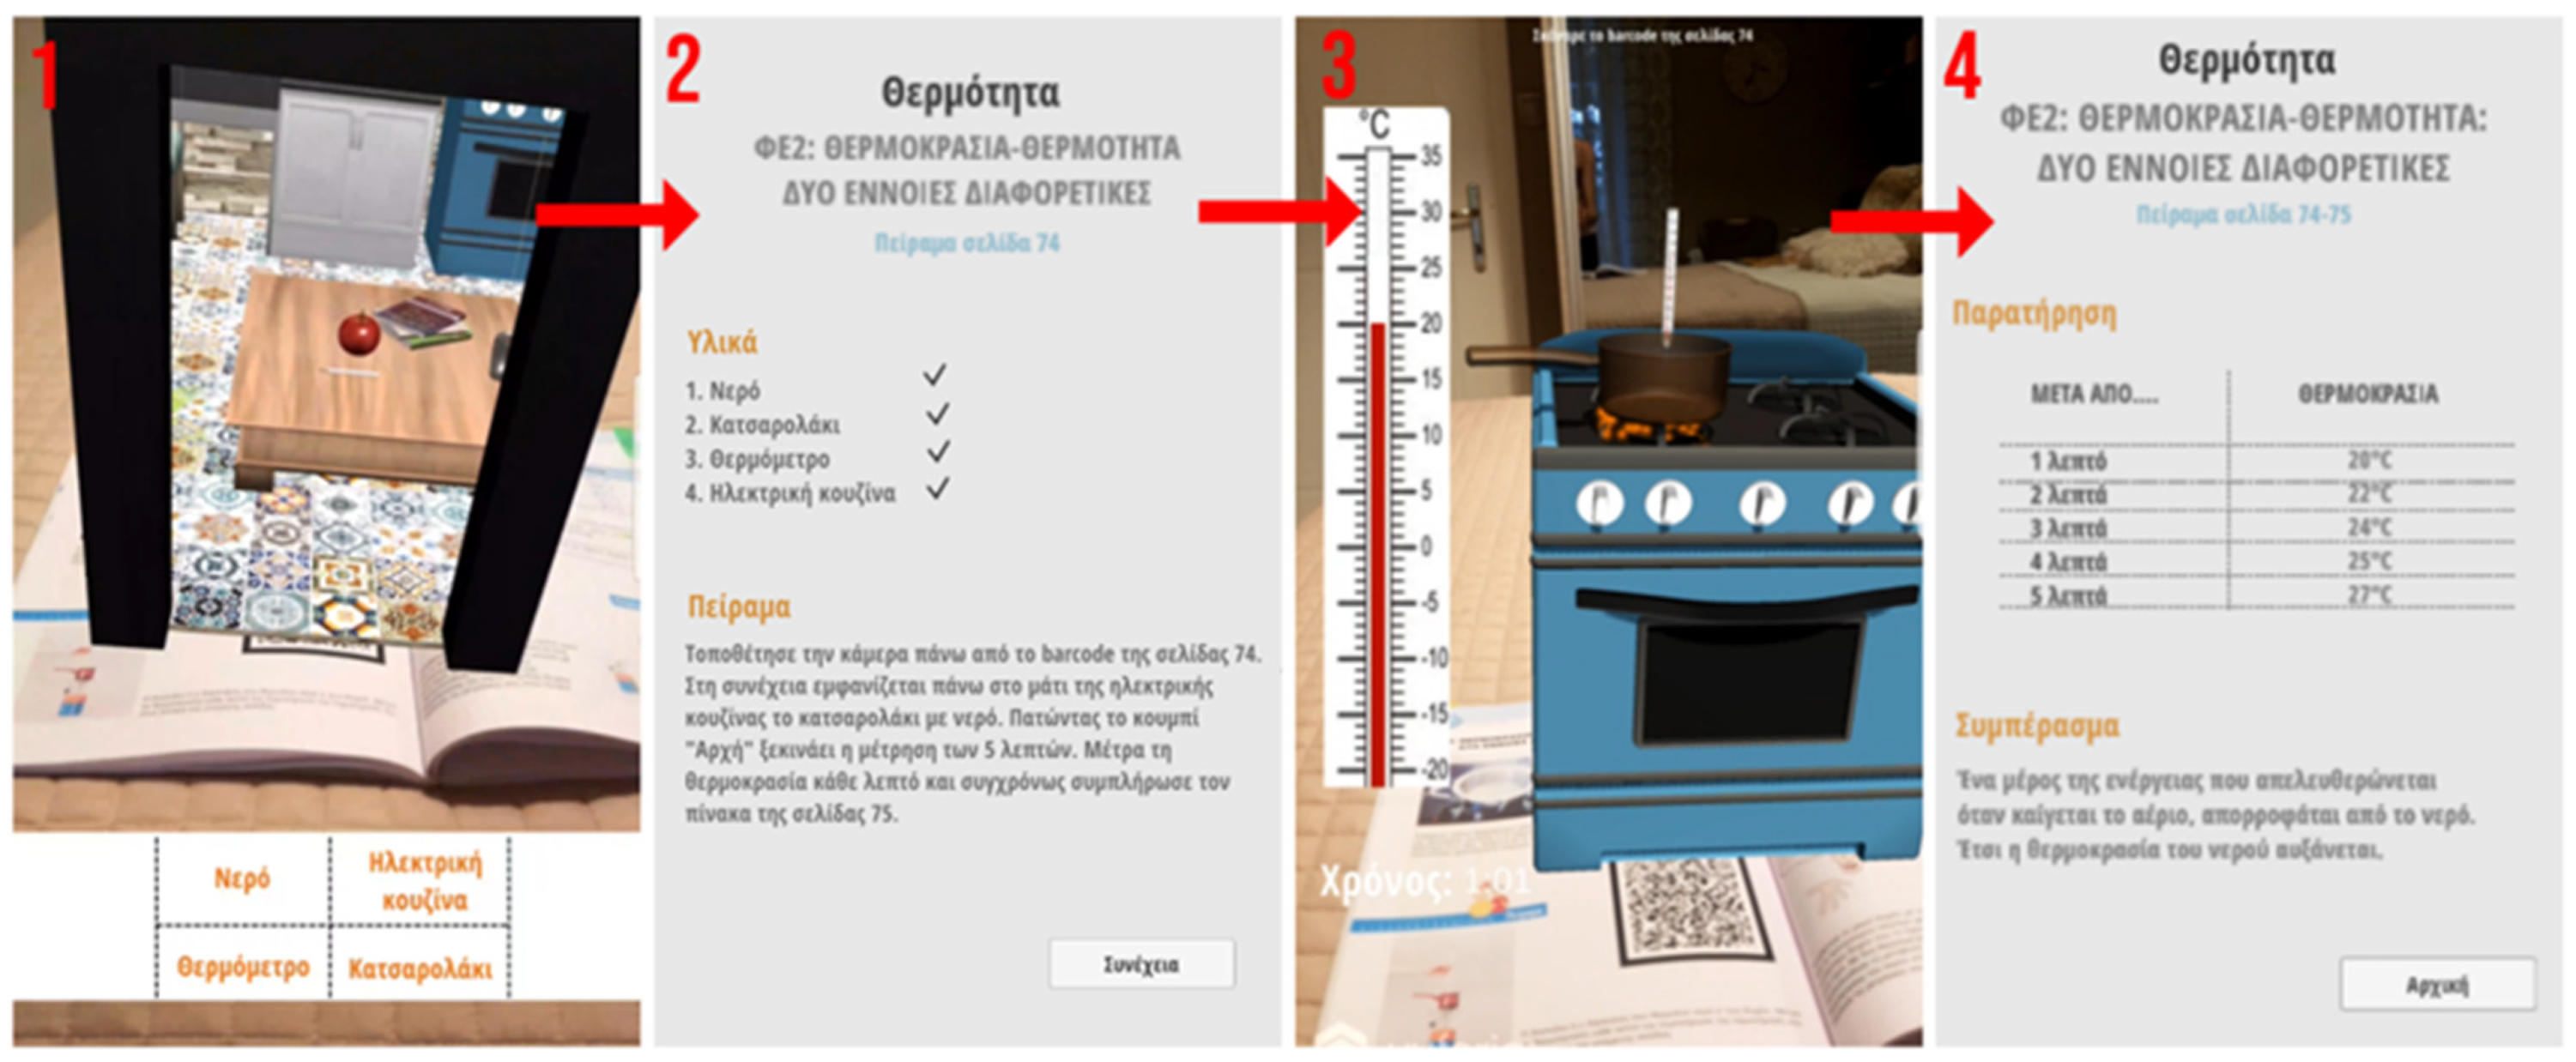
The fourth experiment is from the chapter “Heat” and the section “Temperature and heat”. Pupils must, in order to be able to distinguish the concepts of “temperature” and “heat”, gradually understand that “heat” is a form of energy. A reference is therefore made to the more general concept of “energy” until pupils understand that the supply of energy to a body implies an increase in its temperature. After a class discussion, it is expected from pupils to find experimentally that, when a body absorbs heat, its temperature rises. At first, an electric stove is displayed, using the augmented reality technology, on which the water pot and the thermometer are placed. At the top of the screen, there is the “Start” button and, by selecting that, the five-minute count starts. At the same time as when the timer starts, the electric stove turns on, and the water starts to heat up. At this point, there is a sound effect of “boiling” as well as an animation on the fire to represent the water boiling to look more realistic. As the seconds go by, the temperature on the thermometer constantly changes. The pupils, after every minute that passes, must observe the temperature of the water and note it down in the space provided in the table of the textbook. After five minutes and a class discussion, the “conclusion” button appears. Finally, the pupils must explain that part of the energy released, when the gas is burned, is absorbed by the water, so the water temperature rises. More details about the experiment are shown in Figure 5.

Figure 5.
The process of the “Heat” experiment.
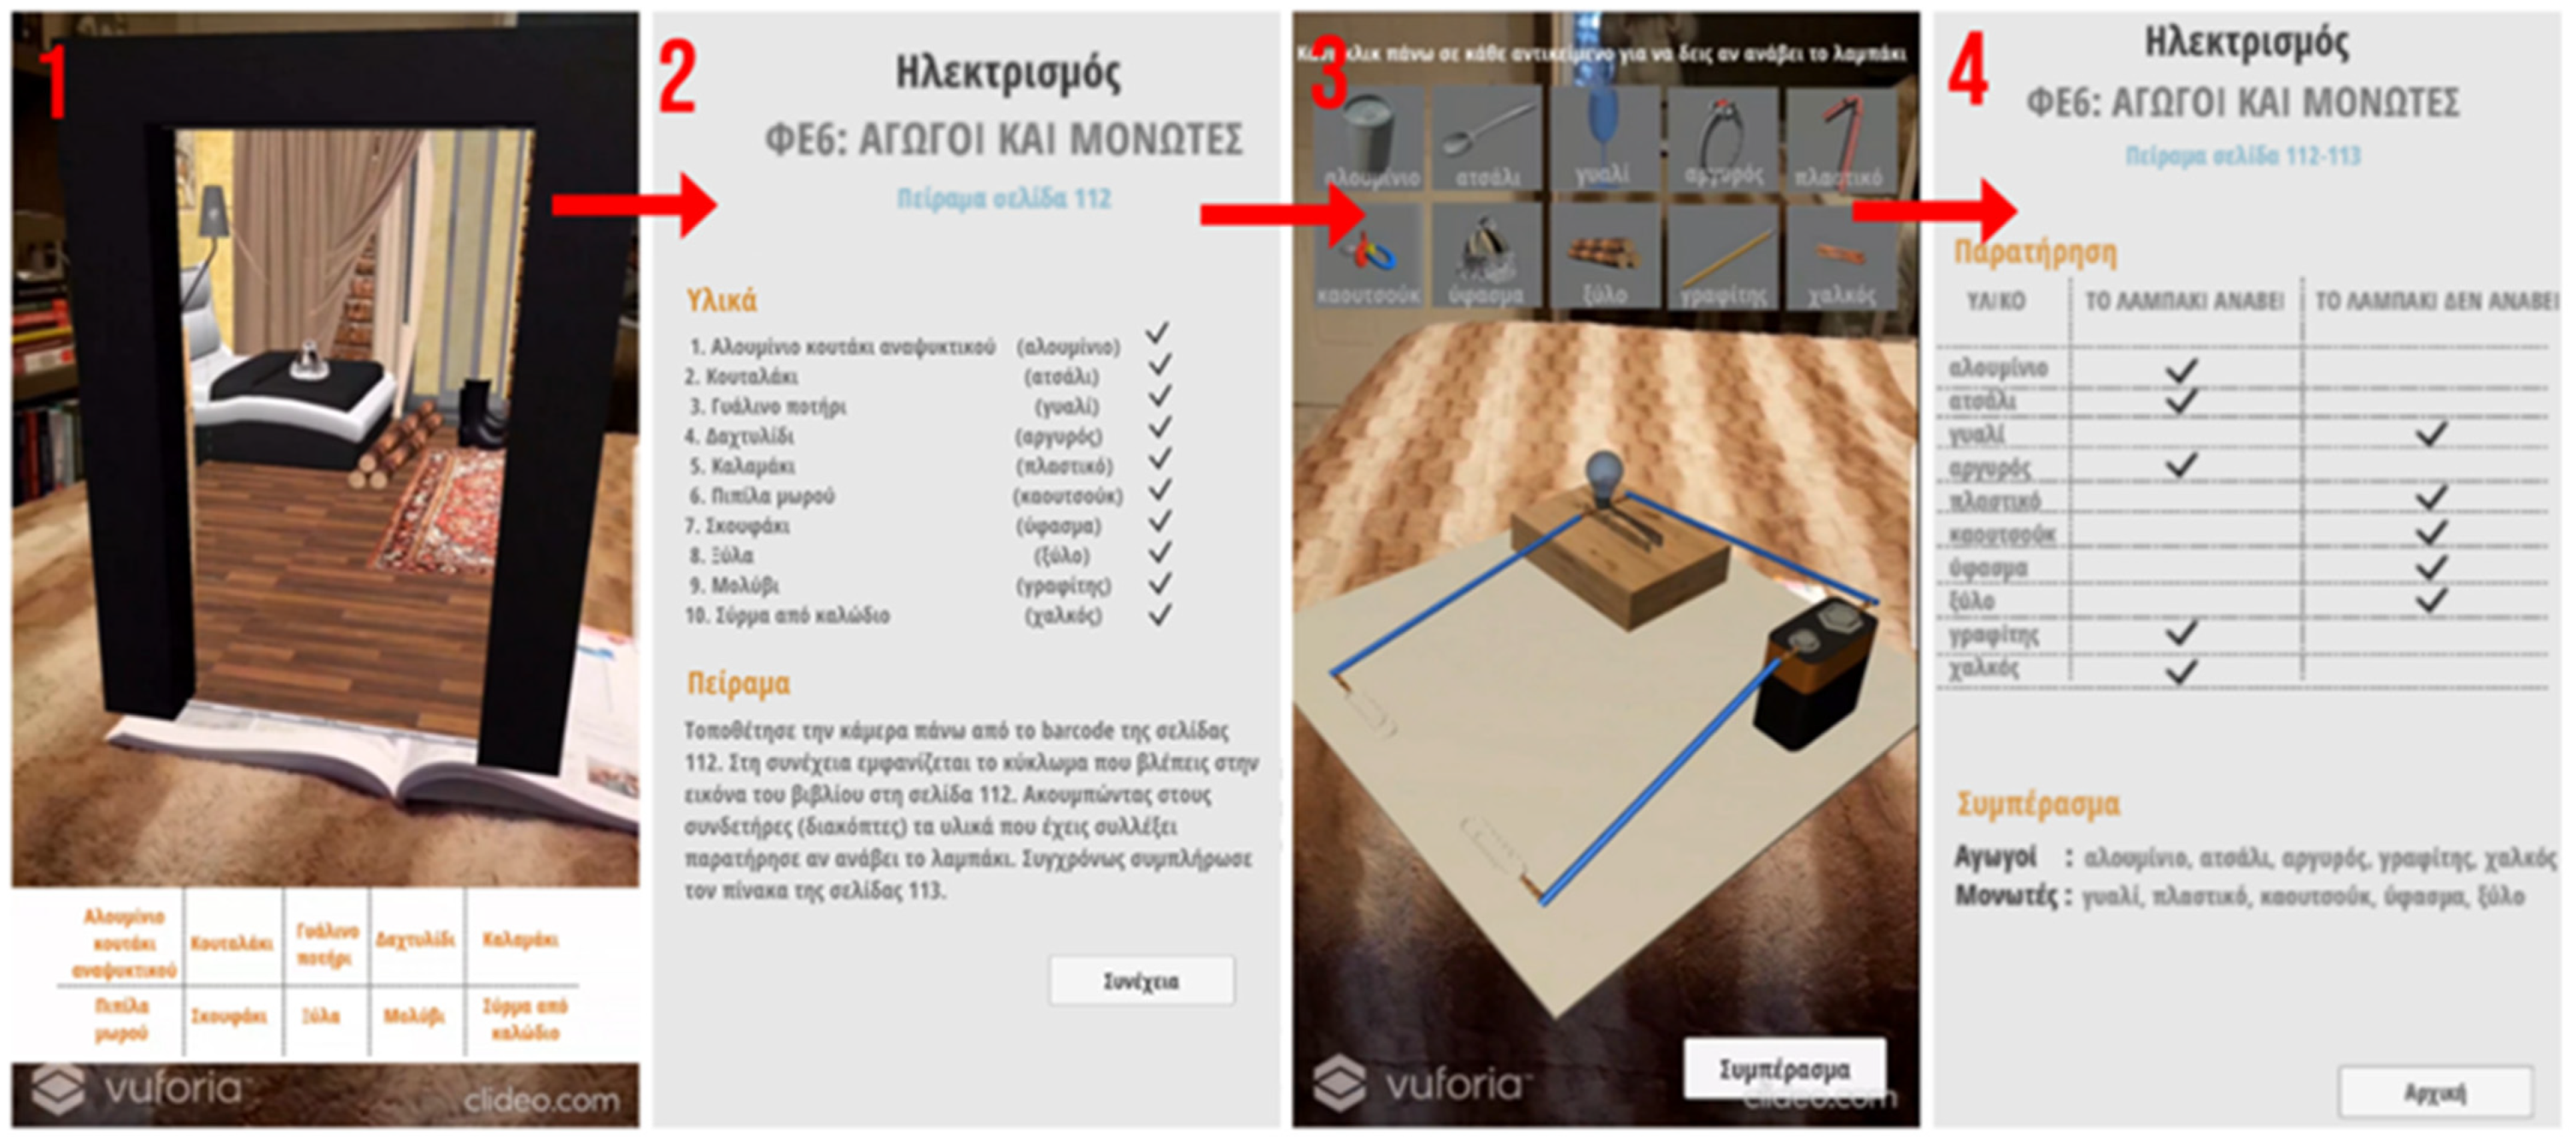
The fifth experiment is from the chapter “Electricity” and the section “Conductors and insulators”. The experiment that follows helps pupils discover that, although some materials allow electricity to flow, others do not. First, an AR electrical circuit is displayed above the QR code of the textbook. Moreover, at the top of the screen, ten buttons correspond to the ten materials/objects of the experiment (aluminum refreshment can, steel spoon, glass, silver ring, plastic straw, rubber baby’s dummy, cloth beanie, wood, graphite pencil and copper wires). By selecting each button, the corresponding object is placed between the connectors of the electrical circuit. The pupils, after observing the behavior of the light, note down in the provided table of the textbook with which materials the light is on or not. Moreover, the teacher introduces the terms “conductor” and “insulator” and explains them to the pupils. After all that, the pupils must classify the materials into conductors and insulators. The above procedure of the experiment is shown more analytically in Figure 6.
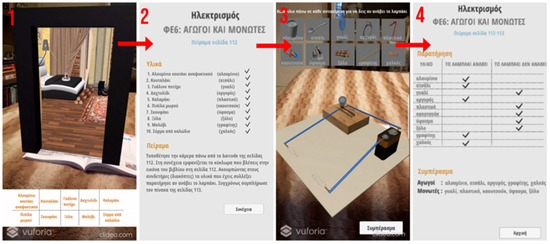
Figure 6.
The process of the “Electricity” experiment.
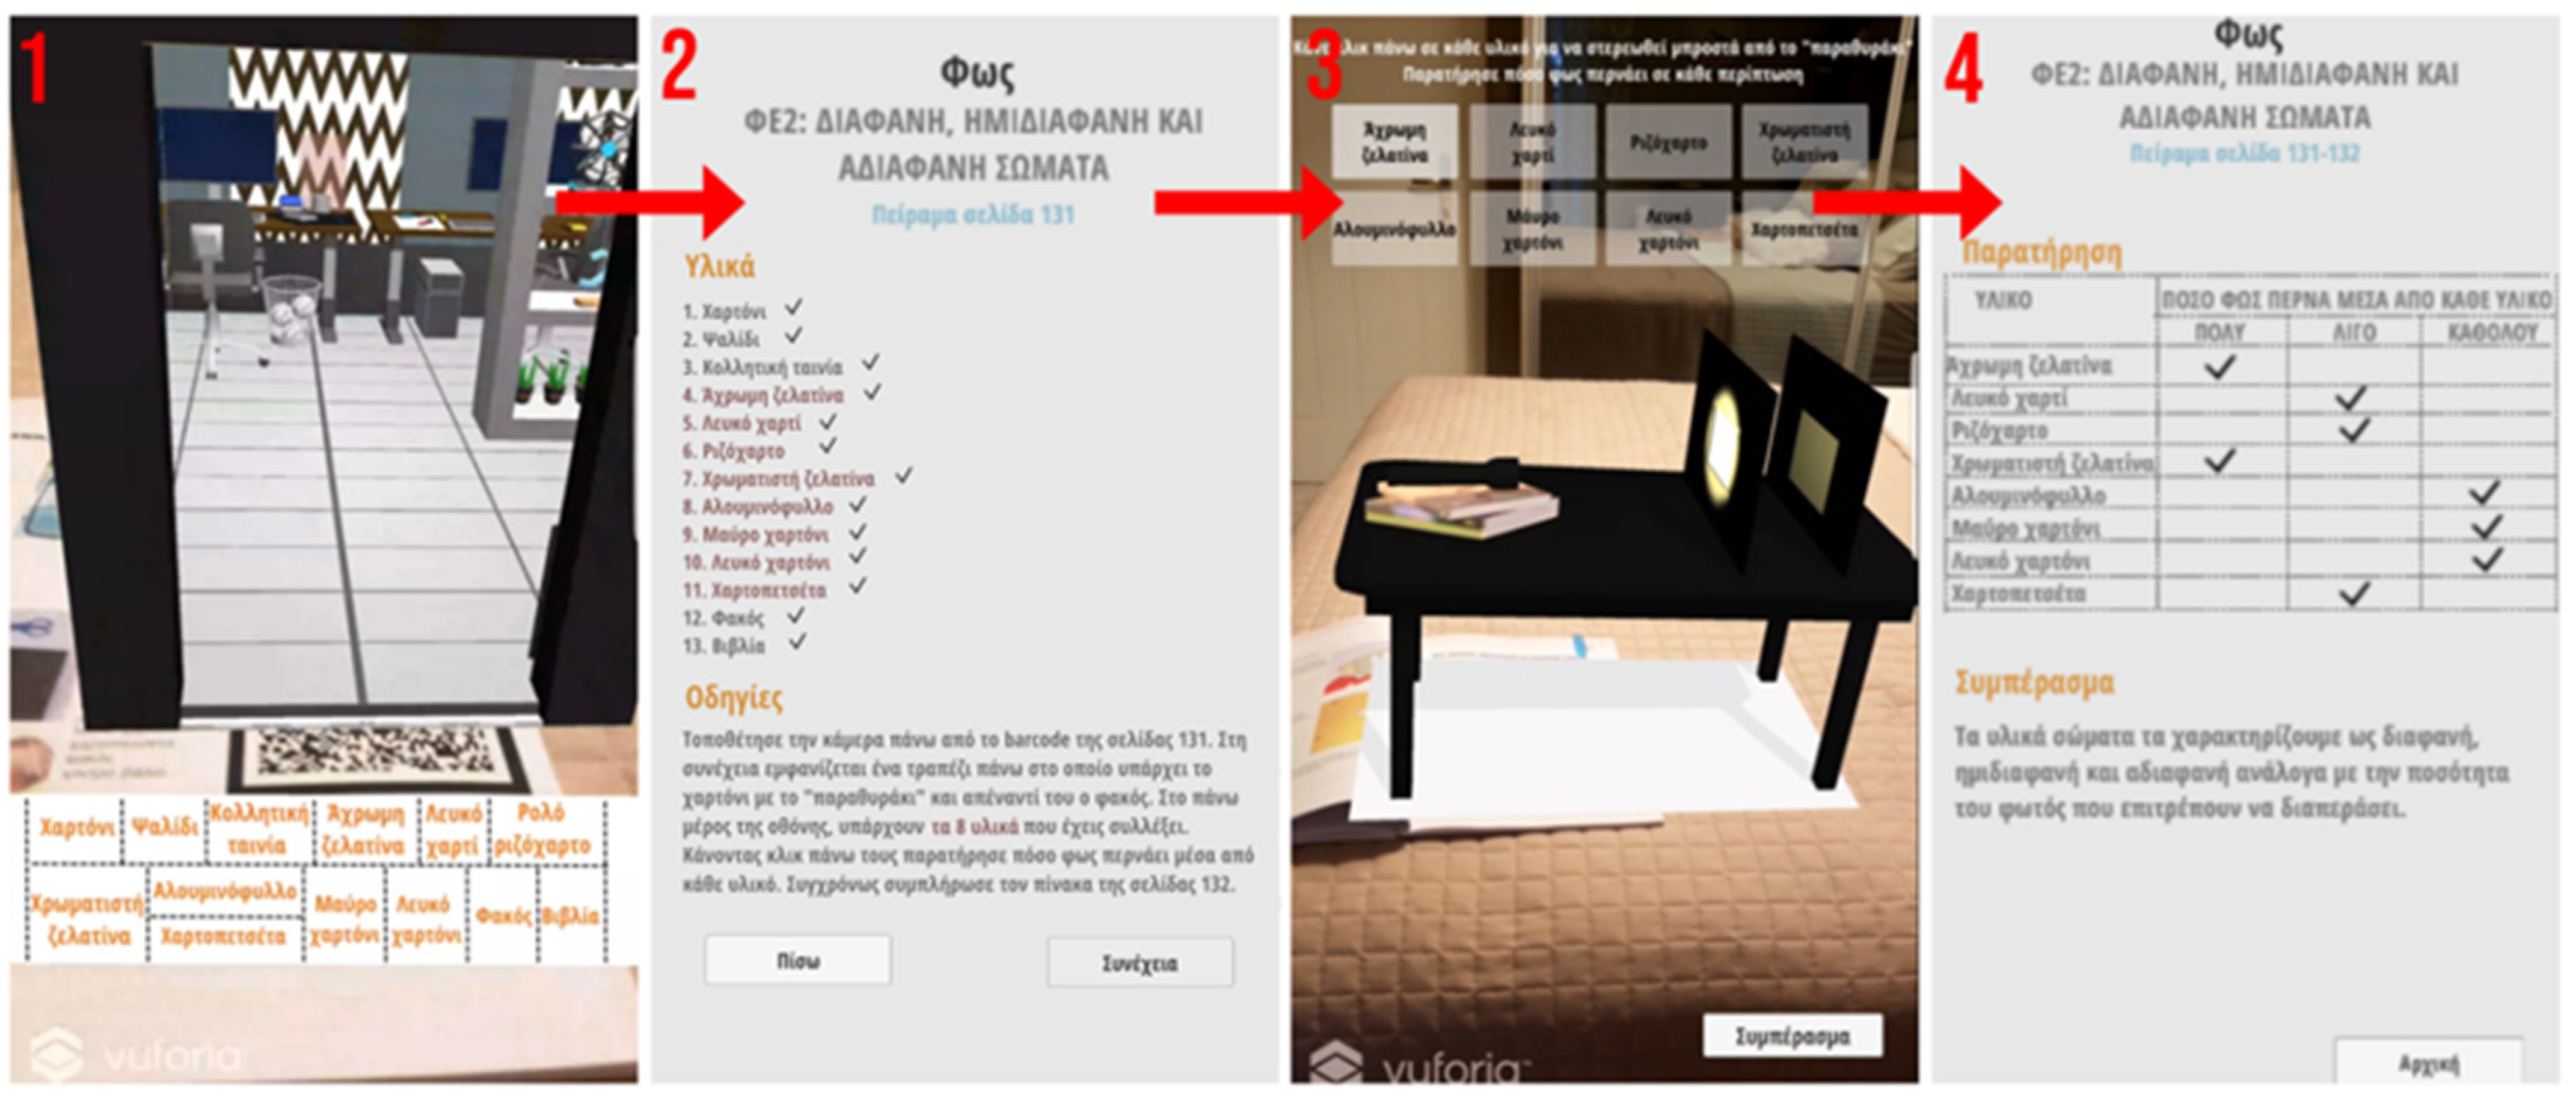
The last experiment is from the chapter “Light” and the section “transparent, semi-transparent and non-transparent bodies”. In the experiment that follows, pupils examine how much light passes through various materials (colorless jelly, white paper, rice paper, colored jelly, aluminum foil, black cardboard, white cardboard and paper towels). While the following experiment is performed, pupils write down for each material a “tick” in the corresponding column (much, little or not at all) of the textbook table, answering “How much light passes through each material?”. First of all, a class discussion is initiated, through which the concepts “transparent”, “semi-transparent” and “non-transparent” are introduced by the teacher. Then, by scanning the textbook QR code, an AR table appears on which books are placed, with a flashlight on the books, cardboard with a window facing the flashlight and black cardboard behind the cardboard with the window; therefore, pupils can see how much light passes through the window. At the top of the screen, eight buttons correspond to the eight materials that must be placed in the window. Above the eight buttons, there is a message that states, “Click on any material to put it in front of the window. Notice how much light passes through in each case”, which prompts the pupil on how to act. The pupils, depending on the amount of light that every material allows to penetrate it, characterize them as transparent, semi-transparent and non-transparent. In Figure 7, the process of the experiment is shown.

Figure 7.
The process of the “Light” experiment.
3.2. AR Application for the 6th Grade of Primary School
The second application was implemented to interactively present physics experiments in the sixth grade of Greek primary school (the average age is 11 years) and is available online at the following link: https://drive.google.com/file/d/17gBry9G0tGiMA8Obz3WHZY09tz517MAT/view?usp=sharing, accessed on 14 May 2022. The Unity game engine was used for the development of the AR application. Additionally, AR Foundation and the XR Interaction toolkit were used. AR Foundation was used to implement augmented reality applications for multi-platforms. Thus, the AR application developed using this library can be translated to the desired native platform, i.e., ARCore [30] for Android and ARKit [31] for iOS. The XR Interaction toolkit increases the usability of the AR application by providing a mechanism that makes 3D and UI interactions available from Unity input events, and it has been used in all the experiments of the second application.
Description of Experiments
The application has six (6) different experiments implemented as games; each one corresponds to a different chapter of the textbook. According to the 2019–2022 school year curriculum, the chapters are: (a) energy, (b) heat, (c) plants, (d) ecosystems, (e) magnetism and (f) acids. Each experiment’s goal is for pupils to gain knowledge more entertainingly.
The first experiment of the application is from the chapter “Energy”. The main goal of the experiment is to present the different divisions of oil and how it is processed. In the first scene of the game, each one of the oil divisions is presented by a 3D model and a 3D model of a fuel tank. The pupil must select and drag one of the oil divisions to the fuel tank in the correct order. The correct order of the oil divisions is (a) crude oil, (b) fuel oil, (c) oil, (d) kerosene, (e) petrol, (f) liquid gas, (g) asphalt, (h) heavy mineral oils, (i) medium mineral oils and (j) light mineral oils. After the pupil puts all the oil divisions on the tank in the correct order, a second scene is presented by showing to the pupil the message “Congratulations. You have completed this game successfully”. The process of the experiment is shown in Figure 8.
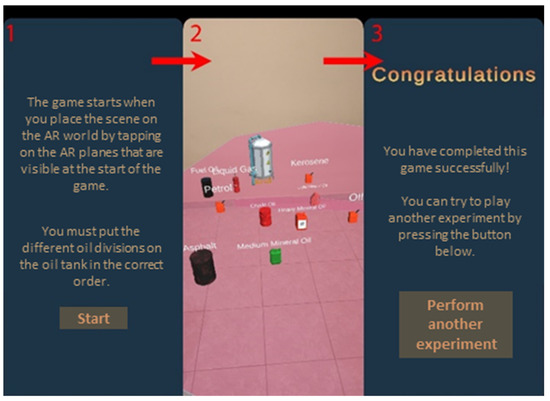
Figure 8.
The process of the “Energy” experiment.
The next experiment is regarding heat. The goal of this experiment is to show to pupils the way that some objects interact at different temperatures. The first objective of the experiment is to inflate one red and one blue balloon. At the beginning of the experiment, a set of instructions regarding the first stage of the game is presented to the pupil (user). The first scene contains a 3D model of a blue balloon, a progress bar right next to it and a button below it. The progress bar shows the inflation percentage of the balloon. When the progress bar is fully filled, the balloon has completely inflated. The pupil can inflate the balloon by pressing the button below it. Every time the pupil presses the button, the balloon gains some air. In the other case that the pupil does not press the button for a certain time, the balloon loses air. The same process must be followed for the red balloon as well. When the pupil has successfully inflated the two balloons, these are placed in two different bowls. The blue balloon is placed in a bowl with cold water, whereas the red one is placed in a bowl with warm water. After that, the two balloons change their temperature according to the bowl that they are in. Then, they are both transferred to a bigger bowl, with water at room temperature. At this stage, the pupil can observe that the red balloon will float on the top of the bowl, whereas the blue balloon will sink to the bottom, which is explained by the temperature difference between the balloons. The process of the experiment is shown in Figure 9.
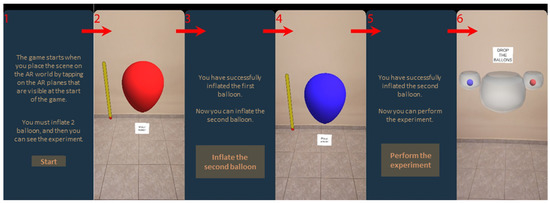
Figure 9.
The process of the “Heat” experiment.
The third experiment is named the “Plant” experiment. The experiment aims to show the pupils how some plants and objects are affected when they come in contact with an acid. The first screen of the game presents the pupils’ specific instructions. Then, three different objects are presented in the scene, i.e., (a) a slice of bread, (b) a leaf and (c) a potato, as shown in Figure 10. The pupils shoot the three objects using a gun loaded with acid bullets. Each time a bullet hits a target object, that object becomes colored pink.
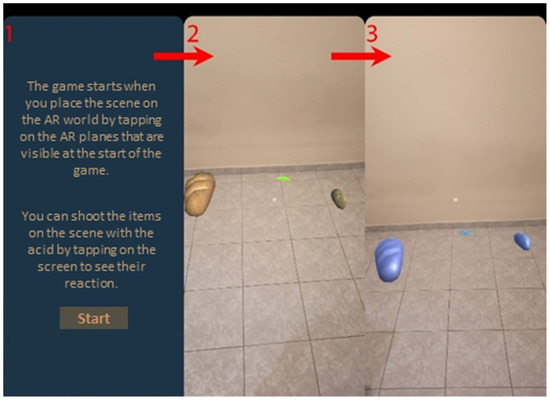
Figure 10.
The process of the “Plant” experiment.
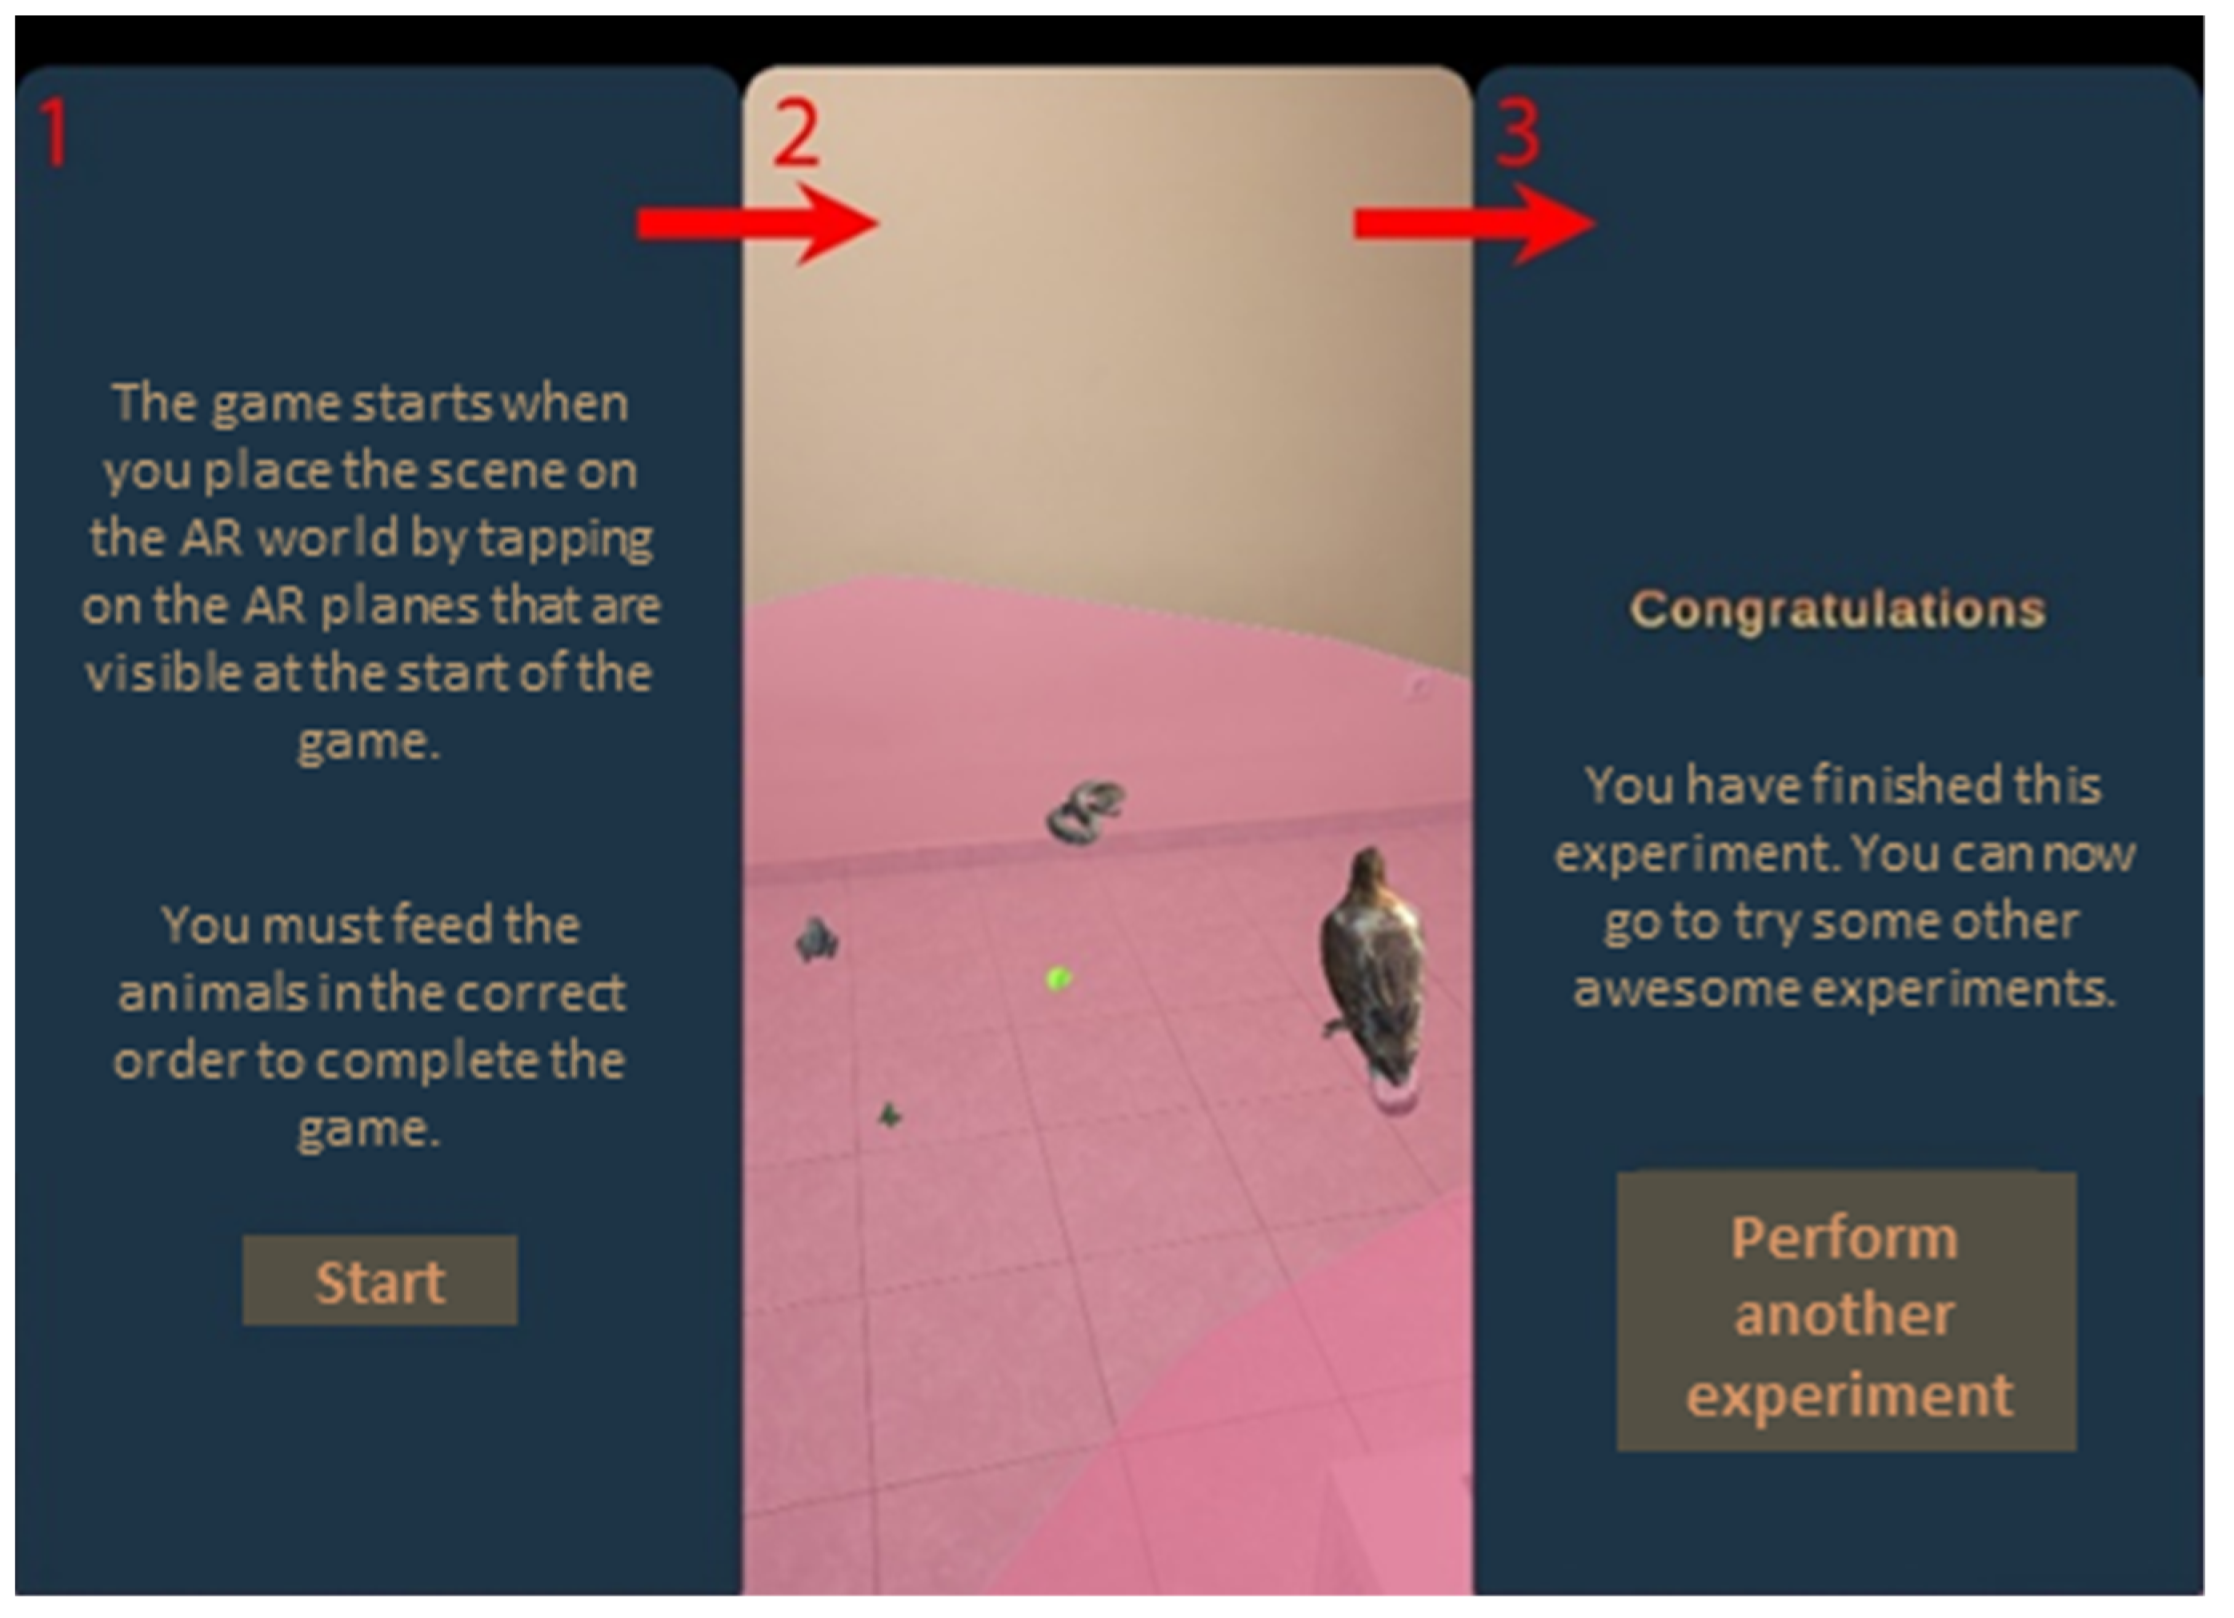
The fourth experiment of the application is regarding an “Ecosystem”. In particular, the goal of the experiment is to present to the pupils the subject of the food chain. The food chain of this experiment includes five (5) different organisms, which are (a) a leaf, (b) a grasshopper, (c) a frog, (d) a snake and (e) an eagle, as shown in Figure 11. The objective of the game, which is explained on the first screen, is for the pupil (user) to feed the organisms one by one in the correct order. Thus, the pupil must feed the leaf to the grasshopper, the grasshopper to the frog, the frog to the snake, and the snake to the eagle, in that order, to win the game. The feeding mechanism works by dragging one organism to another. If the pupil does not follow the correct order, s/he must restart the experiment. At the end of the game, only the eagle will be alive.

Figure 11.
The process of the “Ecosystem” experiment.
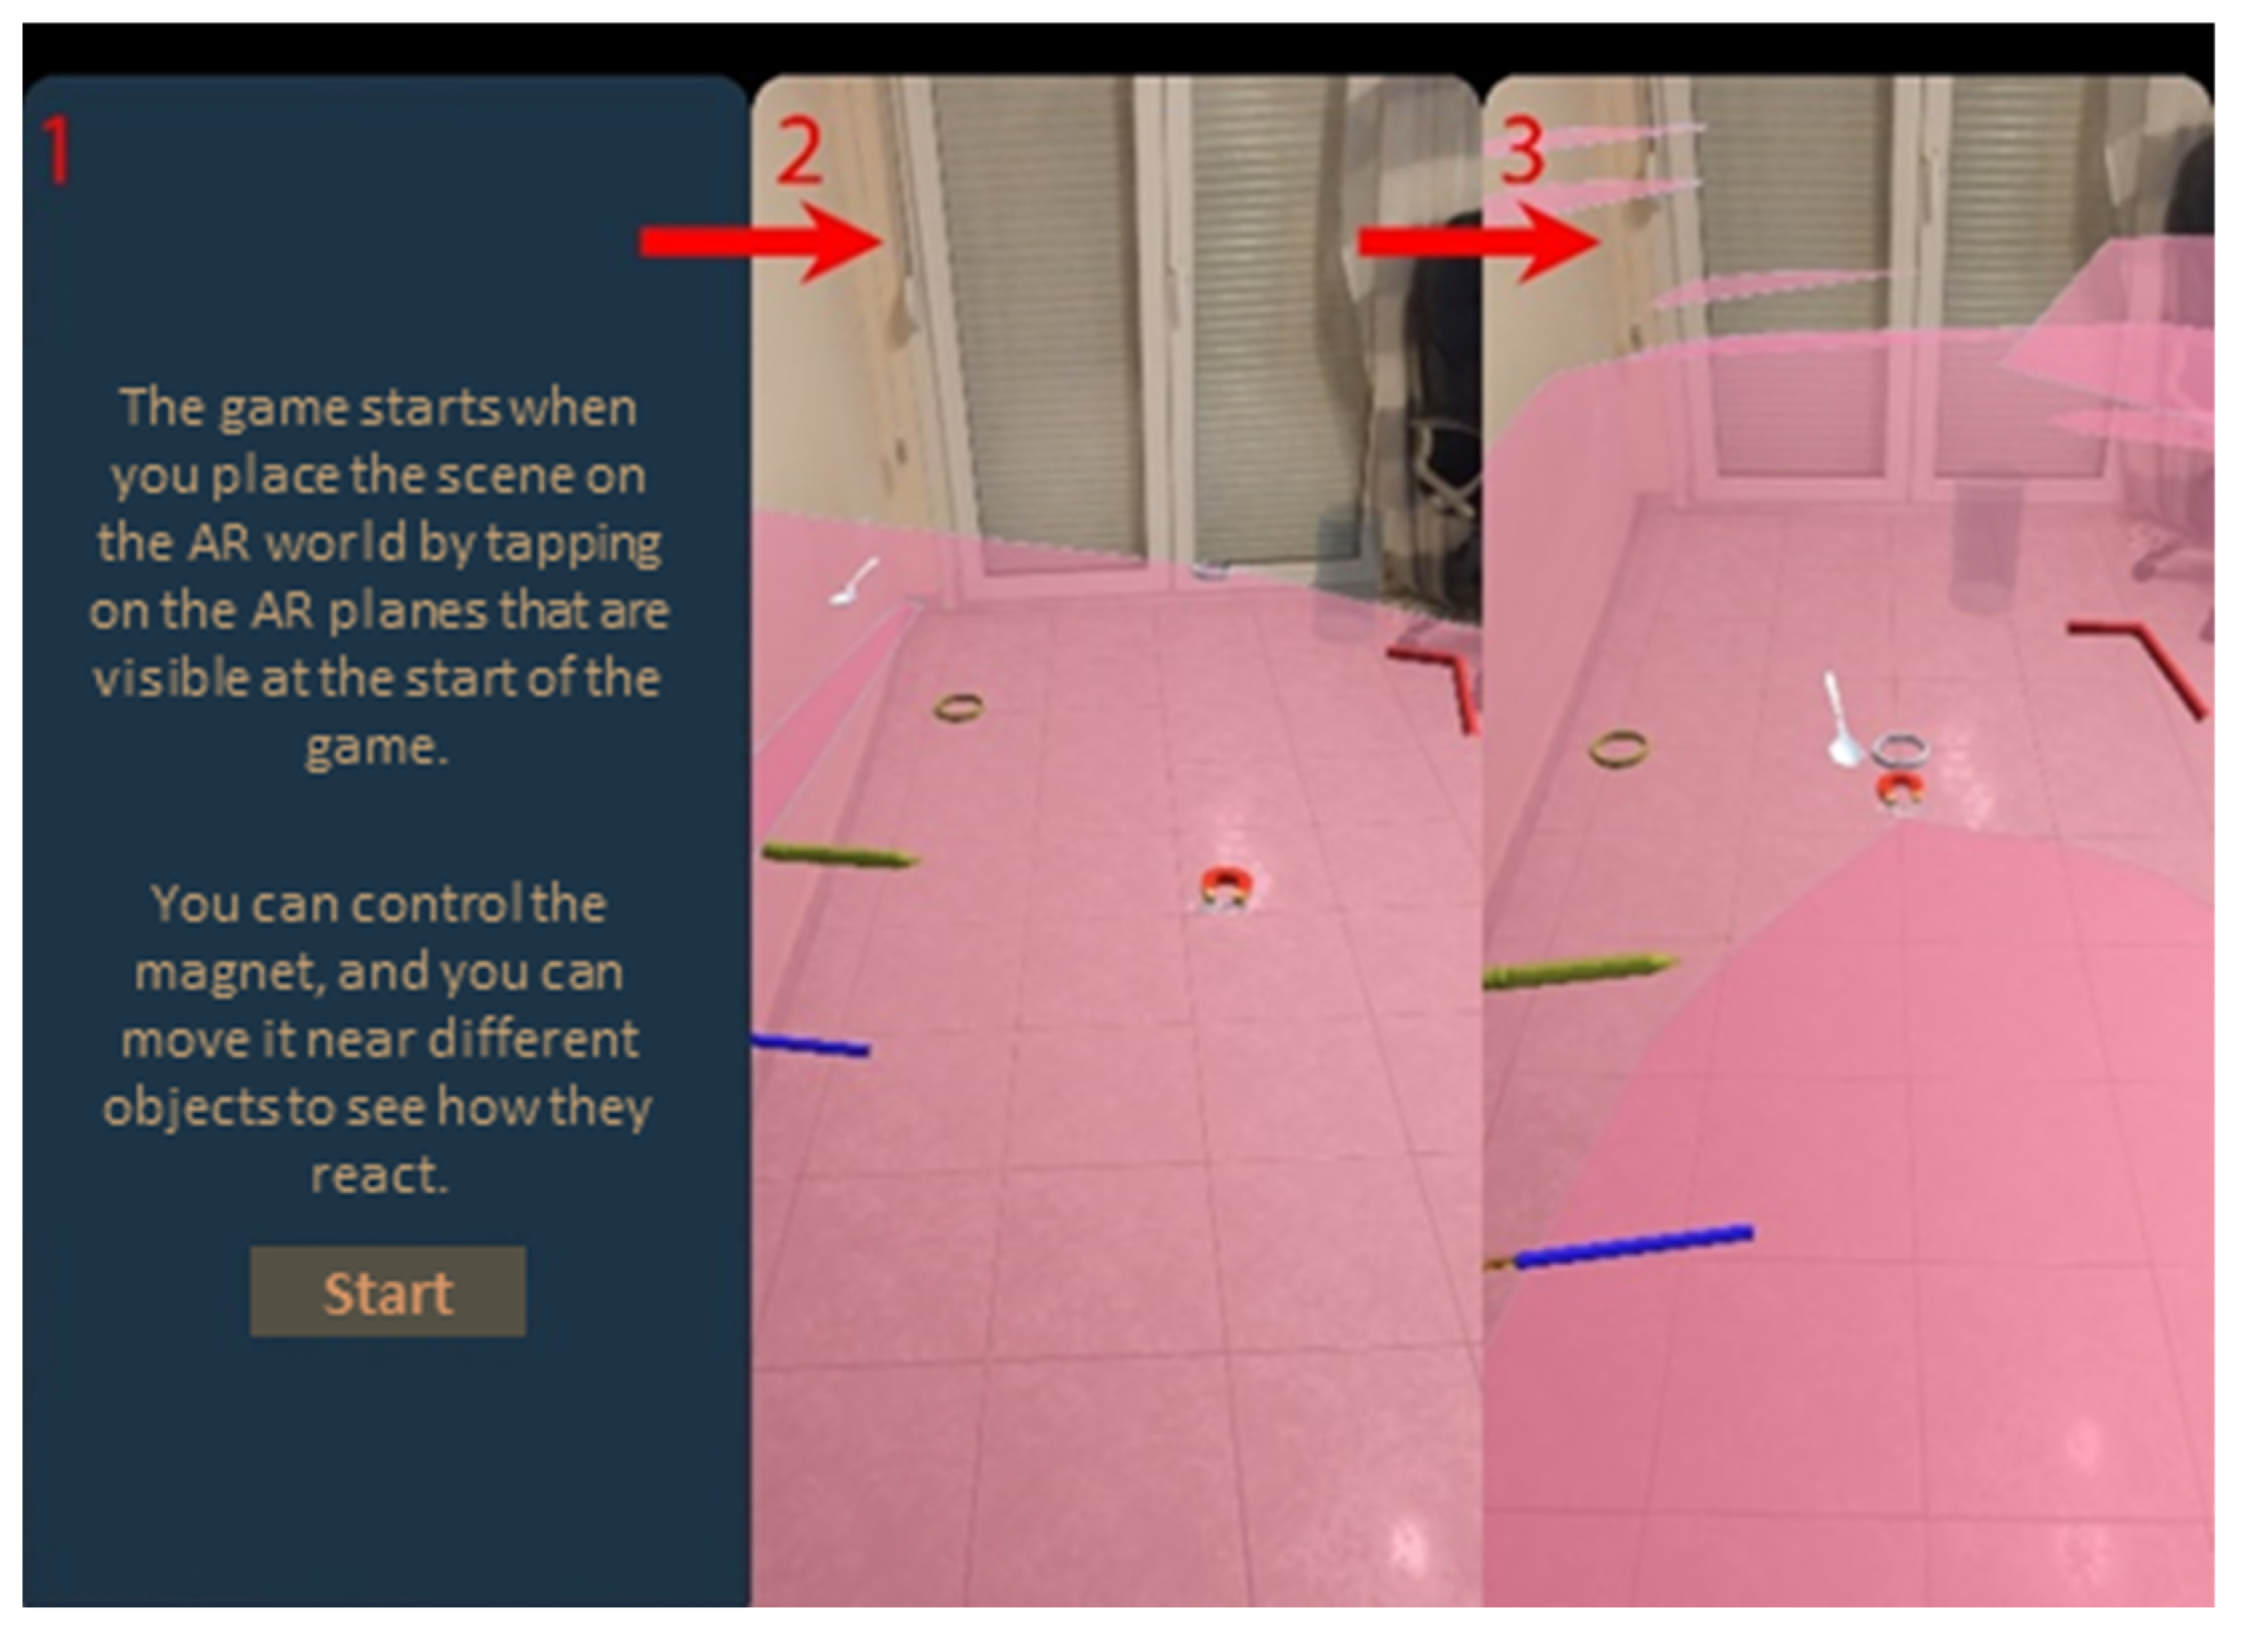
The fourth experiment corresponds to the chapter on “Magnetism”. This experiment presents to the pupil how magnetic fields react with certain objects in order to explain the main principles of magnetism. The pupil (user) can drag a magnet around the scene and find which objects interact with it, as shown in Figure 12. The objects are (a) a copper wire, (b) a straw, (c) a spoon, (d) a silver ring, (e) a gold ring, (f) a paper clip, (i) a glass of water and (j) a pencil.
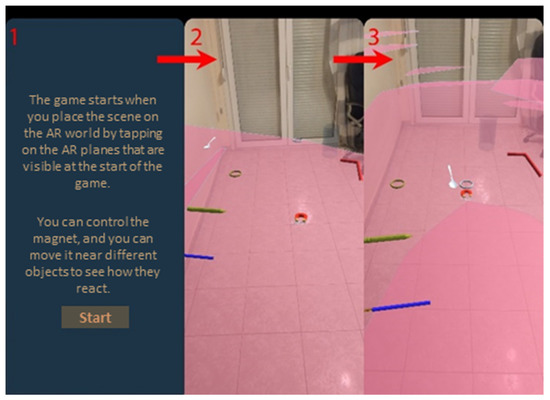
Figure 12.
The process of the “Magnetism” experiment.
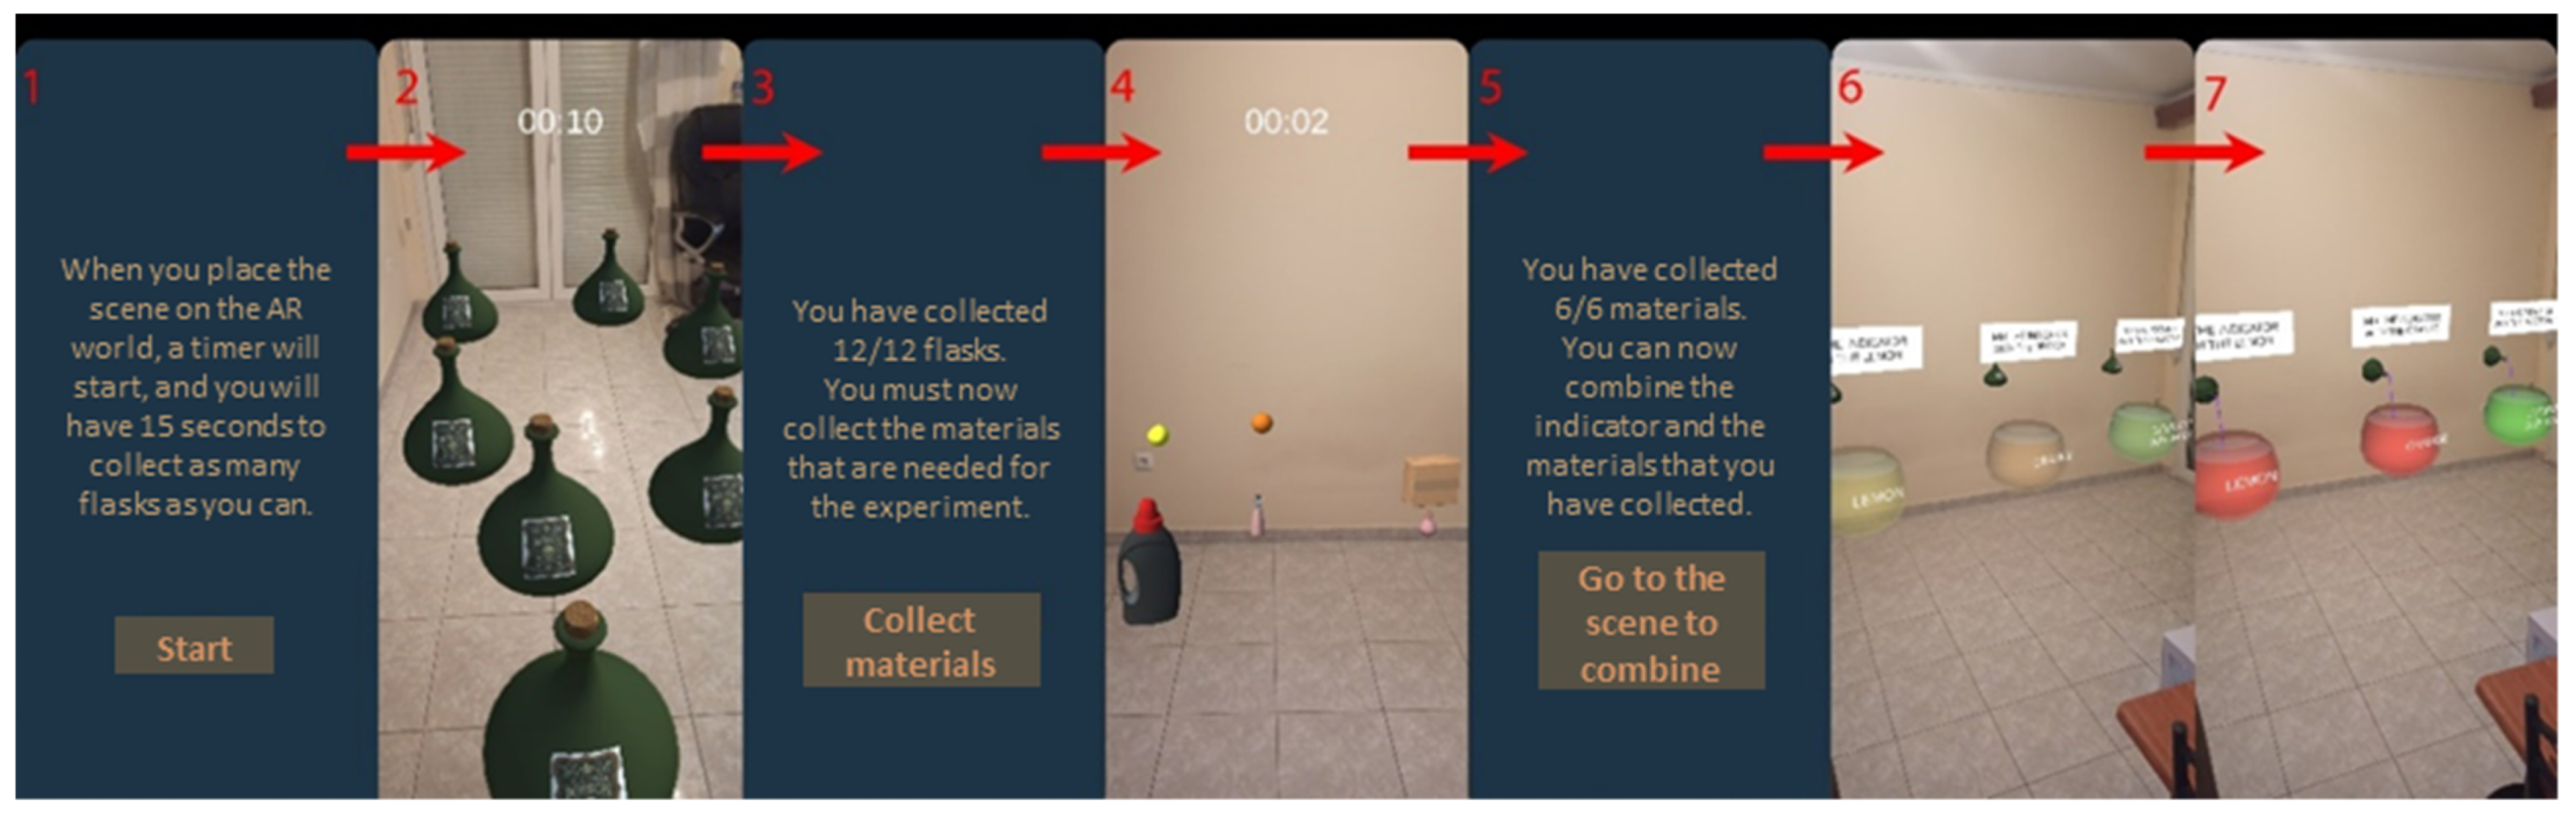
The last experiment of this application is named “Acid”. This game consists of multiple stages to complete the actual experiment, and the pupil comes to understand acids and bases. In the first stage, there are twelve (12) bottles that contain the indicator needed for the experiment. This indicator has been created by mixing small pieces of red cabbage with pure alcohol and straining it after a couple of minutes. The pupil has fifteen (15) seconds to collect as many as s/he can, by tapping on them. A pupil must collect at least 2 of the 12 bottles to continue to the next stage. Then, in the second stage, the pupil has 15 s to collect as many items as s/he can. During this time, there are six different types of items, which are (a) laundry detergent, (b) vinegar, (c) ammonia, (d) baking soda, (e) an orange and (f) a lemon. In this stage, the pupil must collect at least one item. The last stage is where the experiment occurs. This stage is heavily dependent on the previous two. There is a bowl for each item that the pupil collected in the second stage and a bottle above the bowl, with the indicator that was collected in the first stage. The pupil must press the button in front of a bowl to mix the liquid in the bowl with the indicator above it. The liquid of the bowl turns red if the liquid is an acid and green if the liquid is a base. The whole process of the experiment is shown in Figure 13.

Figure 13.
The process of the “Acids” experiment.
3.3. AR Application for the 1st Grade of Secondary School
The third AR application aims at teaching and learning physics for the first grade of secondary education in Greek schools, with a game-based approach. It is available online for download at https://drive.google.com/drive/folders/1J7JFgUC6mrstD-q9P3XeOqpJS_hR-bol, accessed on 14 May 2022. The application covers every experiment of the school textbook, uniquely, as they are levels in a game. Selecting an experiment and using an AR device, the pupils must scan a QR code to start the level. Since the application targets children in the age group of around 12 years old, the game elements are advanced. A virtual assistant is available to help the pupils complete the experiments. The pupils can tap on a spot on the QR code to force the virtual assistant to move in that direction, and if there is a button or an object, the virtual assistant interacts with its surroundings. The AR application was developed in the game engine Unity using the C# programming language. The AR application is available for different smart devices, such as Android phones and tablets. The Vuforia engine was also used to handle the AR functionality of the project. To make the game more suitable for pupils of this age group, the package Universal Render Pipeline was used to make the graphics and the lighting cartoon-like.
Description of Experiments
An introduction screen guides the pupils into the steps that they must follow to complete the experiment, and the main screen has a menu with the twelve (12) chapters of the school textbook. In each chapter, there is a list of experiments included in it. Some of the buttons are the ‘X’ red indication, which ends the scene; the blue arrows, which restart the scene; the blue exclamation mark, which informs about the experiment; and some others, which handle some actions of the 3D assistant.
By selecting an experiment and using an AR device, the pupils must scan one or two QR codes, depending on the experiment, to start the level. Both QR codes are square, but one of them is half the size of the other. The experiment of the first chapter, “Length Measurements—The Average Value”, needs both QR codes. By scanning the big QR code, a ruler, a measuring tape and the 3D assistant appear on the screen. By scanning the small QR code, a brown platform appears on top of it. By tapping on the platform, the assistant moves in that direction, expanding the measuring tape that stays still on the big QR code, displaying the distance between the start of the measuring tape and the end of it on a real-life scale. In addition, pupils can use the traditional ruler to measure objects in the real world (see Figure 14).
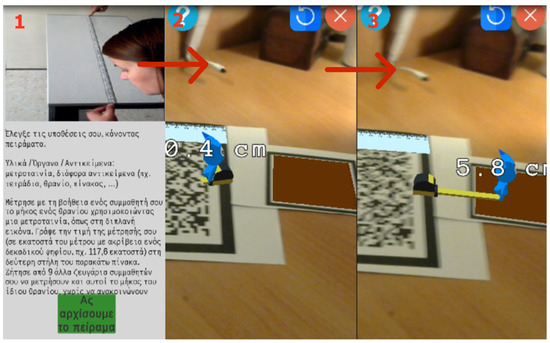
Figure 14.
The process of the “Length Measurements—The Average Value” experiment.
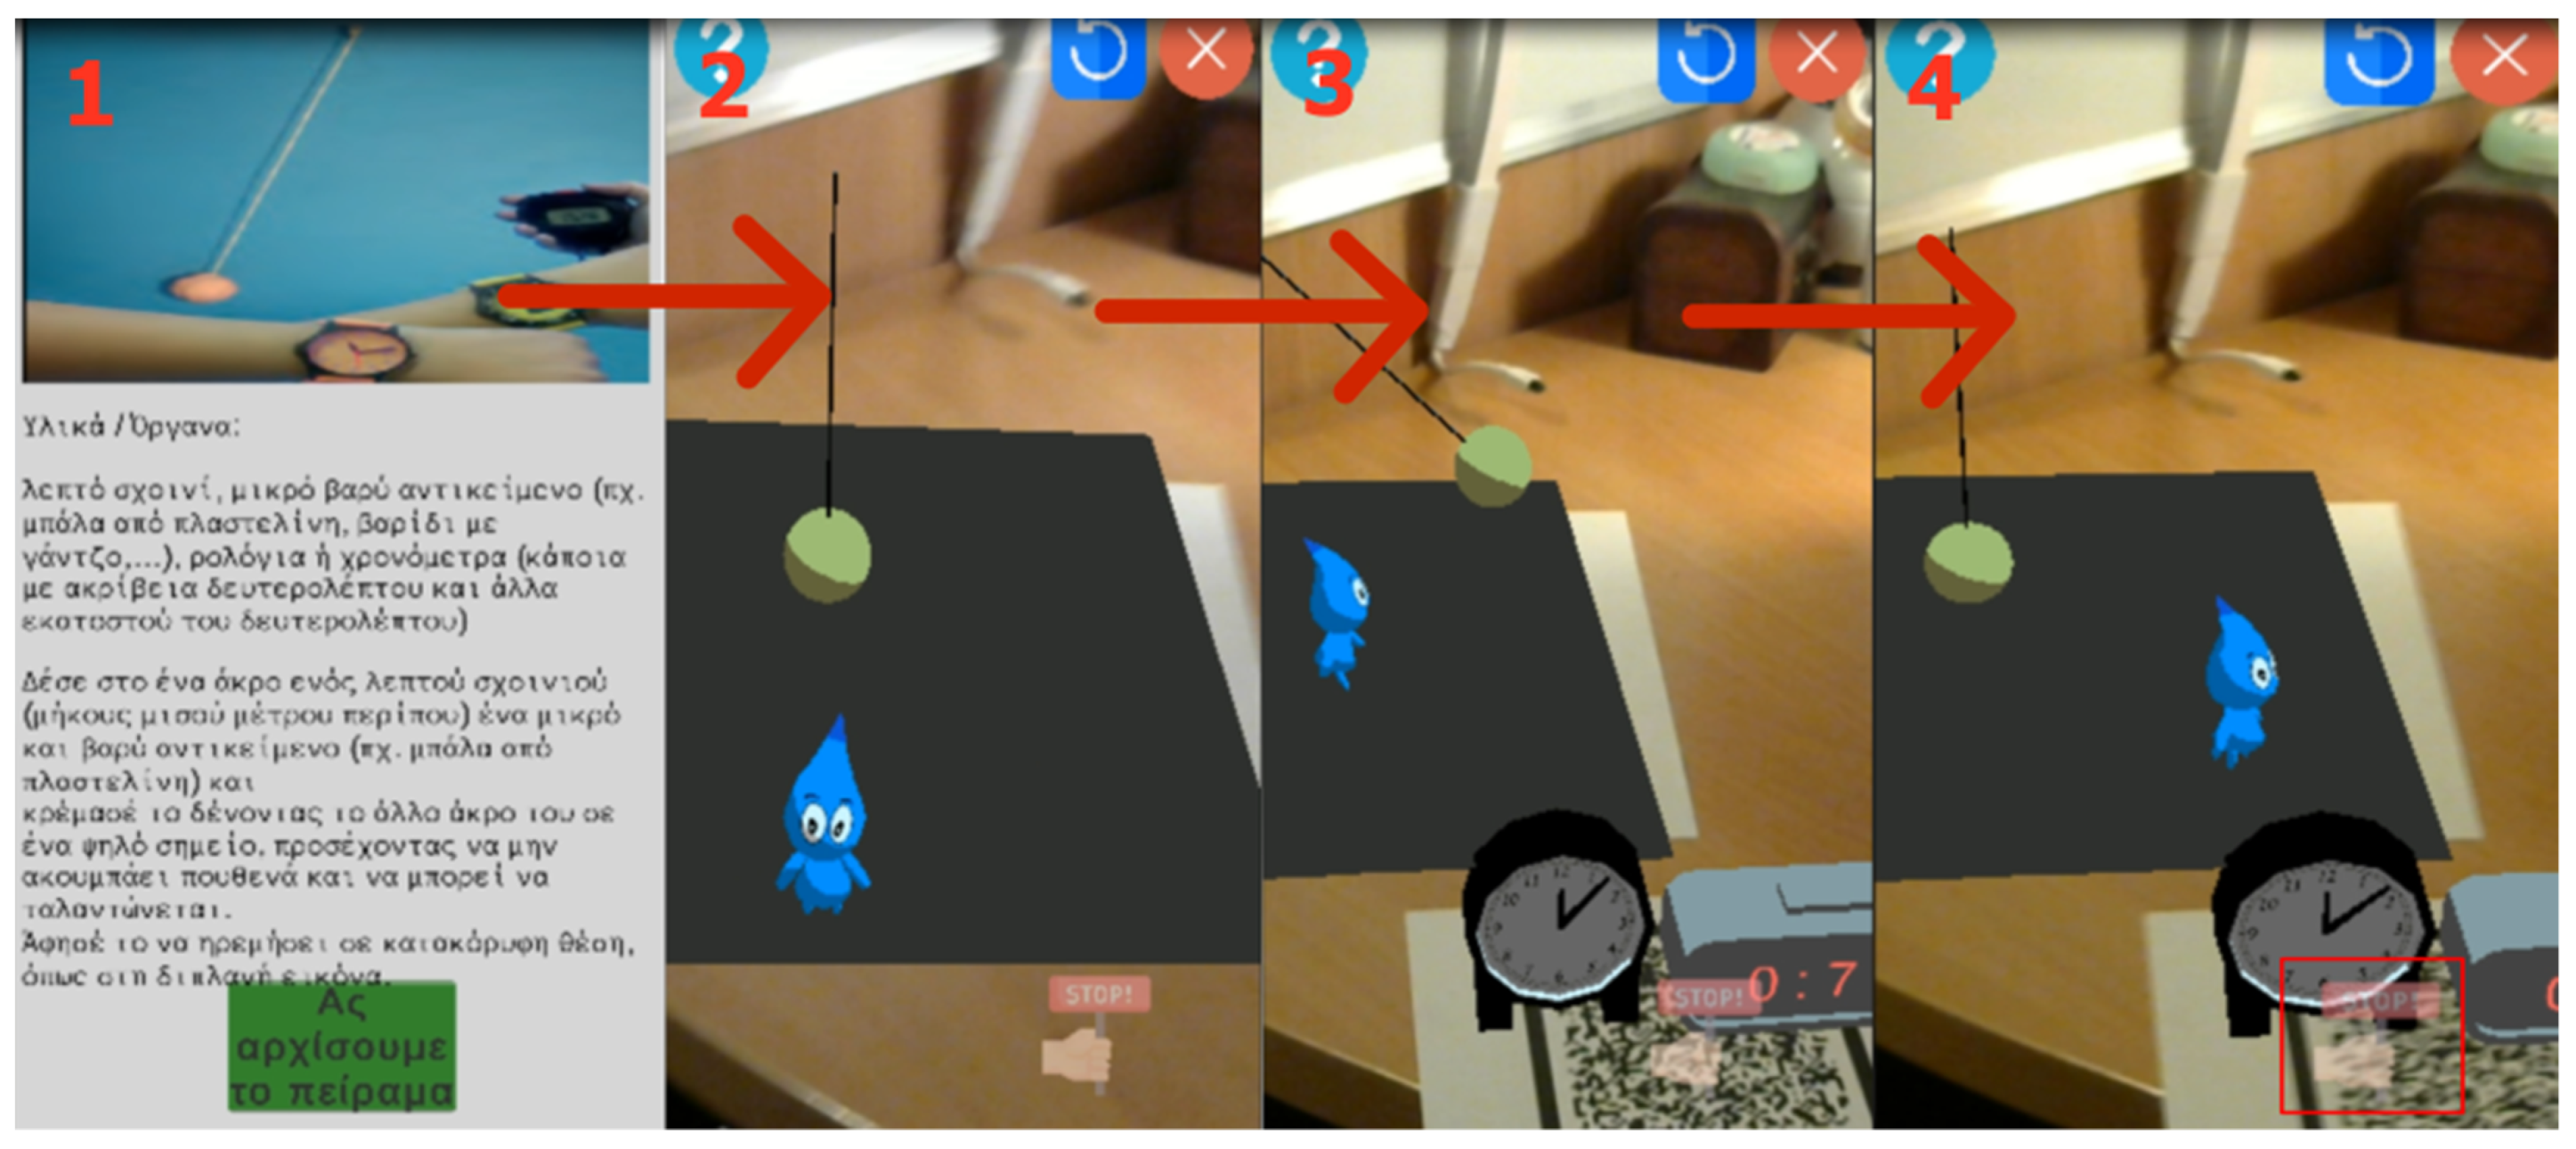
The second chapter, “Time Measurements—Accuracy”, is about time counting with both digital and analog clocks, including two experiments that work similarly. In both experiments, pupils must scan two QR codes; on the surface of the small QR code, two clocks appear: one that is analog and another that is digital, which start automatically when the 3D assistant starts the process. On the surface of the big QR code, the scene of the selected experiment appears. The first experiment is about a pendulum that swings when the 3D assistant touches it. Immediately, both clocks start counting in seconds. According to the instructions of the textbook, the pupils must press the stop button when the pendulum swings five (5) times, and then they must discuss their results. In the second experiment, a tilted ramp and a ball replace the pendulum. The 3D assistant must move the ball to the start of the ramp; therefore, it can roll to the end of the ramp. Both clocks are frozen until the ball starts rolling. When that happens, the clocks start to count and freeze again when the ball meets the bottom of the ramp. The option to restart the scene exists in both experiments in case the pupil wants to repeat the process or if something goes wrong during the experiment (see Figure 15).
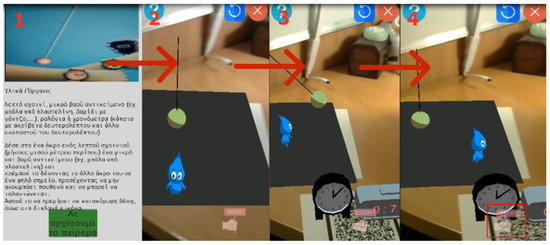
Figure 15.
The process of the “Time Measurements—Accuracy” experiment.
The third chapter of the book, titled “Mass Measurements—Charts”, is concerned with weight measurements and consists of three experiments, all of which use only the big QR code. In the scene of the first experiment, the 3D assistant, a scale, four categories of standard weights (of 16, 24, 32 and 40 g) and a ball with an unknown weight appear. The purpose of this experiment is a better understanding of weights. To accomplish this task, the pupils must determine the weight of the ball using the standard weights. Therefore, they must move the standard weights and the ball onto the scale using the 3D assistant, try different combinations and determine the weight of the ball. It is worth mentioning that the weight of the ball is 120 g, according to the textbook. The second and the third experiments of this chapter share the same mechanics, having a spring and a ruler to measure the weights of different objects, depending on the deformation of the spring’s length as an object is hanging from it. The difference between those two experiments is the objects that pupils must weigh. In the second experiment, the objects are five standard weights of 5, 10, 15, 20 and 25 g, and in the third experiment, the objects are (a) a cube that weighs 42 g and (b) a sphere that weighs 55 g (see Figure 16).
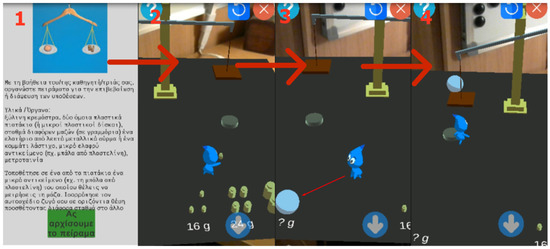
Figure 16.
The process of the “Mass Measurements—Charts” experiment.
In chapters four to nine, the experiments are about measuring temperature. In most of them, the small QR code has a thermometer on it that can be easily carried around in the real world by moving it by hand. When the pupils place the thermometer in an object, such as a glass of water, s/he can see that the thermometer’s liquid rises and lowers, like a normal mercury thermometer, as the temperature of the water changes. Below, the descriptions of chapters four to nine are presented.
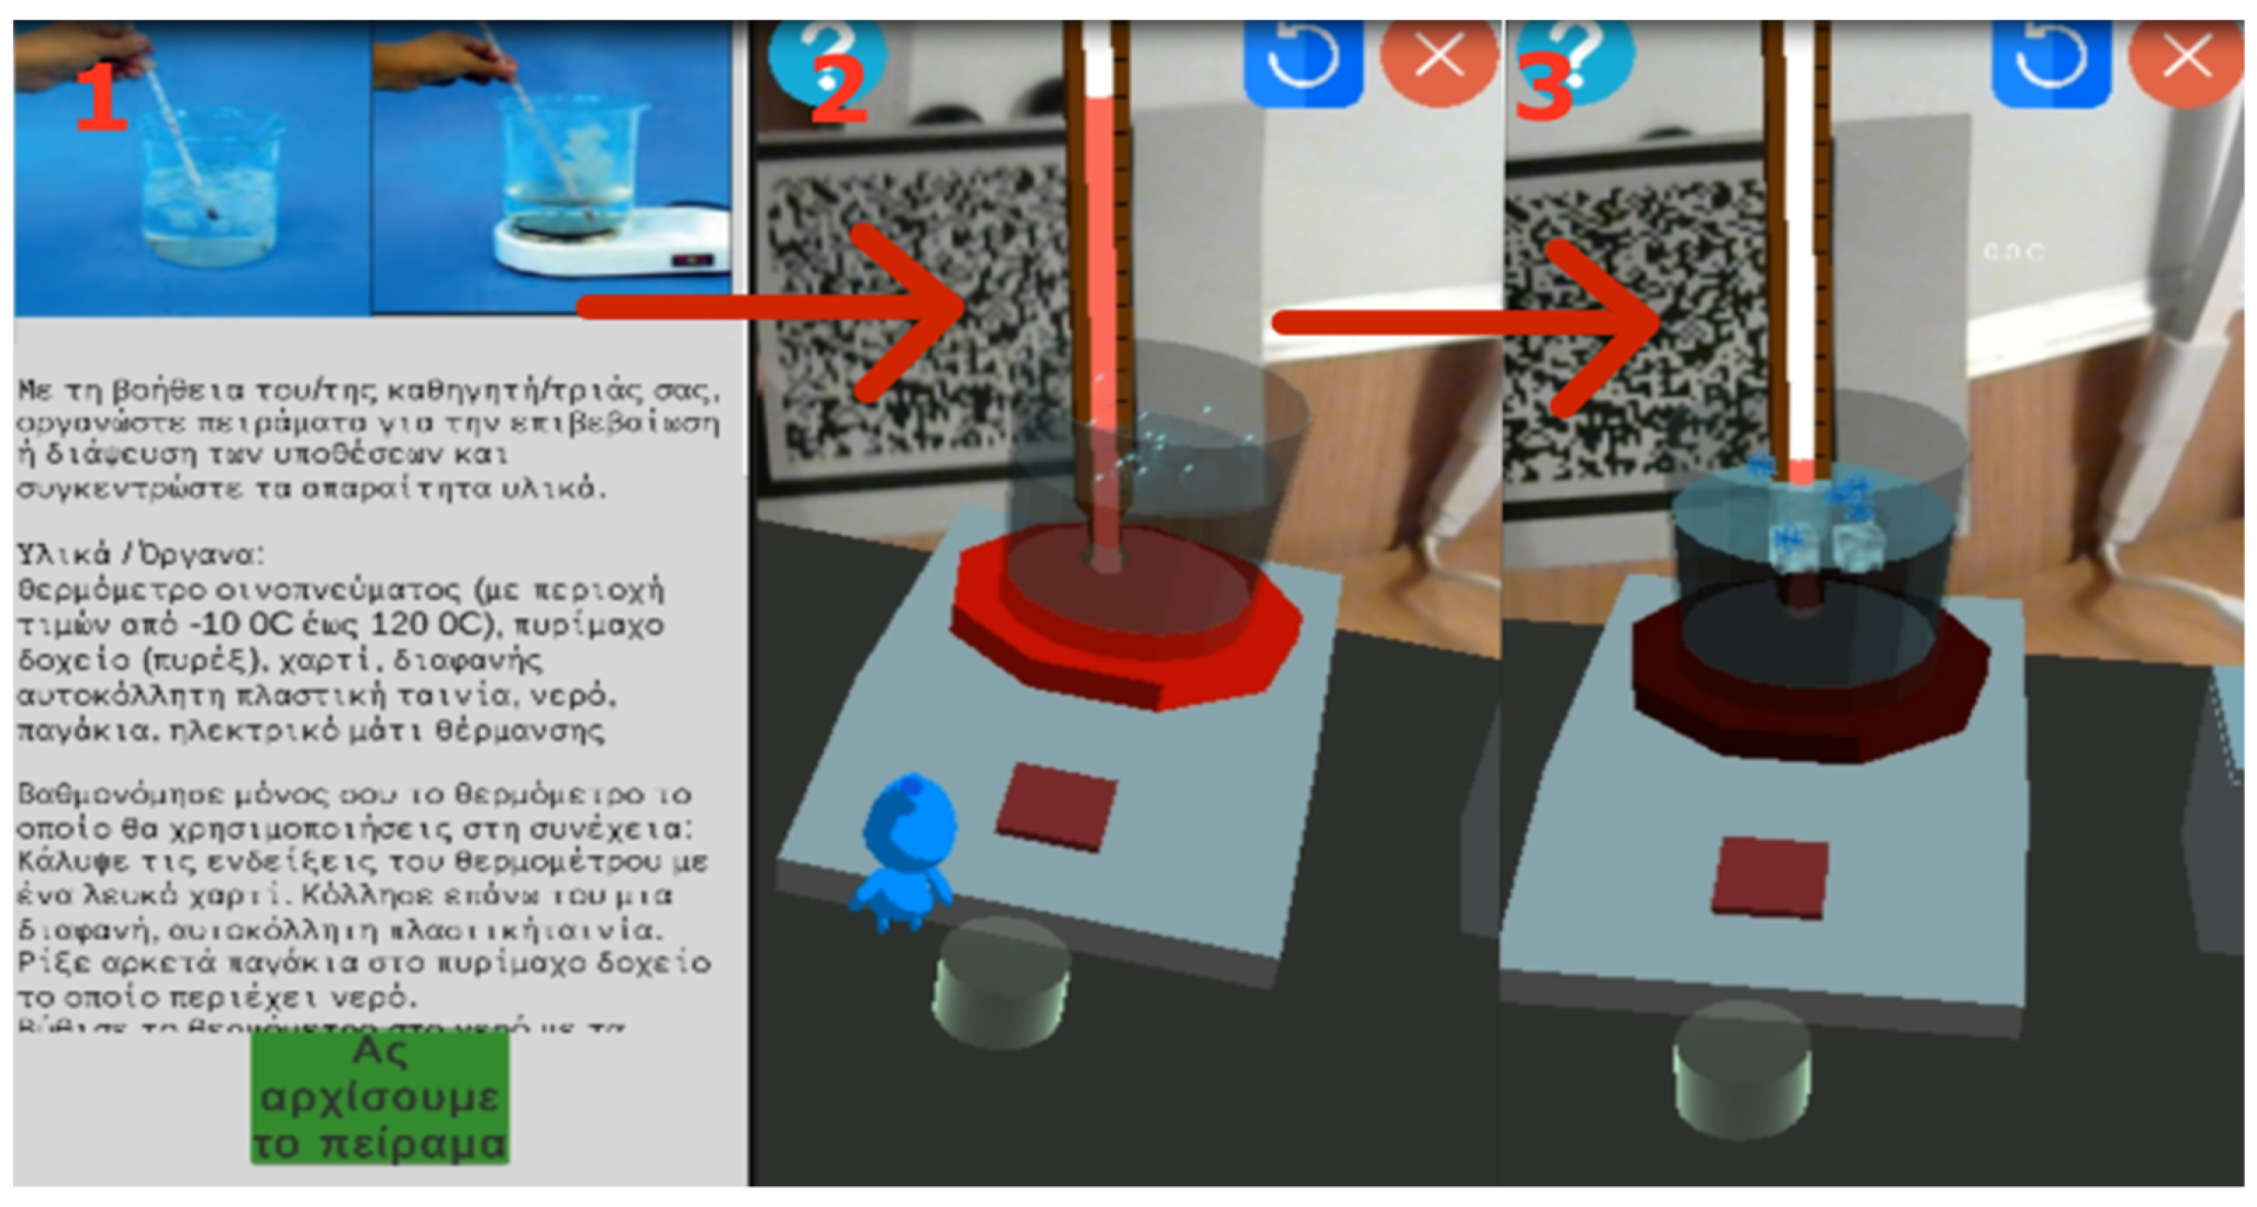
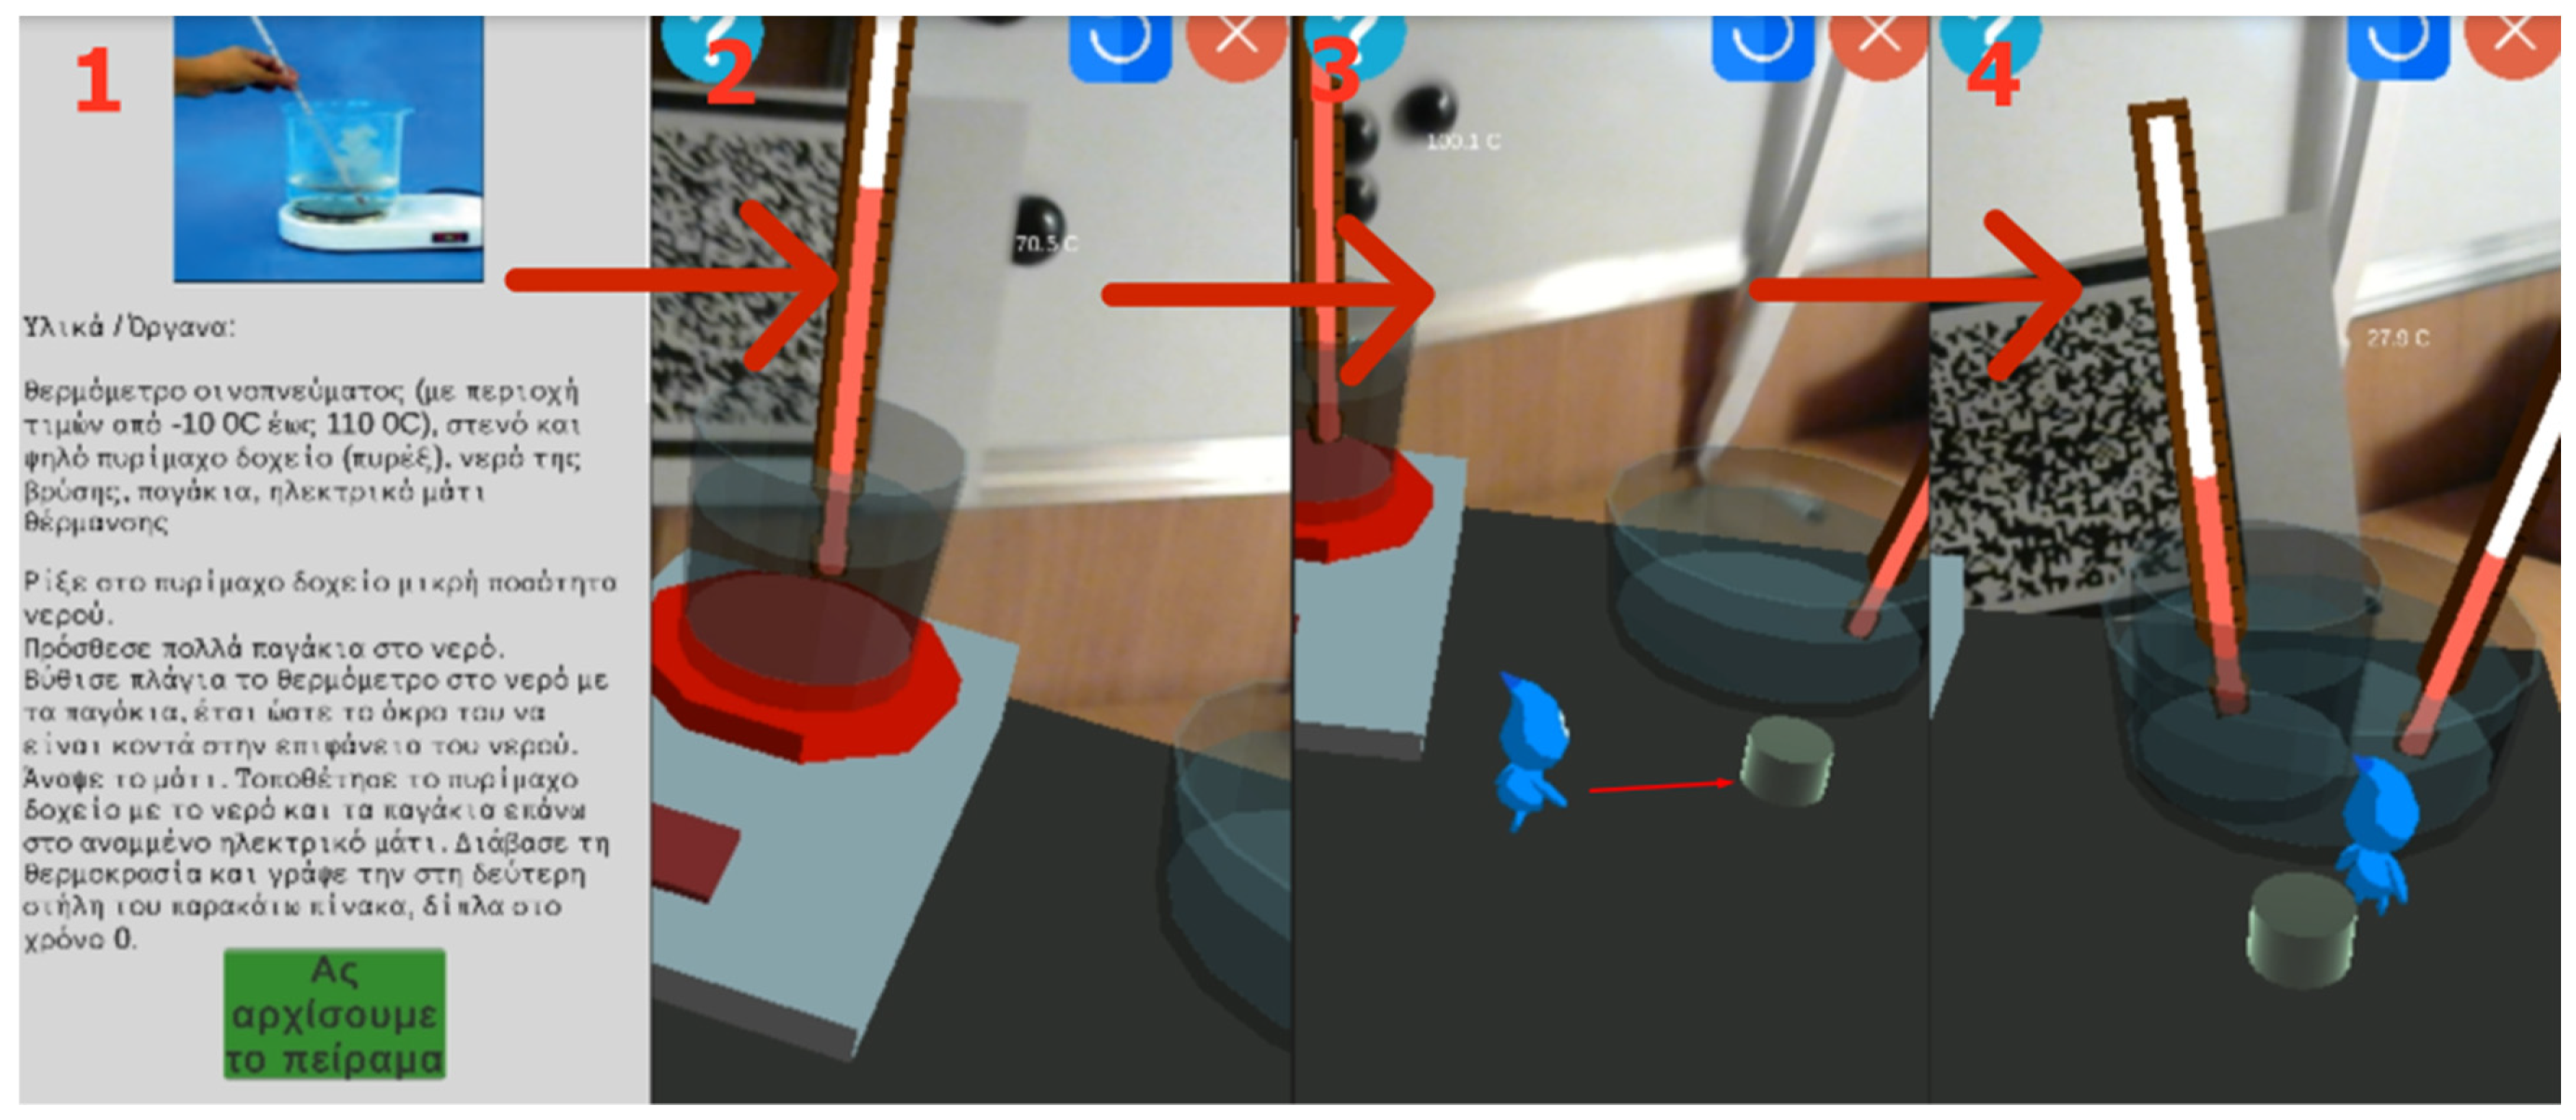
The scene that appears for the experiment of chapter four, entitled “Temperature Measurements—The Calibration”, contains the 3D assistant, a hot plate and a glass of water on top of it, as well as a freezer. This experiment also makes use of the small QR code, which contains the thermometer. Thus, when the button in front of the hot plate is pressed by the 3D assistant, the water starts boiling. At that moment, the pupils need to place the thermometer in the glass to check the shifting temperature. When the water’s temperature reaches 100 °C, it begins to boil, and bubble particles start to form and appear on the water. In the case that the pupil wants to freeze the water, s/he must turn off the hot plate and open the freezer; therefore, ice cubes can be transferred from the freezer into the water. When the water drops to 0 °C, snowflake particles start to appear on top of the water (see Figure 17).

Figure 17.
The process of the “Temperature Measurements—The Calibration” experiment.
In chapter five, titled “From Heat to Temperature—The Thermal Balance”, a scene of the experiment also consists of the QR code with the thermometer, the 3D assistant, a hot plate with a glass of water on top of it and a bowl with water and another thermometer in it. In the remaining experiments that use thermometers, an indicator is used in the UI, which shows the temperature. In this experiment, the pupils must turn on the hot plate by pressing the button in front of it. When the water rises to 100 degrees Celsius, the pupils must press the button that is in front of the bowl with the water and the thermometer. By pressing it, the glass that is on top of the hot plate is transferred into the bowl, and the water’s temperature starts to lower. The water that is in the bowl starts to rise until both have the same temperature (see Figure 18).
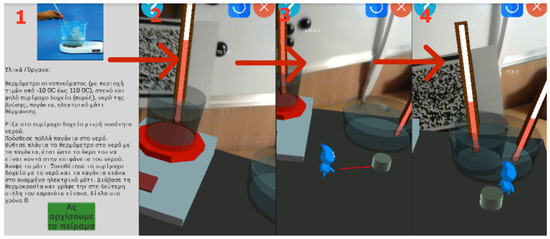
Figure 18.
The process of the “From Heat to Temperature—The Thermal Balance” experiment.
The experiment of chapter six, titled “Water State Changes—The Cycle of Water”, is the same as chapter four, with the difference that the thermometer has the temperature indicator.
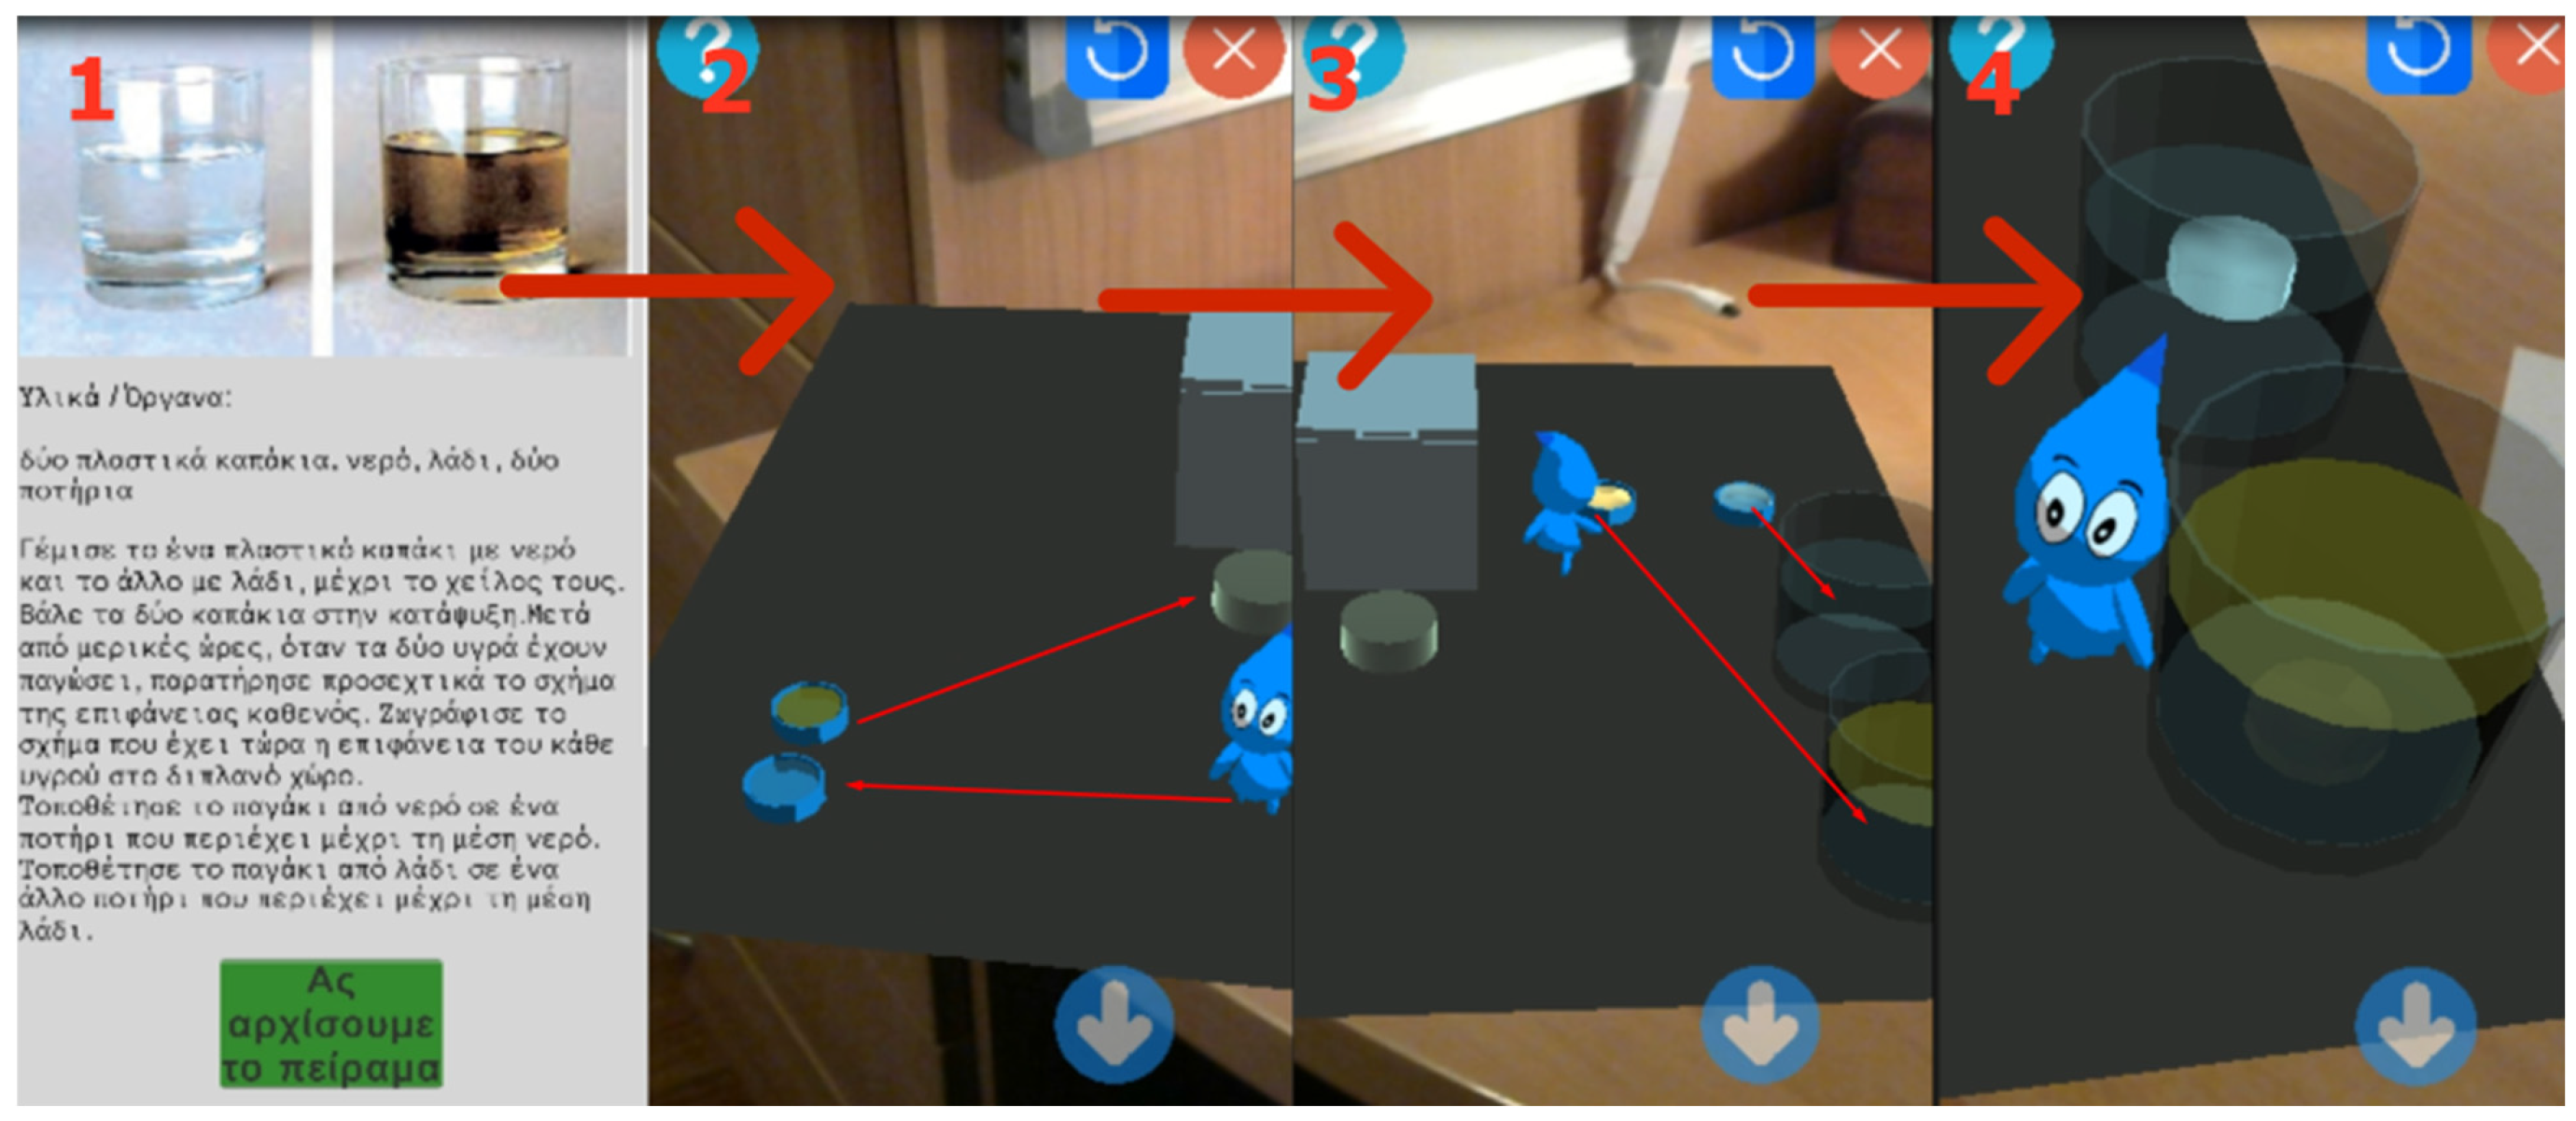
The first and the second experiments in chapter seven, titled “Water Expansion and Contraction—A Natural Abnormality”, are about the different reactions that liquids have when they are frozen. These liquids are water and oil. In the first experiment, the pupil must carry, with the help of the 3D assistant, two caps into the freezer: one with water and one with oil. After a while, the caps with the liquids appear again in the scene, with their contents frozen. The pupils must put the ice cubes into the glass with the same liquid, and they must discuss how both liquids react. What they observe is that the water ice cube floats, and the oil ice cube sinks. The next experiment has a freezer and two bottles: one with water and one with oil. The pupils must put both bottles into the freezer, and when that happens, the bottles appear again in the scene with their liquids frozen but with the water bottles shattered. The last experiment of this chapter has a small QR code with the thermometer, and on the big QR Code, there is a big glass of water and a freezer. The purpose of the experiment is to measure the temperature in different levels of the water when it has ice cubes in it (see Figure 19).

Figure 19.
The process of the “Water Expansion and Contraction—A Natural Abnormality” experiment.
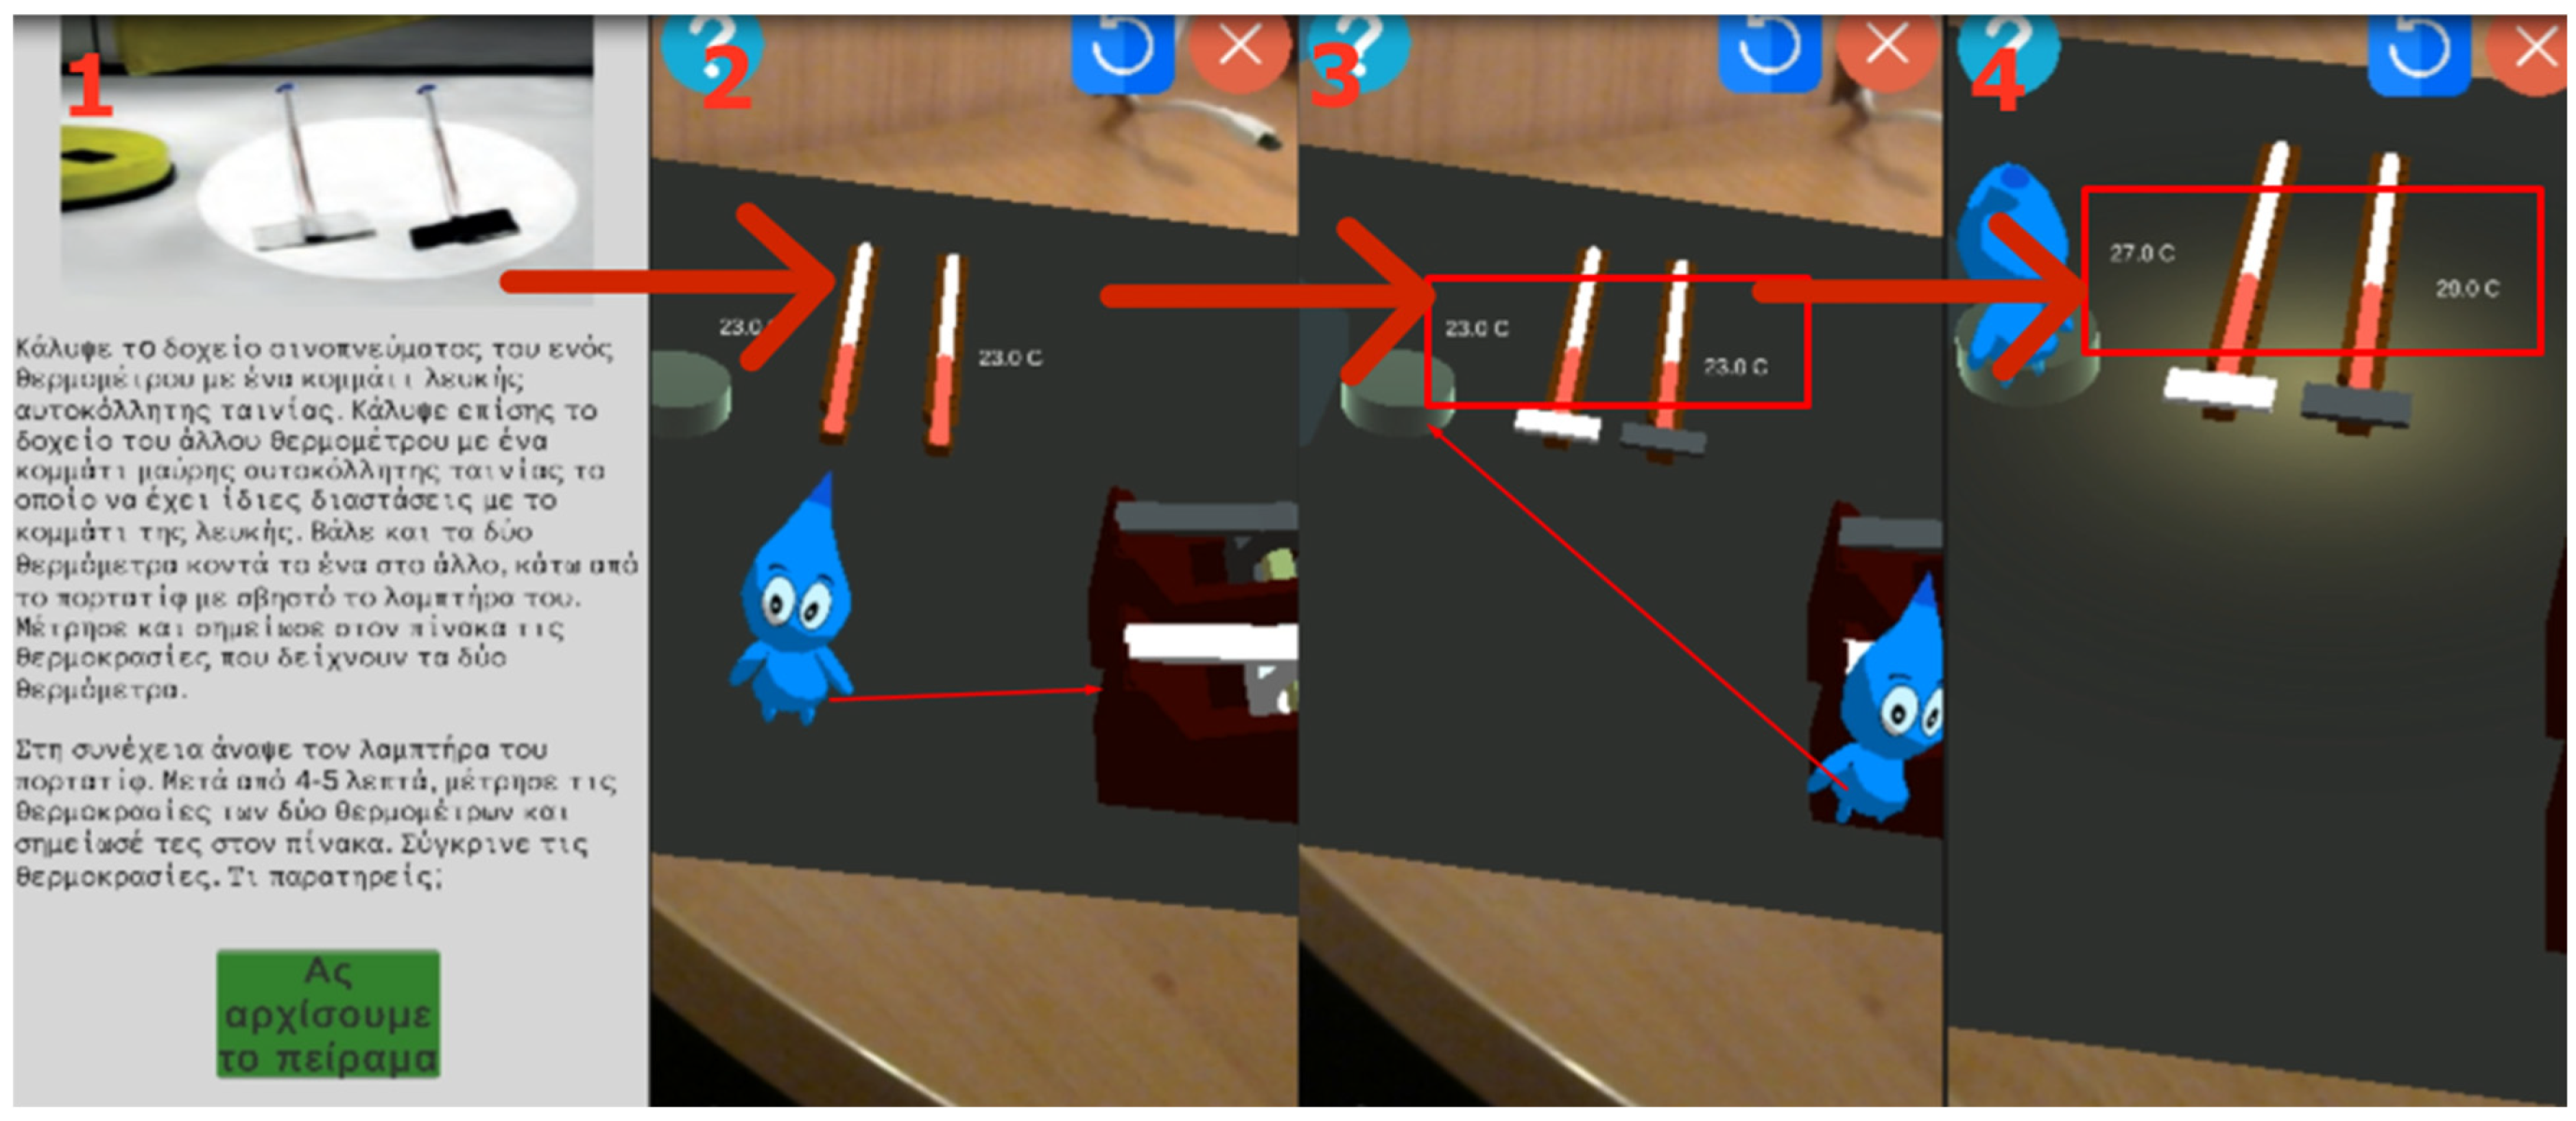
The eighth chapter of the book, titled “Light Heats—Cold and Warm Colors”, studies the way that light affects the temperature of an object. In the first experiment of this chapter, a light source directly hits a thermometer that raises its temperature, which is shown on the UI’s indicator. The next experiment has the same light source but, in addition, has two thermometers and two sticky tapes: one black and one white. The pupils must tape the thermometer tips with both the black and the white sticky tapes and discern the different results of the temperatures. The thermometer with the black sticky tape absorbs more heat from the lamp, so it has a higher temperature than the one with the white sticky tape (see Figure 20).

Figure 20.
The process of the “Light Heats—Cold and Warm Colors” experiment.
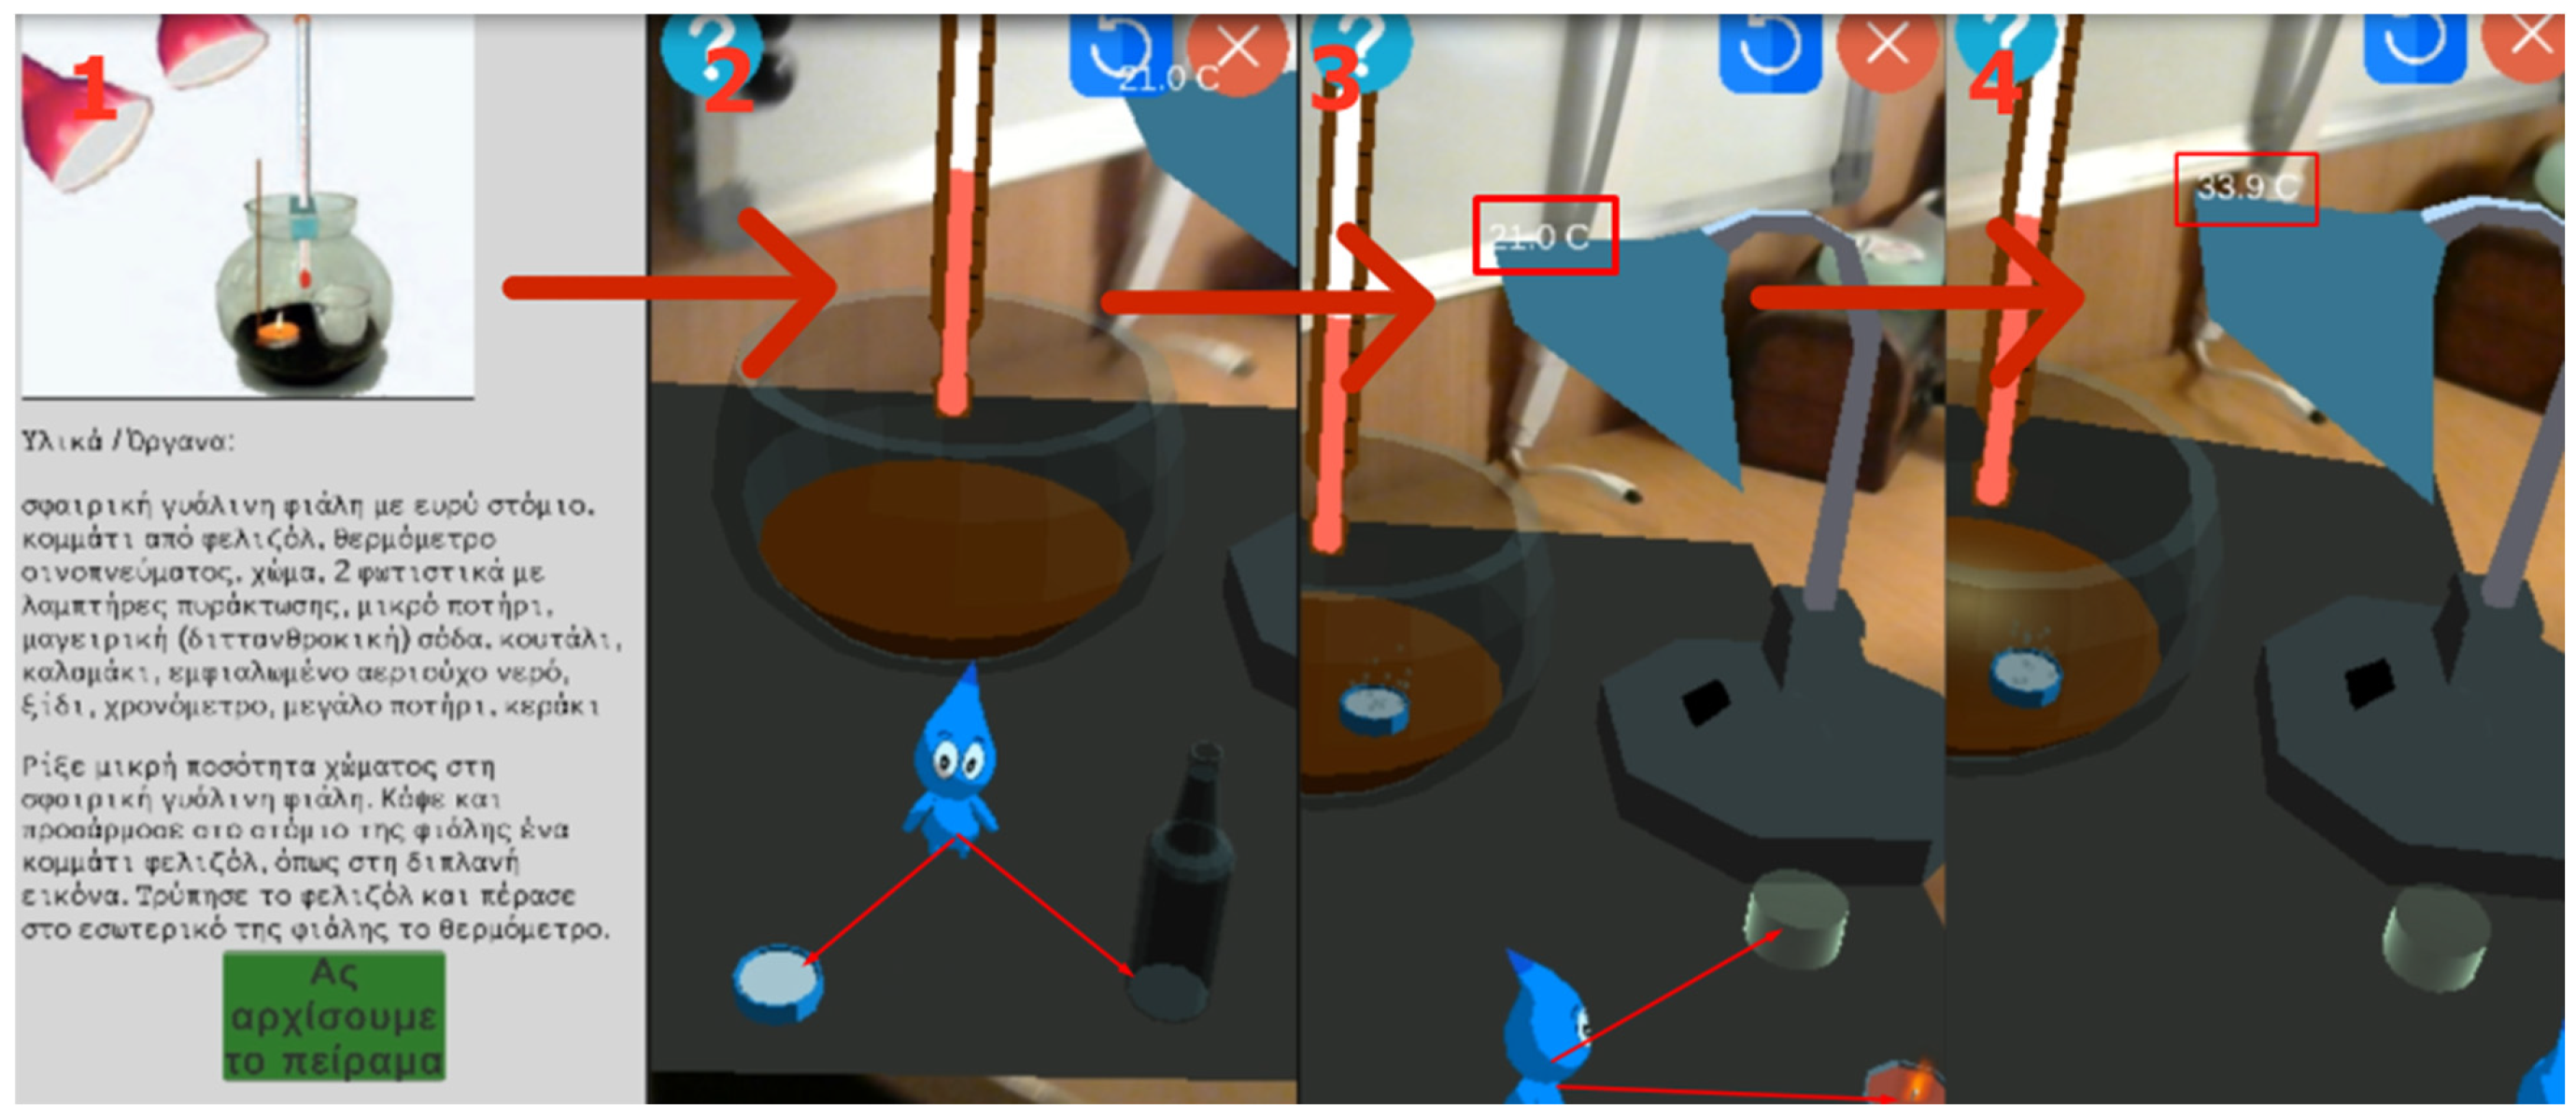
The ninth chapter, titled “The Greenhouse Effect Overheats”, is about the greenhouse effect, and it is the last chapter that uses a thermometer in its experiments. The pupils must follow the school’s textbook instructions to execute the experiment accordingly, but if something goes wrong during the experiment, they can use the restart button. The experiment has three parts. The first part is turning on the lamp. The second part is pouring the bottle with the soda as well as the cup with the cooking soda into the glass. The last part is putting the candle into the glass. As they progress the experiment, the temperature of the thermometer rises every time they perform a new step (see Figure 21).

Figure 21.
The process of the “The Greenhouse Effect Overheats” experiment.
Chapter ten, titled “The Electric Short-Circuit—Dangers and Safety”, presents circuits and five variations of them. In all experiments, the pupils must move the 3D assistant to the button next to the circuit to close or open it. The first variation is a simple circuit with a voltmeter and a battery. The pupil presses the button and observes that the circuit closes, and the voltmeter changes its value. The second and the third experiments consist of a circuit with a battery, a switch and a lamp. The pupil can turn on the switch by moving the 3D assistant to the button. The fourth and the fifth experiments are similar to the second and third, but in addition, a wire is added to the scene. The pupils must note the differences between those circuits. Moreover, in a closed circuit that involves wires, the wires start to burn and dissolve (see Figure 22).
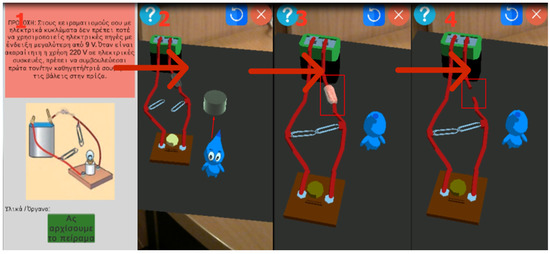
Figure 22.
The process of the “The Electric Short-Circuit—Dangers and Safety” experiment.
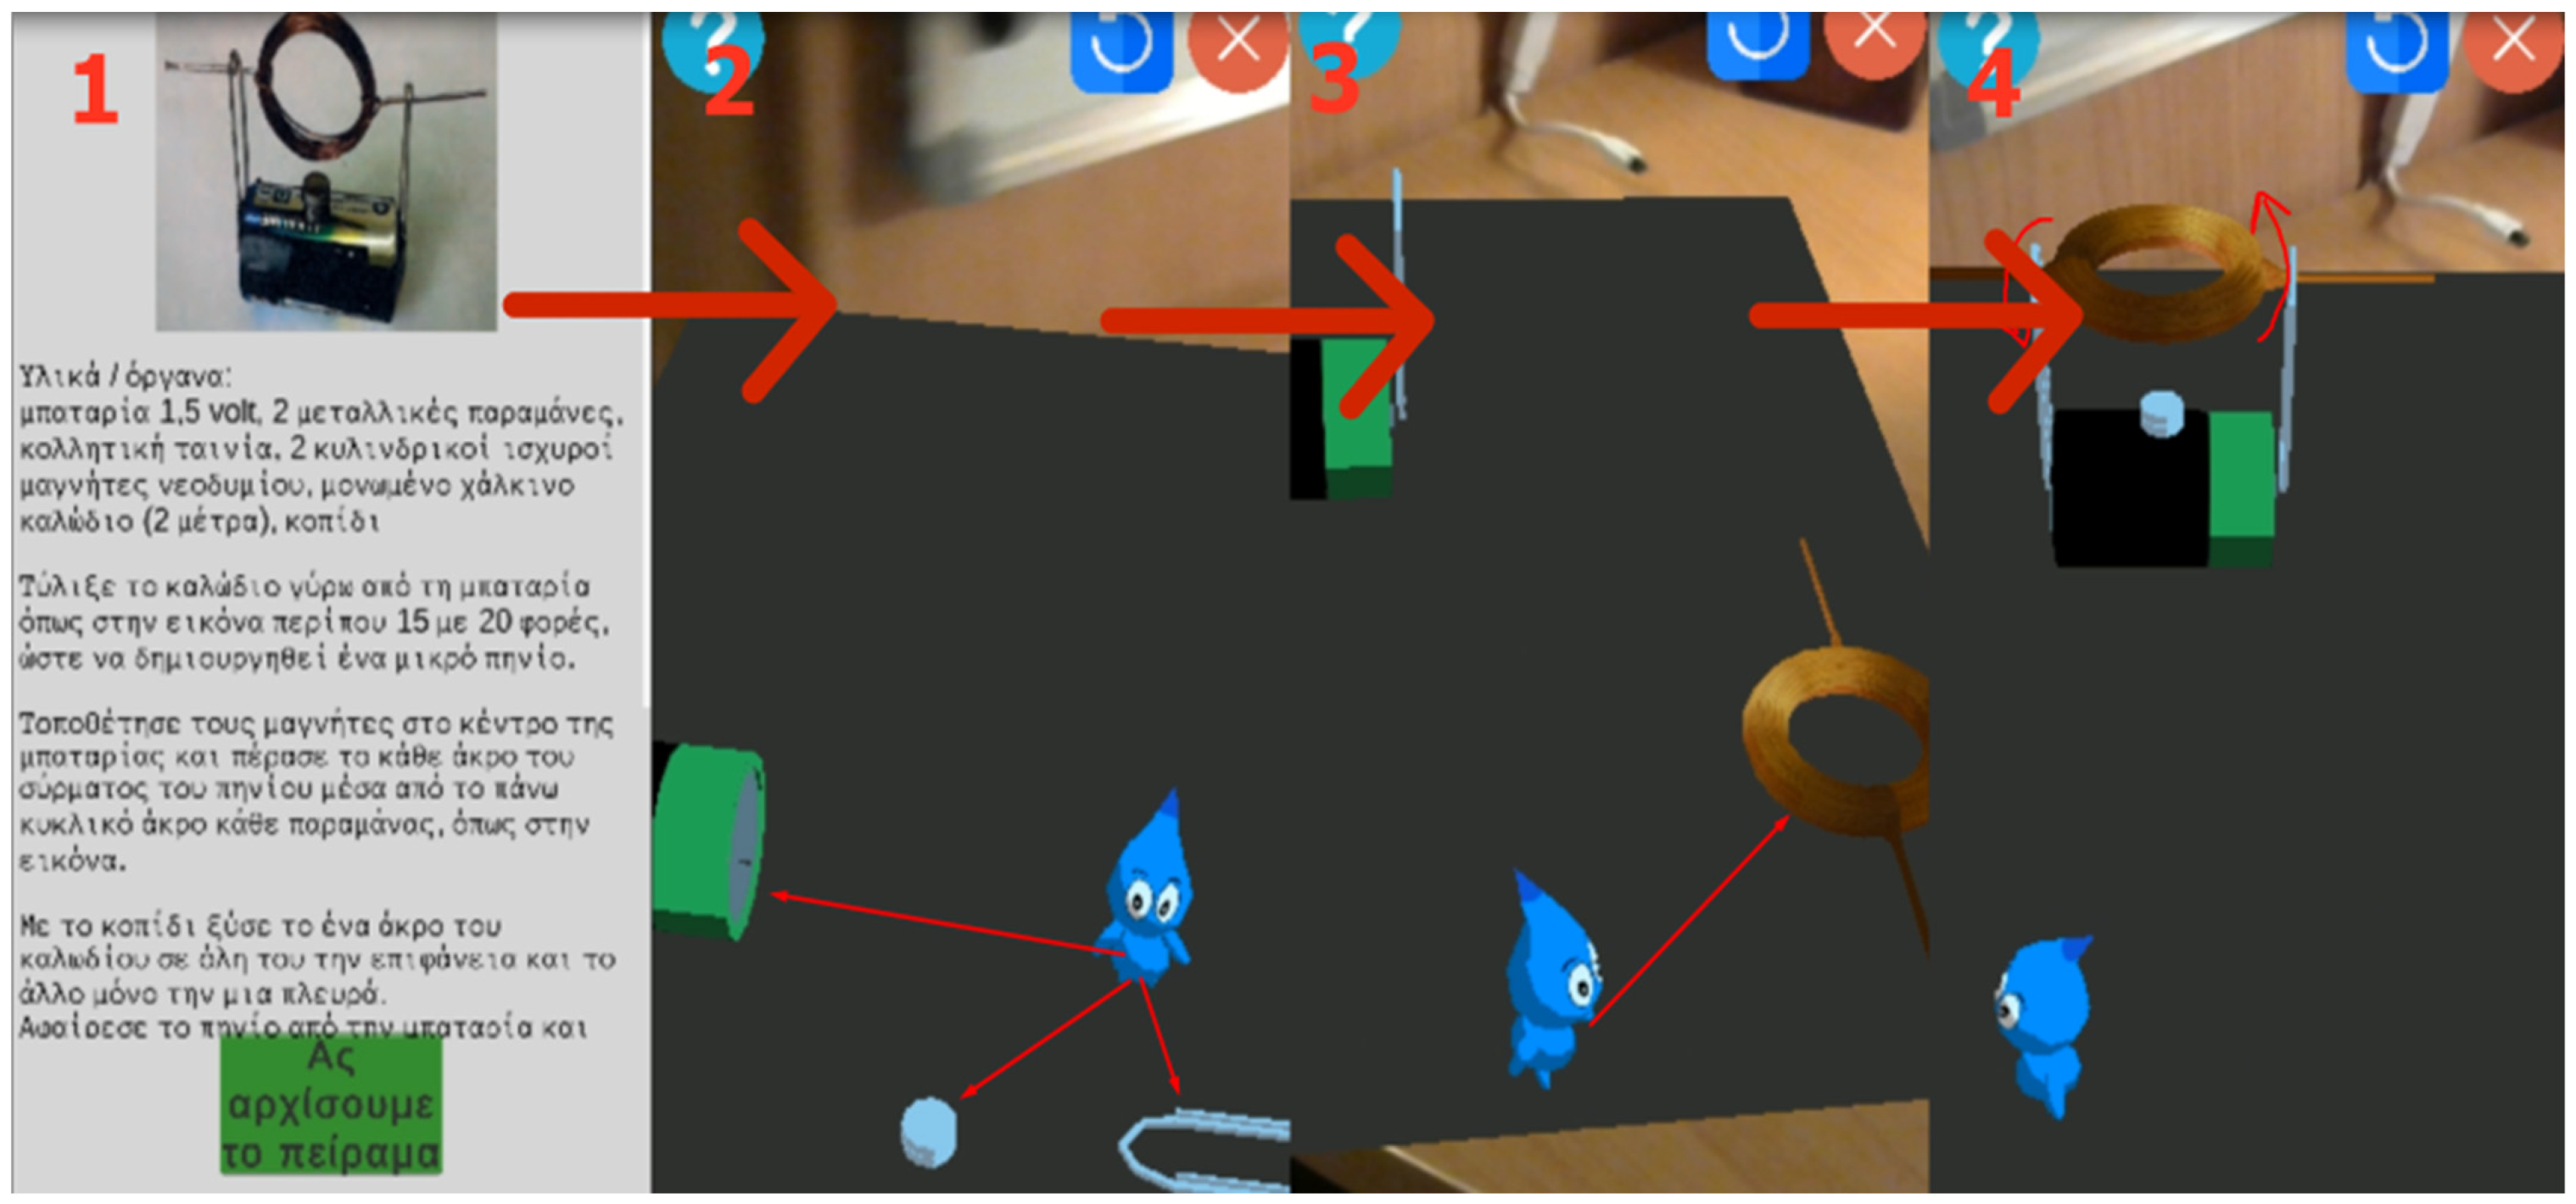
Finally, chapter eleven titled “From Electricity to Magnetism—An Electric (Own-) Motor” and chapter twelve titled “From Magnetism to Electricity—An Electric (Own-) Generator” present electromagnetism and how electricity and magnets interact. The first experiment includes a battery, a magnet, some clips and a coil. When the pupil moves the 3D assistant onto an object, a device appears in the scene that makes the coil spin if it is connected to the battery and if the magnet is under it. In the last experiment, a device appears in the scene, consisting of two magnets inside a coil that is connected to an LED light, and in the middle, there is a nail that can be spun by the pupil. By tapping and holding a finger on the screen, the pupils can create electricity by spinning the nail (in both directions) to turn on the light. Additionally, if they spin the nail fast enough, the light becomes even brighter (see Figure 23).
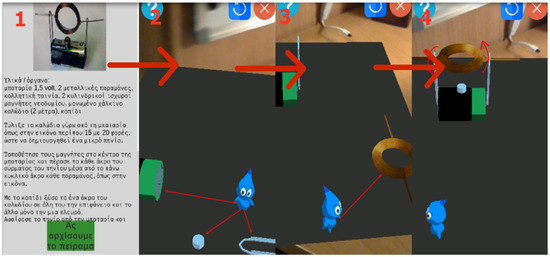
Figure 23.
The process for the “Electric Motor” experiment.
4. Evaluation
This section presents the measurements, design and the methods of the experiment that was conducted for evaluating the proposed AR system with respect to: (i) usability, (ii) gamification and (iii) willingness of the teachers to adopt this technology into their class. Regarding the system’s usability, the System Usability Scale (SUS) [32] was used, which was translated into Greek [33] and adapted to also measure the other two research questions. Each user group had an adapted questionnaire; therefore, three different types of questionnaires were developed. The questionnaire used a Likert scale of 1 (Strongly Disagree) to 5 (Strongly Agree).
4.1. Participants
A total of 314 users voluntarily participated in the study. They were divided into three user groups: (i) teachers who use these AR applications during teaching, (ii) pupils who are the end-users and (iii) computer science students who are expert users [34,35] in software development (see Table 1).

Table 1.
Participants.
The selection criterion of the schools that were involved in the evaluation was that a memorandum of understanding was established between the university conducting the research and the schools due to collaboration in shared research interests. The teachers who participated were those who were available during the experiment and who were interested in the current research. In addition, they voluntarily gave the researchers access to their pupils to conduct the experiment. Finally, the selection criterion of the undergraduate students was that all the students who had the course of Human–Computer Interaction (HCI) in the Department of Information and Electronic Engineering had the right to participate.
What is worth mentioning is that computer science students evaluated all the three AR applications, in contrast to the rest of the participants who evaluated only the AR application that referred to their grade. Therefore, although 110 computer science students in total were enrolled to participate in the assessment of all three AR applications, only the fully completed questionnaires were taken into consideration for the evaluation process for each AR application, and as a result, the total number of students differed per AR application, as shown in Table 1.
All the participants voluntarily participated in the experiment in different primary and secondary schools in the region of Ptolemaida (Greece), as well as in the International Hellenic University in the Department of Information and Electronic Engineering (Greece). Before the execution of the experiments, a training session for all user groups was conducted in order for users to acquire the appropriate knowledge and skills to support and execute the experiment.
4.2. Procudures
Four different experiments were conducted, where three of them were held in the classrooms offered by the schools for this purpose (one experiment for each grade), and the last one was at the university campus. The duration of the experiments in the primary and secondary schools was a class hour, meaning 45 min, whereas in the university, it was approximately 135 min (three class hours), since they evaluated all three AR applications. The experiment protocol was the following:
- Firstly, there was a preparation phase where either the teachers for their pupils or the university students for themselves installed the AR application on the available mobile devices.
- After that, teachers, with the role of the instructor, gave an introductory stimulus to the pupils related to the experiment in order to be prepared for the experiment (this step refers only to teachers and pupils).
- Then, the experiment took place, where the teachers and the pupils evaluated only the AR application that referred to their grade, whereas the university students evaluated all three AR applications. The analytical steps of the experiment were:
- The selection of the activity, which was in accordance with the current school curriculum; therefore, the flow inside the class was not disturbed;
- Scanning the QR code;
- Conducting the experiment;
- Discussion of the results and the conclusions between the pupils and the teachers, who had the role of instructors (similar to step 2, it refers only to teachers and pupils).
In the event that a user did not have a mobile device, one was assigned to him/her to work in dyads with another user. At the end of each experiment, questionnaires were distributed in printed form to all participants. Since there were three different types of questionnaires, each participant received the corresponding questionnaire, depending on which user group s/he belonged to.
5. Results and Discussion
Regarding the usability results, the overall SUS score was quite satisfactory for all the user groups (see Table 2). More analytically, the SUS scores for the AR application for the 5th grade of primary school were 75 (SD 9.57) for the teachers, 77.4 (SD 12.23) for the pupils and 73.2 (SD 10.47) for the computer science students. For the AR application for the 6th grade of primary school, the scores were 76.67 (SD 10.68) for the teachers, 75.9 (SD 10.5) for the pupils and 70.4 (SD 11.48) for the computer science students. Finally, for the AR application for the 1st grade of secondary school, the scores were 93.75 (SD 5.3) for the teachers, 73.66 (SD 12.31) for the pupils and 73.7 (SD 12.5) for the students. It is worth noting that, if the total sample is considered per AR application, for example, for the AR application for the 5th grade of primary school (205 participants in total), the total SUS score is 75.19.
Table 2.
Usability scores.
The SUS scores of the three AR applications for teaching physics are acceptable based on the validation of the SUS test, which considers the rate above 70 at least passable [36]. More analytically, the mean values for the AR application for the 5th grade of primary school (see Table 3 for mean values) indicate that the majority of participants agreed that the system was functional and easy to learn how to use, without the need of any technical support.
Table 3.
Mean values and standard deviations of participants’ responses for the AR application for the 5th grade of primary school.
Regarding the AR application for the 6th grade of primary school (see Table 4 for mean values), the majority of the participants acquired confidence in using the system properly, especially pupils who were the end-users but also teachers who had to organize, support and execute the whole experiment. However, in the case of computer science students, the least satisfactory scores are observed (see Table 2). This may be explained by the fact that some activities needed AR plane detection, and the students did not have the appropriate space to conduct the experiment, since 110 students were in a university hall, in contrast to the pupils, where a maximum of 10 pupils were inside a classroom. As a result, university students may have found the AR application complex and not very easy to use (see Table 4).
Table 4.
Mean values and standard deviations of participants’ responses for the AR application for the 6th grade of primary school.
The majority of the participants found the AR application for the 1st grade of secondary school neither cumbersome nor inconsistent (see Table 5 for mean values). It is worth mentioning that the SUS scores of the teachers are quite high (see Table 2), and a possible explanation may be the limited sample, which consists of two teachers. Additionally, pupils’ scores are the least satisfactory in this AR application, in contrast to the other two. This may be due to the fact that, in some activities, the pupils had to simultaneously use two QR codes, and this may have been difficult for them. Finally, in the case of computer science students, they were asked to install the three AR applications on their devices, as opposed to schools where the devices were already ready, This may have increased the difficulty and may have affected their scores, although it was mentioned that the usability refers to the application and not the preparatory phase of the installation. However, the aforementioned explanations are assumptions, as no interviews were conducted with the participants.
Table 5.
Mean values and standard deviations of participants’ responses for the AR application for the 1st grade of secondary school.
Regarding the second research question, the majority of the participants agreed that the AR applications look like a game, and they support gamification (see Table 6).
Table 6.
Mean values and standard deviations of the statement, “It looks like a game”.
Finally, in the statement “I would like to use these technologies in my class”, which refers only to the teachers, the result was also very positive, with a mean value of 4.40 (SD 0.74).
Therefore, based on the results of the responses, participants satisfactorily rated the system with respect to usability by feeling confident while using it, by supporting that was easy to use and by being willing to use this system more frequently. In addition to this, teachers supported their willingness to adopt such technologies in their classes, since the proposed system provides a variety of benefits, resulting in the improvement of the educational process. Participants also agreed that the system is playful, since it can combine entertainment with learning. The results are in line with findings from previous studies, which concluded that AR can provide richer learning experience, through game-based aspects [6,7]; therefore, teachers would like to incorporate such technologies into their classes [2].
6. Conclusions
To summarize, AR is an emerging and advantageous technology with possible benefits such as improving problem solving, performance, motivation, creativity, satisfaction, engagement and collaboration. However, the incorporation of AR in education is still being investigated, leading to further research and development of new AR systems. Therefore, the current work has a short and long-term purpose.
The short-term purpose, which is reflected in this paper, is to present and evaluate a complete system that includes three AR applications for physics for the fifth and sixth grades of primary school and for the first grade of secondary school. A system evaluation was conducted, where three different user groups participated (teachers, pupils and computer science students). The findings were encouraging, revealing that the proposed system is easy and functional with respect to usability. Additionally, it is a gamified system that contributes to improving the learning process and to better supporting learning objectives. Finally, teachers are willing to adopt and incorporate such modern learning methods into their instructional design to enhance pupils’ skills, learning experiences and performance.
The long-term purpose of our work is to extend the current system by developing a unified platform that consists of all the necessary educational content for teaching and learning physics and that covers all the classes of K-12 education. This can create an appropriate teaching tool that can help researchers to conduct more research on long-term bases, as pupils can use the system for more than three consecutive years. Consequently, continued “exposure” to AR tools can lead to more solid outcomes by understanding pupils’ and teachers’ needs and demands.
7. Limitations and Future Work
The current work has some limitations that need to be improved in future work. All three AR applications were developed for Android, and the current versions do not support other operating systems. In order to be accessible to a larger audience, it could be significant to export the applications to other mobile operating systems. Another limitation is language. In the current stage, we followed the Greek curriculum and did not support multilingual content. Finally, some concerns may arise by the unbalanced sample size for the AR application for the 1st grade of secondary school (particularly teachers and students). This smaller sample size is due to the COVID-19 pandemic, and it may have affected our results and should be addressed in the future.
The future version of the platform will be multilingual to better support multinational Greek schools. Moreover, it is very important to investigate pupils’ learning outcomes. This can be achieved through long-term studies and large-scale experiments in real classrooms during the lesson, resulting in drawing fruitful conclusions. Additionally, an AR authoring tool is planned to be developed, with which teachers will be able to design and create their educational material and also to customize existing activities by editing user settings (such as adding more graphics, animations, sound effects, editing the level of difficulty, etc.), making activities more enjoyable and interesting for their pupils. Finally, as is already mentioned, it is an ongoing project, so our future plans are to extend the learning content by adding more experiments for young learners per class, as well as by adding more classes in a unified platform that contains physics activities for K-12 Greek schools.
Supplementary Materials
The following supporting information can be downloaded at: https://www.mdpi.com/article/10.3390/info13070336/s1, Video S1. The APK for the AR application for the 5th grade of primary school can be downloaded at: https://drive.google.com/drive/u/0/folders/13syvWFztf5UqfsrqHZ3W270Cv9TJmj9p, Video S2. The AR application for the 6th grade of primary school can be downloaded at: https://drive.google.com/drive/u/0/folders/1K33u59jgD-Spz2KzFQcSOXskZ9jB1nWV, Video S3. The AR application for the 1st grade of secondary school can be downloaded at: https://drive.google.com/drive/u/0/folders/1J7JFgUC6mrstD-q9P3XeOqpJS_hR-bol.
Author Contributions
M.Z., C.S. and V.S. implemented the three AR applications and, together with C.V., E.K., T.S. and K.M., conceived, designed and wrote this paper. All authors have read and agreed to the published version of the manuscript.
Funding
This research received no external funding.
Institutional Review Board Statement
The study was conducted according to the guidelines of the Declaration of Helsinki and was approved by the Ethics Committee of Aristotle University of Thessaloniki (protocol code 49437/2022 and date of approval 25/02/2022).
Informed Consent Statement
Informed consent was obtained from all subjects involved in the study.
Data Availability Statement
The data presented in this study are available on request from the corresponding author.
Acknowledgments
The authors of the paper wish to warmly thank the teachers for their constructive comments and for the support that they offered.
Conflicts of Interest
The authors declare no conflict of interest.
References
- Number of Mobile Augmented Reality (AR) Active Users Worldwide from 2019 to 2024. Available online: https://www.statista.com/statistics/1098630/global-mobile-augmented-reality-ar-users/ (accessed on 6 January 2022).
- Huang, Y.; Li, H.; Fong, R. Using Augmented Reality in early art education: A case study in Hong Kong kindergarten. Early Child Dev. Care 2016, 186, 879–894. [Google Scholar] [CrossRef] [Green Version]
- Cai, S.; Chiang, F.; Sun, Y.; Lin, C.; Lee, J. Applications of augmented reality-based natural interactive learning in magnetic field instruction. Interact. Learn. Environ. 2016, 25, 778–791. [Google Scholar] [CrossRef]
- Schmidt, J.T. Preparing Students for Success in Blended Learning Environments: Future Oriented Motivation and Self-Regulation. Ph.D. Thesis, University of Southampton, Southampton, UK, 2007. [Google Scholar]
- Efklides, A.; Kuhl, J.; Sorrentino, R.M. Trends and Prospects in Motivation Research; Springer: Dordrecht, The Netherlands, 2001. [Google Scholar]
- Zafeiropoulou, M.; Volioti, C.; Keramopoulos, E.; Sapounidis, T. Developing Physics Experiments Using Augmented Reality Game-Based Learning Approach: A Pilot Study in Primary School. Computers 2021, 10, 126. [Google Scholar] [CrossRef]
- Fotaris, P.; Pellas, N.; Kazanidis, I.; Smith, P. A systematic review of augmented reality game-based applications in primary education. In Proceedings of the 11th European Conference on Game-Based Learning, Graz, Austria, 5–6 October 2017. [Google Scholar]
- Plass, J.L.; Homer, B.D.; Kinzer, C.K. Foundations of Game-Based Learning. Educ. Psychol. 2015, 50, 258–283. [Google Scholar] [CrossRef]
- Perrotta, C.; Featherstone, G.; Aston, H.; Houghton, E. Game-Based Learning: Latest Evidence and Future Directions (NFER Research Programme: Innovation in Education); NFER: Slough, UK, 2013. [Google Scholar]
- Johnson, L.; Smith, R.; Willis, H.; Levine, A.; Haywood, K. The 2011 Horizon Report; The New Media Consortium: Austin, TX, USA, 2011. [Google Scholar]
- Azuma, R.; Baillot, Y.; Behringer, R.; Feiner, S.; Julier, S.; MacIntyre, B. Recent advances in augmented reality. IEEE Comput. Graph. Appl. 2001, 21, 34–47. [Google Scholar] [CrossRef] [Green Version]
- Cai, S.; Chiang, F.; Wang, X. Using the Augmented Reality 3D Technique for a Convex Imaging Experiment in a Physics Course. Int. J. Eng. Educ. 2013, 29, 856–865. [Google Scholar]
- Kucuk, S.; Yilmaz, R.; Goktas, Y. Augmented Reality for Learning English: Achievement, Attitude and Cognitive Load Levels of Students. Educ. Sci. 2014, 39, 393–404. [Google Scholar] [CrossRef] [Green Version]
- Di Serio, Á.; Ibáñez, M.B.; Kloos, C.D. Impact of an augmented reality system on students’ motivation for a visual art course. Comput. Educ. 2013, 68, 586–596. [Google Scholar] [CrossRef] [Green Version]
- Kaufmann, H.; Schmalstieg, D. Mathematics And Geometry Education With Collaborative Augmented Reality. Comput. Graph. 2013, 27, 339–345. [Google Scholar] [CrossRef]
- Theodoropoulos, A.; Lepouras, G. Augmented Reality and programming education: A systematic review. Int. J. Child-Comput. Interact. 2021, 30, 100335. [Google Scholar] [CrossRef]
- Fuste, A.; Schmandt, C. HyperCubes: A Playful Introduction to Computational Thinking in Augmented Reality. In Extended Abstracts of the Annual Symposium on Computer-Human Interaction in Play Companion Extended Abstracts; Association for Computing Machinery: New York, NY, USA, 2019; pp. 379–387. [Google Scholar] [CrossRef]
- Cheli, M.; Sinapov, J.; Danahy, E.E.; Rogers, C. Towards an augmented reality framework for k-12 robotics education. In Proceedings of the 1st International Workshop on Virtual, Augmented, and Mixed Reality for HRI (VAM-HRI), Chicago, IL, USA, 5 March 2018. [Google Scholar]
- Fleck, S.; Simon, G. An Augmented Reality Environment for Astronomy Learning in Elementary Grades: An Exploratory Study. In Proceedings of the 25th Conference on l’Interaction Homme-Machine, Talence, France, 12–15 November 2013. [Google Scholar]
- Zhang, J.; Sung, Y.T.; Hou, H.T.; Chang, K.E. The development and evaluation of an augmented reality-based armillary sphere for astronomical observation instruction. Comput. Educ. 2014, 73, 178–188. [Google Scholar] [CrossRef]
- Cai, S.; Wang, X.; Chiang, F.K. A case study of augmented reality simulation system application in a chemistry course. Comput. Hum. Behav. 2014, 37, 31–40. [Google Scholar] [CrossRef] [Green Version]
- Enyedy, N.; Danish, J.A.; Delacruz, G.; Kumar, M. Learning physics through play in an augmented reality environment. Int. J. Comput. Support. Collab. Learn. 2012, 7, 347–378. [Google Scholar] [CrossRef]
- Pittman, C.; LaViola, J.J. PhyAR: Determining the Utility of Augmented Reality for Physics Education in the Classroom. In Proceedings of the 2020 IEEE Conference on Virtual Reality and 3D User Interfaces Abstracts and Workshops (VRW), Atlanta, GA, USA, 22–26 March 2020; pp. 760–761. [Google Scholar] [CrossRef]
- Tobar-Muñoz, H.; Baldiris, S.; Fabregat, R. Co Design of Augmented Reality Game-Based Learning Games with Teachers Using Co-CreaARGBL Method. In Proceedings of the 16th International Conference on Advanced Learning Technologies (ICALT), Austin, TX, USA, 25–28 July 2016. [Google Scholar]
- Li, H. Integrating ICT into the early childhood curriculum: Chinese principals’ views of the challenges and opportunities. Early Educ. Dev. 2006, 17, 467–487. [Google Scholar] [CrossRef]
- Akçayır, M.; Akçayır, G. Advantages and challenges associated with augmented reality for education: A systematic review of the literature. Educ. Res. Rev. 2017, 20, 1–11. [Google Scholar] [CrossRef]
- Fidan, M.; Tuncel, M. Integrating augmented reality into problem based learning: The effects on learning achievement and attitude in physics education. Comput. Educ. 2019, 142, 103635. [Google Scholar] [CrossRef]
- Wu, H.-K.; Lee, S.W.-Y.; Chang, H.-Y.; Liang, J.-C. Current status, opportunities and challenges of augmented reality in education. Comput. Educ. 2013, 62, 41–49. [Google Scholar] [CrossRef]
- Unity, Augmented Reality. Available online: https://unity.com/unity/features/ar (accessed on 14 January 2022).
- ARCore. Available online: https://developers.google.com/ar (accessed on 14 January 2022).
- Apple Developer, Augmented Reality. Available online: https://developer.apple.com/augmented-reality/ (accessed on 14 January 2022).
- Brooke, J. SUS: A “quick and dirty” usability scale. In Usability Evaluation in Industry; Jordan, P.W., Thomas, B., Weerdmeester, B.A., McClelland, I.L., Eds.; Taylor & Francis: London, UK, 1996; pp. 189–194. [Google Scholar]
- Katsanos, C.; Tselios, N.; Xenos, M. Perceived usability evaluation of learning management systems: A first step towards standardization of the System Usability Scale in Greek. In Proceedings of the 16th Pan-Hellenic Conference on Informatics, PCI 2012, Piraeus, Greece, 5–7 October 2012. [Google Scholar]
- Granić, A.; Ćukušić, M. Usability Testing and Expert Inspections Complemented by Educational Evaluation: A Case Study of an e-Learning Platform. J. Educ. Technol. Soc. 2011, 14, 107–123. [Google Scholar]
- Testing Expert Users. Available online: https://www.nngroup.com/articles/testing-expert-users/ (accessed on 15 June 2022).
- Bangor, A.; Kortum, P.T.; Miller, J.T. An Empirical Evaluation of the System Usability Scale. Int. J. Hum. Comput. Interact. 2008, 24, 574–594. [Google Scholar] [CrossRef]


Publisher’s Note: MDPI stays neutral with regard to jurisdictional claims in published maps and institutional affiliations. |
© 2022 by the authors. Licensee MDPI, Basel, Switzerland. This article is an open access article distributed under the terms and conditions of the Creative Commons Attribution (CC BY) license (https://creativecommons.org/licenses/by/4.0/).