Article

Performance Evaluation of Distributed Database Strategies Using Docker as a Service for Industrial IoT Data: Application to Industry 4.0

by
Theodosios Gkamas
,
Vasileios Karaiskos
and
Sotirios Kontogiannis
*
Laboratory Team of Distributed Microcomputer Systems, Department of Mathematics, University of Ioannina, 45110 Ioannina, Greece
*
Author to whom correspondence should be addressed.
Information 2022, 13(4), 190; https://doi.org/10.3390/info13040190
Submission received: 16 March 2022 / Revised: 5 April 2022 / Accepted: 7 April 2022 / Published: 9 April 2022
(This article belongs to the Special Issue Big Data, IoT and Cloud Computing)

Abstract

:
Databases are an integral part of almost every application nowadays. For example, applications using Internet of Things (IoT) sensory data, such as in Industry 4.0, are a classic example of an organized storage system. Due to its enormous size, it may be stored in the cloud. This paper presents the authors’ proposition for cloudcentric sensory measurements and measurements acquisition. Then, it focuses on evaluating industrial cloud storage engines for sensory functions, experimenting with three open-source types of distributed Database Management Systems (DBMS); MongoDB and PostgreSQL, with two forms of PostgreSQL schemes (Javascript Object Notation (JSON)-based and relational), against their respective horizontal scaling strategies. Several experimental cases have been performed to measure database queries’ response time, achieved throughput, and corresponding failures. Three distinct scenarios have been thoroughly tested, the most common but widely used: (i) data insertions, (ii) select/find queries, and (iii) queries related to aggregate correlation functions. The experimental results concluded that PostgreSQL with JSON achieves a 5–57% better response than MongoDB for the insert queries (cases of native, two, and four shards implementations), while, on the contrary, MongoDB achieved 56–91% higher throughput than PostgreSQL for the same set up. Furthermore, for the data insertion experimental cases of six and eight shards, MongoDB performed 13–20% more than Postgres in response time, achieving × 2 times higher throughput. Relational PostgreSQL was × 2 times faster than MongoDB in its standalone implementation for selection queries. At the same time, MongoDB achieved 19–31% faster responses and 44–63% higher throughput than PostgreSQL in the four tested sharding subcases (two, four, six, eight shards), accordingly. Finally, the relational PostgreSQL outperformed MongoDB and PostgreSQL JSON significantly in all correlation function experiments, with performance improvements from MongoDB, closing the gap with PostgreSQL towards minimizing response time to 26% and 3% for six and eight shards, respectively, and achieving significant gains towards average achieved throughput.

1. Introduction

Industry 4.0 [1] is progressing at a significant pace nowadays. Information is gathered from numerous machines, devices, sensors, or embedded systems [2]. Through the industrial internet of things (IIoT), such as wireless sensors and actuators, the digital era has been followed by the intelligent one [3]. Consequently, advanced manufacturing based on network and application data must be considered.
Smart objects can communicate with each other as part of an internet of everything (IoE) deployment architecture [4] and can provide tools such as big data analytics and cloud computing [5], leading to the creation of cyber–physical production systems (CPPS) [6]. CPPSs have a great impact on machine to machine (M2M) coordination, interaction, and interoperability [7]. Furthermore, there are additional advantages of using smart sensors, including their low cost, faster decision making, and the optimization of supply chain management [8].
Gathering the measurements of a set of IIoT sensors requires an appropriate control system. Two main concepts exist in the industry, DCS and PLCs. A decentralized control system (DCS) is a control method with some independent CPUs. If one fails, the other CPUs will continue executing their function (exhibiting fault tolerance). DCS is more appropriate for continuous processes, including many analog/digital sensors/signals and PID (proportional, integral, derivative) control loops. Programmable logic controllers (PLCs) use a single CPU capable of controlling the whole process. Therefore, PLCs are more suitable for discrete processes’ automation, such as an automobile assembly line in which there are lots of digital signals and a few analog signals. Through their open source communications using fiber optics or Ethernet networks, PLC based systems can be designed as autonomous and communicate over the network to other autonomous controllers. That wide reaching communication would allow one control system to be in charge of a single or multiple processes.
Distributed database systems are compulsory in order to handle massive datasets and perform big data analytics. These storage systems are protrusive due to three main factors: (a) system scalability (horizontally or vertically), meaning that the created database must be able to manage and store a huge and incremental in time amount of spatial or time variant data, allowing applications to fetch them efficiently; (b) interactive performance upon fetching client requests; and (c) properly secured operations. The authors of [9], highlighted a few challenges in managing and querying the massive scale of spatial data, such as the high computation complexity of spatial queries and the efficient handling of their big data nature. Benchmarks are fundamental in examining the performance and functionality of spatial databases and distributed database deployments. Such deployments are examined in this paper using an open source NoSQL implementation of MongoDB and open source PostgreSQL and its NoSQL JSON field. Moreover, the authors of [10] highlighted the importance of security, both for relational and NoSQL databases, by exposing the underlying vulnerability of open databases in three Baltic countries. In this direction, ref. [11] discusses cyberattacks that have taken place, targeting unsecured MongoDB servers.
MongoDB [12] is an open source, document based NoSQL database. In these systems, data entities are saved in collections, called documents, which provide some structure and encoding of the collected data. Each document is an associative array of scalar values, lists, or nested arrays. As in every NoSQL system, in MongoDB, there are no schema restrictions and it can support semistructured data and multiattribute lookups in records with different kinds of key–value pairs [13]. Sharding [14] is MongoDB’s process for distributing data across multiple machines. MongoDB’s sharding deploys very large datasets and high throughput operations. The sharding method divides the system dataset and loads over multiple servers, meaning additional servers are combined with increased capacity, as required. In cases where a single machine’s overall speed or capacity may not be high, using sharding, we enable each machine to process a subset of the overall workload, potentially achieving better efficiency than a single high speed, high capacity server. Adding additional servers will eventually expand deployment capacity with a lower overall cost than having a single high end machine. In this case, the trade off is increased complexity in infrastructure and deployment maintenance. It is worth mentioning that MongoDB sharding is supported natively by MongoDB and requires no additional libraries.
PostgreSQL is an open source object relational database management system (ORDBMS), started in 1986 at the University of California at Berkeley and with more than 35 years of effective development on the core platform [15]; it is transactional by default (it does not support read uncommitted isolation). In addition, there are several extensions available online that integrate specific data and support a diversity of properties, such as TimescaleDB [16] for time series comprising and storing enormous amounts of data for cloud infrastructure metrics, products, web analytics, and IoT devices. Regarding PostgreSQL scaling, an open source extension of PostgreSQL is used, called Citus [17]. Citus distributes data and queries across multiple nodes in a cluster, thus transforming PostgreSQL into a distributed DBMS, enhanced with features such as sharding, replication, a distributed SQL engine, and reference and distributed tables. Although Citus extends PostgreSQL with distributed functionality, it is not a drop in replacement that scales out all workloads. A performant Citus cluster involves considering the data model, tooling, and choice of SQL features to be used. Furthermore, Citus is not supported natively by PostgreSQL and requires additional libraries to be installed. Other useful extensions are PostgreSQL pg-stat-statements [18], which tracks statistics on the queries executed by a PostgreSQL database, and PostGIS [19], which extends PostgreSQL to handle spatial data and data types, also supporting geographically separated objects.
For the deployment of distributed database nodes, Docker containers are utilized that communicate over OpenVPN secure channels. Docker [20] is an open source platform allowing developers to package their applications and offer services into containers, enabling the separation of applications from their originally created infrastructure, increasing application portability, and guaranteeing that the containerized application is installed and executed with an identical result on every system.
In this paper, the authors evaluate the performance in terms of response time, achieved throughput, and loss between scalable distributed datastores, utilizing MongoDB [21] and two modifications of the open source OR-DBMS, a PostgreSQL [22] one with relational, and one with JSON, files. Each system has been evaluated as a standalone server with a native installation of each DBMS against four deployments of their distributed clustered servers, deployed as containers on the physical server utilizing Docker as a builder and orchestrator. MongoDB will be using one query router server, one configuration server, and shard servers of two, four, six, and eight nodes, respectively, while PostgreSQL will be using one coordinator node with worker nodes of two, four, six and eight nodes, respectively.
The rest of this manuscript is organized as follows. Section 2 contains the bibliography about Industry 4.0 and relational and nonrelational databases. Section 3 presents the Industry 4.0 architecture and capabilities. Section 4 describes the selected performance evaluation using industrial data and the obtained results, Section 5 further discusses the findings and Section 6 presents the application to Industry 4.0. Finally, Section 7 concludes this paper.

2. Related Work

According to the authors’ previous work [23], MongoDB is between 19–30% faster than PostgreSQL at insert queries, achieving 51–55% higher throughput. At the same time, relational PostgreSQL is four times faster than MongoDB and two times faster than Postgres JSON at selection queries, achieving 31–35% higher throughput. The Relational PostgreSQL performed equally to Postgres JSON in terms of response time to correlation function queries, while both of them outperformed MongoDB by 3.6 times. MongoDB achieved 19–24% higher throughput than Relational PostgreSQL and Postgres JSON for aggregation function queries. Rossman [24] determined that the PostgreSQL database was measured to be 4–15 times faster than MongoDB in transaction performance testing conducted by OnGres [25]. The tests concluded that PostgreSQL is the leading choice if a fast performance with lower latency is required. For example, suppose an application relies on a relational database with a scale-up architecture or delivers thousands of queries from hundreds of tables. In that case, PostgreSQL is the most suitable solution [26]. Martins et al. [27] compared seven NoSQL databases, such as MongoDB, Cassandra, HBase, OrientDB, Voldemort, Memcached, and Redis, by measuring the execution time of seven workloads through the Yahoo Cloud Serving Benchmarking (YCSB) Tool, which provides the execution of put and get operations. According to their evaluation, Redis, Memcache, and Voldemort achieved the best performance due to their fast in-memory, although expensive operations, while document-based OrientDB and MongoDB showed the slowest performance. Additionally, the authors concluded by creating two groups of databases: (a) MongoDB, Redis, Memcached, OrientDB, and Voldemort being optimized for reading operations; and (b) Cassandra and HBase for updates/writes. Two years later, Martins et al. [28] extended their previous work, concluding that Cassandra outperformed in all testing cases, while, on the other hand, MongoDB achieved slightly better results than Cassandra in cases where hardware resources are limited. Seghier and Kazar [29] compared three NoSQL databases, Redis, MongoDB and Cassandra. Redis was found to be more efficient in reading operations, while MongoDB confirmed its superior performance in write operations.
Additionally, the scaling process depends on if a read or write operation is performed. It is based on scale-up architectures, where the primary machine must be made powerful enough to scale. For reads, functional scale-out is performed by creating replicas, where each replica must contain a full database copy.
There are usually three models of cloud service to compare: (a) software as a service (SaaS), e.g., Google Workspace, Dropbox, Salesforce, Cisco WebEx, Concur, GoToMeeting; (b) platform as a service (PaaS), e.g., AWS Elastic Beanstalk, Windows Azure, Heroku, Force.com, Google App Engine, Apache Stratos, OpenShift; and (c) infrastructure as a service (IaaS), e.g., DigitalOcean, Linode, Rackspace, Amazon Web Services (AWS), Cisco Metapod, Microsoft Azure, Google Compute Engine (GCE) [30]. With SaaS, vendors manage all potential technical issues, such as data, middleware, servers, and storage, resulting in streamlined maintenance and support for businesses. PaaS delivers a framework for developers to build upon and use to create customized applications.
All servers, storage, and networking can be managed by the enterprise or a third-party provider, while the developers can manage the applications. A platform is delivered via the web, giving developers the freedom to concentrate on implementing software without concern about operating systems, software updates, storage, or infrastructure. IaaS is entirely self-service for accessing and monitoring computers, networking, storage, and other services. IaaS allows businesses to purchase resources on-demand and as needed, instead of investing in hardware outright. IaaS delivers cloud computing infrastructure, including servers, networks, operating systems, and storage, through virtualization technology. These cloud servers are commonly provided to organizations through a dashboard or an API, giving IaaS clients complete control over the entire infrastructure. IaaS provides the same technologies and capabilities as a traditional data center, without physically maintaining or managing everything from scratch. IaaS clients can still access their servers and storage directly, but it is all outsourced through a “virtual data center” in the cloud. As opposed to SaaS or PaaS, IaaS clients manage aspects such as applications, runtime, OSes, middleware, and data. However, providers of IaaS manage the servers, networking, virtualization, and storage. Some providers even offer more services beyond the virtualization layer, such as databases or message queues.

3. DBMS System Architecture for Industry 4.0 Standards

An industrial environment contains sensors that communicate with the corresponding concentrators via control PLCs or DCS controllers. Such an environment allows data to be transferred to the cloud distributed DB system from the controllers. This is performed over a cloud based MQTT broker, which continuously receives measurements as encrypted (Base 64) encoded JSON strings, handled asynchronously by the DB service. Primarily for data storage, an intermediate service, MQTT to DB, exists, which decodes the obtained encrypted IIoT data.
Secondly, an application server is used, offering real time and visualization services to end-users. Such functionality is implemented via SDKs that issue PUT, POST, and GET HTTP secure requests, permitting them to process, analyze and manage the collected DB sensory information via HMIs over the web or mobile devices. In addition, application tools such as Grafana and Telegraf or arbitrary custom implemented push notifications are also utilized for visualization, statistical trends, and alert instances.
Such application services can also respond to incidents, apply AI smart agents and bots generating mass notifications, and perform other capabilities, such as operation suggestions or maintenance requests. Augmented reality is also incorporated into such application services, with annotations for monitoring close to real time sensory measurements, as illustrated in Figure 1.

4. Database Performance Evaluation

This section presents the selected performance evaluation scenarios, dataset overview and metrics used to experiment on IIoT data. The subsections that follow present the IIoT dataset and evaluation metrics used, as well as the examined scenarios and results.

4.1. Dataset Overview

The used dataset, in order to perform the DBMS testing scenarios, was an industrial compressor indexed by a hashed _id sensory data collection of 1 M records stored in one table (for PostgreSQL) or one collection (for MongoDB) of equal size. The dataset consisted of randomly generated data utilizing the same procedural method. Each record contained 23 attributes, such as a unique identifier that each DBMS would generate at successful data insertion. A “tag ID” field containing the tag identifier for the simulated device, a subcollection named “rxInfo” containing the simulated device’s informational fields, and a subcollection named “data”, which includes the sensor measurements, were included. The informational fields consisted of the received signal strength indicator (RSSI), the GPS location coordinates of the physical device, the collector’s gateway ID, and the timestamp of each measurement. The sensor measurements consisted of the rotation per minute (RPM) measurements, temperature measurements around the engine axis and engine frame, measured in C, and 3D Cartesian plane vibration vectors of four acceleration sensors placed on the NW, NE, SW, SE of the simulated engine frame, measured in m/s 2 .
The constructed dataset has been used to consider real world applications and needs, utilizing a variety of information necessary for daily operations in an industrial setting. The total size of the records was decided to be 1 M in order to fit both the criteria of being large enough for an IoT database set consisting of millions of network packet transactions between the IoT devices and database servers, and small enough to perform a simulation of a real world deployed platform, as part of the proof of concept.

4.2. Evaluation Metrics

The paper follows the example of [23,31]; for their performance evaluation experiments using industrial IoT sensory data, the authors used the following metrics: (a) average response time, (b) jitter, (c) average achieved throughput, and (d) failure, meaning either database inability to process a query, or to set a unique key to the record during the insertion time.

4.3. Performance Evaluation Set Up

The selected clustering system consists of 20 client nodes and a server. Each client node is a PC running Linux Slax 4.9.0-11-686 SMP Debian 4.9.189-3 in a virtual box with an AMD Ryzen 32,200 G CPU and 1.5 GB RAM, while the server is a PC running Linux Ubuntu 20.04.3 with an Intel Xeon E5-2640 2.5 GHz (24 cores) CPU and 32 GB RAM. PostgreSQL version 14.1 and MongoDB version v5.0.3 were used for the native installation on the server, while, on the distributed DBMS, Docker v20.10.12 was used to build and run the containerized clustered servers of the same version, respectively. The DBMS testing scenarios were designed to simulate real world case scenarios. For this experiment, three separate use cases were selected, composed of:
  • Nonrelational MongoDB document styled records.
  • Nonrelational JSON Postgres document styled records.
  • Relational PostgreSQL table row styled records.
For each case, three separate scenarios were selected for testing purposes:
(Q1) Insert query: data records will be generated and inserted into the DBMS using the network of 20 computers in multithreaded order consisting of five test cases S = { n a t i v e , 2 , 4 , 6 , 8 } shards with T = { 10 K } inserts per second on each of the DBMS use cases.
(Q2) Select query: Utilizing the databases constructed in the previous test scenarios, selection queries will be performed on the DBMS to fetch data that match the filtering condition. For this case, the query’s dataset returns all matching records(lines/documents) from the table/collection. All fields are procured only if the “tag ID” is matched from the variables set that the executing algorithm produces. The variable set is randomly selected from a list containing all tables/collections paired with each unique “tag ID” within said table/collection. The queries will be performed in a similar structured algorithm as in “Data insertion”, utilizing the same network in a similar multi-threaded order to the S test cases of T QPS, up to the maximum network throughput.
(Q3) Correlation function query: In order to perform a complex type of querying, the same setup as will be the “Data querying” is used, differentiating, in the expected dataset containing one single record, only the arithmetic mean of each “data” subcollection field (sensor measurements). Data correlation queries will be performed in the same network as before, in similar multithreaded order to the S testing cases of T QPS, up to the maximum network throughput.
All testing scenarios will be evaluated and confirmed by replicating the same results. Results are stored in JSON trace files for ease of access and processing.

4.4. Experimental Results

Prior to the experimentation, we shall introduce some generic comments. The size of each of the three databases is a total of 1 M records. Every scenario is executed 50 K times for verification.

4.4.1. Scenario (Q1)—IIoT Data Insertion

According to Table 1, Postgres with JSON data types achieved a better response time than MongoDB, in the first three out of five tested deployments, by 57% in native deployment, and 5%, and 7% in the distributed deployments of two and four servers, respectively, while MongoDB achieved an overwhelming throughput performance against PostgreSQL in all deployments: by 56–61% in native deployment and 88–91%, 69% and × 2 in the distributed deployments. Postgres JSON data types performed slightly better than relational data types in native and two worker node deployment while converging on the four/six/eight worker node deployments, thus achieving similar throughput. Due to the high client achieved throughput (10 K), Postgres with JSON appeared to produce failures in the standalone version, in the order of 0.0002 % , as a result of its inability to assign a unique key to the record in a reasonable time.

4.4.2. Scenario (Q2)—IIoT Data Selection

In this scenario, the authors fetch 0.1 % of 1 M records in each database (around 1 K records). Table 2 shows that PostgreSQL with relational data types was × 2 times faster than MongoDB in terms of response time, achieving 35% higher throughput on the native deployment, while MongoDB outperformed PostgreSQL with relational data types in all distributed deployments by a 19% and 25% better response time, with 44% and 63% better throughput in two and four shards/worker nodes, and 27% and 31% response time with almost 63% and 50% higher throughput in six and eight shards, respectively.
Postgres with JSON data types did not perform well (especially with Citus/sharding, where it was found to be 2+ times slower than MongoDB), proving that it should not be used in applications with big data querying.
Negligible failures, in the order of 0.003 % , appeared in both Relational Postgres using two shards and in Postgres JSON with four shards, due to the high client throughput resulting in the incapability of the database to fetch the results in time.

4.4.3. Scenario (Q3)—IIoT Correlation Functions

Table 3 highlights that PostgreSQL with relational data types performed the best in all deployments, achieving × 4 times, 57% and 15% better response time, with × 3.25 times and 31% better, and a slightly worse throughput than MongoDB, on the native, two/four/ six/eight shards/worker nodes. As the distribution factor increased, MongoDB displayed constant improvement, converging on the performance of PostgreSQL with relational data types in both the throughput and the response time. Postgres with JSON data types improved as well on 4+ worker nodes, although still not providing any additional benefit.

5. Discussion

Throughout this experiment, some key elements were observed. The native counterpart outperformed every distributed DBMS due to additional calculations (overhead) needed for every distributed query that was performed on each system. A detailed discussion of the experimental results follows. In the Q1 and Q2 testing cases, every horizontal scaling strategy had a negative impact on both the response time and the throughput of each query on all the DBMS in question. In the Q3 testing case, distributed Postgres JSON data types had a considerable improvement, outperforming even the native Postgres JSON data types, while MongoDB had a noticeable improvement as well. Distributed PostgreSQL relational data types performed the worst, in relation to their native counterpart. MongoDB DBMS performance was impacted the least by the overhead calculations due to MongoDB architecture being designed for horizontal scaling out. PostgreSQL DBMS with relational data types and the Citus extension was negatively impacted the most, making the usage of distributed clustering on relational data inefficient in industrial IoT data applications.
For the Q1 testing case (data insertion), MongoDB provided substantially better throughput with longer response times up to four shards, delivering a staggering × 2 times higher bandwidth (response time × achieved TP) than PostgreSQL. This can be interpreted as MongoDB attempting to parallelize the insert queries rather than performing sequential execution, which is preferred and highly recommended for industrial IoT data applications. In this direction, MongoDB, with 6–8 shards configurations, decreased its response times significantly, outperforming both versions of PostgreSQL.
Finally, Table 4 summarizes the performance in response time of MongoDB (as the baseline) and the Relational PostgreSQL. It is noticeable that, although in native implementation, the relational PostgreSQL outperforms in all three testing cases; MongoDB overturns the situation to its detriment by gaining significantly in performance as the number of shards increases, in contrast to Relational PostgreSQL performance, which decreases dramatically. This phenomenon can be explained, because the sharding procedure acts drastically and more efficiently in MongoDB, since MongoDB is designed with a sharding strategy as a core functionality, resulting in minimal overhead, rather than any of the two tested versions of PostgreSQL using the sharding extension.

Suggestions to Developers

Table 5 presents a concluding synopsis on which database schemes are suitable for low or high QPS data collection burstiness for the three testing scenarios. According to the table, standalone versions of Relational PostgreSQL are more efficient in all testing cases for low QPS, while, on the contrary, distributed schemes, being benefited by the sharding mechanism of six–eight shards, under MongoDB are preferable for all the cases in situations being characterized by high data burstiness, highlighting that sharding is crucial and mandatory for storing or fetching big data.

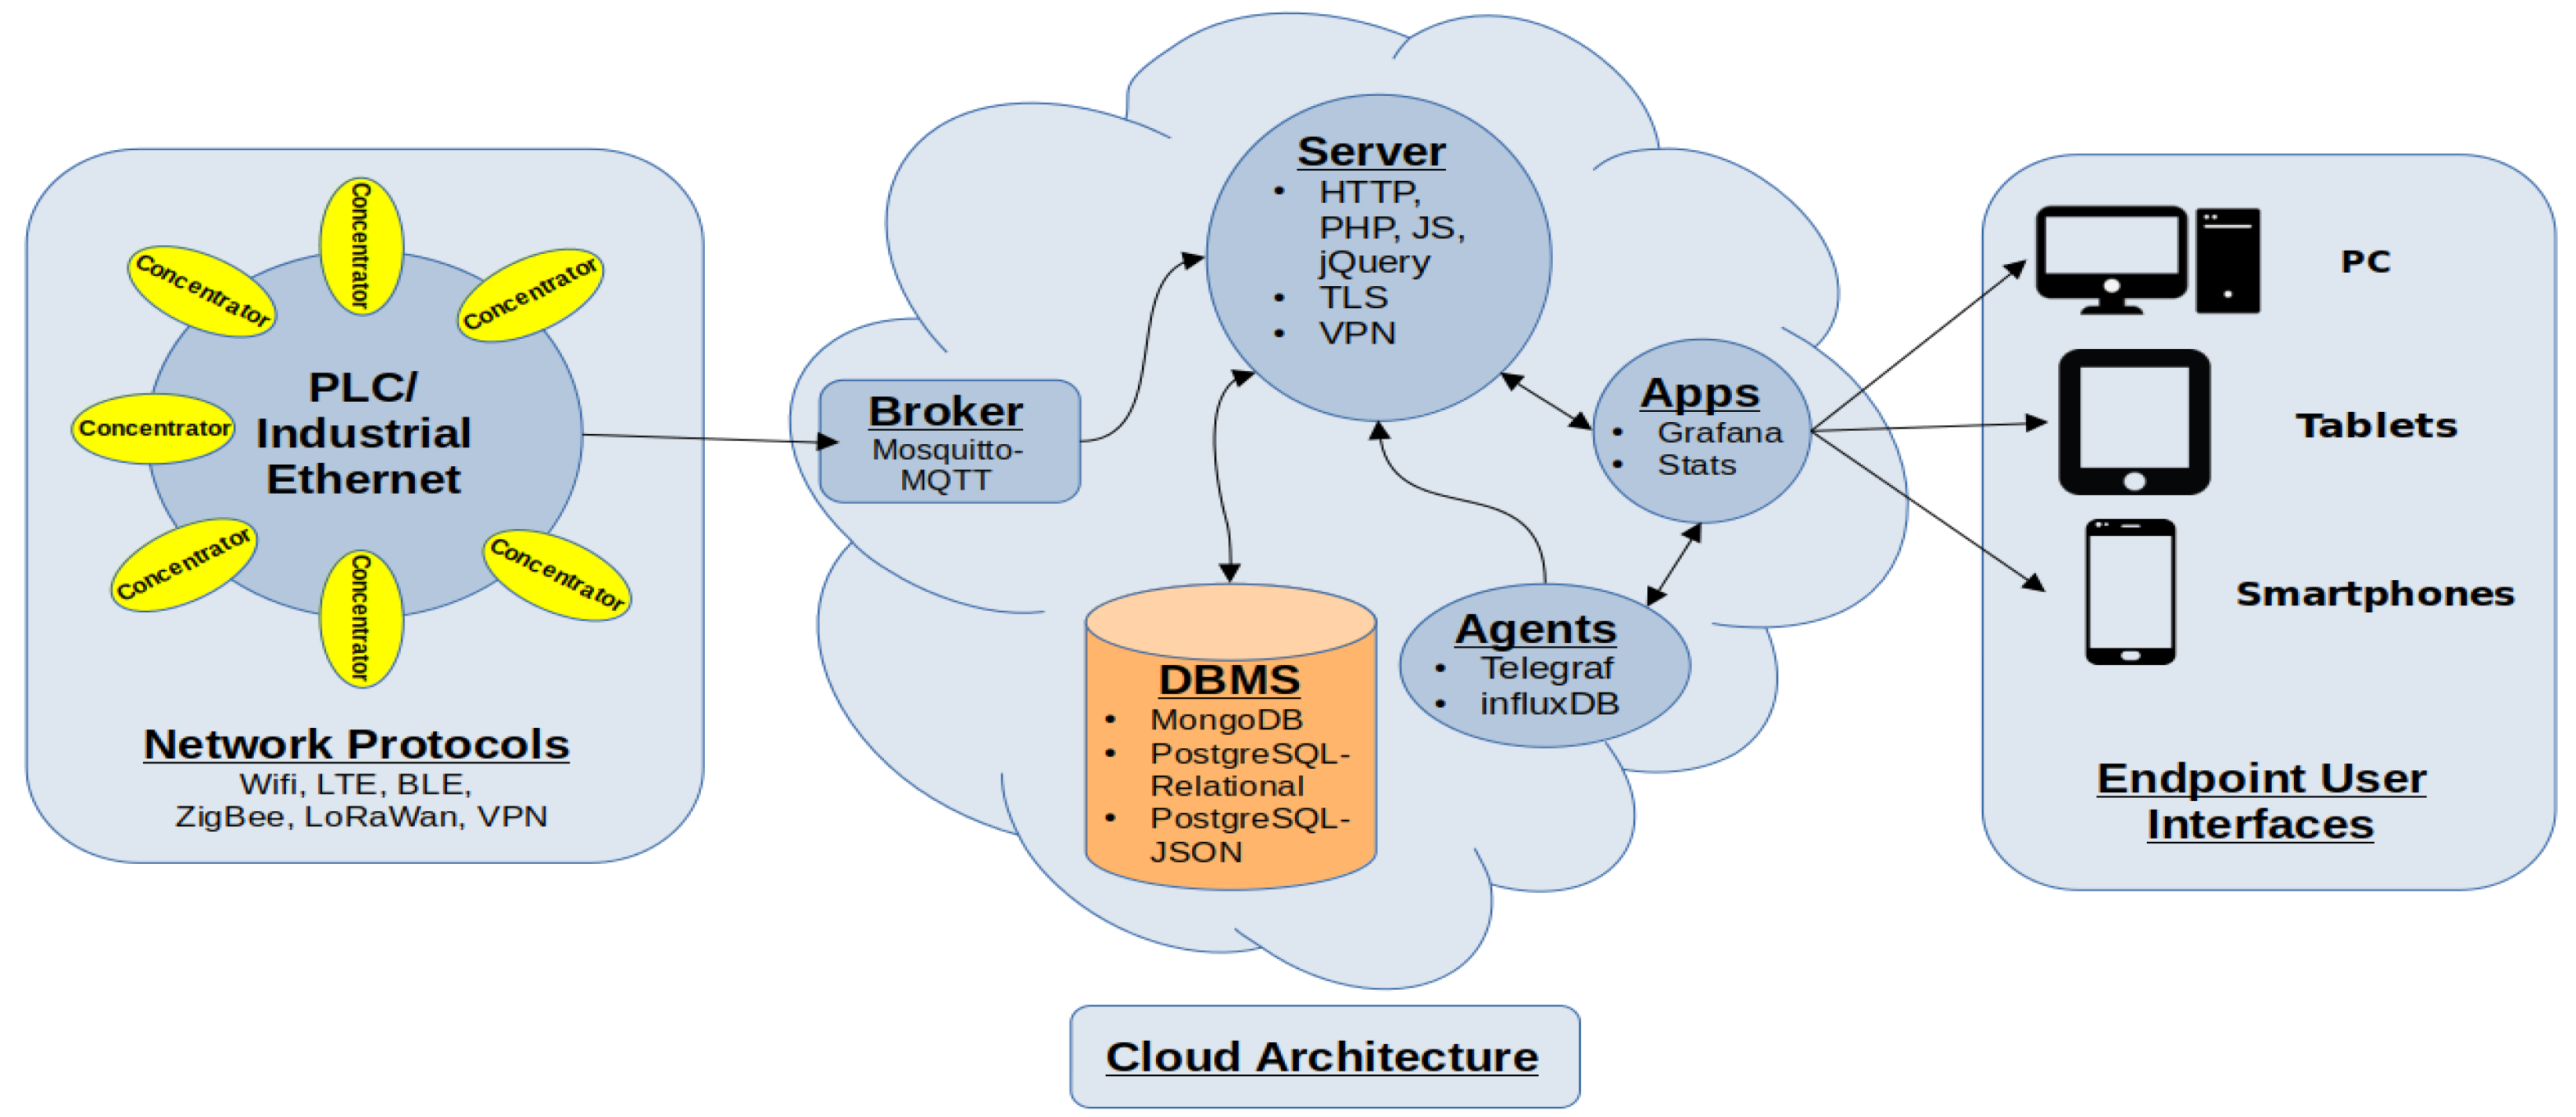
6. Application to Industry 4.0

In this section, the application of the distributed MongoDB architecture has been selected using a NoSQL clustered sensory DB schema, due to its fair results if horizontally scaled and its ease to store data as JSON records of variable size and fields. Furthermore, appropriate case study services and applications are presented as part of the authors’ Industry 4.0 preventive maintenance procedures, specifically for equipment in large industrial infrastructures. Details concerning the database architecture, the chosen broker, its portability via docker, the CRUD, stat and assets managers, and the related JSON ReST API follow.

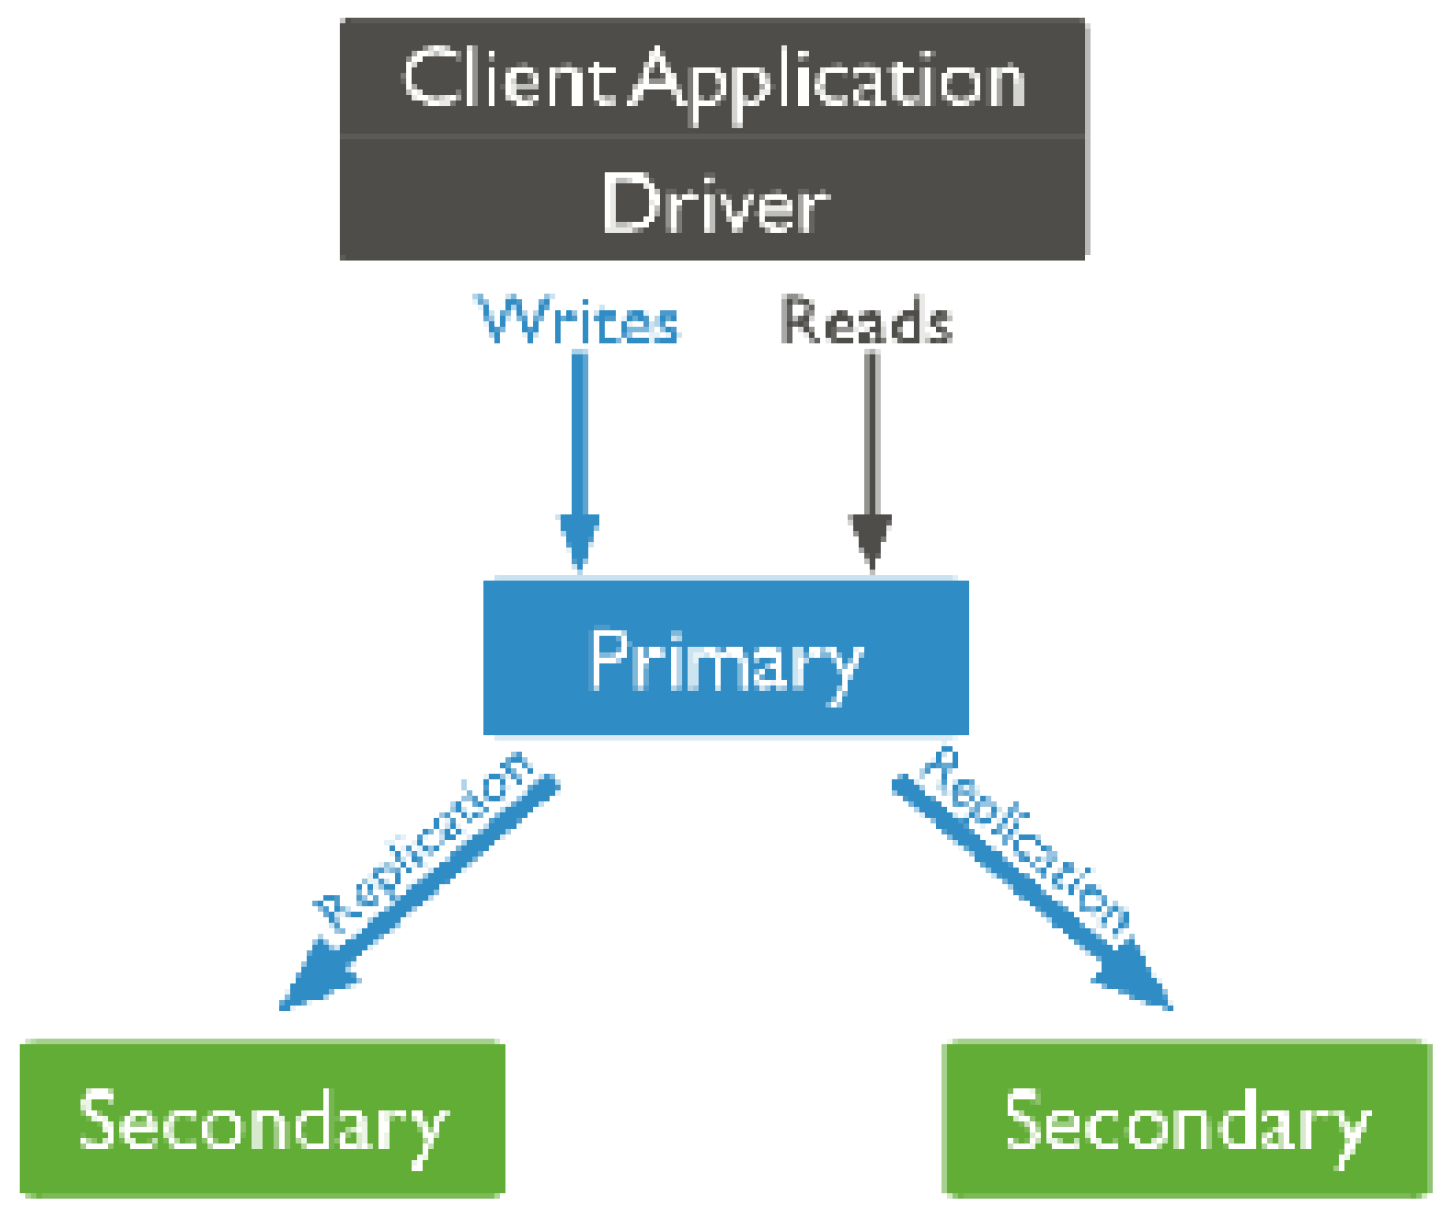
6.1. Database Architecture

The DBMS implementation of the A.R.I.S. platform was chosen to build a horizontally scaled sharded type system with replication (also, replica services coexist). This “Sharded Replica” type system consists of two shards with three replica nodes, one configuration server with three replica nodes, and one “mongos” query router. The replica design servers will be exact copies of each other. This design achieves maximum consistency in reading/writing data and protection from “Denial of Services” in case of the loss of the host server. This function is achieved by defining one server as primary and using the other two as secondary servers (Figure 2).
The selected cloud servers consist of two Dell twin servers with Intel Xeon E5-2640 2.5 GHz (24 cores) CPUs and 32 GB RAM, running the Ubuntu Linux 20.04.3 operating system, with two hard drives each in RAID 1 mode, and one computer used in the process of developing the platform software, which carries Ubuntu Linux with a dedicated single hard drive to store data as a support server. The three servers communicate through the open source software OpenVPN (virtual private network) with personal identification keys, in order to achieve secured connections.
The format of the data set is dynamic, and the ability of MongoDB to store dynamic format data in a JSON format is one of the main reasons it was chosen to be used for the authors’ case study, denoted as “Integrated Interactive Augmented Reality System for Holistic Industrial Maintenance Management”. The data set, although dynamic, is estimated to implement some basic features for each record (the 23 attributes mentioned in Section 4.1).

6.2. Broker

The broker service that was chosen to be used for the needs of the system is the Mosquitto MQTT Broker [32]. An appropriate VPN service has been used via OpenVPN to communicate between DB shards and the MQTT broker. Appropriate agent services have been written in Python using the Paho MQTT libraries and the PyMongo Python Driver from the management of the clustered MongoDBMS service. The service was designed to simultaneously process information through threads in the shortest possible time and operate more efficiently in a multicore processor environment.

6.3. Database System Portability Extension

The DBMS for the clustered (sharded) database MongoDB platform uses an arbitrary number of shards (scalable implementation) for horizontal scaling depending on the data volume and usage. Each shard has been implemented into Docker containers (config servers, shard servers, and mongos), with each one including its designated VPN key.
The orchestration of the containers is performed using the Docker-compose tool. The system is described using the docker-compose.yaml file. This is, by default, initialized with the orchestration of three configuration servers, two sharded clusters of servers consisting of three replica servers each, and a mongos routing server divided into two physical servers.

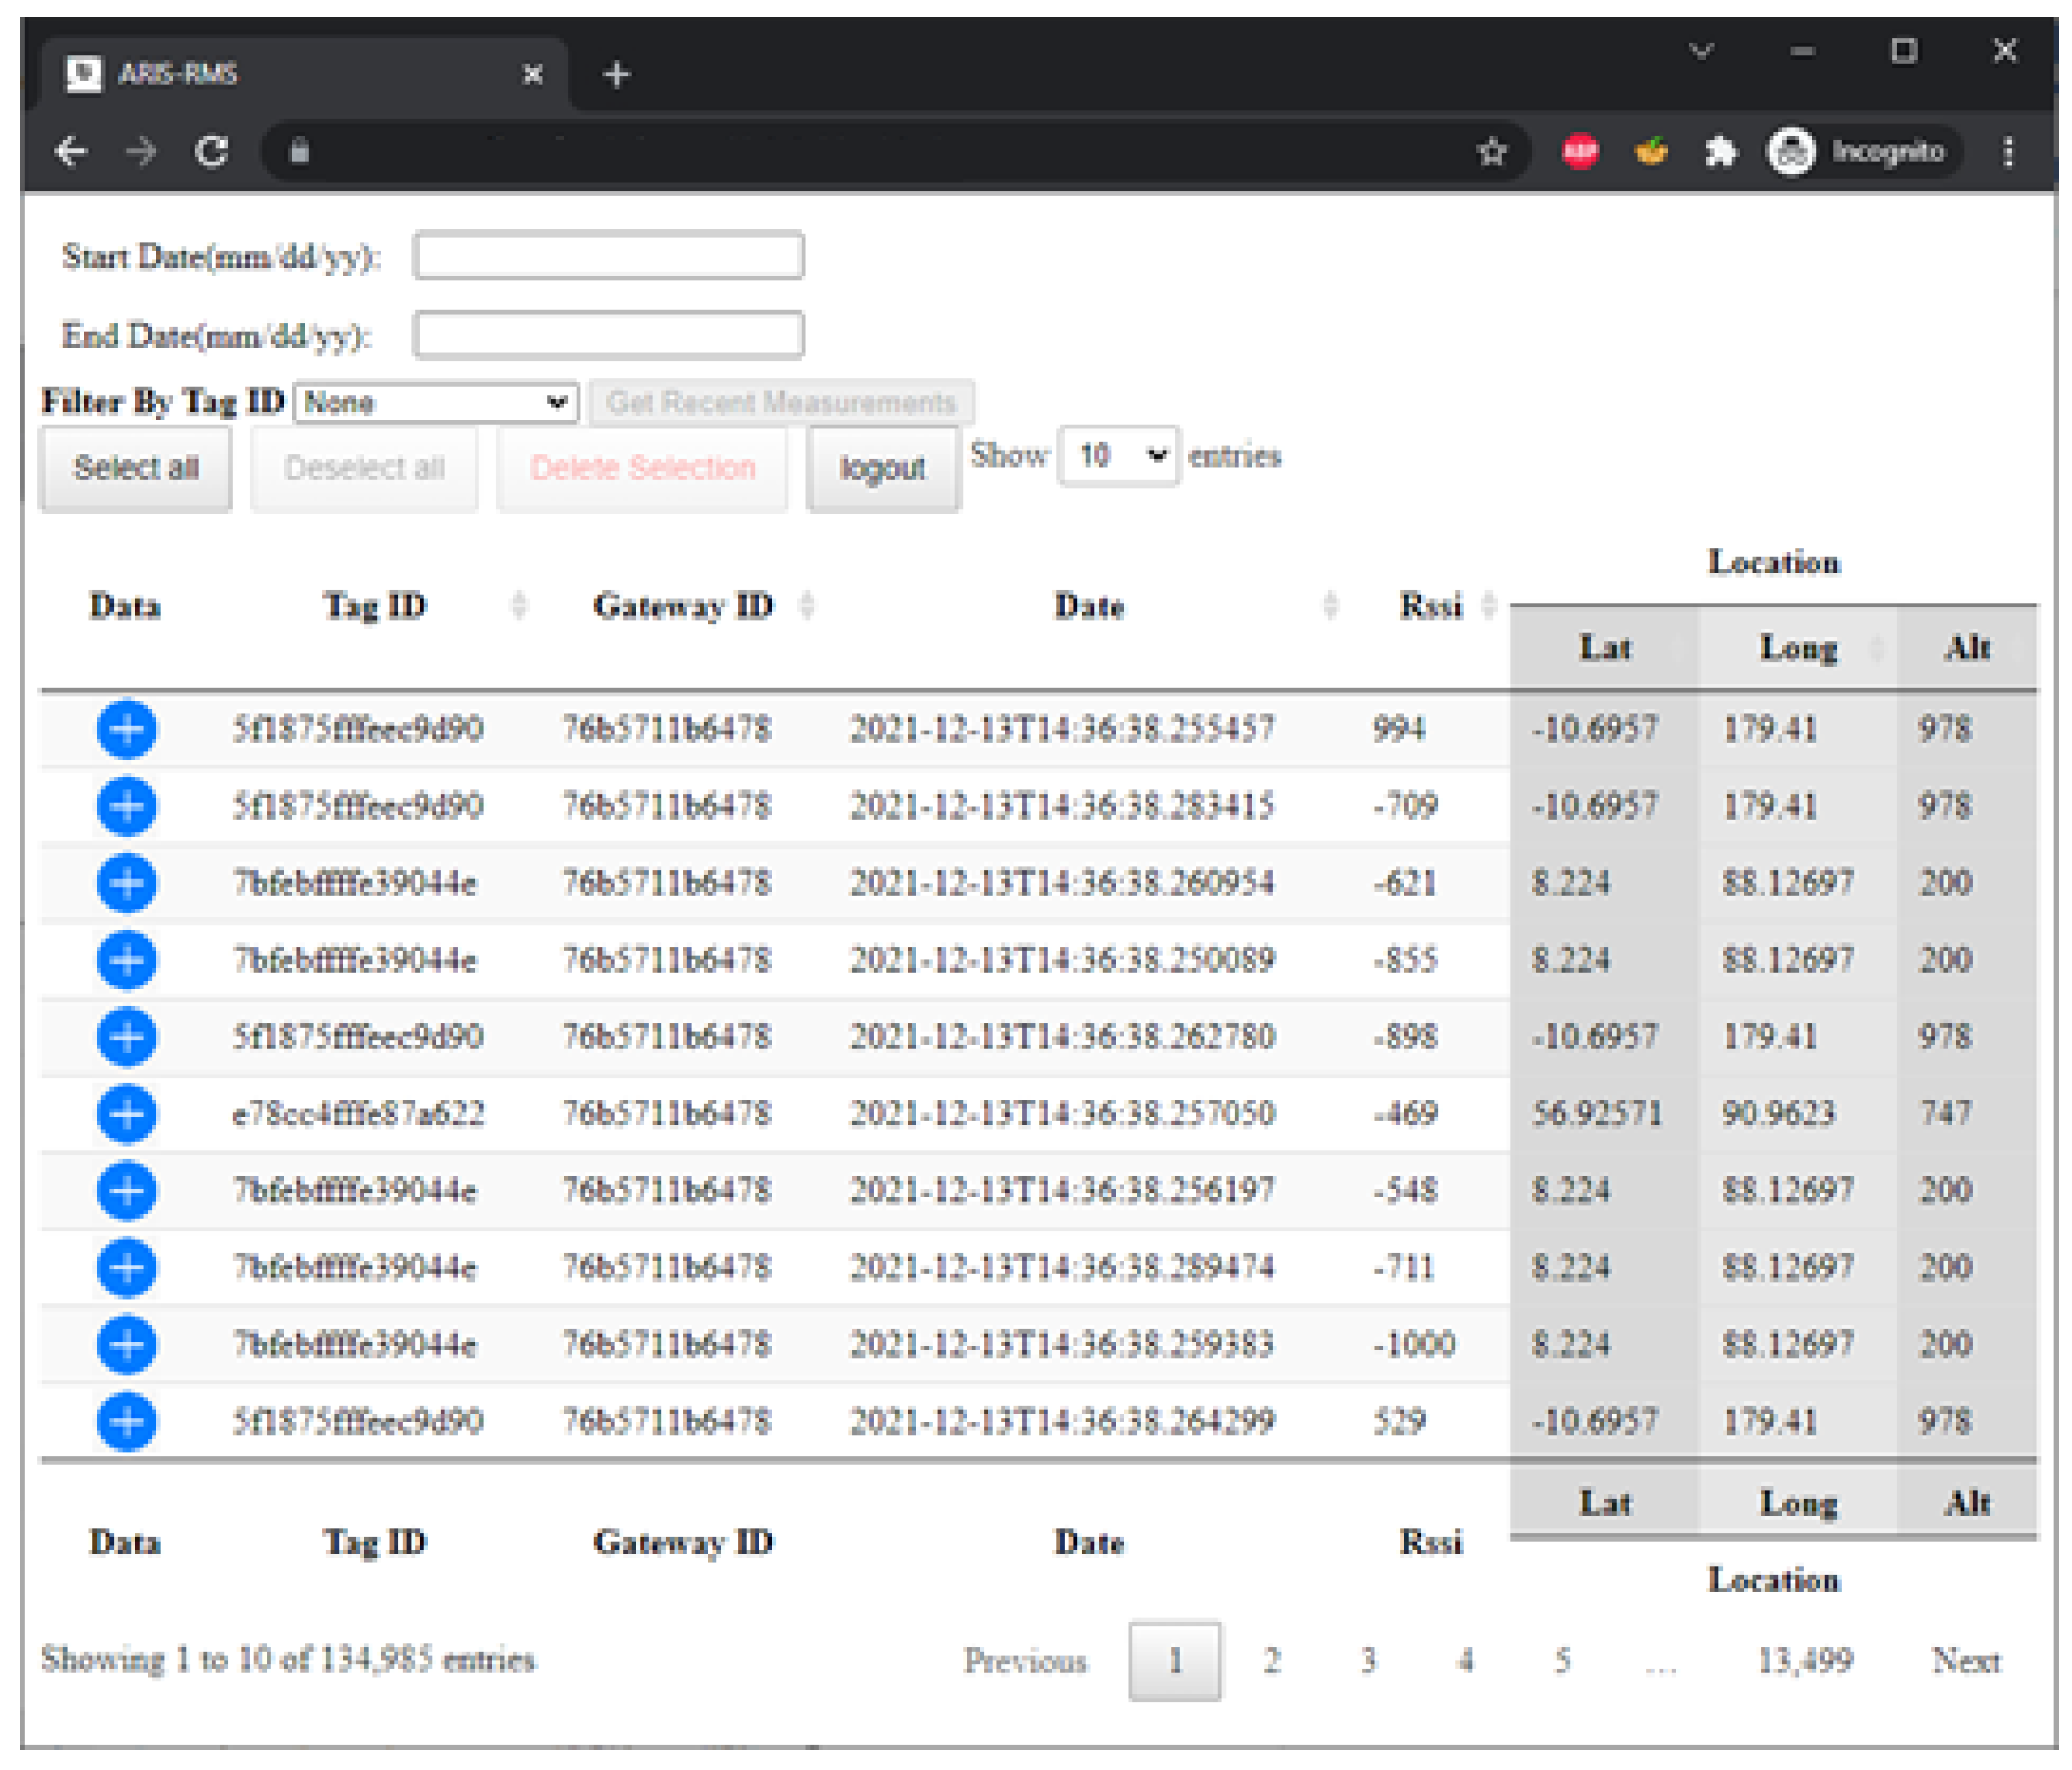
6.4. CRUD Manager HMI

As part of the authors’ Industry 4.0 application services case study implementation for data management, an appropriate MongoDB capable CRUD Manager Web HMI has been developed. CRUD Manager includes the MongoDB DBMS, creating, reading, updating, and deleting (CRUD). The CRUD Manager HMI is named A.R.I.S.-Resources Management System and is illustrated in Figure 3.
The application has been implemented on a LAMP stack (Linux, Apache, MongoDB, PHP), using the DataTables libraries, Mongo PHP Driver and jQuery, AJAX, HTML5, and PHP. The HMI is set on a separate Docker container. It communicates with the database over the virtual private network, implemented using the OpenVPN service and using x.509 authentication, as mentioned above. Through the CRUD Manager, the end-user can monitor the data of the corresponding database, and select one of the following system functions:
  • Sorting based on any field by clicking on the arrow of the desired column.
  • Filtering data based on “tag ID” via the drop down menu or by date by clicking on the text boxes and selecting the corresponding date via the date/time picker submenu.
  • Selectively deleting single or multiple records using the Ctrl or Shift keys and selecting the desired records to delete and pressing the red “Delete Selection” button on the HMI. Deleting is carried out after user confirmation, and the page returns a success or failure message.
  • Showing measurements by pressing the blue button with a cross (+) or hiding measurements by pressing the red button with a hyphen (-) on the left side of each record.
  • Dynamically displaying panel size by selecting the desired display size in the drop down menu “show 10/25/50/100 entries” in the center at the top of the HMI.
  • Displaying recent measurements per “tag ID”, by selecting the desired “tag ID” through the filtering function based on “tag ID” and then selecting the “Get Recent Measurements” button.

6.5. JSON ReST API

As part of the authors’ DB interfacing with other applications, an appropriate ReST SDK has been implemented. In addition, ReST API type commands have been created focusing on data retrieval from the MongoDB clustered database. The access requires a 128 bit size key for identification, and the designated pump’s requested 64 bit “tag ID”. Optional 8 bit field “offset” can also be used, which indicates the time distance between measurements. In case of an error, the corresponding HTML error messages are propagated.

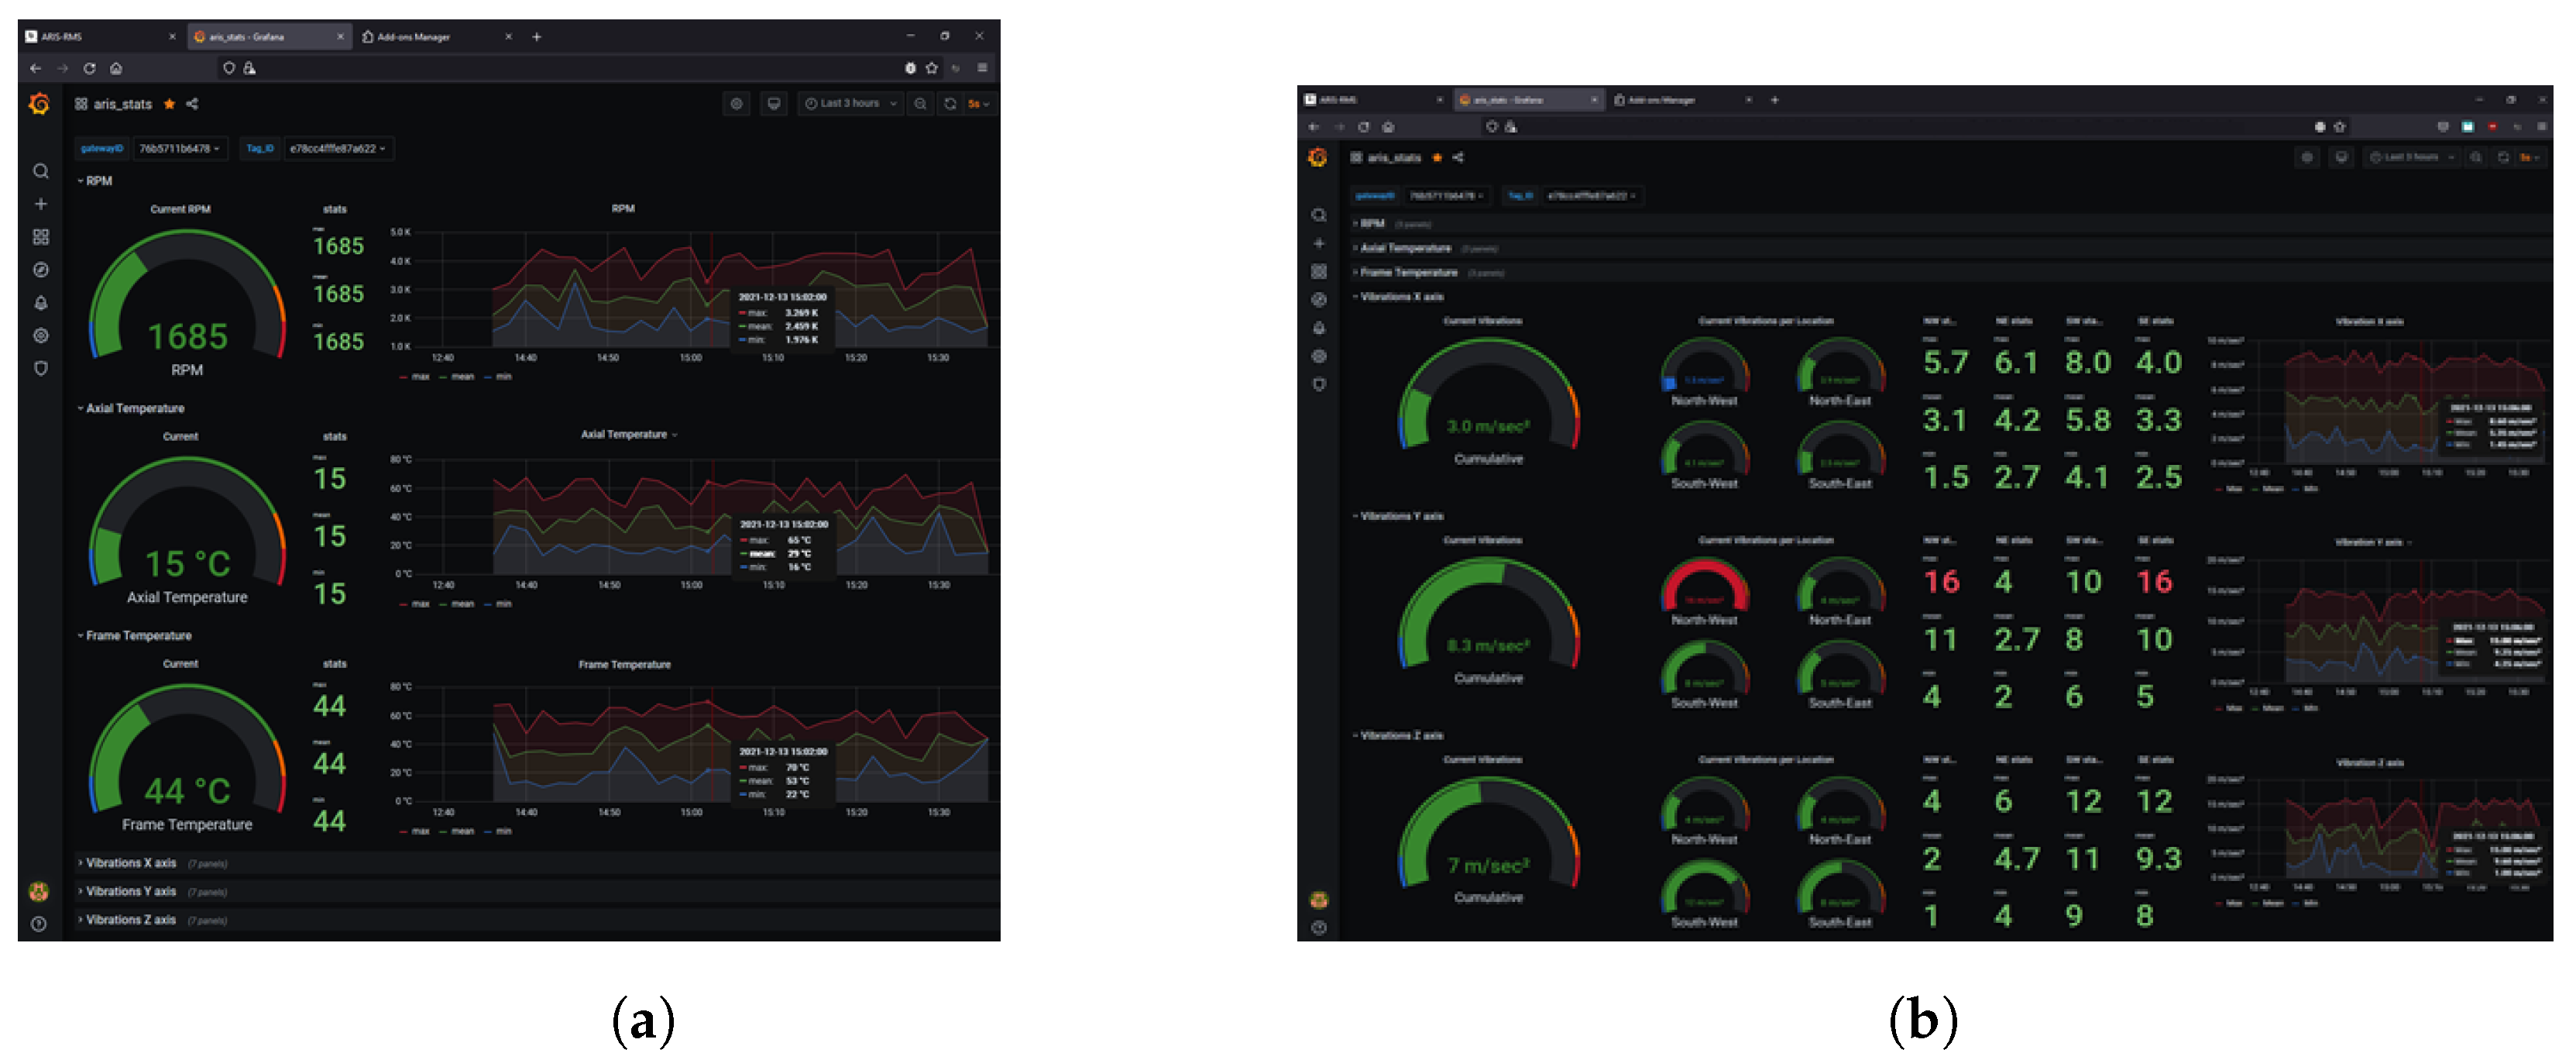
6.6. Stats Manager HMI

As part of the authors’ statistical trends visualization, an appropriate statistical web dashboard manager, called the Stats Manager HMI, has been implemented. The use of the TIG stack was chosen as one of the best open source choices, i.e., the combination of a group of powerful open source monitoring tools, such as Telegraf [33], InfluxDB [34] and Grafana [35]:
  • Telegraf is an open source server agent for collecting and sending metrics and events from IoT databases, systems and sensors.
  • InfluxDB is an open source timeline database that provides data storage for real time metrics, events, and analytics.
  • Grafana is a data visualization and monitoring tool that supports time series data repositories such as Graphite [36], InfluxDB [34], Prometheus [37], Elasticsearch [38].
For real time services and alert issuing implementations, appropriate Python scripts have been created that broadcast real time sensory records as HTTP push notifications via the ReST API. Finally, as part of the authors’ case study implementation, subsequent dashboards have been created in the Stats Manager with three panels that each correspond to one of the measurements—RPM, engine shaft temperature, and engine frame temperature—and three more complex panels that correspond to the measurements vibration, i.e., vibrations on the X, Y and Z axis of an industrial pump. The user configures the dashboard to select the “tag ID” to display the chosen data concentrator Gateway ID by selecting the corresponding field from the drop down list at the top left of the Stats HMI. The selection of the desired data time periods to be displayed can also be arbitrarily selected. Each of the panels representing the RPM, axial temperature and frame temperature measurements consists of:
  • The most recent measurement displayed on the left side of the panel,
  • Statistical values of the selected time period for the maximum value (max), the mean value (mean), and the minimum value (min), displayed on the center left side of the panel (Figure 4a),
  • Detailed graph of the previous values (max, mean, min) concerning their change in the selected time period, displayed on the right side of the panel. The red line corresponds to the maximum value, the green line to the arithmetic mean, and the blue line to the minimum value.
A similar design logic was followed for the more complex panels representing the X-, Y-, and Z-axis vibration measurements. The difference is that each panel displays the aggregate information from the four vibration sensors in NW, NE, SW, and SE directions (see Figure 4b).

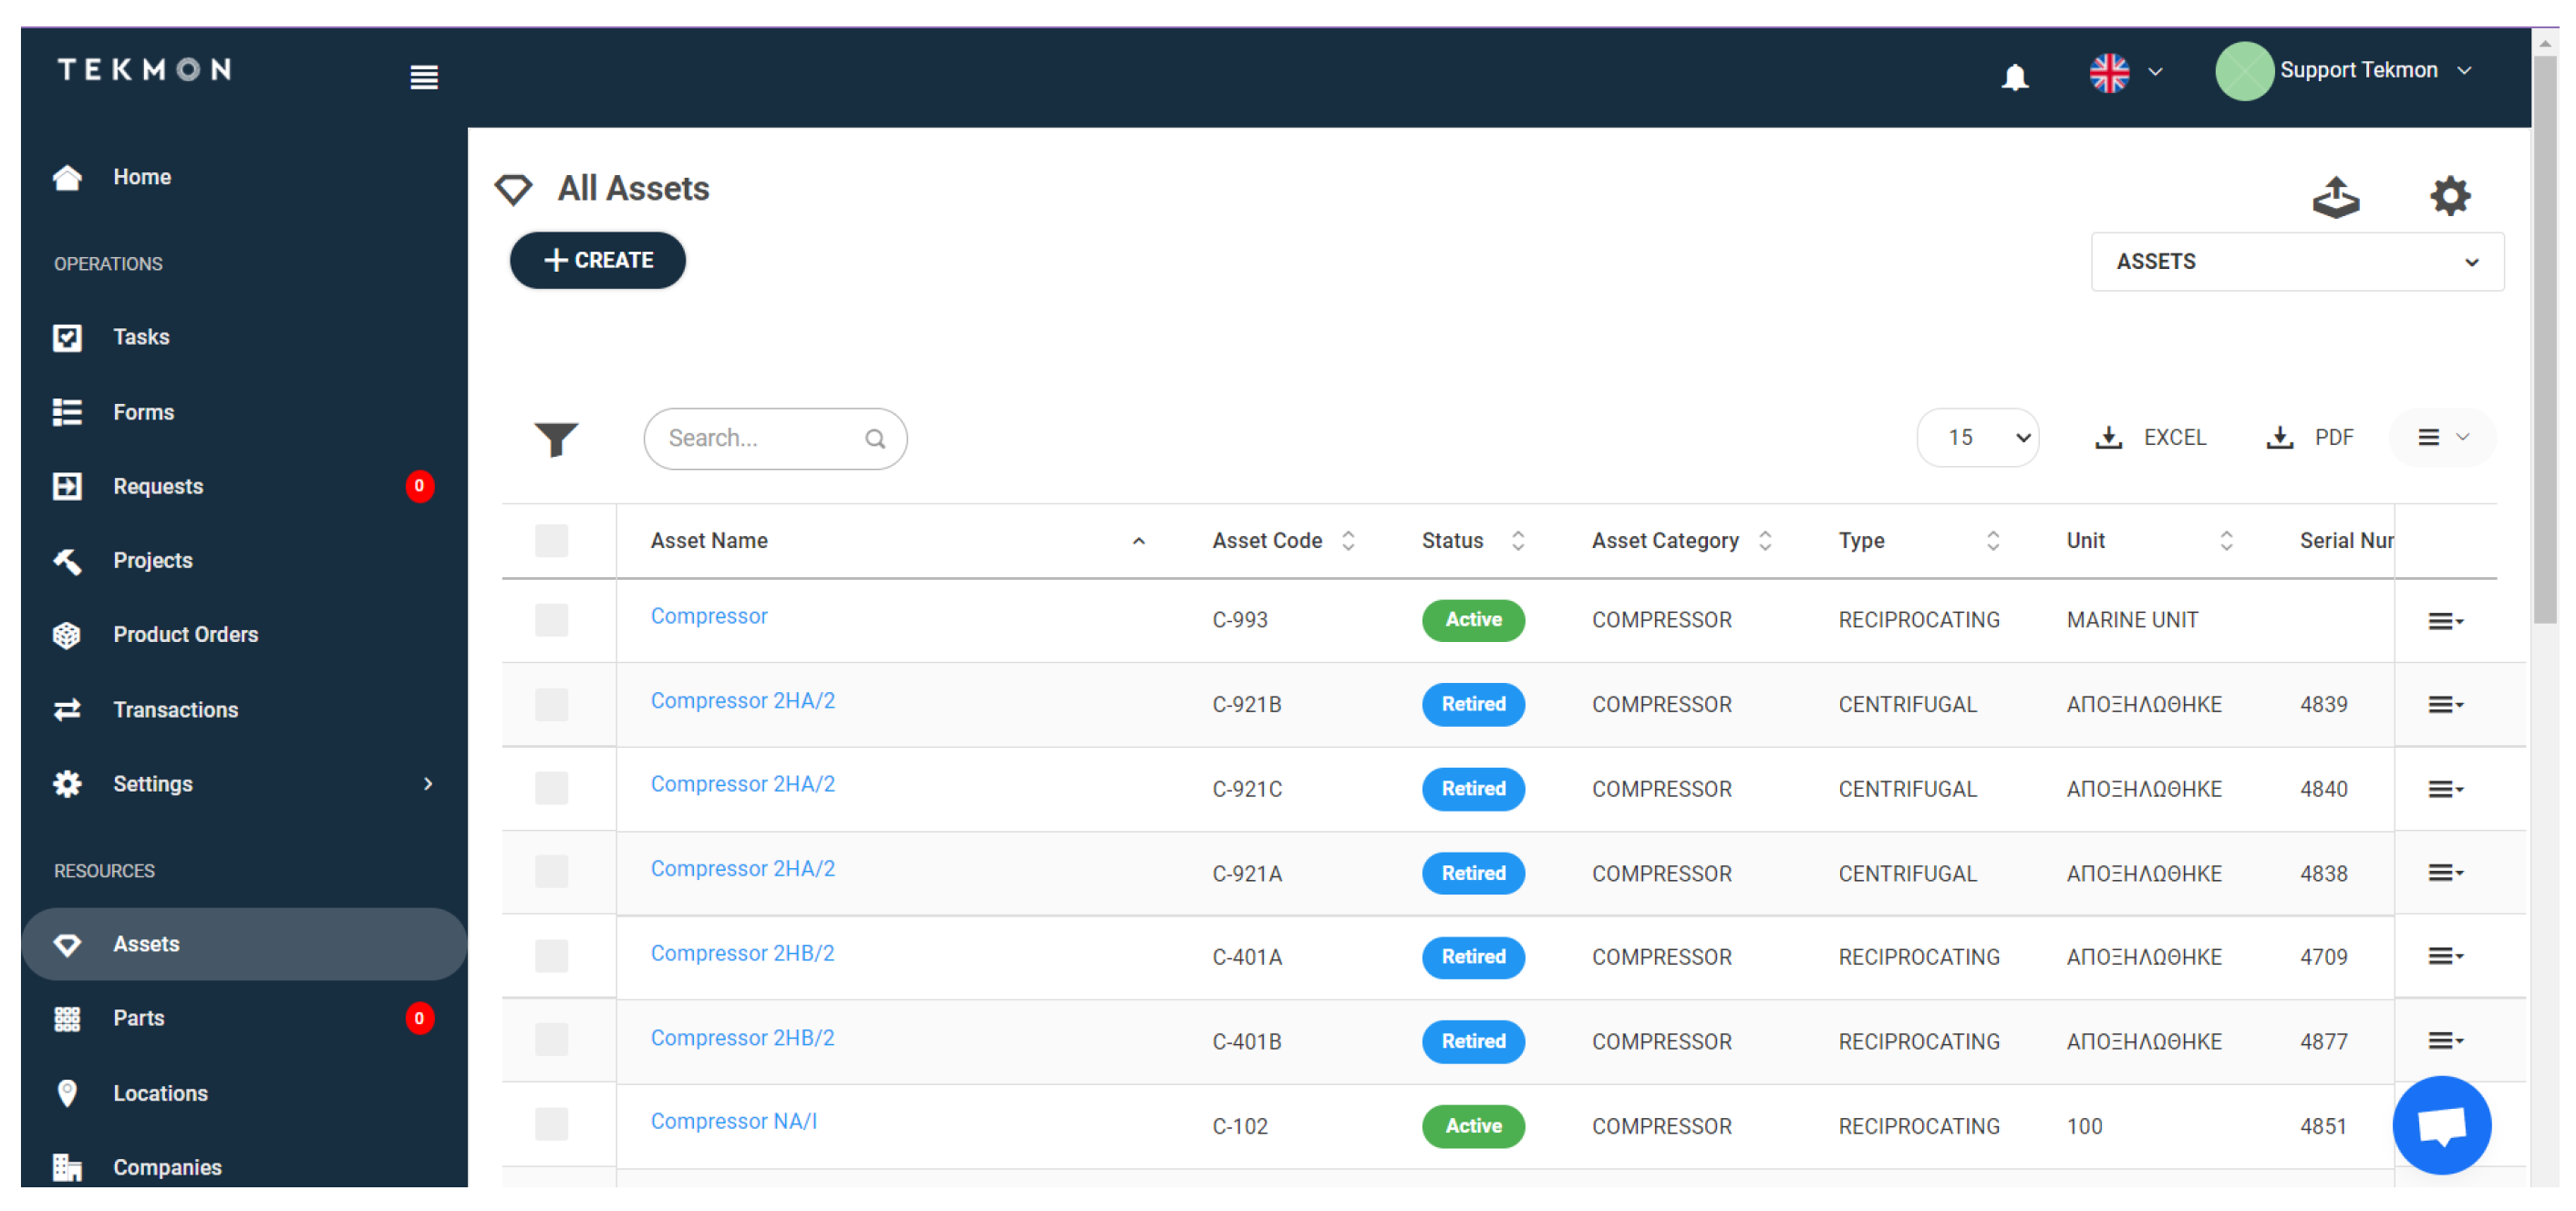
6.7. Daily Operations System via Assets Manager HMI

Finally, as part of the authors’ Industry 4.0 proof of concept, appropriate resources management system interfacing has been implemented in the daily operations and resources management system provided by the project partner Tekmon company, Ioannina, Greece, illustrated in Figure 5. This system includes processes and plans per machinery (asset), historical maintenance information, technical specifications, and guidelines for maintenance operations. It also interfaces with already stored industrial parts per asset and personnel/assets tracking services, generates tasks, and issues alerts and notifications. In addition, the proposed system will be capable of interacting with mobile tablets and exchanging real time information with the maintenance personnel in the field.

7. Conclusions

Due to the evolution of Industry 4.0 and the significant increments of IoT sensory measurements, massive cloud database storages are in great demand. For this reason, the authors selected three main distributed strategies to be evaluated, a NoSQL database called MongoDB, and two versions of PostgreSQL, one that benefited from JSON fields and one the classic relational schema, in order to exploit their horizontal scaling capabilities while being encapsulated in cloud containers.
From the authors’ experimentation, MongoDB is becoming an attractive solution for cloud sensing repositories, outperforming relational database schemes for industrial sensory data burst inserts and bulk reads. Additionally, if horizontal scaling is performed, MongoDB closes the performance gap to their relational counterparts concerning the execution of aggregated stored procedures and correlation functions. Moreover, in cases of low client throughput (≤100 concentrators, 1 K QPS), a standalone version of the Relational PostgreSQL is sufficient to perform inserts, selects, or aggregations, while, as the client throughput increases significantly (500–1000 concentrators, 5 K–10 K QPS), a distributed version of MongoDB, or Relational PostgreSQL with six–eight shards is obligatory.
Finally, the simplicity of the MongoDB shards deployment in containers shows its significant advantages over the cumbersome and heavily loaded PostgreSQL Citus, and the flexibility and transparency offerings to the front-end design of industrial applications and intelligent processes. The authors set, as future work, further experimentation and evaluation of their proposed solution as part of an assets’ sensory storage engine for implementing Industrial maintenance A.I. processes.

Author Contributions

Conceptualization, S.K. and T.G.; methodology, S.K.; software, V.K. and T.G.; validation, V.K., T.G. and S.K.; formal analysis, T.G.; investigation, S.K. and V.K.; resources, S.K.; data curation, T.G.; writing—original draft preparation, T.G.; writing—review and editing, T.G., V.K. and S.K.; visualization, T.G.; supervision, T.G.; project administration, T.G.; funding acquisition, S.K. All authors have read and agreed to the published version of the manuscript.

Funding

This research has been cofinanced by the European Union and Greek national funds through the Operational Program Competitiveness, Entrepreneurship and Innovation, under the call RESEARCH–CREATE–INNOVATE (project code: T2EDK-00708). Project partners: Department of Mathematics of the University of Ioannina, HELLENIC PETROLEUM HOLDINGS S.A., TEKMON P.C., and the Department of Surveying Engineering of Aristotle University of Thessaloniki.

Institutional Review Board Statement

Not applicable.

Informed Consent Statement

Not applicable.

Data Availability Statement

Not applicable.

Conflicts of Interest

Authors declare no conflict of interest.

Abbreviations

The following abbreviations are used in this manuscript:
AIArtificial intelligence
APIApplication programming interface
ARAugmented reality
A.R.I.S.Augmented reality information system
AWSAmazon Web Services
CPPSCyber–physical production system
CPUCentral processing unit
CRUD ManagerCreate, read, update and delete manager
DBDatabase
DBMSDatabase management system
DCSDecentralized control system
GCEGoogle Compute Engine
GPSGlobal positioning system
HMIHuman–machine interface
IaaSInfrastructure as a service
IIoTIndustrial internet of things
IoEInternet of everything
IoTInternet of things
JSONJavaScript object notation
M2MMachine to machine
MQTTMQ telemetry transport
NB-IoTNarrowBand IoT
NENorth-east
NWNorth-west
OR-DBMS          Object relational database management system
OSOperating system
PaaSPlatform as a service
PCPersonal computer
PIDProportional, integral, derivative
PLCProgrammable logic controller
QPSQueries per second
ReST APIRepresentational state transfer application programming interface
RPMRotations per minute
RSSIReceived signal strength indicator
SaaSSoftware as a service
SESouth-east
SDKSoftware development kit
SWSouth-west
TPThroughput
YCSBYahoo Cloud Serving Benchmarking Tool

References

  1. Lasi, H.; Fettke, P.; Kemper, H.-G.; Feld, T.; Hoffmann, M. Industry 4.0. Bus. Inf. Syst. Eng. (BISE) 2014, 6, 239–242. [Google Scholar] [CrossRef]
  2. Padovano, A.; Longo, F.; Nicoletti, L.; Mirabelli, G. A Digital Twin based Service Oriented Application for a 4.0 Knowledge Navigation in the Smart Factory. IFAC-PapersOnLine 2018, 51, 631–636. [Google Scholar] [CrossRef]
  3. Chen, B.; Wan, J.; Shu, L.; Li, P.; Mukherjee, M.; Yin, B. Smart Factory of Industry 4.0: Key Technologies, Application Case, and Challenges. IEEE Access 2018, 6, 6505–6519. [Google Scholar] [CrossRef]
  4. Hu, P. A System Architecture for Software-Defined Industrial Internet of Things. In Proceedings of the IEEE International Conference on Ubiquitous Wireless Broadband (ICUWB), Montreal, QC, Canada, 4–7 October 2015; pp. 1–5. [Google Scholar]
  5. Yue, X.; Cai, H.; Yan, H.; Zou, C.; Zhou, K. Cloud-Assisted Industrial Cyber-Physical Systems: An Insight. Microprocess. Microsyst. 2015, 39, 1262–1270. [Google Scholar] [CrossRef]
  6. Lee, J.; Bagheri, B.; Kao, H.A. A Cyber-Physical Systems architecture for Industry 4.0-based manufacturing systems. Manuf. Lett. 2015, 3, 18–23. [Google Scholar] [CrossRef]
  7. Alam, K.M.; El Saddik, A. C2PS: A Digital Twin Architecture Reference Model for the Cloud-Based Cyber-Physical Systems. IEEE Access 2017, 5, 2050–2062. [Google Scholar] [CrossRef]
  8. IIoT and Automation. Available online: https://www.punetechtrol.com/blogs/iiot-and-automation (accessed on 9 November 2021).
  9. Makris, A.; Tserpes, K.; Spiliopoulos, G.; Anagnostopoulos, D. Performance Evaluation of MongoDB and PostgreSQL for spatio-temporal data. In Proceedings of the EDBT/ICDT Workshops, Lisbon, Portugal, 26–29 March 2019. [Google Scholar]
  10. Daskevics, A.; Nikiforova, A. IoTSE-based open database vulnerability inspection in three Baltic countries: ShoBEVODSDT sees you. In Proceedings of the 8th International Conference on Internet of Things: Systems, Management and Security (IOTSMS), Gandia, Spain, 6–9 December 2021; pp. 1–8. [Google Scholar]
  11. Bad Actors Target MongoDB Databases, Threatening to Contact GDPR Legislators Unless Ransom Is Paid. Available online: https://www.bitdefender.com/blog/hotforsecurity/bad-actors-target-mongodb-databases-threatening-to-contact-gdpr-legislators-unless-ransom-is-paid/ (accessed on 15 March 2022).
  12. Mongodb. Available online: http://www.mongodb.com/ (accessed on 21 November 2021).
  13. Makris, A.; Tserpes, K.; Andronikou, V.; Anagnostopoulos, D. A Classification of NoSQL Data Stores Based on Key Design Characteristics. Procedia Comput. Sci. 2016, 97, 94–103. [Google Scholar] [CrossRef] [Green Version]
  14. Sharding. Available online: https://docs.mongodb.com/manual/sharding/ (accessed on 22 February 2022).
  15. Performance Benchmark POSTGRESQL/MONGODB. Available online: https://info.enterprisedb.com/rs/069-ALB-339/images/PostgreSQL_MongoDB_Benchmark-WhitepaperFinal.pdf (accessed on 22 November 2021).
  16. TimescaleDB. Available online: https://www.timescale.com/ (accessed on 26 November 2021).
  17. What Is Citus? Available online: https://docs.citusdata.com/en/v7.3/get_started/what_is_citus.html (accessed on 22 February 2022).
  18. Postgres, Pg-Stat-Statement. Available online: https://www.postgresql.org/docs/9.4/pgstatstatements.html (accessed on 26 November 2021).
  19. PostGIS. Available online: https://postgis.net/ (accessed on 26 November 2021).
  20. Docker. Available online: https://www.ibm.com/ae-en/cloud/learn/docker (accessed on 22 February 2022).
  21. Plugge, E.; Membrey, P.; Hawkins, T. The Definitive Guide to MongoDB: The NoSQL Database for Cloud and Desktop Computing, 1st ed.; Apress: New York, NY, USA, 2010. [Google Scholar]
  22. Matthew, N.; Stones, R. Beginning Databases with Postgresql: From Novice to Professional, 2nd ed.; Apress: Berkeley, CA, USA, 2005. [Google Scholar]
  23. Gkamas, T.; Karaiskos, V.; Kontogiannis, S. Evaluation of cloud databases as a service for Industrial IoT data. In Proceedings of the 7th International Congress on Information and Communication Technology (ICICT), London, UK, 21–24 February 2022. [Google Scholar]
  24. Rossman, G. New Benchmarks Show Postgres Dominating MongoDB in Varied Workloads. Available online: https://www.enterprisedb.com/news/new-benchmarks-show-postgres-dominating-mongodb-varied-workloads (accessed on 11 November 2021).
  25. OnGres. Available online: https://ongres.com/ (accessed on 26 November 2021).
  26. Comparing MongoDB vs. PostgreSQL. Available online: https://www.mongodb.com/compare/mongodb-postgresql (accessed on 11 November 2021).
  27. Martins, P.; Abbasi, M.; Sá, F. A study over NoSQL performance. In Proceedings of the 7th World Conference on Information Systems and Technologies, La Toja Island, Galicia, Spain, 16–19 April 2019; pp. 603–611. [Google Scholar]
  28. Martins, P.; Tomé, P.; Wanzeller, C.; Sá, F.; Abbasi, M. NoSQL Comparative Performance Study. In Proceedings of the 9th World Conference on Information Systems and Technologies, Terceira Island, Azores, Portugal, 30 March–2 April 2021; pp. 428–438. [Google Scholar]
  29. Seghier, N.B.; Kazar, O. Performance Benchmarking and Comparison of NoSQL Databases: Redis vs. MongoDB vs. Cassandra Using YCSB Tool. In Proceedings of the International Conference on Recent Advances in Mathematics and Informatics (ICRAMI), Tebessa, Algeria, 21–22 September 2021; pp. 1–6. [Google Scholar]
  30. SaaS vs. PaaS vs. IaaS: What’s The Difference & How to Choose. Available online: https://www.bmc.com/blogs/saas-vs-paas-vs-iaas-whats-the-difference-and-how-to-choose/ (accessed on 28 November 2021).
  31. Asiminidis, C.; Kokkonis, G.; Kontogiannis, S. Database Systems Performance Evaluation for IoT Applications. Int. J. Database Manag. Syst. 2018, 10, 1–14. [Google Scholar] [CrossRef]
  32. Mosquitto™ an Open Source MQTT Broker. Available online: https://mosquitto.org/ (accessed on 15 March 2022).
  33. Telegraf Open Source Server Agent. Available online: https://www.influxdata.com/time-series-platform/telegraf/ (accessed on 15 March 2022).
  34. InfluxDB: Open Source Time Series Database. Available online: https://www.influxdata.com/ (accessed on 15 March 2022).
  35. Grafana: The Open Observability Platform. Available online: https://grafana.com/ (accessed on 15 March 2022).
  36. Graphite. Available online: https://graphiteapp.org/ (accessed on 15 March 2022).
  37. Prometheus—Monitoring System & Time Series Database. Available online: https://prometheus.io/ (accessed on 15 March 2022).
  38. Elasticsearch. Available online: https://www.elastic.co/ (accessed on 15 March 2022).
Figure 1. Architecture of the proposed simulated infrastructure.
Information 13 00190 g001
Figure 2. DBMS Architecture of the proposed simulated infrastructure.
Information 13 00190 g002
Figure 3. CRUD Manager HMI.
Information 13 00190 g003
Figure 4. Stats Manager HMI. (a) RPM, shaft temperature and chassis temperature measurements. (b) Vibration measurements on the X, Y and Z axis.
Information 13 00190 g004
Figure 5. Assets Manager HMI.
Information 13 00190 g005
Table 1. Average of response time and throughput, jitter and failure in MongoDB, Postgres JSON and Relational PostgreSQL for the representative case of 10 K client throughput in the insert (Q1) case.
ScenariosDatabase TypeAverage Response
Time (s)
JitterFailure
(%)
Average Achieved
TP
NativeMongoDB0.1490.0440.00390
Post-JSON0.0950.0430.0002250
Post-Rel.0.1030.0460.00243
Two shardsMongoDB0.1850.1450.00332
Post-JSON0.1770.0420.00177
Post-Rel.0.1820.0430.00174
Four shardsMongoDB0.2100.0840.00279
Post-JSON0.1960.0510.00165
Post-Rel.0.1960.0520.00165
Six shardsMongoDB0.1800.0570.00320
Post-JSON0.2160.0610.00155
Post-Rel.0.2150.0560.00156
Eight shardsMongoDB0.1900.0690.00305
Post-JSON0.2320.0640.00148
Post-Rel.0.2310.0730.00149
Table 2. Average of response time and throughput, jitter and failure in MongoDB, Postgres JSON and Relational PostgreSQL for the representative case of 10 K client throughput in the select (Q2) case.
ScenariosDatabase TypeAverage Response
Time (s)
JitterFailure
(%)
Average Achieved
TP
NativeMongoDB4.281.330.0017
Post-JSON4.553.170.0012
Post-Rel.2.131.740.0023
Two shardsMongoDB5.691.800.0013
Post-JSON11.412.640.006
Post-Rel.6.781.580.0039
Four shardsMongoDB5.972.050.0013
Post-JSON12.493.920.0035
Post-Rel.7.471.420.008
Six shardsMongoDB5.882.140.0013
Post-JSON13.124.690.005
Post-Rel.7.461.760.008
Eight shardsMongoDB6.352.580.0012
Post-JSON13.906.240.005
Post-Rel.8.342.550.008
Table 3. Average of response time and throughput, jitter and failure in MongoDB, Postgres JSON and Relational PostgreSQL for the representative case of 10 K client throughput in the correlation (Q3) case.
ScenariosDatabase TypeAverage Response
Time (s)
JitterFailure
(%)
Average Achieved
TP
NativeMongoDB3.771.030.0016
Post-JSON5.051.290.0011
Post-Rel.0.930.230.0052
Two shardsMongoDB3.670.560.0016
Post-JSON6.721.450.008
Post-Rel.2.340.400.0021
Four shardsMongoDB3.510.700.0017
Post-JSON4.360.870.0012
Post-Rel.3.060.470.0016
Six shardsMongoDB3.560.490.0017
Post-JSON4.771.090.0012
Post-Rel.2.830.560.0017
Eight shardsMongoDB3.570.470.0017
Post-JSON4.331.050.0013
Post-Rel.3.470.510.0015
Table 4. Percentages of inferiority (+)/superiority (−) in terms of response time between MongoDB, as a baseline, and Relational Postgres.
ScenariosDistributed Strategy
Standalone2–4 Shards6–8 Shards
Q1−45%−2% to −7%+20% to +22%
Q2−101%+19% to +25%+27% to +31%
Q3−305%−57% to −15%−26% to −3%
Table 5. Suggested database schemes depending on low, or high burstness categorization, where one concentrator produces 10 sensor measurements per second. The first choice is written in bold, and the second in italic.
ScenariosBurstness
LOWHIGH
(Up to 100 Concentrators/1 K QPS)(500–1 K Concentrators/5 K–10 K QPS)
Standalone Rel. Postgres6-shards MongoDB
Q1oror
Standalone Postgres JSON6-shards Rel. Postgres
Standalone Rel. Postgres8-shards MongoDB
Q2oror
2-shards MongoDB6-shards MongoDB
Standalone Rel. Postgres8-shards Rel. Postgres
Q3oror
2-shards Rel. Postgres8-shards MongoDB
Publisher’s Note: MDPI stays neutral with regard to jurisdictional claims in published maps and institutional affiliations.

