Article

User Experience of 5G Video Services in Indonesia: Predictions Based on a Structural Equation Model

by
Raden Deiny Mardian
,
Muhammad Suryanegara
and
Kalamullah Ramli
*
Department of Electrical Engineering, Universitas Indonesia, Depok 16424, Indonesia
*
Author to whom correspondence should be addressed.
Information 2022, 13(3), 155; https://doi.org/10.3390/info13030155
Submission received: 10 January 2022 / Revised: 12 March 2022 / Accepted: 13 March 2022 / Published: 17 March 2022
(This article belongs to the Section Wireless Technologies)

Abstract

:
The advent of 5G has created an expectation for the provision of a much better user experience (UX) for utilising video streaming services. However, apart from quality, there are many other factors believed to influence users’ experiences of video streaming services in the era of 5G. The question then arises: what will determine the UX of streaming video services in the 5G era? This study aimed to discover what factors would influence 5G UX by using a conceptual framework involving measures of users’ predictive judgements of 5G combined with users’ measurements of current 4G UX, considering that there is no specific standard for measuring UX. Our case study is Indonesia, the world’s fourth-largest market, so the predictions may later become a reference for the priorities of implementing 5G technology. Our conceptual framework utilised the structural equation model (SEM) approach, based on the primary data of a 254-respondent sample of the Indonesian market. The questionnaire assessed 10 factors of user experience, ranging from service attractiveness to economic-related aspects. The results imply that the current user’s experience of 4G has an effect with a significance value of 0.42 to their later experience when accessing 5G video services. It means that many users will continue to use 4G for video streaming and still need tangible evidence of 5G. Among the 10 factors, a satisfaction value of 0.72 in 4G technology and perspicuity of 0.81 in 5G are the highest correlations. These factors are the most influential for video service experience.

1. Introduction

Since the advent of 4G technology, video streaming has become one of the most popular services available. This service includes popular platforms such as YouTube, Netflix, and even Zoom (the multimedia video conference tool). Video streaming has been accessed by 77% of internet users, and of that percentage, around 55% enjoy video streaming via mobile or mobile services [1]. When we relate this fact to 5G, we understand that 5G should bring an advancement to video streaming and therefore bring a significant impact to the market. The video quality of 5G is believed to be much better. However, apart from quality, there are many other factors believed to determine successful user adoption of such services. This is why measuring user experience (UX) is so important. UX is defined as things that refer to the feelings experienced by users when interacting with products, applications, systems, or services [2]. Interactivity, product feel, and the ability to serve and achieve goals, in this case, in the form of video streaming on 5G technology, are some of the main experiences that define user experiences [3].
The presence of new 5G technology raises the question of what will determine the UX of video streaming services during the era of 5G. This paper tries to answer this question by focusing on the case of Indonesia. The country is essential to this discussion as it is the world’s fourth-largest market and is typified by a large and diverse market [4,5,6]. Indonesia has around 111.43 million video streaming users among its 202.6 million internet users.
To answer the research question, we developed a framework that identifies UX video streaming measurement of 5G based on users’ predictive judgements combined with users’ measurements of current UX of 4G.
Although ISO 9241-210:2010 has provided a standard for measuring the usability of a feature or technology by its users, there is no specific standard for measuring UX yet [7,8,9]. In contrast, UX itself looks at the overall interaction of the user with a feature or technology [10]. Therefore, in this study, a UX measurement approach was carried out through a user survey of streaming video features on 4G technology, which was then linked to predictions of feature usage on 5G technology. The survey was conducted on a sample of the Indonesian market. The questionnaire respondents are streaming video users with 4G technology because there is no user experience with 5G technology commercially. This condition is a challenge in this research because it is necessary to create a statistical analysis model that can describe the predictive experience of 5G technology users through the results of a UX survey on 4G technology.
Using this framework, we built a structural equation model (SEM), to link both UX valuations of 4G and predictions of 5G. We defined 10 factors that define the UX of video streaming, ranging from the attractiveness of the service to economic-related issues. The SEM that allows the simultaneous testing shows the level of relationship or correlation values of the 10 factors. This structural model is an approach to provide a numerical value and not only shows the correlation value between technologies but also shows the influence of the factors that make up UX on each technology.
Why is it significant to assess the UX of 5G video streaming? We highlighted in [11] that UX, together with quality of service (QoS), is an important factor for forming a complete quality of experience (QoE) analysis. Understanding the UX of a technology means understanding users’ perceptions, which builds an understanding of how users’ value their experience regarding the technology being adopted. To win the competitive market in the 5G era, any service operators should ensure the fulfilment of QoE as this metric likely reflects users’ satisfaction when accessing a technology.
The contribution of our research is that it can be used as a reference for any service operator who launches video streaming services during the 5G era. It also indicates which factors take priority for being addressed to win in the competitive market.
This paper is further structured as follows: Section 2 discusses the demographics of Indonesian video streaming users, the development of 5G technology in Indonesia, and the concept of UX elements as part of QoE of 5G technology; Section 3 describes methods for data collection and data processing models with the proposed model approach; Section 4 discusses the results of data processing, implications, and implementation priorities based on modelling; the last part in Section 5 is the conclusion.

2. Underlying Studies and Theories

2.1. 5G in Indonesia

According to the ITU-RM.0283-02 recommendation from the International Telecommunication Union (ITU), the speed of 5G technology is around 20 Gbps and the latency is only 1 ms. Besides the technical side, 5G technology demands increased affordability and transformation of the user experience that provides innovation and solutions [12,13]. The launch of 5G technology to be used commercially has been starting in several countries since 2019. For example, commercial launches in several countries have taken place, including in South Korea in 2019 and Turkey in 2020 [14,15].
In Indonesia, 5G was only launched officially by a cellular operator in May 2021 [16]; however, 5G technology has been tested in Indonesia since 2018. The height of this was during the 2018 Asian Games, when two major cellular operators in Indonesia provided the public with the opportunity to participate in testing the advantages of 5G technology [17,18]. In May 2021, the commercial use of new 5G technology began through two major operators in Indonesia, although it was technically still superimposed on the infrastructure of 4G technology. Conditions that are still early mean that data on the existence of 5G technology customers in Indonesia cannot be obtained; in other words, the service is available but does not have commercial customers [19]. For the development of 5G infrastructure, Indonesia is considering placing 5G on the radio spectrum frequency, including using the mid-band of the 3.5 GHz and 2.3 GHz spectrum because it can cover a wide geographical area and provide a more efficient platform to serve urban and suburban areas [5]. The frequency of 3.5 GHz is currently used by satellite communications, but this is planned to be shifted to another frequency to support 5G communications.
Regarding the number and distribution of mobile video streaming users in Indonesia, in January 2021, statistical data indicated that Indonesia has a population of 275 million, of which around 40.52% or 111.43 million are mobile video streaming users [20]. In terms of demographics, about 60% of Indonesia’s population resides on the island of Java, followed by 20% on the island of Sumatera, 7% on the island of Sulawesi, 6% on the island of Kalimantan, 4% on the islands of Nusa Tenggara, and 3% on the islands of Maluku and Papua [5]. Urban areas are home to 57% of Indonesia’s population, while 43% of the population lives in rural areas.

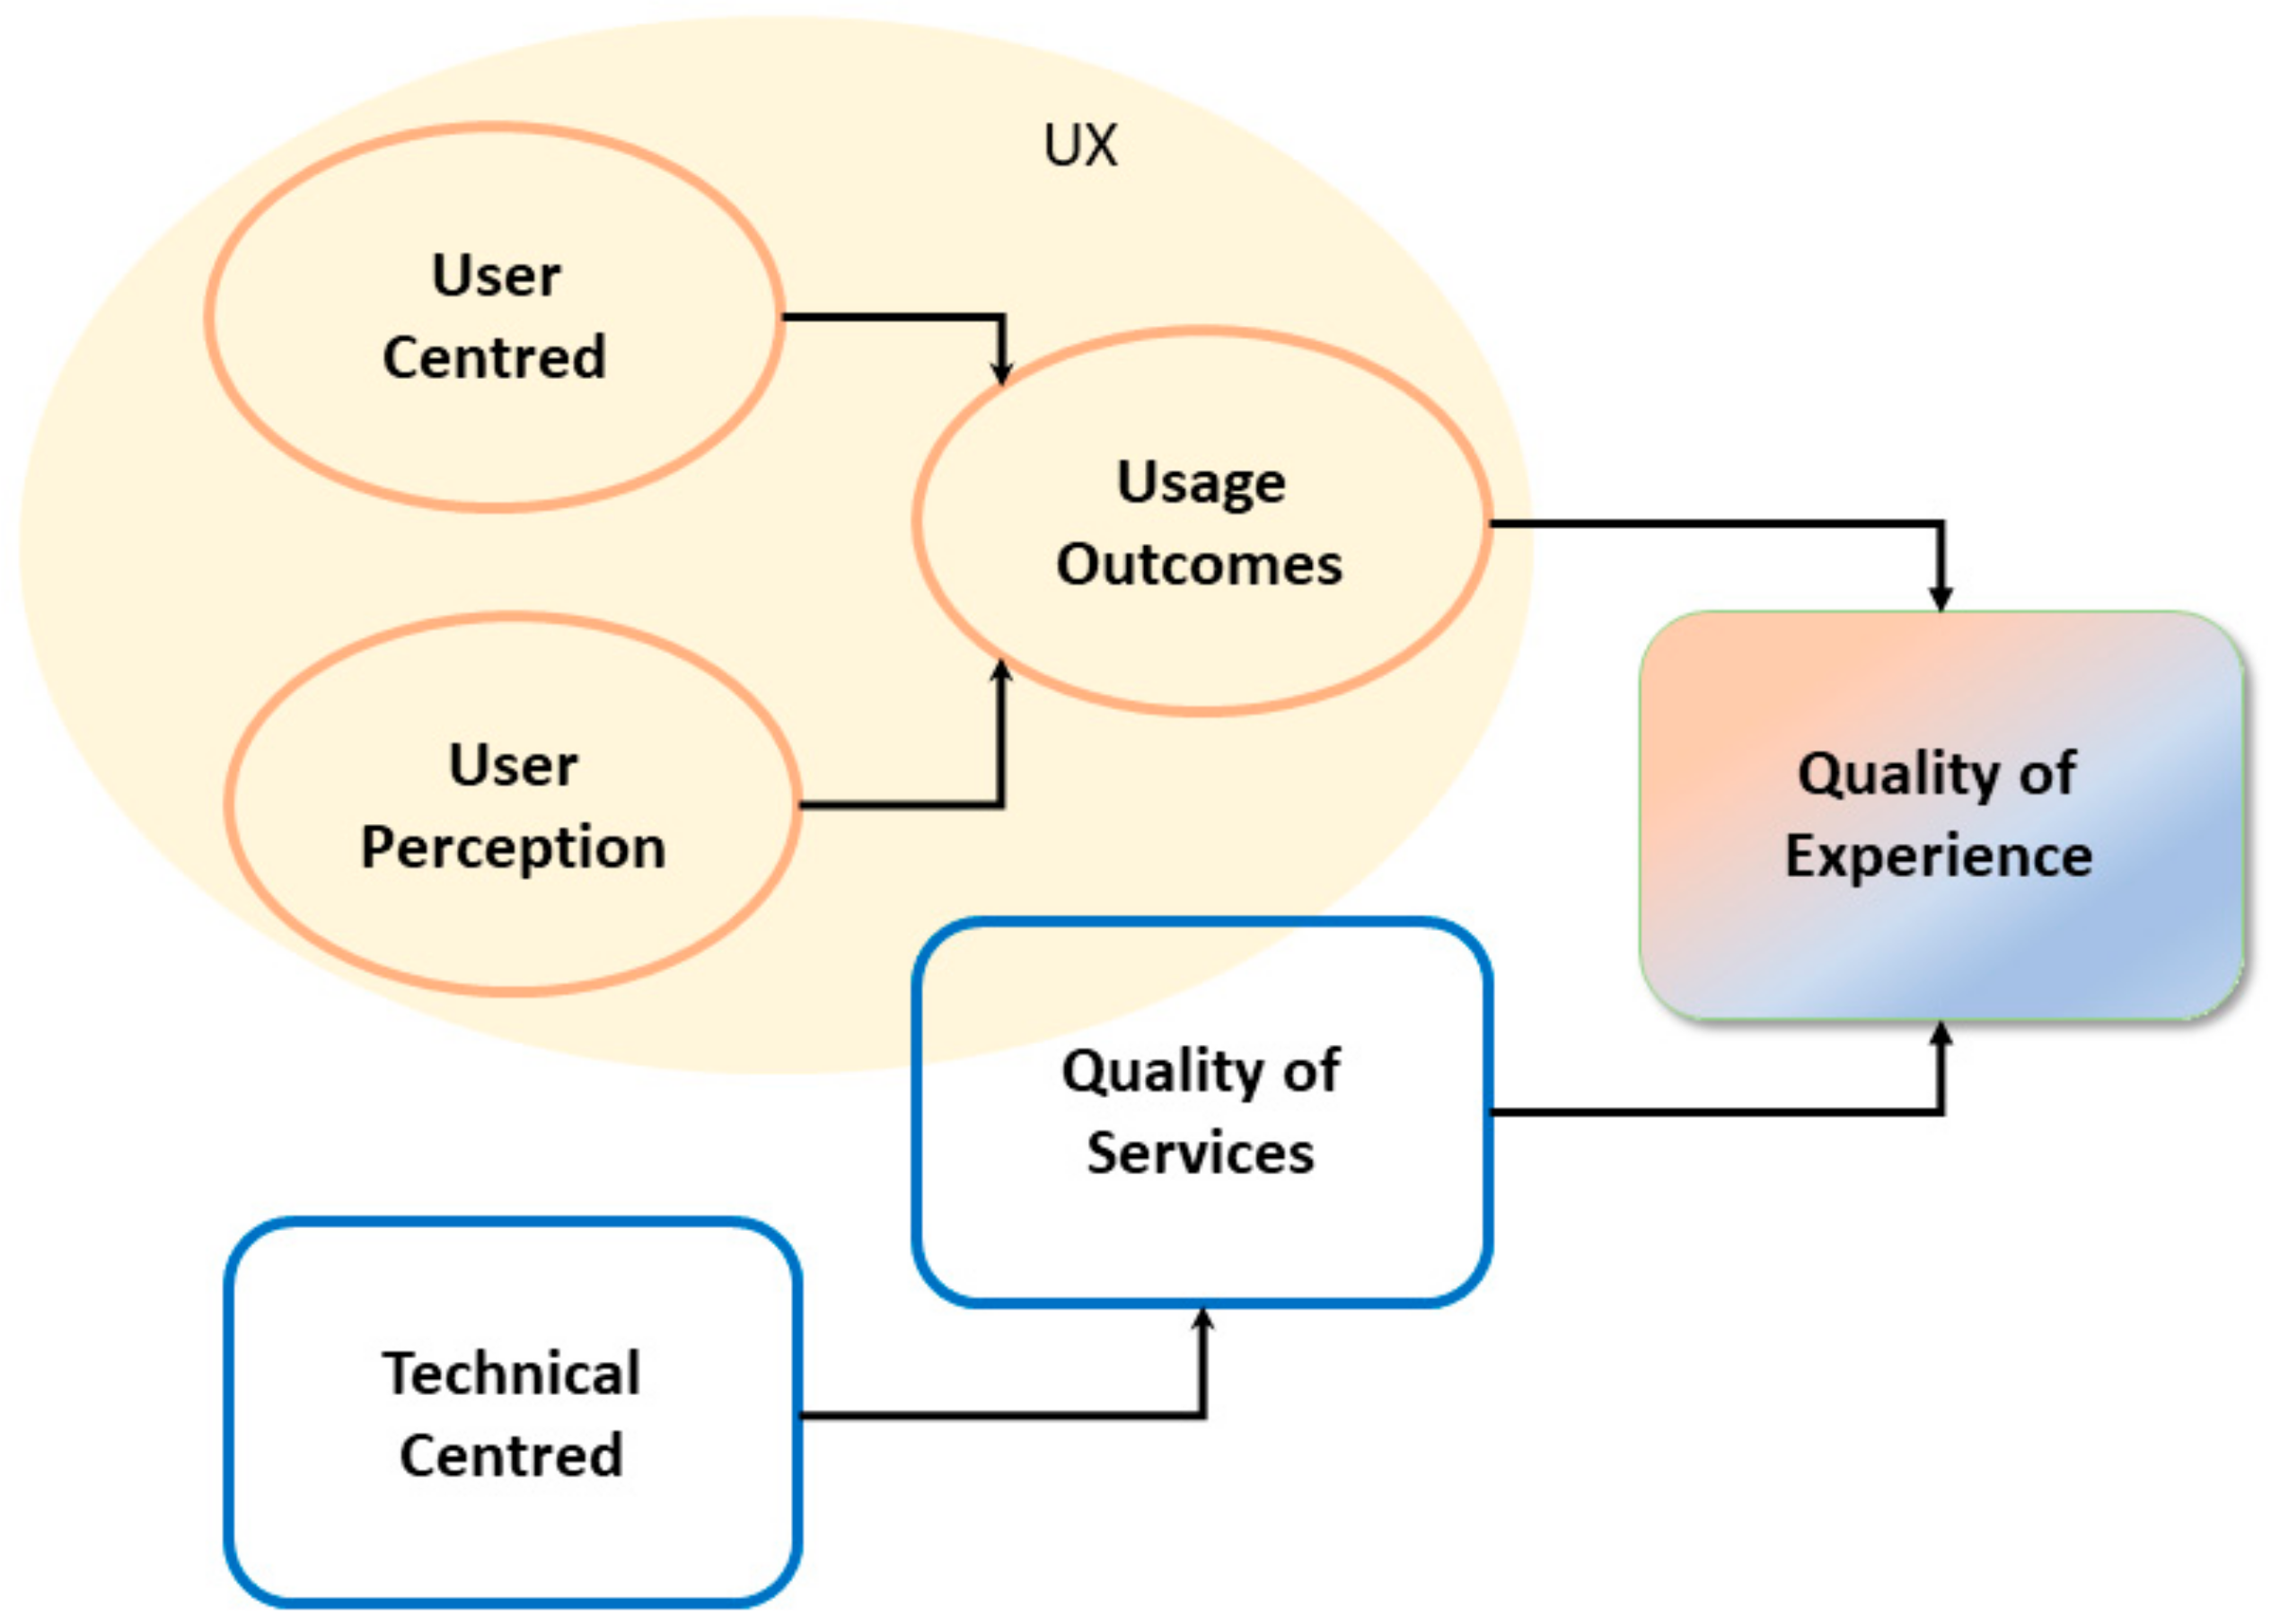
2.2. User Experience and QoE on 5G Technology

The perspective of QoE can be formulated by combining QoS and UX. Combining factors of UX as part of QoE together with QoS is further discussed in [11]. Although the QoS factor from the technical side is still considered vital, alone, it is not enough to show the satisfaction value of service users. QoS factors such as delay, jitter, loss, error, speed, and good bandwidth do not necessarily result in a high QoE value because there are additional satisfaction factors associated with users that are very subjective, diverse, and unpredictable [4,21], and these also affect UX. Moreover, QoE is not limited to the technology itself but is embedded and becomes active during the interaction between the user and the technology [5].
If we look at Figure 1, it can be seen that QoE is formed from two aspects: QoS and UX. The QoS factors are related to the technical factors of a technology, such as delay, jitter, loss, error, speed, bandwidth, etc. Meanwhile, the UX factors are related to users’ perspectives, such as the basic factors mentioned in [22], which mainly include attractiveness (overall impression: do users like or dislike the product?), perspicuity (is it easy to recognize and learn how to use the product?), efficiency (can users complete their tasks without extra effort?), dependency (does the user frequently use the product?), stimulation (is it exciting and motivating to use the product?), and novelty (is the product innovative and creative? Does the product interest users?).
These six basic UX factors can also be further developed by looking at UX as a “human factor”—that is, an element of subjectivity. Related to our case of video streaming for 5G, we further elaborate these six basic factors into 10 factors to be assessed in this research, as discussed in Section 3.

2.3. Structural Equation Modelling

The concept model used in this study is the structural equation model (SEM). SEM is a set of statistical techniques that allow the simultaneous testing of a relatively complex set of relationships. In addition, the SEM method can also identify the dimensions of a concept and simultaneously measure the effects of the relationship of each factor for which dimensions are identified [23,24,25].
This SEM analysis supports a low sample size in anticipation of a low number of respondents as a result of surveys being related to a new technology that has not yet seen its full implementation. The virtue of SEM is that the construction of the model can be estimated, and the correlation values can be measured along with measuring the validity of the model and the variables in it simultaneously.
Based on the concept of the SEM model, it is necessary to have latent variables in order to see the value of their influence on factors that become the measurements for each of these latent variables.

2.4. Previous Studies

Much research related to measurement and efforts to obtain a good QoE has been previously carried out. In [25], a survey related to QoE on good internet Wi-Fi was conducted to measure the level of customer loyalty using SEM analysis. However, this study has not demonstrated user predictions and is limited to specific subjectivity and preferences. In [26,27,28,29], various methods were carried out to measure QoE in video streaming services, starting with measuring data bitrates and creating special measuring tools for traffic, theoretical approaches, and data retrieval through testbed applications in Europe related to video streaming performance parameters. These approaches indeed show several results to assess QoE, which still leads to improvements for existing networks and does not refer to predictions on 5G technology. In [30], modelling with a neural network was used as a predictive model for QoE video streaming. In [31,32], various ways to obtain predictions of good QoE results were presented through various observations, including data management, network settings, and applications related to video streaming services. However, both studies used computer network media that were already available and not on cellular networks and did not include user preferences. Besides [25], there are [33,34,35] studies that also use survey methods for data collection and SEM in their analysis. These three studies also attempted to approach predictions and find the value of user satisfaction. The scope of these studies was loyalty from the emotional attachment of mobile gaming users and strategies for mobile banking users.
Table 1 summarises the four previous studies that utilize the SEM method, and presents their scopes which distinguish them from our research.
There are fundamental differences between this study and the other studies. The first difference is the research focus on predictions about 5G video streaming in Indonesia. Second, this research focuses specifically on UX as an element of QoE. Third, while there is a correlation approach as in [23,24,25], this study has a simpler construction for the novelty. Finally, in this study, novelty is used as a reference in the implementation of 5G technology in Indonesia, especially to identify the priorities that need to be considered from the UX side regarding the transition of video streaming users from 4G to 5G technology and its factors.

3. Methods

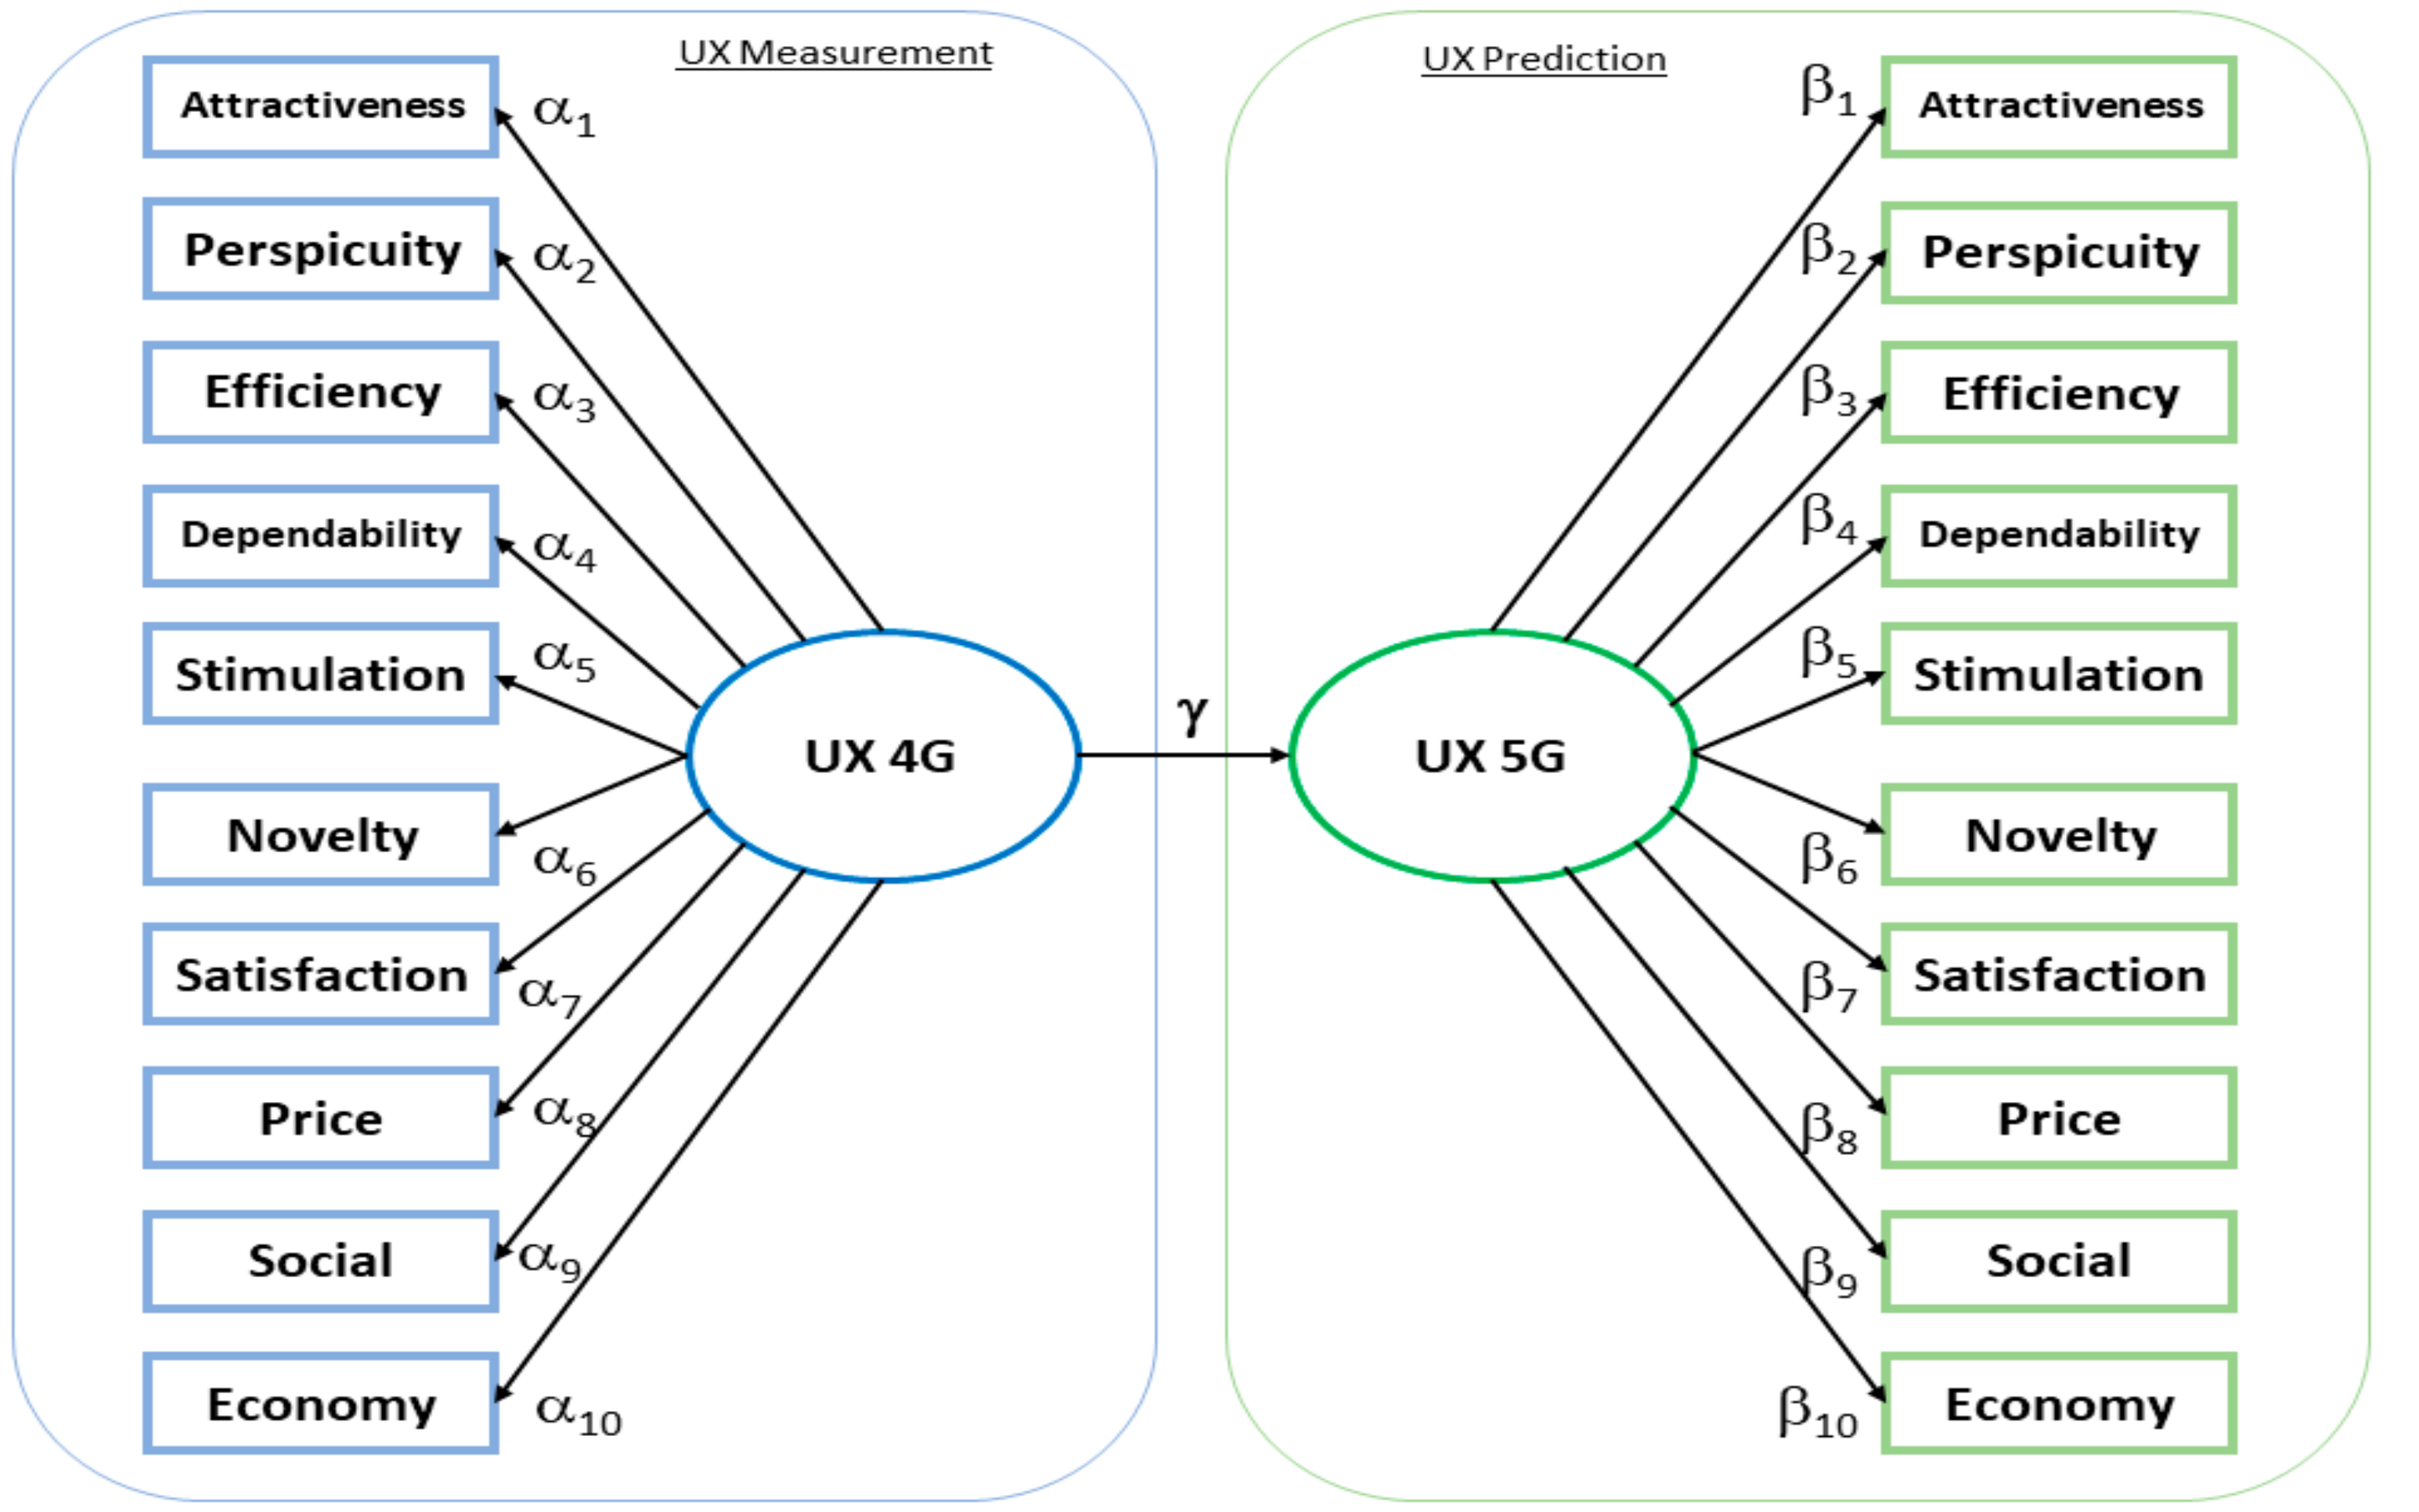
3.1. Conceptual Framework

We propose a conceptual framework based on the SEM approach. SEM is used to obtain the correlation value or influence from the direct experience of streaming video users. This correlation value is used to assume factors that organizers or regulators must prioritize to obtain a UX picture that meets user desires in 5G implementation in Indonesia, especially for video streaming features. The SEM approach can be seen in Figure 2. What needs to be emphasized from this concept is that 5G UX measurement is based on user predictive judgments combined with user measurements on current 4G UX. The predictive assessment was carried out because, as mentioned, even though it already exists in Indonesia, to be precise, it has just been launched, but 5G services do not yet have commercial customers/users, especially for the use of video streaming. There are, therefore, two variables, namely the “4G UX measurement” and the “5G UX measurement”, and each is measured with ten factors. The ten factors include the six basic factors of UX, to which four additional factors have been added.
The correlation value of the ten factors on the UX 4G factor is denoted by α, and the 5G UX factor by β. The overall correlation value or influence between UX 4G and UX 5G is denoted by γ. Figure 2 symbolises the correlation of the overall user experience of the 4G network with the predictions for the user experience of the 5G network.

3.2. The 10 Factors

The determination of which factors to use to obtain data in this study was a matter of user experience relevance on video streaming features. Basically, there are six factors of UX, namely attractiveness, convenience, efficiency, dependability, stimulation, and novelty [22]. Even though there are only six UX factors, this is not a closed set, and it is possible to add other factors, considering the human factor and the subjective element of UX itself. In this study, four other factors were added, namely satisfaction, price, social aspects, and economic aspects. Both the 4G UX measurements and predictions about 5G UX will refer to these 10 factors. An explanation of the meaning of the correlation of the 10 factors in Figure 2 is given below.

3.2.1. Factor #1: Attractiveness

This factor shows the attractiveness that the video streaming feature gives to its users. This is related to the UX that makes users interested in watching streaming videos via mobile networks.
α1 represents the correlation obtained from the measurement of how attracted the user is to watching streaming videos over the 4G network, while β1 symbolizes the correlation obtained from the predicted influence of the attractiveness of streaming videos using the new 5G network.

3.2.2. Factor #2: Perspicuity

Perspicuity, or ease, is a factor that describes the level of ease for users in accessing and controlling video streaming features on their mobile devices.
In this factor, α2 represents the correlation of how easy it is for users to watch videos through devices on a 4G network, while β2 symbolizes the correlation of convenience that prospective users of streaming videos expect when using the new 5G.

3.2.3. Factor #3: Efficiency

Efficiency is a factor related to how fast the smoothness (uninterruptedness and buffering conditions) of streaming video broadcasts through the mobile device used is enjoyed by the user.
The efficiency factor is denoted by α3 as the correlation of the smoothness level when watching streaming videos via mobile devices on a 4G network, and the smoothness prediction of watching streaming videos on devices with 5G mobile networks is denoted by β3.

3.2.4. Factor #4: Dependability

The fourth factor is dependability, or how often video streaming on mobile devices is used as a medium to find information or entertainment.
α4 represents the correlation of this dependability factor through the measurement of the frequency with which users watch streaming videos over the 4G network, while β4 represents the predicted correlation of the frequency of watching streaming videos over the 5G network.

3.2.5. Factor #5: Stimulation

Stimulation is a factor that measures desire for the addition of new features or even new devices for video streaming with mobile networks as part of the user experience.
The correlation in this factor is denoted by α5 and indicates the effect of the stimulus of adding new features to video streaming over the 4G network. β5 symbolizes the predicted effect of a stimulus in the form of replacing an old device with a new one to watch streaming videos on the 5G network.

3.2.6. Factor #6: Novelty

Novelty measures the amount of novelty provided by video streaming features to users. The novelty factor that is meant here is an increase in watching or using video streaming features on the mobile network.
The correlation measurement of the effect of increasing technology, or novelty, from 4G networks compared to previous technologies for video streaming is denoted by α6, while the prediction of the effect of increasing to 5G technology compared to current technology for video streaming is denoted by β6.

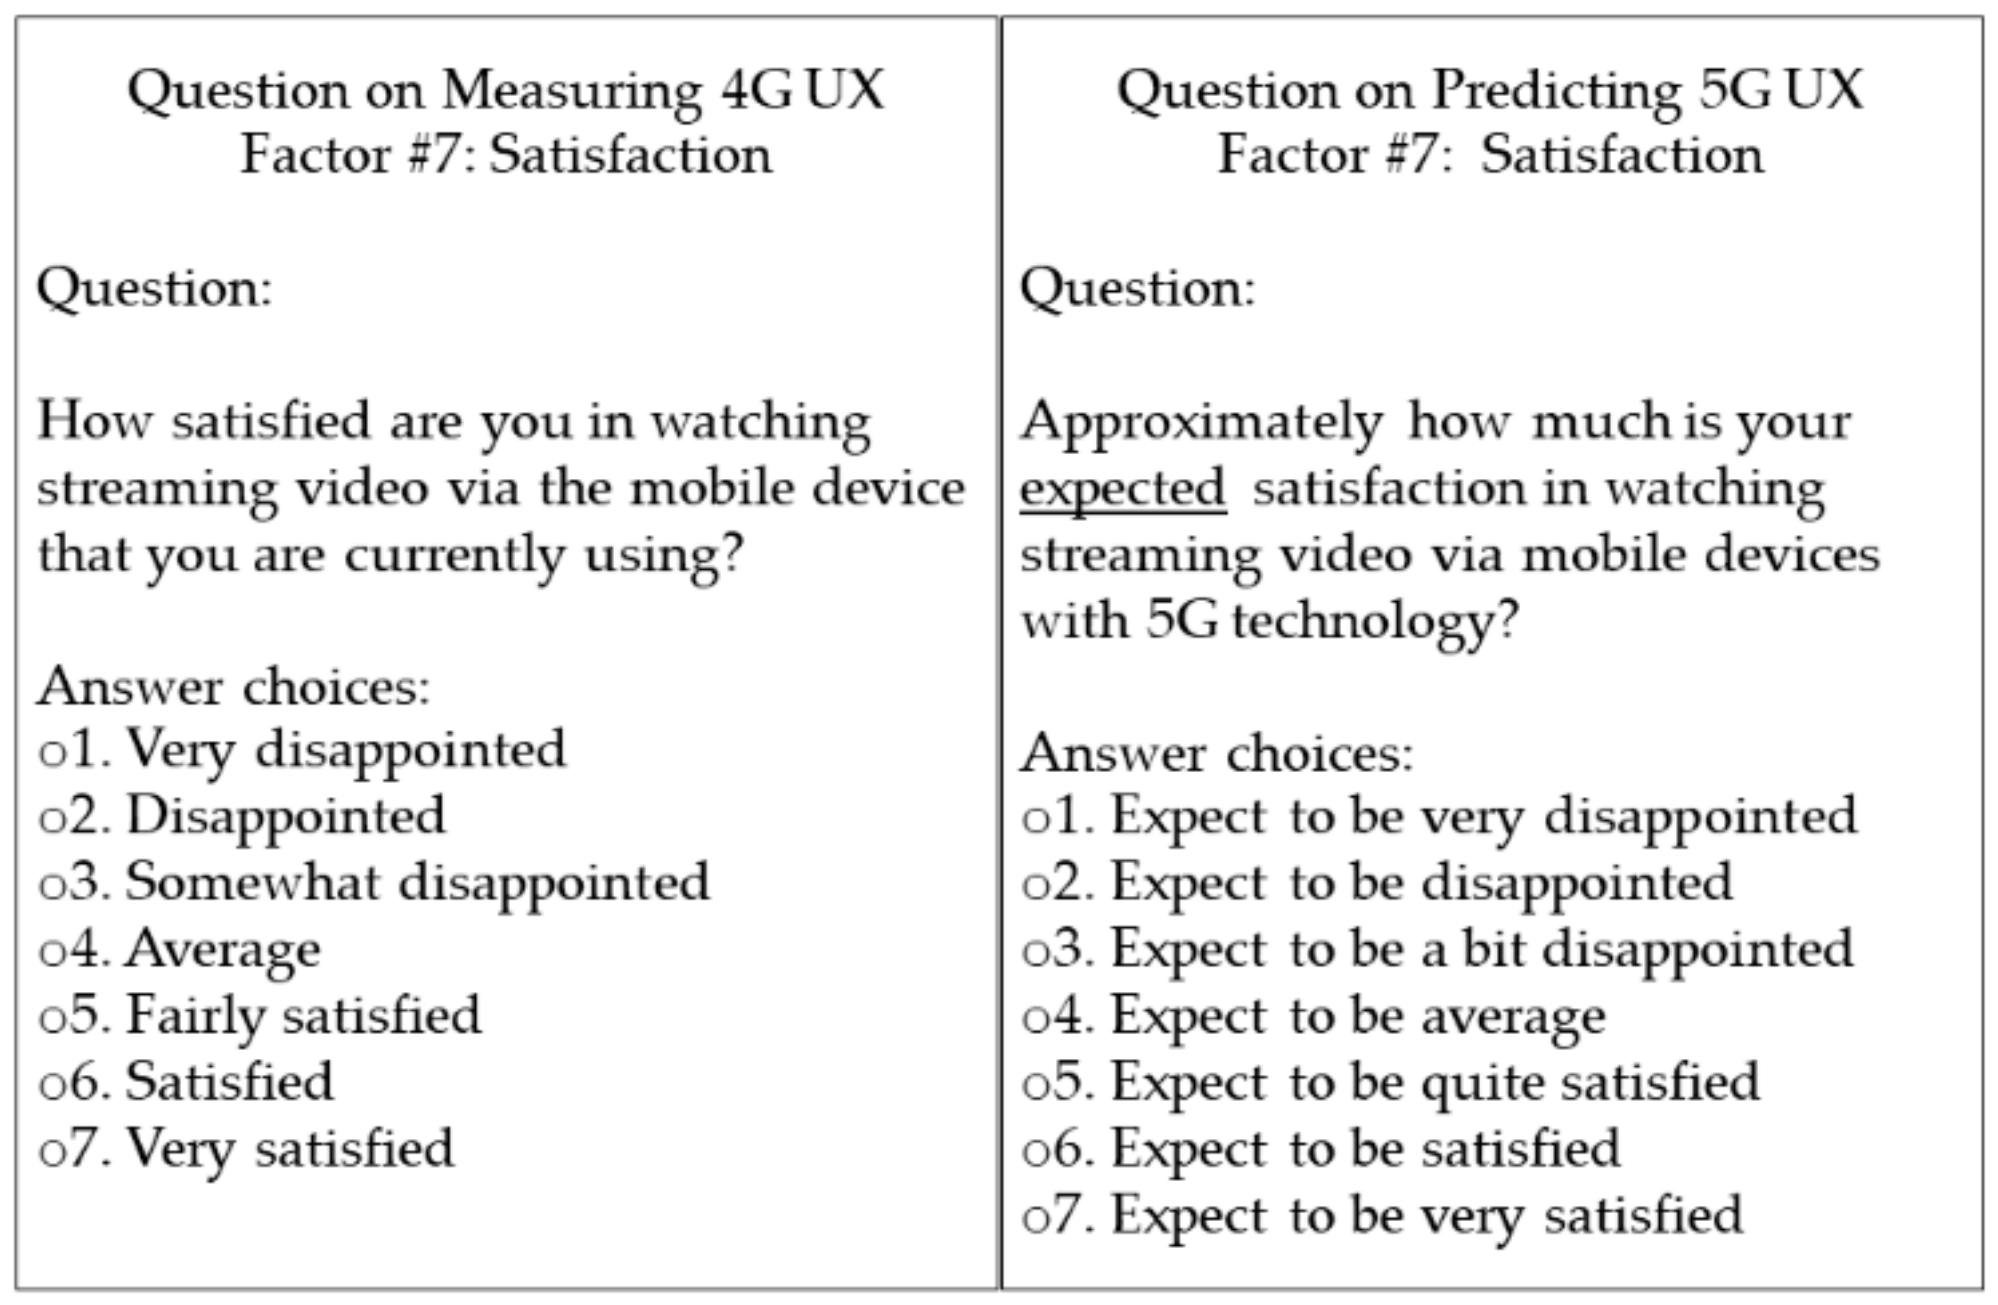
3.2.7. Factor #7: Satisfaction

Satisfaction is a factor related to UX, both technically and in terms of the content accessed through using video streaming as a medium of information and entertainment on mobile devices.
The satisfaction factor is symbolized by α7 and is the result of measuring the level of satisfaction of users both on technical aspects and on their streaming video content via mobile devices on a 4G network. β7 is a prediction of the level of UX related to both the technical side and content of streaming videos on devices with 5G mobile networks.

3.2.8. Factor #8: Price

The eighth factor, price, shows the correlation of users’ willingness to pay the price of a new technology that will increase UX when watching streaming videos.
α8 symbolizes the correlation effect of the measurement of users’ willingness to pay the price of new features to watch streaming videos over the 4G network, while β8 symbolizes the predicted correlation of the influence of users’ willingness to pay for new technology when using 5G technology to watch streaming videos.

3.2.9. Factor #9: Social

The social factor is a measure of social estrangement due to focusing on video streaming. This factor represents the common occurrence of users of mobile devices being so focused on their device and its features that they do not care about their surroundings, causing distance or estrangement from their environment.
The correlation of the effect on this factor is denoted by α9 and is a measure of the social estrangement of users of video streaming features over the 4G network. β9 symbolizes the prediction of the influence of social estrangement when watching streaming videos on the 5G network.

3.2.10. Factor #10: Economy

The economic factor as part of the user experience is the influence of video streaming as a medium for promotion, online shopping or other independent economic activities that can be carried out via a mobile device.
The correlation measurement of the influence of economic aspects through mobile video streaming with the 4G network is denoted by α10, while the prediction of the influence of economic aspects through using mobile video streaming with 5G technology is denoted by β10.

3.3. Hypothesis and Survey

The correlation values obtained become the interpretation of the final results of this study. The correlation values reflect the influence between the variables regarding UX 4G and UX 5G, denoted by γ, and the influence of the 10 factors denoted by α and β. The hypotheses of this study are:
Hypotheses 0 (H0).
There is no influence between the variables of UX 4G and UX 5G and the related 10 factors.
Hypotheses 1 (H1).
There is an influence between the variables of UX 4G and UX 5G and the related 10 factors.
A survey method in the form of a questionnaire was carried out directly with users for the purpose of data collection. This questionnaire was also made based on the User Experience Questionnaire method [22]. The respondents to the questionnaire are users of video streaming with 4G technology since there has not been any user experience with 5G technology commercially. This condition poses a challenge in this study to create a statistical analysis model that can describe the effect of UX on 5G technology through the results of UX surveys on 4G technology.
We conducted a survey on the Indonesian market in the form of a questionnaire for respondents. The main questions were arranged on a seven-point Likert scale. The seven-point Likert scale is also known as the Hedonic scale [36,37]. The Hedonic scale is generally used to fill out surveys related to consumer goods. The assumption is that video streaming on 4G technology has become a daily product and that this will also happen to 5G technology in the future. In order to ensure the validity of the questionnaire responses, the target number of respondents was five to ten times the number of main questions [38].
Figure 3 is an example of the questionnaire asking respondents about Factor #7: Satisfaction.
After meeting the validation and reliability requirements, the questionnaire was distributed to a wide range of respondents, who were users of video streaming on 4G in Indonesia. The results of the responses were processed with an SEM analysis made with a construction model. This survey was conducted over a period of two months, in January and February 2021. The distribution of the questionnaire was carried out via a generated link from the Google Form where the questionnaire was made. The link was repeatedly distributed through social media so that it could reach a broad range of potential respondents. The convenience of using the Google Form meant that the results of the questionnaires submitted by respondents were automatically recorded by Google Forms so that the results could be downloaded and processed.
After running the survey for two months, valid results were obtained from respondents throughout Indonesia with 254 samples. The number of respondents exceeded the minimum limit of 100 to 200 respondents for 20 questions, five to ten times the number of questions [38]. Following the material and research objectives, all respondents were video streaming users. The ages of the largest percentage of respondents, 43%, ranged from 31 to 45; this was followed by respondents aged 21–30 years at 34.7%. Males provided the most responses at 53.3%. In terms of employment status, respondents from the private sector made up the majority of respondents (47.9%), while for the level of education, respondents with an undergraduate degree made up the highest percentage of respondents (58.3%).

3.4. Processing and Interpretation of the Results

Through data processing with SEM, the construction of the concept model and the factors were checked first. Examination of the construction of this model is called the Goodness of Fit Index (GFI). The GFI value is guided by the range from 0 to 1, where the higher the value obtained, the better the suitability of the model construction. In addition to the GFI value, the results of the SEM processing analysis for the two variables with a total of 20 factors also require a minimum validity value of 0.32 and a reliability value above 0.6 [39].
The results of the SEM processing obtained a GFI value of 0.75 from the range 0–1. The validity value of the factor was between 0.52 and 0.85, which means all factors were valid. Meanwhile, the reliability value obtained was 0.86, which means this value was above the required 0.6. From these results, the construction of this model is considered to meet the requirements for use in measurement and analysis [40,41].
The correlation values in this model are denoted by α, β, and γ, where α1–α10 is the correlation between the measurement of video streaming user experience on the 4G network (UX 4G) with its 10 factors, β1–β10 is the correlation between the predicted user experiences of streaming videos on the 5G network (UX 5G) with its 10 factors, and γ is the correlation between UX 4G variables and UX 5G variables related to user experience in streaming video.
The α and β values in SEM are mathematically obtained with the following basic equations [38]:
α = λnq ξ + δ
and
β = λmp µ + ε
where α is the correlation value of the exogenous 4G indicator to its factors, λnq is an exogenous manifest indicator, ξ is an exogenous variable, and δ is an exogenous error factor. Meanwhile, β is the correlation value of the endogenous 5G indicator to its factors, λmp is an endogenous manifest indicator, µ is an endogenous variable, and ε is an endogenous error factor.

4. Analysis

4.1. The Results

With the results of 254 respondents which exceeded the minimum number of respondents and the results of the SEM analysis, Table 2 shows the results of correlation values α, β, and γ that affect the UX of 4G as variable to the UX of 5G, as well as the correlation values between the variables and their factors.
The correlation values listed in Table 2 are then visualized through the comparison chart in Figure 4 below.
From the comparison chart in Figure 4, the high and low correlation values for each factor in each technology were clear, both for existing 4G and predictions for 5G. The factors with the highest correlation in each technology were given an asterisk.
When we compare the results with previous studies in [25,33,34,35], it is clear that the results have reflected more factors of user experience. Concerning 5G video streaming, the additional factors that we proposed may provide a more comprehensive understanding of what will influence the prospective 5G market in a country.
The analysis of each factor is presented in the following subsection.

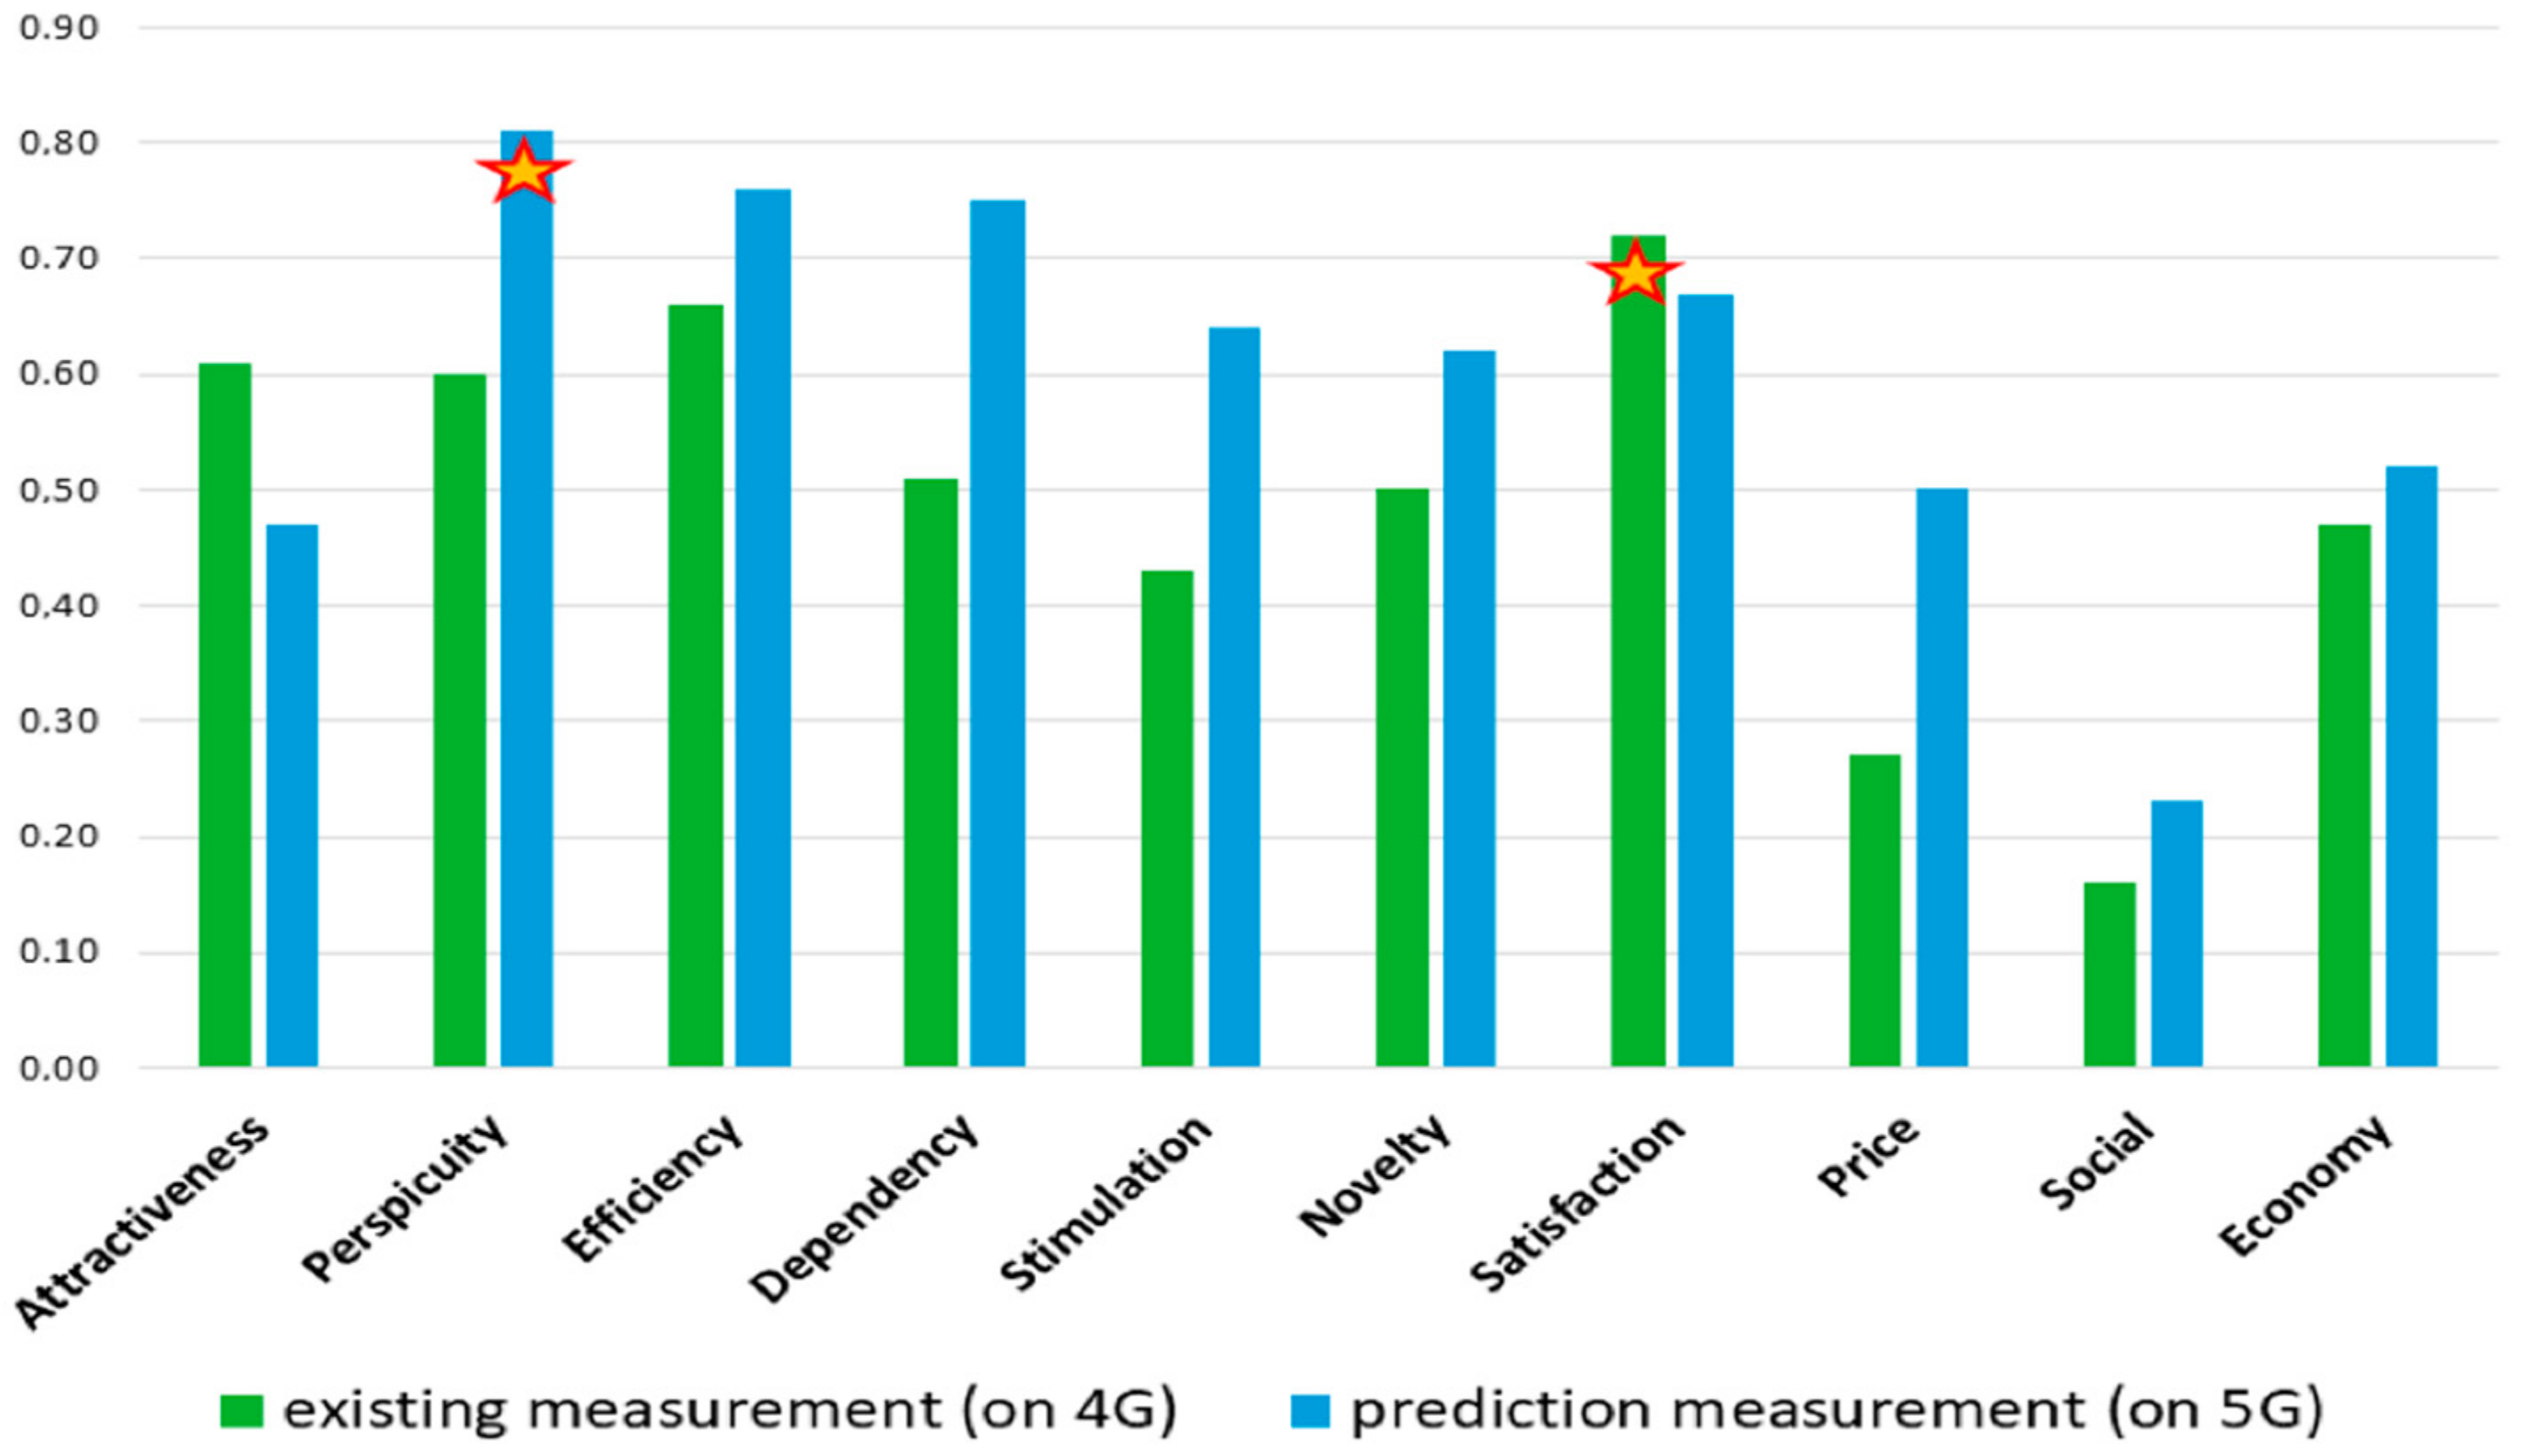
4.1.1. Correlation Value Analysis of α and β

Factor #1: Attractiveness

The significance value of the influence given by attraction to 4G is α1 = 0.61, while β1 = 0.47 is the significance value for 5G. In this case, the video streaming feature with 4G technology still provides a higher appeal compared to using 5G technology that is still a prediction. It can also be assumed that users are satisfied with video streaming on 4G and have not felt the need for newer technology.

Factor #2: Perspicuity

Perspicuity is the level of ease for users in dealing with a device or technology. The significance of this measure of convenience gives the greatest value to 5G technology compared to 4G, namely β2 = 0.81 compared to α2 = 0.6, which is the largest significance of all factors for UX 5G. This can be interpreted as meaning that users have a high expectation that with newer technology the level of convenience will be greatly increased. However, the 4G technology used today also provided a result greater than 50%, which means it has provided high convenience for users.

Factor #3: Efficiency

The same as for perspicuity, the significance value for efficiency in 5G of β3 = 0.76 is greater than that of 4G at α3 = 0.66. Efficiency in the UX assessment of video streaming is judged by the smooth running of the video broadcast so that there are no buffering conditions or interrupted broadcasts. In this regard, user expectations for the efficiency of 5G technology look quite large.

Factor #4: Dependability

The benefits of doing activities on a mobile basis have increased as technology has advanced; there were also pandemic conditions when the survey data were taken, leading to a large significance value for 5G technology in this factor: β4 = 0.75. In contrast, the significance of 4G technology for the dependability value is α4 = 0.51. The difference is clear, similar to the levels of convenience and efficiency; this shows that users have high expectations to be increasingly able to use mobile video streaming as a daily activity.

Factor #5: Stimulation

This stimulus-related assessment measures how a new feature or device changes users’ enjoyment of streaming videos. From the survey results, the stimulus significance value for 4G technology is α5 = 0.43 and is β5 = 0.64 for 5G technology. Through this value, it appears that stimulus is in the form of a new device with new technology, in this case, the 5G technology that provides a change in experience rather than an increase in features.

Factor #6: Novelty

A new thing, especially a new technology, will of course have an influence, whatever its form. This is also true of a technology that is applied to run video streaming. However, it appears that the novelty of proven 4G technology can still provide a significant value with a measure of α6 = 0.5, while as a new technology that is highly anticipated, 5G provides a higher significance value of β6 = 0.62.

Factor #7: Satisfaction

A user of a feature, especially a feature related to information and entertainment such as video streaming, experiences a value of satisfaction with the features used, either in terms of the technology or the content contained in the features. Video streaming with 4G technology currently has a significance value of α7 = 0.72 compared to the value of β7 = 0.67 that is a prediction of satisfaction with 5G technology. This is a logical outcome because 4G technology that has proven its ability will appear superior to technology that has not proved itself.

Factor #8: Price

Price-related factors describe the willingness of users to pay more for a technology when there is a novelty about it. The effect of price on 4G technology gives a significance value of α8 = 0.27, while the value for 5G is β8 = 0.5. This shows that users in Indonesia are more willing to pay for a new technology that is more favourable and influential than the technology that they currently enjoy.

Factor #9: Social

The possibility of a social estrangement factor due to focusing on a feature provided by a technology is an assessment of social aspects due to video streaming. The significance values of α9 = 0.16 in 4G technology and β9 = 0.23 in 5G technology illustrate that, according to video streaming users, social estrangement due to a technology is possible. However, it does not have a big impact as the significance value is still below a quarter of the scale.

Factor #10: Economy

In addition to satisfaction, price, and social aspects, an additional factor to assess for the significance of its effect on video streaming UX with 4G and 5G technology is the economic aspect. The economic aspect here includes the influence of video streaming as a medium for promotion, online shopping, and other independent economic activities. The significance values of α10 = 0.47 for 4G and β10 = 0.52 for 5G indicate that there is a fairly optimistic economic potential, especially when using newer technologies.

4.1.2. γ Correlation Analysis

The correlation value γ at the end of Table 2 shows the significance of the influence of the 4G UX variable on the 5G UX variable related to video streaming. Through the SEM results, a significance value of γ = 0.42 was obtained. This value shows that from the measurement of user experience, the UX video streaming on 4G technology has an effect of 0.42 on UX expectations of using video streaming with 5G technology. This means that users are still confident in watching streaming videos with proven 4G technology, even though there is a desire and hope for a new technology for video streaming, namely 5G.

4.2. Testing Results on Hypothesis

In addition to the correlation value that is the result of SEM processing, it is necessary to test the established hypotheses. Testing the hypotheses is performed by testing the CR value (t-value) and the p-value with the level of significance [38]. The test is carried out by testing whether the C.R (t-value) value is greater than 1.96, which is the critical z value at the 95% confidence level. The conditions for comparing the C.R (t-value) values are as follows:
  • If C.R > 1.96, then H0 is rejected and H1 is accepted.
  • If C.R ≤ 1.96, then H0 is accepted and H1 is rejected.
By looking at the correlation results shown in Table 2, it can be seen that the overall t-value is above or greater than 1.96. This means that, from the results of this study, H0 is rejected and H1 is accepted. The 4G UX variables have a positive influence on 5G UX, and each variable has a positive influence on the factors with different levels of significance. This confirms the results of the analysis on each factor in the discussion in Section 4.2.

4.3. Analysis of Correlation Results and Implementation Priorities

The correlation values generated from processing the SEM construction model show the level of significance of the influence between variables and also between variables and factors that can be used to assign priority levels for the implementation of 5G. From the results of the SEM processing, it can be seen that although the level of curiosity and desire for video streaming with smartphones on a 5G network is quite high, experience with 4G networks still provides an influence value for later using 5G networks. The influence value of γ = 0.42 on a scale of 0–1, even though it is lower than 50%, shows that there are still quite a lot of users who will stick to 4G for video streaming and still need real evidence for 5G as they do not have personal experience with the new technology.
In the relationship between variables and their factors, for 4G UX, the highest influence value obtained, α7 = 0.72, was for satisfaction in using video streaming on the 4G network. The influence of the social aspects of estrangement on 4G gives the smallest correlation, namely α9 = 0.16. These two examples of correlation values should be considered, especially by 4G network providers. As the satisfaction of enjoying streaming videos seems to be sufficient for user satisfaction at more than 50% on a scale of 0–1, there is a question of whether it needs to be improved or only sufficiently maintained, while the effect of social estrangement on the 4G network probably does need further attention or can be ignored, as it is not a significantly negative influence.
For the 5G network, the effect with the largest correlation is the desire to test ease and convenience on new devices and networks, which is measured at β2 = 0.81. This shows user enthusiasm for the existence of a new material to compare to previous technologies and can be considered a priority for 5G network providers.

5. Conclusions

This paper has shown what factors affect UX related to video streaming for 5G implementation in the Indonesian market. Through measurements of video streaming users’ experiences with 4G technology and predictions for using 5G technology processed with SEM, we have provided a reference for the application of 5G technology. Among the 10 UX factors for each technology, the largest correlation values obtained were the satisfaction factor for 4G of 0.72 and the perspicuity or convenience factor for 5G of 0.81. The lowest correlation value observed, which has little effect even though it is still present, is the social aspect measured on both on 4G and 5G, with values of 0.16 and 0.23, respectively. Overall, the effect of UX of video streaming with 4G technology has an effect of 0.42 on user-experience predictions for 5G technology. This shows that the user experience in video streaming using 4G technology still has an impact because it has proven its worth, even though there are high expectations for user experience with the new 5G technology. Through this research, in the future, it can be a reference for operators as a strategy with which to win the market and policymakers or regulators to achieve the government’s mission. Although this study took up the case in Indonesia, in the future, it is also hoped that it can be an example for application in other countries, especially for the implementation of 5G technology. Sustainability is an analytical approach to determine the system, based on the influencing factors of the results of this study.

Supplementary Materials

The following supporting information can be downloaded at: https://www.mdpi.com/article/10.3390/info13030155/s1.

Author Contributions

R.D.M. conducted the experiments and prepared the original draft. M.S. supervised and performed the writing review and editing, while K.R. supervised the research and writing process. All authors have read and agreed to the published version of the manuscript.

Funding

This research was partly funded by the Universitas Indonesia through the PUTI scheme under contract number NKB-2020/UN2.RST/HKP.05.00/2020.

Institutional Review Board Statement

Not applicable.

Informed Consent Statement

Not applicable.

Data Availability Statement

Data are contained within the Supplementary Material.

Conflicts of Interest

The authors declare no conflict of interest.

References

  1. Wang, Q.; Dai, H.N.; Wu, D.; Xiao, H. Data analysis on video streaming QoE over mobile networks. Eurasip J. Wirel. Commun. Netw. 2018, 2018, 173. [Google Scholar] [CrossRef] [Green Version]
  2. Berni, A.; Borgianni, Y. Making order in user experience research to support its application in design and beyond. Appl. Sci. 2021, 11, 6981. [Google Scholar] [CrossRef]
  3. Agiwal, M.; Roy, A.; Saxena, N. Next generation 5G wireless networks: A comprehensive survey. IEEE Commun. Surv. Tutor. 2016, 18, 1617–1655. [Google Scholar] [CrossRef]
  4. Mardian, R.D.; Suryanegara, M.; Ramli, K. Measuring quality of service (QoS) and quality of experience (QoE) on 5G technology: A review. In Proceedings of the 2nd IEEE International Conference on Innovative Research and Development, ICIRD 2019, Jakarta, Indonesia, 28–30 June 2019. [Google Scholar] [CrossRef]
  5. Suryanegara, M. Managing 5G technology: Using quality of experience (QoE) to identify the innovation enhancement pattern according to the Indonesian market. IEEE Access 2020, 8, 165593–165611. [Google Scholar] [CrossRef]
  6. Suryanegara, M.; Arifin, A.S.; Asvial, M.; Ramli, K.; Nashiruddin, M.I.; Hayati, N. What are the Indonesian Concerns about the Internet of Things (IoT)? Portraying the Profile of the Prospective Market. IEEE Access 2019, 7, 2957–2968. [Google Scholar] [CrossRef]
  7. ISO 9241-210:2019; Ergonomics of Human-System Interaction—Part 210: Human-Centred Design for Interactive Systems. ISO: Geneva, Switzerland, 2019. [CrossRef]
  8. Nacheva, R.V. Standardization issues of mobile usability. Int. J. Interact. Mob. Technol. 2020, 14, 149–157. [Google Scholar] [CrossRef]
  9. Wu, Y.; Jiang, Q.; Ni, S.; Liang, H. Critical factors for predicting users’ acceptance of digital museums for experience-influenced environments. Information 2021, 12, 426. [Google Scholar] [CrossRef]
  10. Tullis, T.; Albert, B. Measuring the User Experience: Collecting, Analyzing, and Presenting Usability Metrics, 2nd ed.; Elsevier: Waltham, MA, USA, 2013. [Google Scholar]
  11. Shin, D.H. Conceptualizing and measuring quality of experience of the internet of things: Exploring how quality is perceived by users. Inf. Manag. 2017, 54, 998–1011. [Google Scholar] [CrossRef]
  12. ITU. 5G—Fifth Generation of Mobile Technologies. December 2019. Available online: https://www.itu.int/en/mediacentre/backgrounders/Pages/5G-fifth-generation-of-mobile-technologies.aspx (accessed on 27 December 2021).
  13. Ott, D.; Himayat, N.; Talwar, S. 5G: Transforming the user wireless experience. In Towards 5G: Applications, Requirements and Candidate Technologies; Wiley: Hoboken, NJ, USA, 2017; pp. 34–53. [Google Scholar]
  14. Jahng, J.H.; Park, S.K. Simulation-based prediction for 5G mobile adoption. ICT Express 2020, 6, 109–112. [Google Scholar] [CrossRef]
  15. Kalem, G.; Vayvay, O.; Sennaroglu, B.; Tozan, H. Technology Forecasting in the Mobile Telecommunication Industry: A Case Study Towards the 5G Era. Eng. Manag. J. 2021, 33, 15–29. [Google Scholar] [CrossRef]
  16. Telkomsel. Telkomsel Luncurkan Layanan 5G Pertama di Indonesia, Wujud Nyata Transformasi Sebagai Perusahaan Telekomunikasi Digital Terdepan. 2021. Available online: https://www.telkomsel.com/about-us/news/telkomsel-luncurkan-layanan-5g-pertama-di-indonesia-wujud-nyata-transformasi-sebagai (accessed on 14 June 2021).
  17. Ministry of Communications and Informatics of the Republic of Indonesia. Telkomsel Uji Coba 5G di Ajang Asian Games 2018. 2018. Available online: https://kominfo.go.id/content/detail/13879/telkomsel-uji-coba-5g-di-ajang-asian-games-2018/0/sorotan_media (accessed on 9 January 2021).
  18. Indonesia, X.A. Finalizing Preparations to Provide 5G Service XL Axiata Holds Trial of 5G Technology and Aggressively Fiberization Network. 2019. Available online: https://www.xlaxiata.co.id/en/news/preparations-to-provide-5g-service (accessed on 9 January 2021).
  19. Muwardi, M.I. 5G in Indonesia is Still Not Optimal, Why Is That? 6 June 2021. Available online: https://unida.ac.id/teknologi/artikel/5g-di-indonesia-masih-belum-optimal-mengapa-demikian.html (accessed on 27 December 2021).
  20. Kemp, S. Digital 2021: Indonesia. Datareportal. 2021. Available online: https://datareportal.com/reports/digital-2021-indonesia (accessed on 14 June 2021).
  21. Orueta, G.D.; Ruiz, E.S.C.; Alonso, N.O.; Gil, M.C. Quality of Service—Regulation Manual; ITU—International Telecommunication Union: Geneva, Switzerland, 2017. [Google Scholar] [CrossRef]
  22. Schrepp, M. User Experience Questionnaire Handbook Version 8, pp. 1–15. 2019. Available online: https://www.researchgate.net/publication/303880829_User_Experience_Questionnaire_Handbook_Version_2 (accessed on 2 December 2020).
  23. Mardani, A.; Streimikiene, D.; Zavadskas, E.K.; Cavallaro, F.; Nilashi, M.; Jusoh, A.; Zare, H. Application of Structural Equation Modeling (SEM) to solve environmental sustainability problems: A comprehensive review and meta-analysis. Sustainability 2017, 9, 1814. [Google Scholar] [CrossRef] [Green Version]
  24. Zhang, J.; Chen, Z.; Ma, J.; Liu, Z. Investigating the influencing factors of teachers’ information and communications technology-integrated teaching behaviors toward ‘learner-centered’ reform using structural equation modeling. Sustainability 2021, 13, 12614. [Google Scholar] [CrossRef]
  25. Reyes-Menendez, A.; Palos-Sanchez, P.R.; Saura, J.R.; Martin-Velicia, F. Understanding the Influence of Wireless Communications and Wi-Fi Access on Customer Loyalty: A Behavioral Model System. Wirel. Commun. Mob. Comput. 2018, 2018, 3487398. [Google Scholar] [CrossRef]
  26. Duanmu, Z.; Rehman, A.; Wang, Z. A quality-of-experience database for adaptive video streaming. IEEE Trans. Broadcasting 2018, 64, 474–487. [Google Scholar] [CrossRef]
  27. Keshvadi, S.; Williamson, C. Movie: A measurement tool for mobile video streaming on smartphones. In Proceedings of the ICPE 2020—Proceedings of the ACM/SPEC International Conference on Performance Engineering, Edmonton, AB, Canada, 25–30 April 2020; pp. 230–237. [Google Scholar] [CrossRef]
  28. Mehmeti, F.; la Porta, T.F. Resource Allocation for Improved User Experience with Live Video Streaming in 5G. 2020. Available online: http://arxiv.org/abs/2012.10219 (accessed on 9 January 2022).
  29. Schwind, A.; Midoglu, C.; Alay, Ö.; Griwodz, C.; Wamser, F. Dissecting the performance of YouTube video streaming in mobile networks. Int. J. Netw. Manag. 2020, 30, e2058. [Google Scholar] [CrossRef]
  30. Hu, H.; Xu, Z.; Zhang, X.; Guo, Z. Predicting QoE of Video Streaming with Network-Context Features. In Proceedings of the 2019 2nd IEEE International Conference on Hot Information-Centric Networking, HotICN 2019, Chongqing, China, 13–15 December 2019; Volume 1, pp. 56–57. [Google Scholar] [CrossRef]
  31. Barakabitze, A.A.; Barman, N.; Ahmad, A.; Zadtootaghaj, S.; Sun, L.; Martini, M.G.; Atzori, L. QoE management of multimedia streaming services in future networks: A tutorial and survey. IEEE Commun. Surv. Tutor. 2020, 22, 526–565. [Google Scholar] [CrossRef] [Green Version]
  32. Yang, M.; Wang, S.; Calheiros, R.N.; Yang, F. Survey on QoE assessment approach for network service. IEEE Access 2018, 6, 48374–48390. [Google Scholar] [CrossRef]
  33. Gbongli, K.; Xu, Y.; Amedjonekou, K.M. Extended technology acceptance model to predict mobile-based money acceptance and sustainability: A multi-analytical structural equation modeling and neural network approach. Sustainability 2019, 11, 3639. [Google Scholar] [CrossRef] [Green Version]
  34. Lim, J.S.; Choe, M.J.; Zhang, J.; Noh, G.Y. The role of wishful identification, emotional engagement, and parasocial relationships in repeated viewing of live-streaming games: A social cognitive theory perspective. Comput. Hum. Behav. 2020, 108, 106327. [Google Scholar] [CrossRef]
  35. Khan, A.G.; Lima, R.P.; Mahmud, M.S. Understanding the Service Quality and Customer Satisfaction of Mobile Banking in Bangladesh: Using a Structural Equation Model. Glob. Bus. Rev. 2021, 22, 85–100. [Google Scholar] [CrossRef]
  36. Ltifi, M. Determinants of the intention of smartphone usage by mobile internet users for m-services. Manag. Decis. 2018, 56, 2291–2307. [Google Scholar] [CrossRef]
  37. Yalçıntekin, T.; Saygılı, M. Brand Loyalty at Smartphones Market: Linking between Brand Passion, Hedonic and Utilitarian Values. Mark. Manag. Innov. 2020, 6718, 274–284. [Google Scholar] [CrossRef]
  38. Hair, J.F., Jr.; Black, W.C.; Babin, B.J.; Anderson, R.E. Multivariate Data Analysis; Pearson: London, UK, 2014; ISBN-10 1-292-02190-X. [Google Scholar]
  39. Arbuckle, J.L. IBM® SPSS® User’s Guide AmosTM 24. pp. 1–720. 2016. Available online: ftp://public.dhe.ibm.com (accessed on 11 January 2021).
  40. Nilasari, B.M. The Impact of Social Media on Employee Work Performance with Trust as a Mediation Variable. J. Manaj. 2020, 24, 298. [Google Scholar] [CrossRef]
  41. Nilasari, B.M.; Jasfar, F.; Wahyudi, A.S. The Effect of Interactivity, Cost Effectiveness, and Compatibility on the Use of Social Media and its Implications for Organizational Performance. Am. Res. J. Bus. Manag. 2019, 5, 1–17. [Google Scholar] [CrossRef]
Figure 1. Elements of UX and QoE.
Information 13 00155 g001
Figure 2. Conceptual model.
Information 13 00155 g002
Figure 3. Sample questions on a questionnaire to measure 4G UX and 5G UX expectations.
Information 13 00155 g003
Figure 4. Comparison chart of correlation values for UX video streaming in Indonesia.
Information 13 00155 g004
Table 1. Summary of the most relevant previous studies.
StudyMethodScopes
Reyes-Menendez, A.; et al. [25]Structural equation model (SEM)The study measures café customer loyalty based on the Wi-Fi feature available in Spain. However, the SEM method is used only to analyse a factor of user satisfaction and predictions with complex constructions have not been discussed.
K. Gbongli, et al. [33]The study aims to obtain predictions of Bangladesh’s 5G mobile financial services. The SEM method is used to analyse the five main factors of user experience, i.e., perspicuity, efficiency, dependability, stimulation, and novelty.
J. S. Lim; et al. [34]The study measures users’ loyalty to a computer game across South Korea. It focuses on a factor of emotional attachment.
A. G. Khan; et al. [35]This study measures customer satisfaction with 4G mobile banking to sort out and determine strategies for service sustainability. This study is a case of the Togo national market. The analysis focused on five user-experience factors: perspicuity, efficiency, dependability, stimulation, and novelty.
Table 2. Correlation values for UX video streaming in Indonesia.
FactorCorrelation ValueCR
(t-Value)
Attractiveness on UX 4Gα1 = 0.616.12
Perspicuity on UX 4Gα2 = 0.66.08
Efficiency on UX 4Gα3 = 0.666.36
Dependency on UX 4Gα4 = 0.515.57
Stimulation on UX 4Gα5 = 0.435
Novelty on UX 4Gα6 = 0.55.51
Satisfaction on UX 4Gα7 = 0.726.57
Price on UX 4Gα8 = 0.273.53
Social on UX 4Gα9 = 0.162.25
Economy on UX 4Gα10 = 0.475.46
Attractiveness on UX 5Gβ1 = 0.476.81
Perspicuity on UX 5Gβ2 = 0.8110.95
Efficiency on UX 5Gβ3 = 0.7610.46
Dependency on UX 5Gβ4 = 0.7510.42
Stimulation on UX 5Gβ5 = 0.649.1
Novelty on UX 5Gβ6 = 0.628.83
Satisfaction on UX 5Gβ7 = 0.679.53
Price on UX 5Gβ8 = 0.57.18
Social on UX 5Gβ9 = 0.233.41
Economy on UX 5Gβ10 = 0.527.57
UX 4G to 5G UXγ = 0.424.53
Publisher’s Note: MDPI stays neutral with regard to jurisdictional claims in published maps and institutional affiliations.

