Article

Methodological Study on the Influence of Truck Driving State on the Accuracy of Weigh-in-Motion System

School of Mechanical Engineering, Xi’an University of Science and Technology, Xi’an 710054, China
*
Author to whom correspondence should be addressed.
Information 2022, 13(3), 130; https://doi.org/10.3390/info13030130
Submission received: 6 January 2022 / Revised: 22 February 2022 / Accepted: 23 February 2022 / Published: 3 March 2022
(This article belongs to the Special Issue Soft Computing in Intelligent Transportation System)

Abstract

:
The weigh-in-motion (WIM) system weighs the entire vehicle by identifying the dynamic forces of each axle of the vehicle on the road. The load of each axle is very important to detect the total weight of the vehicle. Different drivers have different driving behaviors, and when large trucks pass through the weighing detection area, the driving state of the trucks may affect the weighing accuracy of the system. This paper proposes YOLOv3 network model as the basis for this algorithm, which uses the feature pyramid network (FPN) idea to achieve multi-scale prediction and the deep residual network (ResNet) idea to extract image features, so as to achieve a balance between detection speed and detection accuracy. In the paper, spatial pyramid pooling (SPP) network and cross stage partial (CSP) network are added to the original network model to improve the learning ability of the convolutional neural network and make the original network more lightweight. Then the detection-based target tracking method with Kalman filtering + RTS (rauch–tung–striebel) smoothing is used to extract the truck driving status information (vehicle trajectory and speed). Finally, the effective size of the vehicle in different driving states on the weighing accuracy is statistically analyzed. The experimental results show that the method has high accuracy and real-time performance in truck driving state extraction, can be used to analyze the influence of weighing accuracy, and provides theoretical support for personalized accuracy correction of WIM system. At the same time, it is beneficial for WIM system to assist the existing traffic system more accurately and provide a highway health management and effective decision making by providing reliable monitoring data.

1. Introduction

In the past decades, road and bridge collapse accidents have occurred in many countries. Especially in those countries where overload monitoring and control systems are not well developed, these accidents pose a threat to both public infrastructure and personal safety, and the most important cause of such accidents is the overweight of trucks, which leads to the collapse of roads and bridges due to overload bearing [1,2,3]. The collapse of the Porcavella Viaduct in Genoa, Italy, showed that a good structural design is not enough to guarantee the longevity of a bridge. It should be continuously monitored in its operational condition during use to verify that it can carry existing traffic. This will enable the timely detection of damage and defects and the development of maintenance plans to ensure the safety, efficiency and sustainability of the infrastructure [4]. Truck weight monitoring is commonly done using static weighing, whose biggest drawback is that it is slow and prone to traffic congestion [5]. Currently, the most promising technology is weigh-in-motion (WIM), which is mainly used for non-stop detection of road vehicles and off-site enforcement [6]. The WIM system can complete the weighing of the whole vehicle during the normal driving process of the vehicle, but in the actual engineering application, the system also reveals many problems, such as susceptibility to the driving state of the vehicle, low weighing accuracy and poor concealment of the system. Therefore, it is crucial to analyze and optimize the accuracy of the WIM system.
In many countries, complex safety monitoring systems have been installed on many bridges and highways. The WIM system is widely used on bridges and highways to monitor the individual axle weight, total weight, quantity and speed of vehicles [7], and the system is able to complete vehicle weight detection effectively and quickly and accurately. In response to the problem of improving the accuracy of the WIM system, it is usually optimized in two aspects: the hardware part, improving the structure of the load cell, the processing process and the way it is arranged on the road surface to improve the accuracy and stability of data acquisition. Zhao [8] analyzed in detail the selection of WIM sensor materials and the design of the structure, and the final structural form and organization of the multi-cell WIM system is given by the determined design index. Dolcemascolo et al. [9] focused on the optimization of the layout configuration of the multi-cells and the development of algorithms to correct the weighing accuracy. In the software part, a high-precision weighing algorithm is designed for data processing to eliminate problems such as low accuracy due to other influencing factors, such as temperature effects, vehicle speed, load frequency of the sensors, road level and vehicle driving condition. Studies have been carried out from the analysis of the thermal performance of the sensors [10], the effect of temperature and speed on the error of WIM systems using piezoelectric sensors [11,12]. Tan et al. [13] established a gray neural network model with vehicle speed, acceleration, and weighing residual sequences as input quantities, which enabled the weighing accuracy level of the system to reach the level 1 index and realized the high accuracy processing of weighing data. Xiang et al. [14] investigated the correlation between the output voltage and the applied force of the piezoelectric transducer by establishing a theoretical model with a multilayer structure and proved that the load frequency is an important factor affecting the measurement accuracy of the transducer. Cheng [15] proposed a new adaptive weighing system using a neural network-based adaptive variable step LMS (least mean squares) algorithm to filter the noise due to vehicle speed in the WIM signal. Faruolo et al. [16] developed a nonlinear computational multi-mass spring model aimed at eliminating the “wobble effect” in the case of liquid transport caused by the movement of the center of gravity on the accuracy of the WIM system. Zhang et al. [17] proposed a signal processing-based approach to develop a vehicle WIM system based on a Hopfield neural network adaptive filter. The system is adaptable, accurate and fast for different vehicle models. McNulty et al. [18] investigated the effect of temperature on the uncertainty of weighing results in WIM systems. The study showed that the accuracy of polymer piezoelectric sensors is relatively affected by temperature. If an appropriate temperature correction algorithm is applied, it is able to reduce the uncertainty introduced. In contrast, the quartz type load cell has a very small temperature drift due to the relatively good temperature performance of the piezoelectric and dielectric coefficients of quartz, and the accuracy of the sensor is almost independent of temperature. Many studies have been conducted to continuously optimize the accuracy of WIM systems from different influencing factors. Many of these studies input the vehicle speed as a major influencing factor into the established network model, so as to eliminate the negative impact caused by the vehicle speed. However, these input speed data are the average speed of the vehicle through the WIM area, and for vehicles with small body lengths, the average speed can completely portray the state of each axle as it passes through the area. And when large trucks pass through, due to its long body (the total length of 6-axle vehicle and cargo is more than 18.1 m), the speed of each axle through the weighing area will have a large difference (the vehicle center of gravity moves back and forth), the average speed will not be able to accurately portray the state of the vehicle but will affect the weighing accuracy of the system.
To address the above problems, this paper proposes to optimize the network structure based on the YOLOv3 network model to improve the detection accuracy and real-time performance. The tracking algorithm based on target detection is used to realize the extraction of trajectory and speed information of vehicles in WIM area, and then analyze the impact size of vehicles with different driving states on weighing accuracy. The experiments prove that the combination of the method and WIM system provides a reference for an adaptive personalized WIM accuracy correction system.

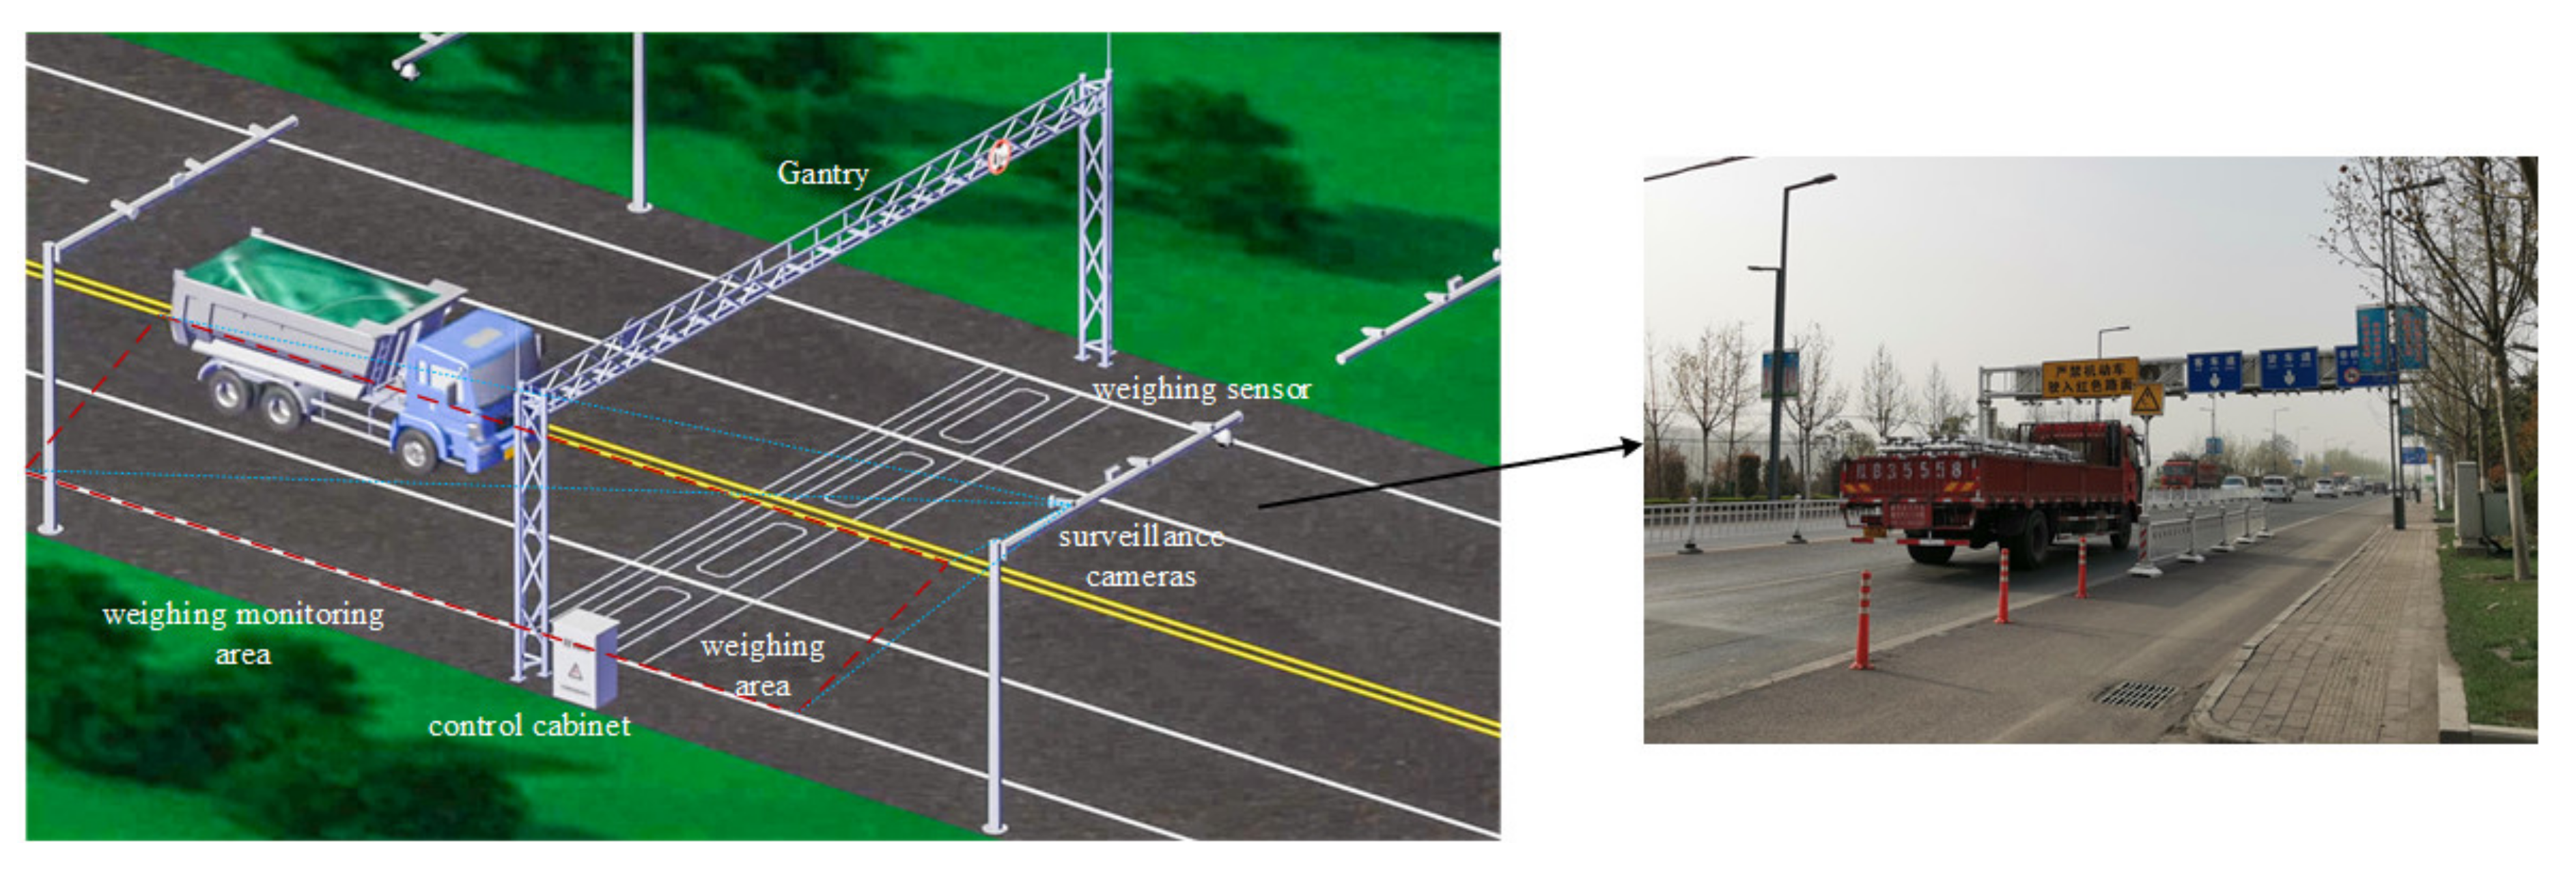
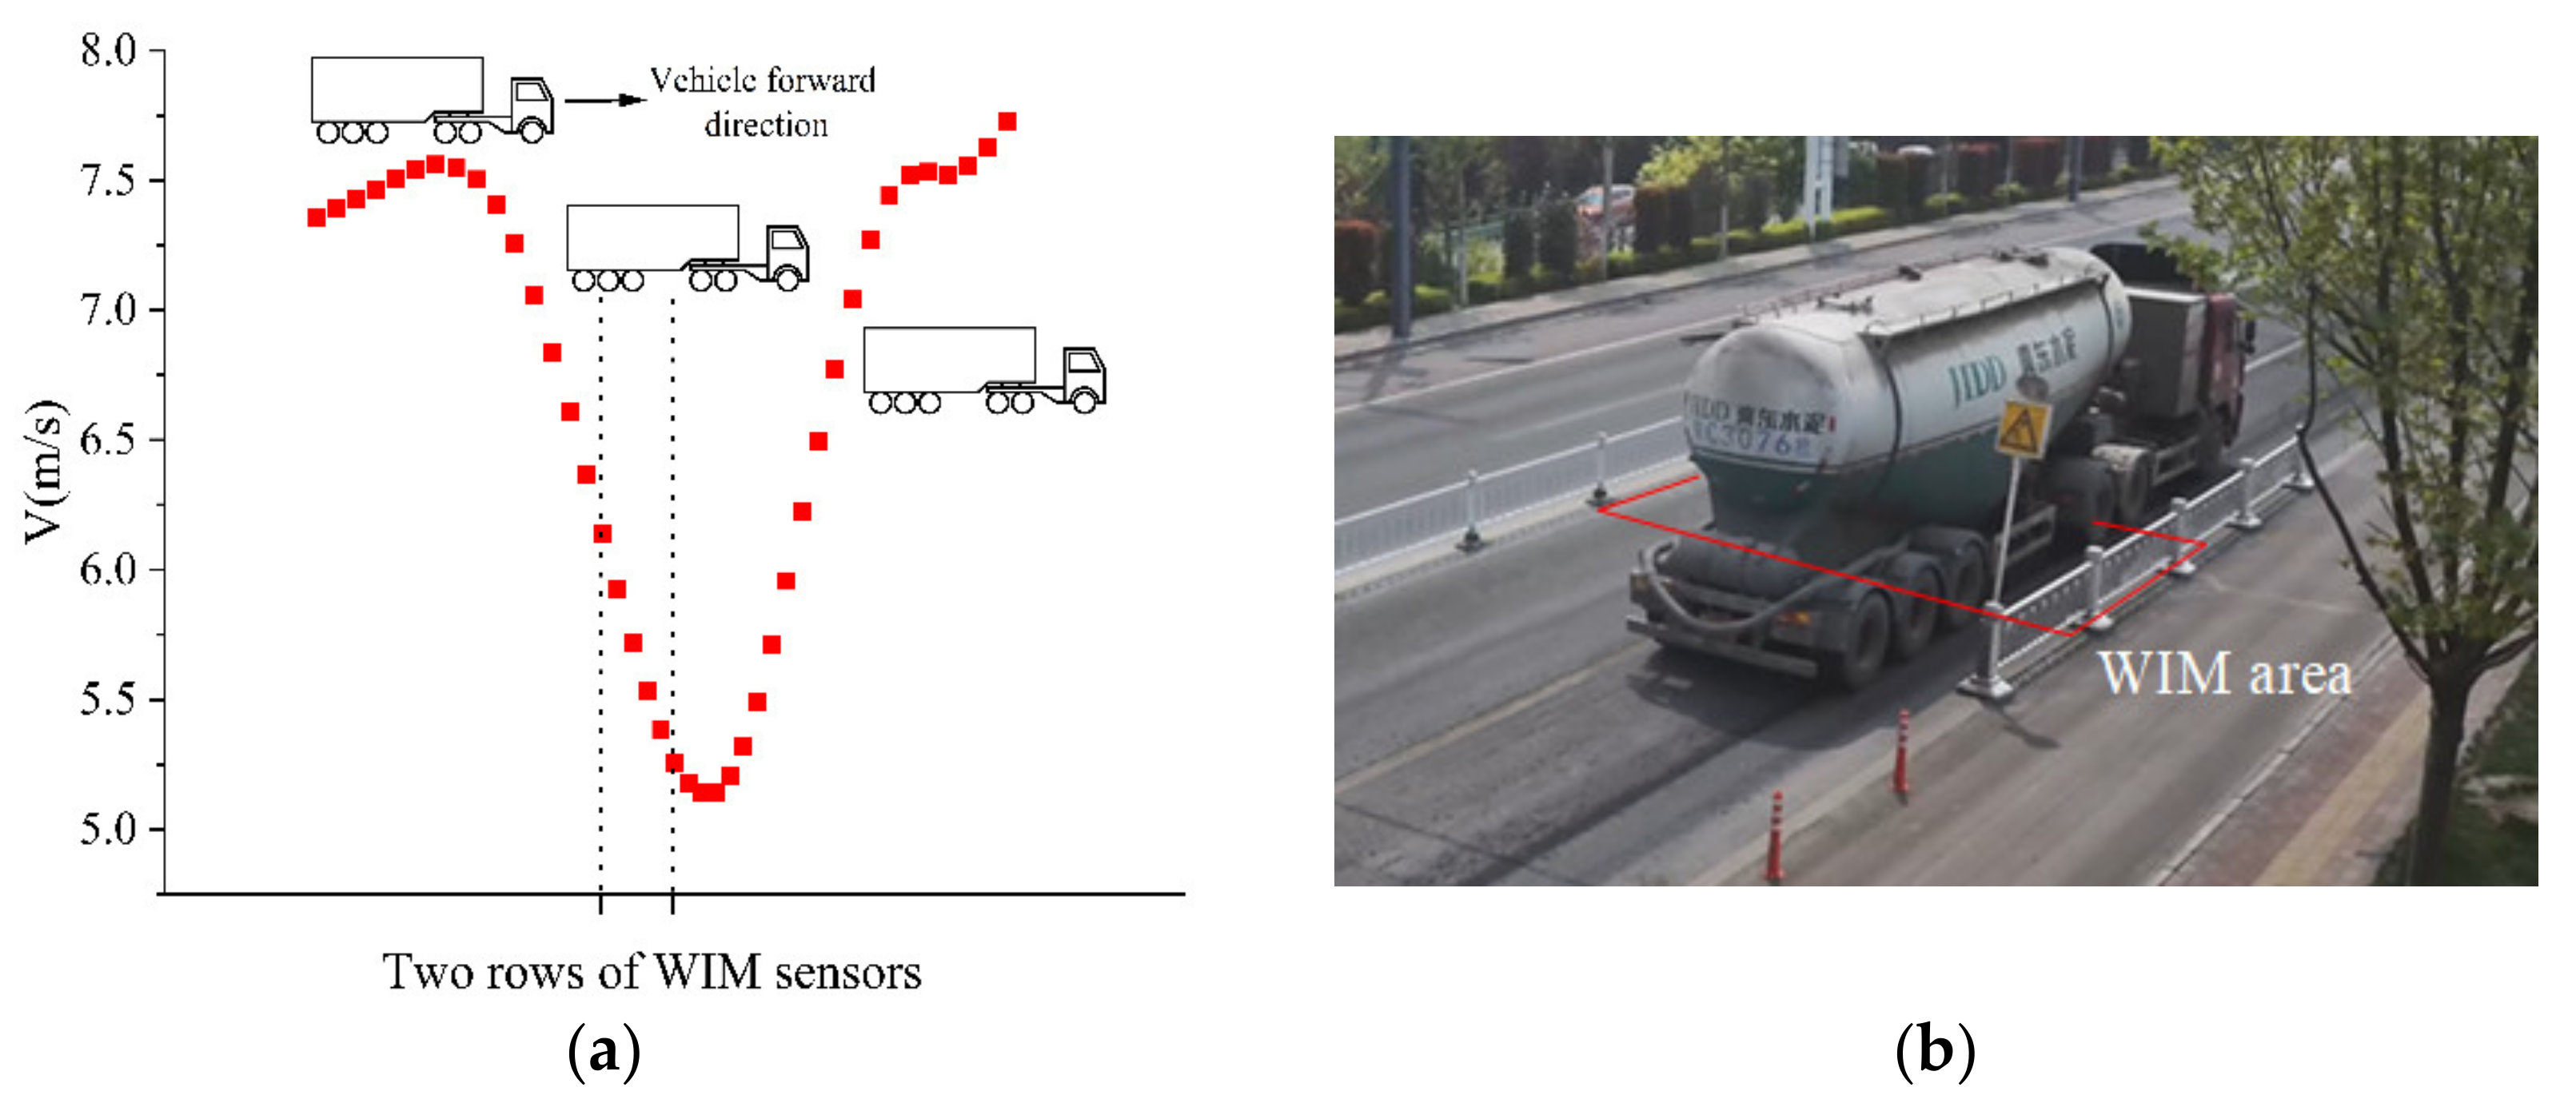
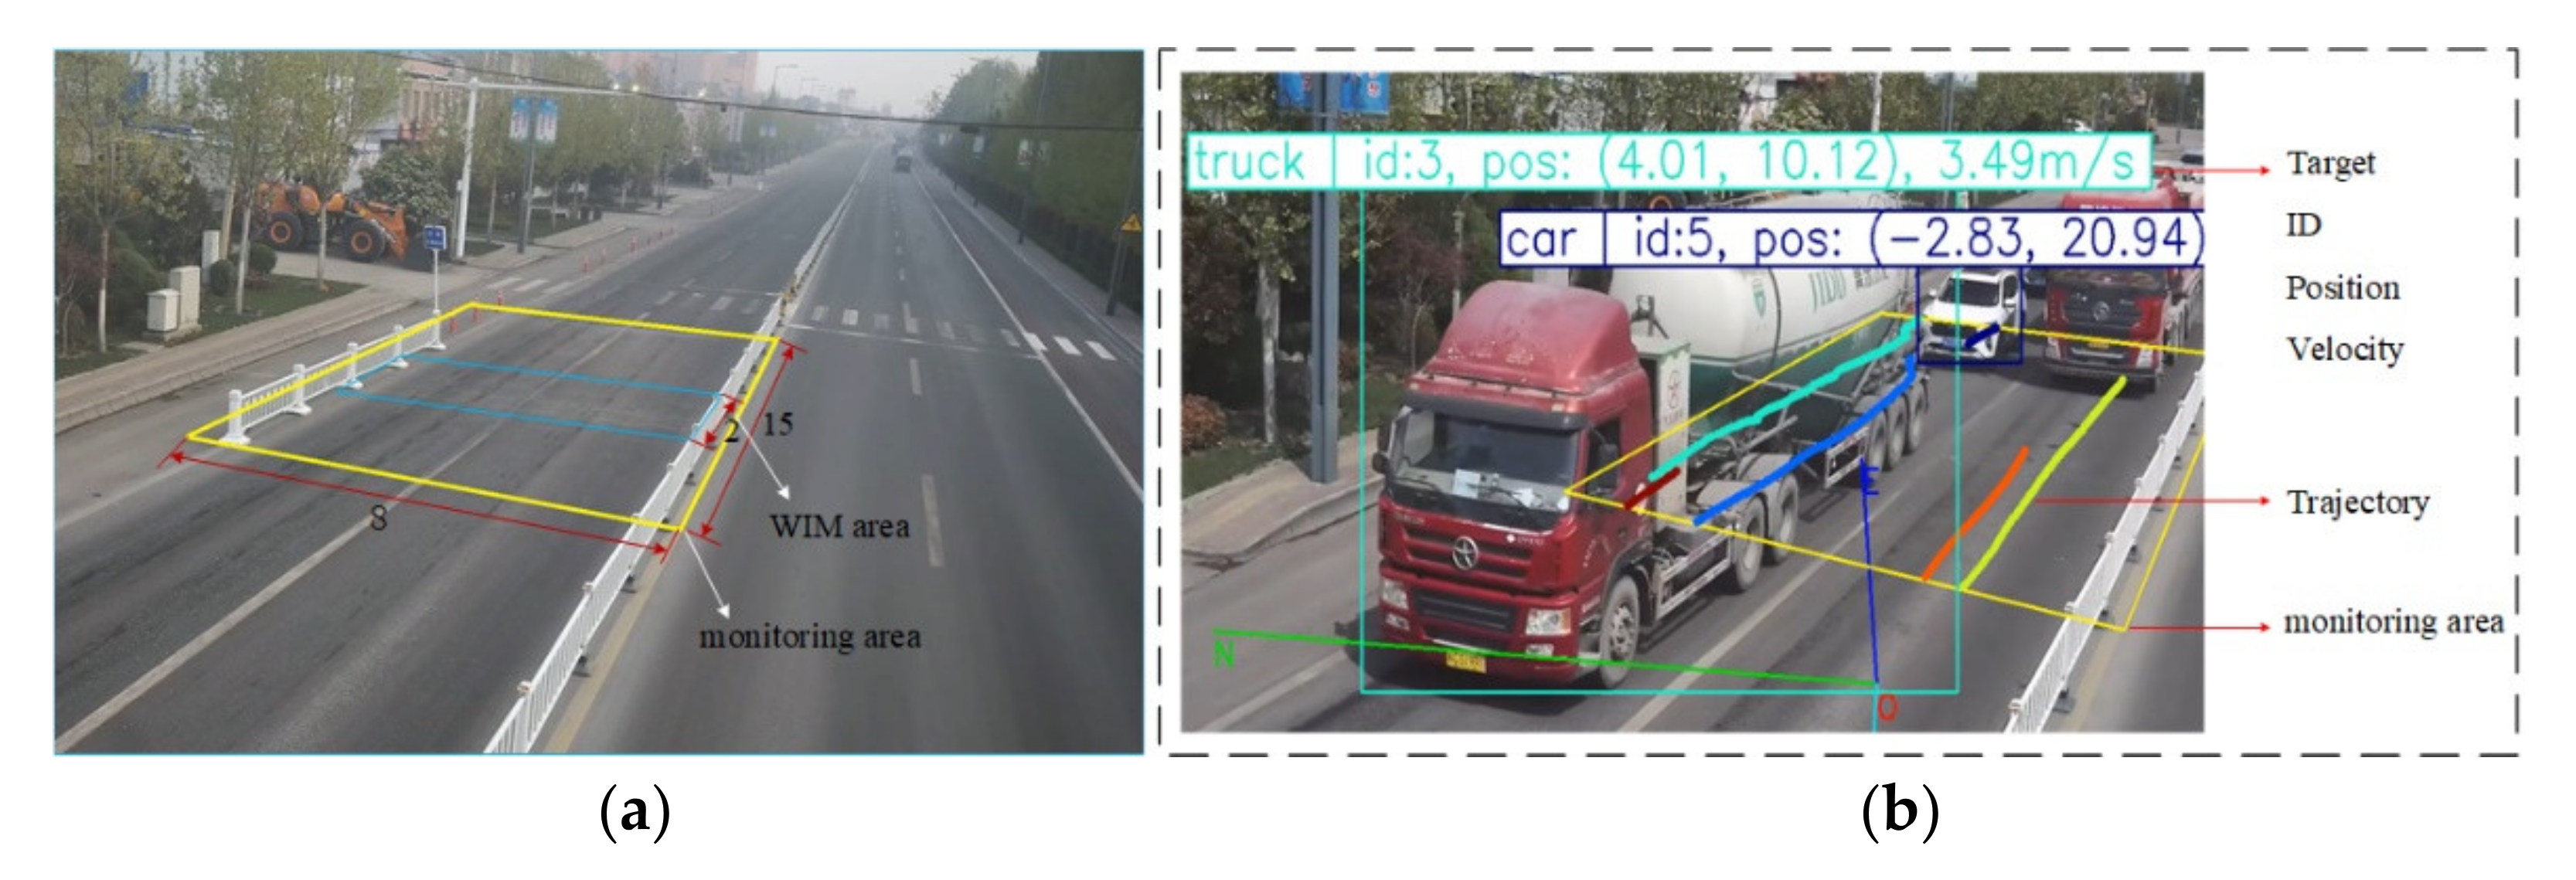
2. Weigh-in-Motion System Framework

The WIM system is commonly used in practical projects such as truck overload detection and structural health monitoring and is a technology that can automatically identify and detect the weight of vehicles traveling normally on a roadway or bridge [19]. The system has unique advantages such as fast weighing speed and easy operation, which is important for rapid assessment of overload detection of trucks. The hardware layout of the WIM system and the actual monitoring station diagram are shown in Figure 1. The whole system deployed in the field consists of three main parts: a piezoelectric quartz-based weighing system, a video acquisition system for traffic flow, and a data communication and processing system. The weighing system is used to obtain the weight information of vehicles on the road, with multiple rows of load cells installed in each lane. 4high-definition cameras are installed on a T-frame 15 m in front and behind the weighing area to obtain the traffic video data as the vehicles pass by. The data communication and processing system is used to transmit and process real-time video and text data. In the system, machine vision technology is used to obtain information about the vehicles (body color, license plate number and model information). Both Zhou and Dan [20,21] proposed a new motion load recognition system based on machine vision techniques. Experimental results demonstrated that vehicle information can be easily obtained from roadside surveillance cameras and verified the reliability and accuracy of the system. Ojio et al. [22] determined the position and wheelbase of the actual vehicle from the surveillance video and successfully tracked the motion of the vehicle by machine vision techniques based on the Lukas–Kanade method.
Many studies based on camera data contribute more to the WIM system to improve the detection accuracy of vehicle information and thus the matching accuracy with vehicle weighing data. The core task of this paper is to extract the driving state of the vehicle as it passes through the weighing area. Through extensive data analysis, it is investigated whether this affects the accuracy of the weighing system and the magnitude of the effect on the accuracy under different driving states. The implementation of these tasks is described in the following.

3. Methods

3.1. Problem Statement

Whether the driving state of the truck through the weighing area has a negative influence on the weighing accuracy, it is necessary to accurately analyze the changes in the driving state of the truck through the weighing area. This paper uses machine vision technology to extract the truck driving state information in the road monitoring video, to solve this problem first need to be able to accurately detect the truck target on the road, then frame by frame for target tracking, and finally in the image coordinate system and the world coordinate system conversion can accurately extract the truck driving state information in each frame. Thus, the extraction of the driving state information of trucks passing through the weighing area is completed.

3.2. Model Formulation

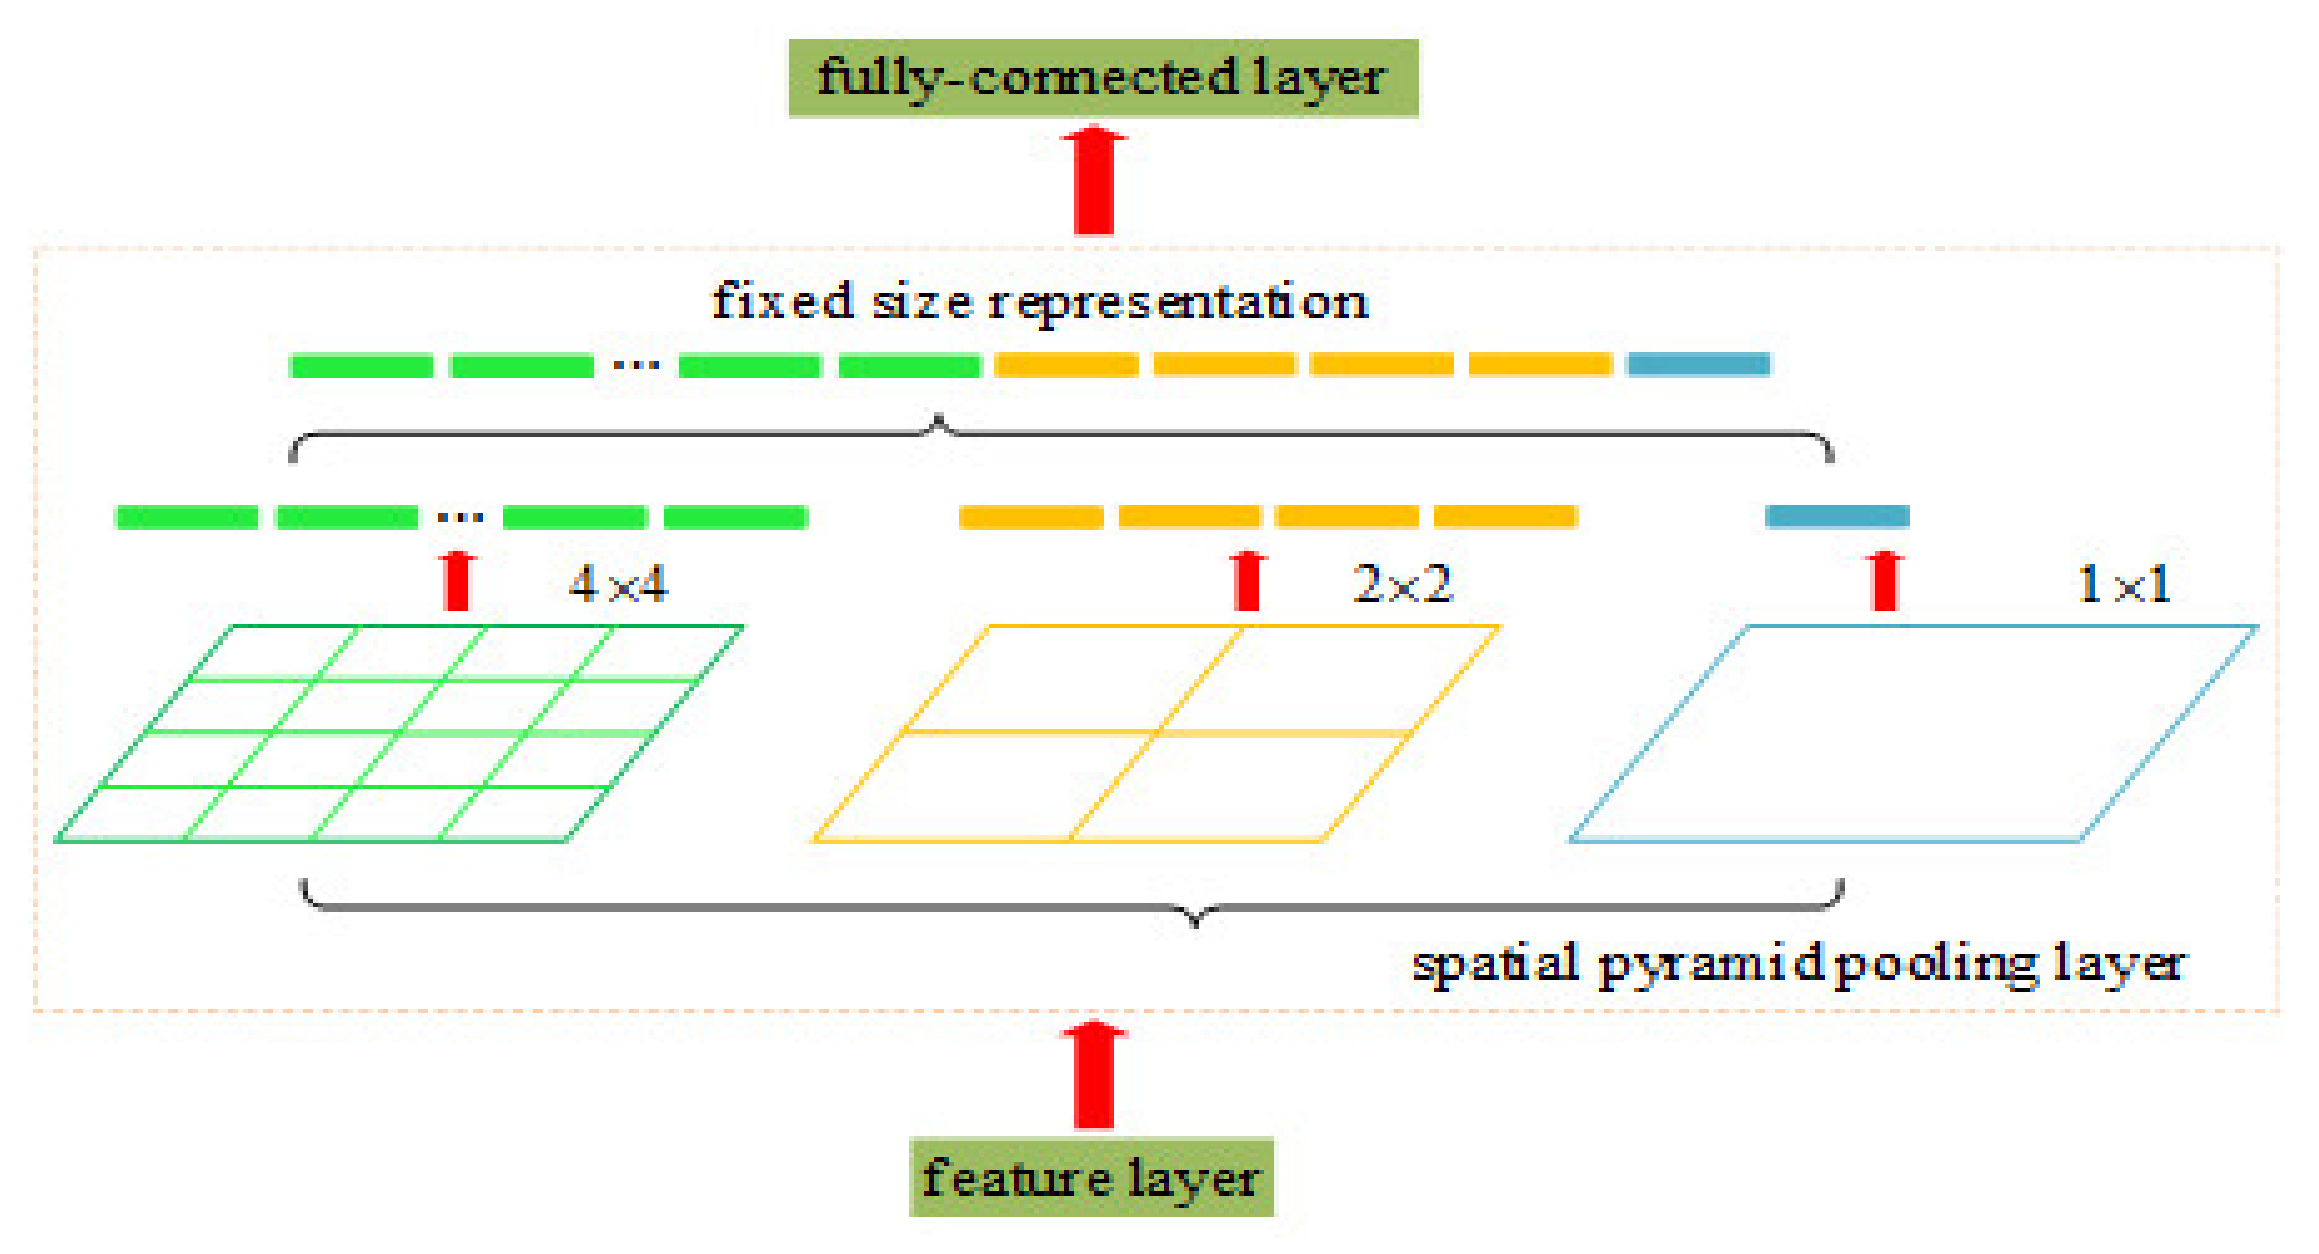
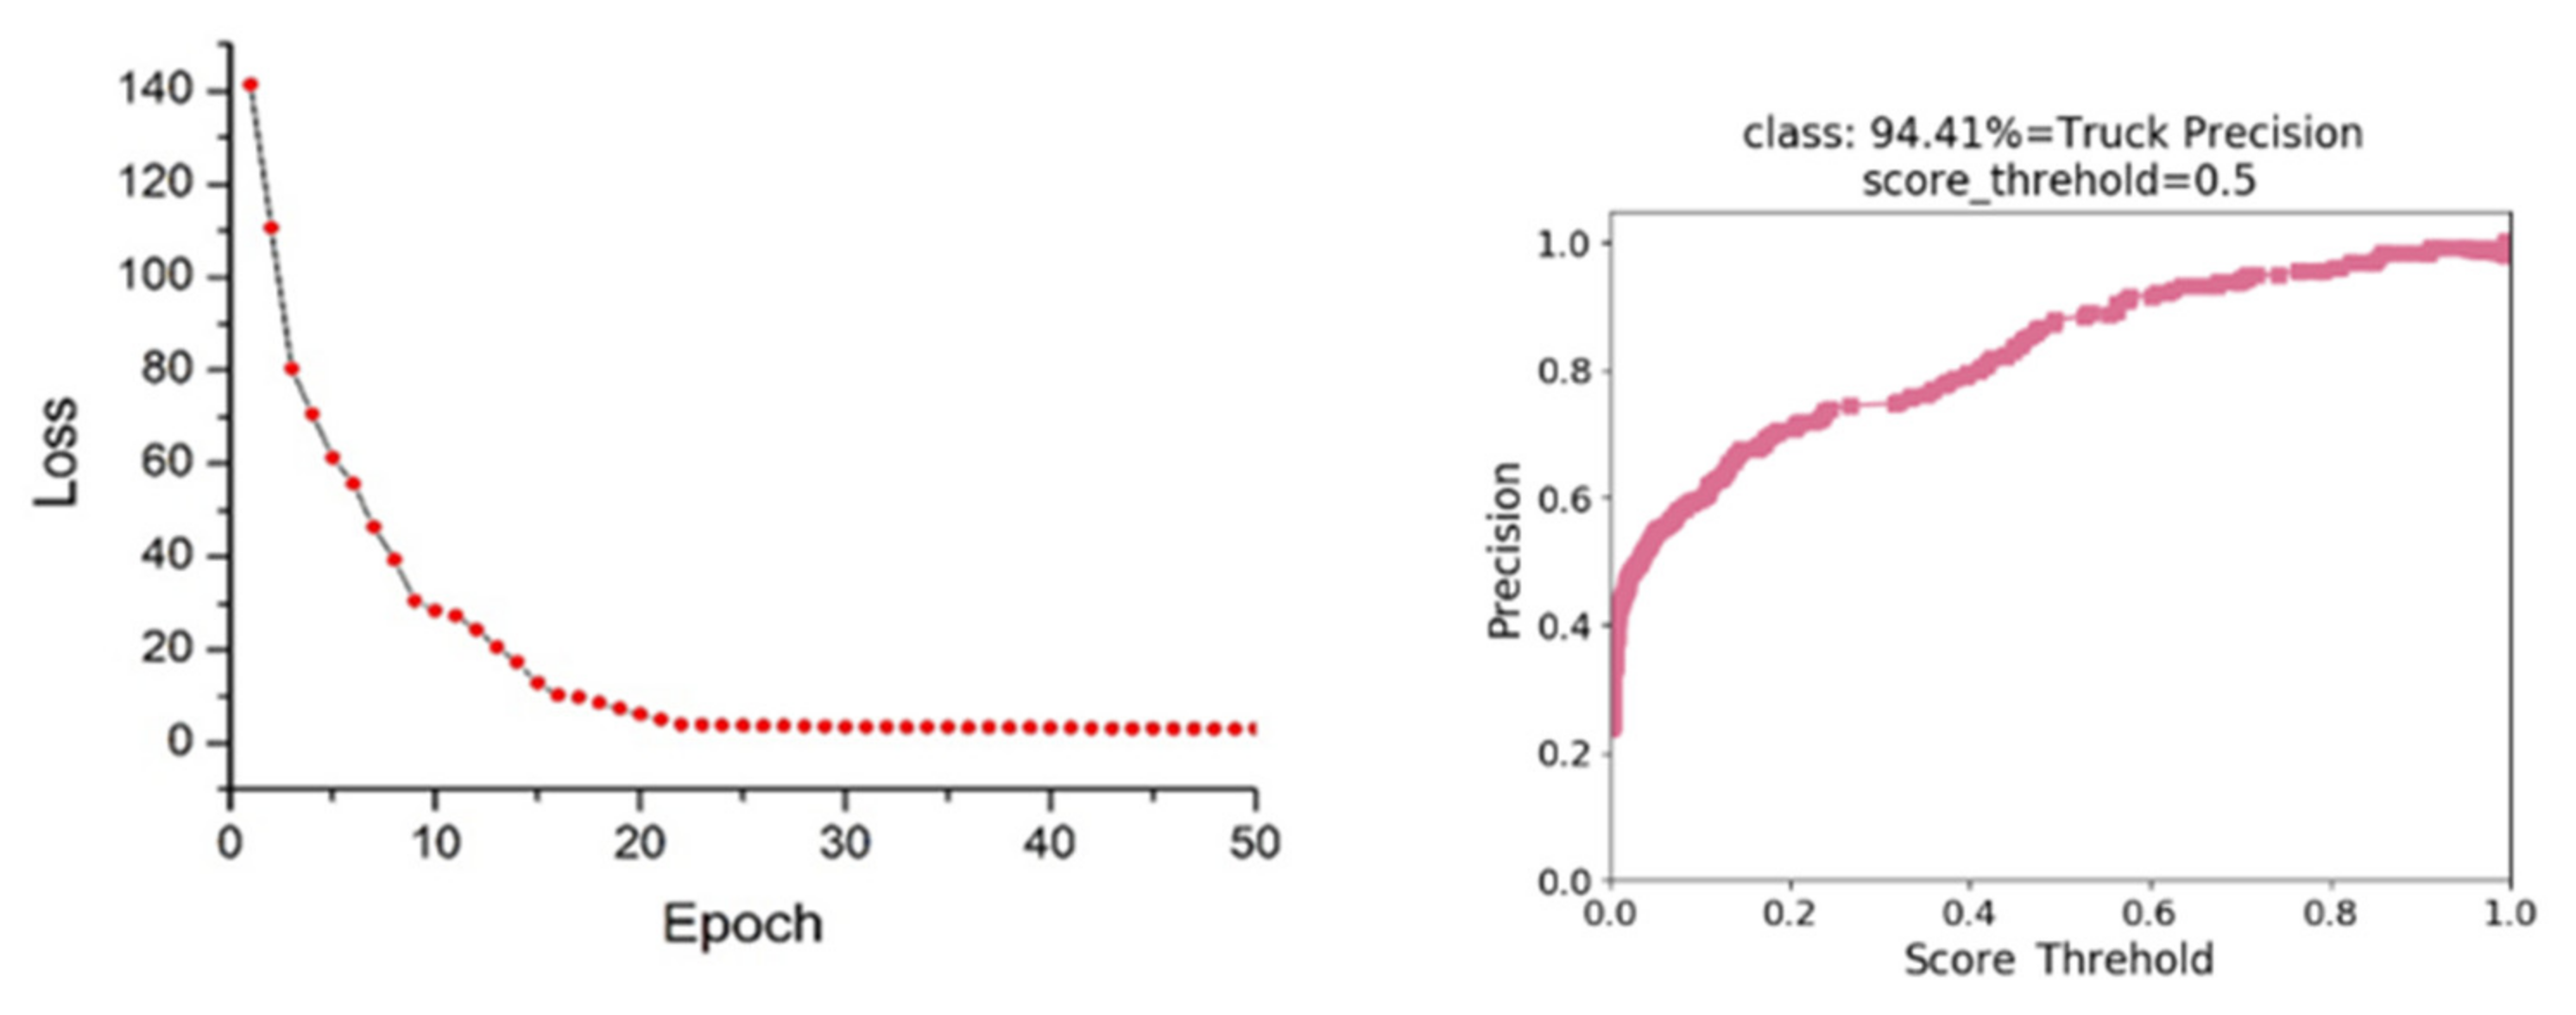
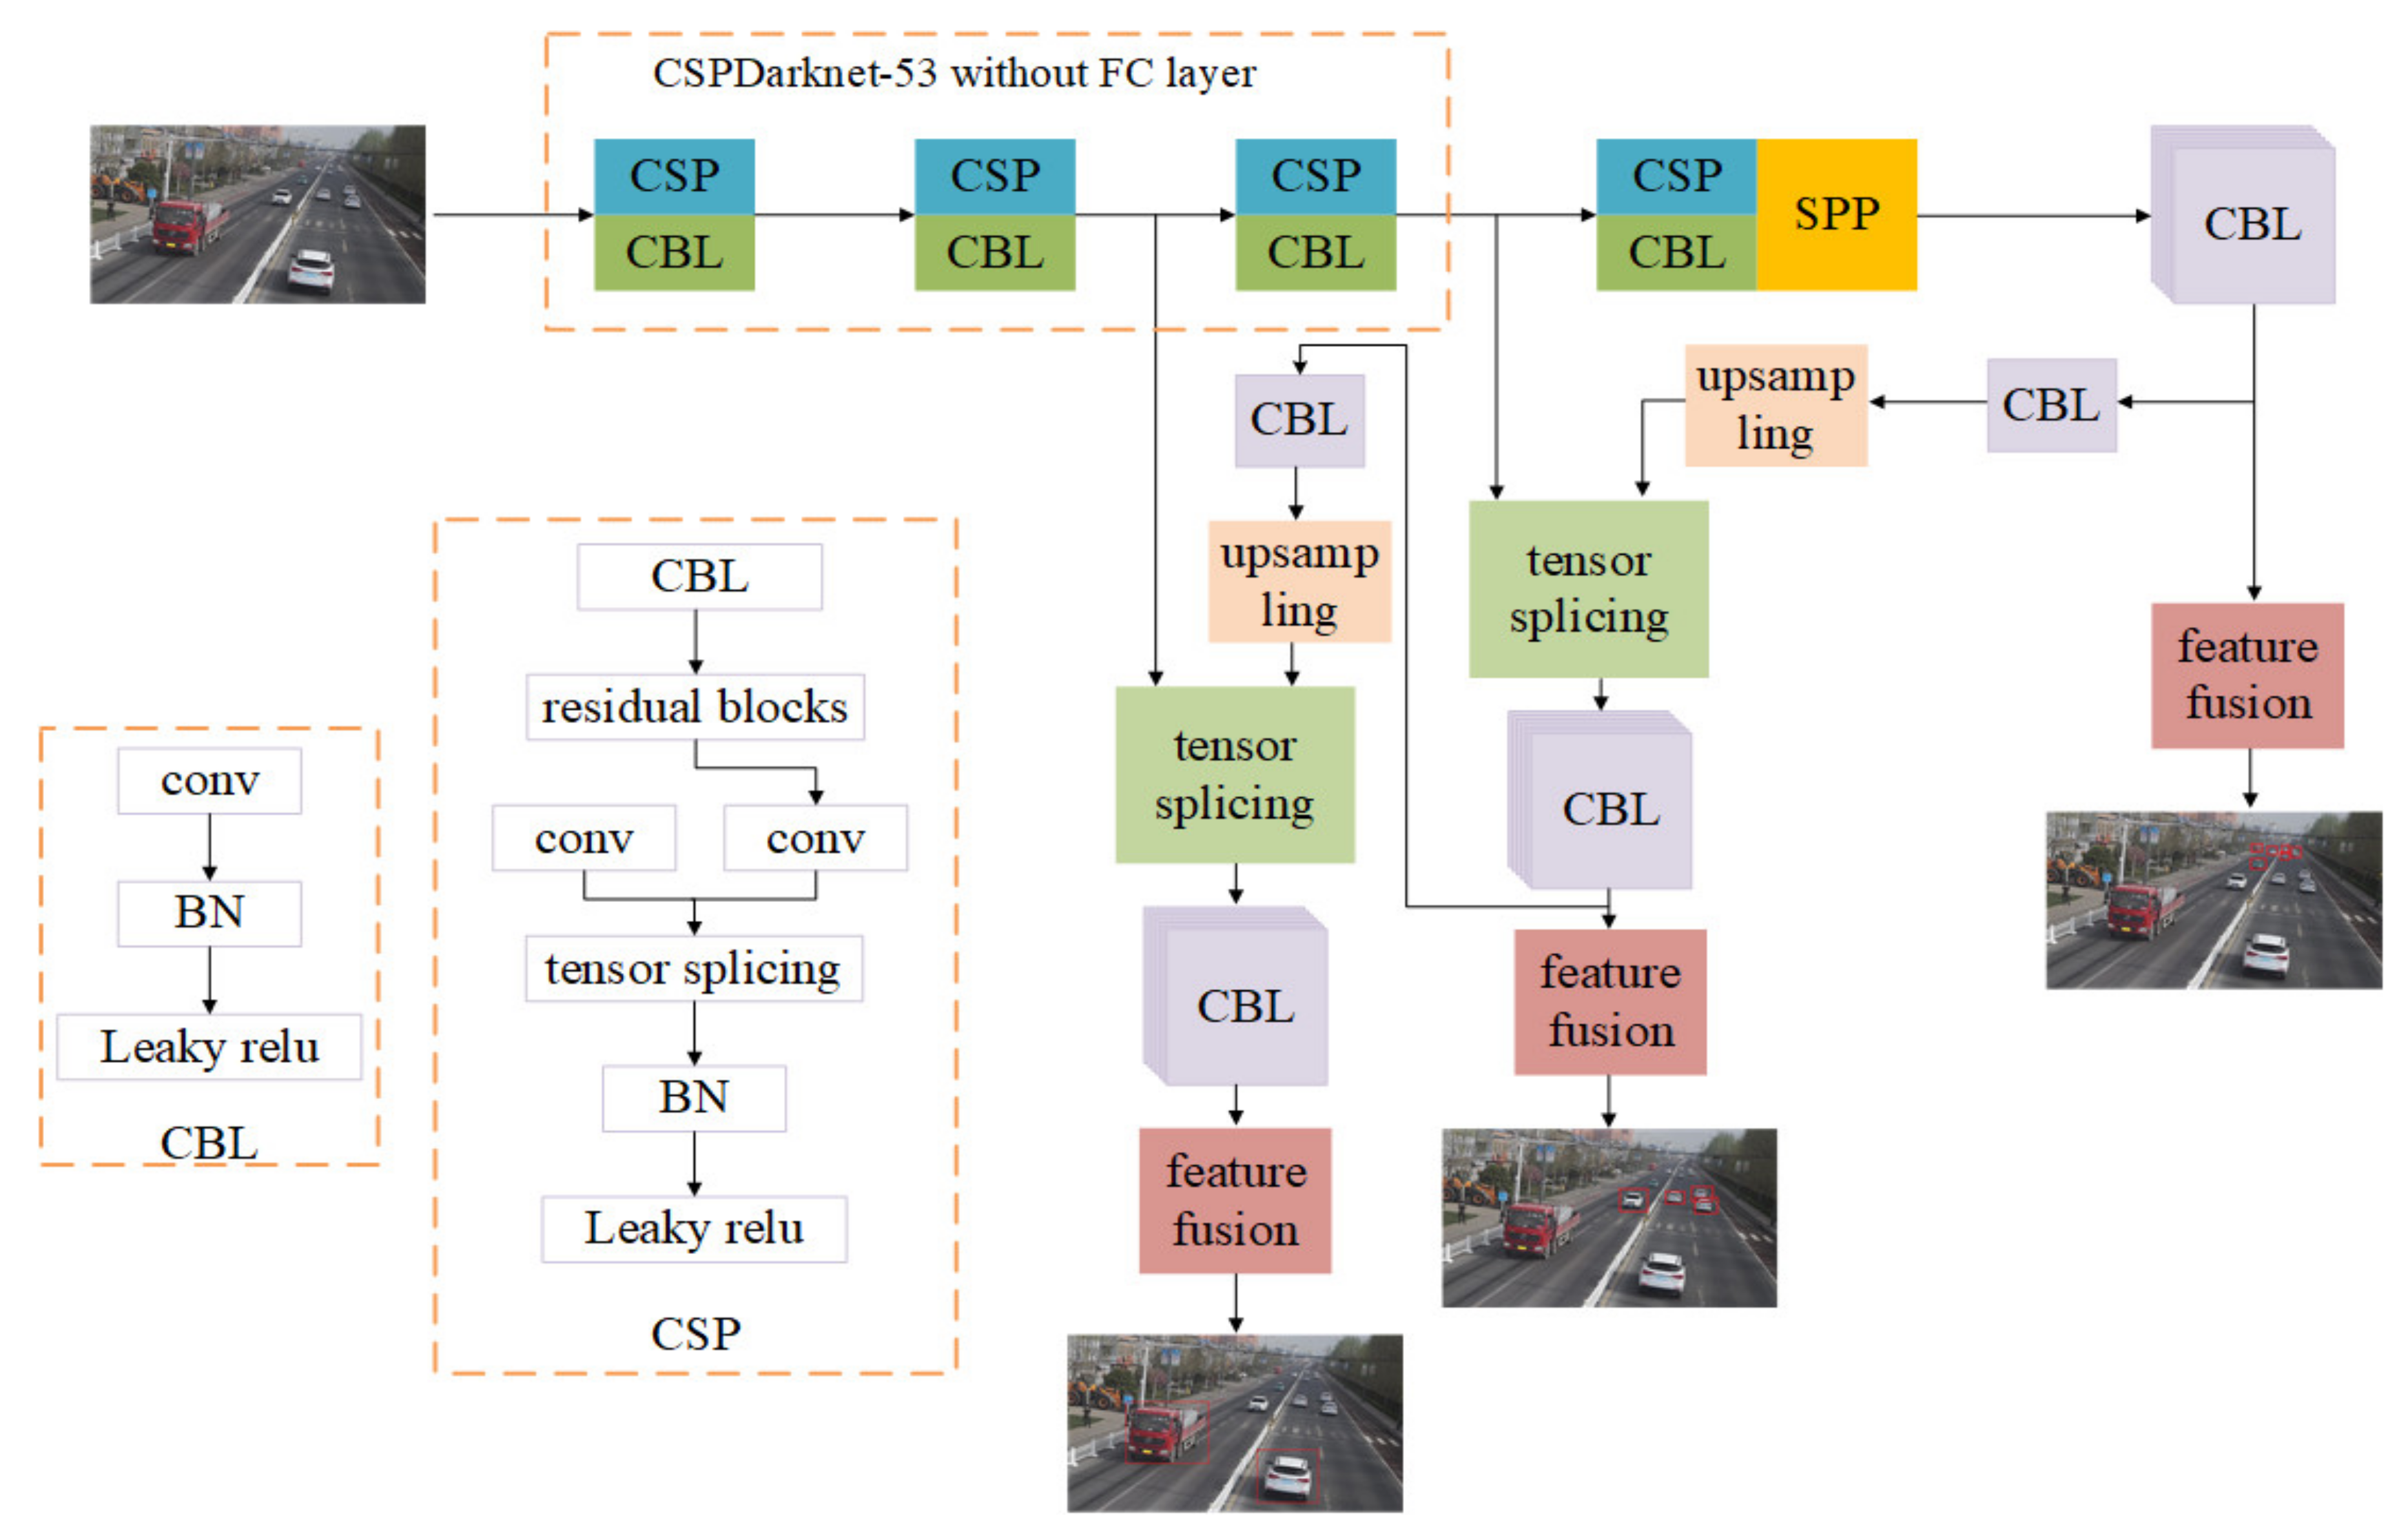
3.2.1. Improved YOLOv3 Detection Model

To improve the speed and accuracy of the network in detecting vehicle targets, Wang, Li et al. [23,24] incorporated an improved CBAM ( convolutional block attention module) attention module, inverse residual network as the base feature extraction layer to further enhance the network detection performance. In this paper, we add the spatial pyramid pooling (SPP) network and cross stage partial (CSP) network to the YOLOv3 network model to improve the learning ability of the convolutional neural network while making the original network more lightweight and reducing the computational effort of the model.
CSPDarknet-53 is the backbone network, which is formed by the fusion of Darknet-53 network and CSP network. Darknet-53 network mainly consists of 53 convolutional layers, and the speed of operation is accelerated by building a large number of residual blocks and setting jump connections between convolutional layers, without pooling layer and fully connected layer. CSP network structure is to split the original features into two parts and perform tensor stitching on one part of the features and the other part of the features after convolutional operation as the output. One part of the features is convolved, and the other part of the features and the convolved features are tensor spliced as the output.
The CBL network is composed of Conv, the optimization function BN and the activation function Leakyrelu, and the CBL network is the basic unit of the vehicle feature detection network.
The SPP network, called spatial pyramid pooling network, is a convolution kernel sliding over the image, which has no relationship with the size of the input image to the network, but only convolves feature maps of different sizes for images of different sizes. As shown in Figure 2, the network first divides the input feature map into three different sets of regular grids, and then extracts the features in the different grids of the division in turn, one kind of feature for each grid, and finally the 21 extracted features constitute a kind of 21-dimensional feature vector with three fixed sizes passed to the fully connected layer, thus realizing that any size feature map can be converted into a fixed size feature vector for output.
The improved network structure mainly consists of CSPDarknet-53 feature extraction network, CBL network, CSP network and SPP network. The surveillance video images are used as the input of the network, and the CSPDarknet-53 feature extraction network is responsible for extracting the target feature information. the SPP network is responsible for the fixed size processing of the feature vector. The target features to be detected are divided into 3 different sizes of feature maps by feature fusion, and finally the 3 different sizes of feature maps are detected. The improved network structure is shown in Figure 3.

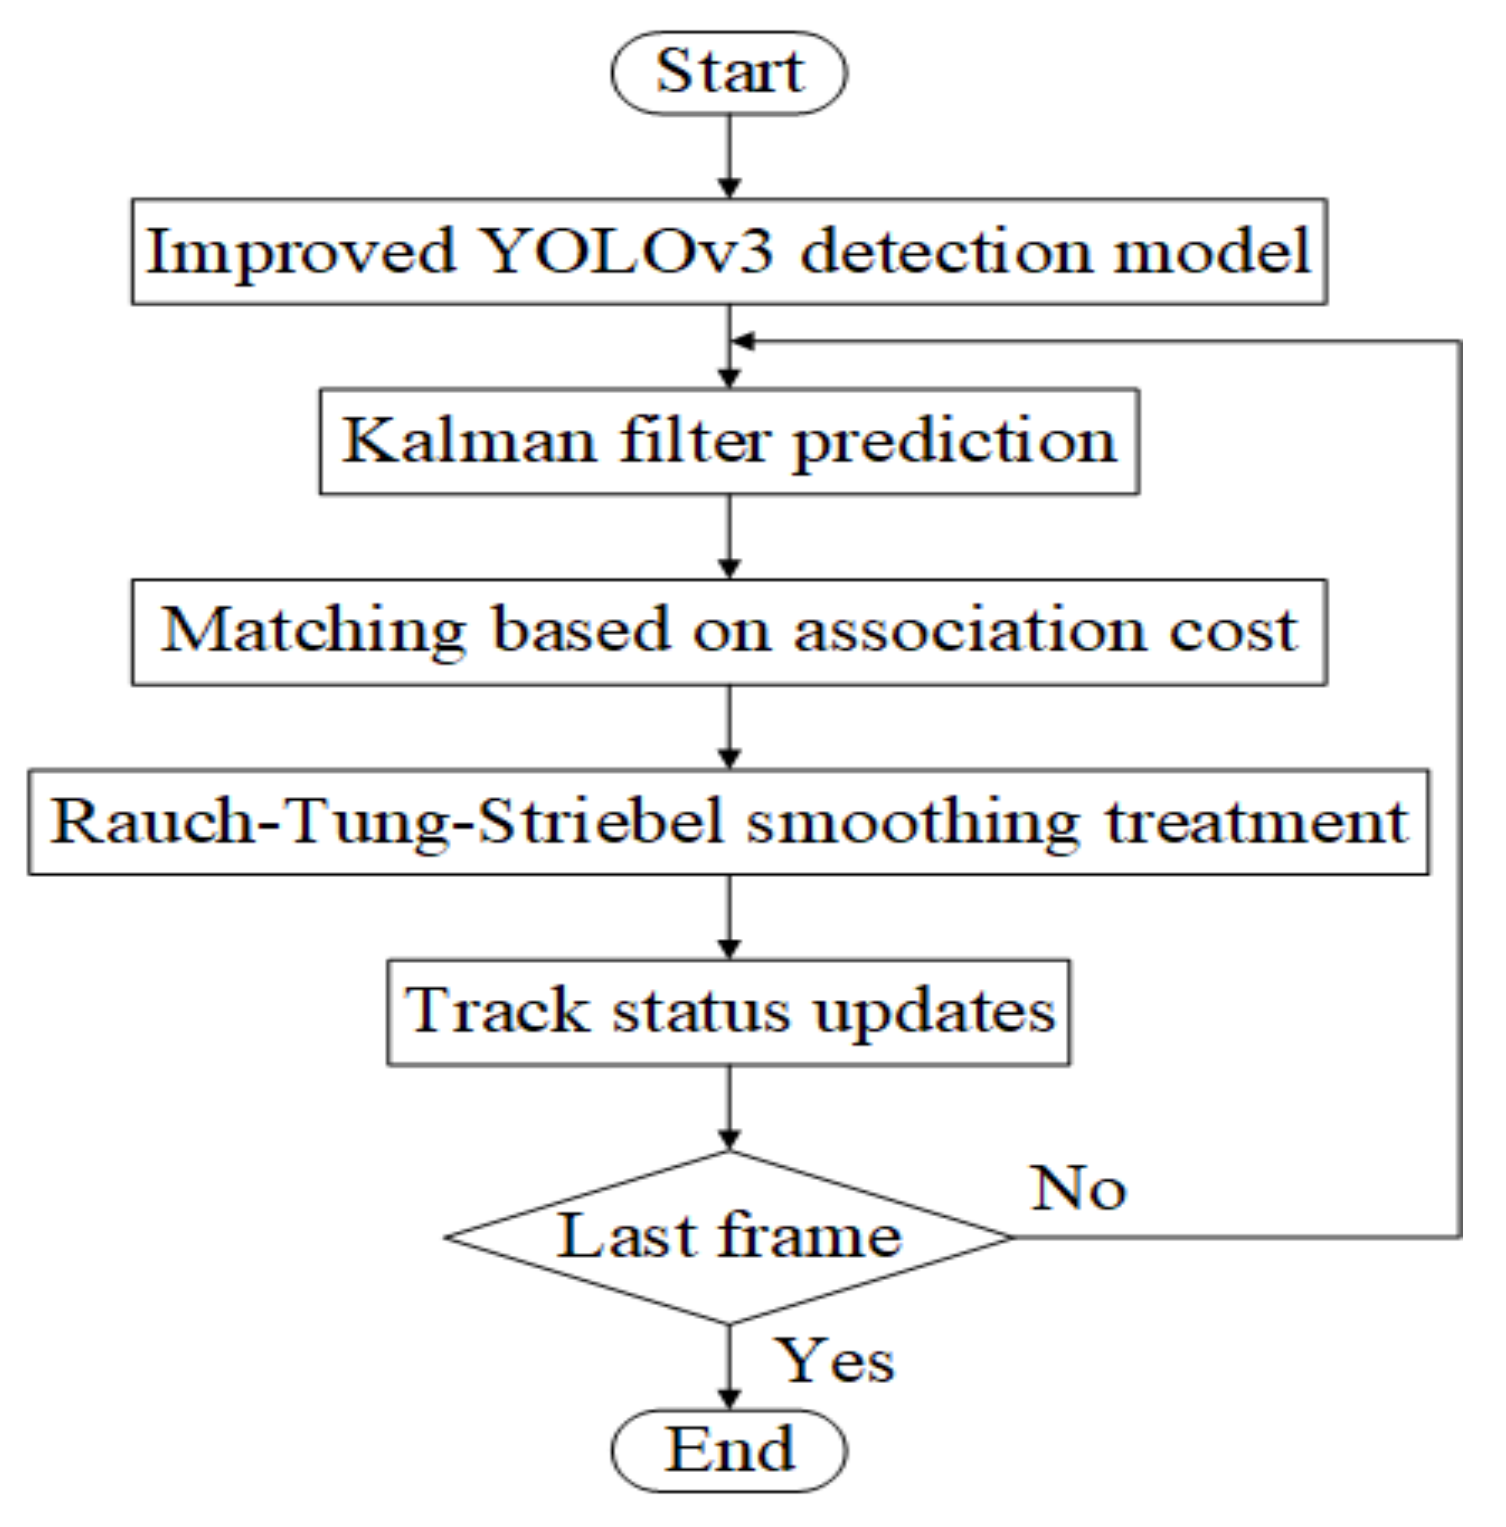
3.2.2. Detection-Based Target Tracking Methods

Extracting the driving status of a vehicle through a weighing area requires the implementation of vehicle target tracking. The Kalman filter algorithm is used to predict the position of the vehicle target that will appear in the next frame, which in turn calculates the status information of the vehicle. Then the current video frame is detected using the improved YOLOv3 vehicle target detection model to obtain the detection frames of all vehicle targets on the road. The results of vehicle target detection and tracking are costed using a fusion metric, which requires the calculation of not only motion similarity but also appearance similarity to improve the accuracy of matching. Combined with the Hungarian matching algorithm to correlate the vehicle detection and tracking results, the trajectory is smoothed using RTS (rauch–tung–striebel), and finally the parameters of the model and Kalman filter are updated to achieve continuous and stable tracking of the vehicle target. The vehicle trajectory tracking process is shown in Figure 4.
In the tracking of vehicle targets, the detection results of vehicle targets in the current frame and the tracking trajectories of existing vehicle targets are linked with the great matching of bipartite graphs. The objective function of the binary assignment problem is shown in Equation (1), where x i , j denotes the result of the i tracking trajectory assigned to the j detection, and c i , j denotes the corresponding assignment cost.
min c i , j x i , j i > 0 x i , j = 1 j > 0 x i , j = 1 x i , j 0 , 1

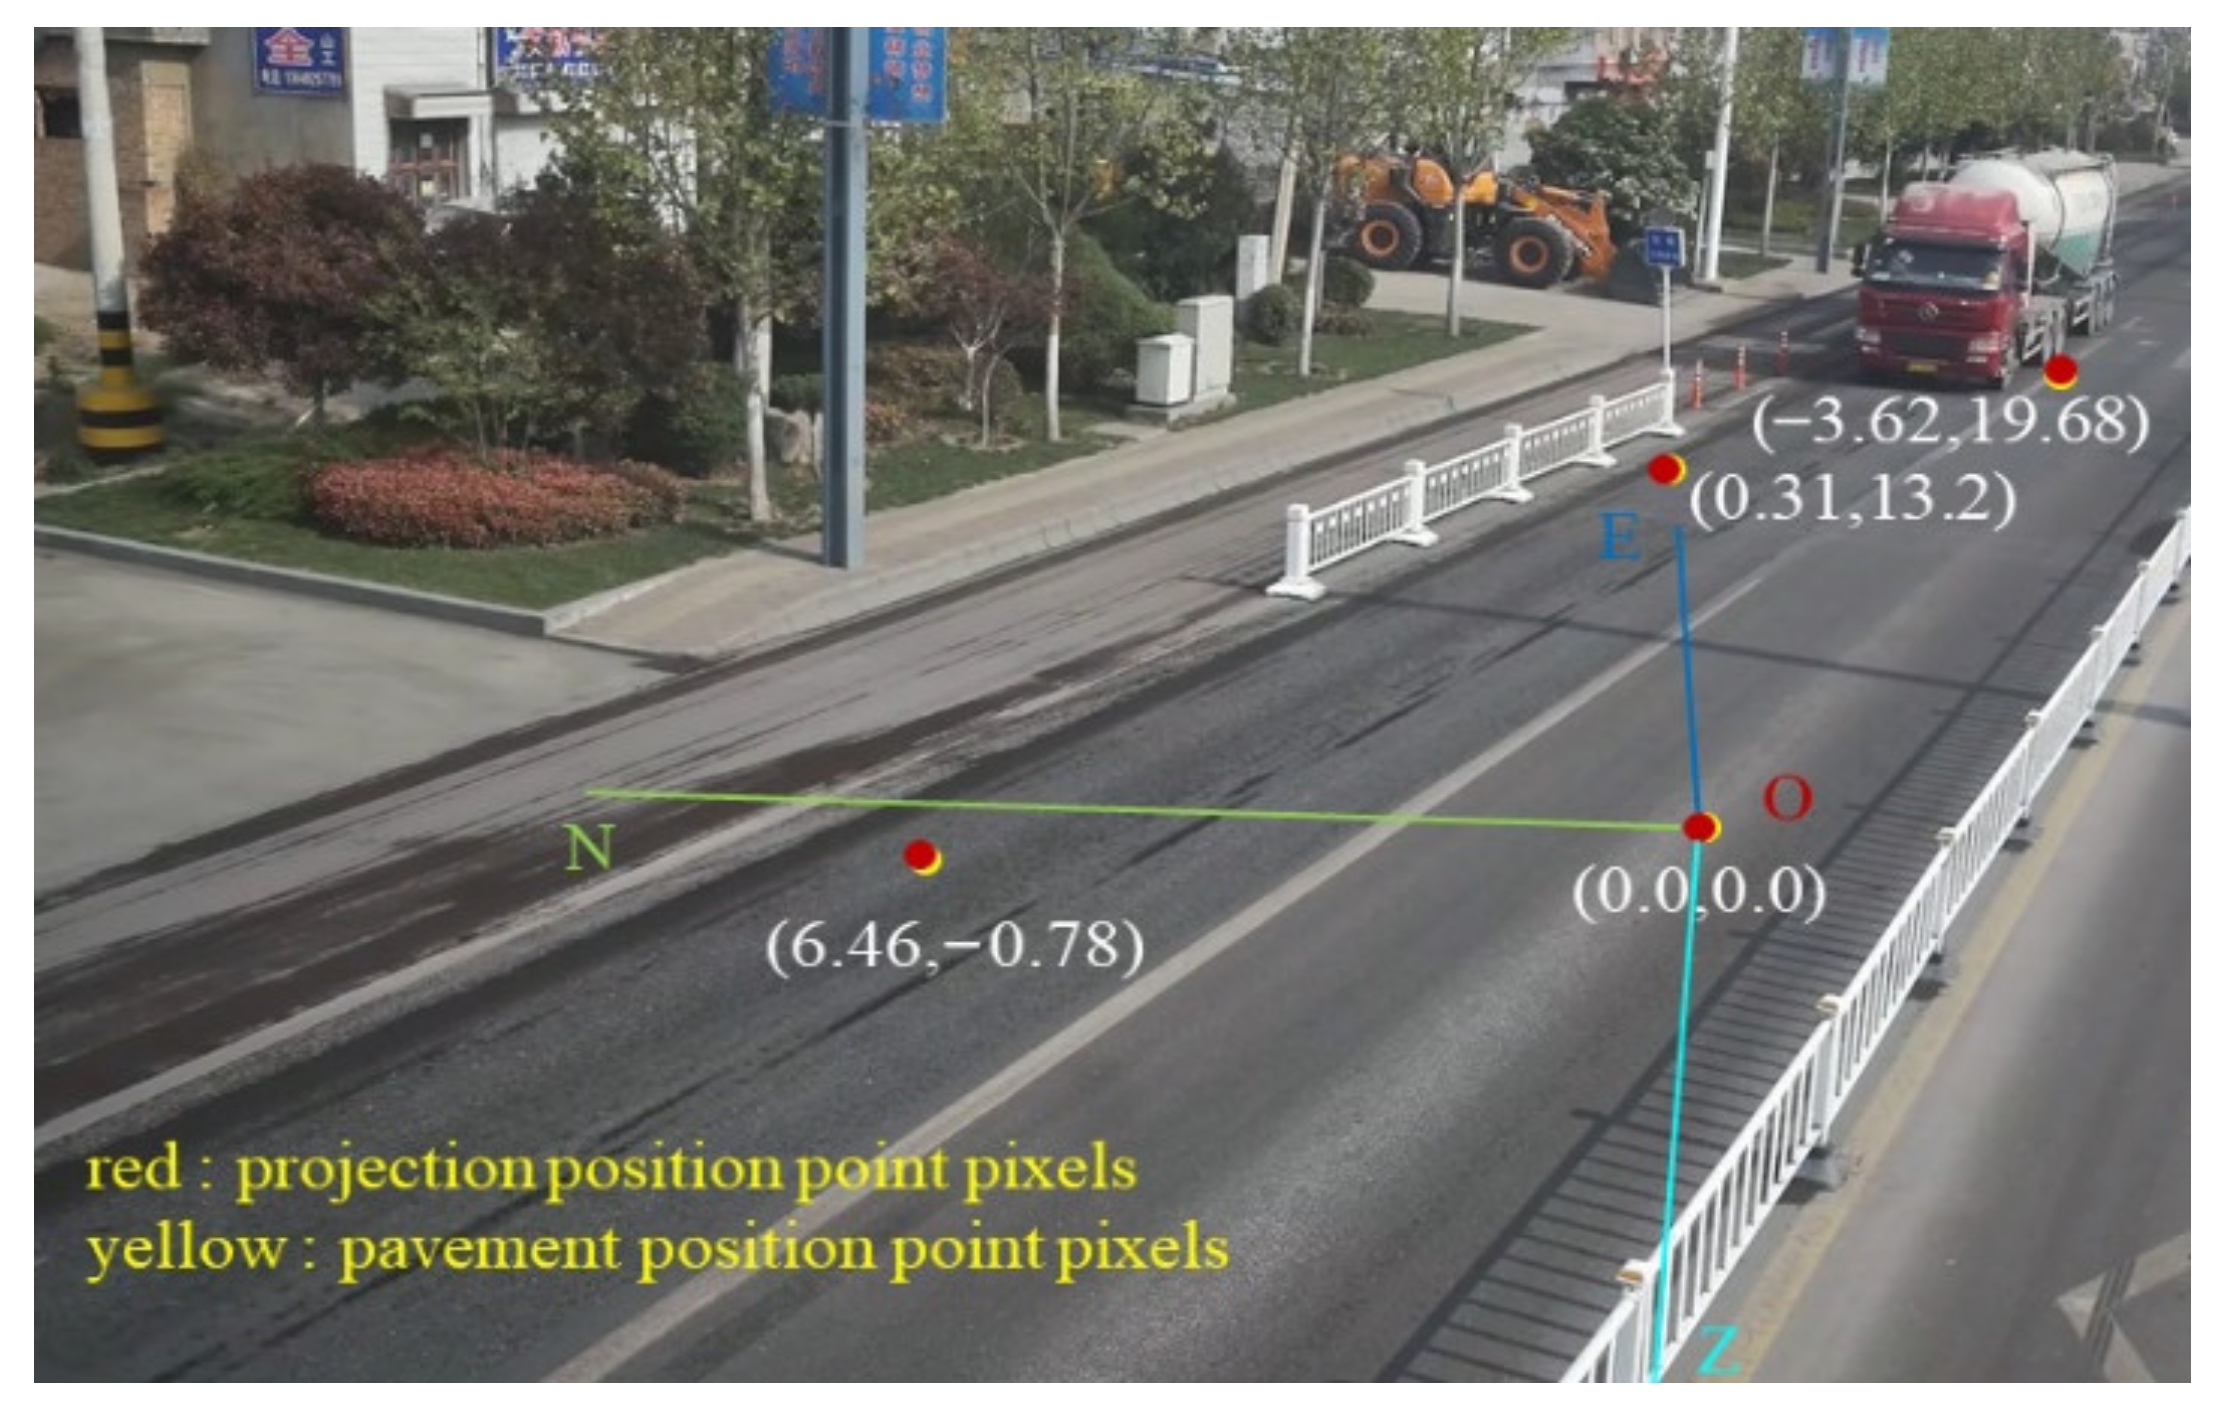
3.2.3. Coordinate Conversion

Extracting information about the vehicle’s driving status requires converting the pixel coordinates in the image to world coordinates and calibrating the surveillance camera. Xing et al. [25] used dynamic map convolutional neural networks to obtain the position of the target in the point cloud for coordinate transformation under real working conditions. Camera calibration often uses self-calibration techniques based on the extended Kalman filter and the fundamental matrix [26,27].
In this paper, a GPS-based calibration method for camera parameters is used. In the calibration process, GPS accurate coordinates are used instead of calibration templates, which can effectively avoid the calibration errors caused by the low accuracy of calibration templates. First, GPS data at four different locations on the road surface and the corresponding image data are collected. Then, coordinate conversion is performed according to the relationship between the GPS coordinate system and the world coordinate system to obtain the coordinates of the four different locations in the world coordinate system and the image coordinate system. Finally, the camera parameter matrix is solved according to the camera imaging model.
Choose any point as the origin O, with the direction due north of O as the positive direction of the x-axis, the direction due east of O as the positive direction of the y-axis, and the vertical ground down as the z-axis. Establish a rectangular coordinate system as the world coordinate system and convert the GPS coordinates of other points to this coordinate system. Due to the high level of the pavement in front and behind the installation of the weigh-in-motion system, this section of the pavement is specified here as plane z = 0. The camera imaging model is shown in Equation (2).
s i u i v i 1 = m 11 m 12 m 13 m 21 m 22 m 23 m 31 m 32 m 33 X i Y i 1
where si is the scale factor, α is the coordinate representation of different positions in the world coordinate system, β is the coordinate representation of different positions in the image coordinate system, and M is the camera parameter matrix. The camera parameter matrix M is solved by the direct linear transformation method based on the world coordinate system and the corresponding image coordinates at the four known locations.
α = X i Y i 1
β = u i v i 1
M = m 11 m 12 m 13 m 21 m 22 m 23 m 31 m 32 m 33
As shown in Figure 5, the red points are the pixel coordinates after the projection transformation, and the yellow points are the pixel coordinates of the road position points. It can be seen from the figure that the red points and yellow points basically match before and after the projection conversion. By actually measuring the distance between the four points compared with the coordinates after conversion, the maximum coordinate error is 0.201 m, and the relative error is 1.3%. This is able to achieve the accuracy requirement for the estimation of vehicle driving status.

4. Experimental Procedure and Results Analysis

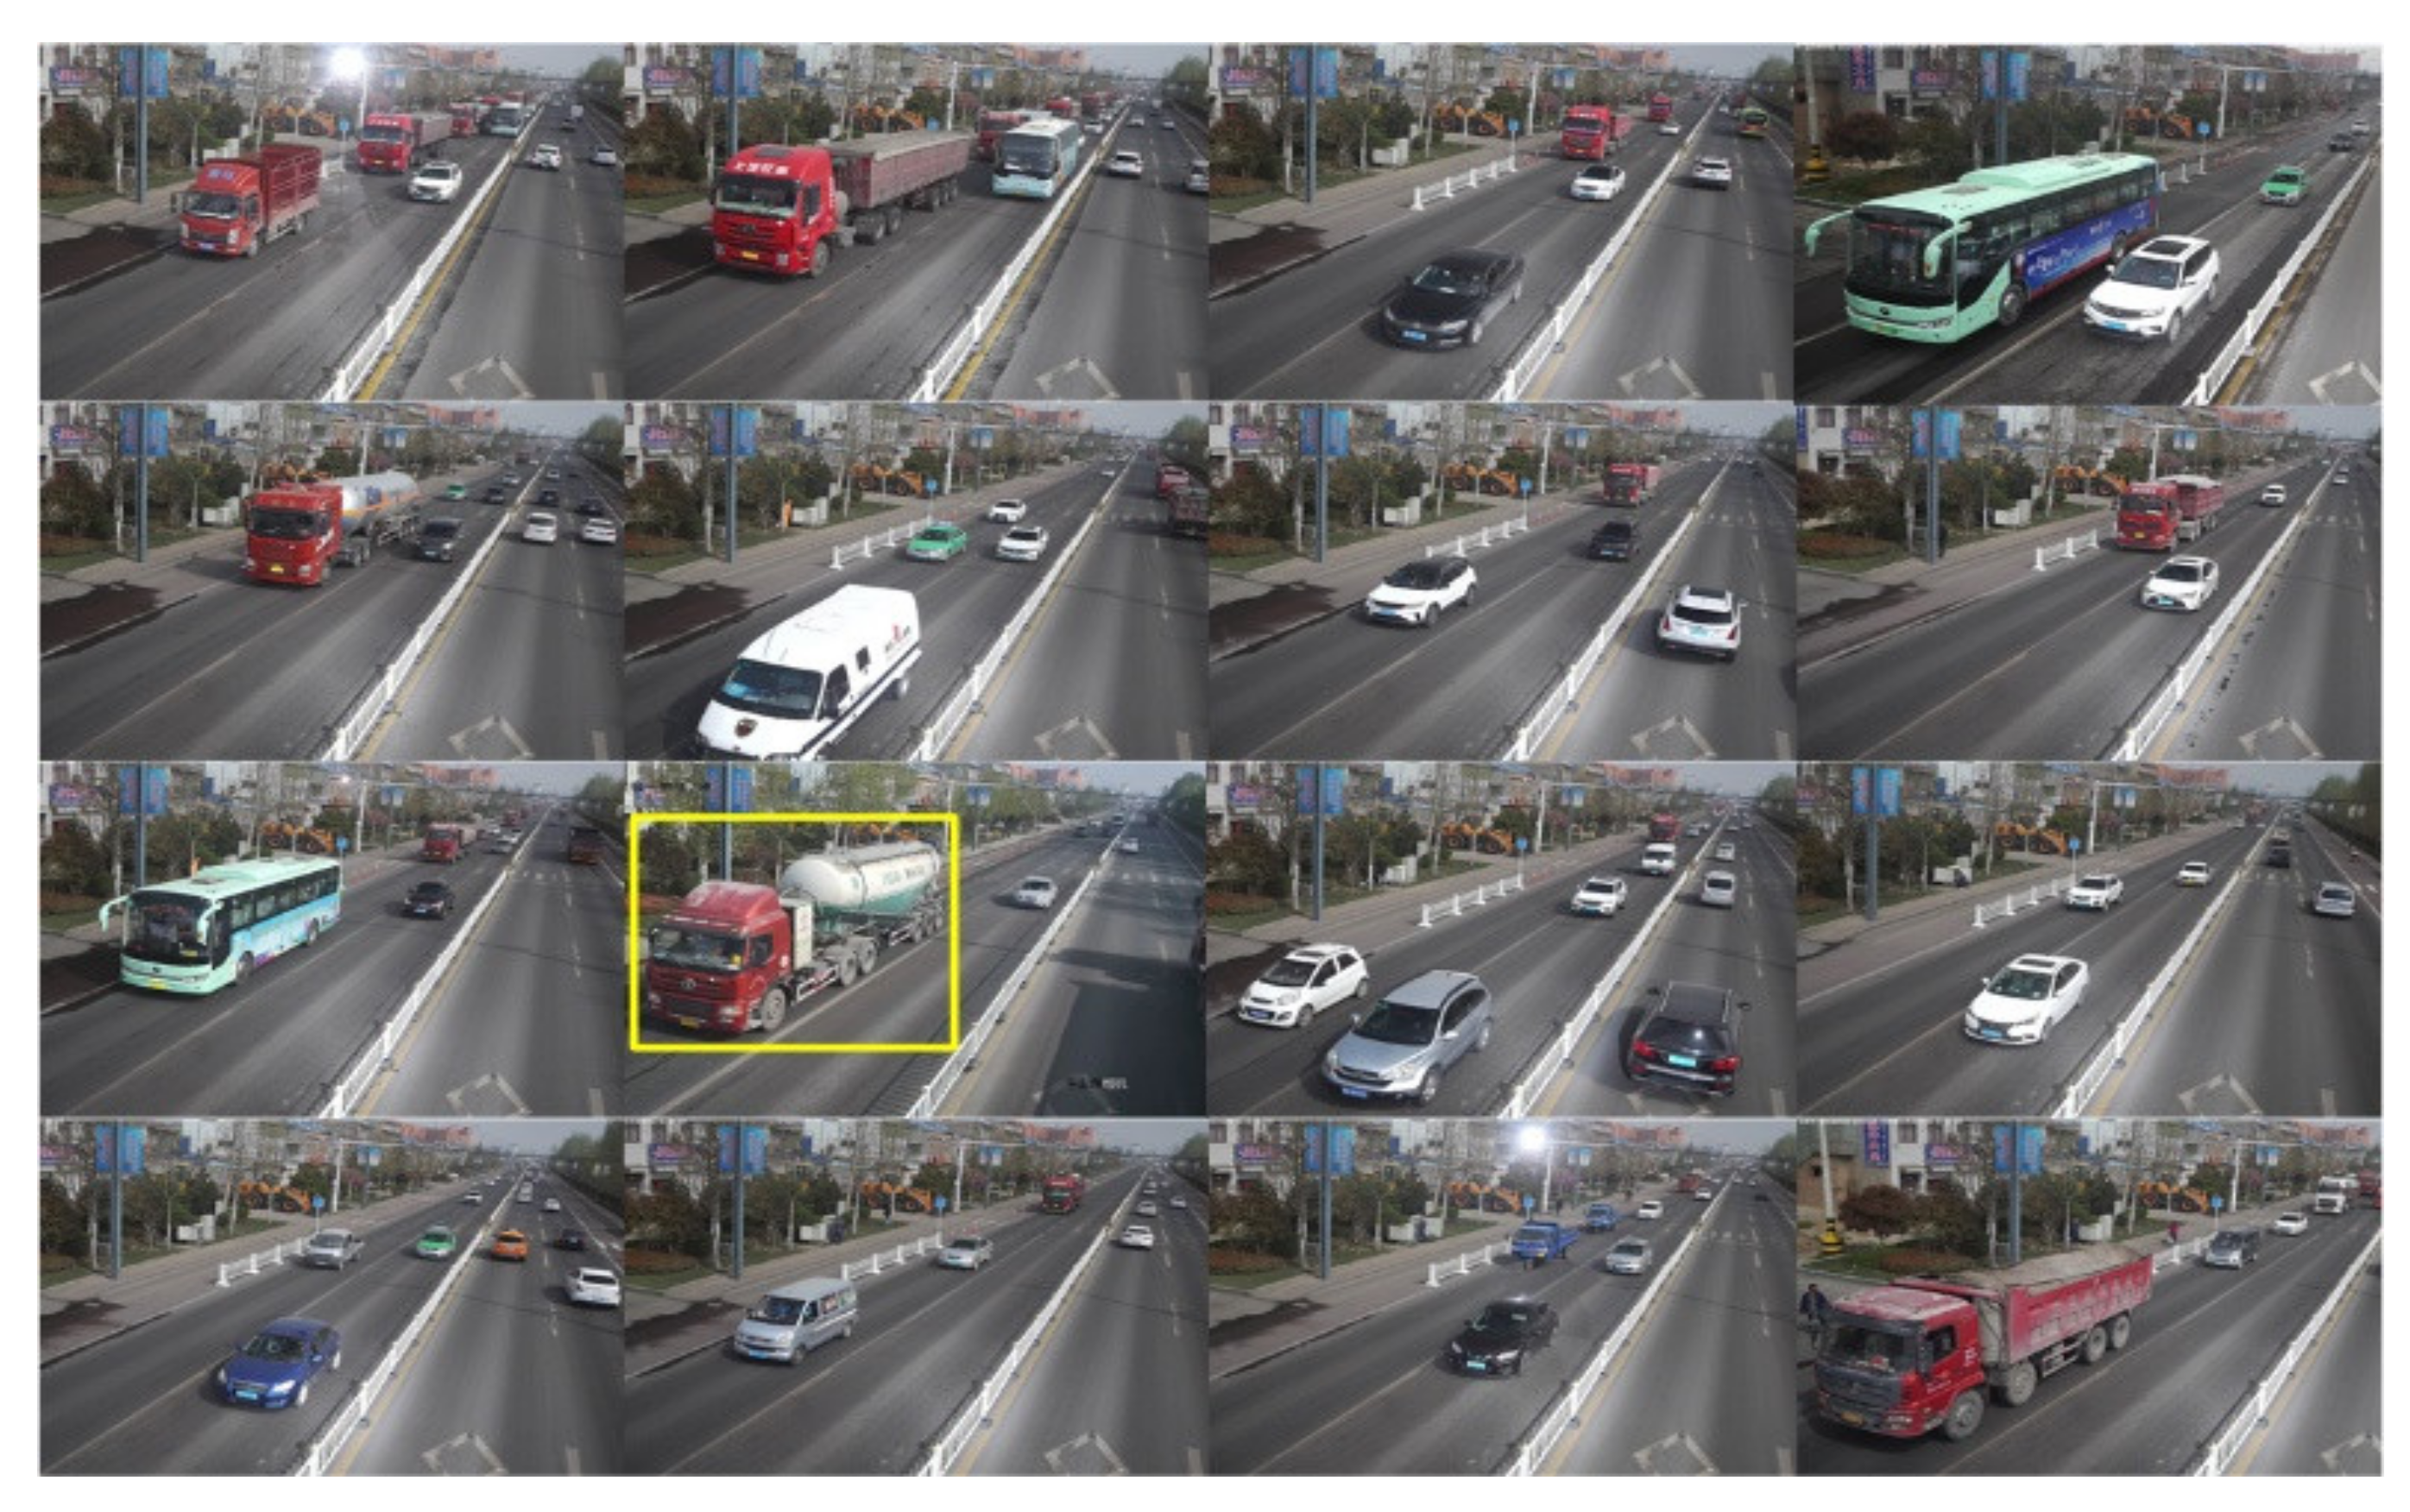
4.1. Data Collection

Some images from the existing datasets PascalVOC2007 and PascalVOC2012 and the surveillance video images from the WIM system of Tongchuan Super Control Point were selected as the datasets for the vehicle detection model in the experiment. Matlab was used to process the surveillance video into a single frame, remove the blurred images, and finally use the LableImg tool to make the dataset in VOC format. The final experimental dataset consists of 3306 images for trucks, 4205 images for cars, and 1853 images for buses. The dataset is divided into training set and test set in the ratio of 9:1. Figure 6 shows some of the image samples from the surveillance video of the WIM system.
The weighing data of the vehicles were collected from the WIM site of the truck for overloading in Xiaoxi Village, Tongchuan City, which works around the clock. Since the real weight of the truck on the road is not known, this paper takes the Jidong cement tanker as the research object, such as the vehicle in the yellow box shown in Figure 6. Its transportation company provided us with the real weight of this fleet of vehicles, and due to the calibration settings of the weighing system, the weight of all monitored vehicles was calculated at an average value of 17.5 tons.

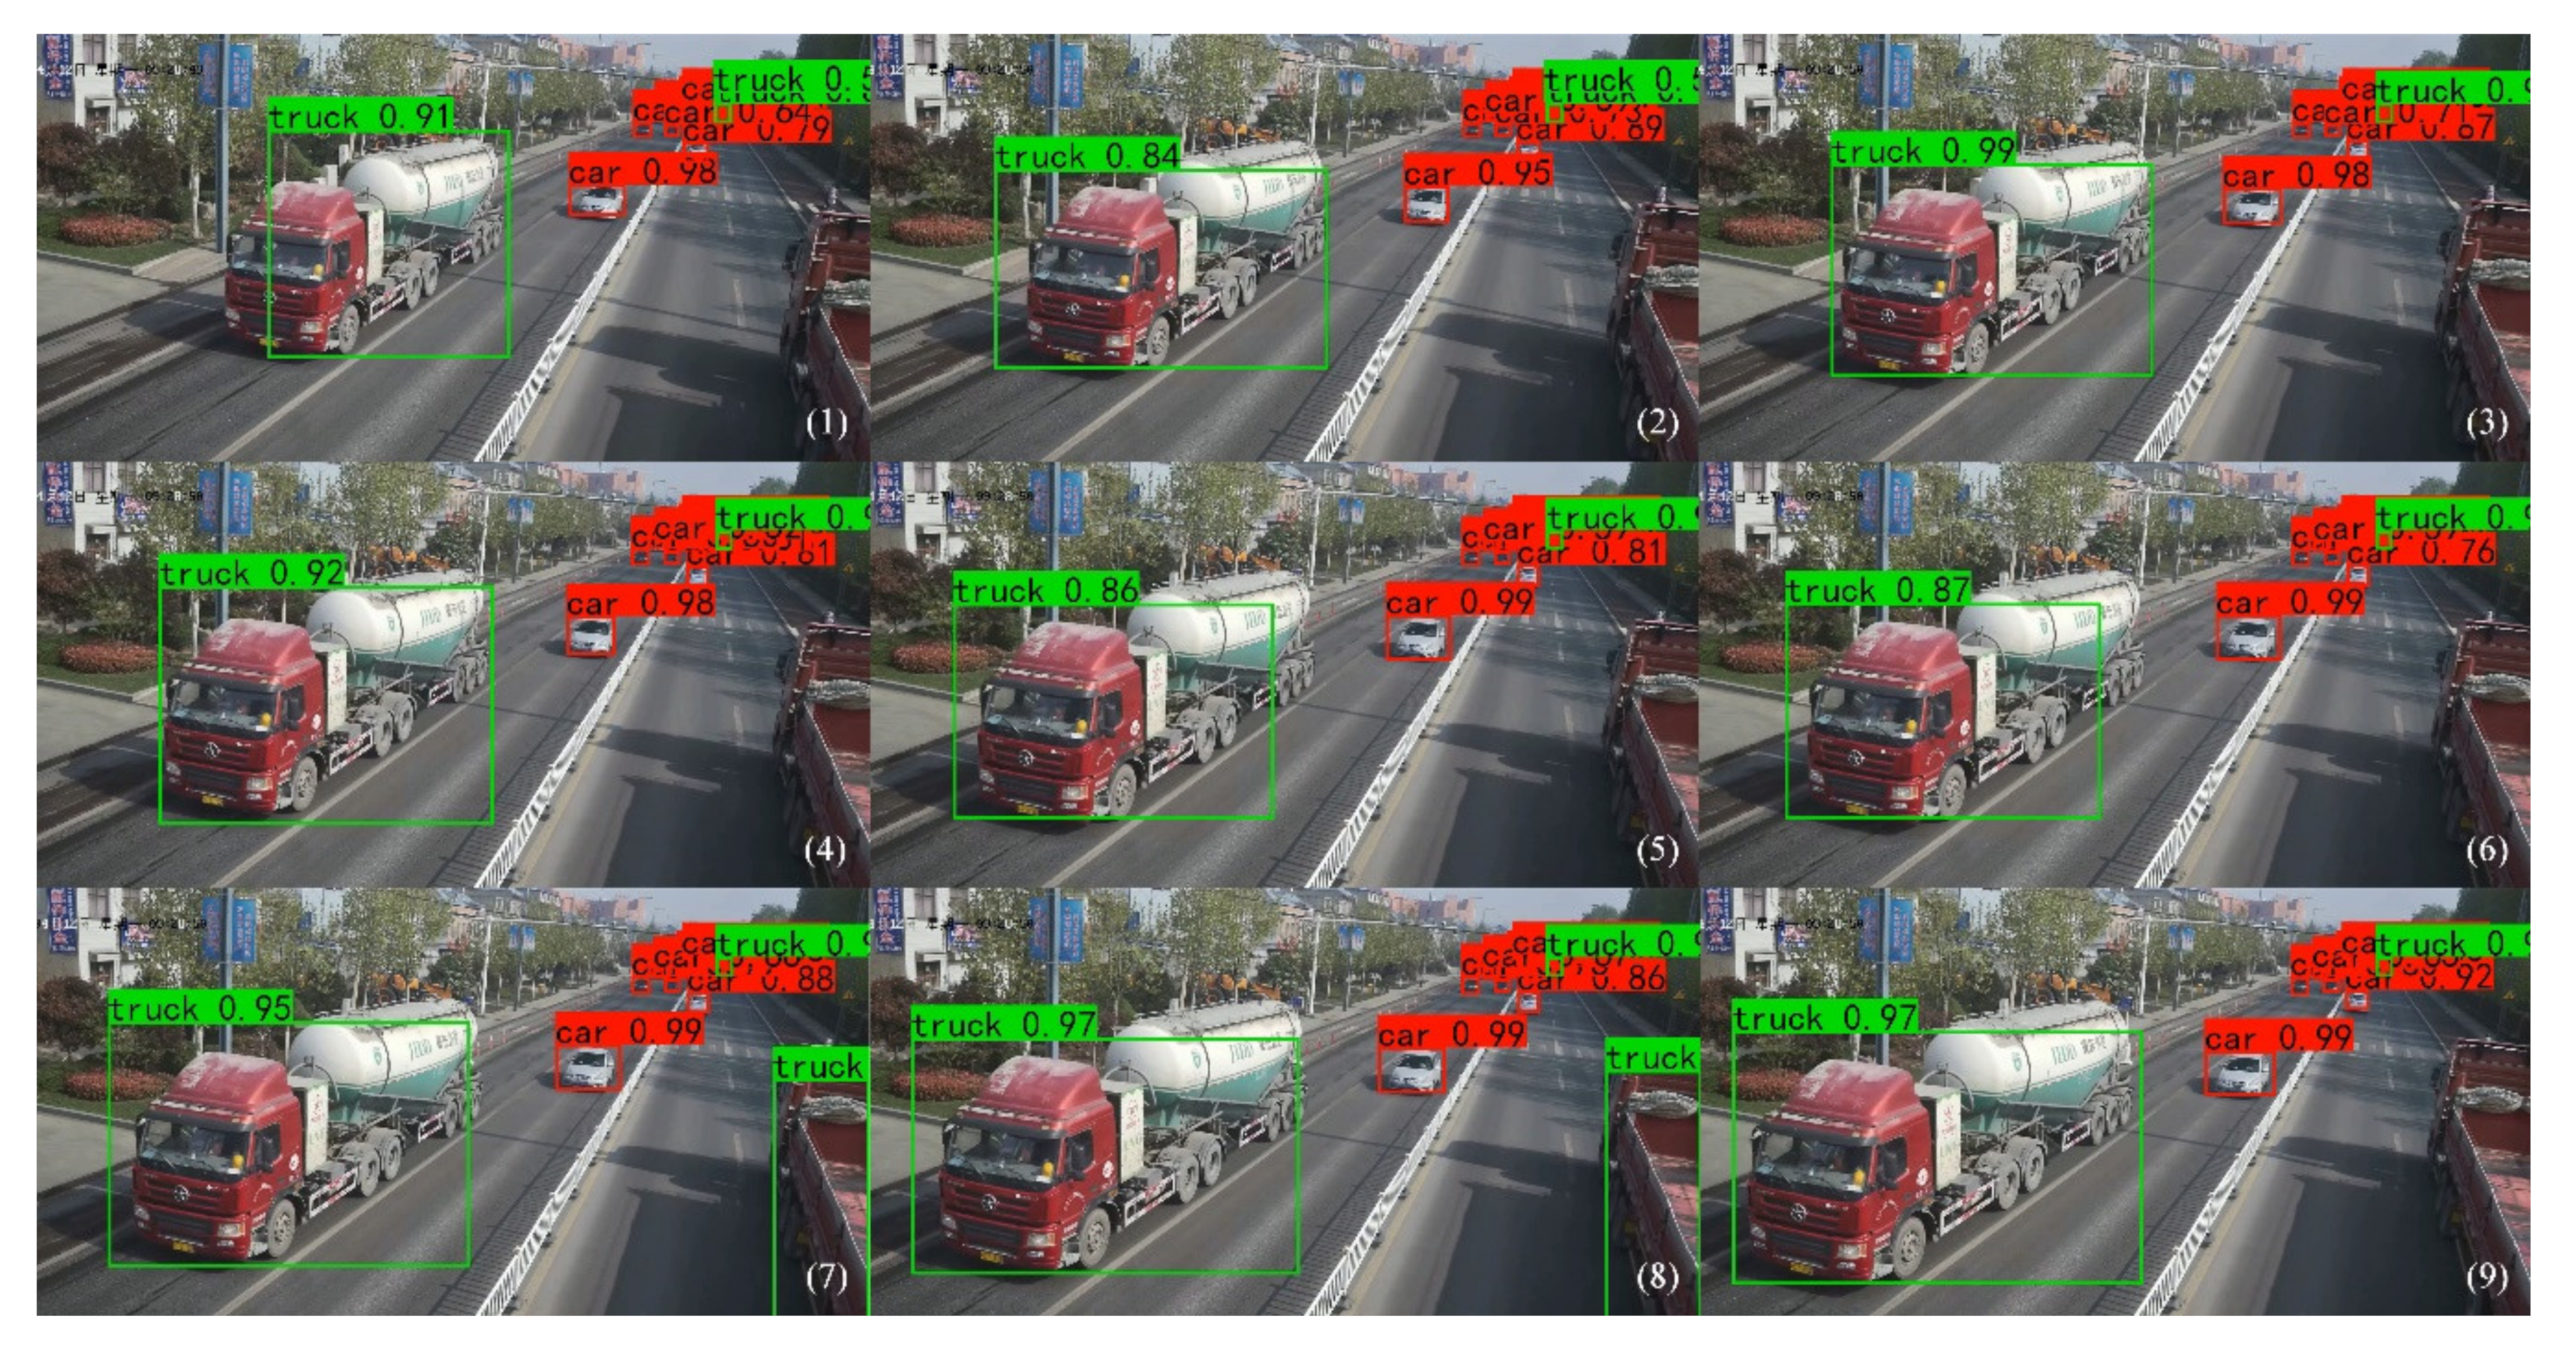
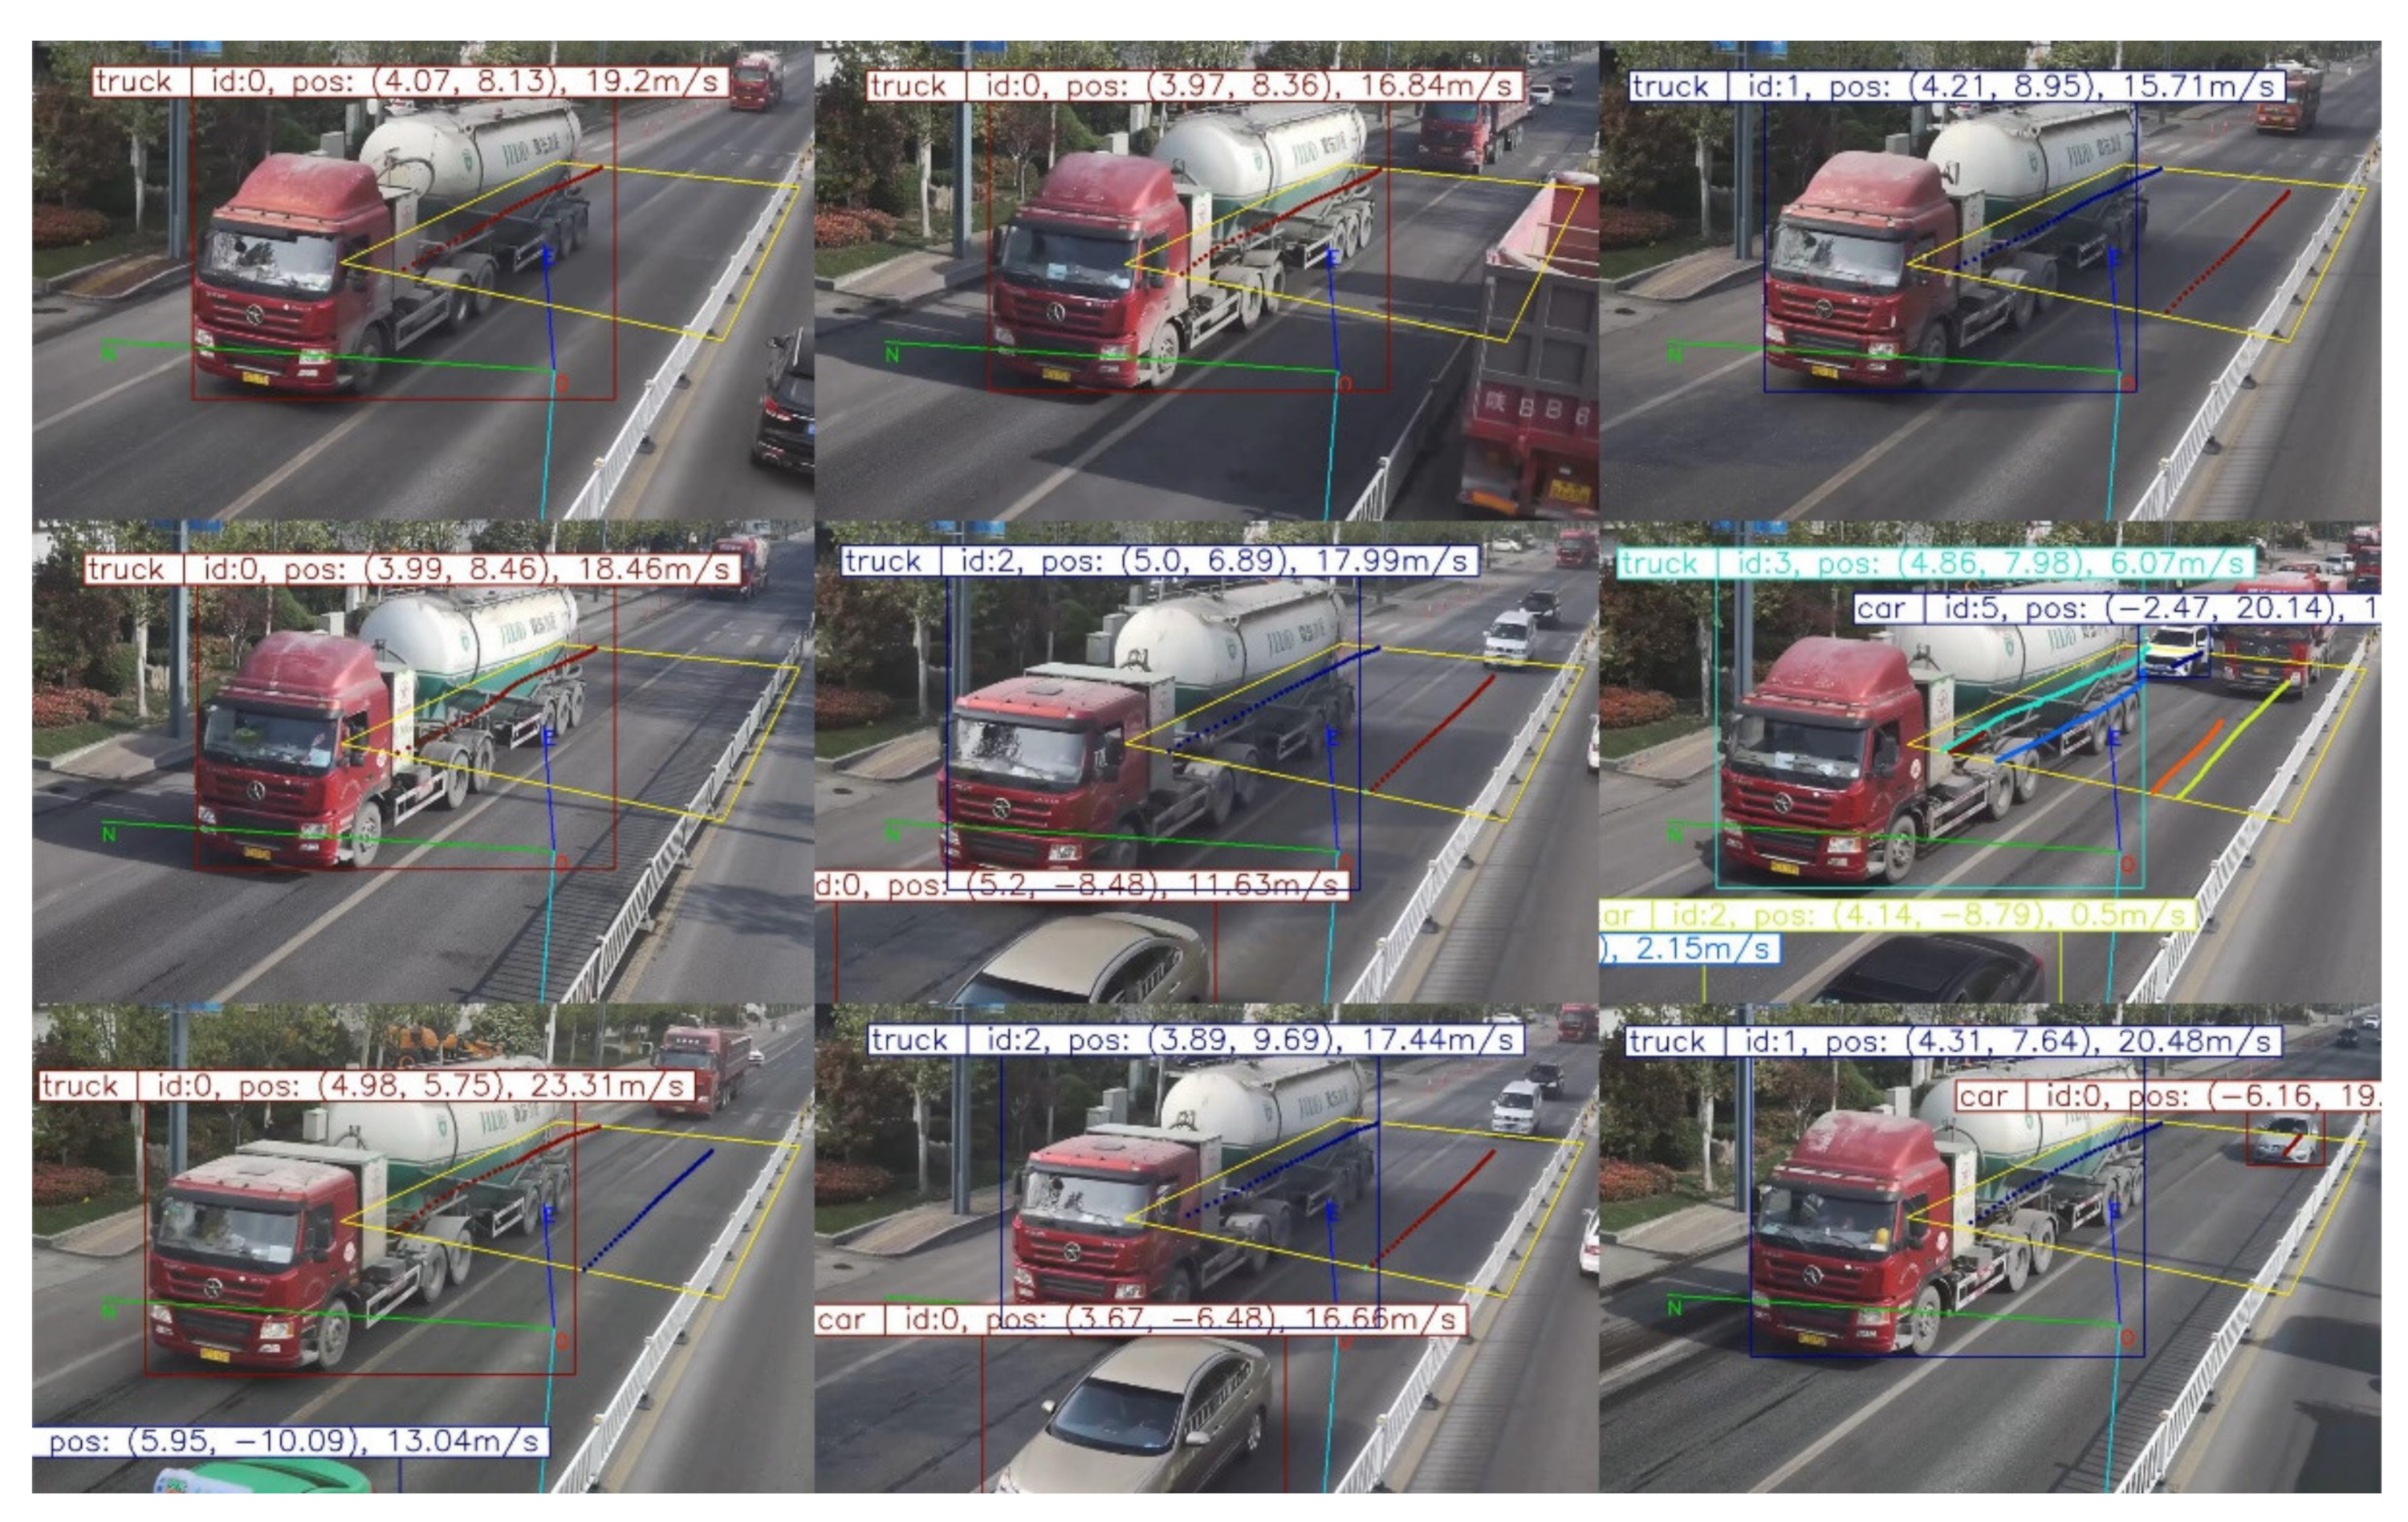
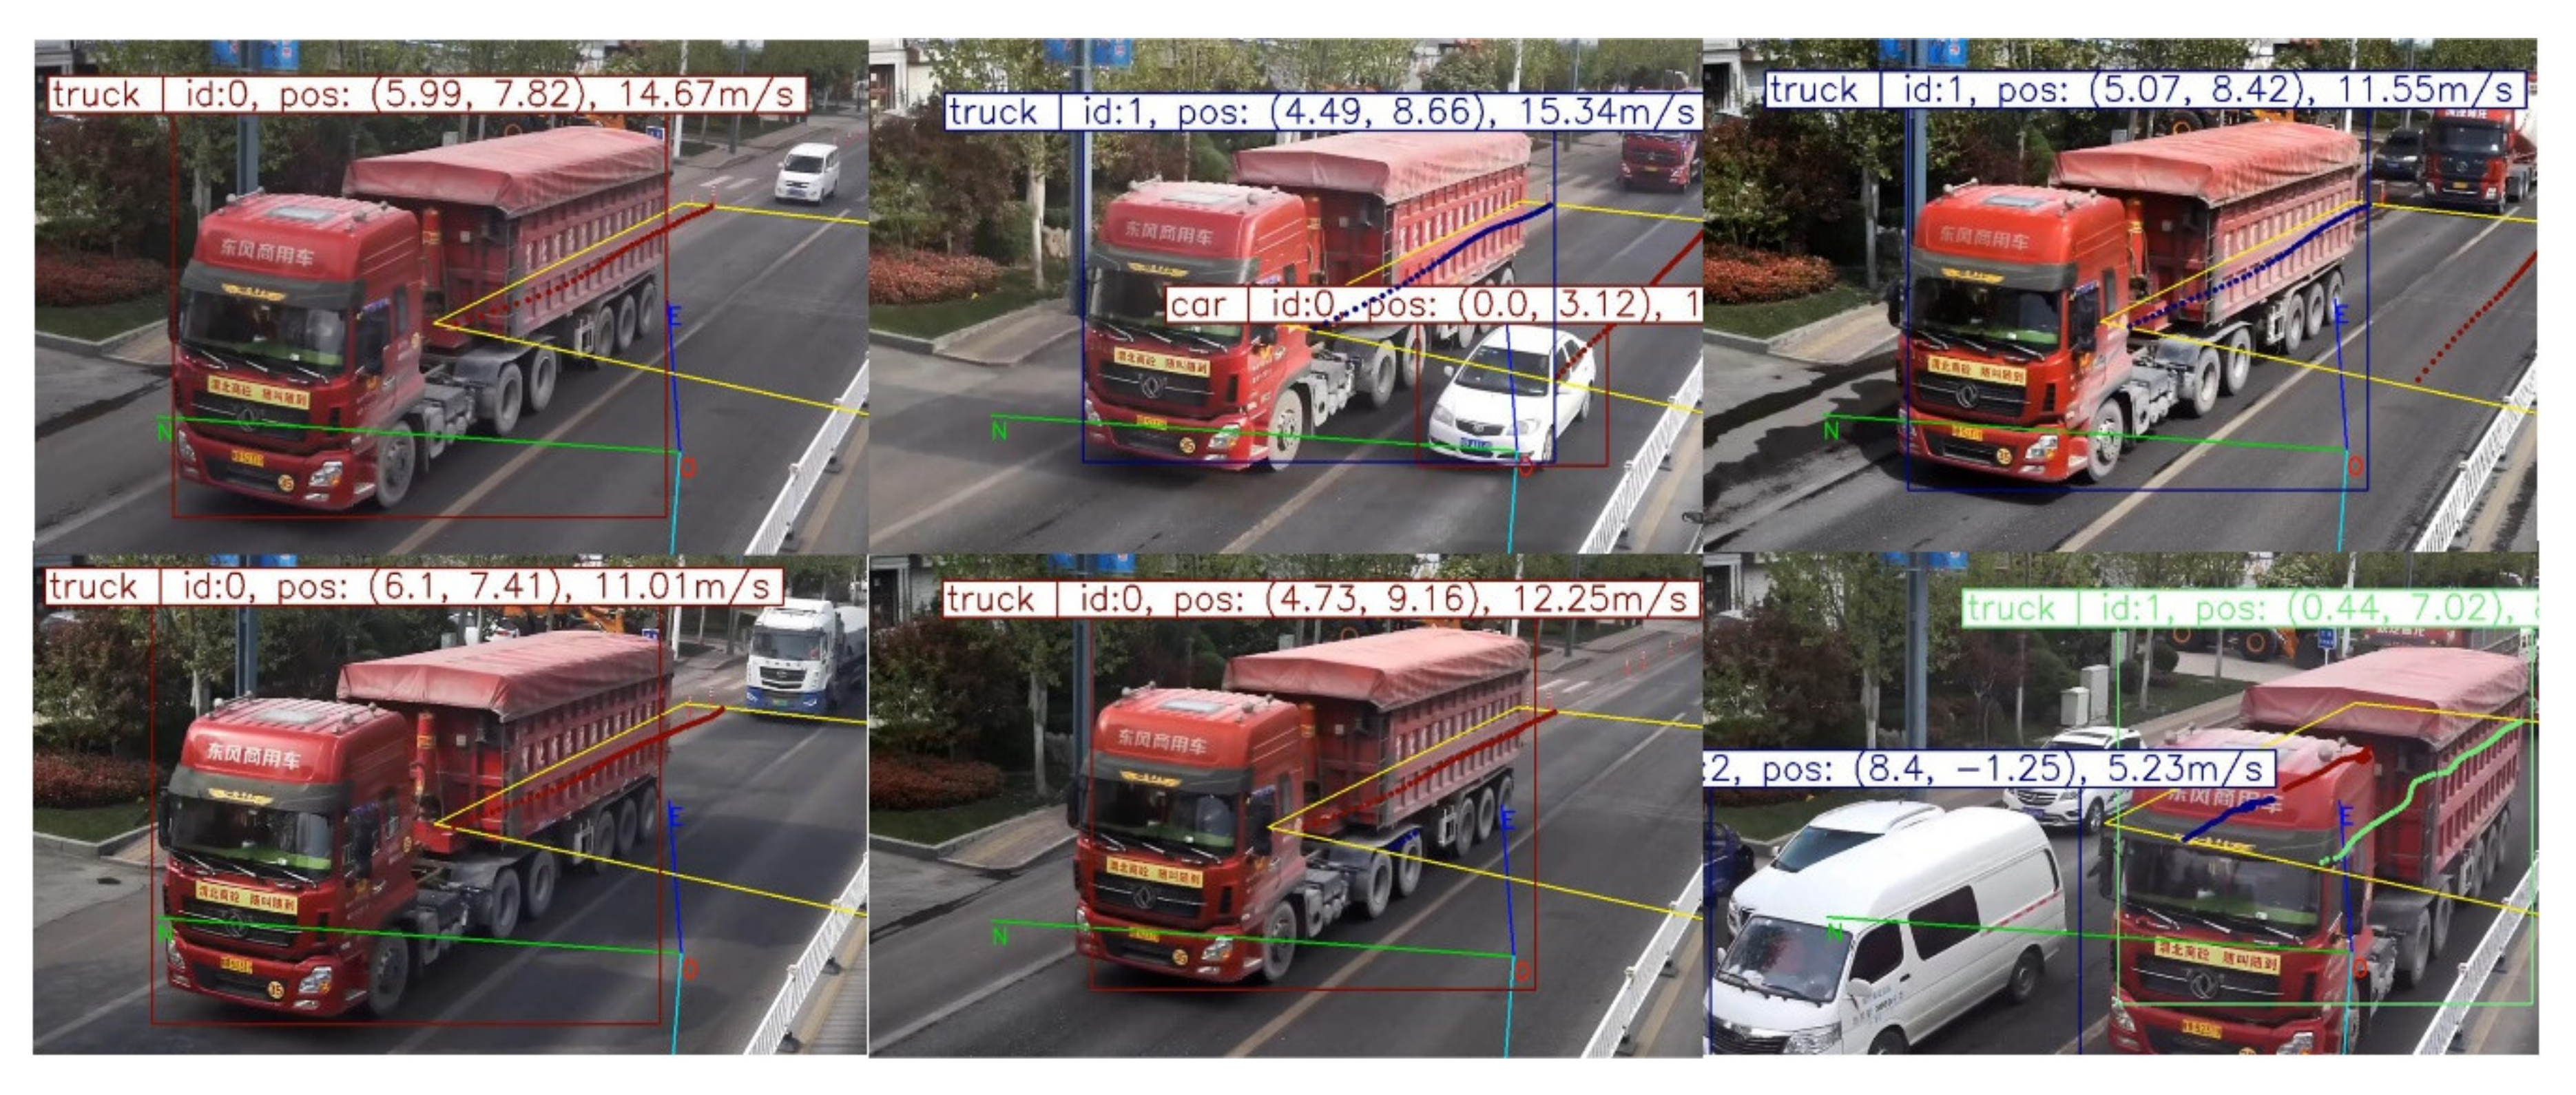
4.2. Analysis of Network Detection and Tracking Results

The hardware used to train the target detection model includes: Intel i7-9700 [email protected] GHz, NVIDIA GeForce RTX 2080 Super 8 GB, 16 GB of memory, the vehicle target detection program is based on the python Pytorch framework, and the training environment is Windows 10 64 + Pytorch (GPU). During the training process of the target detection model, the change of the model loss function is used to determine whether the detection model converges or not. The Loss curve of the training process and the detection accuracy of the van are shown in Figure 7.
From the figure, it can be seen that the model has a large loss value in the first 10 epochs of training and the accuracy of vehicle detection is low, but the loss value decreases very fast and the accuracy increases substantially. After 35 epochs of training, the accuracy improves very slowly and the model gradually stabilizes. The improved YOLOv3 network model in this paper has a high accuracy for truck detection, as shown in Figure 7, the accuracy reaches 94.41%. As shown in Table 1. Although the accuracy is relatively similar to the YOLOv3 detection algorithm, its recall rate and detection real-time have been improved to a certain extent.
The trained target detection model is tested on the test set, and the detection effect of 9 consecutive frames is shown in Figure 8.
Vehicle tracking and driving status information is shown in Figure 9. The weighing monitoring area in Figure 9a is a rectangular box of 8 m × 15 m, and the weighing area is a rectangular box of 8 m × 2 m. The points of different colors in Figure 9b represent the trajectories of different targets driving. It can be seen from the figure that the tracking effect of the vehicle is more accurate, and it can accurately capture the driving trajectory and state information of the vehicle.
Thus, through the monitoring video of WIM system, the driving status information of 467 such trucks through the weighing area is extracted, as shown in Figure 10 is the drawing of the driving status information extraction effect of some trucks.

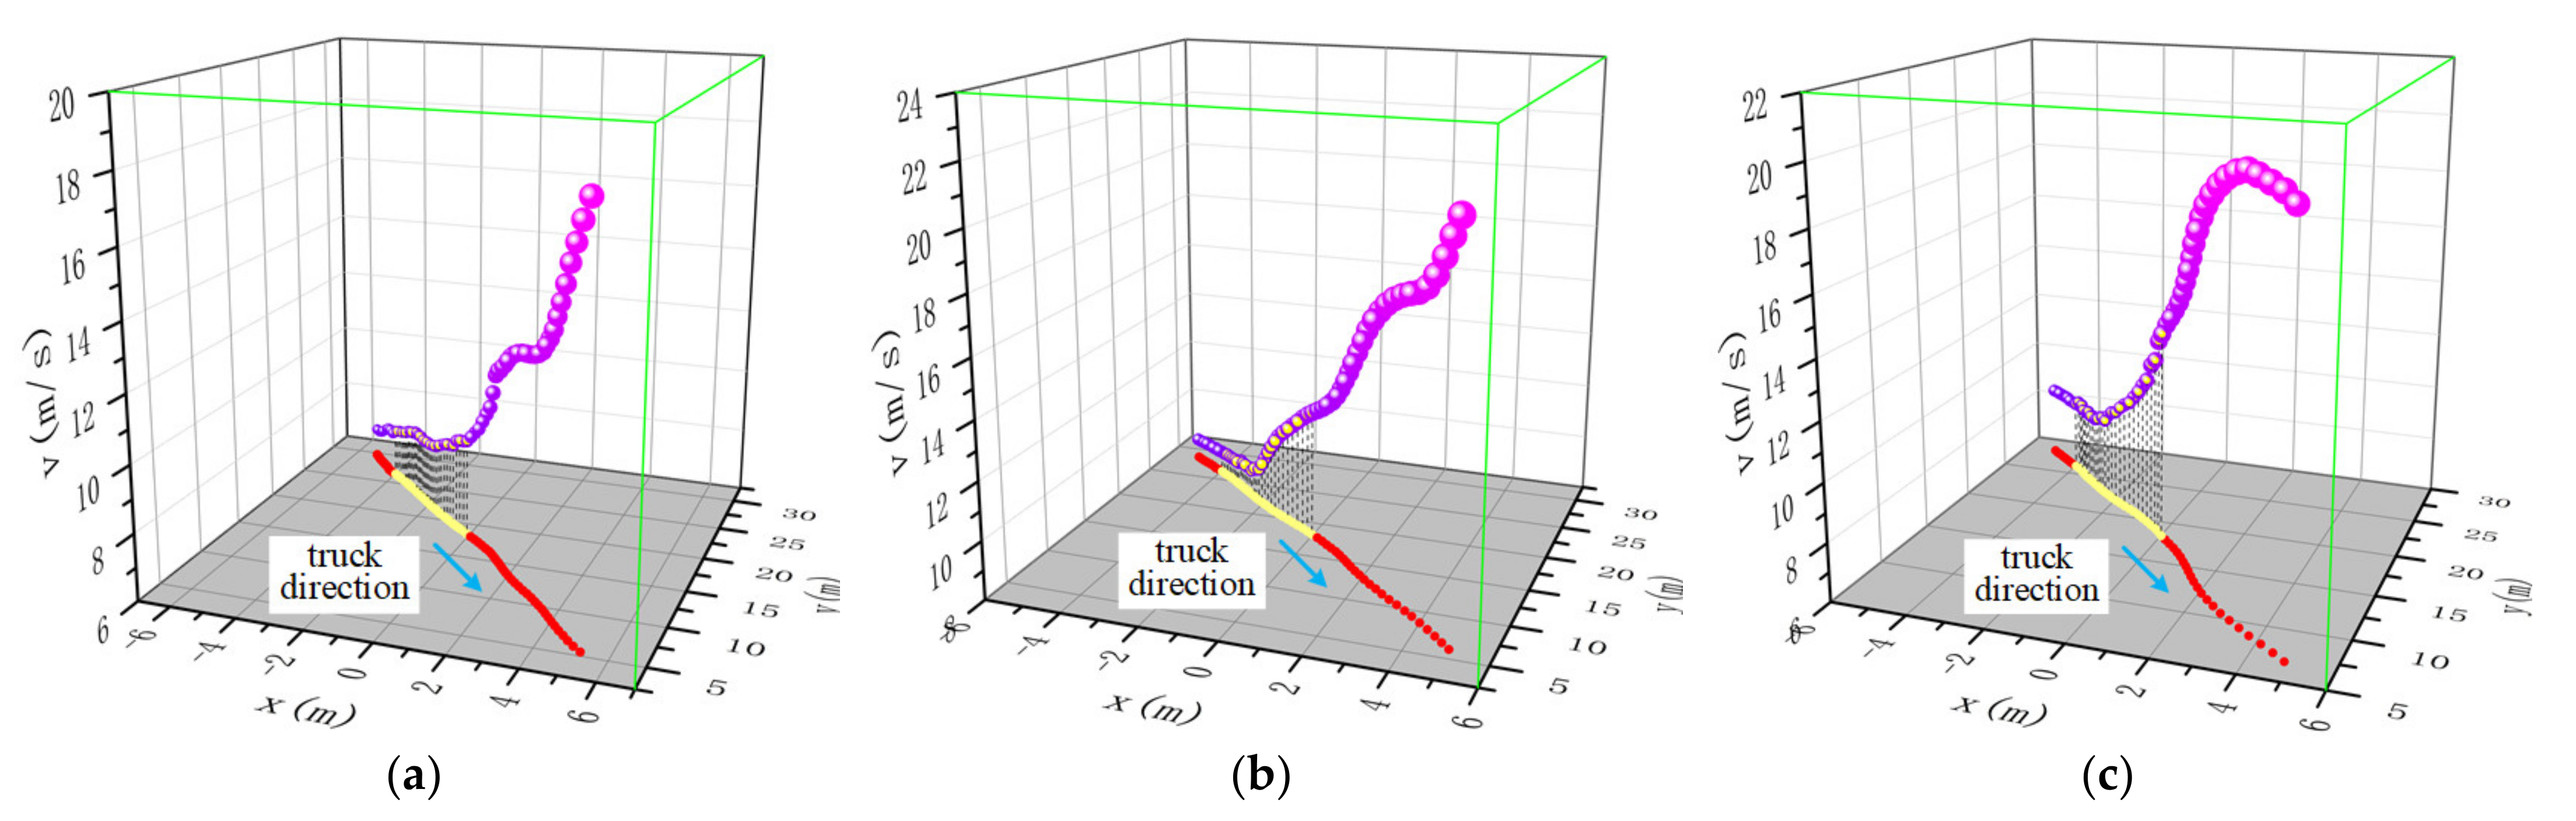
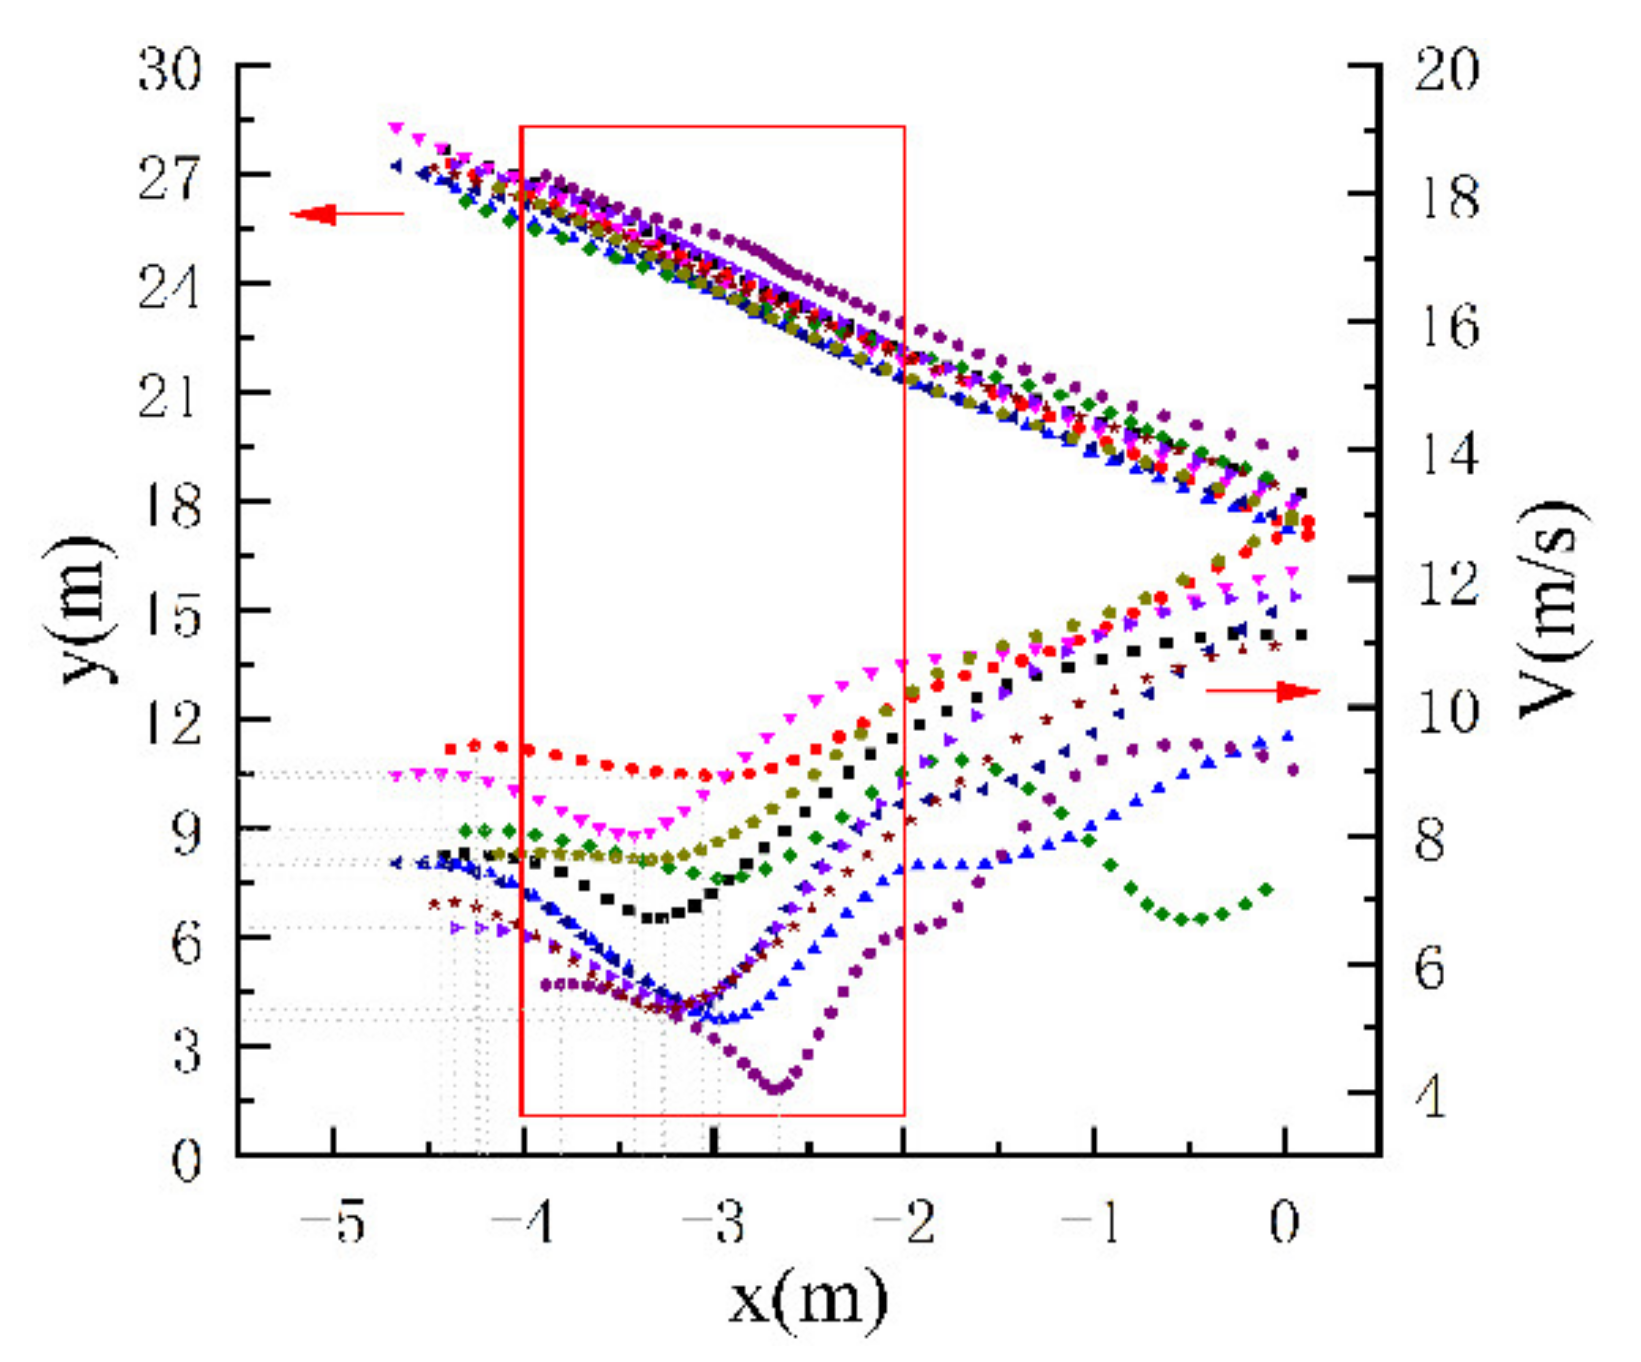
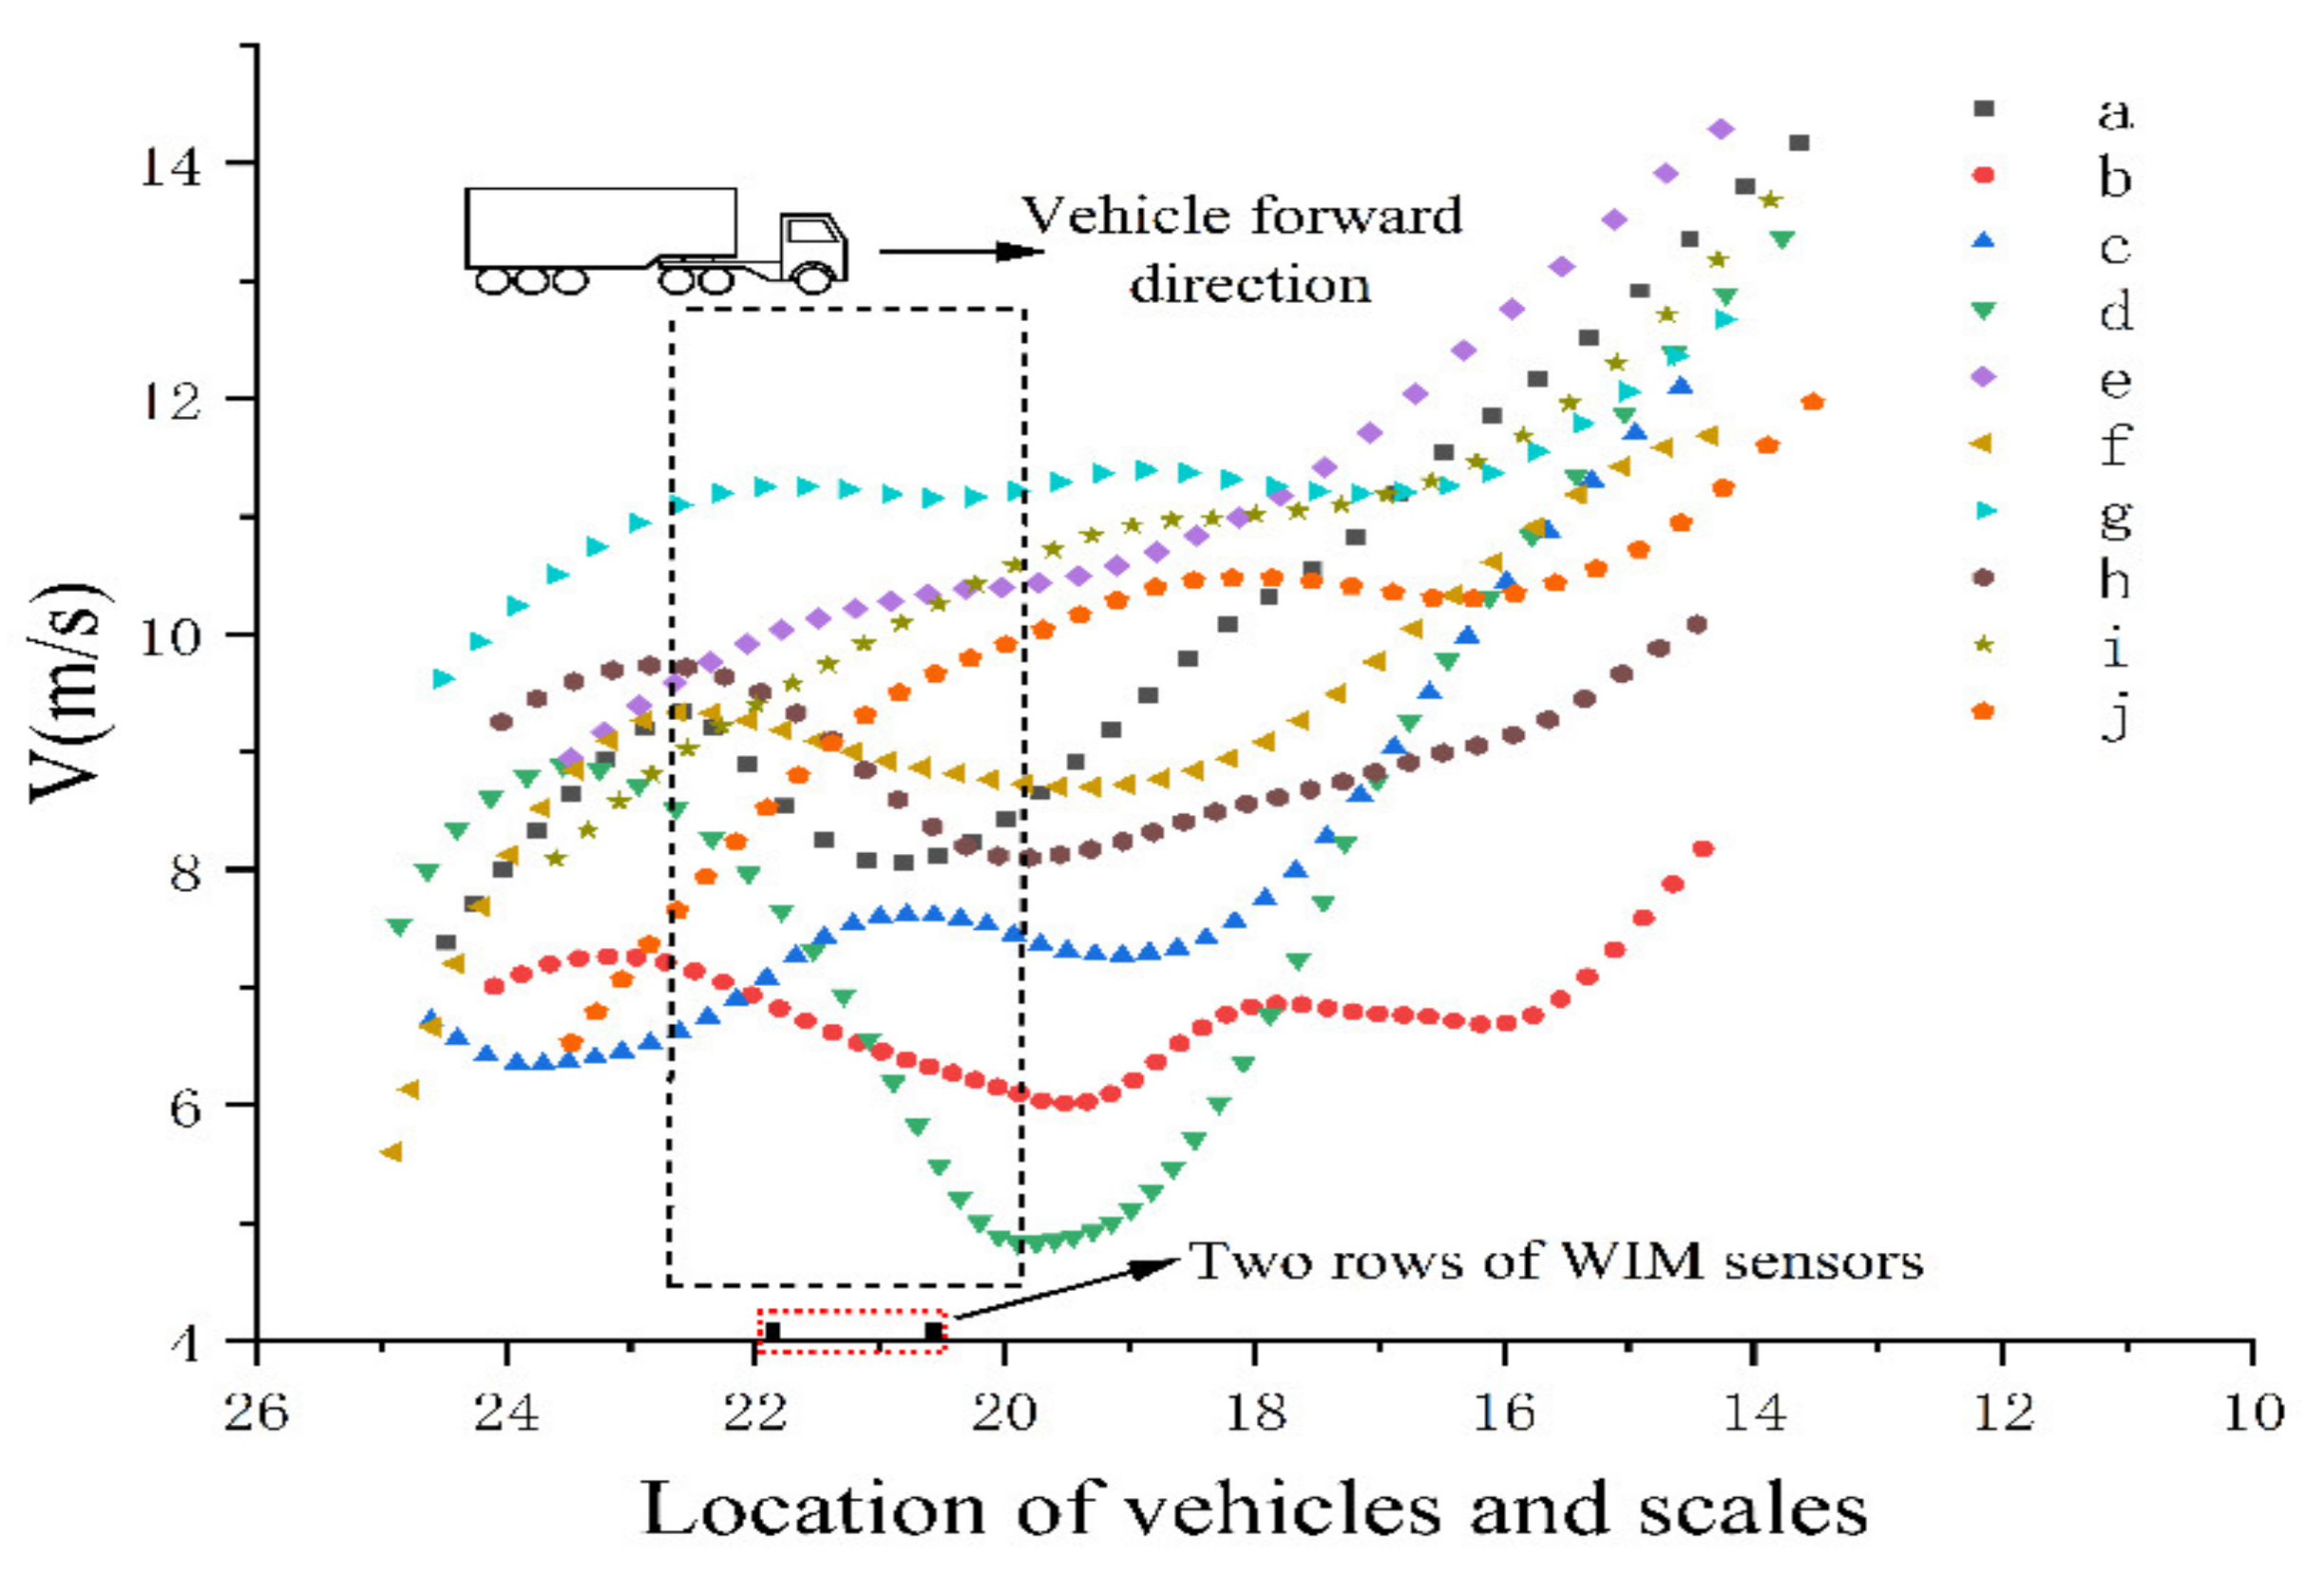
4.3. Analysis Results on the Influence of Vehicle Driving State on Weight Accuracy

As shown in Figure 11, Figure 12 and Figure 13, the x, y coordinates represent the position coordinates of the vehicle in each frame of the video, and the z coordinates represent the speed of the vehicle in each frame of the video. The figure shows the change of driving status of the vehicle from far and near through the weighing monitoring area. The 467 extracted trucks of this type are numbered one by one in the chronological order of the records, and Figure 11, Figure 12 and Figure 13 show the driving state changes of nine different numbered trucks. For example, (a) No.2 in Figure 11 is the driving state change diagram of truck numbered 2, and the others in the same way. After observing the driving state of the vehicle in the field and analyzing the video data, the driving speed of the vehicle through the weighing area has different changes, which is shown on the coordinate axis as the change of vehicle speed between x-axis −4 m and −2 m. x-y surface projection is the driving trajectory of the vehicle in the monitoring area, and the small section of the yellow part of the trajectory is the trajectory of the vehicle through the weighing area, which corresponds to the purple part of the vehicle velocity. Classifying and analyzing all the extracted data, there are 3 different driving states of the trucks passing through the weighing area, which are smooth state, acceleration state and deceleration-then-acceleration state.
According to the extracted monitoring video of 467 trucks of this type and the corresponding weighing data, after data comparison and analysis, we draw 2 conclusions as follows:
(1)
When the truck passes the weighing area in the smooth state and acceleration state, its WIM result and static weight error is within 1.5%, indicating that the truck passes the weighing area in this driving state and the WIM system can accurately detect the weight of the truck.
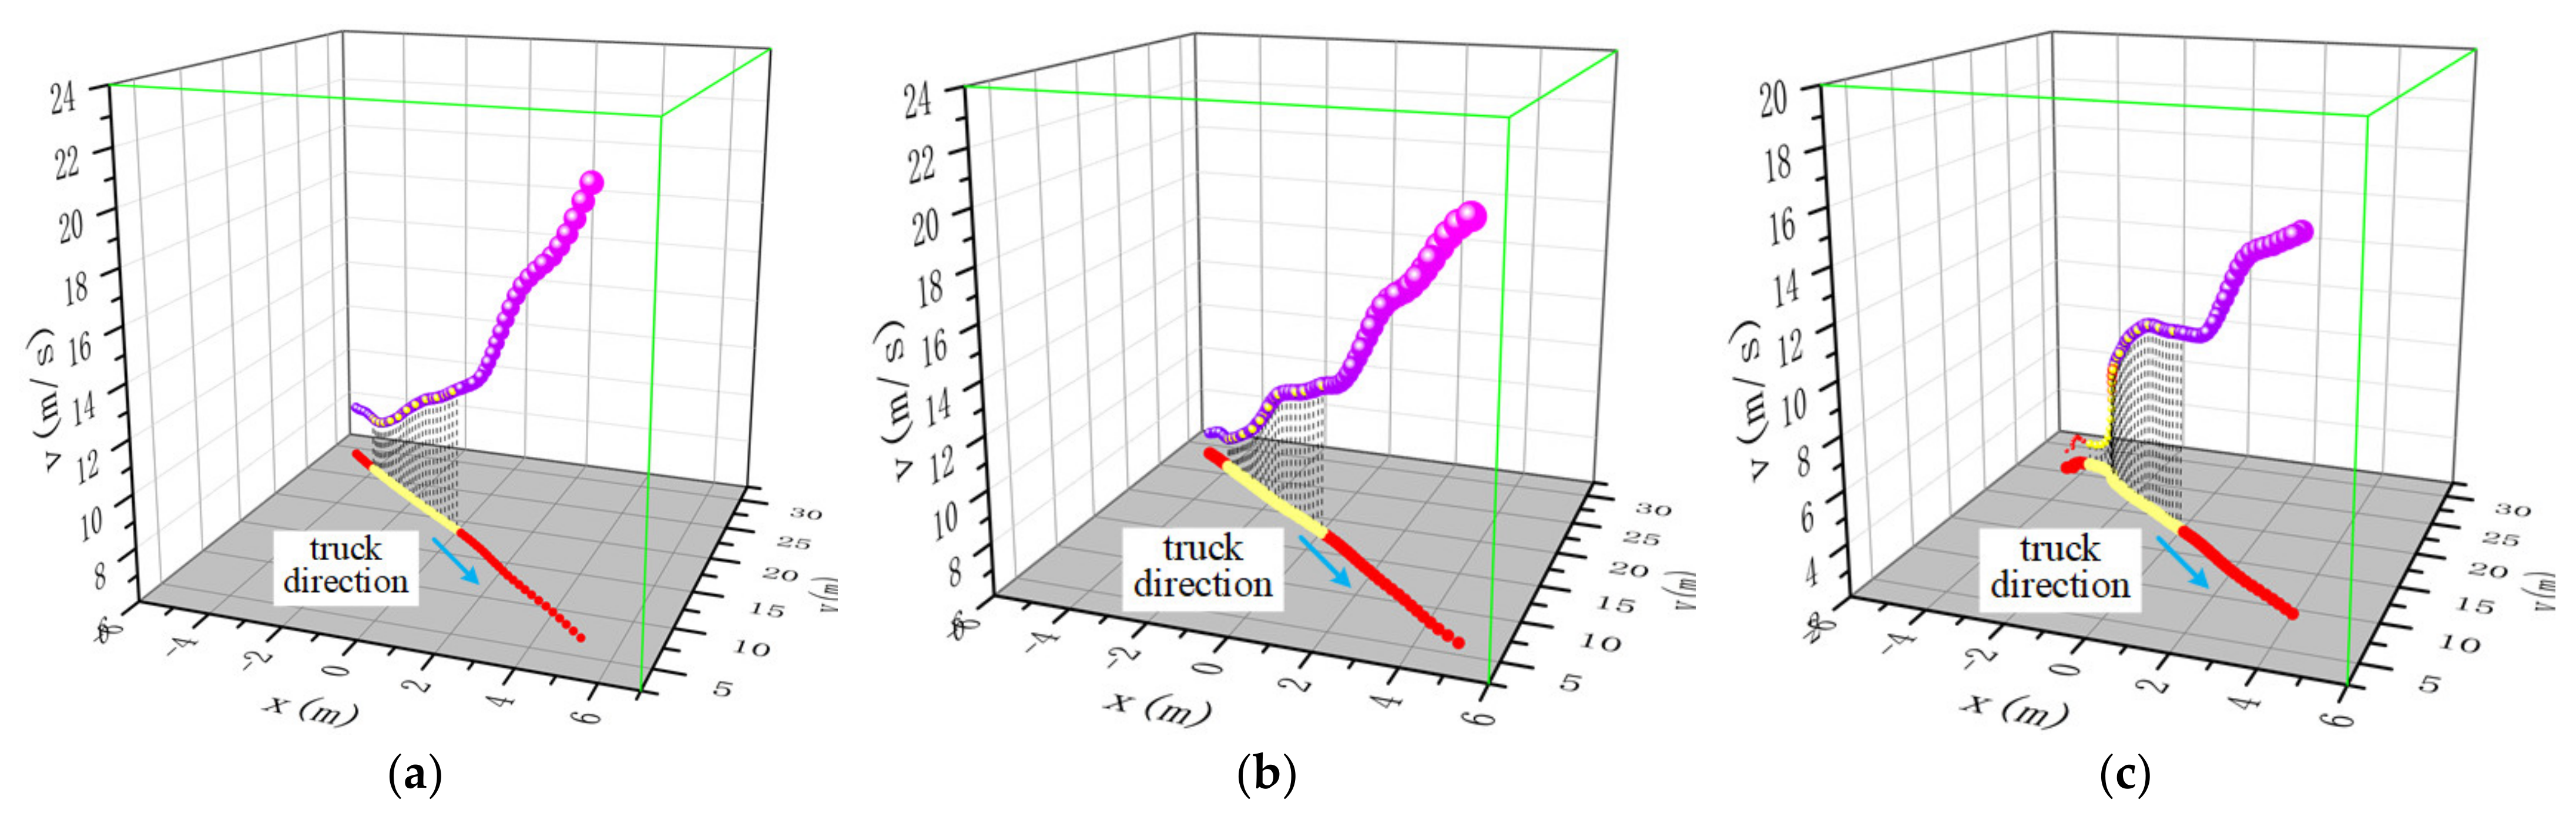
(2)
When the truck passes the weighing area under the state of deceleration and acceleration, the WIM result and static weight have an error of 1–4 tons as shown in Table 2 because the center of gravity has obvious backward and forward movement in the weighing process. Therefore, the truck passes through the weighing area in this driving state, which will have a negative impact on the weighing accuracy of WIM system.
Take the example of a truck with No.17 that first decelerates—then accelerates through the weighing area. By analyzing the driving status of the truck through the weighing area through video, the position of the truck on the scale and the corresponding driving speed are determined. As shown in Figure 14a, the truck is constantly decelerating as it passes through the WIM sensor, at which point the weight of the truck is transferred to the front axle due to inertia. When the front axle of the truck passes through the weighing area to complete the weighing, the deceleration of the truck causes the front end of the truck to dip down, and at this time the weight readings of the back 3 axles are small, resulting in a small total weight of the truck. As shown in Figure 14b, the image of this truck when passing through the weighing area is recorded by the right camera.
As shown in Figure 15 is a comparison of the trajectory and speed of 10 trucks passing through the monitoring area in the state of first deceleration—then acceleration, the arrow to the left represents the trajectory of the truck, and the arrow to the right represents is the speed of the truck. The rectangular part (x from −4 to −2) represents the trajectory and speed change of the vehicle through the weighing area. It can be seen from the figure that the corresponding trajectory points become more and more dense when the speed is decreasing, but the trajectory basically remains stable. There are differences in the driving speed of different vehicles, while there are also differences in the degree of deceleration of different vehicles. Through the data comparison, it is found that: the degree of deceleration of the vehicle into the weighing area until it leaves the weighing area also has a different impact on the weighing accuracy.
As shown in Table 3 below, statistical analysis is conducted on all the vehicle driving status data and weighing data of vehicles passing through the weighing area under the state of deceleration and acceleration first. According to the degree of deceleration of trucks passing through the weighing area, they are divided into three categories and the corresponding weighing error range, and the number of vehicles with different deceleration ranges in the detected vehicles is counted. Due to the limited data, the influence of weighing accuracy is only studied for such trucks, and the suggestion of compensating accuracy is given for vehicles passing the weighing area with different driving states. When such trucks are detected passing through the weighing area, the WIM system is able to compensate for the individual weighing according to the suggested compensation accuracy according to their driving state, thus improving the weighing accuracy, and this method is able to reduce the weighing error to less than 3%.

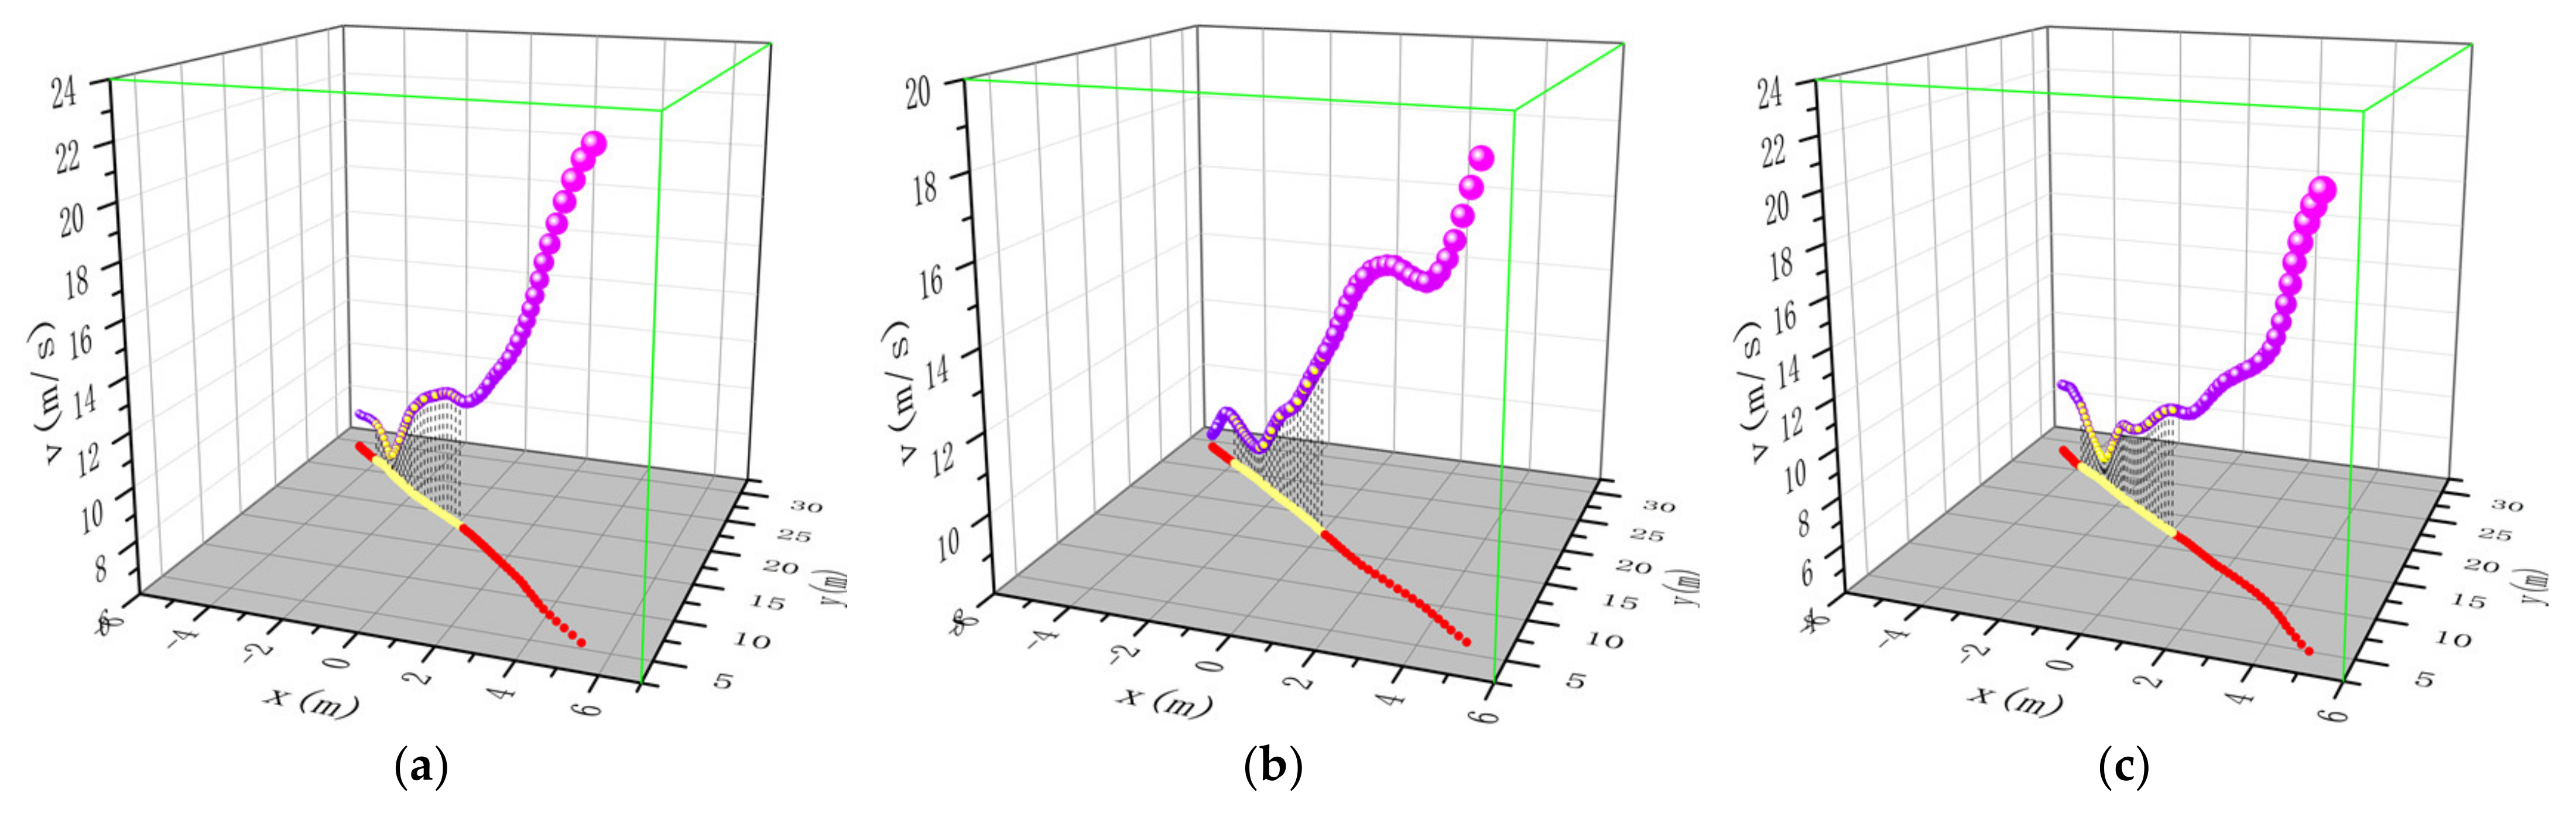
4.4. Analysis of the Results of the Method Validation Experiment

In order to verify whether the proposed method is applicable to other types of trucks and whether the driving state information of the truck extracted by the method is accurate and can play a role in the accuracy correction of the WIM system. Taking a truck with a weight of 36,380 kg as an example, the truck is driven through the WIM area with different driving states. As shown in Figure 16, the effect of driving state information extraction of the truck through the weighing area is shown.
The truck passes through the weighing area with different driving states for a total of 10 times, and extracts different driving state information as shown in Figure 17a–j is the 10 times verification experiment. The horizontal coordinate represents the position change of the truck from far to near, and the vertical coordinate represents the driving speed of the truck in each frame of the video. The road surface is installed with two rows of weighing sensors, and the part of the dashed box is the driving state information of the truck through the weighing area. The results of the validation experiment are shown in Table 4. As the results of the initial experiments with cement tankers, the WIM system is able to achieve high accuracy when the trucks pass the weighing area under smooth and accelerated conditions. When the truck decelerates in the range of 1.5–3.9 m/s, the weighing error will reach 1.0–1.9 tons. When the truck deceleration range is 4.0–5.9 m/s, the weighing error will reach 2.0–2.9 tons. The experimental results show that the proposed method can accurately detect other types of truck targets, can accurately extract the driving status information of trucks passing through the weighing area, and can be applied to the personalized accuracy correction analysis of WM system.

5. Conclusions

Driving behaviors vary across drivers for the WIM system in terms of truck weight detection accuracy. This paper proposes a YOLOv3-based truck driving state extraction method, which adds a spatial pyramid pooling network and a cross-stage local network on the basis of the original network to improve the real-time performance of model detection while making the network more lightweight. Then Kalman filtering + RTS smoothing is used to track and extract the driving state information of the truck. Finally, the impact of different driving states on the weighing accuracy of the truck is statistically analyzed, and the accuracy compensation value of the weighing system under different driving states is given based on the available data. The experimental results show that although the WIM system is corrected for accuracy before it is put into use, for 6-axle trucks with long bodies, some of them cannot be weighed accurately due to the variable driving state of the vehicle during weighing, which leads to the shift of the vehicle’s center of gravity back and forth. The method in this paper shows effectiveness and superiority, and is expected to be applied to real-time, personalized WIM system for condition monitoring and accuracy compensation, thus improving the weighing accuracy of the whole system. It will be more beneficial for WIM system to assist the existing traffic system and provide reliable monitoring data for road health management and effective decision making. The next step of the study also needs monitoring data of other types of trucks to investigate whether there are differences in the influence of different types of trucks on weighing accuracy.

Author Contributions

Conceptualization, S.Z. and J.Y.; methodology, S.Z. and J.Y.; software, Q.L.; validation, J.Y., Z.T. and Q.L.; formal analysis, J.Y., Z.T. and Z.X.; investigation, J.Y. and Z.T.; resources, Q.L.; data curation, Z.T. and Q.L.; writing—original draft preparation, J.Y. and Z.T.; writing—review and editing, J.Y. and Z.T.; visualization, Q.L.; supervision, S.Z.; project administration, J.Y. and Z.X.; funding acquisition, S.Z. and J.Y. All authors have read and agreed to the published version of the manuscript.

Funding

This research was funded by Shaanxi Provincial Key Research and Development Program (Project No. 2020ZDLGY04-06) and Shaanxi Provincial Key Research and Development Program (Project No. 2019ZDLGY03-09-02) and Xi’an Science and Technology Plan Project (Project No. 2019113913CXSF017SF027) and Xi’an Science and Technology Plan Project (Project No. 2020KJRC0064).

Institutional Review Board Statement

Not applicable.

Informed Consent Statement

Not applicable.

Data Availability Statement

The data presented in this study are available on request from the corresponding author.

Conflicts of Interest

The authors declare no conflict of interest.

References

  1. Xiong, W.; Cai, C.S.; Kong, B.; Ye, J. Overturning-collapse modeling and safety assessment for bridges supported by single-column piers. J. Bridge Eng. 2017, 22, 04017084. [Google Scholar] [CrossRef]
  2. Han, W.; Wu, J.; Cai, C.S.; Chen, S. Characteristics and dynamic impact of overloaded extra heavy trucks on typical highway bridges. J. Bridge Eng. 2015, 20, 05014011. [Google Scholar] [CrossRef]
  3. Xu, F.Y.; Zhang, M.J.; Wang, L.; Zhang, J.R. Recent highway bridge collapses in China: Review and discussion. J. Perform. Constr. Facil. 2016, 30, 04016030. [Google Scholar] [CrossRef]
  4. Clemente, P. Monitoring and evaluation of bridges: Lessons from the Polcevera viaduct collapse in Italy. J. Civ. Struct. Health Monit. 2020, 10, 177–182. [Google Scholar] [CrossRef]
  5. Pushka, A.; Regehr, J.D. Retrospective longitudinal study of the impact of truck weight regulatory changes on operating gross vehicle weights. Transp. Res. Rec. 2021, 2675, 34–47. [Google Scholar] [CrossRef]
  6. Miao, N.; Wang, Y.; Peng, L.; Zhang, C.; Luo, Z. Analysis of accuracy affecting factors of off-site law enforcement equipment. In IOP Conference Series: Materials Science and Engineering; IOP Publishing: Bristol, UK, 2018; Volume 452, p. 042193. [Google Scholar]
  7. Xia, Y.; Jian, X.; Yan, B.; Su, D. Infrastructure safety oriented traffic load monitoring using multi-sensor and single camera for short and medium span bridges. Remote Sens. 2019, 11, 2651. [Google Scholar] [CrossRef] [Green Version]
  8. Zhao, Q. Development of a Weigh-In-Motion System Based on Multiple Sensors; University of Science and Technology Beijing: Beijing, China, 2020. [Google Scholar] [CrossRef]
  9. Dolcemascolo, V.; Jacob, B. Multiple sensor weigh-in-motion: Optimal design and experimental study. In Proceedings of the Second European Conference on Weigh-In-Motion of Road Vehicles, Lisbon, Portugal, 14–16 September 1998. [Google Scholar]
  10. Burnos, P.; Gajda, J. Thermal property analysis of axle load sensors for weighing vehicles in weigh-in-motion system. Sensors 2016, 16, 2143. [Google Scholar] [CrossRef] [PubMed]
  11. Gajda, J.; Sroka, R.; Zeglen, T.; Burnos, P. The influence of temperature on errors of WIM systems employing piezoelectric sensor. Metrol. Meas. Syst. 2013, 20, 171–182. [Google Scholar] [CrossRef]
  12. Hashemi, V.S.; Haas, C.R.; Haas, C.; Rothenburg, L. Investigation of the effects of air temperature and speed on performance of piezoelectric weigh-in-motion systems. Can. J. Civ. Eng. 2013, 40, 935–944. [Google Scholar] [CrossRef]
  13. Tan, S.; Li, L.-H. Vehicle dynamic weighing data processing based on grey neural network. Chin. J. Sens. Actuators 2016, 29, 1205–1209. [Google Scholar]
  14. Xiang, T.; Huang, K.; Zhang, H.; Zhang, Y.Y.; Zhang, Y.N.; Zhou, Y.H. Detection of moving load on pavement using piezoelectric sensors. Sensors 2020, 20, 2366. [Google Scholar] [CrossRef] [PubMed]
  15. Cheng, C. Design of Vehicle Weigh-in-Motion System Based on Neural Network. In Advanced Materials Research; Trans Tech Publications Ltd.: Freienbach, Switzerland, 2012; Volume 459, pp. 557–560. [Google Scholar]
  16. Faruolo, L.B.; Pinto, F.A.N.C. Metrological approach to the force exerted by the axle of a road vehicle in motion carrying liquid. Meas. Sci. Technol. 2015, 27, 015101. [Google Scholar] [CrossRef]
  17. Zhang, R.; Lv, W.; Guo, Y. A vehicle weigh-in-motion system based on hopfield neural network adaptive filter. In Proceedings of the 2010 International Conference on Communications and Mobile Computing, Shenzhen, China, 12–14 April 2010; Volume 3, pp. 123–127. [Google Scholar]
  18. McNulty, P.; O’Brien, E.J. Testing of bridge weigh-in-motion system in a sub-Arctic climate. J. Test. Eval. 2003, 31, 497–506. [Google Scholar]
  19. Yannis, G.; Antoniou, C. Integration of weigh-in-motion technologies in road infrastructure management. ITE J. 2005, 75, 39–43. [Google Scholar]
  20. Zhou, Y.; Pei, Y.; Li, Z.; Fang, L. Vehicle weight identification system for spatiotemporal load distribution on bridges based on non-contact machine vision technology and deep learning algorithms. Measurement 2020, 159, 107801. [Google Scholar] [CrossRef]
  21. Dan, D.; Ge, L.; Yan, X. Identification of moving loads based on the information fusion of weigh-in-motion system and multiple camera machine vision. Measurement 2019, 144, 155–166. [Google Scholar] [CrossRef]
  22. Ojio, T.; Carey, C.H.; OBrien, E.J.; Doherty, C. Contactless bridge weigh-in-motion. J. Bridge Eng. 2016, 21, 04016032. [Google Scholar] [CrossRef] [Green Version]
  23. Wang, C.; Yuan, Q.N.; Bai, H.; Li, H.; Zong, W.Z. Lightweight Object Detection Algorithm for Warehouse Goods. Laser and Optoelectronics Progress:1-10[2022-02-28]. Available online: http://kns.cnki.net/kcms/detail/31.1690.tn.20211110.1211.024.html (accessed on 4 January 2022).
  24. Li, H.B.; Xu, C.Y.; Hu, C.C. Improved real-time vehicle detection method based on YOLOV3. Laser Optoelectron. Prog. 2020, 57, 332–338. [Google Scholar]
  25. Xing, Z.; Zhao, S.; Guo, W.; Guo, X.; Wang, Y. Processing laser point cloud in fully mechanized mining face based on DGCNN. ISPRS Int. J. Geo-Inf. 2021, 10, 482. [Google Scholar] [CrossRef]
  26. Liu, H.; Wang, C.; Lu, H.; Yang, W. Outdoor camera calibration method for a GPS & camera based surveillance system. In Proceedings of the 2010 IEEE International Conference on Industrial Technology, Via del Mar, Chile, 14–17 March 2010; pp. 263–267. [Google Scholar]
  27. Zhu, S.; Hu, D. An improved outdoor camera calibration method based on EKF. In Proceedings of the 2014 International Conference on Computer, Communications and Information Technology (CCIT 2014); Atlantis Press: Amsterdam, The Netherlands, 2014; pp. 261–265. [Google Scholar]
Figure 1. Hardware layout of weigh-in-motion system.
Information 13 00130 g001
Figure 2. SPP network structure diagram.
Information 13 00130 g002
Figure 3. Improved YOLOv3 network structure diagram.
Information 13 00130 g003
Figure 4. Vehicle trajectory tracking flowchart.
Information 13 00130 g004
Figure 5. Road surface Coordinate system and reference points.
Information 13 00130 g005
Figure 6. A sample of some of the images in the training dataset.
Information 13 00130 g006
Figure 7. Model training loss curve and detection accuracy of trucks.
Information 13 00130 g007
Figure 8. The detection effect of 9 consecutive frames.
Information 13 00130 g008
Figure 9. Vehicle tracking and status extraction results for weighing areas. (a) WIM monitoring area; (b) Vehicle driving status information extraction.
Information 13 00130 g009
Figure 10. Extraction effect of driving status information of some trucks.
Information 13 00130 g010
Figure 11. Steady state effect diagram. (a)No.2; (b) No.5; (c) No.11.
Information 13 00130 g011
Figure 12. Acceleration state effect diagram. (a) No.4; (b) No.9; (c) No.16.
Information 13 00130 g012
Figure 13. First deceleration—then acceleration state effect diagram. (a) No.6; (b) No.13; (c) No.17.
Information 13 00130 g013
Figure 14. The effect of the position and speed correspondence of the truck (No.17) on the scale. (a) Map of the correspondence between the position and speed of the truck; (b) Map of the truck passing through the weighing area.
Information 13 00130 g014
Figure 15. Trajectory and velocity comparison diagram.
Information 13 00130 g015
Figure 16. Verification experiments truck driving state information extraction effect diagram.
Information 13 00130 g016
Figure 17. Comparison chart of different driving states of the truck for the validation experiment.
Information 13 00130 g017
Table 1. Performance comparison results of different detection algorithms.
Contrast ModelPrecision/%Recall/%FPS
YOLOv394.685.315.72
Improved YOLOv394.487.217.12
Table 2. Comparison of the data of vehicles passing through the weighing area in the state of first deceleration and then acceleration (5 vehicles data, for example).
TimeNo.Weigh/tonWIM Weigh (ton)Error
3.18–10:02:58617.516.08.6%
3.18–11:17:351317.515.89.7%
3.19–09:52:311717.516.27.4%
3.19–10:11:232617.516.27.4%
3.20–15:23:523117.514.517.1%
Table 3. Distribution of weighing accuracy for truck deceleration range.
ClassificationDeceleration
Range (m/s)
Weighing
Error(ton)
Number of
Trucks
Recommended Compensation Accuracy (ton)
11.5~3.91.0~1.91771
23.9~5.91.9~2.9992
35.9~8.52.9~3.9343
Table 4. Validation experimental results table.
Experimental SequenceStandard Weight (kg)Detection Weight (kg)Speed Change Value (m/s)Weighing Error (ton)
a36,38035,1212.041.26
b36,38035,5531.200.83
c36,38035,8940.870.49
d36,38034,1694.022.21
e36,38036,1870.920.19
f36,38036,0010.630.38
g36,38036,2920.190.09
h36,38035,2621.631.12
i36,38036,0331.700.35
j36,38036,2022.510.18
Publisher’s Note: MDPI stays neutral with regard to jurisdictional claims in published maps and institutional affiliations.

