Article

Multimodal EEG Emotion Recognition Based on the Attention Recurrent Graph Convolutional Network

School of Electronic Information and Artificial Intelligence, Shaanxi University of Science and Technology, Xi’an 710021, China
*
Author to whom correspondence should be addressed.
Information 2022, 13(11), 550; https://doi.org/10.3390/info13110550
Submission received: 30 September 2022 / Revised: 14 November 2022 / Accepted: 17 November 2022 / Published: 21 November 2022
(This article belongs to the Special Issue Deep Learning in Biomedical Informatics)

Abstract

:
EEG-based emotion recognition has become an important part of human–computer interaction. To solve the problem that single-modal features are not complete enough, in this paper, we propose a multimodal emotion recognition method based on the attention recurrent graph convolutional neural network, which is represented by Mul-AT-RGCN. The method explores the relationship between multiple-modal feature channels of EEG and peripheral physiological signals, converts one-dimensional sequence features into two-dimensional map features for modeling, and then extracts spatiotemporal and frequency–space features from the obtained multimodal features. These two types of features are input into a recurrent graph convolutional network with a convolutional block attention module for deep semantic feature extraction and sentiment classification. To reduce the differences between subjects, a domain adaptation module is also introduced to the cross-subject experimental verification. This proposed method performs feature learning in three dimensions of time, space, and frequency by excavating the complementary relationship of different modal data so that the learned deep emotion-related features are more discriminative. The proposed method was tested on the DEAP, a multimodal dataset, and the average classification accuracies of valence and arousal within subjects reached 93.19% and 91.82%, respectively, which were improved by 5.1% and 4.69%, respectively, compared with the only EEG modality and were also superior to the most-current methods. The cross-subject experiment also obtained better classification accuracies, which verifies the effectiveness of the proposed method in multimodal EEG emotion recognition.

1. Introduction

With the emergence of artificial intelligence, the concept of affective computing was first proposed by Professor Picard [1] in 1995. Emotion recognition plays an increasingly important role in human–computer interaction. It also has high value in social robotics, medical care, education, etc.
Human emotions involve subjective experiences, physiological responses, and behavioral responses, which are expressed through multiple modalities such as facial expressions, speech, and body movements [2,3]. The signals used for emotion recognition can be divided into two categories: one type is non-physiological signals, such as facial expressions, voices, and text; the other type is physiological signals, such as electroencephalogram (EEG), electrooculogram (EOG), electrocardiogram (ECG), and electromyogram (EMG). Most of the current research focuses on emotion recognition of explicit factors, such as voice, text, and facial expression, but most human emotions are not externalized in facial expressions or sounds. Compared with external behavioral signals, physiological signals are not easy to camouflage and are more real and reliable. Therefore, it is more objective and effective to use physiological signals for emotion recognition. In recent years, EEG has been increasingly used for emotion recognition.
With the continuous proposal of EEG emotion recognition methods in recent years, human–computer interaction has been greatly promoted. Early research generally uses machine learning and feature engineering methods for emotion recognition. In previous emotion-recognition work, commonly used time-domain features include peak value, mean, variance, and standard deviation; frequency-domain features include power spectral density (PSD) and differential entropy (DE); and time-frequency-domain features include Hilbert–Huang spectral (HHS). Verma et al. [4] extracted PSD features from EEG, used SVM and KNN to perform sentiment classification, and obtained the average precision of 81.45% in the binary-emotion-classification experiment on DEAP. In addition, many researchers use different kinds of wavelet transforms to extract more complex handcrafted features and use different machine-learning methods for sentiment classification. Tuncer et al. [5] extracted handcrafted features on the basis of TQWT (tunable Q-factor wavelet transform) and proposed LEDPatNet19, which achieved 94.58% and 94.44% classification accuracies for arousal and valance, respectively, on the DREAMER dataset, and the best classification accuracy of the LEDPatNet19 is 99.29% on the GAMEEMO dataset. They also used the Tetromino method [6] to generate new features based on the discrete wavelet transform for emotion recognition, and the method achieved 99.01% and 99.56% classification accuracies for arousal and valance, respectively, on the DEAP dataset. Dogan et al. [7] proposed the PrimePatNet87 method, which first uses the TQWT method to extract features from the EEG signal, then uses the minimum-redundancy–maximum-relevance selector to select half of the features, and finally uses SVM for emotion classification. The method achieved 99.56% and 99.67% classification accuracies for arousal and valance, respectively, on the DEAP dataset and reached over 99% classification accuracy on the DREAMER and GAMEEMO datasets. Subasi et al. [8] used six different methods to reduce the dimensionality of the handcrafted features extracted by TQWT and proposed the RFE+SVM method, which achieved a classification accuracy of more than 93% on the SEED dataset.
Some important feature information may be lost in the process of manual feature extraction, which limits the model performance and the final emotion-classification accuracy. Deep-learning methods have made feature extraction more convenient because it can automatically extract more-correlated features from large-scale data. Yang et al. [9] used a two-dimensional convolutional neural network for emotion recognition and achieved an average classification accuracies of 89.45% and 90.24% in valence and arousal emotion classification, respectively, on the DEAP. With the emergence of RNN and the gradual emergence of its advantages in sequence, many researchers combine it with CNN for emotion recognition. Chen et al. [10] proposed a CNN and LSTM cascaded hybrid neural network for EEG emotion recognition and achieved an average classification accuracy of 93.15% in valence on the DEAP. Du et al. [11] proposed a 1D-CNN-BiLSTM for EEG emotion recognition and experimented on the DEAP, DREAMER, and DESC datasets, for which the accuracies of the method reached 94.85%, 98.41%, and 99.27%, respectively, in the valence, and the accuracies of the arousal achieved 93.40%, 98.23%, and 99.20%, respectively. The proposal of the GCN provides a new idea for feature learning in non-standard Euclidean space, and some researchers use it to replace the CNN module for research. Yin et al. [12] combined a graph convolutional neural network with a long-short-term-memory network for EEG emotion recognition, which achieved 90.45% and 90.60% average accuracies in binary valence and arousal emotion classification, respectively, on the DEAP.
The EEG-single-modality-emotion-recognition method has made great progress, but the single-modality information is easily affected by various noises. It is difficult to fully reflect on the emotional state, and it also leads to recognition accuracy not being high. Therefore, it is necessary to use multimodal information for emotion recognition. In recent years, researchers are exploring and experimenting with different modalities’ data. Dobrišek et al. [13] proposed a multimodal-emotion-recognition method that fuses audio and video information, using an image-set-matching algorithm and a Gaussian mixture model for fusion classification at the decision level. The average accuracy is 77.5% in the six-category emotion classification on the eINTERFACEʹ05. Zhang et al. [14] fused audio and video features at the model level through a deep belief network. The average accuracy of this method is 85.97% in the six-category emotion classification on the eINTERFACEʹ05. Nakisa et al. [15] proposed a convolutional network and LSTM network cascaded model to capture the emotional correlation of EEG and BVP (blood volume pulse) modalities, which was experimentally performed on the MAHNOB dataset using feature-level fusion, in which the accuracy of the four categories of emotions is 71.61%. Tang et al. [16] proposed bimodal LSTM to fuse EEG and peripheral physiological signals at the model level. The method performs the binary emotion classification on the DEAP, and the average classification accuracies in the valence and arousal are 83.83% and 83.23%, respectively. Huang et al. [17] proposed a decision-level-fusion method based on the enumerated weight rules for the classification of facial expression and EEG. This method is used in MAHNOB-HCI to conduct binary emotion classification, and the average classification accuracies of valence and arousal are 75.2% and 74.1%, respectively, which are both significantly improved compared with the single-modality accuracy. Although researchers have proposed many methods for multimodal emotion recognition in the past few years, there are still two problems that need to be improved: One is how to capture the correlation of different modalities and conduct effective modeling. The other is how to build a more-effective deep model to learn more-discriminative emotion-related features to improve the accuracy of emotion classification.
To solve the above problems, we propose the Mul-AT-RGCN for multimodal emotion recognition. Our main contributions of this paper can be summarized as follows:
  • In terms of feature selection and feature fusion, we utilize multiple physiological signals contained in the dataset to make emotion classification. The different kinds of physiological signals are fused at the data level and transformed from a one-dimensional time series into a graph structure that contains more temporal and spatial information related to human emotion.
  • In terms of models, we design the Mul-AT-RGCN, which combines the CBAM module and graph convolution and bidirectional LSTM to capture EEG-based multimodal physiological signals in time, frequency, and space domains to correlate and effectively extract emotion-related features of the multimodal signals.

2. Construction of Multimodal Space–Time Graph and Frequency–Space Graph

Since the electrode positions of EEG and other peripheral physiological signals are not in a natural Euclidean space, standard convolution cannot represent the relationship between channels well, while graph convolution can solve this problem. At the same time, in order to better consider the features of time domain, frequency domain, and spatial domain, this paper constructs a spatiotemporal graph sequence and a frequency–spatial graph sequence. These graph sequences describe the space of multimodal EEG signals in the time domain and frequency domain. These graphs can be represented as G = ( X F , A ) , where XF represents the node feature, and A represents the adjacency matrix of the graph. The adjacency matrix describes the relationship between different channels, and the graph-sequence construction process is depicted in Figure 1.
The construction of the graph sequence needs to calculate the relationship between different channels in each sample. Specifically, it is to calculate the correlation between different channels in the sample. The calculation process can be expressed as:
a u , v = I ( X u T ; X v T ) = m X u T n X v T p ( m , n ) log p ( m , n ) p ( m ) p ( n )
where T represents the time step, X u T represents the signal in channel u, and X v T represents the signal in channel v. After calculating the correlation between all channels, the adjacency matrix of the space–time graph and the frequency–space graph of size n × n can be obtained, denoted by A = ( a 1 , 1 , a u , v , a n , n ) , where n is the number of channels.
The key to constructing a spatiotemporal graph sequence is to calculate the time node features. We extract the amplitude as its time-domain feature. At each time step, the time-series feature can be expressed as X t = ( X 1 , X 2 , , X n ) , where n represents the number of channels, and the spatiotemporal graph consists of the feature vector of each time step and adjacency matrix, represented as G t = ( X t , A ) , with a dimension of n × n. The space–time graphs of all time steps are stacked to form a sequence of space–time graphs, represented as G = ( G 1 , G 2 , , G T ) , with a dimension of n × n × T, where T represents the number of time steps contained in a sequence.
The construction of a frequency–space graph sequence is similar to the process of building a space–time graph sequence. It is necessary to extract differential-entropy (DE) features from four frequency bands, θ , α , β , and γ , and convert these DE features and channel correlations into frequency–space graphs. The eigenvectors of each frequency band can be represented as X f = ( X 1 , X 2 , , X n ) , where n represents the number of channels, and the frequency–space graph is composed of the eigenvectors and adjacency matrices of each frequency band, denoted by G f = ( X f , A ) , with a dimension of n × n. They were stacked to form a frequency–space graph sequence, specifically represented as G = ( G θ , G α , G β , G γ ) , where the dimension is n × n × 4, and 4 is the number of frequency bands.

3. Attention Recurrent Graph Convolutional Network

In this section, we propose a model-based attention recurrent graph convolutional network to identify emotion-related EEG and peripheral physiological signals. The model is represented by Mul-AT-RGCN, and the structure is depicted in Figure 2. After the EEG and peripheral physiological signals are converted into a spatiotemporal graph sequence and a frequency–space graph sequence, we input the two sequences into the network composed of the attention mechanism and the recurrent graph convolution for deep extraction. The results are fused as the final multimodal features for sentiment classification.

3.1. Convolutional Block Attention Module

To improve the feature-extraction capacity of the deep-learning model, Woo et al. [18] introduced the attention mechanism into deep learning and proposed the convolutional block attention module (CBAM). The CBAM module performs attention-weight calculations from both channel and time dimensions and generates a new feature-matrix map. In our proposed Mul-AT-RGCN model, the CBAM module is used to selectively emphasize emotion-related features and suppress the irrelevant features. This module mainly includes two parts: channel attention mechanism and spatial attention mechanism.
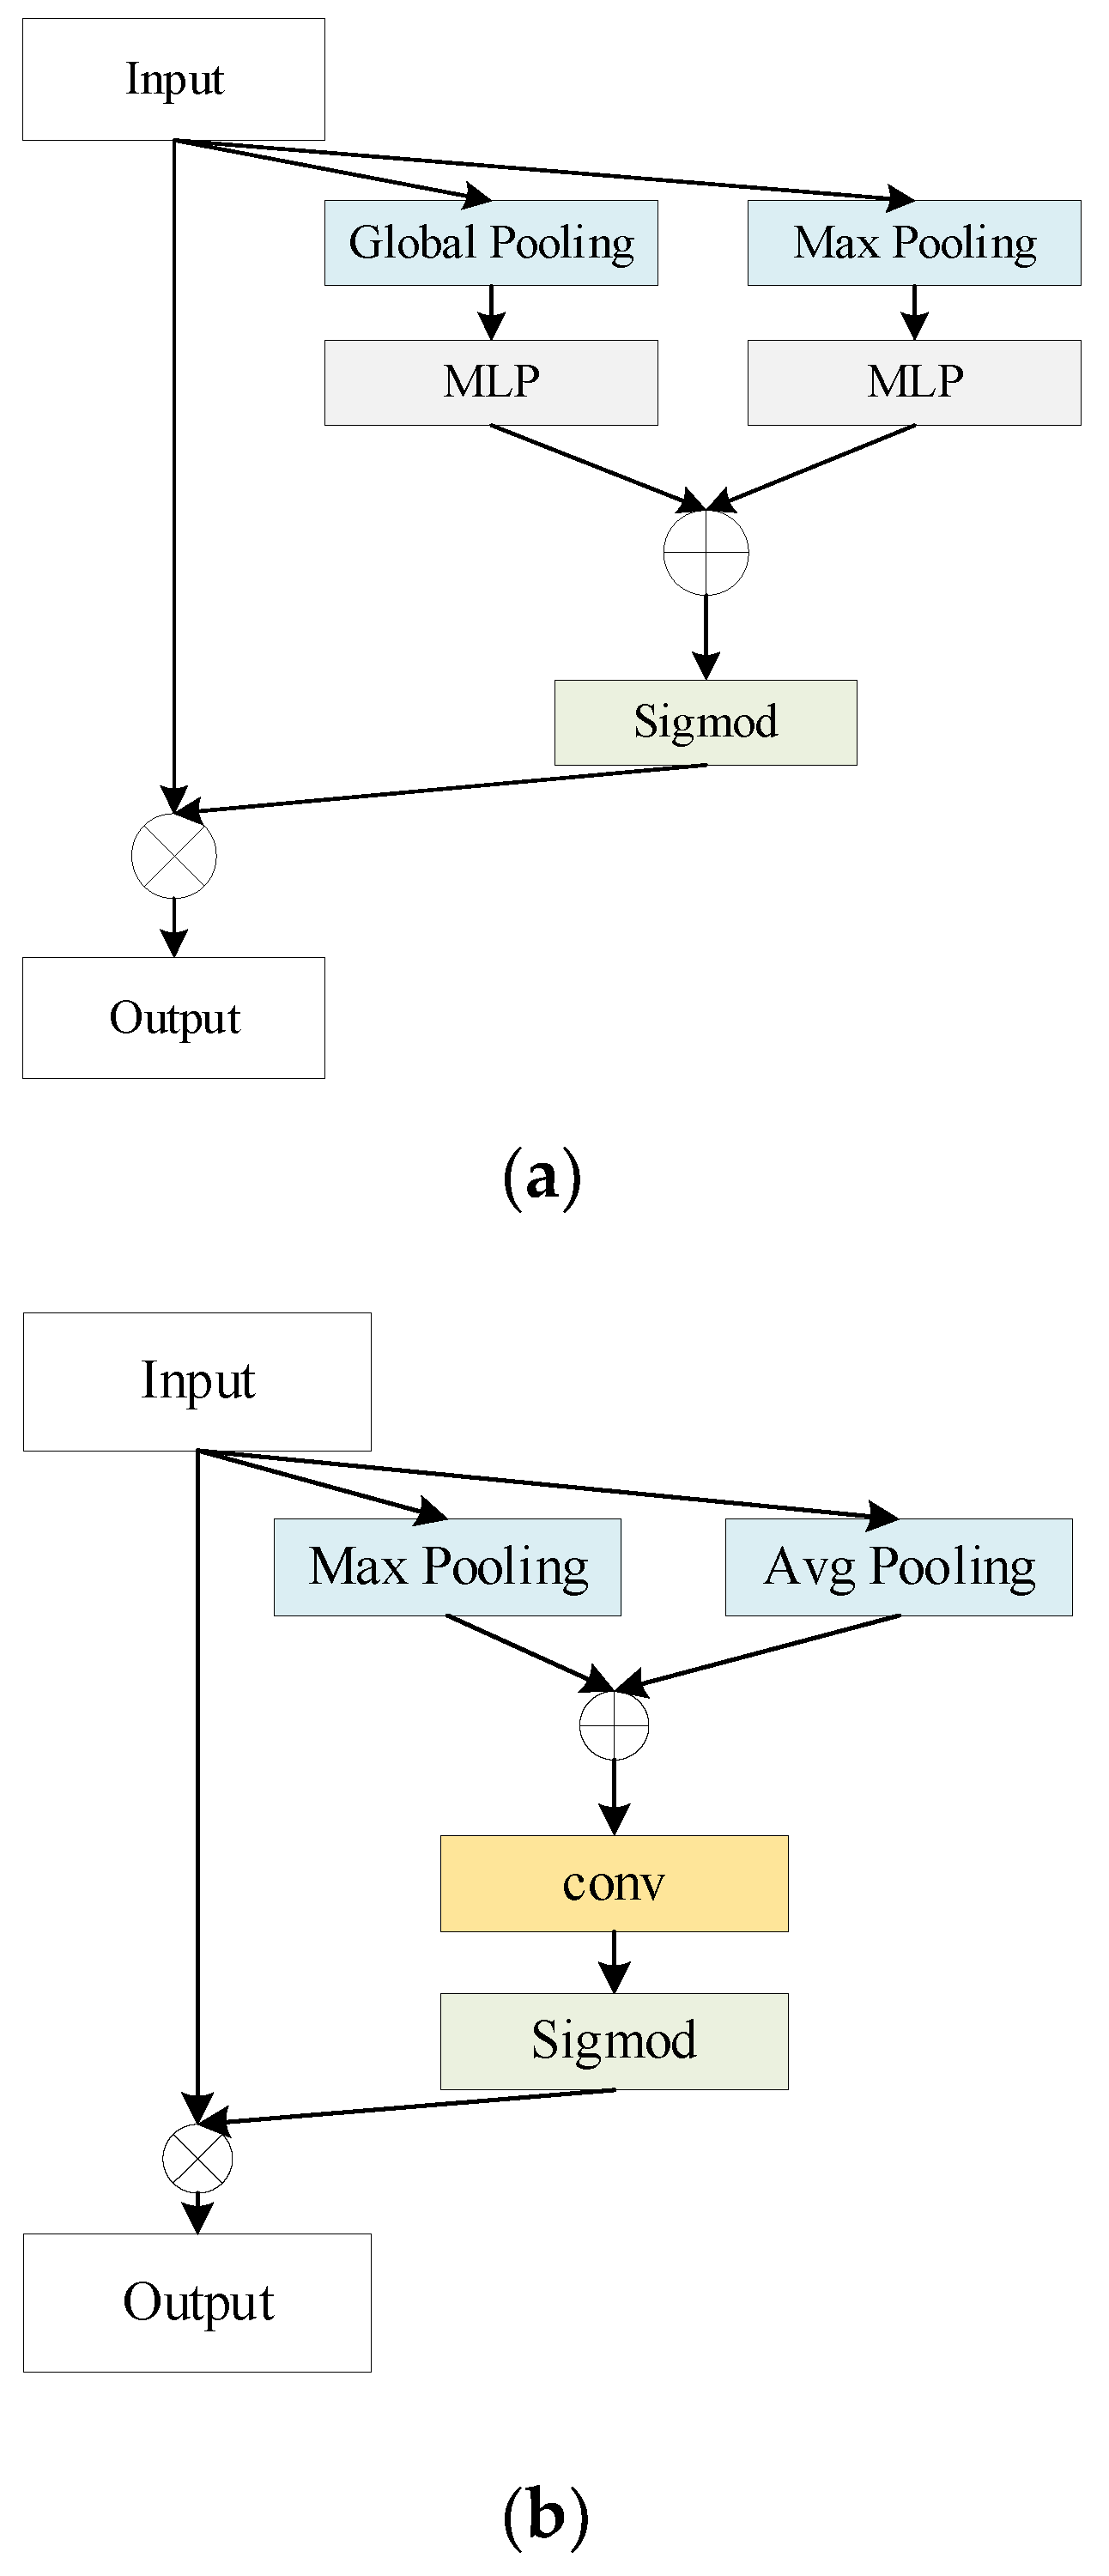
Channel attention can better capture the correlation between different modality channels. The weight of each channel of the multimodal feature is calculated through the network, and the size of the weight indicates the importance of each channel. The larger the weight, the more important the information contained in the channel. The channel-attention process is depicted in Figure 3.
The channel attention module includes two parts: squeeze and excitation. The squeeze is used to aggregate the features in the channel dimension to obtain the global distribution of the channel features, which is achieved by performing global-average and global-maximum pooling on the input multimodal-feature map. The feature map is compressed into two 1 × 1 × c channel descriptors, where c represents the number of channels. The excitation is input into the two channel descriptors into a fully connected layer, used in the RELU activation function, and then input into another fully connected layer, connected to the obtained results, and activated with the Sigmoid function to obtain the attention-weight matrix. Then the result is multiplied with the multimodal-feature matrix to get the attention-matrix map.
The spatial-attention mechanism is a further supplement to the channel attention. Its purpose is to decompress the channel to construct information in the spatial domain. The process of the spatial-attention mechanism is depicted in Figure 3b. It takes the output of the channel-attention module as input to perform global-average pooling and global-maximum pooling, then connects the output results and passes through a 7 × 7 convolution layer, and then is activated with the Sigmoid activation function to obtain the attention-weight matrix. The result is then multiplied with the multimodal-feature matrix to get the attention matrix. Generally speaking, different emotions will activate different regions of the brain, and this module can locate the position where the emotional features are more obvious, which makes the input sample features easier to learn.

3.2. Construction of Recurrent Graph Neural Network

The recurrent graph neural network consists of two parts: the graph convolutional network and the bi-directional-long-short-term-memory (BiLSTM) network, where the graph convolution is mainly used to extract spatial features, and the BiLSTM is mainly used to extract the time-domain and frequency-domain features in the two branches.
A graph is composed of several nodes and an edge connecting two nodes, which describes the relationship between different nodes. It is different from the image in which the neighbor nodes are fixed. Generally speaking, the neighbor nodes of the graph are not fixed and cannot use standard-sized convolution kernels to learn its features; graph convolutions emerged to find learnable convolution kernels suitable for graphs. In this paper, we regard the channel as the node of the graph and the relationship between different channels as the edge of the graph. The graph convolutional network [19] captures spatial-domain features by aggregating surrounding node information, which can capture the correlation between different nodes in the graph. Different nodes may be located in different regions, and capturing the spatial-domain relationship between these node connections can be more effective for emotion recognition. A graph structure is denoted by its Laplacian matrix as L = D A , where D denotes the diagonal matrix consisting of the degrees of the graph nodes and A denotes its adjacency matrix. After regularizing the Laplacian matrix, the eigendecomposition obtains L = I N D 1 2 A D 1 2 = D 1 2 A ^ D 1 2 , where IN represents the identity matrix. The process of graph convolution is as follows:
H i = σ ( D 1 2 A ^ D 1 2 x i W ) + b
where x i represents the input of the graph convolution; H i represents the output of the graph convolution, that is, the node features after the graph convolution; W represents the weight; b represents the bias; and σ represents the RELU activation function. The graph convolution is performed parallel on the spatiotemporal feature graph sequence and the frequency–space feature graph sequence, and the results are stacked to form new spatiotemporal feature and frequency–spatial feature. Since the operations require a large number of parameters, in order to reduce the number of parameters, all graph convolution operations share the same parameters.
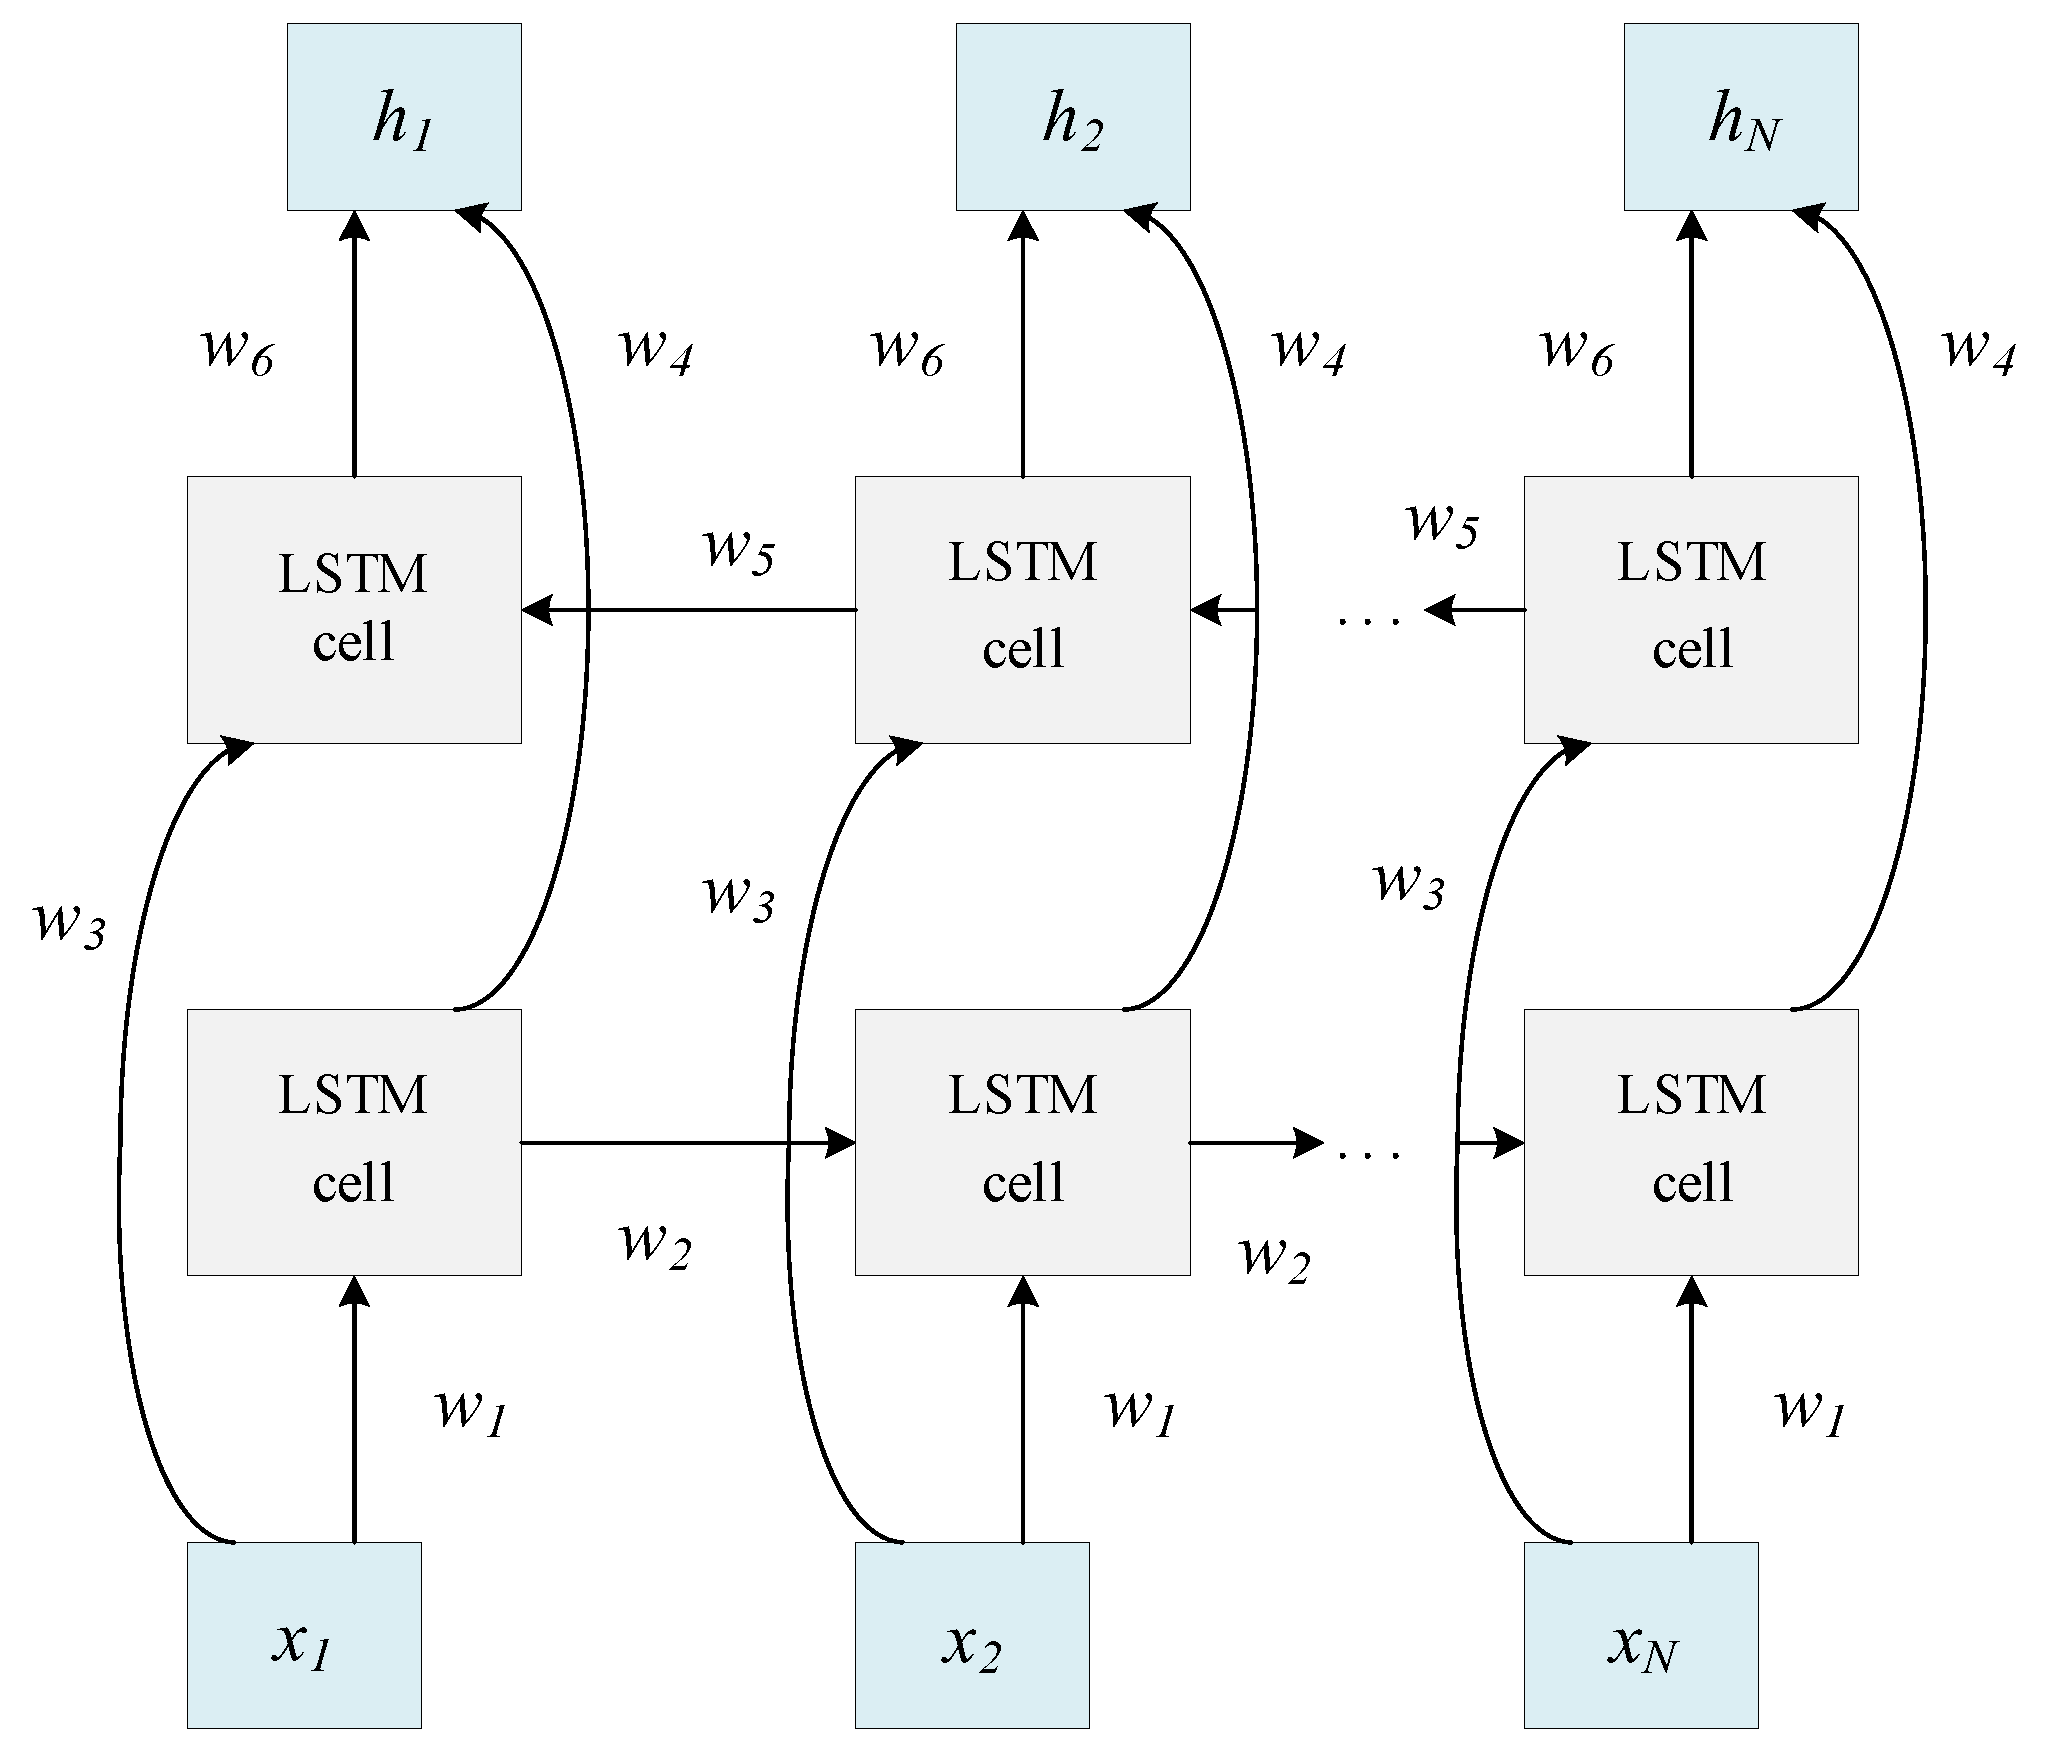
BiLSTM is a special recurrent neural network (RNN), and it is suitable for predicting events with long intervals in the sequence and learning the dependency information between the data [20]. It solves the problem of vanishing gradients in traditional RNNs while being able to model long-term dependencies. In order to better learn the relationship between the context before and after the sequence, we use the BiLSTM network to extract the features of the time domain or frequency domain after the graph convolutional network. The structure of BiLSTM is depicted in Figure 4. The model receives both the positive feedback and the reverse feedback brought by the pre-order and post-order information and uses more control-gate units to avoid overfitting, and the combination of more information is also more conducive to improving the precision of the model.
BiLSTM is used to extract deep correlation features in the time domain or frequency domain from the graph sequence, and it is located after the graph convolution module. BiLSTM is used to learn the dependencies between different time or frequency bands. Each LSTM unit is defined as follows:
f t = σ ( W f [ H t 1 , X t ] + b f )
i t = σ ( W i [ H t 1 , X t ] + b i )
c ˜ t = tanh ( W C [ H t 1 , X t ] + b c )
c t = f t c t 1 + i t c ˜ t
o t = σ ( W o [ H t 1 , X t ] + b o )
H t = o t tanh ( c t )
where X t represents the input; H t 1 represents the output of the previous moment; f t represents the output of the forget gate; i t represents the output of the memory gate; c ˜ t represents the temporary state; c t represents the current state; c t 1 represents the state of the previous moment; o t represents the output of the output gate; H t represents the final output; represents the product of two matrices on each element; W f , W i , W c , and W o represent the weight; and b f , b i , b c , and b o represent the bias. Finally, the outputs are concatenated to obtain the final spatiotemporal feature matrix and frequency–space feature matrix.

3.3. Multidimensional Feature Fusion and Emotion Recognition

We connect the spatiotemporal features and frequency–space features and input them into the fully connected layer to form the final multimodal fusion feature. This feature combines the features of EEG signals and other peripheral physiological signals in three dimensions: time, space, and frequency. Compared with single-modality or single-dimensional features, this feature is more comprehensive. Finally, a softmax classification layer is used to achieve the final emotion recognition.
y = s o f t max ( H W + b )
where H represents the input and y represents the final prediction.
To prevent overfitting, we also added a dropout layer to the model. The model adopts the Adam optimizer, which can adjust the learning rate automatically according to the parameters and has better robustness. The loss function of this model adopts the cross-entropy function, which is calculated as follows:
l o s s = y log y
where y represents the true value of the label and y represents the predicted label.

3.4. Domain Adaptation Module for Model Optimization

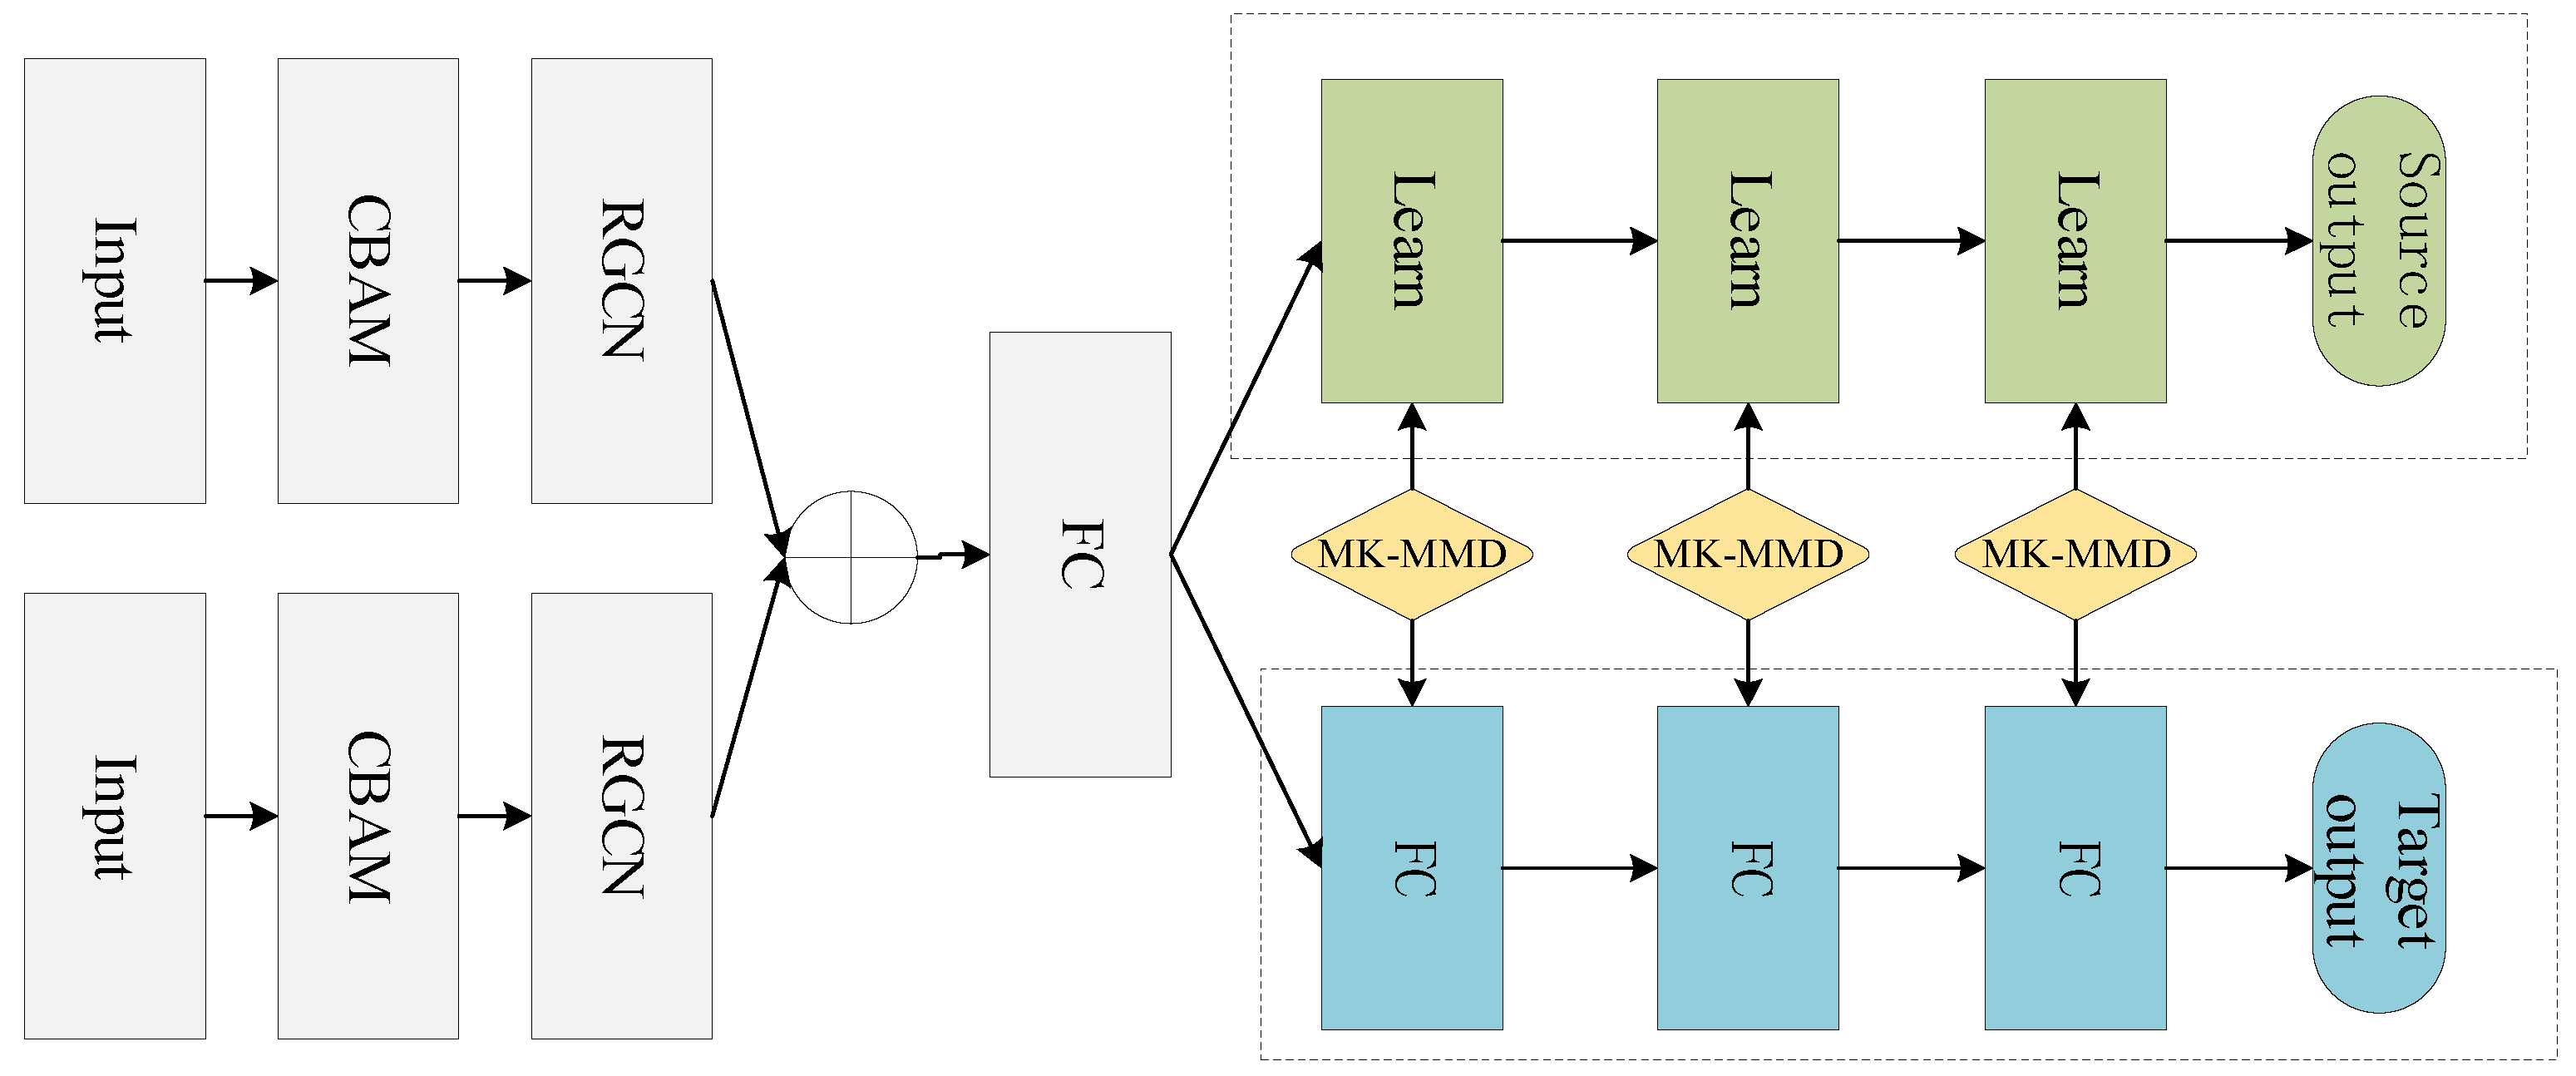
In the process of multimodal signal processing and emotion recognition, the multimodal signals for training and testing may come from different fields, for example, the different subjects. Therefore, the parameters obtained by the model based on the training data may not be adapted to the test data. In transfer learning, the existing knowledge is called the source domain, and the new knowledge to be learned is called the target domain. In the experiment, we use the training data as the source domain and the test data as the target domain. The idea of the deep adaptation network (DAN) [21] is to reduce the difference between the source domain and the target domain by introducing the multi-kernel-maximum-mean-discrepancy (MK-MMD) method, so that the source domain and the target domain are matched to achieve the effect of domain migration. To solve the problem of large differences between subjects, we introduced the idea of DAN and added the MK-MMD module to the original model, which is called the Mul-AT-RGCN-DAN, to learn more features about emotion discrimination and domain invariance. Its specific structure is depicted in Figure 5.
This module reduces the difference between the source domain and the target domain by minimizing the MMD loss. The MMD loss is calculated as follows:
l o s s M M D = 1 n t J ( y t , y t ) + λ D L ( P , Q )
where J represents the cross-entropy function, λ > 0 is the MK-MMD penalty item trade-off parameter, DL represents the MMD distance between the source domain and the target domain, P represents the sample distribution of the source domain, and Q represents the sample distribution of the target domain. By minimizing this loss, domain adaptation from the source domain to the target domain can be achieved, thereby improving the performance of the model in emotion-recognition tasks.

4. Experimental Results and Analysis

4.1. Dataset and Preprocessing

In this section, we verified the effectiveness of the Mul-AT-RGCN model based on the large public multimodal sentiment dataset DEAP [22]. The DEAP-dataset-recorded physiological signals include EEG, ECG, and EMG evoked by 32 subjects watching 40 music videos for about one minute each with different emotional tendencies. Each subject evaluated the videos on a continuous scale of 1–9 on the five dimensions of arousal, valence, liking, dominance, and familiarity. In this experiment, 40-channel data of each subject were taken as the research object, including 32 EEG channels and two EOG channels, two EMG channels, one GSR channel, one respiration-belt channel, one plethysmograph channel, and one temperature channel, in total eight peripheral physiological signal channels. In addition, according to the affective model proposed by Russell in 1980, emotion can be described by two dimensions: valence and arousal, in which valence represents the positive or negative emotion and arousal represents the degree of emotional arousal. Many researchers conduct valence and arousal emotion-classification experiments on DEAP. Therefore, to facilitate comparison with these methods and quickly verify the effectiveness of our proposed model, we also made valence and arousal classifications on DEAP to test our method.
In DEAP, the original data is represented as 32 (sub) × 40 (trial) × 40 (channel) × 8064 (sample), where 8064 represents 128 (sample) × 63 (s), and the label is represented as 40 (trial) × 4. Then we preprocessed the original data, first removing the baseline data for the first 3 s, and extracted temporal features of EEG and other peripheral physiological signals, where the sampling frequency was 128 and the final extracted time-domain feature format was 2400 × 40 × 128. Then we extracted the DE features as frequency-domain features, and the final extracted frequency-domain feature format was 2400 × 40 × 4.
We conducted experiments based on the GeForce GTX3090 GPU and the Pytorch1.7 framework. In this section, we first verified the effectiveness of the model Mul-AT-RGCN on multimodal tasks, and it is better than the current popular model. We also verified the effectiveness of the proposed model through cross-subject experiments.

4.2. Within-Subject Experiment

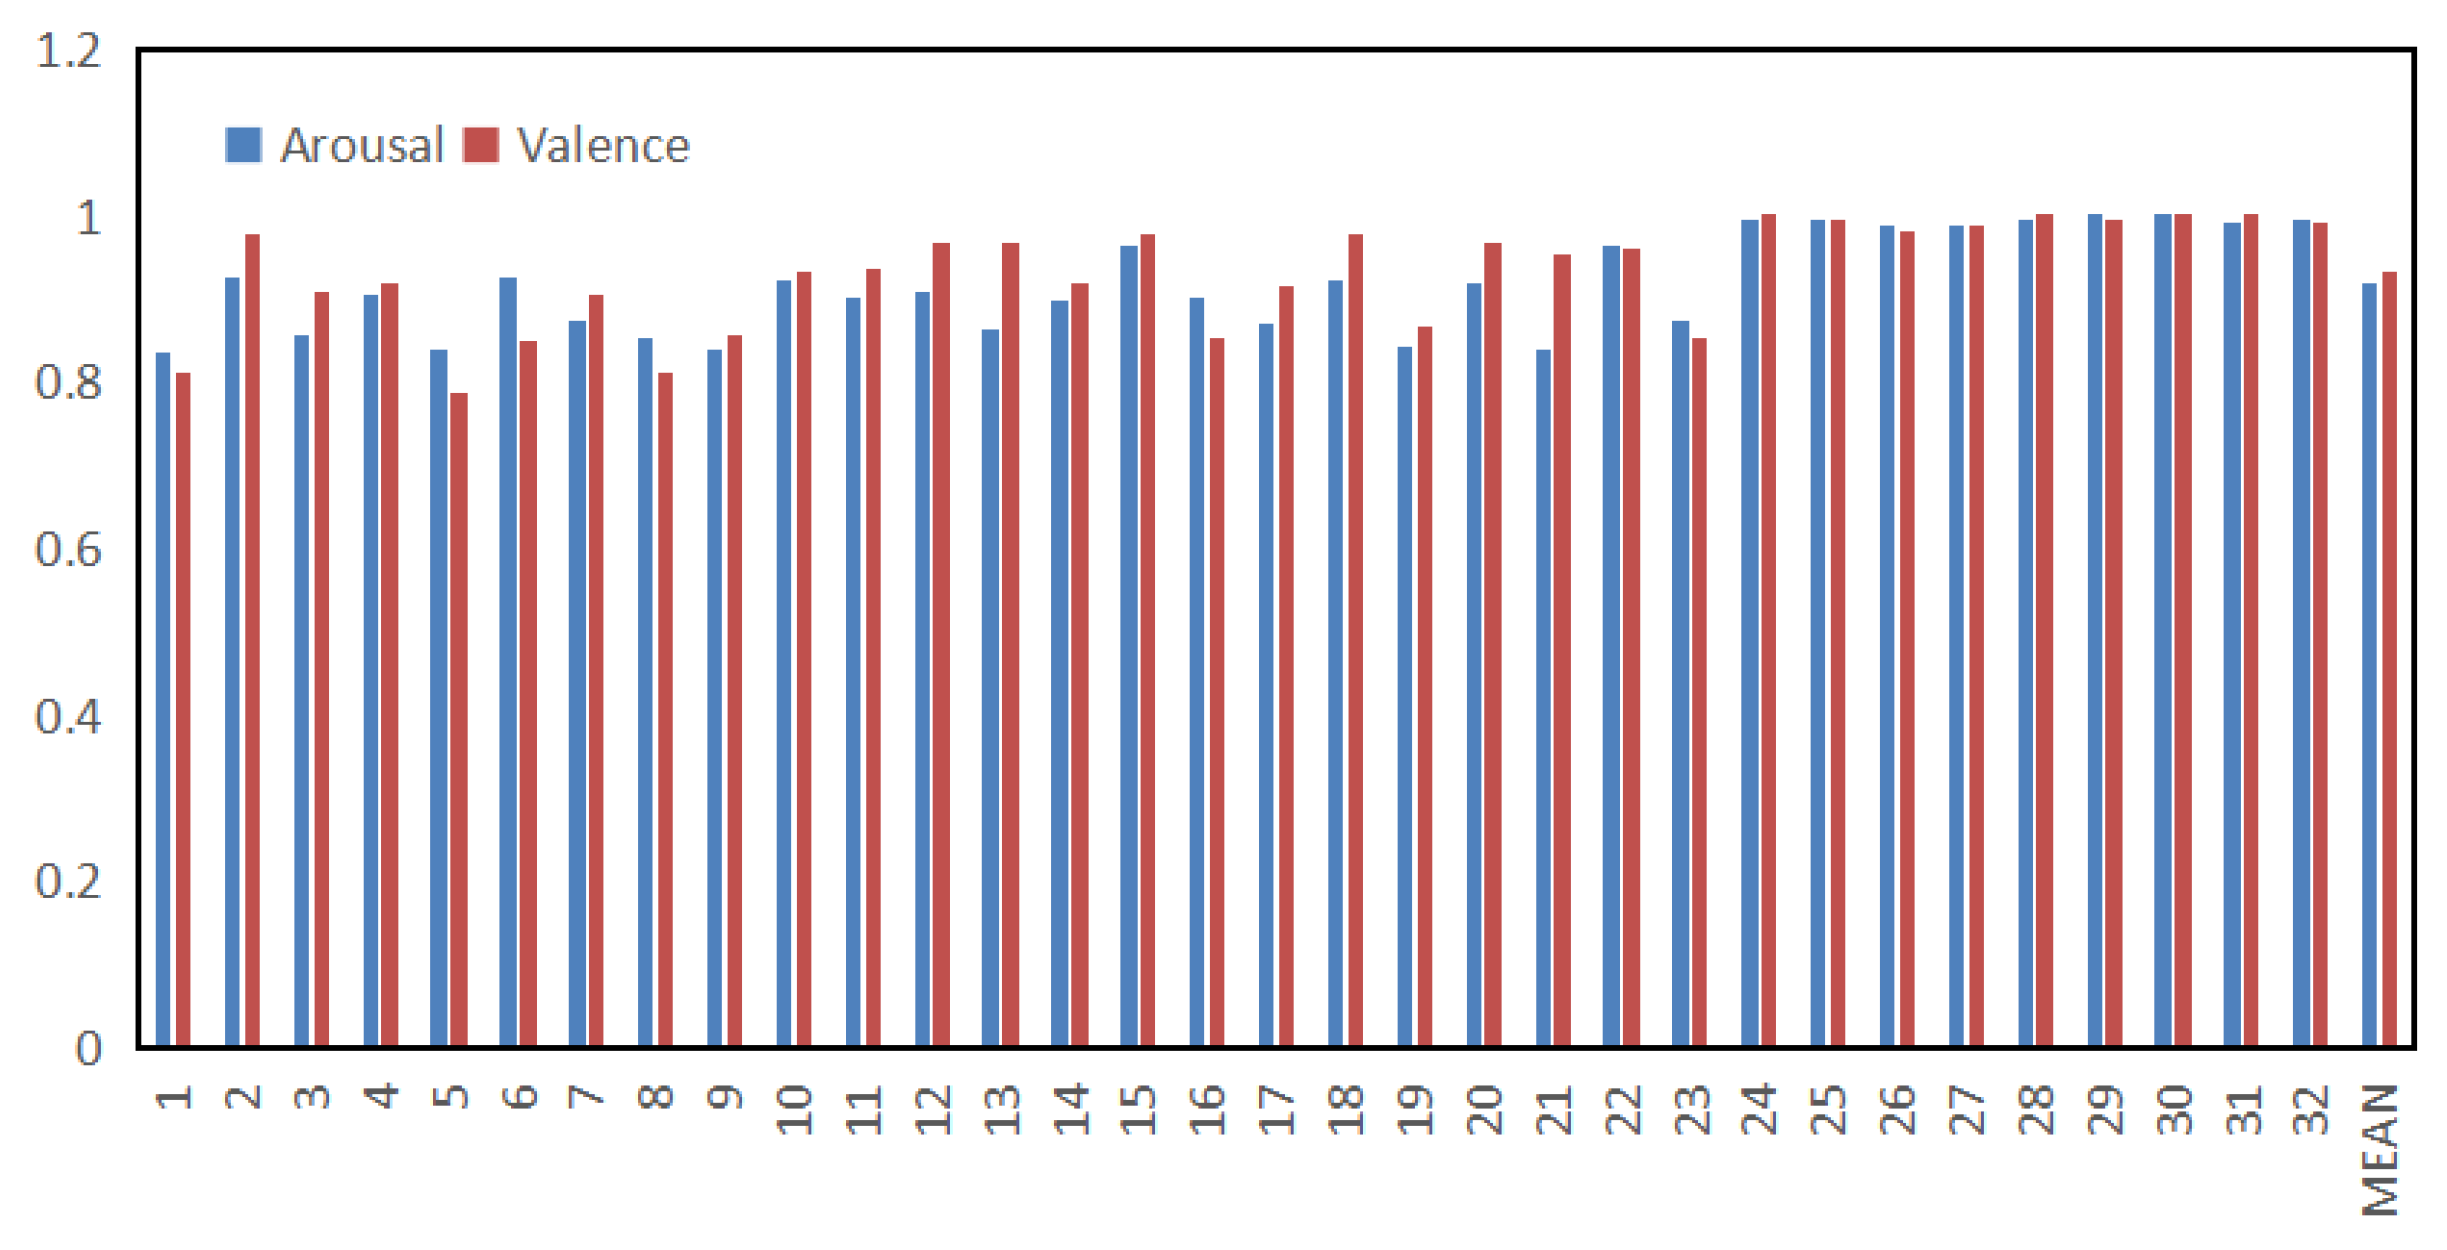
The experiment was carried out among 32 subjects, and the five-fold cross-validation method was used to evaluate the precision of the proposed method in emotion recognition within subjects. Specifically, the data of each subject were divided into five groups of the same size to ensure that there was no overlap between the data. One of the data groups was taken as the test, and the rest of the data groups were used as the train. This process was repeated five times. The average of the five results was used as the final precision of the experiment. The parameters, after tuning, in this experiment were set as follows: epoch was set to 200, batch size was set to 40, learning rate was set to 0.001, and dropout coefficient was set to 0.2. The prediction precision of 32 subjects is depicted in Figure 6.
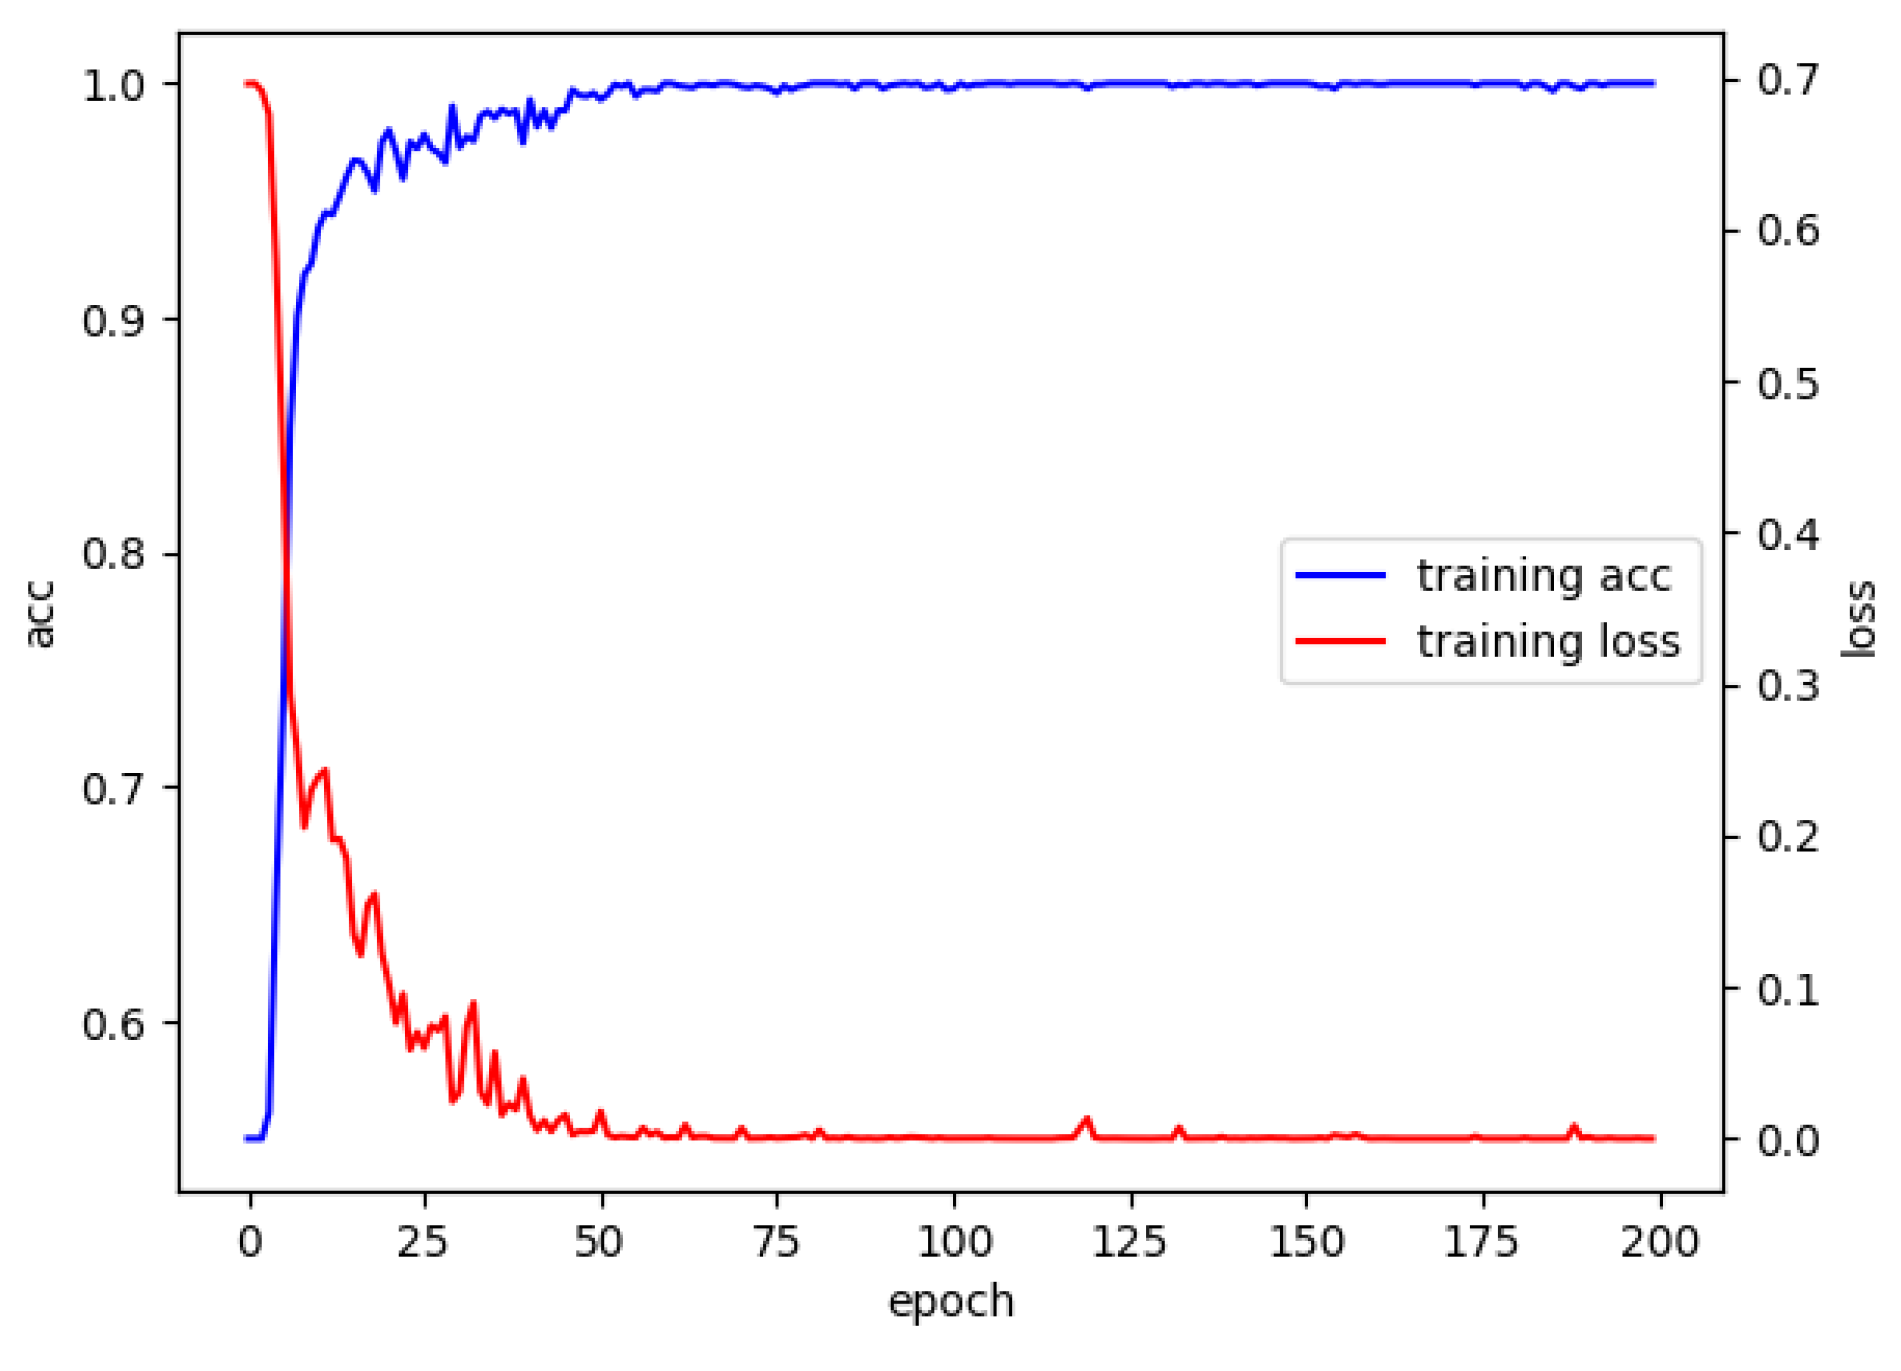
It can be seen from Figure 6 that the Mul-AT-RGCN model’s average classification accuracy of the valence and arousal on the test is 93.19% and 91.82%, respectively, and the training-process curve is depicted in Figure 7.
It can be seen from Figure 7 that during the training process, with the increase of the number of epochs, the training accuracy kept approaching 1 and finally converged around 0.99. Although the loss abruptly increased and then decreased a few times, it generally declined and constantly approached 0. When the epoch increased from 0 to 200, the training accuracy rose with a great gradient and then gradually converged to 1; while the loss decreased with a great gradient and, with the number of iterations, increased and gradually converged to 0. During the iterative process, the loss constantly converged; it also oscillated continuously. The loss had three large changes, while accuracy also underwent large changes. We analyze that the reason for this phenomenon may be the model produces a local optimal solution during the parameter training process. As the number of iterations increases, the Adam optimizer continuously corrects the parameters, and the training data is continuously updated. Finally, the two curves became stable until the fitting was completed.
To further verify the superiority of the proposed model, we use popular machine-learning methods, deep-learning methods, and our proposed method to conduct a comparison of EEG multimodal emotion classification within subjects, and the accuracies are shown in Table 1.
From Table 1, it can be seen that the average classification accuracy of our proposed method is improved by 13.94% and 2.8% in the valence compared with the traditional machine-learning methods SVM and KNN, respectively, and improved by 13.92% and 2.76% in the arousal, respectively. This occurs because our model can automatically learn and classify emotion-related features, but traditional machine-learning methods focus more on manually extracting emotion-related features, and the final classification result is largely determined by the manually extracted features. If we can extract better handcrafted features, machine learning can achieve better classification accuracy than deep learning. Compared with the other six deep-learning methods, the accuracy of the valence increased by 18.88%, 7.69%, 9.37%, 7.57%, 4.2%, and 2.75%, and the accuracy of the arousal increased by 15.59%, 4.52%, 8.59%, 7.49%, 1.49%, and 0.12%, which also shows that our proposed method achieves better performance. We believe that the reason for this is that our proposed model has deeper layers and can learn more parameters, thereby extracting more emotion-related features, and because our model is a combined model of the graph convolutional network and Bi-LSTM network, it can extract more comprehensive feature information.

4.3. Cross-Subject Experiment

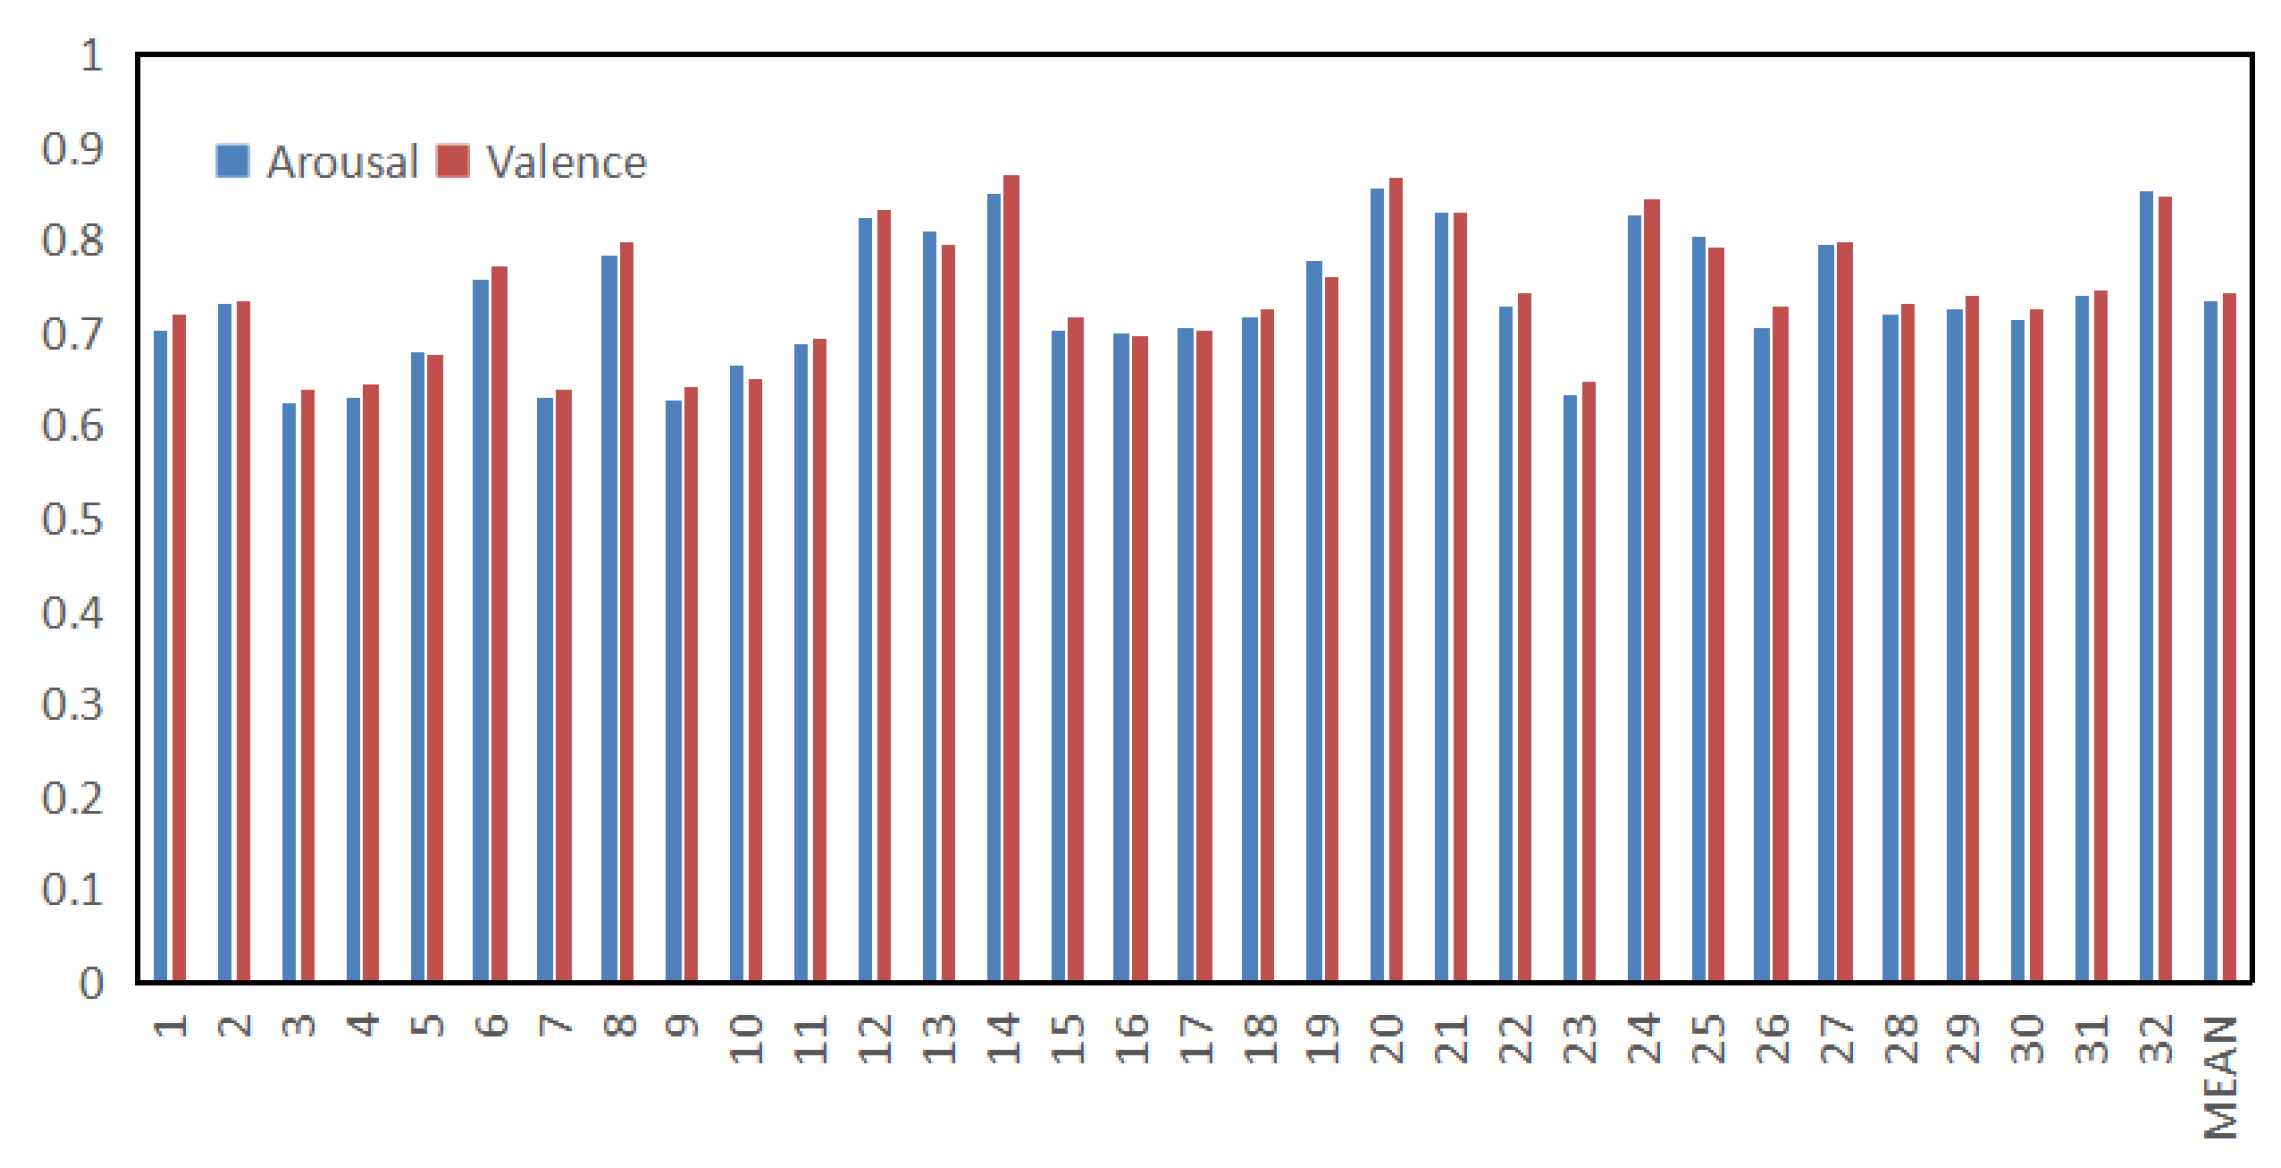
To enhance the generalization ability of the model, we added a domain adaptation module to the Mul-AT-RGCN model and adopted the leave-one-subject verification method to verify the validity of the model. Specifically, a subject was extracted from 32 subjects in each cycle, these data were used as the test, and the rest of the subjects’ data were used as the train for the cross-subject experiment. After the tuning, the model parameters were set as follows: epoch was set to 200, batch size was set to 120, learning rate was set to 0.0005, and dropout coefficient was set to 0.2. Figure 8 shows the accuracy in the valence and arousal.
In Figure 8, it can be seen that the Mul-AT-RGCN-DAN model has an average classification accuracy of 74.13% and 73.47% in valence and arousal, respectively, in the cross-subject experiment.
To verify the effectiveness of the Mul-AT-RGCN-DAN model, we compare the emotion-classification accuracy with the method we proposed in this paper and the current popular machine-learning and deep-learning methods on multimodal-feature cross subjects, as shown in Table 2.
It can be seen from Table 2 that the average classification accuracy of the method proposed in this paper improved compared with those of the existing methods, which verifies that our proposed model achieves better performance in cross-subject experiments.

5. Discussion

In this section, we first discuss the improvement of multimodal performance compared with single-modality and use the three benchmark models RGCN, ATT-RGCN, and AT-LGCN to discuss the role of each component of our proposed model and the contribution of each component to the performance improvement. In cross-subject experiments, we discuss the impact of the presence or absence of the DAN module on performance. In addition, we also discuss shortcomings of our proposed model and the direction of our research in the future.

5.1. Within-Subject Ablation Experiment and Model Comparison

To verify the advantages of multimodal fusion features, we input only the time-domain EEG features with dimensions of 2400 × 32 × 128 and the frequency-domain EEG features with dimensions of 2400 × 32 × 4 into Mul-AT-RGCN. Compared with the multimodal features mentioned, the parameter settings of the two are the same, and the average classification accuracies are shown in Table 3.
It can be seen from Table 3 that the classification accuracies of multimodal features is significantly higher than those of single EEG features. Compared with single EEG features, the classification accuracies of multimodal fusion features are improved by 5.1% and 4.69% in the valence and arousal, respectively. We found that the multimodal fusion feature can make the information of different modalities complement each other so as to obtain more emotion-related information.
To verify the advantages of the proposed structure of the Mul-AT-RGCN model, we use three variants of the model, named RGCN, ATT-RGCN, and AT-LGCN. Among them, RGCN does not have the CBAM module, ATT-RGCN only contains the channel attention but not the spatial attention module, and AT-LGCN only uses a single-layer LSTM in the recurrent graph convolution layer. The rest of the parameters of the three models are the same as the model we proposed in this paper, and the accuracies are shown in Table 4.
It can be seen from Table 4 that compared with RGCN, ATT-RGCN, and AT-LGCN, the classification accuracies of Mul-AT-RGCN increased by 6.02%, 0.86%, and 2.44% in the valence, respectively, and the arousal increased by 5.4%, 0.15%, and 1.79%, respectfully. The experimental results show that our proposed model is better, which also proves the superiority of the proposed model in structure. In particular, the addition of the attention mechanism can extract more correlations between different channels and different modalities so that the multimodal fusion features contain more emotion-related information. Spatial attention can complement channel attention, enabling the network to learn more useful features to optimize emotion classification. The reason why the proposed model works better than the single-layer LSTM model is that BiLSTM can better learn the dependencies before and after the time series, thereby better optimizing the model parameters.

5.2. Cross-Subject Ablation Experiment and Model Comparison

To verify the advantages of the Mul-AT-RGCN-DAN model in cross-subject experiments, we input the features containing only EEG signals into the Mul-AT-RGCN-DAN, compared them with the multimodal input, and compared the model with and without the domain adaptive module. The experimental parameter settings are the same, and the experimental average classification accuracies are shown in Table 5.
It can be seen from Table 5 that the classification accuracies of multimodal fusion features are improved by 2.67% and 2.62% in valence and arousal, respectively, compared with those of EEG features, which verifies the effectiveness of multimodal features in cross-subject experiments. Compared with the model without domain adaptation, the Mul-AT-RGCN-DAN model improves valence and arousal by 13.96% and 14.02%, respectively, which verifies the effectiveness of the domain adaptation module in the cross-subject experimental model.

5.3. Model Limitations and Future Research

Our proposed model converts multimodal features, including peripheral physiological signals such as EEG, OMG, and EMG, into a graph structure by adding CBAM blocks, the graph convolutional network, and the BiLSTM network for deep feature extraction. The proposed method achieved better accuracy in both within-subject and cross-subject binary emotion classification.
Although our proposed method achieved good results in binary emotion classification, it still has some limitations. Our exploration of different modal relationships is insufficient. We use information from different modalities to fuse at the data level in our experiments. Although this fusion will retain the most original feature information, the fusion process may produce some emotion-irrelevant noise information, and our method uses only the simplest join operation to fuse the data and make deep feature extraction and emotion classification. The latest research [6,7,11] achieved higher classification accuracy than our experiment. In [11], Du et al. modified the feature extraction and classification-optimization layer repetitions, successfully reducing the number of samples and, at the same time, improving the classification accuracy. In addition, three BiLSTM sublayers were used to improve the model classification sensitivity. In [6], Tuncer et al. used the DWT (discrete wavelet transform) and Tetromino pattern to generate features in both low- and high-level features. The feature selector is also used to select the feature with the largest amount of information from each channel. Compared with some deep-learning models, this method has smaller parameters and simpler models under the premise of ensuring accuracy. In [7], Dogan et al. used the TQWT (tunable Q-factor wavelet transform) method to extract manual features, where the classification method and feature selector were similar to [6]. The above also provides a new idea for our future experiments. The other limitation of our proposed method is that its cross-subject learning ability is limited. Although our model can achieve a decent classification accuracy, compared with the latest research methods, there is still a large space for improvement in cross-subject experimental accuracy. Although using DAN can reduce the differences between subjects, it is still difficult to learn the common deep multimodal features among subjects.
In the future, we will keep mining the relationship between deeper features between different modalities and study better fusion methods between different modal data to further improve the performance of multimodal emotion recognition. In addition, we will also optimize our proposed model from model structure and features. We will extract better manual features, optimize model structure, reduce model complexity, and improve model classification accuracy. We will also keep researching the transfer learning and domain adaptation method to further reduce the differences between subjects and improve the accuracy of cross-subject EEG emotion recognition. In addition, we will also carry out more research on emotion multi-classification in different dimensions in the DEAP dataset.

6. Conclusions

In this paper, we propose a multimodal-emotion-recognition method based on the attention recurrent graph convolutional neural network, which can obtain multimodal features with richer emotional information by mining the relationship between different channels at the data level. On this basis, two different features of spatiotemporal and frequency–space are extracted and input into the graph convolutional network and BiLSTM network for deep feature extraction, and we use this result as the final multimodal fusion feature for emotion classification. In the cross-subject experiment, a domain adaptation module was added to reduce the differences among different subjects. We conducted a binary emotion classification experiment on the multimodal public dataset DEAP and used 32 subjects for cross-validation with multimodal data. The results showed that the average classification accuracy of the valence can reach 93.19%, and the average classification accuracy of the arousal can reach 91.82%, which is a great improvement compared with the EEG modality. This shows that the method we propose in this paper can make full use of the multimodal complementary information to improve the accuracy of emotion recognition compared with the current popular deep-learning methods, which verifies the superiority of the model. At the same time, cross-subject experiments were carried out to supplement the experimental results, which again verified the validity of the model. This model provides an effective way for the development of multimodal-emotion-recognition applications of the brain–computer interface.

Author Contributions

Conceptualization, J.C.; methodology, J.C. and Y.L.; software and validation, Y.L., W.X., and W.L.; formal analysis, K.H.; investigation, W.X.; resources, W.L.; data curation, K.H.; writing—original draft preparation, Y.L.; writing—review and editing, J.C. All authors have read and agreed to the published version of the manuscript.

Funding

This research was funded by the National Natural Science Foundation of China under the Project Agreement No. 61806118 and the Research Startup Foundation of Shaanxi University of Science and Technology under the Project No. 2020bj-30.

Data Availability Statement

The dataset supporting the conclusions of this article are available at http://www.eecs.qmul.ac.uk/mmv/datasets/deap/download.html. (accessed on 1 November 2020).

Conflicts of Interest

The authors declare no conflict of interest.

References

  1. Picard, R.W. Affective Computing; MIT Press: Cambridge, MA, USA, 2000. [Google Scholar]
  2. Zhao, S.; Jia, G.; Yang, J.; Ding, G.; Keutzer, K. Emotion recognition from multiple modalities: Fundamentals and methodologies. IEEE Signal Process. Mag. 2021, 38, 59–73. [Google Scholar] [CrossRef]
  3. Pan, J.H.; He, Z.P.; Li, Z.N.; Yan, L.; Lina, Q. A review of multimodal emotion recognition. CAAI Trans. Intell. Syst. 2020, 15, 633–645. [Google Scholar] [CrossRef]
  4. Verma, G.K.; Tiwary, U.S. Multimodal fusion framework: A multiresolution approach for emotion classification and recognition from physiological signals. NeuroImage 2014, 102, 162–172. [Google Scholar] [CrossRef] [PubMed]
  5. Tuncer, T.; Dogan, S.; Subasi, A. LEDPatNet19: Automated emotion recognition model based on nonlinear LED pattern feature extraction function using EEG signals. Cogn. Neurodynamics 2022, 16, 779–790. [Google Scholar] [CrossRef] [PubMed]
  6. Tuncer, T.; Dogan, S.; Baygin, M.; Acharya, U.R. Tetromino pattern based accurate EEG emotion classification model. Artif. Intell. Med. 2022, 123, 102210. [Google Scholar] [CrossRef] [PubMed]
  7. Dogan, A.; Akay, M.; Barua, P.D.; Baygin, M.; Dogan, S.; Tuncer, T.; Dogru, A.H.; Acharya, U.R. PrimePatNet87: Prime pattern and tunable q-factor wavelet transform techniques for automated accurate EEG emotion recognition. Comput. Biol. Med. 2021, 138, 104867. [Google Scholar] [CrossRef] [PubMed]
  8. Subasi, A.; Tuncer, T.; Dogan, S.; Tanko, D.; Sakoglu, U. EEG-based emotion recognition using tunable Q wavelet transform and rotation forest ensemble classifier. Biomed. Signal Process. Control 2021, 68, 102648. [Google Scholar] [CrossRef]
  9. Yang, Y.; Wu, Q.; Fu, Y.; Chen, X. Continuous convolutional neural network with 3D input for EEG-based emotion recognition. In Proceedings of the International Conference on Neural Information Processing, Siem Reap, Cambodia, 13–16 December 2018; Springer: Cham, Switzerland, 2018; pp. 433–443. [Google Scholar]
  10. Chen, J.X.; Hao, W.; Zhang, P.W.; Min, C.D.; Li, Y.C. Sentiment classification of EEG spatiotemporal features based on hybrid neural network. J. Softw. 2021, 32, 3869–3883. [Google Scholar]
  11. Du, R.; Zhu, S.; Ni, H.; Mao, T.; Li, J.; Wei, R. Valence-arousal classification of emotion evoked by Chinese ancient-style music using 1D-CNN-BiLSTM model on EEG signals for college students. Multimed. Tools Appl. 2022; 1–18. [Google Scholar]
  12. Yin, Y.; Zheng, X.; Hu, B.; Zhang, Y.; Cui, X. EEG emotion recognition using fusion model of graph convolutional neural networks and LSTM. Appl. Soft Comput. 2021, 100, 106954. [Google Scholar] [CrossRef]
  13. Dobrišek, S.; Gajšek, R.; Mihelič, F.; Pavešić, N.; Štruc, V. To-wards efficient multi-modal emotion recognition. Int. J. Adv. Robot. Syst. 2013, 10, 53. [Google Scholar] [CrossRef] [Green Version]
  14. Zhang, S.; Zhang, S.; Huang, T.; Gao, W.; Tian, Q. Learning affective features with a hybrid deep model for audio–visual emotion recognition. IEEE Trans. Circuits Syst. Video Technol. 2017, 28, 3030–3043. [Google Scholar] [CrossRef]
  15. Nakisa, B.; Rastgoo, M.N.; Rakotonirainy, A.; Maire, F.; Chandran, V. Automatic emotion recognition using temporal multimodal deep learning. IEEE Access 2020, 8, 225463–225474. [Google Scholar] [CrossRef]
  16. Tang, H.; Liu, W.; Zheng, W.L.; Lu, B.L. Multimodal emotion recognition using deep neural networks. In Proceedings of the International Conference on Neural Information Processing, Guangzhou, China, 14–18 November 2017; Springer: Cham, Switzerland, 2017; pp. 811–819. [Google Scholar]
  17. Huang, Y.; Yang, J.; Liu, S.; Pan, J. Combining facial expressions and electroencephalography to enhance emotion recognition. Future Internet 2019, 11, 105. [Google Scholar] [CrossRef] [Green Version]
  18. Woo, S.; Park, J.; Lee, J.Y.; Kweon, I.S. Cbam: Convolutional block attention module. In Proceedings of the European Conference on Computer Vision (ECCV), Munich, Germany, 8–14 September 2018; pp. 3–19. [Google Scholar]
  19. Kipf, T.N.; Welling, M. Semi-supervised classification with graph convolutional networks. arxiv 2016, arXiv:1609.02907. [Google Scholar]
  20. Graves, A.; Schmidhuber, J. Framewise phoneme classification with bidirectional LSTM and other neural network architectures. Neural Netw. 2005, 18, 602–610. [Google Scholar] [CrossRef]
  21. Long, M.; Cao, Y.; Wang, J.; Jordan, M. Learning transferable features with deep adaptation networks. In Proceedings of the International Conference on Machine Learning, PMLR, Lille, France, 7–9 July 2015; pp. 97–105. [Google Scholar]
  22. Koelstra, S.; Muhl, C.; Soleymani, M.; Lee, J.; Yazdani, A.; Ebrahimi, T.; Pun, T.; Nijholt, A. Deap: A database for emotion analysis; using physiological signals. IEEE Trans. Affect. Comput. 2011, 3, 18–31. [Google Scholar] [CrossRef] [Green Version]
  23. Rumelhart, D.E.; Hinton, G.E.; Williams, R.J. Learning Internal Representations by Error Propagation; ICS Report 8506; California Univ San Diego La Jolla Inst for Cognitive Science: San Diego, CA, USA, 1985. [Google Scholar]
  24. Suykens JA, K.; Vandewalle, J. Least squares support vector machine classifiers. Neural Process. Lett. 1999, 9, 293–300. [Google Scholar] [CrossRef]
  25. Kwon, Y.H.; Shin, S.B.; Kim, S.D. Electroencephalography Based Fusion Two-Dimensional (2D)-Convolution Neural Networks (CNN) Model for Emotion Recognition System. Sensors 2018, 18, 1383. [Google Scholar] [CrossRef] [PubMed] [Green Version]
  26. Lin, W.; Li, C.; Sun, S. Deep convolutional neural network for emotion recognition using EEG and peripheral physiological signal. In Proceedings of the International Conference on Image and Graphics, Shanghai, China, 13–15 September 2017; Springer: Cham, Switzerland, 2017; pp. 385–394. [Google Scholar]
  27. Qiu, J.L.; Liu, W.; Lu, B.L. Multi-view emotion recognition using deep canonical correlation analysis. In Proceedings of the International Conference on Neural Information Processing, Siem Reap, Cambodia, 13–16 December 2018; Springer: Cham, Switzerland, 2018; pp. 221–231. [Google Scholar]
  28. Song, T.; Zheng, W.; Song, P.; Cui, Z. EEG emotion recognition using dynamical graph convolutional neural networks. IEEE Trans. Affect. Comput. 2018, 11, 532–541. [Google Scholar] [CrossRef] [Green Version]
  29. Chuang, S.W.; Ko, L.W.; Lin, Y.P.; Huang, R.; Jung, T.; Lin, C. Co-modulatory spectral changes in independent brain processes are correlated with task performance. Neuroimage 2012, 62, 1469–1477. [Google Scholar] [CrossRef]
  30. Yang, F.; Zhao, X.; Jiang, W.; Gao, P.; Liu, G. Multi-method fusion of cross-subject emotion recognition based on high-dimensional EEG features. Front. Comput. Neurosci. 2019, 13, 53. [Google Scholar] [CrossRef] [PubMed] [Green Version]
  31. Cimtay, Y.; Ekmekcioglu, E. Investigating the use of pretrained convolutional neural network on cross-subject and cross-dataset EEG emotion recognition. Sensors 2020, 20, 2034. [Google Scholar] [CrossRef] [PubMed]
Figure 1. Schematic process of multimodal-graph-sequence construction. A multimodal graph sequence is a stack of several multimodal graphs. A multimodal graph is composed of node features and graph structure.
Information 13 00550 g001
Figure 2. The schematic process of the Mul-AT-RGCN model. The model consists of two branches, space–time and frequency–space. Each branch consists of an attention mechanism module and a recurrent graph convolution module.
Information 13 00550 g002
Figure 3. Components of the attention mechanism module: (a) represents the schematic process of channel attention and (b) represents the schematic process of spatial attention.
Information 13 00550 g003
Figure 4. The schematic process of the BiLSTM module, which contains the forward LSTM and the backward LSTM.
Information 13 00550 g004
Figure 5. The schematic process of the Mul-AT-RGCN-DAN model. The domain adaptation module is added to the model Mul-AT-RGCN.
Information 13 00550 g005
Figure 6. Statistical chart of Mul-AT-RGCN model’s within-subject accuracy.
Information 13 00550 g006
Figure 7. The training-process curve in the within-subject experiment.
Information 13 00550 g007
Figure 8. Statistical chart of Mul-AT-RGCN-DAN model’s cross-subject accuracy.
Information 13 00550 g008
Table 1. Comparison of classification performance with other models.
ModelValenceArousal
MLP [23]74.31%76.23%
SVM [24]79.75%78.90%
KNN [25]90.39%89.06%
CNN [26]85.50%87.30%
LSTM [16]83.82%83.23%
DCCA [27]85.62%84.33%
GCN [19]89.17%90.33%
DGCNN [28]90.44%91.70%
Mul-AT-RGCN93.19%91.82%
Table 2. Comparison of classification accuracies of cross subjects of different models.
ModelAverage ACC
BT [29]71.00%
SVM [24]71.06%
ST-SBSSVM [30]72.00%
InceptionResNetV2 [31]72.81%
Mul-AT-RGCN73.80%
Table 3. Comparison of single-modal and multimodal within-subject classification.
ModalityValenceArousal
EEG88.09%87.13%
EEG+PPS93.19%91.82%
Table 4. Comparison of classification of ablation experimental models.
ModelValenceArousal
RGCN87.17%86.42%
ATT-RGCN92.33%91.67%
AT-LGCN90.75%90.03%
Mul-AT-RGCN93.19%91.82%
Table 5. Comparison of cross-subject classification accuracies between single-modal and multimodal models.
ModelModalityValenceArousal
Mul-AT-RGCN-DANEEG71.46%70.85%
Mul-AT-RGCN-noDANEEG+PPS60.17%59.45%
Mul-AT-RGCN-DANEEG+PPS74.13%73.47%
Publisher’s Note: MDPI stays neutral with regard to jurisdictional claims in published maps and institutional affiliations.