Article

A Spark-Based Artificial Bee Colony Algorithm for Unbalanced Large Data Classification

by
Jamil Al-Sawwa
*,† and
Mohammad Almseidin
Computer Science Department, Tafila Technical University, Tafila 66110, Jordan
*
Author to whom correspondence should be addressed.
These authors contributed equally to this work.
Information 2022, 13(11), 530; https://doi.org/10.3390/info13110530
Submission received: 23 August 2022 / Revised: 3 November 2022 / Accepted: 6 November 2022 / Published: 8 November 2022
(This article belongs to the Special Issue Advanced Information Technology, Big Data and Artificial Intelligence)

Abstract

:
With the rapid development of internet technology, the amount of collected or generated data has increased exponentially. The sheer volume, complexity, and unbalanced nature of this data pose a challenge to the scientific community to extract meaningful information from this data within a reasonable time. In this paper, we implemented a scalable design of an artificial bee colony for big data classification using Apache Spark. In addition, a new fitness function is proposed to handle unbalanced data. Two experiments were performed using the real unbalanced datasets to assess the performance and scalability of our proposed algorithm. The performance results reveal that our proposed fitness function can efficiently deal with unbalanced datasets and statistically outperforms the existing fitness function in terms of G-mean and F 1 -Score. In additon, the scalability results demonstrate that our proposed Spark-based design obtained outstanding speedup and scaleup results that are very close to optimal. In addition, our Spark-based design scales efficiently with increasing data size.

1. Introduction

Data classification is a supervised learning technique that aims to classify future data by analyzing past data. In the classification task, a model is built and trained using historical data (training data) using a sophisticated algorithm. Then, the model is used to classify each sample in testing data [1]. In recent decades, data classification has been effectively applied to various areas such as bioinformatics, transportation engineering, and business.
Unbalanced data is one of the significant challenges that face the researchers in real-life data, according to [2]. In this kind of data item, the distribution of samples is skewed among the class labels. Thus, this skewed distribution poses a difficulty for machine learning algorithms, as they bias toward the majority class labels and ignore the minority class labels even if classifying the minority is more important. Consequently, this problem should be tackled before or while building a model. The aim is to obtain a robust and efficient model that could classify the minority and majority class labels with the same priority.
During the last decade, various big data frameworks have been introduced to cope with the sheer volume of data. Apache Spark is one of the big data frameworks that processes a massive amount of data across a cluster of worker nodes [3], which was introduced in the AMPLab at the University of California-Berkeley [4]. Their main contribution aims to handle the main drawback of the Hadoop MapReduce [5] which is the overhead of disk operation (Input/Output) during running a Map and Reduce job. In addition, Apache Spark addresses the inefficiency of Hadoop MapReduce when performing iterative and interactive jobs. Apache Spark uses Resilient Distributed Dataset (RDD) to perform all computations across the worker nodes’ memory in a fault-tolerant manner [4,6]. RDDs are immutable objects, which means that once the RDD is created cannot be changed. Furthermore, RDDs are fault tolerant in the case of failure by keeping the “Lineage” for RDDs. Two primary operations can be executed on the RDDs: transformation and action. The transformation operations are lazily operations used to create a new RDD by transforming the existing RDDs, such as map, intersection, and groupByKey. The action operations are used to perform computation on the RDDs and return the results to the driver program, such as foreach, collect, and reduce.
Compared to the Hadoop MapReduce, Apache Spark is 10 to 100 times faster than the Hadoop MapReduce for processing massive data because all computations are carried out on worker nodes’ memory. Recently, Apache spark has been efficiently used for processing big data in various applications such as eBay and Netflix [7].
In the past two decades, various bio-inspired algorithms have been proposed to solve real optimization problems in scientific domains such as engineering. The bio-inspired algorithms imitate a biological model such as social behavior. Artificial Bee Colony (ABC) algorithm is one of the bio-inspired algorithms belonging to the Swarm Intelligence family, a population-based search algorithm introduced by Karaboga [8,9]. ABC mimics the intelligent behavior of the honeybees seeking a good food source (solution). ABC algorithm presented itself as a robust and efficient search technique for solving real-world optimization problems [8]. Recently, ABC has been used to solve classification and clustering tasks [10,11,12].
In [10], Karaboga and Ozturk proposed an ABC-based data classification algorithm (ABCC). Their proposed algorithm aims to find the optimal centroid of each class label in a training dataset by minimizing the sum of the Euclidean distance between the data samples and their class label’s center. The experimental results show that their proposed work can efficiently perform the data classification task in small balanced datasets. In addition, their proposed work outperforms the particle swarm optimization-based data classification in terms of misclassification rate. However, this algorithm shows inefficient performance when applied to a massive and unbalanced dataset.
In this paper, we address the previous shortcomings of the ABC-based data classification algorithm to enhance its performance when applied to a massive unbalanced dataset. The major contributions to this work are as follows:
  • We propose a new minimum fitness function to handle unbalanced data by minimizing the weight of the miss-classification rate.
  • We design and implement a parallel version of the ABC-based data classification algorithm using Apache Spark to carry out the classification task on a massive amount of data while maintaining the quality level of the classification outcomes.
  • We investigate the scalability and effectiveness of the parallel design of the ABC-based data classification algorithm using real-world massive unbalanced datasets.
The rest of the paper is organized as follows: Section 2 presents the recent relevant related to designing a scalable solution using a big data framework. The background knowledge, including ABC and ABCC, is briefly presented in Section 3. Section 4 illustrates spark-based design of ABCC for large data classification. The dataset and environment are described in Section 5. Section 6 describes the evaluation measures. The experiments and results are presented in Section 7. Finally, Section 8 concludes the paper.

2. Related Works

Recently, designing and implementing scalable solutions of nature-inspired algorithms for solving big data mining tasks have received attention from researchers. The aim is to enhance the performance of these algorithms when applied to a massive amount of data. This section provides the recent works relevant to designing parallel nature-inspired algorithms for big data mining tasks.
The authors in [11] proposed a parallel artificial bee colony for data clustering using Hadoop MapReduce (MR-ABC). The aim is to improve the performance of the artificial bee colony algorithm when performing a clustering task in big data. The idea of MR-ABC is to find the optimal centroids of each cluster. MR-ABC uses the Hadoop MapReduce programming paradigm to evaluate the bees’ fitness through Map and Reduce phases. Using real and synthetic datasets, the experimental results presented that MR-ABC is effective and robust for performing a clustering task in big data compared to the serial version of that algorithm.
In [12], a Spark-based artificial bee colony was introduced to carry out a big data clustering by finding the optimal centroid of each cluster. In their proposed work, the bee’s fitness is evaluated in a parallel fashion. The experiments were conducted using KDD CUP 99 dataset to evaluate the effectiveness of the proposed algorithm. The results demonstrate that the proposed algorithm achieved approximately linear speedup and good clustering quality.
In [13], MapReduce-based enhanced grey wolf optimizer (MR-EGWO) was proposed for performing big data clustering. In MR-EGWO, the dataset is split into partitions distributed across a cluster of nodes. Then, the Map and Reduce phases are launched on the Hadoop nodes to evaluate the grey wolf’s (individual) fitness. The experimental results using seven UCI datasets showed that MR-EGWO obtained a good clustering quality in terms of F-measure compared to five nature-inspired-based clustering algorithms. In addition, MR-EGWO achieved a good speedup result using two synthetic datasets.
The authors in [14] proposed two variants of a Spark-based particle swarm optimization (PSO) for big data classification. In their proposed work, the updating phases for the position and the velocity of all particles are performed on the master node, while the fitness evaluation of all particles is carried out on worker nodes using the broadcast and accumulator variables. Their proposed work obtained very good speedup and scaleup results while maintaining PSO’s efficiency for solving data classification.
In [15], the authors proposed a MapReduce-based differential evolution algorithm for big data clustering. In their work, the operations of differential evolution (mutation and crossover) and fitness evaluation are carried out using MapReduce jobs. The experimental results revealed that their proposed algorithm obtained outstanding results compared to MapReduce-based particle swarm optimization and K-means algorithms.
Wang et al. proposed a hybrid K-PSO method using Hadoop MapReduce to perform a clustering task on a large dataset [16]. In another work found in [17], a MapReduce-based ant-colony clustering algorithm is proposed. Their work aims to perform clustering on a big dataset using the ant colony algorithm. The results showed that their proposed obtained good accuracy with good efficiency.
In [18], the authors proposed MapReduce-based particle swarm optimization for large data clustering (MR-CPSO). Using synthetic datasets, MR-CPSO achieved significant speedup results while maintaining the clustering quality. Other works that related to the scalable solutions of big data mining using meta-heuristics algorithms can be found in [19,20,21].

3. The Background Knowledge

3.1. Artificial Bee Colony Algorithm (ABC)

ABC [8,9] is a meta-heuristic search algorithm that belongs to the swarm intelligence family. In ABC, the bees that form a colony collaborate in finding the food source (solution) with the highest nectar (fitness). The bees are categorized based on their work into three groups: employed bees, onlookers’ bees, and scouts. Each employed bee binds to a food source and updates the food source in its memory if a new candidate food source is better. Onlookers’ bees wait in the dance area in the hive and cooperate with the employed bees to update the food sources depending on their probability. The scout bees behave randomly in a search space to discover a new food source.
ABC starts by randomly distributing a predefined number of food sources ( S N ) in d-dimensional search space. Formally, the i-th food source is encoded as follows:
u i = { u 1 , u 2 , , u d } , i = { 1 , 2 , , S N }
After initialization, the nectar amount (fitness) of the food sources is evaluated using an objective function (fitness function). Then, the food sources are updated by the bees (employed, onlookers, and scouts) through repeated cycles.
Each employed bee starts generating a new candidate food source by modifying the current food source using Equation (2). Then, the candidate food source is evaluated to measure its nectar amount. After that, the employed bee replaces the old food source in its memory with the candidate food source if the nectar amount of the candidate food source is better than the old one. Otherwise, the employed bee keeps the old food source.
z i j = u i j + ϕ i j ( u i j u r j ) , i ϵ { 1 , 2 , , S N } a n d j ϵ { 1 , 2 , , d }
z i is the candidate food source, ϕ i j is randomly chosen in rang [−1, 1], and r is randomly chosen from { 1 , 2 , , S N } and different from i.
After the employed bees finish their work, the probability of each food source is calculated as follows:
P i = F i j = 1 S N F j
where P i is the probability of i-th food source and F i is the nectar amount of i-th food source.
Then, the employed bees return to their hive and share the information with the onlooker bees. The onlooker bees choose a food source depending on the food source’s probability and then generate a new candidate food source by modifying the chosen food source using Equation (2). The onlooker bee updates the chosen food source with the new candidate food source if the new candidate food source has a better nectar amount than the chosen food source.
ABC carries out the global search using the scout bees to avoid local minima. In ABC, any food source that has not improved after certain cycles is called the abandoned food source. The scout bees replace the abandoned food source with a new random food source calculated by Equation (4). The limit parameter in ABC determines the number of cycles for abandonment
u i j = u j m i n γ . ( u j m a x u j m i n )
where u j m i n and u j m a x are the lower and upper limit of i-th food source in dimension j, respectively, and γ is a random number in the range [0, 1].
The previous processes will be repeated until the termination criterion is met. In ABC, the maximum number of cycles (MCN) is used as a termination criterion.

3.2. Artificial Bee Colony Algorithm for Data Classification

In [10], the ABC-based data classification algorithm (ABCC) presented itself as efficient and robust in carrying out data classification on small balanced datasets. The goal of ABCC is to find the optimal center of each class label using the artificial bee colony algorithm. Then, each sample in a testing dataset is classified by assigning it to the closest centroid (class label) according to Euclidean distance. In their work, the fitness of each solution is evaluated using Equation (5). This fitness function minimizes the sum of Euclidean distance between a data sample ( x j ) and the centroid of the class label that x j belongs to.
F d ( S i ) = 1 D T j = 1 D T d i s t a n c e ( x j , p C L k n o w n ( x j ) )
where D T is the number of training samples, x j is a sample vector in a training dataset. p is a centroid vector of a class label that x j belongs to according to the training dataset.
ABCC starts by distributing a predefined number of solutions randomly in the search space. The i-th solution is represented as follows:
s i = { c l 1 , c l 2 , , c l n } , i = { 1 , 2 , , S N }
where S N is the number of solutions and c l n is a center vector of class label l n in a d-dimensional space.
Then, the solutions are repeatedly updated by the bees as mentioned in Section 3.1.

4. Spark-Based Artificial Bee Colony Algorithm for Large Data Classification

ABCC shows poor performance when applied to an unbalanced binary and massive dataset (Section 3.1). In this paper, we introduce a new fitness function to enhance the performance of ABCC when applied to an unbalanced dataset. In addition, a scalable solution of the ABC-based data classification algorithm using Apache Spark (ABCCS) is proposed to overcome the inefficient performance of ABCC when handling large datasets.

4.1. New Fitness Function

In our work, a new fitness function ( F w ) is proposed to cope with an unbalanced binary dataset. F w aims to minimize the sum of misclassification weights. F w computes the fitness of a solution i as follows:
Step 1:
Each sample in the training dataset is assigned to the closest centroid (class label) according to the Euclidean distance.
Step 2:
Sum the misclassification weight of all misclassified samples.
Formally, i-th solution fitness is computed as follows:
F w ( s i ) = j = 1 D s i z e w ( s a m p l e j )
where D s i z e is the number of samples in the training dataset, w ( s a m p l e j ) is the wight of misclassified s a m p l e j if s a m p l e j is incorrectly classified, or 0 if s a m p l e j is correctly classified.
It should be mentioned here that a misclassification weight for each class label should be determined before starting the training phase.

4.2. Adopting Spark-Based ABC for Big Data Classification

To carry out the classification task on massive data using the ABCC algorithm, two operations of the ABCC, the updating solution and the evaluating fitness, should be adapted. In ABCC, the computational time and required memory space depend on the data size. For example, suppose the training dataset contains 10 million samples with two class labels, and the number of solutions is 30. The ABCC needs to compute 10,000,000 × 2 × 30 = 6 million distance values to classify all samples. Thus, compared to updating the solutions (30 solutions), evaluating the fitness of all solutions required much more memory space and computational time. In our proposed design for ABCC using Apache Spark (ABCCS), the update solution by the bees is performed in the master node while the evaluating fitness of all solutions is performed on the worker nodes as shown in Figure 1.
As we can see in Figure 1, ABCCS starts by distributing a predefined number of solutions randomly in the search space. The i-th solution has an identifier (ID) and is encoded as follows:
s i = { c l 1 , c l 2 , , c l n }
where c l n is a center vector of class label l n in a d-dimensional space.
After initialization, the employed bees modify the current solutions to create new candidate solutions and calculate the fitness of those candidates. The employed bees share the information with the onlooker bees. The onlookers choose the solutions based on their probability. Then, the onlookers modify the chosen solutions, and the fitness of those solutions is calculated. This process is repeated until the maximum number of cycles is reached. The scout bees replace the solutions that have not improved after a predetermined number of cycles. However, conducting the fitness evaluation task takes a lot of memory and computing time when working with massive datasets. Thus, the fitness evaluation of the solutions is executed in a parallel manner using the Apache Spark framework.
In ABCCS, the driver program in the master node is launched and creates a directed acyclic graph (DAG) for the RDD operations. Then, the tasks are sent to the worker nodes along with the solutions(centroids) as a broadcast variable. Figure 2 shows the fitness evaluation process performed on the worker nodes. In this figure, each executor reads a part of the data contained within an RDD. Then, the executor creates <key, value> pairs (RDDpair) based on the RDDs using the MapToPair operation. After that, the FlatMapToPair operation with the broadcast variable(solutions) is carried out on RDDpairs to generate a new <key, value> pairs where the key is Solution_ID and the value is the misclassification weight. Finally, the ReduceByKey operation is triggered to aggregate the values with the same key. The result of the ReduceByKey is <key, value> pairs which are collected and then sent to the master node to update the fitness of the solutions.

5. Dataset and Environment

The purpose of this section is to assess the performance of our proposed fitness function compared to the existing fitness function. We used a real medical dataset called the SEER dataset in our experiments. The main reason for choosing this dataset is that it is a real and highly unbalanced dataset. The SEER dataset was released in April 2018 and collected from various geographic regions by the Surveillance, Epidemiology, and End Results (SEER) program of the National Cancer Institute (NCI) [22]. The SEER dataset contains the cancer incidences for patients. Each sample represents the information of one patient with 72 attributes [22]. This dataset was preprocessed to extract the cancer incidences for only four types of cancers: Breast, Lung, Colon, and Stomach. In addition, we chose only the attributes that were used in past research works [23,24,25]. Depending on the rule of five-year survivability in [23], “Vital Status Recode”, “Cause Of Death”, and “Survival Months” attributes are used to tag each patient (sample) as “Survived” or “Not Survived”. All samples that have a missing value were excluded. In addition, the remaining samples were normalized using Min-Max normalization. Table 1 shows the characteristics of the extracted datasets.
To evaluate the scalability of ABCCS, we decided to duplicate the largest dataset “Breast Cancer” 5, 15, and 30 times. The reason behind duplication is that the size of all datasets in Table 1 is considered too small for analyzing and testing the scalability of ABCCS over a large cluster of worker nodes. Table 2 shows the size of the datasets after duplication.

6. Evaluation Measures

In our experiments, we use Geometric Mean (G-mean) and F 1 -score measures to assess the performance of ABCCS using our proposed fitness function ( F w ) compared to the existing fitness function. The reason for choosing these measures is that all datasets in Table 1 are highly unbalanced datasets where the distribution of samples is skewed among the class labels. Thus, other measures such as accuracy, recall, or error rate do not accurately assess the classifier’s performance. Furthermore, G-mean and F 1 -score measures are highly sensitive to the rate of correctly classified samples of the majority and minority class labels together [26,27,28].
G-mean is an important measure to evaluate the performance of the classifier when applied to an unbalanced dataset [26,27,28], which is calculated as follows:
G - m e a n = s e n s i t i v i t y × s p e c i f i c i t y
s e n s i t i v i t y = T P T P + F N
s p e c i f i c i t y = T N T N + F P
F 1 -Score is another measure for evaluating the classifier’s performance when applied to an unbalanced dataset [26]. It is calculated by taking the harmonic mean of precision and recall as follows:
F 1 - S c o r e = 2 · P r e c i s i o n · R e c a l l P r e c i s i o n + R e c a l l
To measure the scalability and robustness of ABCCS, we use the speedup and scaleup metrics. The speedup metric assesses the parallelization capability of the parallel algorithm by keeping the dataset size constant and increasing the number of worker nodes, which is calculated as follows:
S p e e d u p = T 1 T n
where T 1 is the running time taken by a single node, and T n is the running time taken by n nodes.
The Scaleup metric measures how the parallel algorithm uses the cluster of nodes. In this metric, the dataset size and the number of worker nodes increase with the same ratio. The scaleup is calculated as follows:
S c a l e u p = T 1 s T n s
where T 1 s is the running time using a single node with s as dataset size, and T n s is the running time using n nodes with n × s as a dataset size.

7. Experiments and Results

This section demonstrates the experiments that assess the performance and scalability of ABCCS. In the performance analysis section, we statistically compared the performance of our proposed fitness function and the existing fitness function using the datasets in Table 1 in terms of G-mean and F 1 -Score. The parameters of ABCCS are set as follows:
  • Colony size = 150
  • Maximum Cycles (MCN) = 200
  • Limit = 20
For fitness function F w , the misclassification weight for each class label should be specified before using F w . Table 3 shows the best misclassification weight for each class label that was empirically found in each dataset.
In the scalability analysis section, we evaluate the scalability of ABCCS over a large cluster of nodes and explain the obtained results. It should be mentioned here that the MCN parameter of ABCCS is set to 50 for the scalability experiments.

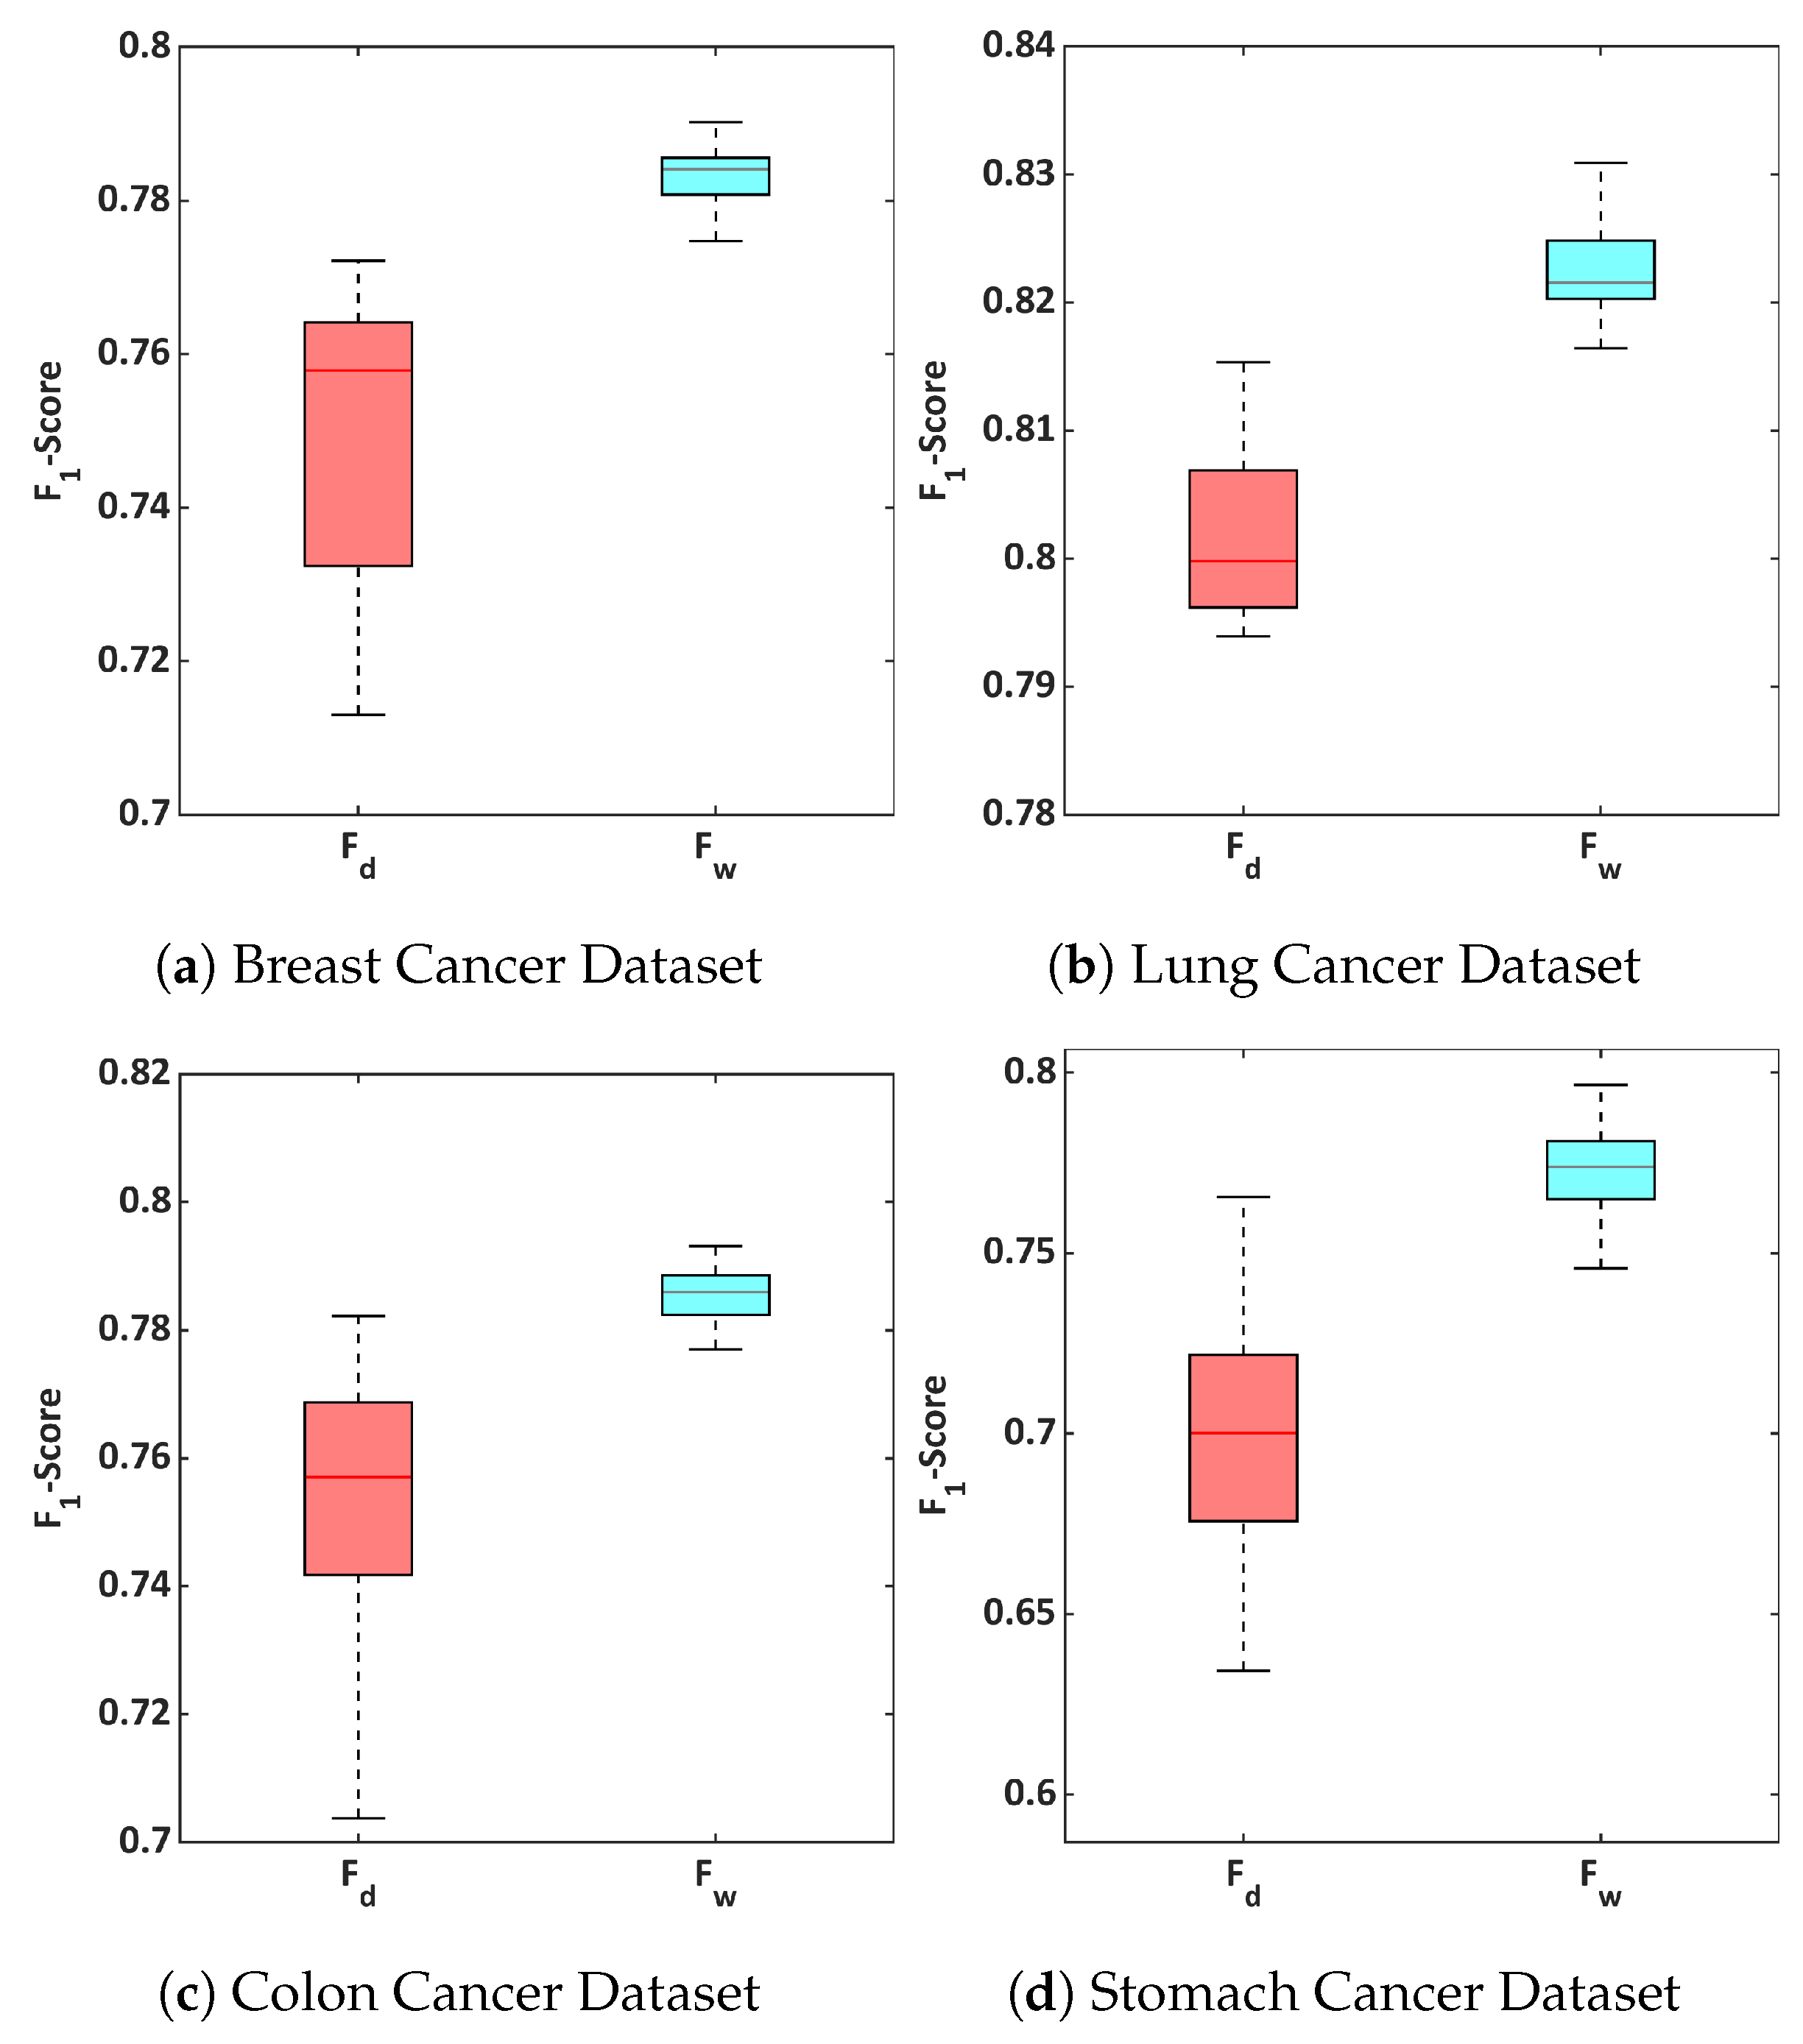
7.1. Performance Analysis of ABCCS

In this experiment, we evaluate the impact of our proposed fitness function ( F w ) on ABCCS’s performance and the classification quality compared to the existing fitness function ( F d ) in terms of G-mean and F 1 -Score. For each fitness function, we ran the ABCCS 30 times (independent runs) on all datasets in Table 1 and reported the G-mean and F 1 -Score results. Table 4 and Table 5 show the G-mean and F 1 -Score results, respectively, that achieved by ABCCS using F w and F d .
From the results in Table 4, the ABCCS using F w achieved the best G-mean on all datasets compared to the ABCCS using F d , where the G-mean results were 77.99%, 81.23%, 77.58%, and 77.58% for Breast Cancer, Lung Cancer, Colon Cancer, and Stomach Cancer datasets, respectively. In terms of F 1 -Score, the ABCCS using F w also achieved the best F 1 -Score on all datasets compared to the ABCCS using F d as shown in Table 5, where the F 1 -Score results were 78.28%, 82.2%, 78.57%, and 77.41% for Breast Cancer, Lung Cancer, Colon Cancer, and Stomach Cancer datasets, respectively.
The obtained results by both fitness functions were statistically compared using the Wilcoxon Signed-Rank test. In this test, the p-value was computed at the 5% significance level. According to the p-value, the performance of ABCCS using F w statistically outperforms the performance of ABCCS using F d where the p-value obtained for all datasets was 0.000012. Figure 3 and Figure 4 show the distribution of the G-mean and F 1 -Score results (30 independent runs) that were achieved by ABCCS using F w and F d .

7.2. Scalability Analysis of ABCCS

We ran this experiment on Amazon Elastic MapReduce (Amazon EMR). In this experiment, we used a cluster of up to 20 nodes (m5.xlarge). Each node has a configuration of a four-core CPU with 3.1 GHz and 16 GB memory.
To measure the speedup of ABCCS, we ran ABCCS using F w on all datasets in Table 2 for up to 20 nodes. In this experiment, the dataset size is kept fixed while the number of worker nodes is increased in each run by multiples of four. Figure 5 shows the running time in seconds and the speedup of ABCCS for 5R, 15R, and 30R datasets. In Figure 5b,d,f, the green dashed line is an optimal speedup (linear).
As can be seen in Figure 5a,c,e, ABCCS using one node takes 2962 s, 9158 s, and 18,984 s for the 5R, 15R, and 30R datasets, respectively, whereas ABCCS using 20 nodes takes 189 s, 508 s, and 1006 s for the 5R, 15R, and 30R datasets, respectively. Thus, we can conclude from these figures that the performance of ABCCS is improved with an increasing number of worker nodes.
To evaluate the parallelization capability of ABCCS, the speedup is computed using Equation (13). Figure 5b,d,f show the speedup results achieved by ABCCS for the 5R, 15R, and 30R datasets. In Figure 5b, ABCCS achieved approximately the optimal speedup for 4 and 8 nodes using the 5R dataset. However, starting from 12 nodes, the speedup values drift apart from the optimal speedup.
As shown in Figure 5d, the speedup results achieved by ABCCS are very close to the optimal speedup for 4, 8, and 12 nodes using the 15R dataset. For 16 and 20 nodes, the speedup results drift a little apart from the optimal speedup.
In Figure 5f, the speedup results achieved by ABCCS are almost the optimal speedup for 4, 8, 12, 16, and 20 nodes using the 30R dataset. Overall, ABCCS achieved significant speedup results as the data size increased. In addition, the running time of ABCCS is linearly decreasing as the number of worker nodes increases.
To measure the Scaleup of ABCCS, we ran ABCCS on the Amazon EMR cluster using the Breast cancer dataset. In each run, the dataset size and number of nodes are doubled, starting from 309,006 records for data size and two nodes. Figure 6 shows the scaleup results obtained by ABCCS. As we can see from this figure, ABCCS achieved outstanding scaleup results ranging between 0.91 and 0.98.

8. Conclusions

In this paper, we address the limitations of the ABCC algorithm when performing classification on massive unbalanced data. We introduced a new fitness function based on the misclassification weight to improve the performance of the ABCC algorithm when applied to highly unbalanced datasets. In addition, we design a scalable ABCCS algorithm using Apache Spark to overcome the inefficient performance of the ABCC algorithm on massive data.
Two experiments were conducted. In the first experiment, we assessed the impact of our proposed fitness function ( F w ) on the performance of ABCCS compared to the existing fitness function ( F d ) using unbalanced binary real datasets. The first experiment results revealed that F w statistically outperforms F d in terms of G-mean and F 1 -Score. In addition, F w improves the ABCCS’s classification quality when applied to unbalanced datasets.
The second experiment was performed over a cluster of worker nodes to evaluate the scalability of the ABCCS algorithm. The experimental results demonstrated that the ABCCS achieved outstanding speedup results with increasing data size. In addition, ABCCS obtained outstanding scaleup results close to the optimal (1.0). Overall, the ABCCS can efficiently perform the classification task on big datasets over a cluster of worker nodes. In addition, ABCCS scales efficiently with increasing the amount of data.
For future work, we will investigate and analyze the scalability of ABCCS when applied to big data sets (terabyte size), as well as perform extensive experiments. Furthermore, we will look into other parallel designs of artificial Bee colony classification algorithms while maintaining the quality level of the classification results.

Author Contributions

All authors have contributed equally to the work. All authors have read and agreed to the published version of the manuscript.

Funding

This research received no external funding.

Data Availability Statement

Not applicable.

Conflicts of Interest

The authors declare no conflict of interest.

References

  1. Sayad, S. Real Time Data Mining; Self-Help Publishers: Newcastle, UK, 2011. [Google Scholar]
  2. Krawczyk, B. Learning from imbalanced data: Open challenges and future directions. Prog. Artif. Intell. 2016, 5, 221–232. [Google Scholar] [CrossRef] [Green Version]
  3. Spark 2.1.0 Documentation. Available online: https://spark.apache.org/docs/2.1.0/ (accessed on 24 December 2021).
  4. Zaharia, M.; Chowdhury, M.; Das, T.; Dave, A.; Ma, J.; McCauly, M.; Franklin, M.J.; Shenker, S.; Stoica, I. Resilient distributed datasets: A fault-tolerant abstraction for in-memory cluster computing. In Proceedings of the 9th USENIX Symposium on Networked Systems Design and Implementation (NSDI 12), San Jose, CA, USA, 25–27 April 2012; pp. 15–28. [Google Scholar]
  5. Apache Hadoop- MapReduce. Available online: https://hadoop.apache.org/docs/r1.2.1/mapred_tutorial.html (accessed on 4 December 2021).
  6. Karau, H.; Konwinski, A.; Wendell, P.; Zaharia, M. Learning Spark: Lightning-Fast Big Data Analysis; OReilly: Newton, MA, USA, 2015. [Google Scholar]
  7. Apache Spark About. Available online: https://databricks.com/spark/about (accessed on 24 December 2021).
  8. Karaboga, D. An Idea Based on Honey Bee Swarm for Numerical Optimization; Technical Report, Technical Report-tr06; Erciyes University, Engineering Faculty, Computer Engineering Department: Kayseri, Turkey, 2005. [Google Scholar]
  9. Karaboga, D.; Gorkemli, B.; Ozturk, C.; Karaboga, N. A comprehensive survey: Artificial bee colony (ABC) algorithm and applications. Artif. Intell. Rev. 2014, 42, 21–57. [Google Scholar] [CrossRef]
  10. Karaboga, D.; Ozturk, C. A novel clustering approach: Artificial Bee Colony (ABC) algorithm. Appl. Soft Comput. 2011, 11, 652–657. [Google Scholar] [CrossRef]
  11. Banharnsakun, A. A MapReduce-based artificial bee colony for large-scale data clustering. Pattern Recognit. Lett. 2017, 93, 78–84. [Google Scholar] [CrossRef]
  12. Wang, Y.; Qian, Q. A Spark-Based Artificial Bee Colony Algorithm for Large-Scale Data Clustering. In Proceedings of the 2018 IEEE 20th International Conference on High Performance Computing and Communications; IEEE 16th International Conference on Smart City; IEEE 4th International Conference on Data Science and Systems (HPCC/SmartCity/DSS), Exeter, UK, 28–30 June 2018; pp. 1213–1218. [Google Scholar] [CrossRef]
  13. Tripathi, A.K.; Sharma, K.; Bala, M. A Novel Clustering Method Using Enhanced Grey Wolf Optimizer and MapReduce. Big Data Res. 2018, 14, 93–100. [Google Scholar] [CrossRef]
  14. Al-Sawwa, J.; Ludwig, S.A. Parallel particle swarm optimization classification algorithm variant implemented with Apache Spark. Concurr. Comput. Pract. Exp. 2020, 32, e5451. [Google Scholar] [CrossRef]
  15. Daoudi, M.; Hamena, S.; Benmounah, Z.; Batouche, M. Parallel diffrential evolution clustering algorithm based on mapreduce. In Proceedings of the 2014 6th International Conference of Soft Computing and Pattern Recognition (SoCPaR), Tunis, Tunisia, 11–14 August 2014; pp. 337–341. [Google Scholar]
  16. Wang, J.; Yuan, D.; Jiang, M. Parallel k-pso based on mapreduce. In Proceedings of the 2012 IEEE 14th International Conference on Communication Technology, Chengdu, China, 9–11 November 2012; pp. 1203–1208. [Google Scholar]
  17. Yang, J.; Li, X. MapReduce based method for big data semantic clustering. In Proceedings of the 2013 IEEE International Conference on Systems, Man, and Cybernetics, Manchester, UK, 13–16 October 2013; pp. 2814–2819. [Google Scholar]
  18. Aljarah, I.; Ludwig, S.A. Parallel particle swarm optimization clustering algorithm based on mapreduce methodology. In Proceedings of the 2012 fourth world congress on Nature and biologically inspired computing (NaBIC), Mexico City, Mexico, 5–9 November 2012; pp. 104–111. [Google Scholar]
  19. Ashish, T.; Kapil, S.; Manju, B. Parallel bat algorithm-based clustering using mapreduce. In Networking Communication and Data Knowledge Engineering; Springer: Singapore, 2018; pp. 73–82. [Google Scholar]
  20. Al-Madi, N.; Aljarah, I.; Ludwig, S.A. Parallel glowworm swarm optimization clustering algorithm based on MapReduce. In Proceedings of the 2014 IEEE Symposium on Swarm Intelligence, Orlando, FL, USA, 9–12 November 2014; pp. 1–8. [Google Scholar]
  21. Shanthi, S.; Lakshmi, K. MapReduce-Based Crow Search-Adopted Partitional Clustering Algorithms for Handling Large-Scale Data. Int. J. Cogn. Inform. Nat. Intell. (IJCINI) 2021, 15, 1–23. [Google Scholar]
  22. Surveillance, Epidemiology, and End Results (SEER) Program Research Data (1973–2015), National Cancer Institute, DCCPS, Surveillance Research Program, Released April 2018. Available online: www.seer.cancer.gov (accessed on 24 December 2021).
  23. Pour, E.S.H. Stage-Specific Predictive Models for Cancer Survivability. Ph.D. Thesis, The University of Wisconsin-Milwaukee, Milwaukee, WI, USA, 2016. [Google Scholar]
  24. Agrawal, A.; Misra, S.; Narayanan, R.; Polepeddi, L.; Choudhary, A. Lung cancer survival prediction using ensemble data mining on SEER data. Sci. Program. 2012, 20, 29–42. [Google Scholar] [CrossRef] [Green Version]
  25. Delen, D.; Walker, G.; Kadam, A. Predicting breast cancer survivability: A comparison of three data mining methods. Artif. Intell. Med. 2005, 34, 113–127. [Google Scholar] [CrossRef] [PubMed]
  26. Tharwat, A. Classification assessment methods. Appl. Comput. Inform. 2018, 17, 168–192. [Google Scholar] [CrossRef]
  27. Al-Sawwa, J.; Ludwig, S.A. A Cost-Sensitive Centroid-based Differential Evolution Classification Algorithm applied to Cancer Data Sets. In Proceedings of the 2019 IEEE Symposium Series on Computational Intelligence (SSCI), Xiamen, China, 6–9 December 2019; pp. 2514–2521. [Google Scholar] [CrossRef]
  28. Puri, A.; Gupta, M.K. Comparative Analysis of Resampling Techniques under Noisy Imbalanced Datasets. In Proceedings of the 2019 International Conference on Issues and Challenges in Intelligent Computing Techniques (ICICT), Ghaziabad, India, 27–28 September 2019; Volume 1, pp. 1–5. [Google Scholar] [CrossRef]
Figure 1. Adopting Spark-based ABCC for big data classification.
Information 13 00530 g001
Figure 2. The fitness evaluation stage.
Information 13 00530 g002
Figure 3. Box plots of the G-mean results obtained by F d and F w for Breast, Lung, Colon, and Stomach Cancer datasets. The red bar inside the box represents the median; the upper whisker represents the maximum value; the lower whisker represents the minimum value.
Information 13 00530 g003
Figure 4. Box plots of the F 1 -Score results obtained by F d and F w for Breast, Lung, Colon, and Stomach Cancer datasets. The red bar inside the box represents the median; the upper whisker represents the maximum value; the lower whisker represents the minimum value.
Information 13 00530 g004
Figure 5. The running time and Speedup results achieved by ABCCS for 5R, 10R, and 30R Datasets.
Information 13 00530 g005
Figure 6. Scaleup of ABCCS; the dashed black line is an optimal scaleup.
Information 13 00530 g006
Table 1. Characteristics of the extracted datasets.
DatasetClass LabelNumber of AttributesTotal
SurviveNot Survive
Breast Cancer280,592 (90.80%)28,414 (9.20%)15309,006
Lung Cancer24,513 (26.49%)68,041 (73,51%)1792,554
Colon Cancer56,263 (63.14%)32,840 (36.86%)1789,103
Stomach Cancer4177 (36.25%)7345 (63.75%)1611,522
Table 2. Characteristics of the duplicated datasets.
Dataset NameDuplication RateSize
5R Dataset5 times1,545,030
15R Dataset15 times4,635,090
30R Dataset30 times9,270,180
Table 3. The misclassification weight.
Class Label
SurvivedNot Survived
Breast Cancer1.010.0
Lung Cancer2.71.0
Colon Cancer1.01.8
Stomach Cancer1.81.0
Table 4. G-mean results obtained by F d and F w .
F d F w
BreastAverage68.99 %77.99%
Standard Deviation[±0.0313][±0.003]
LungAverage79.04%81.23%
Standard Deviation[±0.004][±0.0025]
ColonAverage69.76%77.58%
Standard Deviation[±0.0385][±0.0042]
StomachAverage68.90%77.33%
Standard Deviation[±0.0272][±0.0112]
Average71.67%78.53%
Table 5. F 1 -Score results obtained by F d and F w .
F d F w
BreastAverage75.11%78.28%
Standard Deviation[±0.0178][±0.0044]
LungAverage80.15%82.2%
Standard Deviation[±0.0065][±0.0042 ]
ColonAverage74.6%78.57%
Standard Deviation[±0.0437][±0.0044]
StomachAverage69.36%77.41%
Standard Deviation[±0.0393][±0.0127]
Average74.81%79.12%
Publisher’s Note: MDPI stays neutral with regard to jurisdictional claims in published maps and institutional affiliations.

