Article

Comparing Worldwide, National, and Independent Notifications about Adverse Drug Reactions Due to COVID-19 Vaccines

by
Francesco Branda
1,† and
Davide Tosi
2,*,†
1
Department of Computer Science, Modeling, Electronics and Systems Engineering (DIMES), University of Calabria, 87036 Rende, Italy
2
Department of Theoretical and Applied Sciences (DiSTA), University of Insubria, 21100 Varese, Italy
*
Author to whom correspondence should be addressed.
These authors contributed equally to this work.
Information 2022, 13(7), 329; https://doi.org/10.3390/info13070329
Submission received: 7 June 2022 / Revised: 28 June 2022 / Accepted: 5 July 2022 / Published: 8 July 2022
(This article belongs to the Special Issue Advanced Information Technology, Big Data and Artificial Intelligence)

Abstract

:
The rapid development of effective vaccines against COVID-19 is an extraordinary achievement. However, no medical product can ever be considered risk-free. Several countries have a pharmacovigilance system that detects, assesses, understands, and prevents possible adverse effects of a drug. To benefit from such huge data sources, specialists and researchers need advanced big data analysis tools able to extract value and find valuable insights. This paper defines a general framework for a pharmaceutical data analysis application that provides a predefined (but extensible) set of functions for each data processing step (i.e., data collection, filtering, enriching, analysis, and visualization). As a case study, we present here an analysis of the potential side effects observed following the administration of the COVID-19 vaccines. The experimental evaluation shows that: (i) most adverse events can be classified as non-serious and concern muscle/joint pain, chills and nausea, headache, and fatigue; (ii) the notification rate is higher in the age group 20–39 years and decreases in older age groups and in very young people.

1. Introduction

In recent years, the ability to produce data has increased exponentially. Such data, commonly referred to as big data, contain valuable information about users’ activities, interests, and behaviors, making it inherently suitable for an extensive range of applications [1]. For example, in bioinformatics applications [2], big data analytics provides appropriate techniques for storing, organizing, understanding, and interpreting the exponential amount of biological data that aims at solving problems in medicine and biology (e.g., fast analysis of massive DNA, RNA, and protein sequence data, fast querying on incremental and heterogeneous disease networks, and detection of complexes over growing protein–protein interaction data [3]).
Moving from science to society, social data and e-health are good examples to discuss. Social networks such as Facebook and Twitter have become very popular and are receiving increasing attention from the research community, since every day millions of people produce a huge amount of digital data that can be effectively exploited to extract insights concerning human dynamics and behaviors [4]. For example, social media users moving through a sequence of locations in a city or region can create a huge amount of georeferenced data that includes extensive knowledge of human dynamics and mobility behaviors [5,6]. In addition, an ever-increasing volume of urban-related data, with spatial and temporal attributes, poses several challenges related to city management and services, from weather and air quality to public transport to reduce emissions, traffic congestion, and energy costs [7,8].
The same occurs in the e-health domain, where big data analytics tools and systems can be used to help medical experts and epidemiologists design accurate and generalized models for predicting the different evolutionary stages of COVID-19 [9,10,11] or to support professionals and scientists in applying the natural language processing models able to detect and fight the COVID-19 infodemic on social media [12]. In particular, the pandemic demonstrated how important real-world (RWD) data are for informing health policy decisions and improving clinical trials. However, it is hard for many users to exploit such RWD, mainly due to the programming skills needed for implementing the appropriate data analysis methods.
This paper defines a general framework for a pharmaceutical data analysis application to automatically monitor increases in known adverse events and discover possible reporting clusters (e.g., suspected temporally localized or product-specific adverse event reporting).
Results of large-scale data analysis show that: (1) most of the adverse events are labeled as non-serious and concern muscle/joint pain, chills and nausea, headache, and fatigue; (2) the notification rate is higher in the age group 20–39 years and decreases in older age groups and in very young people; and (3) the distributions of such reports concern women more than men.
The rest of the paper is organized as follows. Section 2 discusses related work. Section 3 introduces the main concepts. Section 4 describes the proposed methodology. Section 5 presents the experimental evaluation of the methodology. Finally, Section 6 concludes the paper and discusses plans for future research.

2. Related Work

In this section we briefly review some of the most closely related research on the safety of the COVID-19 vaccines, discussing differences and similarities with the methodology we designed.
Singh Amninder et al. [13] used VAERS data from 1 January 2021 to 30 April 2021 to analyze the adverse effects of the three COVID-19 vaccines authorized in the United States (US), i.e., Pfizer/BioNTech, Moderna, and Janssen. With respect to our work, this is less general, as it is specialized, providing information on the effects of vaccines in the United States only, over a limited period of time.
Beatty et al. [14] evaluated factors potentially associated with participant-reported adverse effects after COVID-19 vaccination. The aim of the work is different from ours, since we propose a methodology that can be applied to big dataset of pharmaceutical data for detecting unusual or unexpected patterns of adverse events and identifying potential patient risk factors for particular types of vaccine.
In [15], Boekel et al. described the results of a questionnaire that assessed adverse events following COVID-19 vaccinations in patients with autoimmune diseases and healthy controls. The results suggest that vaccination with COVID-19 does not seem to trigger relapses of autoimmune diseases. Fu et al. [16] evaluated the safety, immunogenicity, and effectiveness of COVID-19 vaccines in pregnancy and lactation. The study showed that the COVID-19 vaccination in pregnant and lactating subjects is immunogenic, causes no significant vaccine-related adverse events or obstetrical and neonatal outcomes, and is effective in preventing COVID-19 disease. These types of data can be integrated into the methodology we have designed.
Lian et al. [17] implemented a machine-learning-based pipeline to identify tweets containing personal experiences with COVID-19 vaccinations in the US, showing that pain to the touch, fatigue, and headache were the three most commonly reported adverse effects. In our case, the adverse events data are already available, so it is not required to find them; however, the  method proposed in [17] cover only the step data analysis of our methodology and may be considered as alternative technique to detect possible safety problems in licensed vaccines.
The main novel contributions of our approach with respect to the other studies can be outlined as follows. We propose a new methodology aimed at extracting useful knowledge from a big dataset of pharmaceutical data to: (i) collect consolidated information in order to have sufficient data to ensure robustness in analysis, comparison, and evaluation; (ii) detect potential severity in observed adverse events; and (iii) identify unusual or unexpected patterns of adverse event reporting that might indicate a possible vaccine safety problem.

3. Background

Before discussing the proposed method, we provide an overview of the fundamental vaccine safety concepts, from detecting and managing signals of possible side effects to assessing causality between adverse events and vaccine administration.

3.1. Guide to Data Reading

Monitoring the safety of vaccines is a complex ongoing process. Comprehensive safety data are required to ensure that the benefits of a vaccination campaign outweigh the risks and reduce these to a minimum, allowing policymakers to make informed decisions about implementing a large-scale program among healthy citizens and ensuring that people are confident enough to accept vaccination. For the sake of clarity and for the reader’s convenience, it is important to clarify the meaning of some terms that are used throughout the paper:
  • An adverse event is any adverse episode that may appear after the administration of a vaccine, but which does not necessarily have a causal relationship with the vaccine;
  • An adverse reaction is a response to a vaccine that is noxious and unintended. In order to distinguish between adverse events and adverse reactions, we must study potential causalities related to the vaccine;
  • An undesirable effect is an unintended effect related to the properties of a vaccine, observed in a number of people, that is not necessarily harmful.

3.2. Signal Detection and Management

A safety signal is a notification about a new/known adverse event that can be related to a drug and requires further analysis. Several countries have a pharmacovigilance system that detects, assesses, understands, and prevents adverse effects or any other drug-related problems. For example, the Centers for Disease Control and Prevention (CDC) and the Food and Drug Administration (FDA) conduct post-licensure safety monitoring of US-licensed vaccines, the Medicines and Healthcare products Regulatory Agency (MHRA) verifies that medicines and medical devices work and are acceptably safe in the United Kingdom, and the Italian Medicines Agency (AIFA) controls the regulatory activity for pharmaceuticals in Italy.
In general, surveillance systems are based on two main approaches: passive surveillance and active surveillance. The first approach occurs when laboratories, physicians, or other healthcare providers regularly report cases or diseases to the local health department. Passive systems are most widely used to collect adverse events following immunization (AEFI) (an AEFI is any adverse medical event that follows immunization and is not necessarily causally related to vaccine use [18]. The adverse event may be any unfavorable or unintended sign, abnormal laboratory finding, symptom, or disease), and the system depends on receiving reports of adverse events, so data quality and completeness are difficult to ensure. An example of a passive surveillance system is the Vaccine Adverse Events Reporting System (VAERS) [19], which relies on information about unusual or unexpected events after vaccination from those who choose to voluntarily report their experience. The second approach provides accurate and timely information, since designated staff visit healthcare facilities, communicate with healthcare providers, and detect possible cases of adverse events of particular interest (AESI) (an AESI is a pre-specified medically significant event that can be causally associated with a vaccine product and must be carefully monitored and confirmed by further special studies. For example, AESIs associated with the administration of COVID-19 vaccines [20] cover all body systems, including immunological, cardiovascular, neurological, musculoskeletal, and dermatological manifestations) and review patient records; however, this is more resource and time-consuming than passive surveillance. An example of an active surveillance system is the Therapeutic Goods Administration system (TGA) [21], which exploits SMS messaging to directly ask people if they have experienced potential side effects.

3.3. Causality Assessment

It is very challenging to study the interactions between the vaccine, natural disease, and adverse reactions. Possible side effects differ with age, but if a high-incidence adverse reaction occurs shortly after introducing a vaccine, the temporal association can be easily misinterpreted as causal. To recognize whether an adverse reaction may be related to the administration of a vaccine, the WHO has developed an algorithm that considers: (i) the temporal connection between the administration and the notified reaction; (ii) previously reported evidence; (iii) the frequency of the event notification in the general population, vaccinated or unvaccinated; and (iv) plausibility from a biological point of view.
On the basis of all these factors, the evaluation process can output four potential suggestions:
  • Related to the event, i.e., the causal connection between the event and vaccine is considered possible;
  • Unrelated to the event, i.e., other elements and factors can explain the adverse reaction;
  • Indeterminate, i.e., the temporal association is valid, but the collected data are not enough to confirm causality;
  • Unclassifiable, i.e., all reports that lack sufficient information and for which further investigation is required.
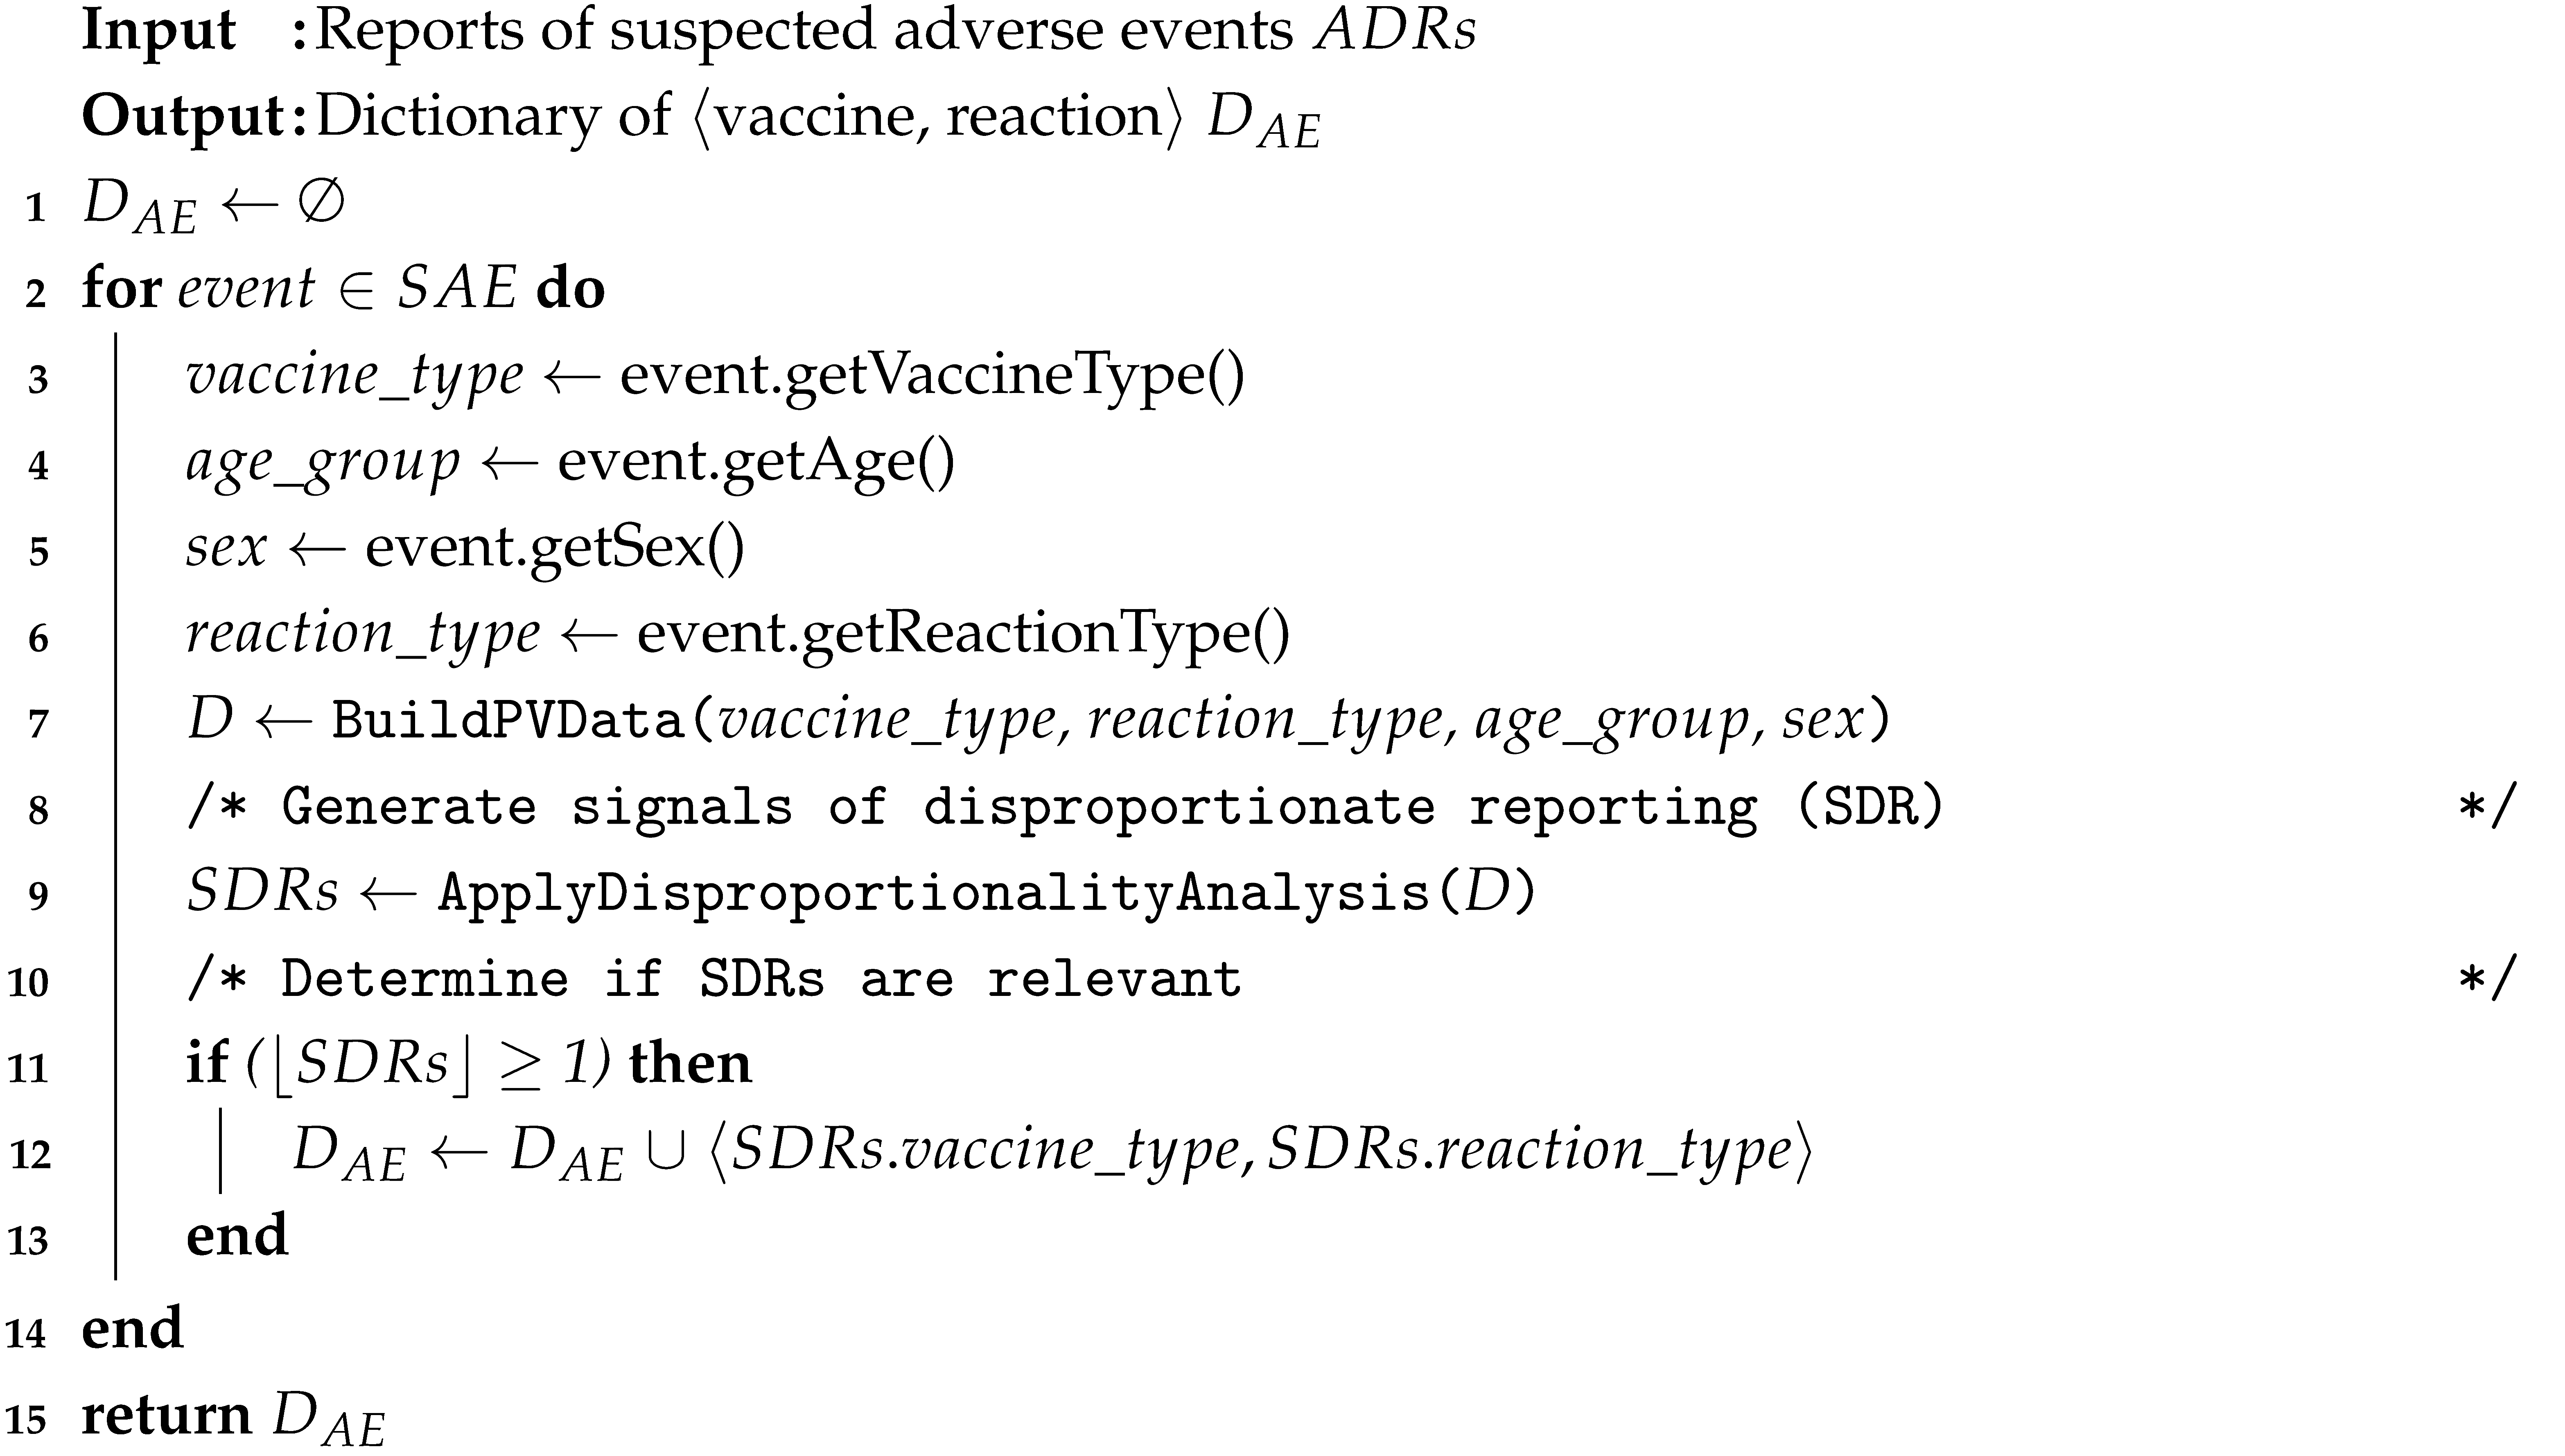
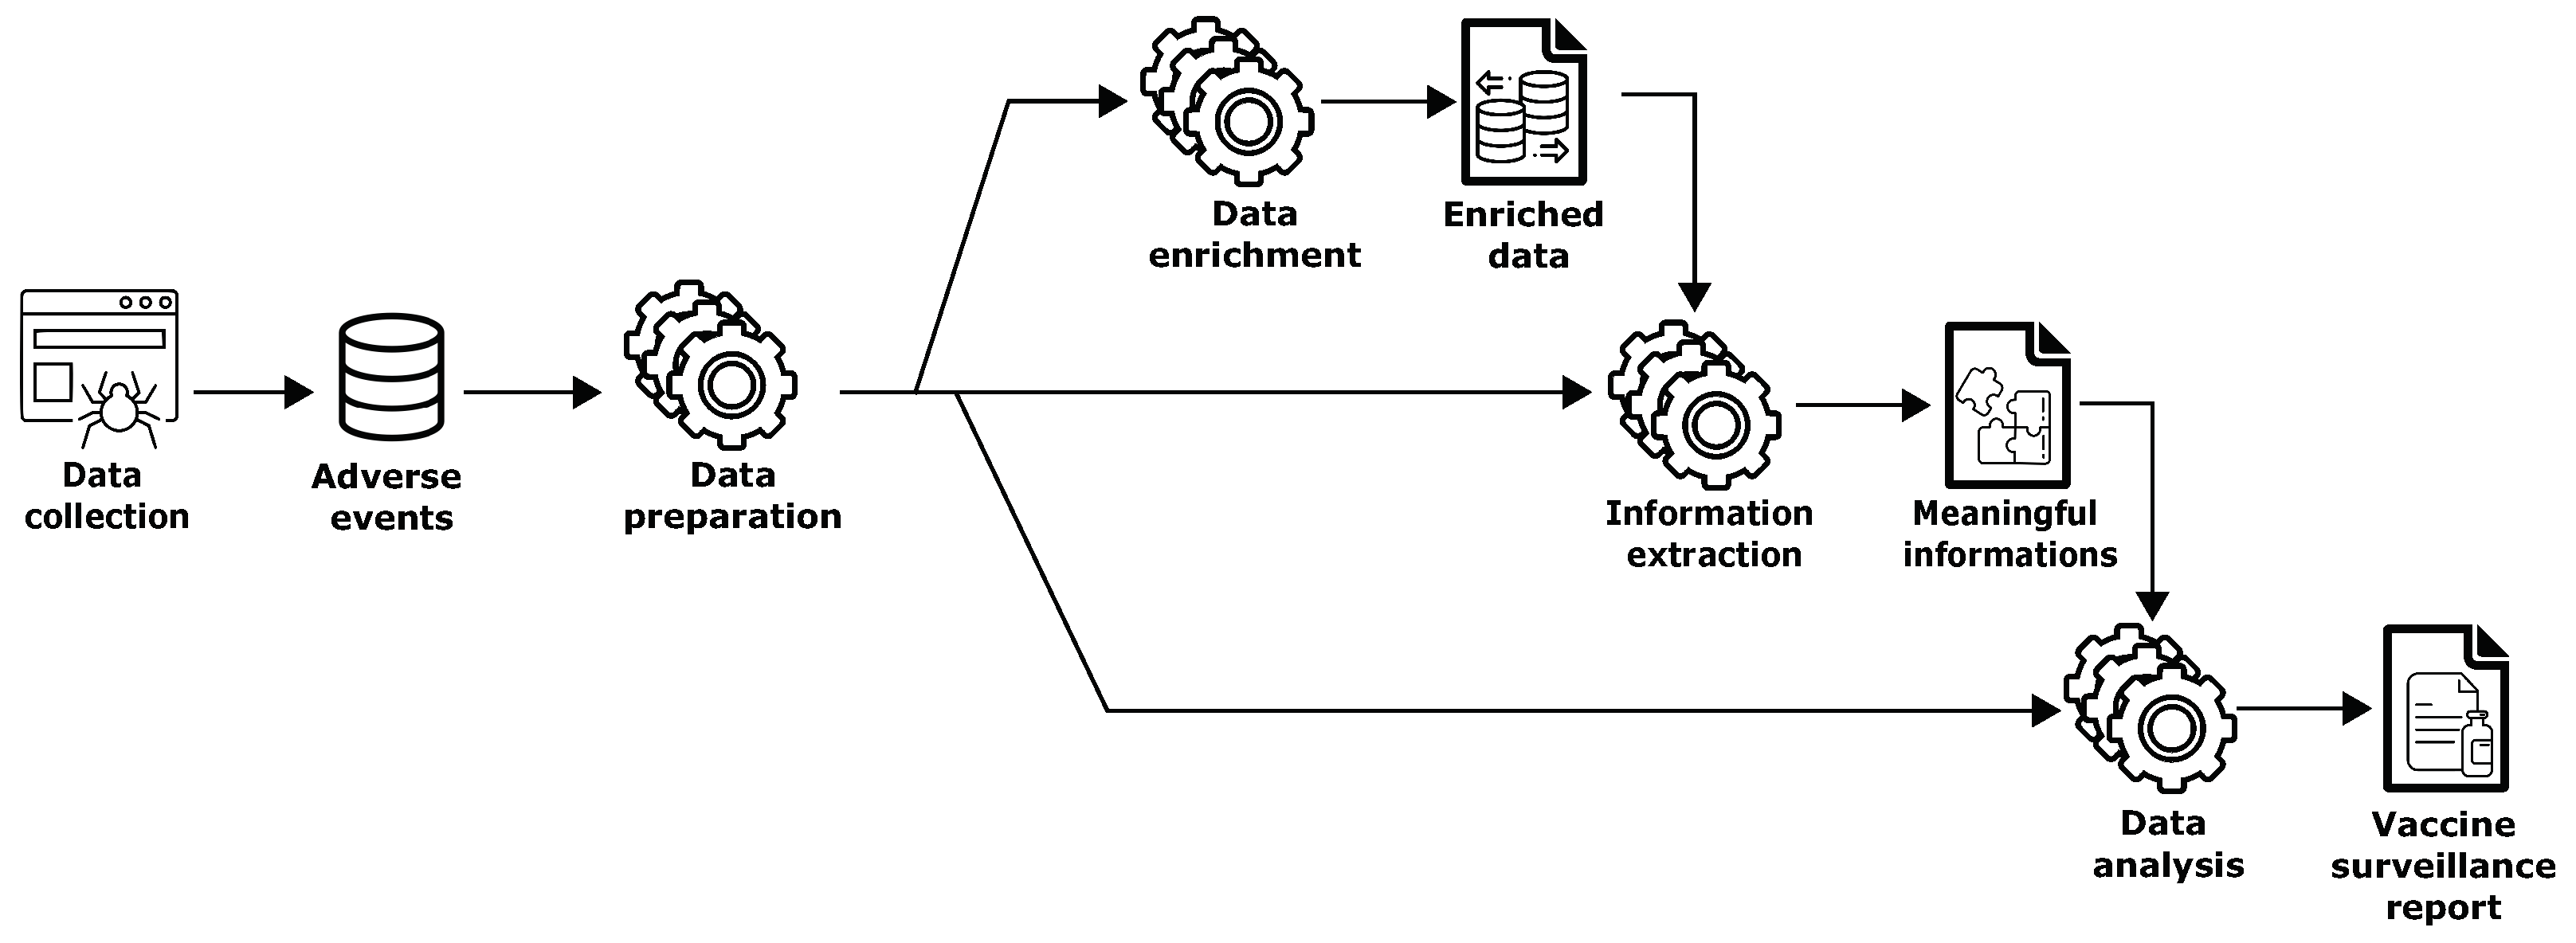
4. Methodology

This paper presents the design and implementation of a methodology to automatically process and analyze data gathered from a pharmacovigilance system (see Figure 1). The first step consists of collecting adverse events to be processed. In the second step, the data are cleaned, selected, and transformed to make them suitable for analysis. Specifically, in this step, the following operations are performed: data enrichment combines data from multiple pharmacovigilance systems into a single, consistent database; information extraction involves the aggregation, filtering, cleaning, de-duplication, and validation of the data; and data analysis examines the transformed data to detect new, unusual, or rare vaccine adverse events, and to address possible reporting clusters (e.g., suspected or product-/batch-/lot-specific adverse event reporting).
Algorithm 1 shows the pseudocode for classifying a suspected adverse event. The algorithm receives as input the reports of suspected adverse events, A D R s , and returns a collection D A E of adverse reactions that have been classified as potential drug–event associations for further evaluation. The algorithm analyzes each e v e n t (lines 2–13) by performing the following operations:
  • Retrieving the information about v a c c i n e _ t y p e (i.e., typology of medical product such as Comirnaty, Spikevax, etc.), a g e _ g r o u p (i.e., the patient’s age), s e x (i.e., the patient’s sex), and  r e a c t i o n _ t y p e (i.e., the information about the suspected ADRs/ e v e n t ) (lines 3–6).
  • Creating a pharmacovigilance dataset to make it suitable for analysis (line 7).
  • Generating the statistical associations between medicinal products and adverse events, i.e., drug–event pairs, using disproportionality analysis methods (line 9). More details are given in Section 5.3.
  • If the lower bound of the 95% confidence interval of signals of disproportionate reporting (SDRs) generated at the previous step is greater than or equal to one, the adverse reactions require further evaluation (lines 11–12).
Algorithm 1 Adverse events reports processing
Information 13 00329 i001

5. Experimental Results

We carried out an extensive experimental evaluation using four real-world datasets: (i) VigiBase [22], containing more than 5 million reports collected from 27 December 2020 to 20 November 2021; (ii) EudraVigilance [23], containing about 3 million suspected adverse reactions collected from 27 December 2020 to 27 November 2021; (iii) more than 100,000 reports from the pharmacovigilance activities carried out by AIFA [24], collected from 27 December 2020 to 26 September 2021; and (iv) about 2000 spontaneous reports, collected by our independent platform [25], from 1 October 2021 to 20 November 2021.
In particular, VigiBase and EudraVigilance were used to explore potential side effects reported globally and filtered by COVID-19 vaccine type, respectively, whereas the pharmacovigilance activities carried out by AIFA and spontaneous reports collected by our independent platform were instead exploited to monitor the safety of COVID-19 vaccines authorized in Italy. For each vaccine, the goal of our analysis was to detect the health outcomes for the most frequently reported adverse events and discover possible reporting clusters (e.g., reporting of suspected adverse events by age, sex, etc.). Note that the data processed and described in the following sub-sections are evolving over time, since they belong to a dynamic process.

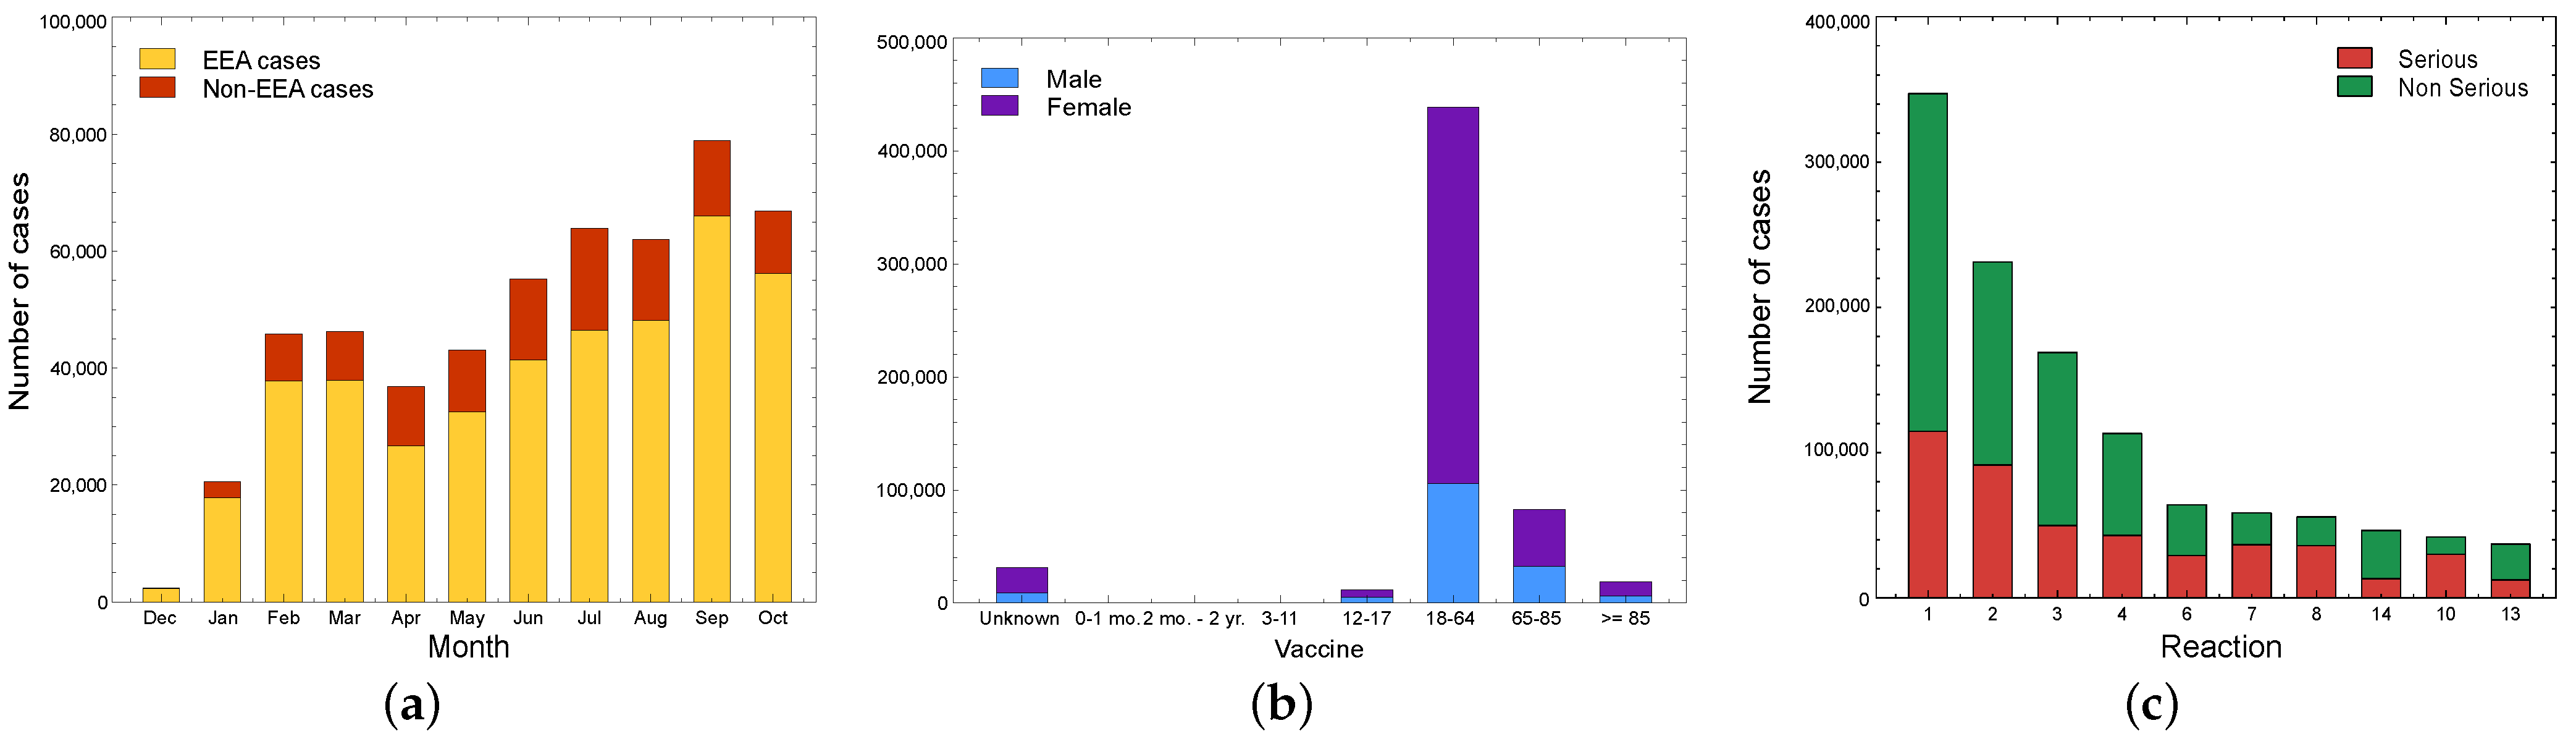
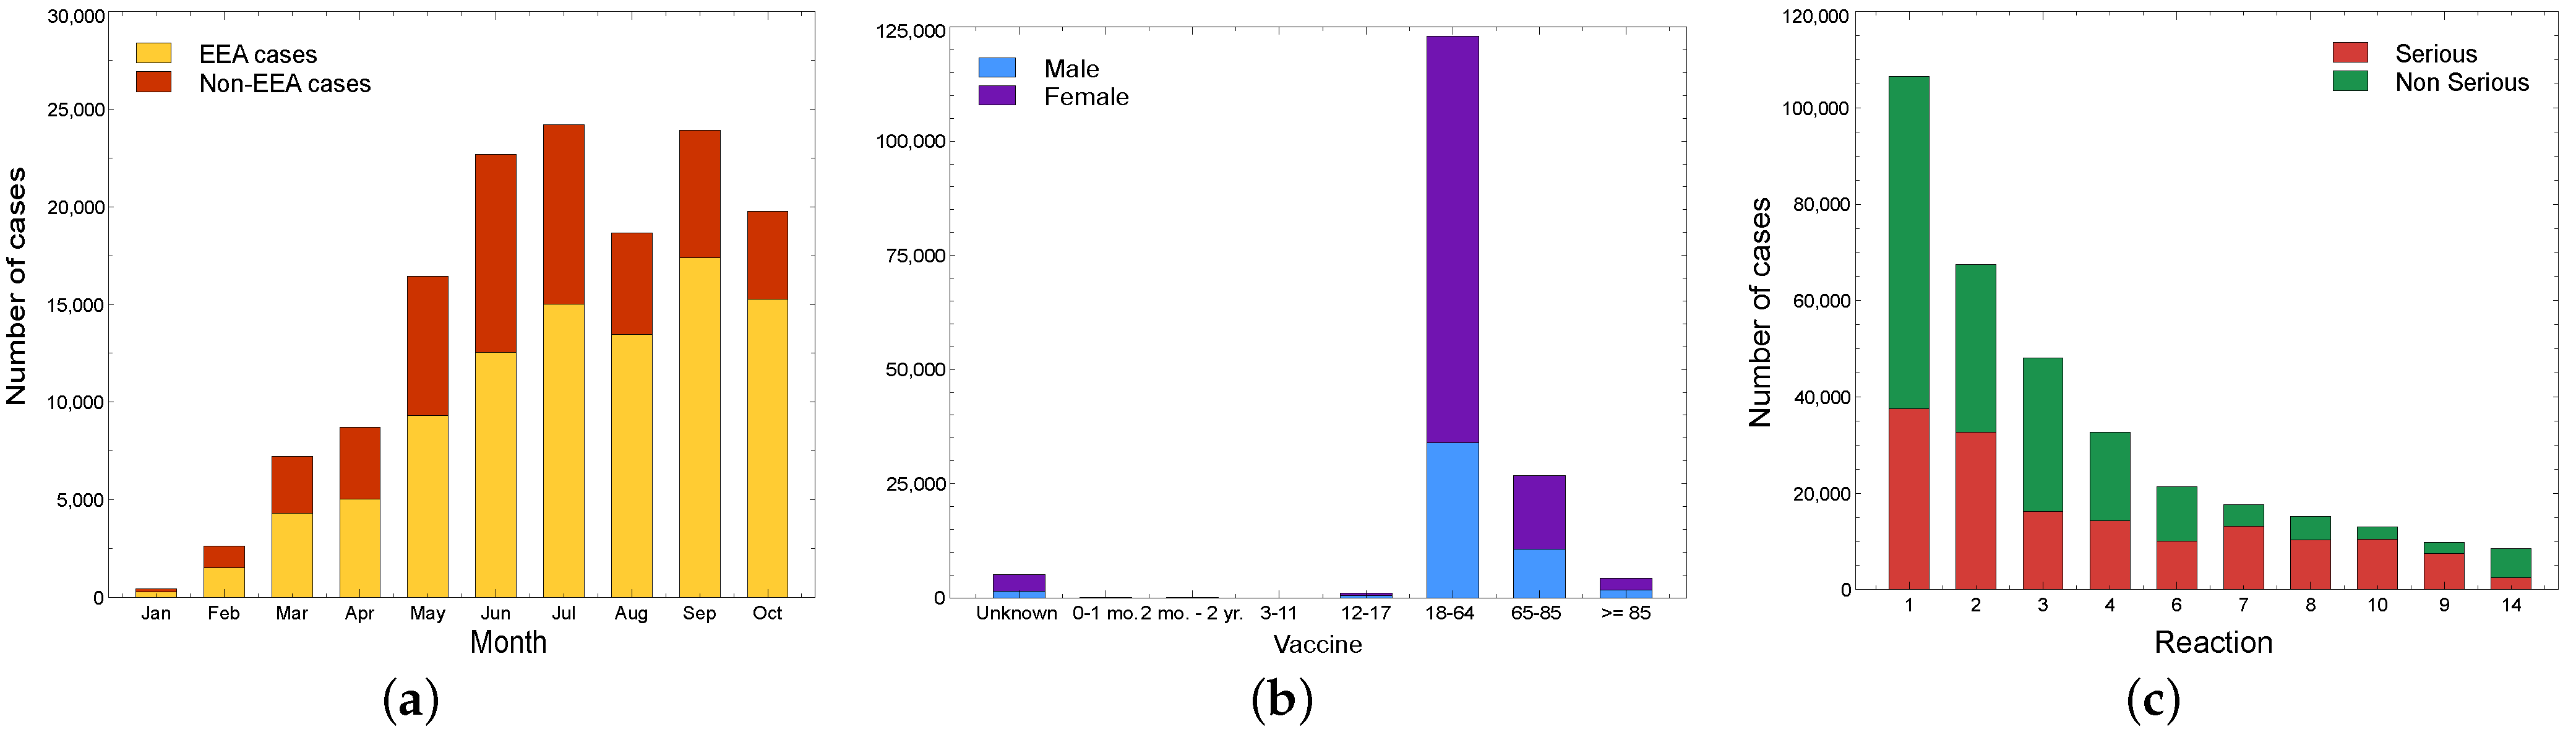
5.1. Pharmacovigilance: Global Overview

This section presents the main results of our analysis carried out on the VigiBase and EudraVigilance databases. In particular, VigiBase is explored to describe globally reported potential side effects, whereas EudraVigilance is used to analyze the reports filtered by the type of COVID-19 vaccine.

5.1.1. VigiBase

Globally, 5,451,004 potential side effects were collected from 27 December 2020 to 20 November 2021, using the VigiAccess website [22], a public, online tool providing a summarized view of VigiBase. Table 1 reports the total number of cases reported for all COVID-19 vaccines according to the System Organ Class (SOC) hierarchy (i.e., the highest level of the Medical Dictionary for Regulatory Activities (MedDRA) [26]), which groups events by cause (e.g., infections and infestations), location (e.g., gastrointestinal disorders), and purpose (e.g., medical and surgical procedures).
Looking at the values in the table, we can observe that 25% of reported suspected adverse events fall within general disorders and administration site conditions (especially pyrexia (17%), fatigue (15%), and chills (11%)), followed by 18% nervous system disorders (mainly headache (45%) and dizziness (14%)), 12% musculoskeletal and connective tissue disorders (mostly myalgia (34%), arthralgia (23%), and pain in extremities (18%)), and gastrointestinal disorders (generally nausea (42%) and vomiting and diarrhoea (13%)).
In the following sub-sections, we describe the adverse events collected from 27 December 2020 to 27 November 2021 by type of vaccine, using the EudraVigilance web application (EVWEB) [27], i.e., the public interface for accessing information in the EudraVigilance database.

5.1.2. Comirnaty (Pfizer/BioNTech)

In total, 1,363,522 suspected adverse events following vaccination with Comirnaty were collected, of which 776,796 were notified as non-serious (57%) and 586,726 as serious (43%). Figure 2a shows the number of suspected adverse events identified in EudraVigilance received over the last 12 months, regardless of the administered dose (1st or 2nd dose). The histogram shows that the reports vary significantly between different periods of the year. In particular, the number of reports is highest in September (about 78,883, of which 66,027 are from countries of the European Economic Area (EEA) and 12,856 from countries of the Non-European Economic Area (Non-EEA)).
The number of cases is higher in the age groups between 18 and 64 years (about 75%), and 72% of reports concern women and 27% men (sex is not reported in 1% of the reports, Figure 2b). Most notifications are classified as non-serious (about 61%) and fall within general disorders and administration site conditions (25%), followed by nervous system disorders (17%), musculoskeletal and connective tissue disorders (12%) and gastrointestinal disorders (8%), as described in Figure 2c, which shows the ten main adverse events, each represented by a unique identifier (see Table 1) and divided by seriousness (an event is considered serious if it resulted in hospitalization, death, or other clinically significant conditions. In addition, some adverse events are labeled as serious if recognized by international health authorities, regardless of the clinical consequences. Based on these considerations, a fever of ≥38 °C that requires the administration of a medicine can also be considered serious).
Table 2 summarizes the outcome of reports presented in Figure 2c. About 37% of these events were reported as “Recovered/Resolved” (i.e., the person has improved or recuperated), 25% as “Not recovered/Not resolved” (i.e., the person has not improved or recuperated), 20% as “Recovering/Resolving” (i.e., the person is improving but has not yet fully recovered), and 16% as “Unknown” (i.e., the outcome was not known, not observed, or not recorded). Only 1% of the cases were “Fatal” events or events where the subject recuperated but retained pathological conditions resulting from the prior disease or injury (i.e., the event is included as “Recovered/Resolved with sequelae”).

5.1.3. Spikevax (Moderna)

The total number of collected adverse events following vaccination with Spikevax is 398,352, of which 204,083 were reported as non-serious (51%) and 194,269 as serious (49%). The number of reports increases in size and becomes more evident from June (about 24,215, of which 15,023 were from EEA member states and 9192 from Non-EEA member states), as shown in Figure 3a. About 69% of the notifications refer to women and 30% to men (sex was not reported in 1% of cases), and the notification rate is highest in the age groups 18–64 years (about 77% of cases, Figure 3b).
As shown in Figure 3c, for the Spikevax vaccine, the most frequently reported suspected adverse events are non-serious (about 54%) and fall within general disorders and administration site conditions (27%), followed by nervous system disorders (17%), musculoskeletal and connective tissue disorders (12%), and gastrointestinal disorders (8%). A total of 36% of these events were included as “Recovered/Resolved”, 27% as “Not recovered/Not resolved”, 18% as “Recovering/Resolving”, and 16% as “Unknown”. The adverse reactions were “Fatal” in 2% of cases, whereas 1% were entered as “Recovered/Resolved with sequelae” (see Table 3).

5.1.4. Vaxzevria (AstraZeneca)

Overall, 1,083,116 reports related to the Vaxzevria vaccine were collected, of which 562,208 were classified as serious (52%) and 520,718 classified as non-serious (48%). Figure 4a shows a clear decreasing trend in reporting suspected adverse events. In particular, the number of reports is highest in March, with 110,136 total reports, of which 36,394 are from EEA member states and 73,742 are from Non-EEA member states.
The age group reporting the highest number of suspected adverse events was 18–64 years, with 78% of cases, followed by 65–85 years with 14% of cases. Looking at reports by sex, 71% involve women, 27% men, and in 2% of cases the sex is not specified (see Figure 4b).
The most notified suspected adverse events refer to general disorders and administration site conditions (26%), followed by nervous system disorders (21%), and musculoskeletal and connective tissue disorders (15%). However, unlike the other vaccines, about 51% of these events were found to be serious and 49% non-serious, as described by the pharmacovigilance results in Figure 4c.
As summarized in Table 4, approximately 38% of these events were entered as “Recovered/Resolved”, 22% as “Not recovered/Not resolved”, 21% as “Recovering/Resolving”, and 14% as “Unknown”. In 4% of cases, the reports were “Fatal”, and in 1% they were entered as “Recovered/Resolved with sequelae”.

5.1.5. Janssen (Janssen-Cilag)

The total number of reports collected after administration of the Janssen vaccine was 103,925, of which 65,741 were non-serious and 38,184 serious. Figure 5a shows an increasing trend over time in the number of notifications, with a peak in the month of June (with 7076 reports, of which 6259 are from EEA countries and 817 from Non-EEA countries).
The notification rate is highest in the age group 18–64 years (about 84% of cases) and decreases in older age groups and the very young. In addition, 58% of reports involve women, 41% men, and in 1% of cases, sex is not specified (see Figure 5b).
Most of the notifications refer to the general disorders and administration site conditions category (26%), followed by nervous system disorders (20%), musculoskeletal and connective tissue disorders (15%), and gastrointestinal disorders (8%). In 66% of cases, reports were entered as non-serious and in 34% as serious (see Figure 5c). The outcomes of these events are reported in Table 5 as follows: 33% “Recovered/Resolved”, 29% “Not recovered/Not resolved”, 21% “Recovering/Resolving”, 15% “Unknown”, and 1% “Fatal”.

5.2. Pharmacovigilance: Italy Overview

This section presents the analysis performed on the AIFA reports on the surveillance of vaccines and the spontaneous reports collected by our independent platform, which was designed to provide timely and understandable information on the COVID-19 pandemic in Italy.

5.2.1. AIFA

To monitor the safety of COVID-19 vaccines authorized in Italy, we manually extracted the most relevant data on COVID-19 pharmacovigilance activities from the official reports of AIFA [28], from 27 December 2020 to 26 September 2021. As of 26 October 2021, 89,116,434 doses had been administered, of which 64,184,204 were Comirnaty (about 72%), 11,286,535 were Spikevax (about 13%), 12,154,213 were Vaxzevria (about 14%), and 1,491,482 were Janssen (about 2%). The number of doses administered as of 26 October 2021 is published by the Ministry of Health at the following link: https://github.com/italia/COVID-19-opendata-vaccini. Data extraction was carried out on 30 October 2021.
The distribution of reports by onset time from vaccination, without considering the vaccine, the dose, and the type of event, is shown in Figure 6a. Most reactions (about 50%) occur on the same day as vaccination or on the following day (29%), more rarely beyond the following 48 h (21%).
The temporal trend for the number of notifications by dose number is described in Figure 6b,c. No main differences in notification rates were collected for the 1st and 2nd dose with regard to Comirnaty and Spikevax vaccines. In contrast, the reporting rate for the 2nd dose of Vaxzevria vaccine was significantly lower than for the 1st dose.
Table 6 lists the numbers of fatal cases by vaccine type, where “C” stands for Comirnaty, “S” for Spikevax, “V” for Vaxzevria, and “J” for Janssen.
Overall, about 608 serious reports (of which 293 cases concern women (48.2%), 309 men (50.8%), and 6 (0.7%) did not include this information) indicate the outcome “death” at the notification time or as information acquired after the follow-up. The notification rate is 0.72 per 100,000 administered doses, without considering the type of vaccine, dose number, or causality, and the mean age is 76 years. About 71% (435/608) of death reports had a causality assessment by the WHO surveillance algorithm, according to which 59.5% (259/435) of cases were not related, 30.6% (133/435) were indeterminate, and 6.2% (27/435) were unclassifiable due to lack of sufficient data. It is important to highlight that only 16 cases (3.7%) out of the 435 evaluated by AIFA were officially related to the vaccine (about 0.2 cases per million administered doses), of which:
  • One report concerns a 79-year-old man with a history of high blood pressure, surgery for triple aortocoronary bypass, and pacemaker implantation;
  • Two reports concern a 46-year-old man and a 32-year-old woman, who died 12 days after the administration of the 1st dose of Vaxzevria vaccine as a result of thrombotic events and concomitant thrombocytopenia;
  • Two reports refer to two patients with respiratory symptoms and positive swabs, 45 and 35 days after completion of the vaccine cycle, respectively, who died from complications of interstitial pneumonia. Both patients had clinical conditions and therapies consistent with a state of immunosuppression;
  • One report refers to a fragile patient who experienced fever and vomiting after administration of the first dose of vaccine and died 2 days later;
  • Three reports refer to three patients over 80 years old with various diseases, who died after completing the vaccination cycle (in two cases 3 weeks before and in one case 39 days before the fatal event);
  • Three reports involve three patients who died from complications of a thrombotic event associated with thrombocytopenia;
  • One report involves one patient who died from complications of thrombotic thrombocytopenic purpura;
  • Two reports refer to two patients aged 76 and 80 years with various diseases who died after completing the vaccination cycle;
  • One death is not described in the AIFA reports.
Figure 7 describes the reporting rate (the notification rate is the number of reports observed per 100,000 doses administered, to obtain a standardized and comparable measure) (i.e., the ratio between the number of reports of suspected adverse reactions and the number of administered doses), with distributions by sex and age group.
Specifically, Figure 7a shows the distribution of reports by date of onset of the suspected adverse reaction, depending on the doses of vaccine administered and without considering the number of doses, whereas Figure 7b,c show the reporting rate by sex and age, respectively. The plots reveal some interesting features. First, it is evident that the number of suspected adverse reactions decreases over the time period, showing that an increase in doses administered does not correspond to an increase in adverse reactions. Second, the female sex reported more suspected adverse reactions than the male sex, particularly with regard to the Vaxzevria vaccine. Third, the notification rate is higher in the 12–59 years age groups and decreases in older age groups. From the plot, we see that the occurrence of suspected adverse reactions typically increases for the Vaxzevria vaccine in the age group 20–29.
Table 7 summarizes the distribution of reports by seriousness. For each date, without considering vaccine type and dose administered, we reported the outcome of notifications with a reporting rate per 100,000 administered doses, where “S” stands for serious adverse events and “ N S ” for non-serious events. Looking at the values in the table, we can observe that the number of reports decreases over time. One possible reason could be related to the categories vaccinated in different periods of the year. For example, at the beginning of the vaccination campaign, physicians and healthcare professionals were vaccinated, and these were perhaps more likely to report any adverse reactions than adolescents or children.

5.2.2. Independent Monitoring Platform

To make our evaluation more accurate and complete, we designed and developed an independent platform for collecting and analyzing spontaneous reports, where everyone (from health professionals to patients to citizens) can report a suspected adverse event through a secure online submission process [29], as shown in Figure 8. The form has required data fields for patient demographic information (sex and age), vaccine administered, and severity outcome of the adverse event on a scale of 1 to 5 (the severity of an event varies between 1 and 5, broken down as follows: low (“1”, “2”), medium (“3”), high (“4”, “5”)), including the description of an adverse event if the "Other" option is clicked.
Starting from the scientific divulgation page of one of the authors [30] with more than 10,000 followers, we collected about 2000 spontaneous and anonymous (GDPR-compliant) reports (third dose pre-booster) from 1 October 2021 to 20 November 2021, distributed as follows (see Figure 9a): 33.1% of reports referred to injection site pain, 24.3% to lethargy, 15.2% to fever, 12.6% to headache, 8.1% to other (i.e., more detailed reporting that does not fall into a predefined category, such as menstrual cycle alteration, arrhythmia, tachycardia, chest pain, etc.), 2.9% to nausea, and 2.0% to gastrointestinal disorders and loss of consciousness.
However, the severity of these events on a scale of 1 (very low) to 5 (very high), is low with a value of 2.39 on average, a maximum value of 2.65 for lethargy, and a minimum value of 2.09 for the other adverse events collected, as shown in Figure 9b. Regardless of dose number, the distribution of suspected adverse events is in line with that reported in previous sections, as shown in Figure 10a,b. In fact, the charts reveal that the number of reports is highest in the 20–49 age groups, and about 61% of them involve women.
Considering the “Other” category, Figure 10c shows the keywords most commonly used by platform users to describe the reactions that were observed after administration of the vaccine. Specifically, 104 reports fell within the category for joint and muscle pain (back, neck), followed by 48 for injection site warmth, erythema, and pruritus, 44 for lymphadenopathy, 33 for menstrual cycle alteration, 28 for arrhythmia, tachycardia, and chest pain, 23 for chills, 18 for drowsiness, 12 for transient hypertension and dizziness, 8 for eye disorders (i.e., blurred vision and hemorrhage), 7 for paresthesia, and 6 for tinnitus. Regarding the severity of such events, 21.22% (83/391) were classified as “high”, 12.28% (48/391) as “medium”, and 66.5% (260/391) as “low”.

5.3. Disproportionality Analysis

Disproportionality analysis involves the use of statistical techniques to assess the disproportional reporting of specific vaccine-adverse event combinations, i.e., the so-called signals of disproportionate reporting (SDRs). Different statistical methods are used to generate SDRs [31]. In this study, we calculate the proportional reporting ratio (PRR), which relies on the principle that when an SDR (involving a particular adverse event) is identified for a medicinal product (in this case referred to as a vaccine of interest VI), this adverse event is reported relatively more frequently in association with this medicinal product VI than with other medicinal products. A mathematical representation of the proportional reporting ratio is shown in Table 8.
The PRR is computed as V i A E i / ( V i A E i + V i A E x ) V x A E i / ( V x A E i + V x A E x ) , where:
  • The value V i A E i indicates the number of individual cases with the suspect medicinal product V I involving an adverse event A E ;
  • The value V i A E x indicates the number of individual cases related to the suspect medicinal product V I , involving any other adverse events apart from the A E ;
  • The value V x A E i indicates the number of individual cases involving event A E in relation to any other medicinal products apart from the V I ;
  • The value V x A E x indicates the number of individual cases involving any other adverse events apart from the A E and any other medicinal products apart from the V I .
There is currently no gold standard that establishes universal thresholds for evaluating the PRR. Thresholds used in EudraVigilance are empirical and refer to those published by Evans et al. [32]. The following criteria are applied to define an SDR when the PRR is displayed with its 95% confidence interval: (i) the lower bound of the 95% confidence interval is greater than or equal to one; (ii) the number of individual cases is greater than or equal to three.
Table 9 reports the PRR values considering the four vaccines mainly used against COVID-19. Looking at the values in the table, we can observe that the potential drug–event associations for further evaluation are the following:
  • “Neoplasm benign, malignant, and unspecified”, “Renal and urinary disorders”, “Blood and lymphatic system disorders”, and “Vascular disorders” for the Comirnaty vaccine;
  • “Social circumstances”, “Hepatobiliary disorders”, “Endocrine disorders”, and “Renal and urinary disorders”, for the Spikevax vaccine;
  • “Nervous system disorders”, “Musculoskeletal and connective tissue disorders”, and “Gastrointestinal disorders” for the Vaxzevria vaccine;
  • “Social circumstances”, “Renal and urinary disorders”, “Product issues”, and “Cardiac disorders” for the Janssen vaccine.

5.4. Comparative Analysis

Using the EudraVigilance database, we performed a comparative analysis of the COVID-19 vaccines discussed in this study. In Table 10, we can observe that the reports mainly concern Comirnaty (46%) and Vaxzevria (37%), and to a lesser extent Spikevax (14%) and Janssen (3%). Based on the seriousness criterion, most reported adverse events were classified as non-serious (about 53%). In particular, the distribution of reports by type of vaccine is as follows: (1) Comirnaty: SAE = 26%, NSAE = 20%; (2) Vaxzevria: SAE = 18%, NSAE = 19%; (3) Spikevax: SAE = 7%, NSAE = 7%; and (4) Janssen: SAE = 2%, NSAE = 1%.
Considering the reported events by sex (Table 11), 72% of the reports concern women and 26% men, with the following distributions: (1) Comirnaty: Female = 35%, Male = 11%; (2) Vaxzevria: Female = 28%, Male = 9%; (3) Spikevax: Female = 10%, Male = 4%; and (4) Janssen: Female = 2%, Male = 1%.
Table 12 summarizes the distribution of reported adverse events by age. About 83% of the reports come from persons aged 18–64 years, followed by persons aged 65–85 years (about 14%). The reporting distribution in the age group 18–64 years by type of vaccine is as follows: (1) Comirnaty = 38%; (2) Vaxzevria = 31%; (3) Spikevax = 11%; and (4) Janssen = 3%. Considering the age group 65–85 years, the distribution of reported adverse events concerns: (1) Comirnaty = 6%; (2) Vaxzevria = 5%; (3) Spikevax = 2%; and (4) Janssen = 0%.

6. Conclusions

This paper presented a general approach for investigating the significance and causes of the potential side effects observed after COVID-19 vaccination. Experimental evaluation showed that: (1) most of the adverse events are classified as non-serious, concerning muscle/joint pain, chills, nausea, headache, and fatigue, and the reporting outcome is recovered/resolved (i.e., the person has improved or recuperated); (2) the notification rate is higher in the 20–39 years age group and decreases in older age groups and in very young people; (3) the distribution of the reports concerns women more than men; and (4) most reactions occur during the first 24 h after vaccination or the day after (more rarely in the next 48 h) and no differences in notification rates were detected between the 1st and 2nd dose (except for the Vaxzevria vaccine, which shows a significantly lower notification rate for the 2nd dose than the 1st dose).
However, the work has several limitations. For example, since the data do not include vaccination status, it is not possible to analyze the rates of adverse events in vaccinated versus unvaccinated persons and detect whether vaccination is associated with an increased risk of adverse events. Another limitation is that the study does not determine whether a vaccine caused a health problem but only underscores possible reporting clusters (e.g., suspected (temporally or geographically) localized or age-/sex-/vaccine-specific adverse event reporting).
In future work, other research issues may be investigated. Firstly, we may explore a machine-learning-based approach, using feature importance for identifying potential patient risk factors for particular types of adverse events, as well as investigating further disproportionality analysis methods to generate hypotheses regarding possible causal relations between drugs and adverse effects. Secondly, we will improve the quality and completeness of reporting, as there is currently a lack of information about the total number of people vaccinated and the total number of people who experienced an adverse event, as well as about the incidence of adverse events in unvaccinated persons.

Author Contributions

Conceptualization, F.B. and D.T.; Data curation, D.T.; Formal analysis, F.B.; Methodology, F.B.; Supervision, D.T. All authors have read and agreed to the published version of the manuscript.

Funding

This research received no external funding.

Institutional Review Board Statement

Not applicable.

Informed Consent Statement

Not applicable.

Data Availability Statement

Not applicable.

Conflicts of Interest

The authors declare no conflict of interest.

References

  1. Belcastro, L.; Marozzo, F.; Talia, D. Programming models and systems for big data analysis. Int. J. Parallel Emergent Distrib. Syst. 2019, 34, 632–652. [Google Scholar] [CrossRef]
  2. Luo, J.; Wu, M.; Gopukumar, D.; Zhao, Y. Big data application in biomedical research and health care: A literature review. Biomed. Inform. Insights 2016, 8, BII-S31559. [Google Scholar] [CrossRef] [PubMed] [Green Version]
  3. Kashyap, H.; Ahmed, H.A.; Hoque, N.; Roy, S.; Bhattacharyya, D.K. Big data analytics in bioinformatics: A machine learning perspective. arXiv 2015, arXiv:1506.05101. [Google Scholar]
  4. Ghani, N.A.; Hamid, S.; Hashem, I.A.T.; Ahmed, E. Social media big data analytics: A survey. Comput. Hum. Behav. 2019, 101, 417–428. [Google Scholar] [CrossRef]
  5. Cesario, E.; Marozzo, F.; Talia, D.; Trunfio, P. SMA4TD: A social media analysis methodology for trajectory discovery in large-scale events. Online Soc. Netw. Media 2017, 3, 49–62. [Google Scholar] [CrossRef]
  6. Branda, F.; Marozzo, F.; Talia, D. Ticket Sales Prediction and Dynamic Pricing Strategies in Public Transport. Big Data Cogn. Comput. 2020, 4, 36. [Google Scholar] [CrossRef]
  7. Tosi, D. Cell phone big data to compute mobility scenarios for future smart cities. Int. J. Data Sci. Anal. 2017, 4, 265–284. [Google Scholar] [CrossRef] [Green Version]
  8. Tosi, D.; Marzorati, S.; La Rosa, M.; Dondossola, G.; Terruggia, R. Big data from cellular networks: How to estimate energy demand at real-time. In Proceedings of the 2015 IEEE International Conference on Data Science and Advanced Analytics, Houston, TX, USA, 17–19 December 2015. [Google Scholar]
  9. Tosi, D.; Campi, A. How data analytics and big data can help scientists in managing COVID-19 diffusion: Modeling study to predict the COVID-19 diffusion in Italy and the Lombardy region. J. Med. Internet Res. 2020, 22, e21081. [Google Scholar] [CrossRef]
  10. Tosi, D.; Campi, A.S. How schools affected the covid-19 pandemic in Italy: Data analysis for Lombardy region, Campania region, and Emilia region. Future Internet 2021, 13, 109. [Google Scholar] [CrossRef]
  11. Tosi, D.; Verde, A.; Verde, M. Clarification of misleading perceptions of COVID-19 fatality and testing rates in Italy: Data analysis. J. Med. Internet Res. 2020, 22, e19825. [Google Scholar] [CrossRef]
  12. Cinelli, M.; Quattrociocchi, W.; Galeazzi, A.; Valensise, C.M.; Brugnoli, E.; Schmidt, A.L.; Zola, P.; Zollo, F.; Scala, A. The COVID-19 social media infodemic. Sci. Rep. 2020, 10, 1–10. [Google Scholar] [CrossRef] [PubMed]
  13. Singh, A.; Khillan, R.; Mishra, Y.; Khurana, S. The safety profile of COVID-19 vaccinations in the United States. Am. J. Infect. Control 2022, 50, 15–19. [Google Scholar] [CrossRef] [PubMed]
  14. Beatty, A.L.; Peyser, N.D.; Butcher, X.E.; Cocohoba, J.M.; Lin, F.; Olgin, J.E.; Pletcher, M.J.; Marcus, G.M. Analysis of COVID-19 vaccine type and adverse effects following vaccination. JAMA Netw. Open 2021, 4, e2140364. [Google Scholar] [CrossRef] [PubMed]
  15. Boekel, L.; Kummer, L.Y.; van Dam, K.P.; Hooijberg, F.; van Kempen, Z.; Vogelzang, E.H.; Wieske, L.; Eftimov, F.; van Vollenhoven, R.; Kuijpers, T.W.; et al. Adverse events after first COVID-19 vaccination in patients with autoimmune diseases. Lancet Rheumatol. 2021, 3, e542–e545. [Google Scholar] [CrossRef]
  16. Fu, W.; Sivajohan, B.; McClymont, E.; Albert, A.; Elwood, C.; Ogilvie, G.; Money, D. Systematic review of the safety, immunogenicity, and effectiveness of COVID-19 vaccines in pregnant and lactating individuals and their infants. Int. J. Gynecol. Obstet. 2022, 156, 406–417. [Google Scholar] [CrossRef] [PubMed]
  17. Lian, A.T.; Du, J.; Tang, L. Using a Machine Learning Approach to Monitor COVID-19 Vaccine Adverse Events (VAE) from Twitter Data. Vaccines 2022, 10, 103. [Google Scholar] [CrossRef]
  18. Glossary—WHO Vaccine Safety Basics. Available online: https://vaccine-safety-training.org/glossary.html (accessed on 3 December 2021).
  19. Shimabukuro, T.T.; Nguyen, M.; Martin, D.; DeStefano, F. Safety monitoring in the vaccine adverse event reporting system (VAERS). Vaccine 2015, 33, 4398–4405. [Google Scholar] [CrossRef] [Green Version]
  20. COVID-19 Brighton Collaboration. Available online: https://brightoncollaboration.us/covid-19/ (accessed on 30 October 2021).
  21. Ghosh, D.; Skinner, M.; Ferguson, L.R. The role of the Therapeutic Goods Administration and the Medicine and Medical Devices Safety Authority in evaluating complementary and alternative medicines in Australia and New Zealand. Toxicology 2006, 221, 88–94. [Google Scholar] [CrossRef]
  22. Lindquist, M. VigiBase, the WHO global ICSR database system: Basic facts. Drug Inf. J. 2008, 42, 409–419. [Google Scholar] [CrossRef]
  23. Postigo, R.; Brosch, S.; Slattery, J.; van Haren, A.; Dogné, J.M.; Kurz, X.; Candore, G.; Domergue, F.; Arlett, P. EudraVigilance medicines safety database: Publicly accessible data for research and public health protection. Drug Saf. 2018, 41, 665–675. [Google Scholar] [CrossRef] [Green Version]
  24. Italian Medicines Agency (AIFA). Available online: https://www.aifa.gov.it/en/farmacovigilanza-vaccini-covid-19 (accessed on 30 October 2021).
  25. COVID19 ITALIA: “Predire è Meglio che Curare”. Available online: http://www.covid19-italy.it/ (accessed on 30 October 2021).
  26. Medical Dictionary for Regulatory Activities (MedDRA). Available online: https://www.meddra.org/ (accessed on 10 November 2021).
  27. EudraVigilance—European Database of Suspected Adverse Drug Reaction Reports. Available online: https://www.adrreports.eu/en/index.html (accessed on 27 November 2021).
  28. AIFA—COVID-19 Vaccine Surveillance Report. Available online: https://www.aifa.gov.it/en/rapporti-su-sorveglianza-dei-vaccini-covid-19 (accessed on 27 September 2021).
  29. COVID 19 ITALIA “Predire è Meglio che Curare”—Segnalazioni. Available online: http://www.covid19-italy.it/segnalazioni-covid19/segnala.html (accessed on 3 December 2021).
  30. Predire è Meglio che Curare. Available online: https://www.facebook.com/prediremegliochecurare (accessed on 20 November 2021).
  31. Zorych, I.; Madigan, D.; Ryan, P.; Bate, A. Disproportionality methods for pharmacovigilance in longitudinal observational databases. Stat. Methods Med. Res. 2013, 22, 39–56. [Google Scholar] [CrossRef] [PubMed]
  32. Evans, S.J.; Waller, P.C.; Davis, S. Use of proportional reporting ratios (PRRs) for signal generation from spontaneous adverse drug reaction reports. Pharmacoepidemiol. Drug Saf. 2001, 10, 483–486. [Google Scholar] [CrossRef] [PubMed]
Figure 1. Workflow of the proposed framework.
Information 13 00329 g001
Figure 2. Main results of pharmacovigilance for Comirnaty vaccine: number of reports received over time (a), and their distribution by age group and sex (b) and by seriousness (c).
Information 13 00329 g002
Figure 3. Main results of pharmacovigilance for Spikevax vaccine: number of reports received over time (a), and their distribution by age group and sex (b) and by seriousness (c).
Information 13 00329 g003
Figure 4. Main results of pharmacovigilance for Vaxzevria vaccine: number of reports received over time (a), and their distribution by age group and sex (b) and by seriousness (c).
Information 13 00329 g004
Figure 5. Main results of pharmacovigilance for Janssen vaccine: number of reports received over time (a), and their distribution by age group and sex (b) and by seriousness (c).
Information 13 00329 g005
Figure 6. Distribution of reports by onset time of symptoms from vaccination date (a), by 1st dose (b), and by 2nd dose (c).
Information 13 00329 g006
Figure 7. Main results of pharmacovigilance activities of AIFA: reporting rate vs. time (a), and distribution by sex (b) and by age (c).
Information 13 00329 g007
Figure 8. An example of online reporting of an adverse event on our platform.
Information 13 00329 g008
Figure 9. Distribution of reported adverse events on our platform by type (a) and by severity (b).
Information 13 00329 g009
Figure 10. Main results of our pharmacovigilance activity: distribution of number of reported cases by sex (a), by age (b), and in “Other” category (c).
Information 13 00329 g010
Table 1. Distribution of adverse events by System Organ Class (SOC) for all COVID-19 vaccines reported in VigiBase, from 27 December 2020 to 20 November 2021.
IDType of ReactionValue
1General disorders and administration site conditions1,377,111
2Nervous system disorders974,508
3Musculoskeletal and connective tissue disorders660,524
4Gastrointestinal disorders464,713
5Investigations311,319
6Skin and subcutaneous tissue disorders310,449
7Respiratory, thoracic, and mediastinal disorders240,202
8Infections and infestations156,200
9Vascular disorders122,603
10Cardiac disorders113,225
11Injury, poisoning, and procedural complications111,467
12Psychiatric disorders107,102
13Blood and lymphatic system disorders91,518
14Reproductive system and breast disorders90,911
15Eye disorders83,206
16Ear and labyrinth disorders75,838
17Metabolism and nutrition disorders51,461
18Immune system disorders32,182
19Surgical and medical procedures22,157
20Renal and urinary disorders18,321
21Social circumstances15,970
22Pregnancy, puerperium, and perinatal conditions5181
23Hepatobiliary disorders4571
24Product issues3698
25Neoplasms benign, malignant, and unspecified3403
26Endocrine disorders3164
Total-5,451,004
Table 2. Outcome of reports of suspected major adverse events related to Comirnaty vaccine after 459 million doses administered globally.
IDFatalNot Recovered/
Not Resolved
Recovered/
Resolved
Recovered/
Resolved with Sequelae
Recovering/
Resolving
Unknown
1418286,342160,390293779,47863,717
2157964,35994,7753,82848,97133,666
318448,02970,029165636,97421,787
459226,81949,529127425,46915,131
612619,01722,06372113,77711,500
7163616,44517,857104413,02211,722
8158512,30811,15373810,13220,796
14522,36111,38144665669525
10216011,38511,903112290137949
1321113,15210,41135487104807
Total12,260295,680437,17712,644234,389187,844
Table 3. Outcome of reports of suspected major adverse events related to Spikevax vaccine after 63 million doses administered globally.
IDFatalNot Recovered/
Not Resolved
Recovered/
Resolved
Recovered/
Resolved with Sequelae
Recovering/
Resolving
Unknown
1303032,19747,67462525,40518,297
284018,29727,00861212,00011,034
317914,64919,25028910,2556186
4329771714,33322662964979
6796990699012939074208
79405525476414622184586
88164586357110119684840
109263714353818819942915
93302905290910012352419
147387222147211821566
Total7476100,452132,251248866,46061,030
Table 4. Outcome of reports of suspected major adverse events related to Vaxzevria vaccine after 67 million doses administered globally.
IDFatalNot Recovered/
Not Resolved
Recovered/
Resolved
Recovered/
Resolved with Sequelae
Recovering/
Resolving
Unknown
1152770,937149,024372080,25450,431
299859,45996,760424752,75934,657
334,65746,84066,890211139,21518,157
433422,07548,513139824,14514,306
65114,78616,66662111,5099796
780611,31710,96471993397923
8437728210,35765580297080
94507292732552764265683
51575071990727247114237
12605427715330441454,134
Total39,477250,486423,55914,574240,532156,404
Table 5. Outcome of reports of suspected major adverse events related to Janssen vaccine after 17 million doses administered globally.
IDFatalNot Recovered/
Not Resolved
Recovered/
Resolved
Recovered/
Resolved with Sequelae
Recovering/
Resolving
Unknown
1519910612,3088285275520
22116611754410547992403
344528255923840641354
47921713773192087835
5108183615373562891
8151701749225522414
7251144883916626667
9148125861118387842
68118393015629494
14611564848230345
Total152530,75234,36732622,46315,765
Table 6. Distribution of (unconfirmed) death reports by type of vaccine in Italy (only 16 cases out of the 608 collected by AIFA were officially classified as related to the vaccine.)
PeriodFatal CasesReporting Rate
CSVJCSVJ
27 December 2020–26 January 202113---0.8%---
As of 26 February40---0.97%---
As of 26 March761212-1.1%2.8%0.7%-
As of 26 April1503934-1.17%3.05%0.85%-
As of 26 May213585340.96%1.99%0.79%0.79%
As of 26 June2627572140.75%1.58%0.84%1.15%
As of 26 July3078688170.66%1.30%0.78%1.28%
As of 26 August3459294240.64%1.05%0.78%1.68%
As of 26 September3919698230.65%0.91%0.81%1.56%
Table 7. Distribution by seriousness of the reports in Italy.
PeriodReportsEventsReporting Rate
SNSSNS
27 December 2020–6 January 202173377.3%92.4%34434
As of 26 February 202130,0156.1%93.6%44683
As of 26 March 202146,2377.1%92.7%36473
As of 26 April 202156,1108.6%91.0%27282
As of 26 May 202166,25810.4%90.0%21183
As of 26 June 202176,20611.9%87.9%18135
As of 26 July 202184,32212.8%87.1%16111
As of 26 August 202191,36013.8%86.1%13111
As of 26 September 2021101,11014.4%85.4%17103
Table 8. Table (2 × 2) for the computation of the proportional reporting ratio (PRR).
Adverse Event of Interest (AE)All Other Adverse Events
Vaccine of interest (VI) V i A E i V i A E x
Comparator vaccine(s) V x A E i V x A E x
Table 9. Calculation of PRRs of the main adverse events reported in EudraVigilance for each COVID-19 vaccine.
Type of ReactionComirnatySpikevaxVaxzevriaJanssen
General disorders and administration site conditions0.96 (95% CI: 0.96–0.97)1.03 (95% CI: 1.03–1.04)1.02 (95% CI: 1.02–1.03)1.02 (95% CI: 1.00–1.03)
Nervous system disorders0.87 (95% CI: 0.86–0.87)0.91 (95% CI: 0.90–0.92)1.20 (95% CI: 1.20–1.21)1.07 (95% CI: 1.06–1.09)
Musculoskeletal and connective tissue disorders0.88 (95% CI: 0.87–0.88)0.89 (95% CI: 0.88–0.90)1.19 (95% CI: 1.18–1.20)1.10 (95% CI: 1.08–1.12)
Gastrointestinal disorders0.91 (95% CI: 0.91–0.92)0.93 (95% CI: 0.92–0.94)1.15 (95% CI: 1.14–1.16)0.95 (95% CI: 0.93–0.97)
Investigations1.37 (95% CI: 1.34–1.39)0.98 (95% CI: 0.96–1.00)0.75 (95% CI: 0.74–0.77)0.65 (95% CI: 0.62–0.68)
Skin and subcutaneous tissue disorders0.98 (95% CI: 0.97–0.99)1.15 (95% CI: 1.14–1.17)0.95 (95% CI: 0.94–0.96)0.98 (95% CI: 0.95–1.01)
Respiratory, thoracic, and mediastinal disorders1.12 (95% CI: 1.11–1.14)1.11 (95% CI: 1.09–1.13)0.82 (95% CI: 0.81–0.83)1.08 (95% CI: 1.05–1.12)
Infections and infestations1.25 (95% CI: 1.23–1.26)1.05 (95% CI: 1.03–1.07)0.76 (95% CI: 0.75–0.77)0.97 (95% CI: 0.94–1.01)
Vascular disorders1.39 (95% CI: 1.37–1.41)0.95 (95% CI: 0.93–0.97)0.73 (95% CI: 0.72–0.74)0.82 (95% CI: 0.78–0.86)
Cardiac disorders1.32 (95% CI: 1.31–1.34)0.91 (95% CI: 0.89–0.93)0.75 (95% CI: 0.74–0.76)1.15 (95% CI: 1.11–1.19)
Injury, poisoning, and procedural complications1.16 (95% CI: 1.14–1.18)1.30 (95% CI: 1.27–1.34)0.76 (95% CI: 0.75–0.78)0.69 (95% CI: 0.65–0.73)
Psychiatric disorders1.19 (95% CI: 1.17–1.21)1.16 (95% CI: 1.13–1.19)0.78 (95% CI: 0.77–0.80)0.80 (95% CI: 0.75–0.84)
Blood and lymphatic system disorders1.40 (95% CI: 1.38–1.43)0.92 (95% CI: 0.90–0.94)0.72 (95% CI: 0.71–0.74)0.90 (95% CI: 0.87–0.94)
Reproductive system and breast disorders1.25 (95% CI: 1.24–1.27)1.08 (95% CI: 1.06–1.10)0.74 (95% CI: 0.73–0.75)1.01 (95% CI: 0.98–1.05)
Eye disorders1.24 (95% CI: 1.22–1.27)1.08 (95% CI: 1.05–1.11)0.79 (95% CI: 0.77–0.81)0.70 (95% CI: 0.65–0.74)
Ear and labyrinth disorders1.17 (95% CI: 1.15–1.20)0.97 (95% CI: 0.94–1.00)0.89 (95% CI: 0.87–0.91)0.73 (95% CI: 0.69–0.78)
Metabolism and nutrition disorders1.15 (95% CI: 1.12–1.19)1.63 (95% CI: 1.58–1.69)0.62 (95% CI: 0.60–0.64)0.45 (95% CI: 0.42–0.49)
Immune system disorders1.02 (95% CI: 0.99–1.04)0.90 (95% CI: 0.87–0.93)1.09 (95% CI: 1.07–1.12)0.61 (95% CI: 0.57–0.66)
Surgical and medical procedures1.00 (95% CI: 0.96–1.03)1.44 (95% CI: 1.37–1.50)0.81 (95% CI: 0.78–0.84)1.03 (95% CI: 0.94–1.13)
Renal and urinary disorders1.48 (95% CI: 1.42–1.55)1.73 (95% CI: 1.64–1.82)0.37 (95% CI: 0.35–0.39)1.44 (95% CI: 1.30–1.58)
Social circumstances1.01 (95% CI: 0.96–1.06)2.09 (95% CI: 1.97–2.21)0.53 (95% CI: 0.50–0.56)1.55 (95% CI: 1.38–1.73)
Pregnancy, puerperium, and perinatal conditions1.22 (95% CI: 1.15–1.30)1.57 (95% CI: 1.45–1.70)0.60 (95% CI: 0.55–0.64)0.96 (95% CI: 0.81–1.15)
Hepatobiliary disorders1.31 (95% CI: 1.21–1.40)1.88 (95% CI: 1.72–2.05)0.49 (95% CI: 0.45–0.53)0.68 (95% CI: 0.53–0.86)
Product issues0.81 (95% CI: 0.68–0.97)1.21 (95% CI: 0.95–1.53)1.02 (95% CI: 0.85–1.22)1.65 (95% CI: 1.13–2.40)
Neoplasms benign, malignant, and unspecified (including cysts and polyps)1.49 (95% CI: 1.37–1.62)1.29 (95% CI: 1.15–1.45)0.58 (95% CI: 0.52–0.63)0.56 (95% CI: 0.41–0.76)
Endocrine disorders1.22 (95% CI: 1.13–1.32)1.81 (95% CI: 1.65–1.99)0.56 (95% CI: 0.51–0.61)0.64 (95% CI: 0.49–0.83)
Table 10. Comparative analysis of vaccines by seriousness of the reported adverse events.
VaccineSuspected-AE a SAE b NSAE c
Comirnaty1,363,522586,726776,796
Vaxzevria1,082,926562,208520,718
Spikevax398,352194,269204,083
Janssen103,92538,18465,741
a Suspected Adverse Event; b Serious Adverse Event; c Non-Serious Adverse Event.
Table 11. Comparative analysis of vaccines by sex.
VaccineMaleFemaleUnknown
Comirnaty333,3251,010,54119,656
Vaxzevria257,784800,99324,149
Spikevax112,749282,5543049
Janssen39,21263,7121001
Table 12. Comparative analysis of vaccines by age.
Vaccine0–1 Months2 Months–2 Years3–11 Years12–17 Years18–64 Years65–85 Years≥85 YearsUnknown
Comirnaty41083427025,6611,045,338176,21936,53578,255
Vaxzevria669783608680866,919134,324554173,402
Spikevax93182292041309,08364,441958512,898
Janssen920616589,29266727137048
Publisher’s Note: MDPI stays neutral with regard to jurisdictional claims in published maps and institutional affiliations.

