1. Introduction
Many real-world complex systems are represented by graphs, where nodes are entities such as universities, people or even proteins and edges represents the relations between the nodes. The most central property of these networks is their evolution, where edges are added and deleted over time. Link prediction (LP) is one of the most important tasks in social network analysis. It has many applications in various areas: spam E-mail [
1]; disease prediction [
2]; system recommendations [
3]; and viral marketing [
4]. The authors in [
5] used a network-based technique to assess multimorbidity data and build algorithms for forecasting which diseases a patient is likely to develop in their research. A temporal bipartite network is used to describe multimorbidity data, with nodes representing patients and diseases, and a link between these nodes indicating that the patient has been diagnosed with the condition. The link prediction problem is defined as: let G(V,E) be an undirected graph, V is the set of nodes that refer to users of a social network (SN), E is the set of links or edges that represent relations between nodes. Given a snapshot of links at time t, could we infer the links that will be established at time
?
To solve this issue, authors have proposed various approaches. The authors in [
6] have compared several similarity measures using AUC, and their results show that the Adamic Adar metric (AA) [
7] performs best in four of the five datasets followed by Jaccard [
8]; the difference between those two metrics is that (AA) [
7] assumes that the rare common neighbors are heavily weighted; however, Jaccard [
8] measures the probability that two nodes have a common neighbor. The authors in [
9] have an proposed adaptive degree penalization metric (ADP). They proposed a generalized formula for the existing degree penalization local link prediction method in order to provide the degree penalization level. Then, the penalization parameter for a network is predicted using logistic regression. In [
10,
11], we proposed a similarity metric based on the path depth from a source node to a destination node and their degrees. In addition, we found a strong correlation between the clustering coefficient and area under the curve. Machine learning algorithms were used to solve the link prediction problem where the enhancement was by
in the power grid dataset.
In [
12], the authors solved the link prediction problem as a binary classification task, where they set the precision as an objective function, and then transform the link prediction problem into an optimization problem where the authors defined a feature set for each edge. This set contains state-of-the-art metrics, the used class label was
for existing links and
for non-existing links. In [
13], the authors collected four different data, namely: node feature subset, topology features subset, social features subset (following or followed) and collaborative filtering for the voting feature subset, then they trained SVM, naive Bayes, random forest and logistic regression classifiers. In [
14], the authors used the importance of neighborhood knowledge in link prediction that has been proven. As a result, they suggest extracting structural information from input samples using a neighborhood neural encoder.
In [
15], the authors proposed a combination of the preferential attachment metric (PA) and (AA) to solve the link prediction problem using weights for each used metric and then obtained good accuracy for the GitHub dataset:
. The same idea was applied in [
16] where the authors proposed common neighbor and centrality-based parameterized algorithm (CCPA):
,
is a parameter between
. It is used to control the weight of common neighbors and centrality,
represents the neighbors of node x, the fraction
represents the closeness centrality between the nodes x and y, where N is the number of nodes in the network, and
is the shortest path between x and y.
As shown previously, recent decades have witnessed a tremendous growth in the amount of research seeking to provide precise predictions of links. Researchers have only focused on proposing new metrics and compared their results using area under the curve (AUC) against the state-of-the-art metrics. However, there is still a need for a unique method that enables the users of state-of-the-art metrics to improve their results in terms of accuracy. This paper proposes a solution to a link prediction (LP) problem based on the combination of state-of-the-art metrics and mean received resources (MRRs). This method is parameterized to grant full control to the user/system to give the importance to the link prediction metric or the MRRs. The main goal is to improve the area under the curve (AUC) of the state-of-the-art measures and any other local metric that could or will be proposed. We proved that the proposed combination has a meaningful effect on the results. Then, we used machine learning algorithms to classify the links. The results show the superiority of machine learning models whenever we add our proposed metric as an additional feature. Furthermore, we found that the decision tree performs best using the proposed metric.
To summarize, the principal contributions of this paper are:
We proposed a new parameterized link prediction metric that grants the user or system the full control of metric. Note that the proposed metric enhances the performance of the state-of-the-art metrics;
We compared the performance of the proposed metric against the state-of-the-art metrics using the AUC;
We studied the impact of using the parameter on each enhanced version of link prediction;
We studied the correlation between the parameter and the network features;
We used machine learning algorithms to confirm the efficiency of the proposed method.
This paper is organized as follows: in
Section 2, we describe the state-of-the-art metrics and introduce the proposed metric.
Section 3 presents the evaluation metric AUC and the datasets used to compare the proposed metric with the state-of-the-art metrics. In
Section 4, we report the results. In
Section 5, we used machine learning algorithms to classify the links. We conclude our paper in
Section 6.
4. Results
In our study, we used of the graph as a training set and as a test set. We tested the different value of from 0 to 1 with a step of 0.1 to show the impact of the contribution of MRR and LM on the AUC values.
In
Table 3, we used Equation (
13) with different values of
, from
where the MRR provides the scores of links, to
where the state-of-the-art metric defines the scores of links. The x axis defines the value of
, the y axis defines the AUC value. From Zachary’s results, we can conclude that the best combination is between MRR and RA for a value of
. As we can notice, the curve is above all other combinations with a high AUC value. The results of YeastS highlight that MRR and AP combination outperforms all other combinations and gives good results (since the gap between the AP and MRR combination and other metrics curves is huge) for all values of
( the best
). From USAir results, we can notice that the curve of the combination between MRR and RA has a minor advantage over the curve of the combination of MRR and AA for
. Power grid results show that all combinations provide great results with no big difference except for CN when the accuracy decreases for
. At
, we obtain the best accuracy value. This proves that the only use of MRR can give promising results for some datasets. The results of political networks exhibit that both the CN and MRR combination and PD and MRR combination offer the best results in term of AUC, and the curves of other methods are very close except for the AP metric. The curve of Les Misérables dataset shows that the PD metric performs very well in comparison with other metrics. Football curves make it clear that the majority of combinations have very close performance. Moreover, the test shows that the best combination for this dataset is the combination of LHN with MRR. From Florida dataset results, we can sum up that the combination of RA and MRR provides the best accuracy.
We then compare our proposed metric Equation (13) against the state-of-the-art algorithms on eight datasets from different fields—using the maximum AUC found in
Table 3.
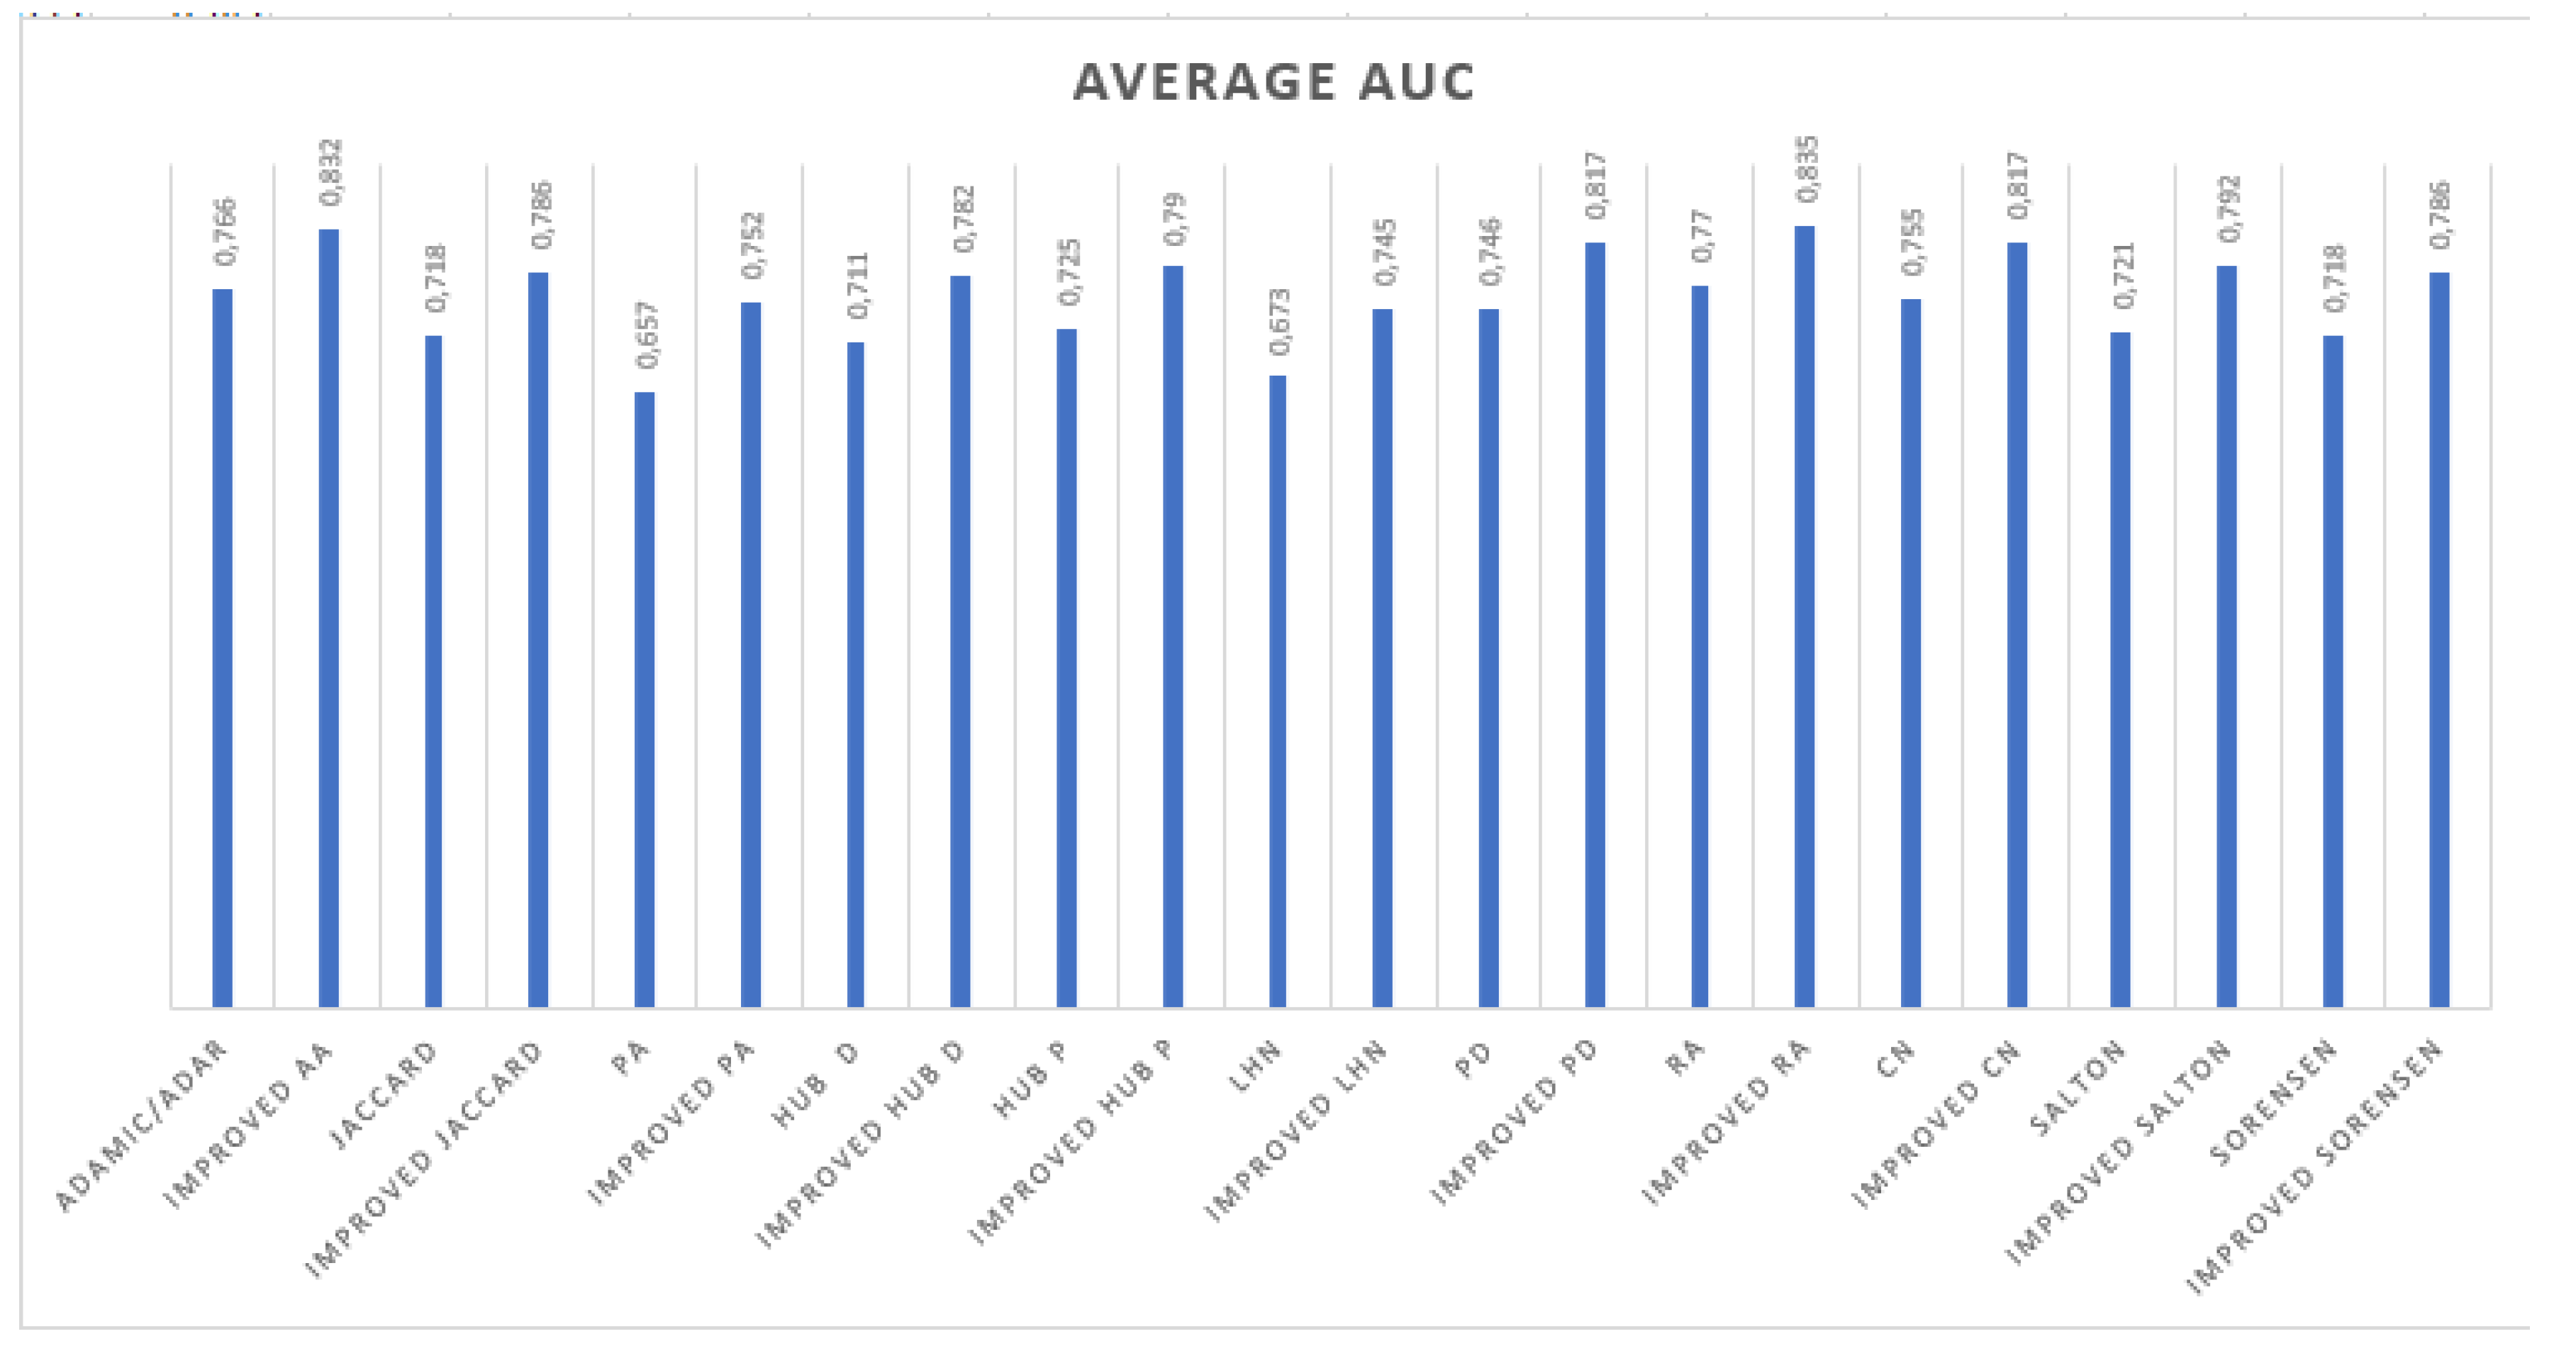
From
Table 4, we can draw the following conclusions: the improved version of the Jaccard metric offers a great enhancement in terms of accuracy. Furthermore, the average AUC value of the improved Jaccard is better than the average value of simple Jaccard by
in terms of AUC. The results of AA show that the improved version has refined the certainty of the algorithm for all datasets except for the Florida dataset. The improvement of the average value of AUC in all datasets was by
in the terms of AUC. We found that the improved version of AP amplifies the AUC results of the simple AP, for instance, the AUC of AP for Football dataset is 0.271 which is lower than pure chance, and the improved version reaches 0.864. For the Florida dataset, the overall improvement was by
on average, and the improved version of CN outperforms the simple version by
. The best improvement was
in the Power Grid dataset. The same conclusions can be drawn for the rest of algorithms, for the promoted hub the enhancement was
; for LHN, the enhancement was by
; RA was improved by
; and the Salton and Sorensen improvement was by
and
, respectively.
In
Figure 2, we calculate the mean of every row of
Table 4 to obtain the average AUC on all datasets. This allows us to globally compare the performance of every algorithm on all datasets.
According to the results of
Figure 2, we notice that for all algorithms, the improved version has a higher AUC average than the existing metrics. For the preferential attachment metric, the improved AP is superior by
. We can draw the same conclusion for the rest of metrics.
The experiment shows that the proposed metric outperforms the existing local metrics. Furthermore, it demonstrates that any local metric may be improved in terms of precision. As expected, our metric gives a higher score to links in the against the links in . Then, the probability that a link exists in the graph G(V,E) is high compared to a link from . For instance, in the Power Grid dataset, LM has while the proposed weighted combination reached .
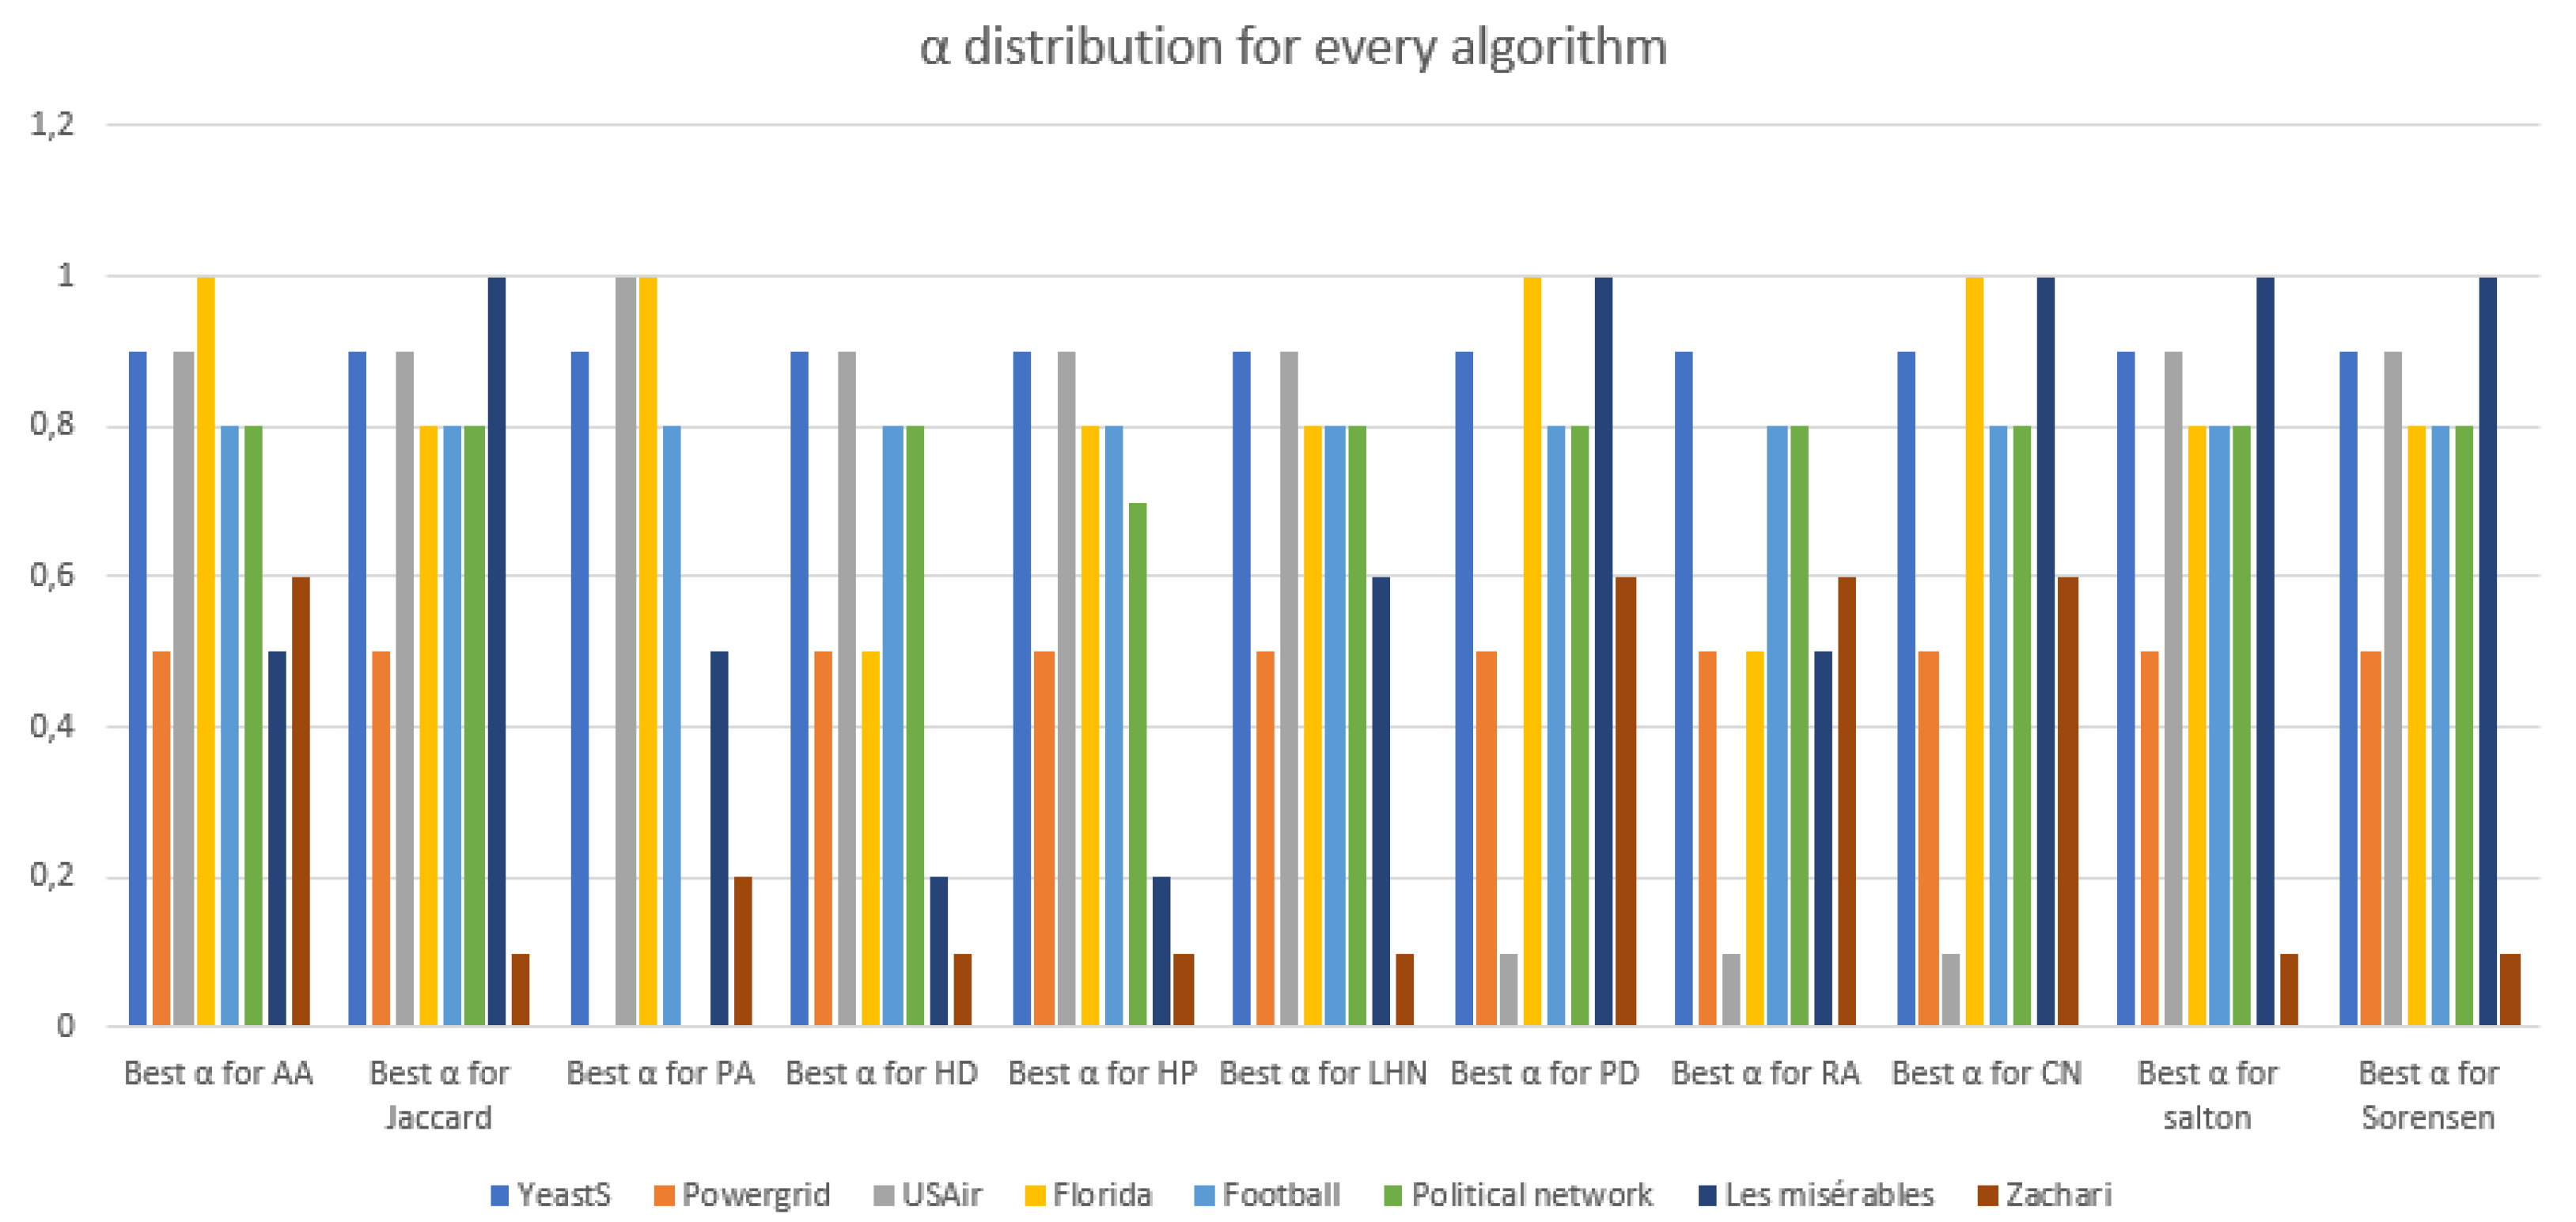
From
Figure 3, we can conclude that for the majority of datasets used to test the validity of our algorithm, the best
. Furthermore, we can notice that all the algorithms have the same
for the same dataset, for instance, the
is 0.9 for the YeastS network using all algorithms and 0.5 for all algorithms on Power Grid dataset. We then try to find a correlation between the
and any network feature presented in
Table 2.
From
Table 5 and using the rule of thumb, we can conclude that for AA and PA, we have a strong correlation between the
and the average degree of the networks. For Jaccard, hub depressed, hub promoted, LHN and Sorensen, we have moderately strong correlation with r. For the metrics PD, CN and Salton, we have a moderately strong correlation with H. The RA index is the only metric to have a moderately strong correlation with C. Consequently, the parameter
can be written as a product of the network feature and a constant. For instance,
for AA and PA.


