Article

Graph Analysis Using Fast Fourier Transform Applied on Grayscale Bitmap Images

1
Bugolka, 02-654 Warsaw, Poland
2
Department of IT in Management, University of Szczecin, 71-004 Szczecin, Poland
*
Author to whom correspondence should be addressed.
Information 2021, 12(11), 454; https://doi.org/10.3390/info12110454
Submission received: 15 September 2021 / Revised: 25 October 2021 / Accepted: 29 October 2021 / Published: 1 November 2021

Abstract

:
There is spiking interest in graph analysis, mainly sparked by social network analysis done for various purposes. With social network graphs often achieving very large size, there is a need for capable tools to perform such an analysis. In this article, we contribute to this area by presenting an original approach to calculating various graph morphisms, designed with overall performance and scalability as the primary concern. The proposed method generates a list of candidates for further analysis by first decomposing a complex network into a set of sub-graphs, transforming sub-graphs into intermediary structures, which are then used to generate grey-scaled bitmap images, and, eventually, performing image comparison using Fast Fourier Transform. The paper discusses the proof-of-concept implementation of the method and provides experimental results achieved on sub-graphs in different sizes randomly chosen from a reference dataset. Planned future developments and key considered areas of application are also described.

1. Introduction

Social networks play an essential role in everyone’s lives. People get involved in social networks for various reasons, such as leisure, hobby, or work. The last reason is especially valid in the context of development projects, during which online project management and collaboration platforms are often used, such as JIRA, Basecamp, Asana, or Trello. The social network data obtained from such platforms can be effectively used, e.g., to improve team structure and performance [1] or help in the information systems requirements elicitation process [2]. There is, similarly, a lot to be gained from the analysis of social networks formed by the end-users of information systems, for such purposes as identifying members of the social network [3], behavioral rules detection [4], pattern matching [5], predicting bias [6], planning the improvement of the infrastructure thanks to the identification of bottlenecks, extending the system functionality thanks to understanding trends in the system usage, improving user experience thanks to building user models, and many more [7]. The analysis of social networks can be done from multiple angles, such as complexity, structure, strength of ties, evolution, value concept, and social capital [8].
Many of the social network analysis methods use graph analysis as their base. As social network graphs may achieve a very large size, analyzing them often becomes a highly time-consuming process. This motivates the search for new time-efficient methods for graph analysis.
In this paper, we are particularly interested in the solution of problems in graph morphism. Our proposal deals directly with effectively obtaining a list of candidate solutions to the morphism problems rather than finding their exact solution. Our key idea is to treat graph structure as an image and use image comparisons in frequency domain to solve morphism problems.
Although we were directly motivated by the need to analyze user interactions in team collaboration platforms by identifying cliques and similarities in user behaviors that may adversely impact business processes (e.g., hurt software development quality and costs), the proposed method can as well be used for any other analytical purposes.
Our paper is structured as follows. First, we briefly present the problem of identifying graph morphisms. We discuss the key idea of our approach, which is the abstract representation of the sub-graph in the form of an image. Next, we skim through the image comparison methods that can be applicable in this context. A proof-of-concept solution is described in Section 4. The final section of the paper summarizes the findings, and the steps to follow next are given.

2. Identifying Graph Morphisms

The problem of identifying graph morphisms is usually solved by a time- and memory-expensive algorithm [9] or various application-specific algorithms, such as Frequent Subgraph Mining (FSM) algorithms [10]. There is especially active research dedicated to solving the problem of isomorphism. This problem is known to belong to the NP class of problems. It can be solved using Ullman’s algorithm [9], whose main operation consists in matching pair generation by adding and removing edges from the analyzed graph. It is a time-expensive algorithm as any failure to identify a matching edge requires returning to the previous choice and continuing with the next iteration by adding another edge. When processing massive, big data graphs (like social media graphs) whose size keeps growing with every year, reducing execution time and memory consumption becomes a concern of increasing importance.
This concern has been addressed, to some extent, by FSM algorithms. These can be split into three categories: candidate generation strategy, search strategy, or frequency counting. Candidate generation strategy extracts candidate sub-graphs to check how feasible is probed vertex in terms of morphism determination. Search strategy determines the order of vertices to be visited. Frequency counting is related to the identification of the occurrence of the sub-graphs in the graph.
Candidate generation of various algorithms [11,12,13,14] operates on approximation. The approximation might be represented by identifying sub-graphs that partially match the chosen sub-graph with one from a probed vertex. Having a smaller population of candidates for exact graph matching reduces computational time spent on exact morphism calculation. These methods operate on sub-graph models and create various possible options. They all operate on graphs rather than breaking the problem into more generic objects. The overall process of possible candidate generation leads to a considerable population of potential candidates for each sub-graph. In practice, any further analysis requires recalculation of the candidates’ population whenever there is a change in a sub-graph associated with a probed vertex. A different solution is needed to address the temporal aspect of big data applications, where vertices and edges are constantly modified in the graph (added or removed). The analysis of each potential candidate sub-graph in such detail by existing algorithms is infeasible, especially that the sub-graph analysis has to be performed in many viewpoints simultaneously.
The development of the method proposed here stems from the idea that generated candidate population can be shared between various potentially available vertices in the graph. This approach requires an abstract generation of candidate sub-graph populations from the comparison and matching processes. Instead of building sub-graphs in the context of a matching graph, where edges are added and removed in matching perspective, the candidate sub-graph generation must always proceed independently. As part of the preliminary research, it was found that an alternative representation of sub-graphs could help make the matching process more efficient. This approach is adopted in the proposed method and will be described in the following section.

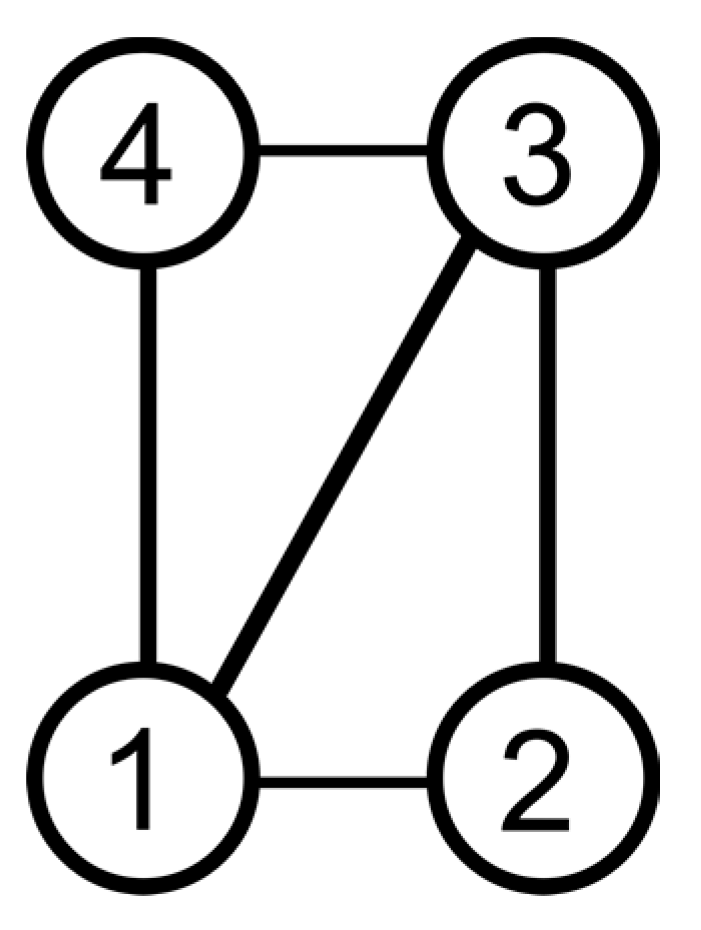
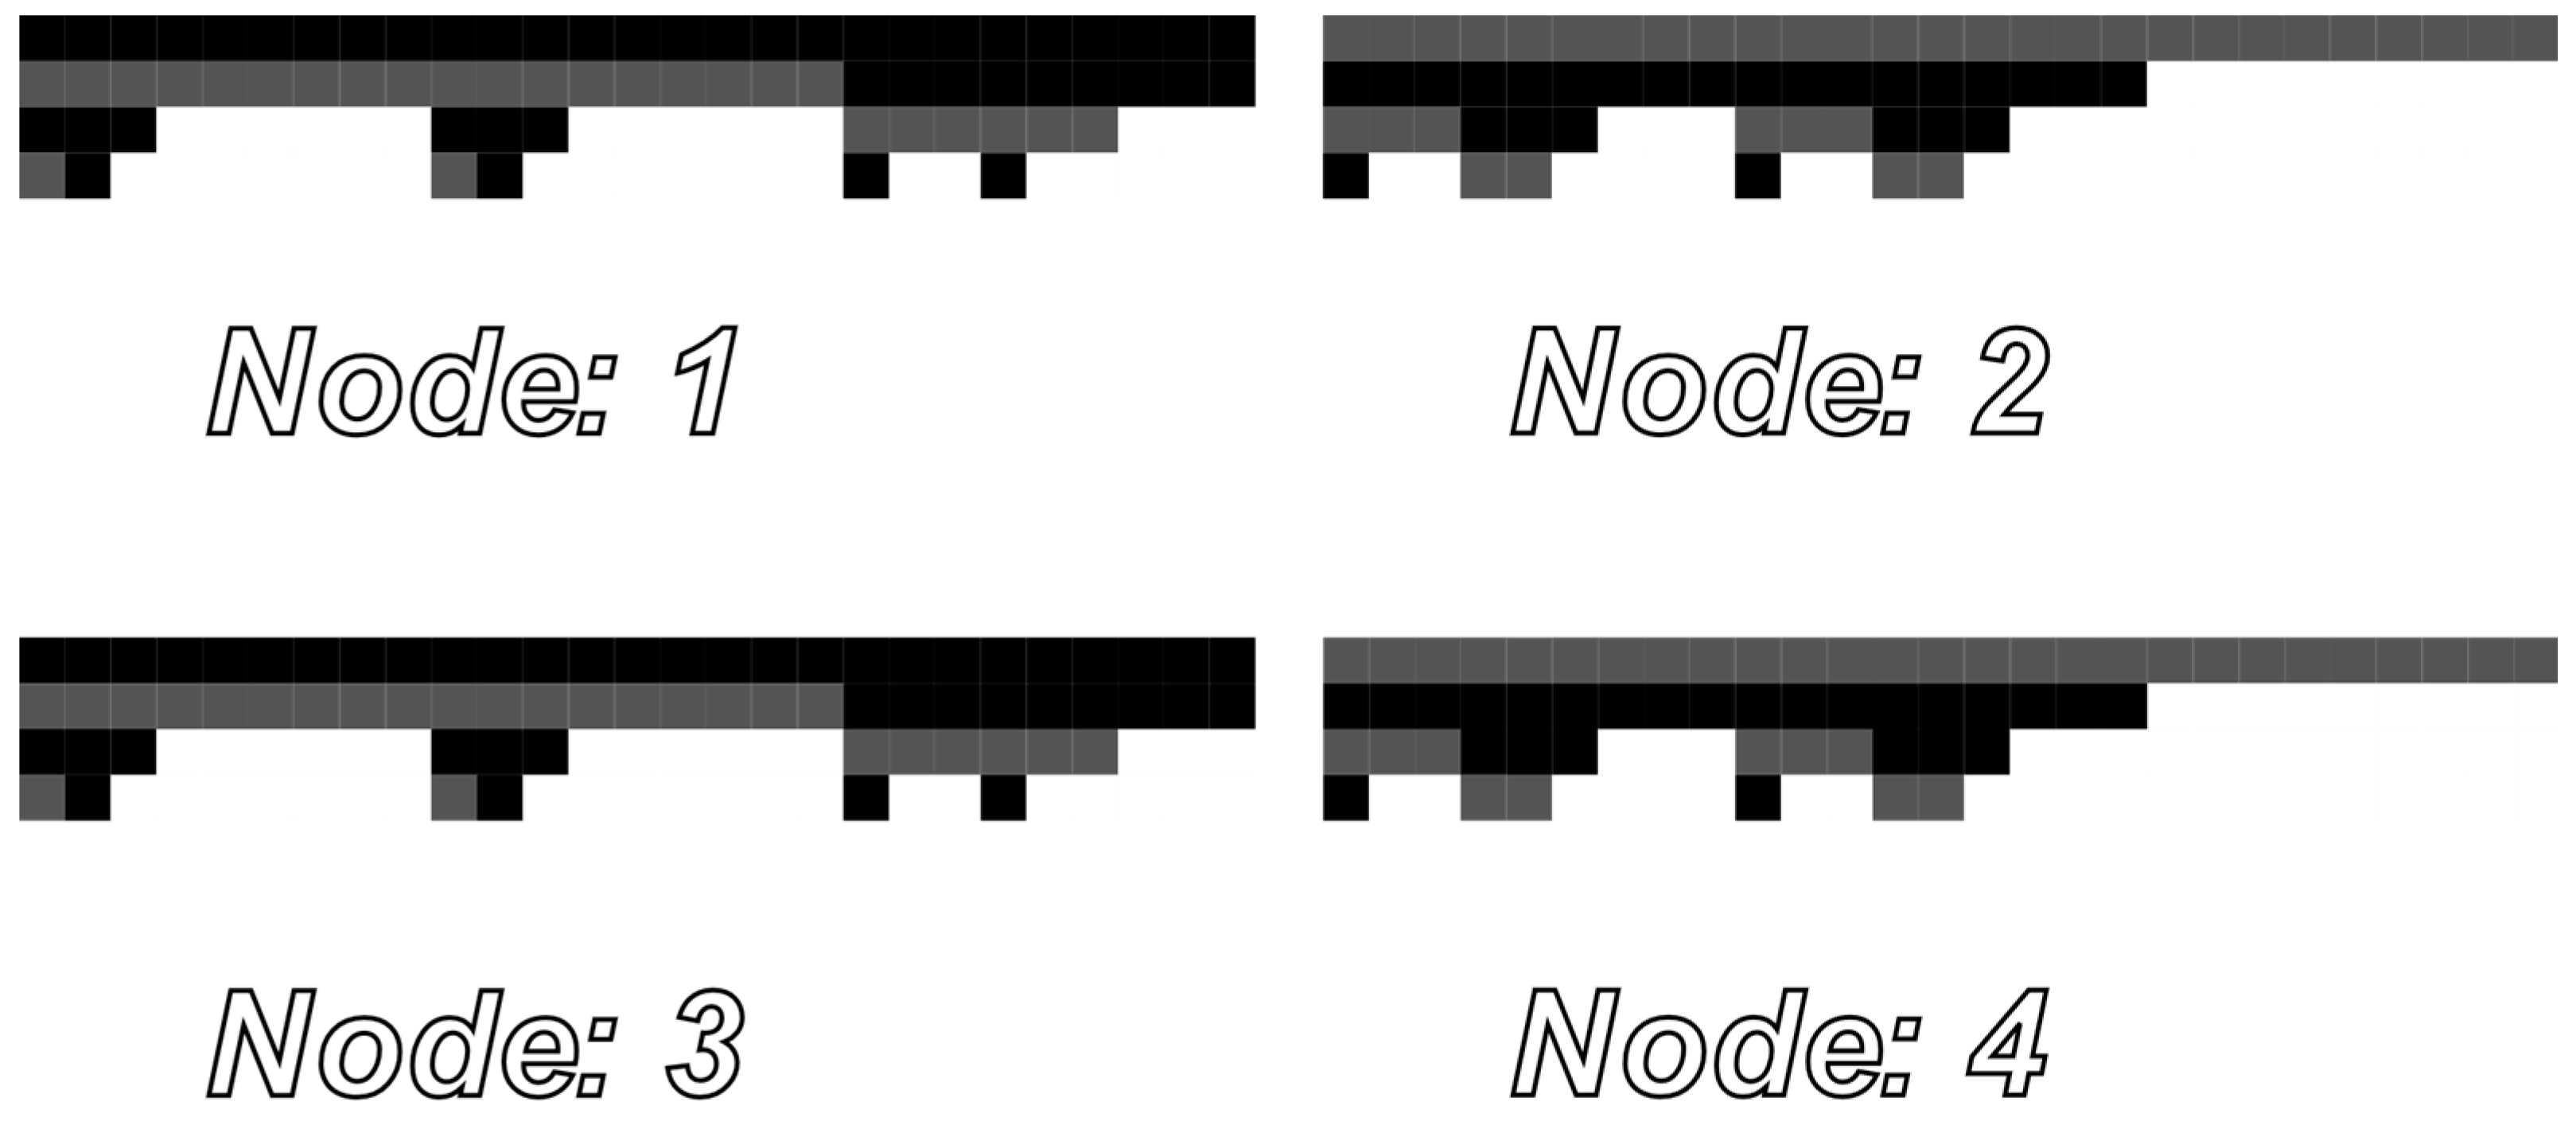
3. Sub-Graph Representation Using a Bitmap Image

Before we proceed to description of the procedure leading to the solution of the candidate generation strategy, we shall first discuss the characteristics of sub-graph representation and how it is central to the discussed solution.
Candidate generation strategy must have the following properties: context-independent, repeatable (creating the canonical form), comparable, and configurable. We assume that sub-graph representation must be generated in an abstraction of application. The sub-graph representation has to be generated in the same manner for nodes within the same graph as for nodes from other graphs. Having a context-independent representation has several advantages stemming from being usable in different applications and regardless of the actual implementation. The single way of representation allows checking various morphisms, e.g., isomorphism or homomorphism. From an implementation perspective, candidates can be calculated just once and then re-used. Re-use can be materialized by a persistence layer (for example, using in-memory cache) or be incorporated in actual morphism algorithms implementation.
Candidate generation must give the same results over multiple iterations and comparisons to a different target node. The sub-graph representation must be computationally feasible to compare. The representation should have well-known algorithms available for that purpose with a complexity of less than the exponential growth rate. Finally, the representation must be configurable to the target application.
The proposed solution has two representation components: sub-graph structure and vertex degree. Sub-graph structure representation is configurable using a threshold value. The threshold value represents the depth of the sub-graph traversal. All vertices connected to the probed vertex are visited until a given depth level is reached. From the probed vertex, a tree-like structure is built. The probed vertex becomes the parent node in a tree. Its neighbors become children in the tree. For each child, the structure is repeated, where its neighbors in the graph (excluding parent node) become its children. The structure-building process repeats until the target depth of sub-graph transition is reached. The candidate generation process will create the same structure for graphs with loops, as any loops in the graph are represented by a duplicate representation of the same vertex in the tree.
If all children nodes in the generated tree are sorted by their degree, the process becomes repeatable. Vertex degree representation is also used for tree node labeling with the maximal degree in the graph. The maximal degree can be calculated using all nodes in graphs or assigned as an input parameter of arbitrary value (i.e., according to the expected graph structure or tailored to the target computing environment).
There are multiple ways to represent a graph. It could be a graphical form with vertices drawn as circles and lines as edges (see Figure 1), an adjacency matrix, or an adjacency list. All forms rely on placing the vertices, which turns into another well-known problem consisting of checking if a graph is planar. Here, we propose to use a bitmap image as a representation of the tree-like structure discussed above. This has the obvious advantage of unifying structure representation without introducing additional computational complexity.
If the structure is represented as a bitmap, there are two aspects of image representation to consider: size and color. The size of the bitmap is related to the two parameters: depth threshold (t) and maximal degree (d). In this paper, we assume that the height of the bitmap is t + 1, while the width is d^(t + 1). The tree structure determines the bitmap contents. Each line in a bitmap represents a level in a tree from its parent perspective; therefore, the first line becomes a representation of the root node. The second line is equally split into parts. The number of parts is equal to a maximal degree. Each part becomes a representation of a child in the tree. If fewer children are in the tree than the maximal degree, the remaining parts are left blank. In the next line, the process repeats. Each new part of the line is split into the same number of parts, and in the last line, each node in a tree is represented by a part of size one. A color is assigned to each part of the bitmap, representing the value of the quotient of node degree and maximum degree.
The use of bitmap image representation for each node brings the following advantages:
  • Bitmap image can be used regardless of the target morphism graph calculation.
  • The same bitmap image generation rules applied for the same sub-graphs must give the same results, including the same size.
  • There are many image comparison methods developed and available for use.
  • It is possible to generate bitmap images for vertices using a given threshold.
Regarding the last point, from an implementation perspective, respective bitmap images can be persisted between various morphism calculations to make calculations taking less time between various morphism calculations [15]. In the actual implementation, thresholds can be defined depending on the target application. The height of the bitmap associated with a threshold can be set accordingly to the graph characteristics. A relatively small maximal degree and an equally distributed degree of vertices might be a reason to set a higher threshold value. This would result in images with a bigger size and more accurate graphical representation at the cost of requiring additional computational resources. In the opposite situation, if the allocated system resources are constrained, the prefiltering of vertices might be an option to reduce the width of the bitmap. Considering a situation in which a graph contains outliers in node degree, they can be safely removed to significantly reduce the width of the generated bitmaps and thus memory consumption. Similarly, reducing the number of possible colors might result in smaller memory structures (e.g., taking 16 instead of 64 bits per element). The tuning of such parameters can be essential in finding an adequate trade-off between the quality of the results and the memory and computational time needed for processing.

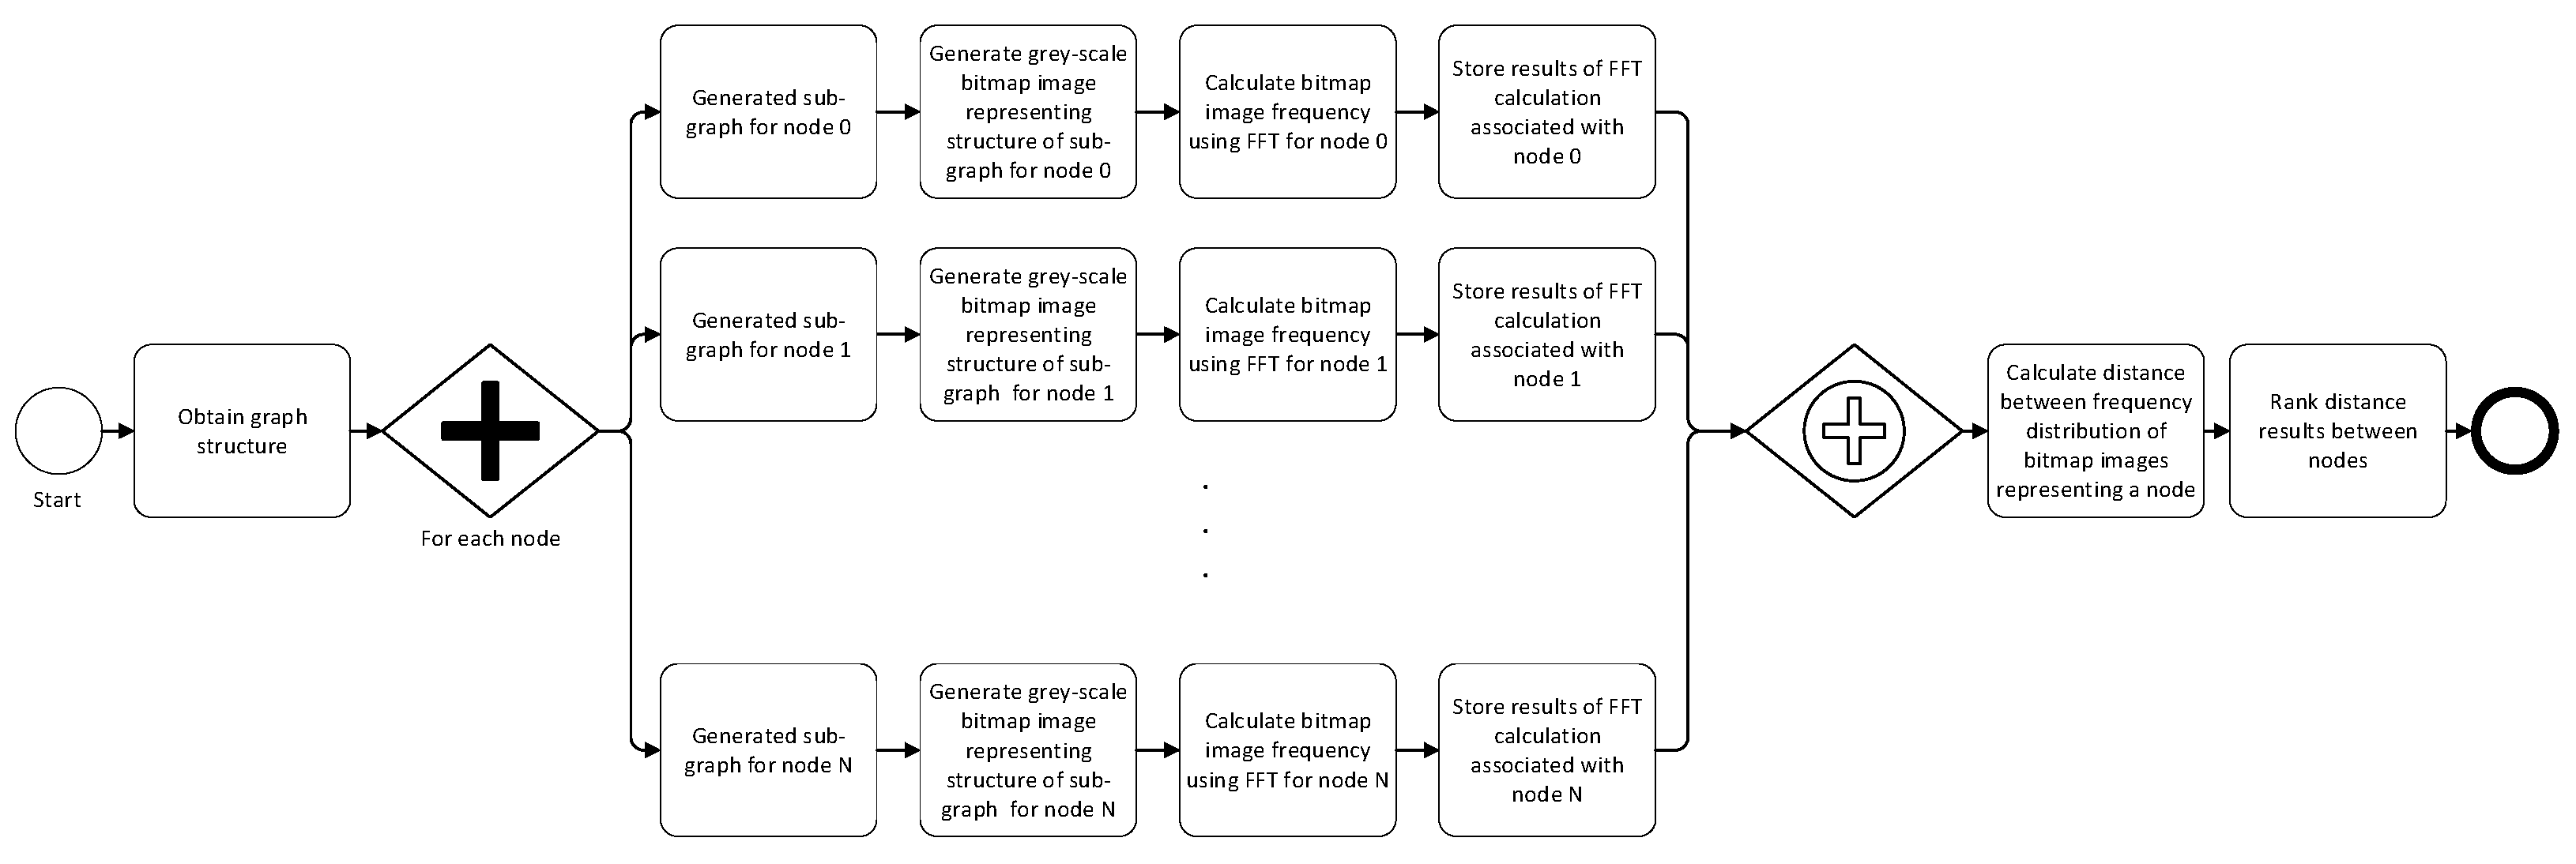
4. Image Comparison Algorithm

Many algorithms are dedicated to image comparison, starting from simple ones, based on pixel-by-pixel color comparison, to more advanced methods, developed in computer vision and artificial intelligence. In this section, we shall not go into a full review of the available methods, but we shall focus only on the image comparison chosen for the proposed method. The choice was made considering bitmap image generation characteristics, which is the point we start at.
The proposed bitmap image representation has the overall shape as a two-dimensional matrix with a content characterized by shape and color. Generated shapes are in triangular forms. The proposed method does not need to recognize objects, so there is no need to apply computer vision algorithms to perform such a task.
The single value of each cell in the bitmap image contains a single number, which simplifies various aspects of further processing (see Figure 2).
Shape and color comparisons are two vital aspects of bitmap image matching. Each horizontal and vertical line can be interpreted as a one-dimensional array with color values in each cell. Values of those cells can be interpreted as signal values. Signals that may change over time with a frequency can be represented as functions. Having a function that represents frequency factors allows the image to be processed using existing frequency processing methods. Two basic frequency analysis methods are Discrete Cosine Transform (DCT) and Discrete Fourier Transform (DFT). The definition of DFT is n = 0 N 1 x ( n ) W N n k where n, N, k are integer numbers, W n = e j 2 π / N , j = 1 2 , the basis functions are the N roots of unity [16].
DFT is the base calculation component of the proposed method, whose practical implementation is based on the Fast Fourier Transform (FFT), an umbrella set of algorithms effectively implementing DFT. Here, FFT is used as a black-box function to transform a two-dimensional bitmap image into the frequency domain. Applying the two-dimensional FFT is also a two-dimensional array that can be further processed as an abstraction of a bitmap image.
Discussion about applying specific signal processing algorithms for image processing (FFT or substitutes [17]) is not out of scope for this research. The choice of a particular image analysis algorithm may significantly impact the performance or introduce additional requirements for the bitmap image (i.e., some algorithms may be optimized for input arrays being square or having dimension size in the power of two). There are many examples of using FFT to solve image matching challenges [18,19]. Early experiments gave positive results of using FFT in bitmap image comparison, which resulted in choosing FFT for the method proposed here.
In the proposed method, the results of the two-dimensional FFT for a given vertex and a probed vertex are checked for their statistical relationship. Multiple measures can be used to measure the distance between factors of two matrices. The expected measure must accept two two-dimensional matrices as its parameters and provide a distance measure as its result. The lower the value, the more considerable similarity between the compared matrices exists. If both matrices contain the same values, the output value should be zero, meaning no distance. In the described proof-of-concept implementation, the Euclidean measure has been used, where the distance between two matrixes (A and B indexed respectively by i and j) is expressed as i ,   j a b s ( A i , j B i , j ) 2 .
The distinct steps of the overall algorithm are presented in Figure 3. Each step of the algorithm can be implemented in a way tailored to the target application. The steps related to a sub-graph derived from a single node (see the middle section of the diagram) can be executed in parallel to reduce processing time.

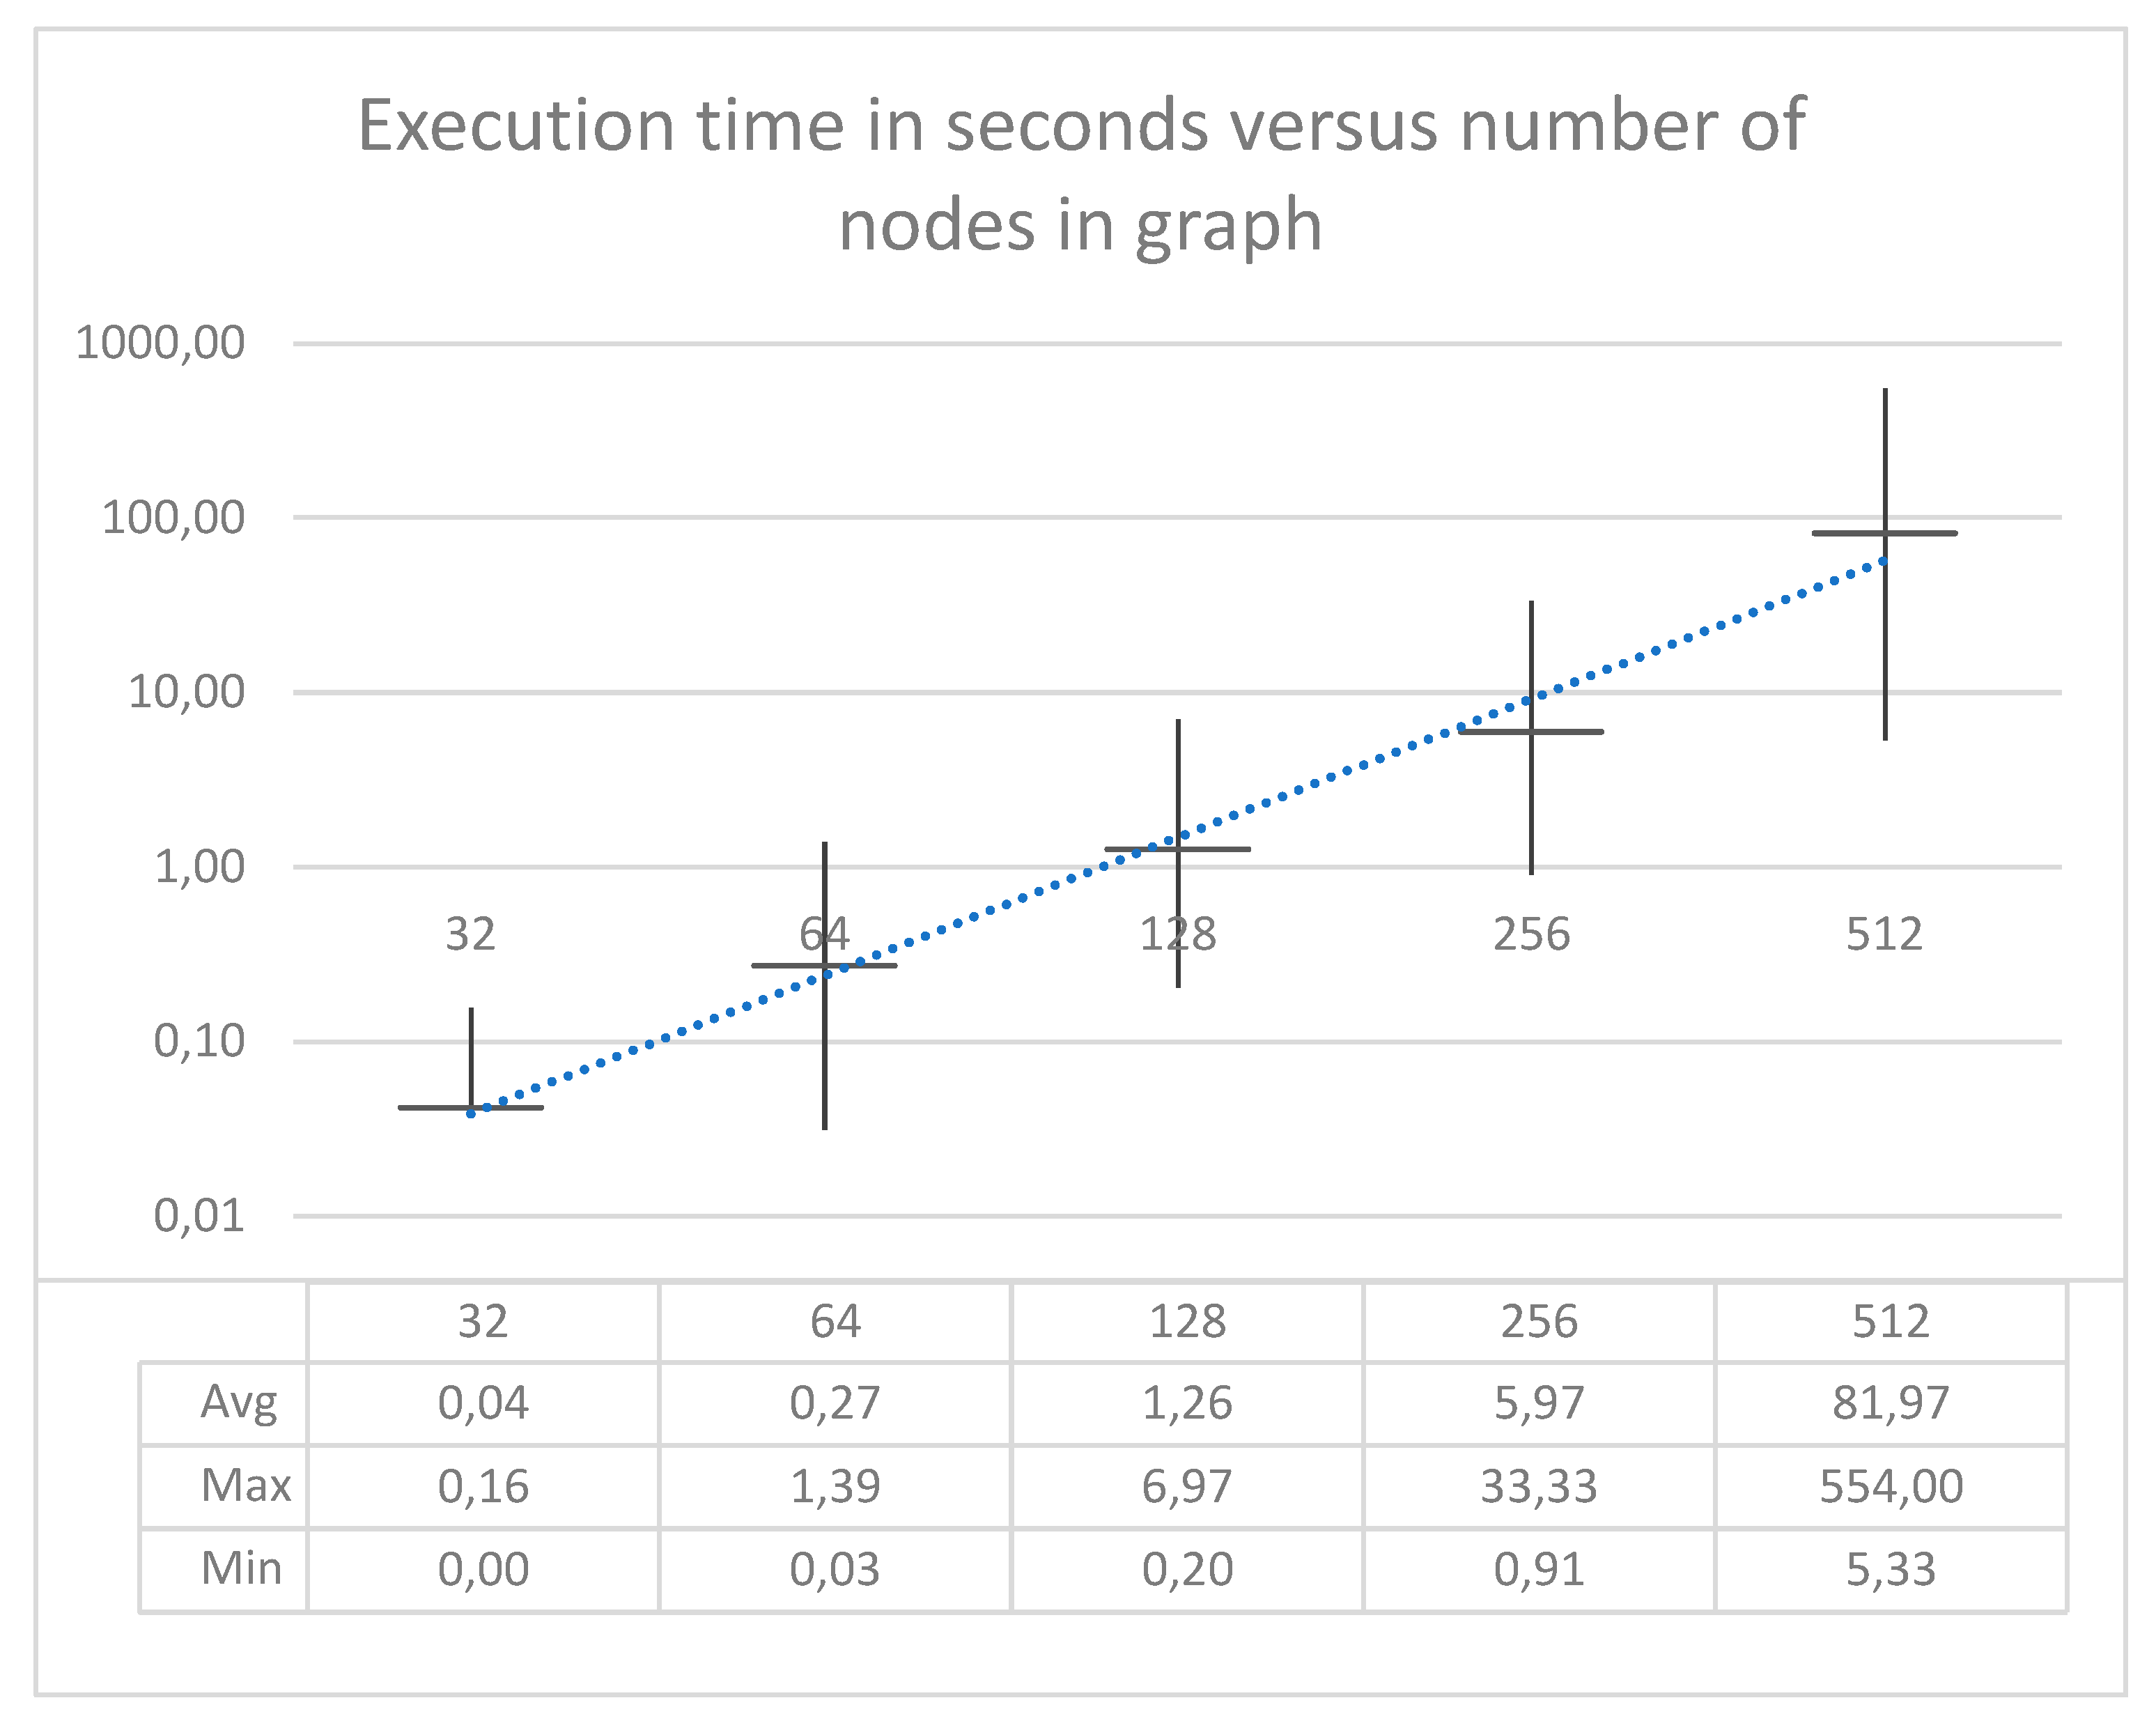
5. Proof-of-Concept Implementation

A proof of concept for the proposed method was implemented, and simple experiments were performed. The details are presented below.
The algorithm was implemented in Python 3 AMD64 environment using dedicated libraries for the most complex calculations. Graph processing (parsing raw files, the transformation of graphs, calculating maximum degree, graph traversal) was implemented using the NetworkX library [20]. The FFT implementation of the SciPy library was used [21]. The entire code was written as a Python library with additional scripts for running various tests and performing utilitarian functions (i.e., visualization of the bitmap images). No caching was implemented in the proof-of-concept script.
The main experiments were performed using well-known datasets acquired from the Stanford Network Analysis Project [22]. In the discussed experiment, the DBLP (Computer Science bibliography) sample was used. In each experiment, a sub-graph was randomly extracted for a given number of vertices. The outcome was a Cartesian matrix with distances between all vertexes (i.e., for 32 vertexes, there are 1024 pairs to be measured for distance). Tests were evaluated multiple times to emulate real-life applications.
All tests were run on the same machine with Ryzen 3 3200, 64 GB of RAM (2400 MHz), and SSD running Windows 10 Professional 64-bit. The threshold for tests presented in Figure 4 was three, and the maximum degree of the graph was calculated using a random sub-graph sample.
Figure 4 shows the algorithm execution times in seconds (Avg stands for average, Max for maximum, and Min for minimum) measured for 16 runs each on sub-graphs of various sizes (with 32, 64, 128, 256, and 512 vertexes, respectively).
The dotted line shows the regression function built on top of raw data. Due to the skewed distribution of the average, a logarithm-based scale was used to visualize the regression results. The visible regression seems to confirm the relationship between the number of analyzed vertexes and execution time. Overall computational complexity must be carefully analyzed, and it goes beyond the scope of this paper, but it depends on the complexity of each step of the algorithm. Most of the steps are related to the two-dimensional matrix transformations and have respectively polynomial complexity related to the size of the matrix (i.e., up to the width of the matrix multiplied by its height). There is an extraordinary step of calculating the two-dimensional FFT related to the size of the matrix processed. In this case, it is related to the size of the image, thus: d t + 1 multiplied by t, where t is depth threshold, and d is maximal degree. As two-dimensional FFT has quasilinear complexity, the overall complexity of the FFT steps in this algorithm is:
T ( t ,   d ) = t   d t + 1 log ( t   d t + 1 ) .
In order to compare the running times of the proposed method to the BLISS [23] software library representing the current state of the art in automorphism algorithms, another experiment has been performed. In it, the Flower Snark [24] J 5 graph, which contains 20 vertices and 30 edges, has been used as the benchmark dataset. The tests were run on the same machine using the same Python environment. Version 2.7.18 of BLISS was used via the PyBliss (Python wrapper around the BLISS library) version 0.5 beta. Tests were repeated five times in the same operating conditions; PyBliss had average runtimes of 1212 microseconds, and the proposed method had an average of 998 microseconds. It shows that even though our proof-of-concept implementation has not been optimized in any way, and it did not even exploit the opportunity of parallel execution of the key stage of the procedure, it managed to outperform the well-known algorithm.

6. Conclusions and Future Work

Graphs are important elements of modern social network analysis [25]. Much research was done to identify efficient ways of checking graph morphism. This paper presents a novel approach to address this problem based on bitmap image generation and processing. The novelty of the proposed algorithm lies in the combined use of representation of graph as an image, image comparison, and frequency analysis.
We have experimentally proven the method to be operational. We have developed its proof-of-concept implementation and evaluated it using multiple random sub-graphs chosen randomly from a well-known dataset. Even the initial experimental time measurements compare favorably with the existing algorithms, although the known optimization opportunities were not exploited in the first implementation of our method.
The obtained results are promising, although we are aware that the presented method in its current form is not suitable for graphs with a high number of loops. It produces many false positives in the generated candidate population. Therefore, our future work will be to extend it with special handling for graphs with many loops to address this known weak point.
The purpose of the described implementation was to prove that the method works. For real-life applications on big-data sets, there is a need to implement it in a distributed environment. One of the options considered from an implementation perspective is to use a map-reduce solution, where each portion of data (i.e., sub-graph structure) is passed to a computational node with a program that generates a bitmap image, calculates the FFT, and stores the results. To gain the most performance from the proposed method, the use of distributed processing and cache would be necessary. However, such an implementation is not trivial, as pre-caching bitmaps and its FFT results to reduce the time for costly recalculations creates a problem with cache invalidation whenever a change to the sub-graph structure occurs.
The authors plan to apply the presented method to analyze user interactions in business collaboration software applications (particularly ticket management systems) to identify cliques and similarities in user behaviors that may adversely impact business processes (i.e., software development quality and costs). Random human factors may shape the interaction graphs, so that exact graph matching algorithms may be considered irrelevant, whereas graph morphism approximation might become the necessary choice [25].
On a more general level, the presented positive results of applying signal frequency processing algorithms to graph data inspired the authors to look for other possible applications. One such idea is to build a graph query engine using bitmap image representation of graphs and FFT analysis.

Author Contributions

Conceptualization, P.B.; methodology, P.B. and J.S.; software, P.B..; validation, P.B.; formal analysis, P.B.; investigation, P.B.; resources, P.B.; writing—original draft preparation, P.B. and J.S.; writing—review and editing, J.S. and P.B.; visualization, P.B. All authors have read and agreed to the published version of the manuscript.

Funding

This research received no specific grant from any funding agency.

Data Availability Statement

The data that support the findings of this study are available from the corresponding author, P.B., upon reasonable request.

Conflicts of Interest

The authors declare no conflict of interest.

References

  1. Yang, H.-L.; Tang, J.-H. Team structure and team performance in IS development: A social network perspective. Inf. Manag. 2004, 41, 335–349. [Google Scholar] [CrossRef]
  2. Avesani, P.; Bazzanella, C.; Perini, A.; Susi, A. Supporting the Requirements Prioritization Process. A Machine Learning Approach. Available online: https://www.researchgate.net/profile/Anna-Perini-2/publication/221390930_Supporting_the_Requirements_Prioritization_Process_A_Machine_Learning_approach/links/00463519e064cd7643000000/Supporting-the-Requirements-Prioritization-Process-A-Machine-Learning-approach.pdf (accessed on 28 October 2021).
  3. Wu, W.; Xiao, Y.; Wang, W.; He, Z.; Wang, Z. K-Symmetry Model for Identity Anonymization in Social Networks. In Proceedings of the 13th International Conference on Extending Database Technology, Lausanne, Switzerland, 22–26 March 2010; pp. 111–122. [Google Scholar]
  4. Leung, C.W.; Lim, E.-P.; Lo, D.; Weng, J. Mining Interesting Link Formation Rules in Social Networks. In Proceedings of the 19th ACM International Conference on Information and Knowledge Management, Toronto, Canada, 26–30 October 2010; pp. 209–218. [Google Scholar]
  5. Gacitua-Decar, V.; Pahl, C. Structural Process Pattern Matching Based on Graph Morphism Detection. Int. J. Softw. Eng. Knowl. Eng. 2017, 27, 153–189. [Google Scholar] [CrossRef]
  6. Szanto, A. Defuse the News: Predicting Misinformation and Bias in News on Social Networks via Content-Blind Learning. Available online: https://dash.harvard.edu/bitstream/handle/1/38811538/SZANTO-SENIORTHESIS-2018.pdf?sequence=3&isAllowed=y (accessed on 28 October 2021).
  7. Bonchi, F.; Castillo, C.; Gionis, A.; Jaimes, A. Social Network Analysis and Mining for Business Applications. ACM Trans. Intell. Syst. Technol. 2011, 2, 1–37. [Google Scholar] [CrossRef]
  8. Shiau, W.-L.; Dwivedi, Y.K.; Yang, H.S. Co-citation and cluster analyses of extant literature on social networks. Int. J. Inf. Manag. 2017, 37, 390–399. [Google Scholar] [CrossRef] [Green Version]
  9. Ullmann, J.R. An Algorithm for Subgraph Isomorphism. J. ACM 1976, 23, 31–42. [Google Scholar] [CrossRef] [Green Version]
  10. Jiang, C.; Coenen, F.; Zito, M. A survey of frequent subgraph mining algorithms. Knowl. Eng. Rev. 2013, 28, 75–105. [Google Scholar] [CrossRef] [Green Version]
  11. Chen, C.; Yan, X.; Zhu, F.; Han, J. GApprox: Mining Frequent Approximate Patterns from a Massive Network. In Proceedings of the Seventh IEEE International Conference on Data Mining (ICDM 2007), IEEE, Omaha, NE, USA, 28–31 October 2007; pp. 445–450. [Google Scholar] [CrossRef]
  12. Wang, X.; Huan, J.; Smalter, A.; Lushington, G.H. G-Hash: Towards Fast Kernel-Based Similarity Search in Large Graph Databases. In Graph Data Management: Techniques and Applications; Sakr, S., Pardede, E., Taniar, D., Eds.; Advances in data mining and database management; IGI Global: Hershey, PA, USA, 2012; pp. 176–213. [Google Scholar] [CrossRef]
  13. Yan, X.; Yu, P.S.; Han, J. Graph Indexing. In Proceedings of the 2004 ACM SIGMOD International Conference on Management of Data-SIGMOD ’04, Paris, France, 14–16 June 2004; ACM Press: New York, NY, USA, 2004; p. 335. [Google Scholar] [CrossRef]
  14. Zhang, S.; Yang, J. RAM: Randomized Approximate Graph Mining. In Scientific and Statistical Database Management; Ludäscher, B., Mamoulis, N., Eds.; Springer : Berlin/Heidelberg, Germany, 2008; pp. 187–203. [Google Scholar] [CrossRef]
  15. Yuan, Z.; Li, F.; Zhang, P.; Chen, B. Description of shape characteristics through Fourier and wavelet analysis. Chin. J. Aeronaut. 2014, 27, 160–168. [Google Scholar] [CrossRef] [Green Version]
  16. Burrus, C.S. Fast Fourier Transforms. OpenStax CNX. 2012. Available online: http://cnx.org/contents/[email protected] (accessed on 28 October 2021).
  17. Mantoro, T.; Alfiah, F. Comparison Methods of DCT, DWT and FFT Techniques Approach on Lossy Image Compression. In Proceedings of the 2017 International Conference on Computing, Engineering, and Design (ICCED), Kuala Lumpur, Malaysia, 23–25 November 2017; pp. 1–4. [Google Scholar] [CrossRef]
  18. Ye, Y.; Bruzzone, L.; Shan, J.; Bovolo, F.; Zhu, Q. Fast and Robust Matching for Multimodal Remote Sensing Image Registration. IEEE Trans. Geosci. Remote Sens. 2019, 57, 9059–9070. [Google Scholar] [CrossRef] [Green Version]
  19. Zhang, Z.; Chen, J.; Li, X.; Li, W.; Yuan, W. An Image Matching Method Based on Fourier and LOG-Polar Transform. Sens. Transducers 2014, 169, 61. [Google Scholar]
  20. Scellato, S. NetworkX: Network Analysis with Python. 2010. Available online: https://www.cl.cam.ac.uk/~cm542/teaching/2010/stna-pdfs/stna-lecture8.pdf (accessed on 28 October 2021).
  21. Virtanen, P.; Gommers, R.; Oliphant, T.E.; Haberland, M.; Reddy, T.; Cournapeau, D.; Burovski, E.; Peterson, P.; Weckesser, W.; Bright, J.; et al. SciPy 1.0: Fundamental algorithms for scientific computing in Python. Nat. Methods 2020, 17, 261–272. [Google Scholar] [CrossRef] [PubMed] [Green Version]
  22. Yang, J.; Leskovec, J. Community-Affiliation Graph Model for Overlapping Network Community Detection. In Proceedings of the 2012 IEEE 12th International Conference on Data Mining, Brussels, Belgium, 10–13 December 2012; IEEE: Manhattan, NY, USA; pp. 1170–1175. [Google Scholar] [CrossRef]
  23. Junttila, T.; Kaski, P. Engineering an Efficient Canonical Labeling Tool for Large and Sparse Graphs. In Proceedings of the Ninth Workshop on Algorithm Engineering and Experiments (ALENEX), New Orleans, LA, USA, 6 January 2007. [Google Scholar]
  24. Isaacs, R. Infinite Families of Nontrivial Trivalent Graphs Which Are Not Tait Colorable. Am. Math. Mon. 1975, 82, 221–239. [Google Scholar] [CrossRef]
  25. Majeed, A.; Rauf, I. Graph Theory: A Comprehensive Survey about Graph Theory Applications in Computer Science and Social Networks. Inventions 2020, 5, 10. [Google Scholar] [CrossRef] [Green Version]
Figure 1. Exemplary simple graph having four nodes and five edges.
Information 12 00454 g001
Figure 2. Image bitmaps generated from four vertices of the simple graph presented in Figure 1.
Information 12 00454 g002
Figure 3. The visual representation of the proposed algorithm flow using BPMN.
Information 12 00454 g003
Figure 4. Sub-graph size versus execution time.
Information 12 00454 g004
Publisher’s Note: MDPI stays neutral with regard to jurisdictional claims in published maps and institutional affiliations.

