Article

Spatial Pattern and Influencing Factors of Outward Foreign Direct Investment Enterprises in the Yangtze River Economic Belt of China

1
School of Civil Engineering and Architecture, Suqian University, Suqian 223800, China
2
Research Center of Canal Ecological Civilization, Suqian Branch of Grand Canal Cultural Belt Construction Research Institute, Suqian 223800, China
3
School of Urban and Environmental Science, Huaiyin Normal University, Huai’an 223300, China
4
Key Research Base of Philosophy and Social Sciences of Colleges & Universities in Jiangsu Province, Research Institute of Huai River Eco-Economic Belt, Huai’an 223300, China
5
College of Architecture & Design, Chung Hua University, Hsinchu 30012, Taiwan
6
Department of Civil, Environmental and Architectural Engineering, Korea University, Seoul 02841, Korea
*
Authors to whom correspondence should be addressed.
Information 2021, 12(9), 381; https://doi.org/10.3390/info12090381
Submission received: 16 July 2021 / Revised: 8 September 2021 / Accepted: 16 September 2021 / Published: 18 September 2021

Abstract

:
This paper studies outward foreign direct investment (OFDI) enterprises in the Yangtze River Economic Belt. Using geographical information system (GIS) spatial analysis and SPSS correlation analysis methods, it analyzes the change in the spatial distribution of OFDI enterprises in 2010, 2014, and 2018. It explores the influencing factors that have an impact on this change. The results show the following: (1) The geographical distribution of OFDI enterprises in the Yangtze River Economic Belt is uneven. In the downstream region, OFDI enterprises have significant advantages in both quantity and quality over those in the mid- and up-stream regions. In recent years, a multi-core spatial pattern has gradually emerged. (2) The factors influencing the spatial distribution of OFDI enterprises have been gradually changing from one dominant factor, i.e., technological innovation capability, to four core factors, namely, urbanization level, economic development level, technological innovation capability, and degree of economic openness. The research results serve as an important reference for future policy adjustment in the Yangtze River Economic Belt. First, the Yangtze River Economic Belt should adjust industrial policies; comprehensively increase the level of OFDI; accelerate the upgrading and transformation of regional industries; and, at the same time, inject vitality into the development of the world economy. Moreover, the downstream region should fully play a leading role in the Yangtze River Economic Belt, especially in encouraging OFDI enterprises to establish global production networks. Meanwhile, enterprises in the upstream region are encouraged to establish regional production networks to accelerate the development of inland open highlands.

1. Introduction

Since the reform and opening up in 1978, China has achieved rapid economic growth by attracting foreign investment. China is now the second largest economy in the world. In recent years, with the rapidly rising cost of general production factors, China’s ability to attract foreign investment has been weakening, and its economic development has entered a “new normal” stage. Expanding outward foreign investment to rationally allocate resources on a global scale for the acquisition of development dividends from other fast-developing countries is an important measure for China to achieve further innovative development in this new stage [1,2,3].
Pursuing sustainable development under the “new normal”, the Chinese government launched the “One Belt One Road” initiative [4,5]. After the National Development and Reform Commission issued the “Vision and Actions for Promoting the Joint Construction of the Silk Road Economic Belt and the 21st Century Maritime Silk Road” in 2015 [6], China’s OFDI ushered in a new era. China is learning from the concept of the ancient Silk Road to promote regional and continental interconnection in the modern context [7,8,9]. The “One Belt One Road” project of cross-border infrastructure has also greatly enhanced China’s international image and soft power [10,11]. Through OFDI, an increasing number of Chinese enterprises are obtaining production and innovation elements, such as skillsets, technology, brands, marketing networks, and natural resources, realizing the transition from “internationalization” to “globalization” [12,13]. According to the “2020 Report on China’s Outward Foreign Investment Cooperation and Development” [14], China’s OFDI flow was USD 136.91 billion in 2019, ranking second in the world. Since 2020, the epidemic has had a strong influence on the globalization of the world economy [15], but many scholars believe that enterprises and capital will continue to seek “space outlets” [16], and foreign direct investment will recover [17,18,19]. The same may be expected for the COVID-19 crisis, given the rebound of foreign direct investment after past crises [20,21].
The Yangtze River Economic Belt is the region with the strongest comprehensive strength and the greatest strategic position in China. It has formed a comprehensive opening-up belt integrating regions along the coast, the Yangtze River, and surrounding areas. It is an important engine for China’s economic development [22,23]. As the most important economic development axis in China, both the population and economic aggregate of the Yangtze River Economic Belt account for more than 40% of the country. Nevertheless, there are obvious development problems within the belt, such as unbalanced economic development, difficult issues in industrial transformation and upgrading, and unsmooth intraregional cooperation. A large number of scholars have shown that reconstructing the spatial structure of OFDI in the Yangtze River Economic Belt and comprehensively improving the overall level of regional OFDI are important ways to solve these development problems.
Our study extends the Chinese OFDI literature by examining the spatial pattern of OFDI enterprises and the impact factors of OFDI enterprises’ distribution in the Yangtze River Economic Belt and focuses on answering two research questions:
(1)
How can we make full use of the advantages in the upper, middle, and lower reaches to improve the overall OFDI level with the special characteristics of OFDI growth in the Yangtze River Economic Belt?
(2)
In the context of the new normal development of China’s economy and the global epidemic, how can we effectively enhance intraregional cooperation, as well as regional cooperation, with other places?
To answer these questions, we initially provide the research background, which is followed by a literature review. The third section introduces the methodology and data sources used for the quantitative analysis. The fourth section analyses the spatial distribution and evolution characteristics of OFDI enterprises in the Yangtze River Economic Belt from three aspects: the number of enterprises, the amount of OFDI, and China’s top 100 OFDI enterprises. In the fifth section, from the perspective of province of origin, the paper examines the factors influencing the spatiotemporal distribution of OFDI enterprises. It is expected that the conclusions of this paper will have enlightening significance for the reconstruction of the spatial pattern of OFDI in the Yangtze River Economic Belt and, thus, provide implications for the development of differentiation strategies in the three regions of the upper, middle, and lower reaches.

2. Literature Review

OFDI is a research topic of multidisciplinary fields, such as economics, regional economics, and economic geography. OFDI is an important driving force of economic globalization. The international industrial transfer accompanying international direct investment has an important impact on the adjustment of industrial structures of various countries, and the larger its scale and scope, the more significant this impact will be [24]. Based on the practice of OFDI in developed countries, many related theories have been formed. These theories all suggest that OFDI can promote the adjustment of investors’ industrial structure, such as the “product lifecycle theory” proposed by Vernon [25], the “market internalization” transnational direct investment theory proposed by Buckley and Casson responding to the incomplete market of “intermediate products” [26], and the “labor-intensive industry transfer theory” for OFDI in developed countries proposed by Lewis [27]. With a “gradient” advancement of international industrial transfers between countries at different levels of development caused by international investment, continuous deepening of the international division of labor facilitates the formation and expansion of a “global production network” based on the “value chain.” Thus, not only have developed countries been innovating OFDI with increasingly diversified investment behaviors and motivations, but developing countries have also been learning from the experience of pioneering countries to encourage domestic enterprises to actively participate in transnational investment activities [28]. The technological innovation and industrial upgrading theory proposed by Cantwell and Tolentino [27] suggests that the OFDI process in developing countries is also a process of improving the technological capabilities of enterprises, which will boost the optimization and upgrading of a country’s industrial structure. Some other theories, such as the investment theory of strategic asset acquisition motivation proposed by Dunning [29,30], and the “unbalanced ODFI theory” proposed by Hwy-Chang Moon and T. W. Roehl (2011) [31], also explain the impact of OFDI on investors’ industrial upgrading.
One of the strategic focuses for China’s economic and social development is “transformation of development mode and adjustment of industrial structure”. OFDI will play an increasingly significant role in developing an “open economy” in China [32]. To study temporal and spatial patterns of OFDI in China, scholars have mainly used regression models [4], GIS spatial visualization methods [17], the Theil index method [33], gravity models [34], and panel data models [35] in their research. The studies have investigated OFDI location selection, development characteristics and investment modes and patterns to provide useful conclusions, such as those that suggest that China’s OFDI location is determined by market demand, natural resources, trade factors, technical-level factors, labor cost factors, institutional factors, etc. However, China has a large land area, and there are considerable internal differences in the pattern and level of outward FDI. Scholars mostly carry out research on the national scale and less so on the sub-national scale. Thus, the research conclusions have insufficient implications for the sub-national unit.
Regarding the influencing factors that affect the temporal and spatial patterns of China’s OFDI, scholars have used various methods, such as Gaussian mixture model (GMM) estimation [36] and gravity models [37,38], to analyze statistical data. The studies suggest that the host country’s resource endowment, bilateral trade, technological level, market size, political system, and economic development level are important factors that influence the spatial distribution of OFDI in the global. Most of the existing studies on influencing factors by Chinese scholars have been focused on host countries [39,40], with little attention paid to source countries and investment enterprises [41]. Some studies investigated the influence of OFDI in the Yangtze River Economic Belt on the regional economy [42,43], but most regarded the OFDI flow and stock, with minimal attention paid to OFDI enterprises themselves [44,45].

3. Methodology and Data

3.1. Methodology

In this study, ArcGIS software was used to conduct spatiotemporal analysis, exploring spatial distribution and changes in OFDI enterprises. In the analysis process, the Jenks natural breaks classification method was used to conduct data classification [46], which reduces the variance within classes and maximizes the variance between classes [47]. Using ArcGIS, we took pictures showing the spatial structure of the number of enterprises, the amount of OFDI, and China’s top 100 OFDI enterprises in the Yangtze River Economic Belt in 2010, 2014, and 2018.
Moreover, SPSS software was used to carry out correlation coefficient analysis to explore the relationship between regional characteristics and the spatial pattern of OFDI enterprises. Firstly, we assumed that the number of regional OFDI enterprises (y) has an uncertain correlation with regional environmental characteristics(x). The correlation coefficient was used to determine whether there is a linear correlation between the two variables as well as the closeness and direction of the correlation. The calculation formula [48] of the correlation coefficient is as follows:
r = n x y x y [ n x 2 ( x ) 2 ] [ n y 2 ( y ) 2 ]
The value range of correlation coefficient r is between −1 and +1. If r is positive, it indicates that the two variables are positively correlated, and if r is negative, it indicates that the two variables are negatively correlated. The closer r is to 1 (1 or −1), the stronger the linear correlation between the two variables. The closer r is to 0, the weaker the linear correlation between the two variables.

3.2. Data and Variables

The data used in this study include the number of OFDI enterprises, the amount of OFDI, and the Chinese top 100 OFDI enterprises in the Yangtze River Economic Belt, which were sourced from Statistical Bulletin of China’s Outward Foreign Direct Investment.
Based on the existing literature [49], combined with the availability of data, an analysis of influencing factors was carried out. The number of OFDI enterprises in each province (municipality) was used as the response variable (y), and ten indicators representing physical, economic, and social factors were selected as the explanatory variables (x) (Table 1). The physical factors included topography and landforms, measured by average altitude (X1); the economic factors, as core factors that affect spatial distribution of OFDI enterprises, included the economic development level (X2), the degree of industrialization (X3), the production cost (X4), the degree of economic openness (X5), and the level of urbanization (X6), measured by per capita GDP, proportion of secondary sector in GDP, average wage of urban employees, ratio of total import and export trade to local GDP, and proportion of non-agricultural population, respectively; the social factors, as important factors that affect the spatial distribution of OFDI enterprises, included the level of informatization (X7), traffic accessibility (X8), technological innovation capabilities (X9), and regional policies (X10) as explanatory variables, measured by per capita expenditure on telecommunication services, mileage of highway per square kilometer, number of patents per population of 10,000, and proportion of local fiscal expenditures in local GDP. The date for the ten influencing factors (x) come from statistic yearbooks published in 2011, 2015, and 2019, including China Statistical Yearbooks, Shanghai Statistical Yearbooks, Chongqing Statistical Yearbooks, Jiangsu Statistical Yearbooks, Zhejiang Statistical Yearbooks, Sichuan Statistical Yearbooks, Anhui Statistical Yearbooks, Jiangxi Statistical Yearbooks, Hubei Statistical Yearbooks, Hunan Statistical Yearbooks, Yunnan Statistical Yearbooks, and Guizhou Statistical Yearbooks.

4. Spatial and Temporal Characteristics of OFDI Enterprises
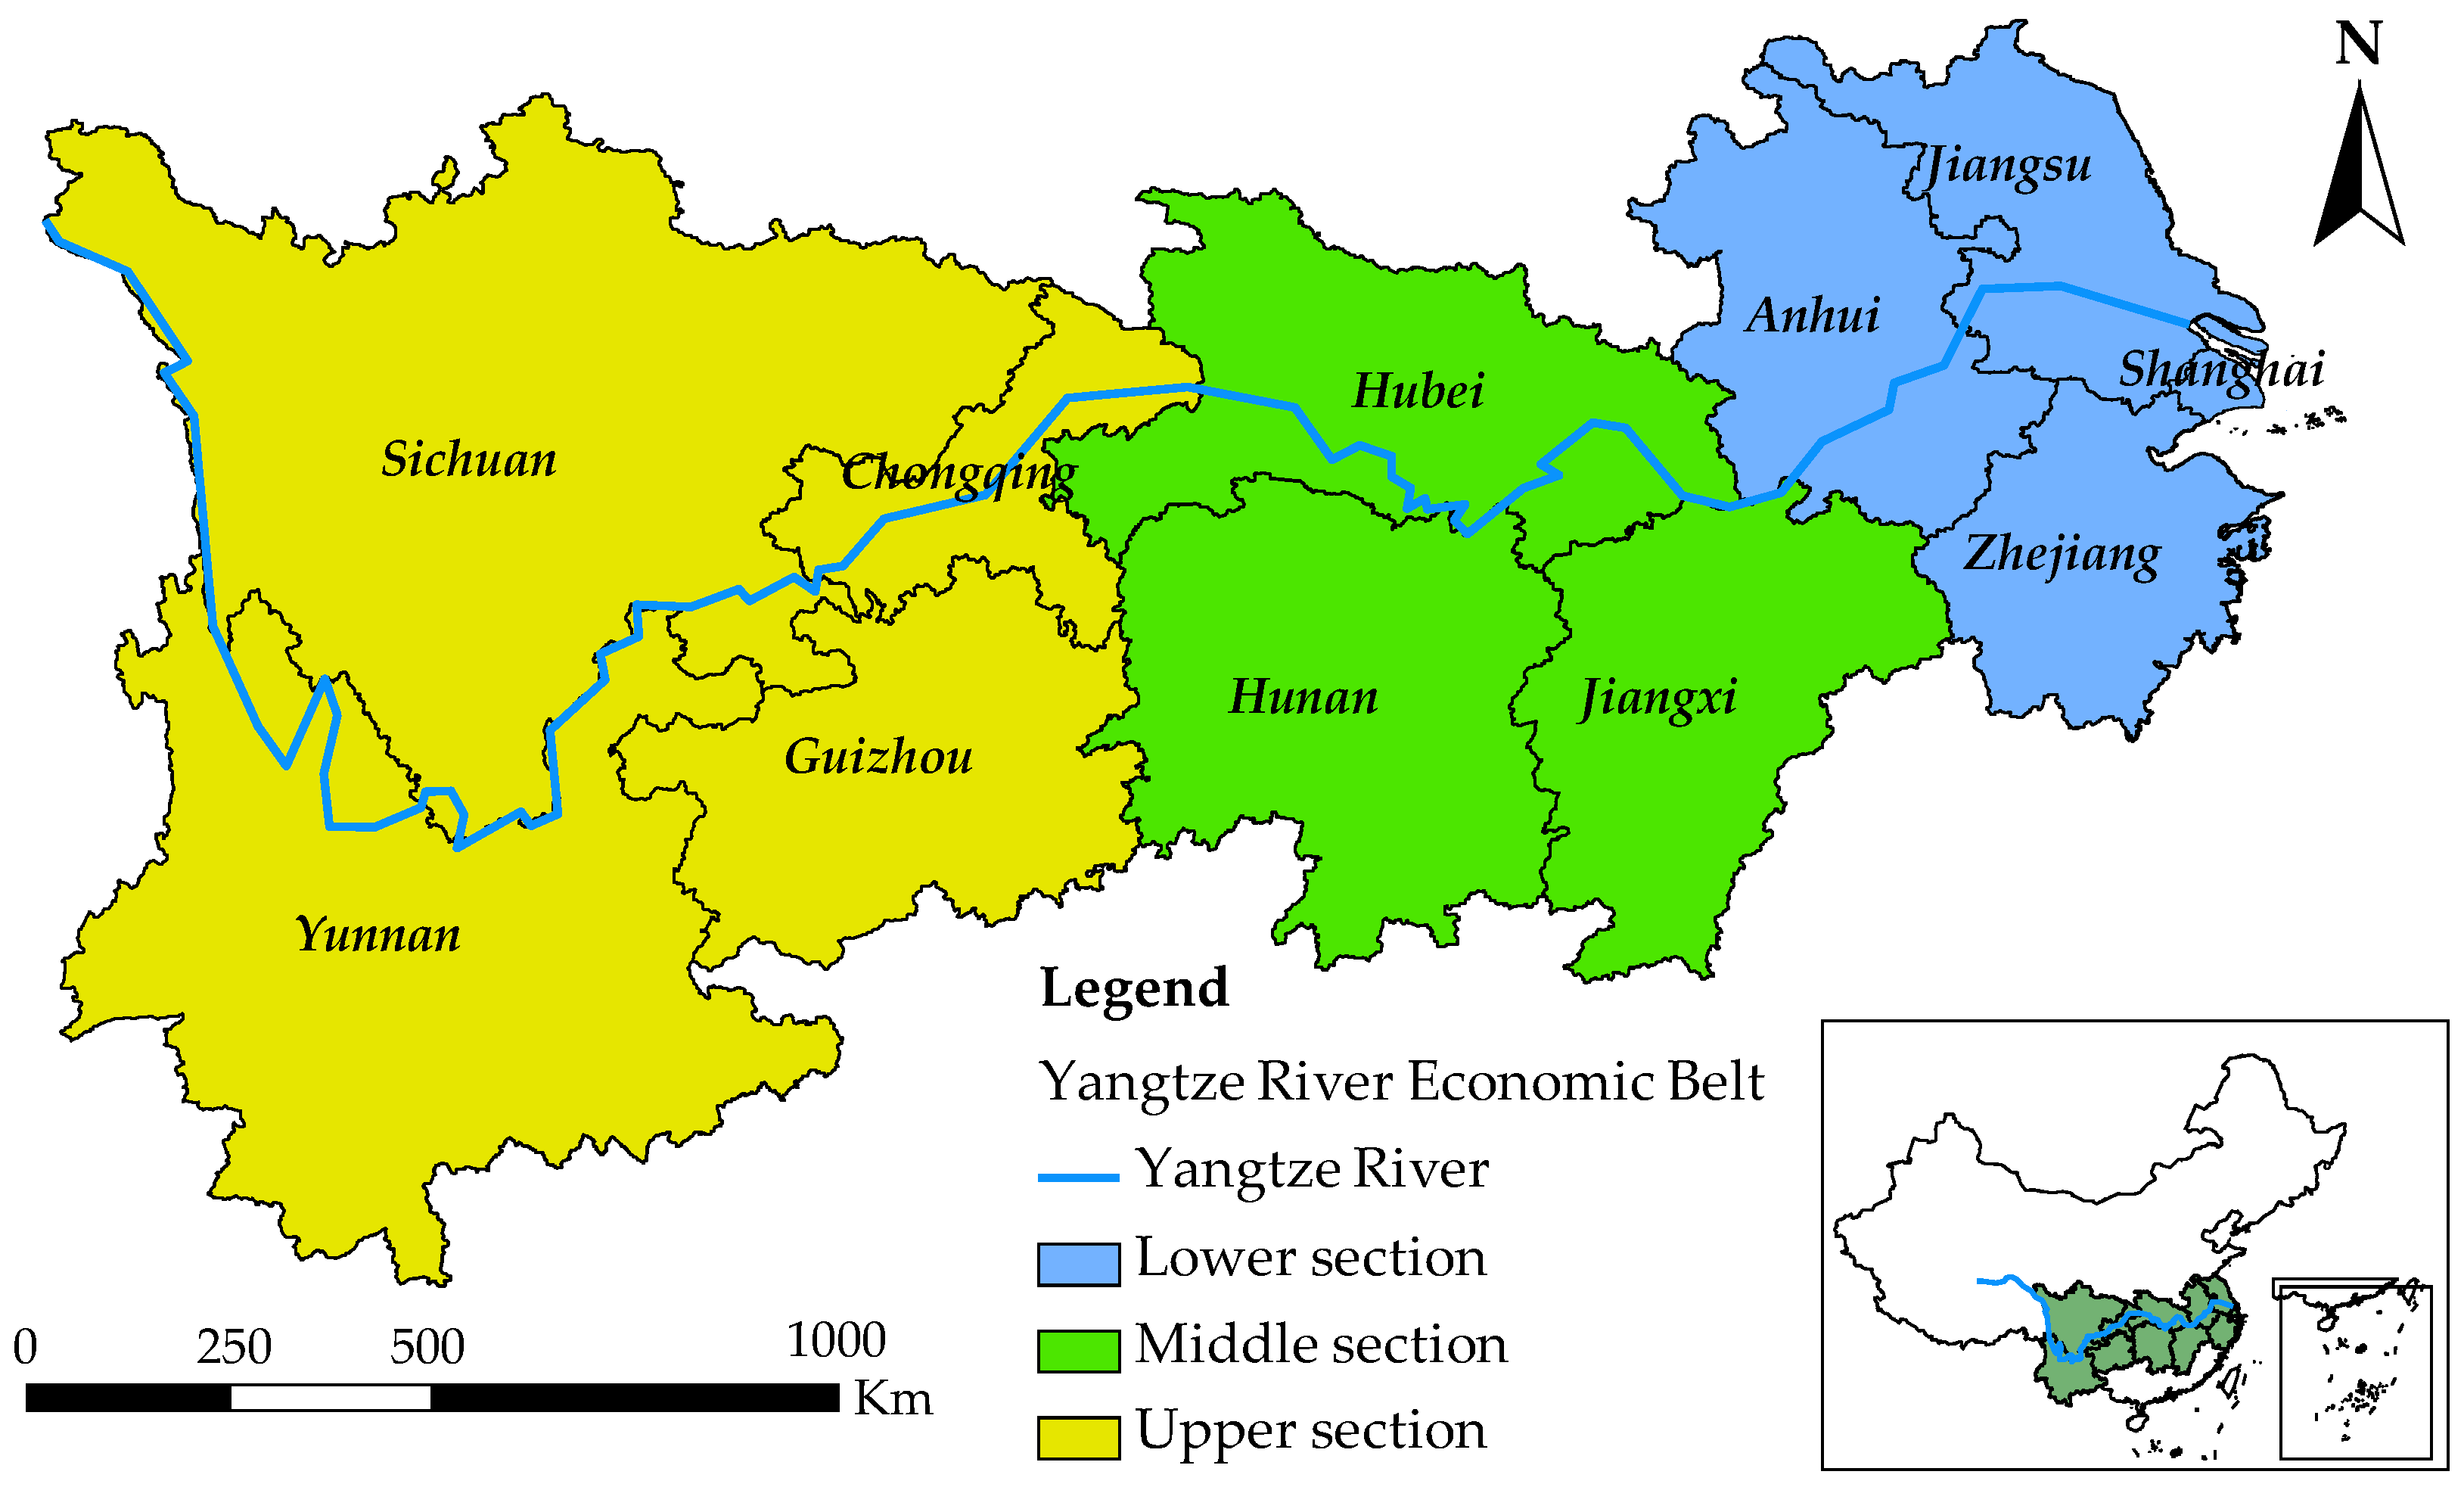
4.1. Research Area

Originating from the Yangtze River Industrial Concentration Zone proposed in the 1980s, the Yangtze River Economic Belt is an important strategic region in China. It clusters 11 provincial jurisdictions (provinces and municipalities), namely, Shanghai, Jiangsu, Zhejiang, Anhui, Jiangxi, Hubei, Hunan, Chongqing, Sichuan, Yunnan, and Guizhou. The land area is 2.0523 million square kilometers, accounting for 21.4% of China’s total landmass, with a population of 600 million and 45% of national GDP. The Yangtze River Economic Belt is divided into upper, middle, and lower sections [50], as shown in Figure 1. In this study, we make tempo-spatial analysis both from provincial jurisdictions and the three sections.

4.2. Spatial Agglomeration Characteristics

As shown in Table 2, the distribution of OFDI enterprises in the Yangtze River Economic Belt presents a clear pattern of “more in the east and less in the west.” Comparing the years 2010, 2014, and 2018, the number of OFDI enterprises in the lower section of the Belt accounts for a dominant proportion of more than 75%, while those in the middle and lower sections are similarly much lower. Therefore, in terms of the number of enterprises, the OFDI distribution in the Yangtze River Economic Belt is an agglomeration distribution, highly concentrated in the lower reaches of the Yangtze River.
To further investigate the spatial differentiation and evolution characteristics of OFDI within the upper, middle, and lower sections of the Yangtze River Economic Belt, ArcGIS software was used to conduct provincial and municipal spatial scale analysis. The results are shown in Figure 2.
(1) The agglomeration of OFDI enterprises in three provinces and one municipality in the lower section of the Belt (Shanghai, Zhejiang, Jiangsu, and Anhui) was significantly uneven. From 2010 to 2018, the agglomeration of OFDI enterprises gradually changed, agglomerating from two provinces (Zhejiang and Jiangsu) to the three provinces/municipalities of Zhejiang, Shanghai and Jiangsu, while the position of Jiangsu province slightly declined. In this section, Anhui Province had a relatively low level of OFDI. (2) In the middle section, the spatial pattern of OFDI of the three provinces (Hubei, Hunan, and Jiangxi) did not change significantly, where OFDI was centered in Hunan Province. (3) In the upper section, agglomeration of OFDI enterprises occurred in 2014, with Yunnan Province representing the core. However, in 2018, the central position of Yunnan Province declined, and the agglomeration of OFDI enterprises in Sichuan and Chongqing accelerated.

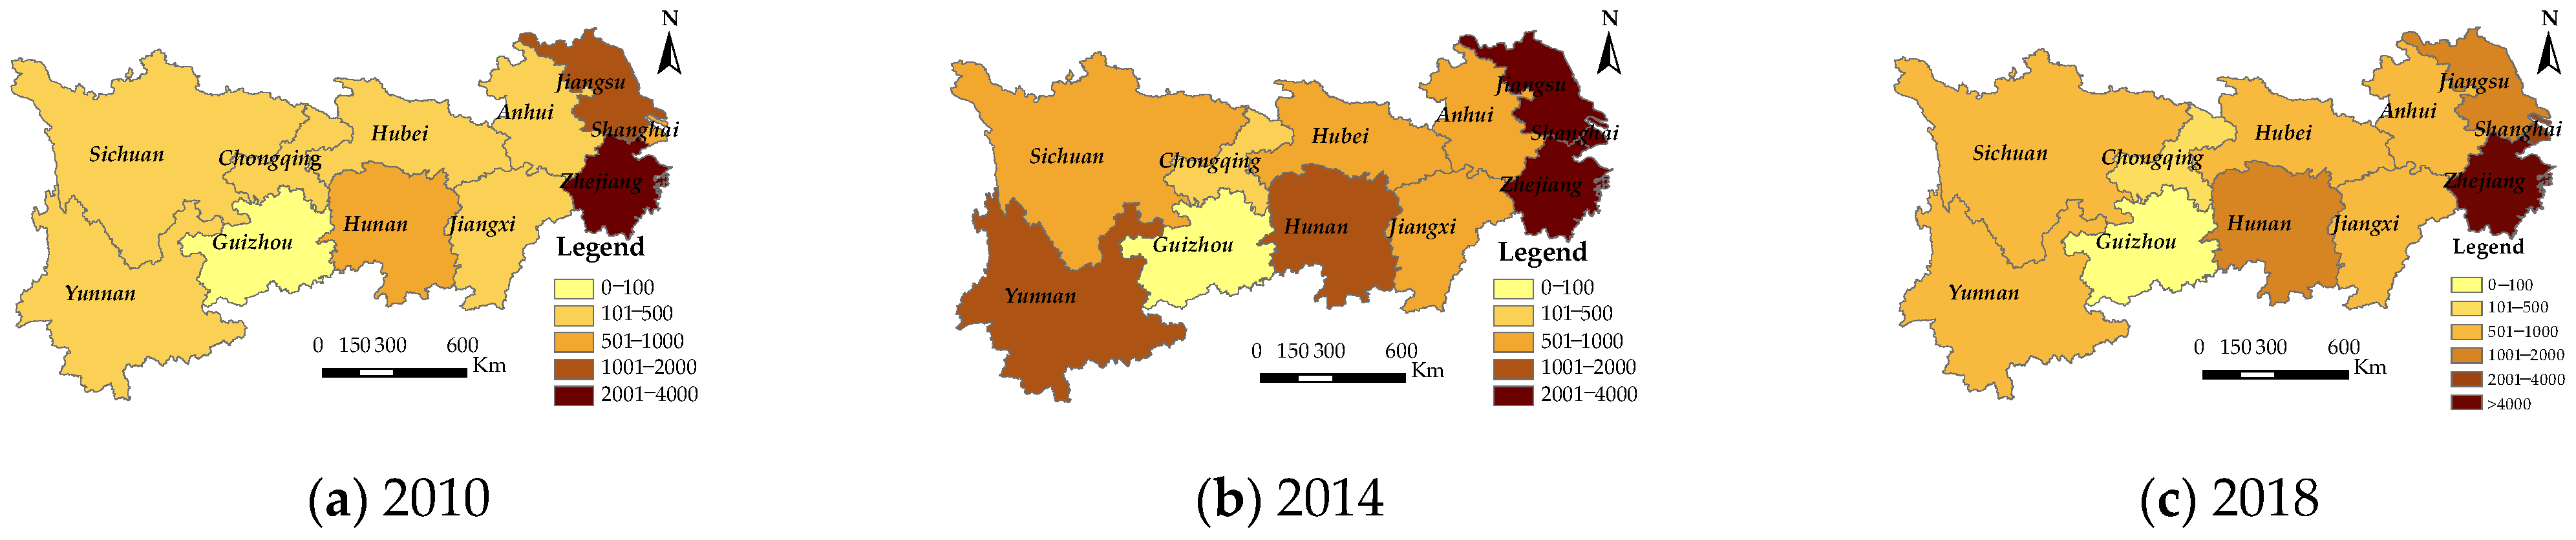
4.3. Spatial and Temporal Characteristics in the Amount of OFDI

Regarding the amount of OFDI, the lower section of the Belt has a notable advantage over the middle and lower sections. Analyzing the trend shown from three-year data for the years 2010, 2014, and 2018, it was observed that OFDI enterprises in the lower section gained an increasing advantage in the OFDI scale. In the middle and upper sections, OFDI showed a downward trend (Table 3). Comparing the numbers of OFDI enterprises in Table 2, we can conclude that in all three years, the scale of OFDI by enterprises in the upper section exceeded that in the middle and lower sections; moreover, there was a tendency for the OFDI scale in the lower section to become increasingly larger.
ArcGIS was used to further investigate the difference in the investment amount and the evolution characteristics of spatial patterns within the three sections of the Belt. The results are shown in Figure 3.
In terms of the spatial distribution of OFDI (Figure 3), the following observations were made:
(1)
Among the three provinces and one municipality in the lower section, OFDI predominantly occurred in Shanghai, Zhejiang, and Jiangsu. However, comparing the data of the three specific years, the importance of Jiangsu in OFDI declined.
(2)
In the middle section, the central position of Hunan in OFDI declined.
(3)
In the upper section, although Sichuan still had a significant advantage in the OFDI scale over Yunnan, Guizhou, and Chongqing, its importance in OFDI declined. This conclusion is different from that of the spatial distribution of OFDI enterprises (Figure 2), which suggests that the OFDI scale in Sichuan Province was significantly larger than that of other provinces (municipality) in the region. In comparison, Yunnan Province had many OFDI enterprises but had a small scale of OFDI in terms of the investment amount.

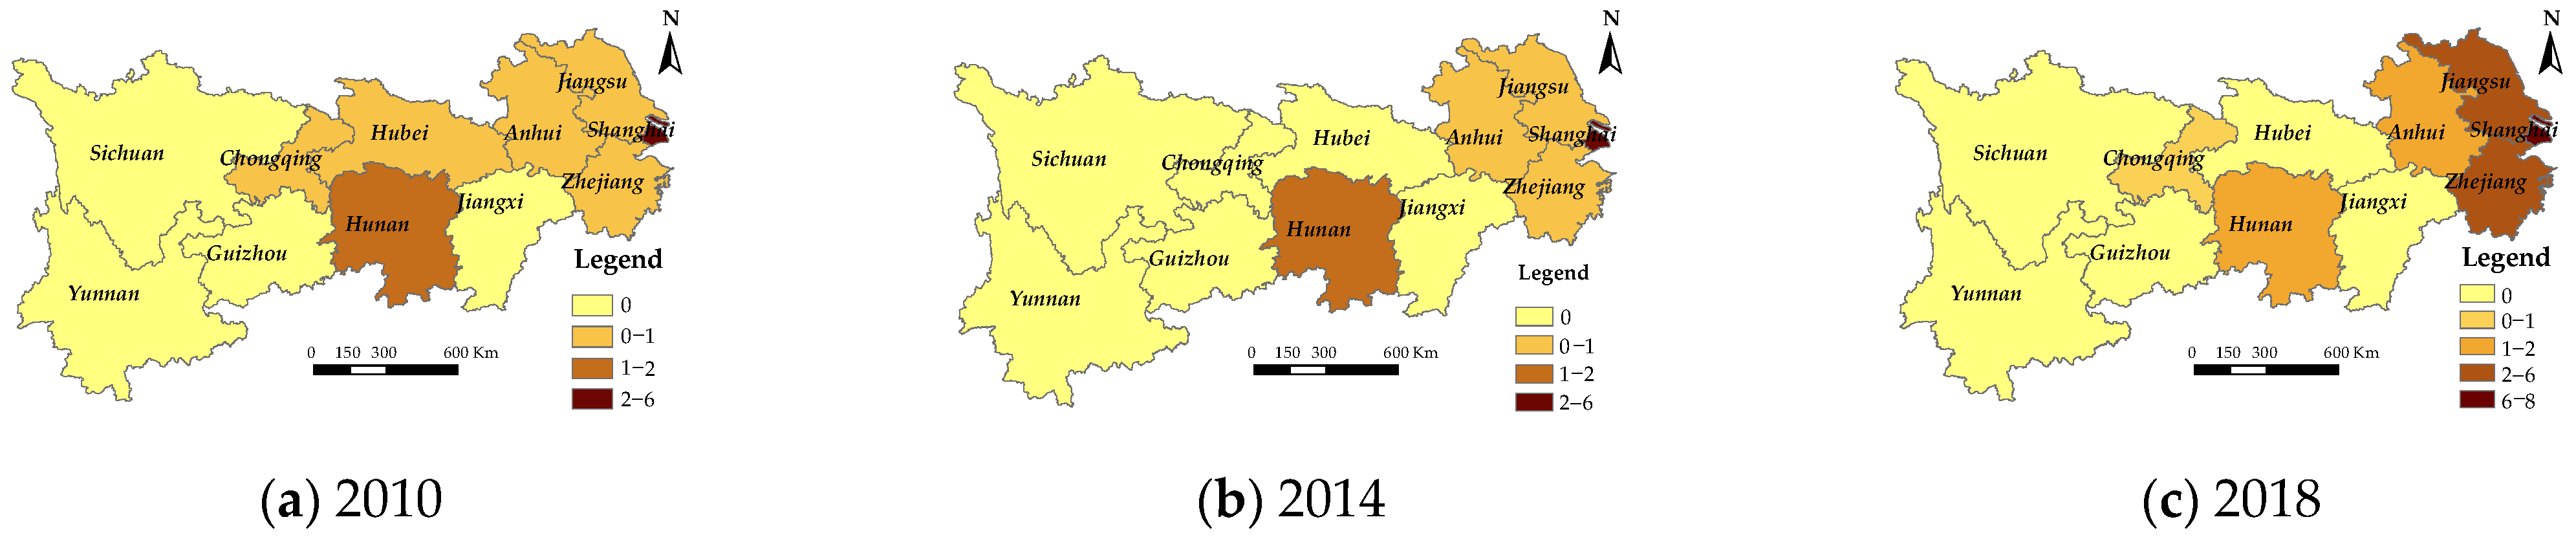
4.4. Spatial and Temporal Characteristics in China’s Top 100 ODFI Enterprises

China’s Top 100 OFDI enterprises are the leading enterprises in China’s OFDI, and they are pioneering and taking exploratory steps in the process of globalization. In recent years, as China’s economic level tends to be stable, the top 100 OFDI enterprises have achieved steady development. This article analyzed the spatial pattern and evolution characteristics of those enterprises listed as China’s top 100 OFDI enterprises (hereon referred to as “top 100 enterprises”) in the Yangtze River Economic Belt.
In 2010, the top 100 enterprises were distributed in Shanghai, Zhejiang, Jiangsu, Anhui, Hubei, Hunan, and Chongqing (Figure 4). Among these, Shanghai and Hunan were the provinces where the top 100 enterprises were concentrated.
By 2014, the spatial pattern of the Top 100 enterprises in the Yangtze River Economic Belt had undergone significant changes, showing a phenomenon of gathering in the lower section. Then, all four provinces (municipality) in the lower section had top 100 enterprises. Shanghai hosted most of them; in the middle section, only Hunan Province had a considerable number of top 100 enterprises; in the upper section, there was not even a single top 100 enterprise.
By 2018, the number of top 100 enterprises in the Yangtze River Economic Belt was showing a trend of growth, with agglomeration relocating to the lower section. Meanwhile, the key provinces (municipalities), such as Shanghai in the lower section, Hunan in the middle section and Chongqing in the upper section, continued to play a significant role.

5. Factors Influencing Spatial Pattern of OFDI Enterprises in the Yangtze River Economic Belt

Using SPSS22.0, a correlation analysis was conducted on influencing factors based on data collected in 2010, 2014, and 2018. The results are shown in Table 4.
A correlation analysis between the number of OFDI enterprises and explanatory variables found that in 2010, there was a strong correlation between the OFDI enterprise number and the number of patents granted per 10,000 people. There were also significant correlations between the OFDI enterprise number and per capita GDP, per capita expenditure on telecommunications services, and proportion of local fiscal expenditure in local GDP. Although the significant level of these correlations is lower than the number of patents granted per 10,000 people, they still passed the significant level test, while the remainder did not pass the test. By 2014, the OFDI enterprise number displayed a strong correlation with per capita GDP, per capita expenditure on telecommunications services, and the number of patents granted per 10,000 people. The ratio of total import and export trade to local GDP, the proportion of the non-agricultural population, and the proportion of local fiscal expenditures in local GDP also displayed significant correlations with the number of foreign investment enterprises, although these were not as strong as the former three factors. In 2018, the four factors of per capita GDP, the ratio of total import and export trade to the local GDP, the proportion of the non-agricultural population, and the number of patents per 10,000 people showed a strong correlation with the OFDI enterprise number. The correlations between the average wage of employees, per capita expenditure on telecommunications services, and the OFDI enterprise number were not as strong as the former four factors, but they passed the significant level test.
From Table 4, it can be seen that the r-value of technological innovation capability in 2010 was 0.817, the highest among all the tests that passed the significant level of correlation. This indicates that in 2010, technological innovation capability was the most important influencing factor that affected the spatial distribution of OFDI enterprises in the Yangtze River Economic Belt. As technological innovation capability is at the core competitiveness of enterprises, the stronger technological innovation capability in a region, the easier the achievement of production efficiency improvement. Consequently, this motivates enterprises to pursue larger markets and actively make overseas investments. In addition, many factors such as economic development level, informatization level, and regional policy factors also impact the spatial agglomeration of OFDI enterprises. The higher the level of economic development, the better the foundation of economic strength, and the easier it is for large and powerful enterprises to expand their market overseas. In regions with a higher level of informatization, enterprises can obtain and master information faster, which allows them to make timely decisions to secure maximum investment profits. In recent years, the government’s continuous advocacy of the “going out” policy has also led enterprises to actively explore global markets. Other influencing factors did not pass the significance level test, suggesting that those influencing factors had little impact on the spatial pattern of OFDI enterprises in the Yangtze River Economic Belt at that time.
By 2014, although the significantly increased economic development and informatization became important core factors affecting the spatial pattern of OFDI enterprises, technological innovation capabilities remained the factor with the most influence. The improved degree of openness and urbanization level also affected the spatial pattern of OFDI enterprises. The degree of openness determines the extent of the economic connection to the outside. An open environment facilitates enterprises to “go out” to make direct investments overseas. Moreover, the higher the level of urbanization, the faster the regional economy develops. Thus, it is easy for enterprises in the region to make multinational investments.
In 2018, with further improvement in the openness and urbanization level, the two factors of economic development level and technological innovation capabilities became core influencing factors. Production costs also became an influencing factor affecting the spatial distribution of OFDI enterprises. Meanwhile, the influence of the informatization level on OFDI enterprise distribution weakened, although a relatively strong influence remained. However, the influence of regional policies declined significantly, mainly because China had generally established all-round and multi-level openness in recent years, and the Yangtze River Economic Belt displayed outstanding performance in terms of OFDI; all levels of governments were actively engaging enterprises to “go out.”
Among the three categories of factors, natural factors had a stable and weak influence on the spatial distribution of OFDI enterprises compared with the other two categories of factors. In addition, the technological innovation capability was a core influencing factor over all three time periods, namely, 2010, 2014, and 2018, but it also went from being a solo core factor in 2010 to one of the multiple cores influencing factors, including economic development, openness, urbanization level, and technological innovation capabilities.

6. Conclusions and Suggestions

6.1. Conclusions

This paper explores the spatial and temporal characteristics of OFDI enterprises in the Yangtze River Economic Belt in relation to the impact of various influencing factors. The conclusions are drawn below.
There is an uneven geographical distribution of OFDI enterprises in the Yangtze River Economic Belt. The lower section of the Yangtze River Economic Belt has significant advantages in terms of quantity and quality in OFDI. Generally speaking, an OFDI pattern of “uneven geographical distribution with high concentration to the lower section” can be observed. At the same time, its spatial pattern has not significantly changed over time.
Within the three regions, namely, the upper, middle, and lower sections of the Yangtze River Economic Belt, uneven distribution of OFDI enterprises has occurred, and each section has formed its own OFDI agglomeration. In the lower section, OFDI enterprises have clustered in Shanghai, Jiangsu, and Zhejiang. In the middle section, a spatial pattern of OFDI enterprises centered in Hunan has formed. In the upper section, while Yunnan Province is home to the largest number of OFDI enterprises in the region, Sichuan Province has contributed the most in terms of investment amount. Therefore, despite a relatively low level of openness in the central and western regions of the Yangtze River Economic Belt, benefiting from related policies, such as the “One Belt One Road” initiative, a multi-core spatial pattern of OFDI has gradually emerged.
In the three time periods of 2010, 2014 and 2018, the influencing factors affecting the spatial distribution of OFDI enterprises in the Yangtze River Economic Belt have displayed change, but some similarities remain over time. These similarities include the fact that technological innovation capabilities were consistently a core factor in all three time periods, which decisively affected the spatial pattern of OFDI enterprises in the Yangtze River Economic Belt. The significant changes include the fact that in 2010, the technological innovation capability was the only core factor affecting the spatial pattern of OFDI, but in 2018, four core factors, namely, urbanization level, economic development level, technological innovation capabilities, and openness, collectively affected the spatial distribution pattern of OFDI enterprises in the Yangtze River Economic Belt.

6.2. Suggestions

6.2.1. Comprehensive Improvement in Enterprises’ Foreign Investment in the Yangtze River Economic Belt and Injection of Vitality into the World Economic Development

The Yangtze River Economic Belt, with its vast hinterland and wealthy resources, is a gathering position for China’s traditional industries, such as steel, automobile, electronics, and petrochemicals. Meanwhile, the core cities of the economic belt, such as Shanghai, Nanjing, Hefei, Wuhan, Chengdu, Changsha, and Chongqing, have strong scientific and technological innovation capability, and, as such, many emerging industries in China are gathering here. The strategy of “high-quality development of the Yangtze River Economic Belt” proposed by the Chinese government in 2016 emphasizes the goal of high-end and green development of industries in the economic belt. Therefore, there is great pressure on the transformation and upgrading of traditional industries in the economic belt. Provinces along the Yangtze River should actively adjust their industrial policies and guide enterprises to achieve rapid upgrading and transformation through OFDI practices to realize industrial transformation and upgrading at the regional scale. Guiding enterprises to “go global” will not only facilitate high-quality development within the economic belt but also bring China’s economy onto the track of rapid development. In addition, the continuous improvement to the Belt and Road Transportation Network and the expansion of the transnational investment network of enterprises in the Yangtze River Economic Belt will also inject new economic vitality into the countries along the belt.

6.2.2. Encouraging the Lower Section to Play a Leading Role in Opening up and Establishing Global Production Networks

In 2018, the regional integration of the Yangtze River Delta developed into a national strategy. The three provinces and one city in the lower reaches of the Yangtze River Economic Belt are all included in the overall planning of the Yangtze River Delta. The Yangtze River Delta is one of the regions with the most active economic development, the highest degree of openness, and the strongest innovation capabilities in China. The three provinces and one city have their own advantages. For example, Jiangsu has developed a manufacturing industry, Zhejiang’s private economy is the most dynamic, Anhui has strong scientific and technological innovation capabilities, and Shanghai has outstanding global resource allocation capabilities. Therefore, various large enterprises are encouraged to actively establish global production networks, capture more value on a global scale, and promote the growth of regional core cities into innovative cities with global competitiveness and headquarters economy cities, thereby driving the overall development of the Yangtze River Economic Belt.

6.2.3. Acceleration of the Cultivation of More Inland Open Highlands and Encouraging Enterprises in the Upper Section of the Yangtze River Economic Belt to Establish Regional Production Networks

At present, the Yangtze River as a golden waterway is well connected with the railway system along the river, and the construction of a new western land–sea corridor is under way. Interconnection between the Yangtze River Economic Belt and the countries along the “One Belt One Road” will continue to be strengthened. Cities such as Chongqing, Chengdu, and Kunming on the upper reaches of the Yangtze River are at the intersection of the Yangtze River Economic Belt and the “One Belt One Road.” These cities have a relatively high level of urbanization and technology, which establishes an advantage in engaging in international cooperation in regard to production capacity and equipment manufacturing. In the future, we should accelerate the cultivation of more inland open highlands in this region and encourage enterprises with overcapacity and cost-sensitive enterprises to “go global” to achieve rapid technological and product upgrading in order to enhance global competitiveness while leaving space for the development of high-end industries. Especially in the context of the COVID-19 epidemic, speeding up cooperation with Southeast Asian countries, building a regional production network, and ensuring the stability of the China–ASEAN supply chain and the safety of the industrial chain are of great significance to China’s economic development.
This paper examined the evolution of the spatial pattern of OFDI enterprises in the Yangtze River Economic Belt from the perspective of geography. It introduced ten explanatory variables for the analysis of the factors influencing the spatial pattern of OFDI enterprises. There are some limitations to this study. For example, the correlation coefficient analysis carried out in this paper focuses on interpreting the correlation between the number of OFDI enterprises and their regional environment, which is a large-scale analysis, and this relationship has not been studied from the micro-scale of enterprises. We agree that the OFDI practices are the result of multi-actors’ complex interaction in the context of a multi-spatial institutional environment. However, in the current research phase, we deemed it appropriate to focus our attention on the differences in OFDI levels caused by regional differences, aiming to put forward suggestions on promoting OFDI practices and inter-region cooperation in the Yangtze River Economic Belt. The next stage of our research will prioritize the internal mechanism of enterprises’ OFDI behavior. At the same time, our research will be carried out on the scale of prefecture-level cities to solve the shortage of quantitative analysis caused by a minor sample size.

Author Contributions

Conceptualization, F.S.; data curation, J.Z.; formal analysis, F.S.; funding acquisition, H.X.; investigation, F.S. and Y.-C.L.; methodology, H.X.; project administration, W.-L.H.; resources, H.X.; software, J.Z.; supervision, H.X.; validation, W.-L.H.; writing—original draft, W.-L.H.; writing—review and editing, Y.-C.L. All authors have read and agreed to the published version of the manuscript.

Funding

This research was funded by 2020 Major Project about the Philosophy and Social Sciences of Higher Education in Jiangsu Province, China. (Grant No. 2020SJZDA043); Humanities and Social Sciences Foundation of the Chinese Ministry of Education (Grant No. 20YJAGAT002); Humanities and Social Sciences Foundation of the Chinese Ministry of Education (Grant No. 20YJA630087).

Institutional Review Board Statement

Not applicable.

Informed Consent Statement

Not applicable.

Data Availability Statement

The data presented in this study are available on request from the corresponding author.

Acknowledgments

We are grateful to the editors and anonymous referees for their comments. In addition, we would like to thank Xiaofan Sun and Zhen Luo who studies at Huaiyin Normal University for their great contribution to the ArcGis mapping, typesetting and proofreading of the article.

Conflicts of Interest

The authors declare no conflict of interest.

References

  1. Liu, W.; Tian, J.; Ou, X. Study on “One Belt One Road” Stratey; The Commercial Press: Beijing, China, 2017; p. 35. [Google Scholar]
  2. Du, J.; Zhang, Y. Does One Belt One Road initiative promote Chinese overseas direct investment? China Econ. Rev. 2018, 47, 189–205. [Google Scholar] [CrossRef]
  3. Aoyama, R. “One Belt, One Road”: China’s New Global Strategy. J. Contemp. East Asia Stud. 2016, 5, 3–22. [Google Scholar] [CrossRef] [Green Version]
  4. Ma, S.; Xu, X.; Zeng, Z.; Wang, L. Chinese Industrial Outward FDI Location Choice in ASEAN Countries. Sustainability 2020, 12, 647. [Google Scholar] [CrossRef] [Green Version]
  5. Das, C.K. The Making of One Belt, One Road and Dilemmas in South Asia. China Rep. 2017, 53, 125–142. [Google Scholar] [CrossRef]
  6. The Vision and Actions to Promote the Joint Construction of the Silk Road Economic Belt and the 21st Century Maritime Silk Road. Available online: https://www.ndrc.gov.cn/xwdt/xwfb/201503/t20150328_956036.html (accessed on 4 April 2021).
  7. Gong, Z.; Chan, F.; Wu, Y. Borrowing Hong Kong’s International Standards: A Steppingstone for the Chinese “Belt and Road” Going Out? Sustainability 2021, 13, 3485. [Google Scholar] [CrossRef]
  8. Winter, T. Geocultural Power: China’s Belt and Road Initiative. Geopolitics 2020, 1–24. [Google Scholar] [CrossRef]
  9. Yu, H. Motivation behind China’s ‘One Belt, One Road’ Initiatives and Establishment of the Asian Infrastructure Investment Bank. J. Contemp. China 2017, 26, 353–368. [Google Scholar] [CrossRef]
  10. Voon, J.P.; Xu, X. Impact of the Belt and Road Initiative on China’s soft power: Preliminary evidence. Asia-Pac. J. Account. Econ. 2020, 27, 120–131. [Google Scholar] [CrossRef] [Green Version]
  11. Jung, J.Y.; Wang, W.; Cho, S.W. The Role of Confucius Institutes and One Belt, One Road Initiatives on the Values of Cross-Border M&A: Empirical Evidence from China. Sustainability 2020, 12, 10277. [Google Scholar] [CrossRef]
  12. Yang, L.; Lu, J. The future development direction of Chinese enterprises “going out”. Internaitonal Trade 2018, 46–51. [Google Scholar] [CrossRef]
  13. Asongu, S.A.; Nnanna, J.; Tchamyou, V.S. The comparative African regional economics of globalization in financial allocation efficiency: The pre-crisis era revisited. Financ. Innov. 2020, 6. [Google Scholar] [CrossRef]
  14. Ministry of Commerce of the People’s Republic of China. Report on Development of China’s Outward Investment and Economic Cooperation; Ministry of Commerce of the People’s Republic of China: Beijing, China, 2021. [Google Scholar]
  15. Foreign Direct Investment Flows in the Time of COVID-19. Available online: https://www.oecd.org/coronavirus/policy-responses/foreign-direct-investment-flows-in-the-time-of-covid-19-a2fa20c4.html (accessed on 28 August 2020).
  16. Liu, H.Y.; Tang, Y.K.; Chen, X.L.; Poznanska, J. The Determinants of Chinese Outward FDI in Countries Along “One Belt One Road”. Emerg. Mark. Financ. Trade 2017, 53, 1374–1387. [Google Scholar] [CrossRef]
  17. Liu, W. The impacts of COVID-19 pandemic on the development of economic globalization. Geog. Res. 2020, 39, 1439–1449. [Google Scholar] [CrossRef]
  18. Ramasamy, B.; Yeung, M.; Laforet, S. China’s outward foreign direct investment: Location choice and firm ownership. J. World Bus. 2012, 47, 17–25. [Google Scholar] [CrossRef]
  19. Zhao, J. Analysis of the Evolution of Spatial Pattern and Influencing Factors of Outward Foreign Direct Investment in China. Master’s Thesis, Nanjing Normal University, Nanjing, China, 2015. [Google Scholar]
  20. Thomas, R.; Narayanan, K. Determinants of outward foreign direct investment: A study of Indian manufacturing firms. Transnatl. Corp. 2017, 24, 9–26. Available online: https://unctad.org/system/files/official-document/diaeia2017d2a2_en.pdf (accessed on 4 April 2021). [CrossRef]
  21. World Investment Report 2020. Available online: https://unctad.org/webflyer/world-investment-report-2020 (accessed on 28 August 2021).
  22. Liang, H. China Regional Economic Development Report; Social Sciences Literature Press: Beijing, China, 2015. [Google Scholar]
  23. Zhang, C.; Wang, C.; Mao, G.; Wang, M.; Hsu, W.-L. An Empirical Study on the Ecological Economy of the Huai River in China. Water 2020, 12, 2162. [Google Scholar] [CrossRef]
  24. Jiang, X. The growth of outward foreign direct investment and multinational corporations in China—Trends and strategies in the “Tenth Five-Year Plan” period. Econ. Res. Ref. 2002, 19–31. [Google Scholar] [CrossRef]
  25. Vernon, R. International Investment and International Trade in the Product Cycle. Q. J. Econ. 1966, 80, 190–207. [Google Scholar] [CrossRef]
  26. Buckley, P.J.; Casson, M. A Long-Run Theory of the Multinational Enterprise, The Future of the Multinational Enterprise; Palgrave Macmillan: London, UK, 1976. [Google Scholar]
  27. Lewis, W.A. The Evolution of the International Economic Order; Princeton University Press: Princeton, NJ, USA, 1978. [Google Scholar] [CrossRef]
  28. Zhou, S.-q. Impact of OFDI on Industrial Restructuring of Investing Country: A Literature Review. J. Int. Trade 2011, 135–144. [Google Scholar] [CrossRef]
  29. Dunning, J.H. Internationalizing Porter’s Diamond. Manage. Int. Rev. 1993, 33, 7–15. [Google Scholar] [CrossRef]
  30. Xu, H.; Hsu, W.-L.; Lee, Y.-C.; Chern, T.-Y.; Luo, S.-W. Information Application of the Regional Development: Strategic Couplings in Global Production Networks in Jiangsu, China. Information 2020, 11, 420. [Google Scholar] [CrossRef]
  31. Moon, H.C.; Roehl, T.W. Unconventional foreign direct investment and the imbalance theory. Int. Bus. Rev. 2011, 10, 197–215. [Google Scholar] [CrossRef]
  32. Li, Z. Research on the mechanism and derivative effects of international industrial Transfer—An analysis of political economy model from perspective of trade. Contemp. Econ. Res. 2011, 6, 82–88. [Google Scholar]
  33. Wang, H.; Liu, B.; Ren, H.; Tong, R.; Zhang, Z. The evolution of regional disparity and gravity center time-region shift for China’s direct investment in Africa. J. Shanghai Normal Univ. Nat. Sci. 2018, 47, 500–506. [Google Scholar] [CrossRef]
  34. Fung, K.C.; Garcia-Herrero, A. Foreign Direct Investment Outflows from China and India. China Econ. Policy Rev. 2012, 1. [Google Scholar] [CrossRef] [Green Version]
  35. Chen, S.; Liu, H.-y. The Effects of Governance of Host Countries on Chinese Outward Foreign Direct Investment—An Empirical Study Based on Panel Data. Res. Econ. Manag. 2012, 71–78. [Google Scholar] [CrossRef]
  36. Xiang, B.-w. An Empirical Research on the Features of Host-country and China’s Direct Investment Abroad. J. Quant. Tech. Econ. 2009, 26, 33–46. [Google Scholar]
  37. Cheng, H.; Ruan, X. Use a gravity model to analyze the location choice of China’s outward foreign direct investment. World Economy 2004, 11, 23–30. (In Chinese) [Google Scholar]
  38. Wen, K. An empirical study on determinants of China’s outward foreign direct Investment—Based on the characteristics of host countries. World Econ. Outlook 2008, 10, 18–23. (In Chinese) [Google Scholar]
  39. Guan, J.-C.; Wang, X.-J. The Research on the Determinants of China’s Outward Direct Investment. China Soft Sci. 2007, 59–65. [Google Scholar] [CrossRef]
  40. Wen, L. An Empirical Study of the Driving Factors in Chinese OFDI. J. Shanxi Univ. Philos. Social Sci. 2013, 36, 104–108. [Google Scholar] [CrossRef]
  41. Hang, J.; Ying, C. Spatial distribution and influencing factors of foreign investment enterprises in the Loess Plateau. J. Shaanxi Normal Univ. Nat. Sci. Ed. 2019, 47, 40–47. [Google Scholar] [CrossRef]
  42. Chen, X.; Li, L. Study on the Impact of OFDI on Economic Growth in the Yangtze River Economic Belt—An Empirical Analysis based on the Spatial Durbin Model. J. Jingchu Univ. Technol. 2019, 34, 49–58. [Google Scholar] [CrossRef]
  43. Zhang, J.; Tang, G. Spatial Differentiation Pattern of Manufac turing Industry in Zhejiang and Its Influencing Factors. Sci. Geog. Sin. 2018, 38, 1107–1117. [Google Scholar] [CrossRef]
  44. Gammeltoft, P.; Kokko, A. Introduction: Outward foreign direct investment from emerging economies and national development strategies: Three regimes. Int. J. Technol. Learn. Innov. Dev. 2013, 6, 1–20. [Google Scholar] [CrossRef]
  45. Wee, K.H. Outward Foreign Direct Investment by Enterprises from Thailand. Transnatl. Corp. 2007, 16, 89. Available online: http://econ.tu.ac.th/class/archan/Rangsun/MB%20663/MB%20663%20Readings/%E0%B9%95.%20%E0%B8%A3%E0%B8%B0%E0%B8%9A%E0%B8%9A%E0%B8%97%E0%B8%B8%E0%B8%99%E0%B8%99%E0%B8%B4%E0%B8%A2%E0%B8%A1%E0%B9%84%E0%B8%97%E0%B8%A2/TWMs/Outward%20FDI%20By%20Enterprises%20from%20Thailand.pdf (accessed on 4 April 2021).
  46. Siriopoulos, C.; Tsagkanos, A.; Svingou, A.; Daskalopoulos, E. Foreign Direct Investment in GCC Countries: The Essential Influence of Governance and the Adoption of IFRS. J. Risk Financ. Manag. 2021, 14, 264. [Google Scholar] [CrossRef]
  47. Jenks, G.F.; Caspall, F.C. Error on Choroplethic Maps: Definition, Measurement, Reduction. Ann. Assoc. Am. Geogr. 1971, 61, 217–244. [Google Scholar] [CrossRef]
  48. Johnson, R.A.; Bhattacharyya, G.K. Statistics: Principles and Methods; John Wiley & Sons: Hoboken, NJ, USA, 2019; Available online: https://www.wiley.com/en-ag/Statistics%3A+Principles+and+Methods,+8th+Edition-p-9781119497110 (accessed on 4 April 2021).
  49. Tasáryová, K.; Pakšiová, R. The Impact of Equity Information as An Important Factor in Assessing Business Performance. Information 2021, 12, 85. [Google Scholar] [CrossRef]
  50. Wang, M.; Yu, B.; Li, Z.; Wang, W.; Zhou, R. Spatial and Temporal Differentiation of the Comprehensive Carrying Capacity of the Yangtze River Economic Belt and Its Influencing Factors. J. Xinyang Norm. Univ. Nat. Sci. Ed. 2020, 33, 235–243. [Google Scholar] [CrossRef]
Figure 1. Location of the Yangtze River Economic Belt.
Information 12 00381 g001
Figure 2. Comparison of the distribution of OFDI enterprises in the Yangtze River Economic Belt (by number).
Information 12 00381 g002
Figure 3. Investment amount of OFDI in the Yangtze River Economic Belt.
Information 12 00381 g003
Figure 4. Comparison of distribution of China’s top 100 OFDI enterprises in the Yangtze River Economic Belt (by number).
Information 12 00381 g004
Table 1. Selection and interpretation of explanatory variables.
FactorsCodeExplanatory VariablesMeasurementsUnit
Natural factorsX1Topography and landformsAverage altitudem
Economic factorsX2Economic development levelPer capita GDPCNY
X3Degree of industrializationProportion of secondary sector in GDP%
X4Production costAverage wage of urban employeesCNY
X5Degree of economic opennessRatio of total import and export trade to local GDP%
X6Level of urbanizationProportion of non-agricultural population%
Social factorsX7Level of informatizationPer capita expenditure on telecommunication servicesCNY
X8Traffic accessibilityMileage of highway per square kilometerkm
X9Technological innovation capabilitiesNumber of patents per 10,000 populationnumber
X10Regional policiesProportion of local fiscal expenditures in local GDP%
Table 2. Key indicators of the number of OFDI enterprises in the Yangtze River Economic Belt.
Yangtze River Economic BeltLower SectionMiddle SectionUpper Section
TotalPercentageTotalPercentageTotalPercentageTotalPercentage
20105182100%404678%58311%55311%
201411,028100%826075%141813%135012%
201815,433100%11,73476%194313%175611%
Table 3. Key indicators of the investment amount of OFDI in the Yangtze River Economic Belt (USD million).
Lower SectionMiddle SectionUpper Section
Amount of OFDIPercentageAmount of OFDIPercentageAmount of OFDIPercentage
20108756.4976%1050.1910%1713.7014%
201425,787.7379%3222.8010%3530.1011%
201846,065.7984%4094.058%4209.468%
Table 4. Correlation analysis results of factors affecting the distribution of OFDI enterprises in the Yangtze River Economic Belt.
YearX1X2X3X4X5X6X7X8X9X10
2010−0.2940.621 *0.2020.3570.5050.4760.633 *0.2170.817 **−0.613 *
2014−0.3400.818 **−0.1410.5060.637 *0.645 *0.816 **0.3990.965 **−0.662 *
2018−0.3730.868 **0.2180.604 *0.791 **0.746 **0.702 *0.2810.971 **−0.567
** p < 0.01; * p < 0.05.
Publisher’s Note: MDPI stays neutral with regard to jurisdictional claims in published maps and institutional affiliations.

