Article

An Intelligent Hierarchical Security Framework for VANETs

by
Fábio Gonçalves
*,†,
Joaquim Macedo
and
Alexandre Santos
Algoritmi Center, University of Minho, 4710-057 Braga, Portugal
*
Author to whom correspondence should be addressed.
These authors contributed equally to this work.
Information 2021, 12(11), 455; https://doi.org/10.3390/info12110455
Submission received: 15 September 2021 / Revised: 26 October 2021 / Accepted: 27 October 2021 / Published: 2 November 2021

Abstract

:
Vehicular Ad hoc Networks (VANETs) are an emerging type of network that increasingly encompass a larger number of vehicles. They are the basic support for Intelligent Transportation Systems (ITS) and for establishing frameworks which enable communication among road entities and foster the development of new applications and services aimed at enhancing driving experience and increasing road safety. However, VANETs’ demanding characteristics make it difficult to implement security mechanisms, creating vulnerabilities easily explored by attackers. The main goal of this work is to propose an Intelligent Hierarchical Security Framework for VANET making use of Machine Learning (ML) algorithms to enhance attack detection, and to define methods for secure communications among entities, assuring strong authentication, privacy, and anonymity. The ML algorithms used in this framework have been trained and tested using vehicle communications datasets, which have been made publicly available, thus providing easily reproducible and verifiable results. The obtained results show that the proposed Intrusion Detection System (IDS) framework is able to detect attacks accurately, with a low False Positive Rate (FPR). Furthermore, results show that the framework can benefit from using different types of algorithms at different hierarchical levels, selecting light and fast processing algorithms in the lower levels, at the cost of accuracy, and using more precise, accurate, and complex algorithms in nodes higher in the hierarchy.

1. Introduction

The advancements in vehicular communication allow vehicle makers to implement new functionalities and services, providing enhancements in the driving experience, road traffic, and, more importantly, road safety. The networks that support this type of communication are called VANETs. These are, however, networks with characteristics different from other networks, where the nodes move very quickly, creating constant topology changes. VANET communications are wireless, using the air as the medium to communicate. Currently, the main industry standards are Dedicated Short Range Communications (DSRC) [1] and Institute of Electrical and Electronics Engineers (IEEE) 802.11p [2]. Still, these are heterogeneous networks that may take advantage of other technologies [3]. There are two types of nodes: On-Board Units (OBUs) and Road Side Units (RSUs) [4]. The first is installed in mobile nodes, such as vehicles. The latter are located alongside the road and constitute the network infrastructure. So, VANET demanding characteristics create vulnerabilities, providing an attractive environment for attackers.
Additionally to the normal security measures that try to prevent attacks, usually through cryptography, IDSs can provide an extra layer of security by detecting unpreventable attacks. These can detect attacks and trigger responses to minimize their effects. Depending on the detection technique used, IDSs can be classified into [5] signature-based, anomaly detection, specification-based and reputation-based. Anomaly detection works from collected data history (unlabeled) or a set of training data (labeled) to detect anomalies or deviations from patterns [5]. This work focuses on anomaly detection from labeled data.
IDSs can inclusively take advantage of ML algorithms to enhance their capabilities, increasing their accuracy and ability to detect anomalies. ML uses data mining techniques to infer knowledge from collected data. These are useful for finding data in already gathered data. For example, data collection of user preferences can be mined to find behavioral patterns and find the likelihood of a client buying a product or a service [6]. These techniques can be classified into [7] supervised, unsupervised, and semi-supervised. As already mentioned, this work uses supervised learning, which assumes that each instance has a correspondent label.
This work aims to design a complete Intelligent Security framework for VANETs able to detect attacks accurately and efficiently. It also provides mechanisms so that all the system entities may communicate securely. The framework divides the network into four levels, each in multiple clusters, grouping nodes with similar characteristics and needs and assigning different roles to each cluster. Thus, each level may carry out its role and use the detection type that better suits its needs.
As found in [8], most of the published research does not make the datasets available, making it difficult for third parties to verify the results. Thus, another contribution of this work is the suite of vehicular communications datasets, which has been made publicly available.
In previous works [9] it was shown that the nodes in the lower layers do not have enough data to create efficient ML models. Thus, in this work, only the high-level entity that has a wider view of the network and more data available will use the data for training the ML algorithms. The other nodes will use ML models and rules to detect the attacks.
The communications between all entities in the network are protected using an application layer security framework called Vehicular Ad hoc Network Public Key Infrastructure and Attribute-Based Encryption with Identity Manager Hybrid (VPKIbrID). It is a hybrid model that uses multiple techniques to fulfill the communication security requisites for VANET.
The main contributions of the present research work are to:
  • Propose a security framework for attack detection for VANETs;
  • Define a hierarchy-based architecture that adapts each level roles and functions to their capabilities and needs;
  • Compare multiple ML algorithms for attack detection;
  • Use datasets available publicly, enabling the replication and verification of the results.
Experimental results, obtained with the publicly available datasets, show that it is possible to detect attacks with very high accuracy. Additionally, the framework can benefit from different types of detection, using more complex algorithms at the higher levels, providing better accuracy, although slower response times. At lower levels, rule-based detection with lighter processing is more appropriated as it leads to faster detection. However, it works only as the first line of defense, detecting mostly Denial of Service (DoS) attacks.

2. Background

This section is divided into three subsections. First, related work found in the literature that addresses the same problems is described. Then, due to their importance for this work, the datasets used in this work are presented. Finally, the security model used to protect the communications between all the architecture’s entities is explained.

2.1. Related Work

VANET security is a well-researched topic, with solutions ranging from the most common and traditional Public Key Infrastructure (PKI) [10,11,12,13,14] to others, such as ID-based or situation-modeling approaches [15]. However, the approach using IDSs, more precisely, intelligent IDSs, is more recent, with interest growing since 2010 [8]. In the Systematic Literature Review (SLR) performed in previous works [8], it was found that the most common approach type of solution used a hierarchical architecture, with 10 of the 19 research works choosing this approach.
There is a variety of technologies in the solutions found; however, authors seem to prefer the following: anomaly detection (8 works) with Simulation of Urban Mobility (SUMO) (4 works) and a version of Network Simulator (4 works) as the traffic and network simulators, respectively. A large variety of attacks has been addressed, including DoS, Probing, Blackhole attack, and Sybil attack. The most commonly chosen ML algorithm seems to be Support Vector Machine (SVM) (3 works). The works found in the SLR are summarized in Table 1.
Authors in [16] propose an ML-based IDS for VANETs based on the ToN-IoT [17]. This dataset is an updated version of the NSL-KDD dataset, containing the most updated attacks. The authors use the SMOTE technique to fix the class unbalance and then compare the performance of the following algorithms in attack detection: Logistic Regression, Naive Bayes, Decision Tree, SVM, k-Nearest Neighbor, Random Forrest, and XGBoost. The dataset is divided using 70% for the training and validation of the algorithm and the rest for testing its performance. The results show that XGBoost has the best performance either in binary class and multi-class classification problems.
In [18] the authors present a SVM-based IDS for VANETs, using an enhanced penalty function for reinforcing the regularization of the classifier and comparing three different ML algorithms for optimization. The test and training are made using the NSL-KDD dataset by dividing it into ten groups. One is used for the test, and the remaining 9 are used for training. The results show that SVM performs better when optimized using the Genetic Algorithm.
The ML-based IDS that is proposed in [19] targets spoofing attacks using a probabilistic cross-layer approach in a VANET comprised of Electric Vehicles. If an attack is detected, the attackers are excluded from the Dynamic Wireless Charging mechanism. One of the contributions of the papers is the introduction of a novel metric used to separate features for the ML algorithms, which is named Position Verification using Relative Speed. It is based on the relative speed that is estimated through the interchanged signals in the PHY layers. The introduction of the new metric increased the performance of the probabilistic IDS by 6%. The authors designed their simulations and attacks using sumo and OMNET++/VEINS simulators. The data created was evaluated using k-Nearest Neighbor and Random Forrest. The performance of both algorithms using the new metric for both was very similar with 91.3% accuracy.
The biggest limitation of these works is related to the datasets. Most of the research works that we found use self-fabricated datasets but fail to publish them or even the methodology used to create them. The ones that use publicly available datasets choose the Kyoto [20] and NSL-KDD [21]. There are two of the most known datasets and they have great quality, but do not originate from VANETs. The authors in [18] choose the ToN-IDS, which is an update of the older NSL-KDD, which is also not from VANETs.
Table 1. Related Work—ML-Based IDSs for VANETs.
PaperNet SimTraffic SimAttacksIDS TypeDetection TypeMLDatasetPlacement
[22]OwnOwnMalicious packetsHierarchicalAnomalyLearning
Automata
From
Simulation
Base
Station
[23]NS2N.A.DoSHierarchicalAnomalyNeural NetworksNS2 Trace fileAccess Points
[24]NS3SUMODoS, R2L, U2R,
Probing
HierarchicalAnomalyNaive Bayes
and
Logistic Regression
TCPdumpEach cell
and
vehicle
[25]NS3SUMOSelective Forwarding, Black Hole, Packet duplication, Resource Exhaustion and Sybil attackHierarchicalRule Based and AnomalySVMNS3 Trace fileVehicles and RSUs
[26]DoSHierarchicalMisuse and AnomalyNeural NetworksKyoto DatasetN.A.
[27]MatlabVANET Mobisimpacket droppingHierarchicalWatchdog and AnomalySVMFrom
Simulation
Vehicles
[28]NetSim and MatlabSUMOWormhole, Selective
Forwarding, Packet
Drop
HierarchicalAnomalySVMNS2 Trace fileVehicles
[29]N.A.N.A.DoSHierarchicalN.A.N.A.N.A.N.A.
[30]--Network AnomaliesHierarchicalAnomalyLogistic
Regression
NSL-KDDVehicles
[31]NS2SUMONetwork AnomaliesHierarchicalN.A.HGNGFrom
Simulation
Vehicles
N.A.: Not Available.

2.2. Datasets

Despite the advantages of ML algorithms’ anomaly detection capabilities, they need large sets of data to be trained and tested. Therefore, this is a key aspect of this work. Unfortunately, in the previously performed SLR [8], it was found that most of the research work in the literature fails to publish their datasets or the methodology used to produce them. Thus, the VANETs datasets that were made and publicly published in a prior work [32] were selected.
The datasets were created through simulation using the SUMO and Network Simulator 3 (ns-3) as the traffic and network simulator, two of the most popular simulators [8]. These can be used individually by running the simulation in SUMO and then feeding the output to ns-3. However, if coupled together, more functionalities and bidirectional communication can be obtained. V2X Simulation Runtime Infrastructure (VSimRTI) [33] was the chosen framework to do this. Developed in Java by the Daimler Center for Automotive IT Innovations (DCAITI) institute it has permanent support and frequent updates. Additionally, the structure of the framework abstracts the application development from the network, facilitating the independent development.
Ideally, the datasets would be from real-world data, not from simulation, but real data collection is a complicated process as currently there are not so many vehicles with wireless communication devices that allow message collection. Additionally, the entities that possess this data do not make it available. Nevertheless, using publicly available datasets enables the results to be verified and compared with others.
Thus, a simple scenario was implemented where all vehicles are loaded with an application that generates Context Awareness Messages (CAMs) according to the standard EN 302 637-2 [34]. The parameters used are shown in Table 2. These Indicate that a CAM is only generated if there is a position change of at least 4 m, a change in heading bigger 4.0 degrees, or a speed change of more than 0.5 m/s. However, the interval between CAMs must be at least 100 ms. If none of the parameters varies enough, a CAM must be generated each 1000 ms. The CAMs were chosen due to their generation rate. They have a dynamic rate that changes according to a set of parameters, accurately simulating a real-world scenario. Moreover, the usage of CAM simulates a scenario easily implementable in the real world. It is a generic standard used by all vehicles that have communications-enabled devices. Thus, it seems to be the most indicated application to use in the message collection.
Forty-two different datasets, collected from seven different maps, are publicly available. Each map deals with a different geographic location, with different characteristics (number of vehicles, types of roads, intersections, etc.). The maps range from 2618 to 37,248 m and the average vehicle density—computed using the number of vehicles in radio range per second—ranges from 6 to 35.
The datasets also contain two different simulated attacks, DoS and Fabrication. In the former, all the messages have real values but are generated at much higher frequencies to overload the medium and the receiving equipment. The latter contains messages with fake data simulating an attacker or even a faulty sensor. The fabrication attack can be subdivided into three: speed fabrication, acceleration fabrication, and heading fabrication.
All the attacks are performed in all maps, so more than one dataset is obtained from the same map. However, the attack type and the number of attackers per simulation varies, and the time and duration of each attack are random, resulting in entirely different scenarios.
All datasets contain data regarding the following information: senderId, receiveId, receverTime, diffTime, heading, longAcceleration, generationTme, elevation, latitude, longitude, bitLen, diffPos, diffSpeed, diffHeading, diffElevation, diffAcc, and isAttack.
The datasets are available at https://doi.org/10.5281/zenodo.4304411 (accessed 5 October 2021), and the code used for their fabrication is available at https://github.com/fabio-r-goncalves/dataset-collection (accessed on 5 October 2021).

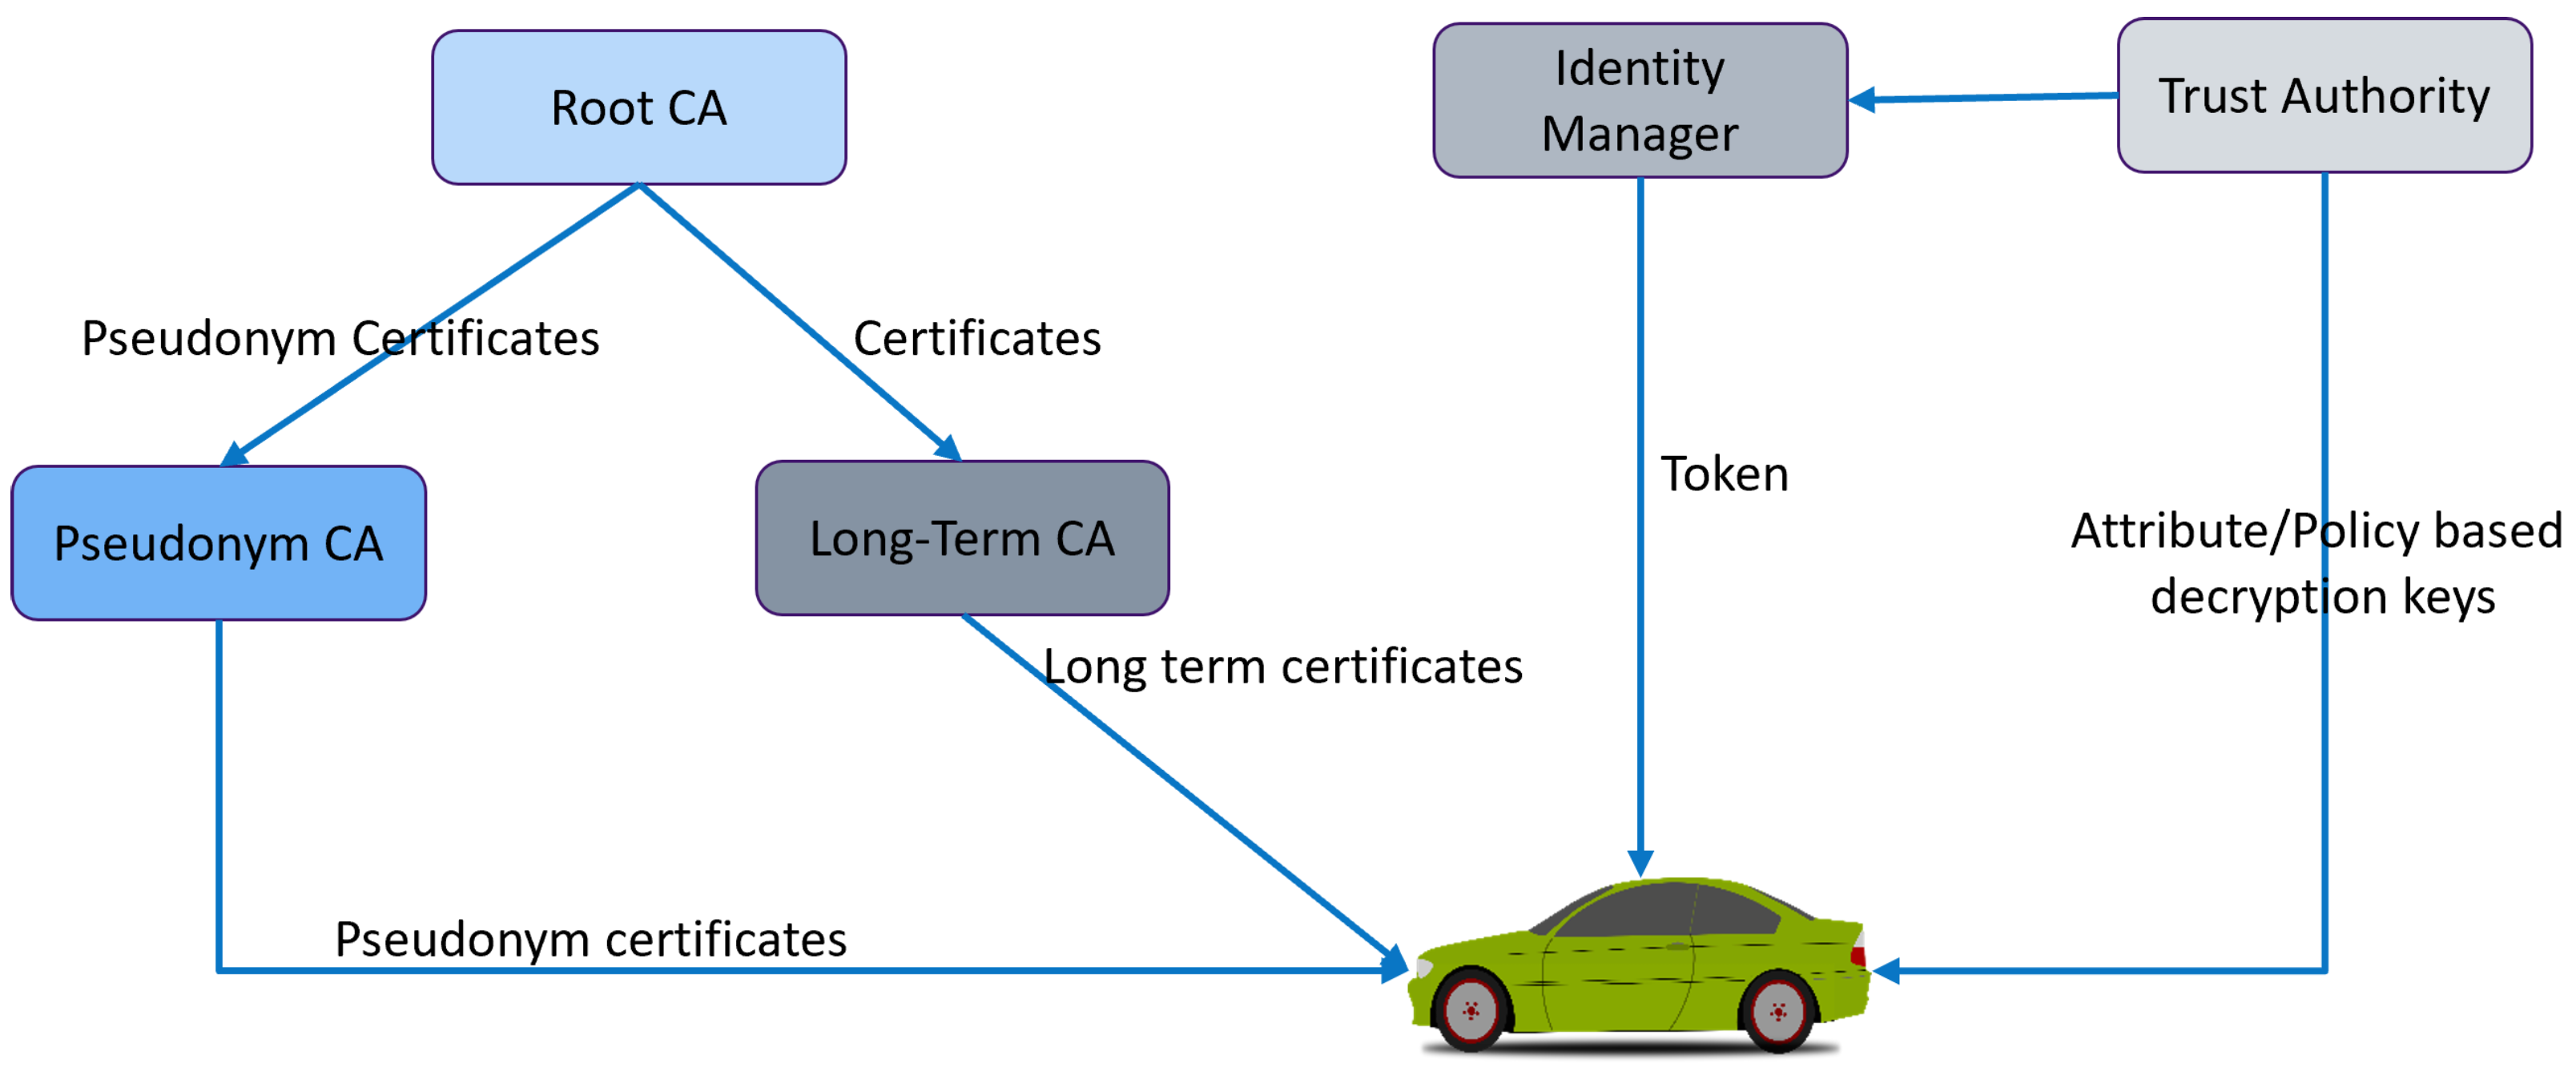
2.3. Securing Communications

A secure communication framework is needed to enable the nodes on a multi-cluster multi-level architecture to exchange messages securely. There are several approaches to security in VANETs, each presenting their stronger points and challenges. However, the application layer security model Vehicular Ad hoc Network Public Key Infrastructure and Attribute-Based Encryption with Identity Manager Hybrid (VPKIbrID) proposed in a previous research work [35] can take advantage of multiple techniques and tackle the challenges of other approaches.
VPKIbrID (shown in Figure 1) uses technologies from both Attribute-Based Encryption (ABE) and PKI, combining the flexibility of ABE with the infrastructure offered by the PKI. The model comprises the following entities: Root Certification Authority (CA), Long-Term CA, Root CA, Identity Manager (IdM), and Trusted Authority (TA).
The first three entities are very similar in their basic functionalities, generate certificates but differ in their roles. The Root CA is responsible for certifying the Pseudonym CA and the Long-Term CA. It issues root certificates that are then used to sign the certificates generated by the latter two entities.
The Pseudonym CA and the Long-Term CA generate certificates for the rest of the system entities. The first generates Pseudonym Certificates (PCs), volatile certificates that allow entities to sign and encrypt messages in the network without risking their privacy. The Long-Term CA generates Long-Term Certificates (LTCs), certificates that represent the real identity. These should be used only to access trustable services, as for example, to access the IdM or to obtain PCs.
The IdM generates Oauth/OpenID connect like tokens. These can be used to access services or resources while protecting privacy.
Lastly, the TA enables the usage of ABE keys. It is the only entity that can generate Public Parameters and ABE decryption. The public parameters allow any entity in the system to generate an ABE encryption key.
This model was designed to take into account the intrinsic needs and requirements of the VANET environment. One of its key advantages is the available different encryption modes: VPKIbrID Public Key Infrastructure (VPKIbrID-PKI) and VPKIbrID Attribute-Based Encryption (VPKIbrID-ABE). The first uses the most commonly used PKI to cipher the data to be exchanged. The VPKIbrID-ABE uses ABE encryption. It uses attributes to encrypt the data, enabling data to be ciphered to multiple entities. This means that it fits the scenario in this proposal, allowing the entities to secure messages without ciphering them individually to each target. For example, if the goal is to cipher rules to each of the nodes in layer 2 in map 2, the attributes “ L 2 map2 2of2” can be used. This enables the higher-level entities to send the rules or models to all the intended targets without the possibility for other entities to read them. More precisely, this rule specifies that only entities with the attribute “ L 2 ” and “map2” will be able to decipher the message. The “2of2” parameter means that both of the attributes need to be satisfied. With this methodology, it is even possible for entities from different companies to send the rules for only the vehicles subscribing to their service, such as “ L 0 company1 2of2”.

3. Intelligent Hierarchical Security Framework for VANETs
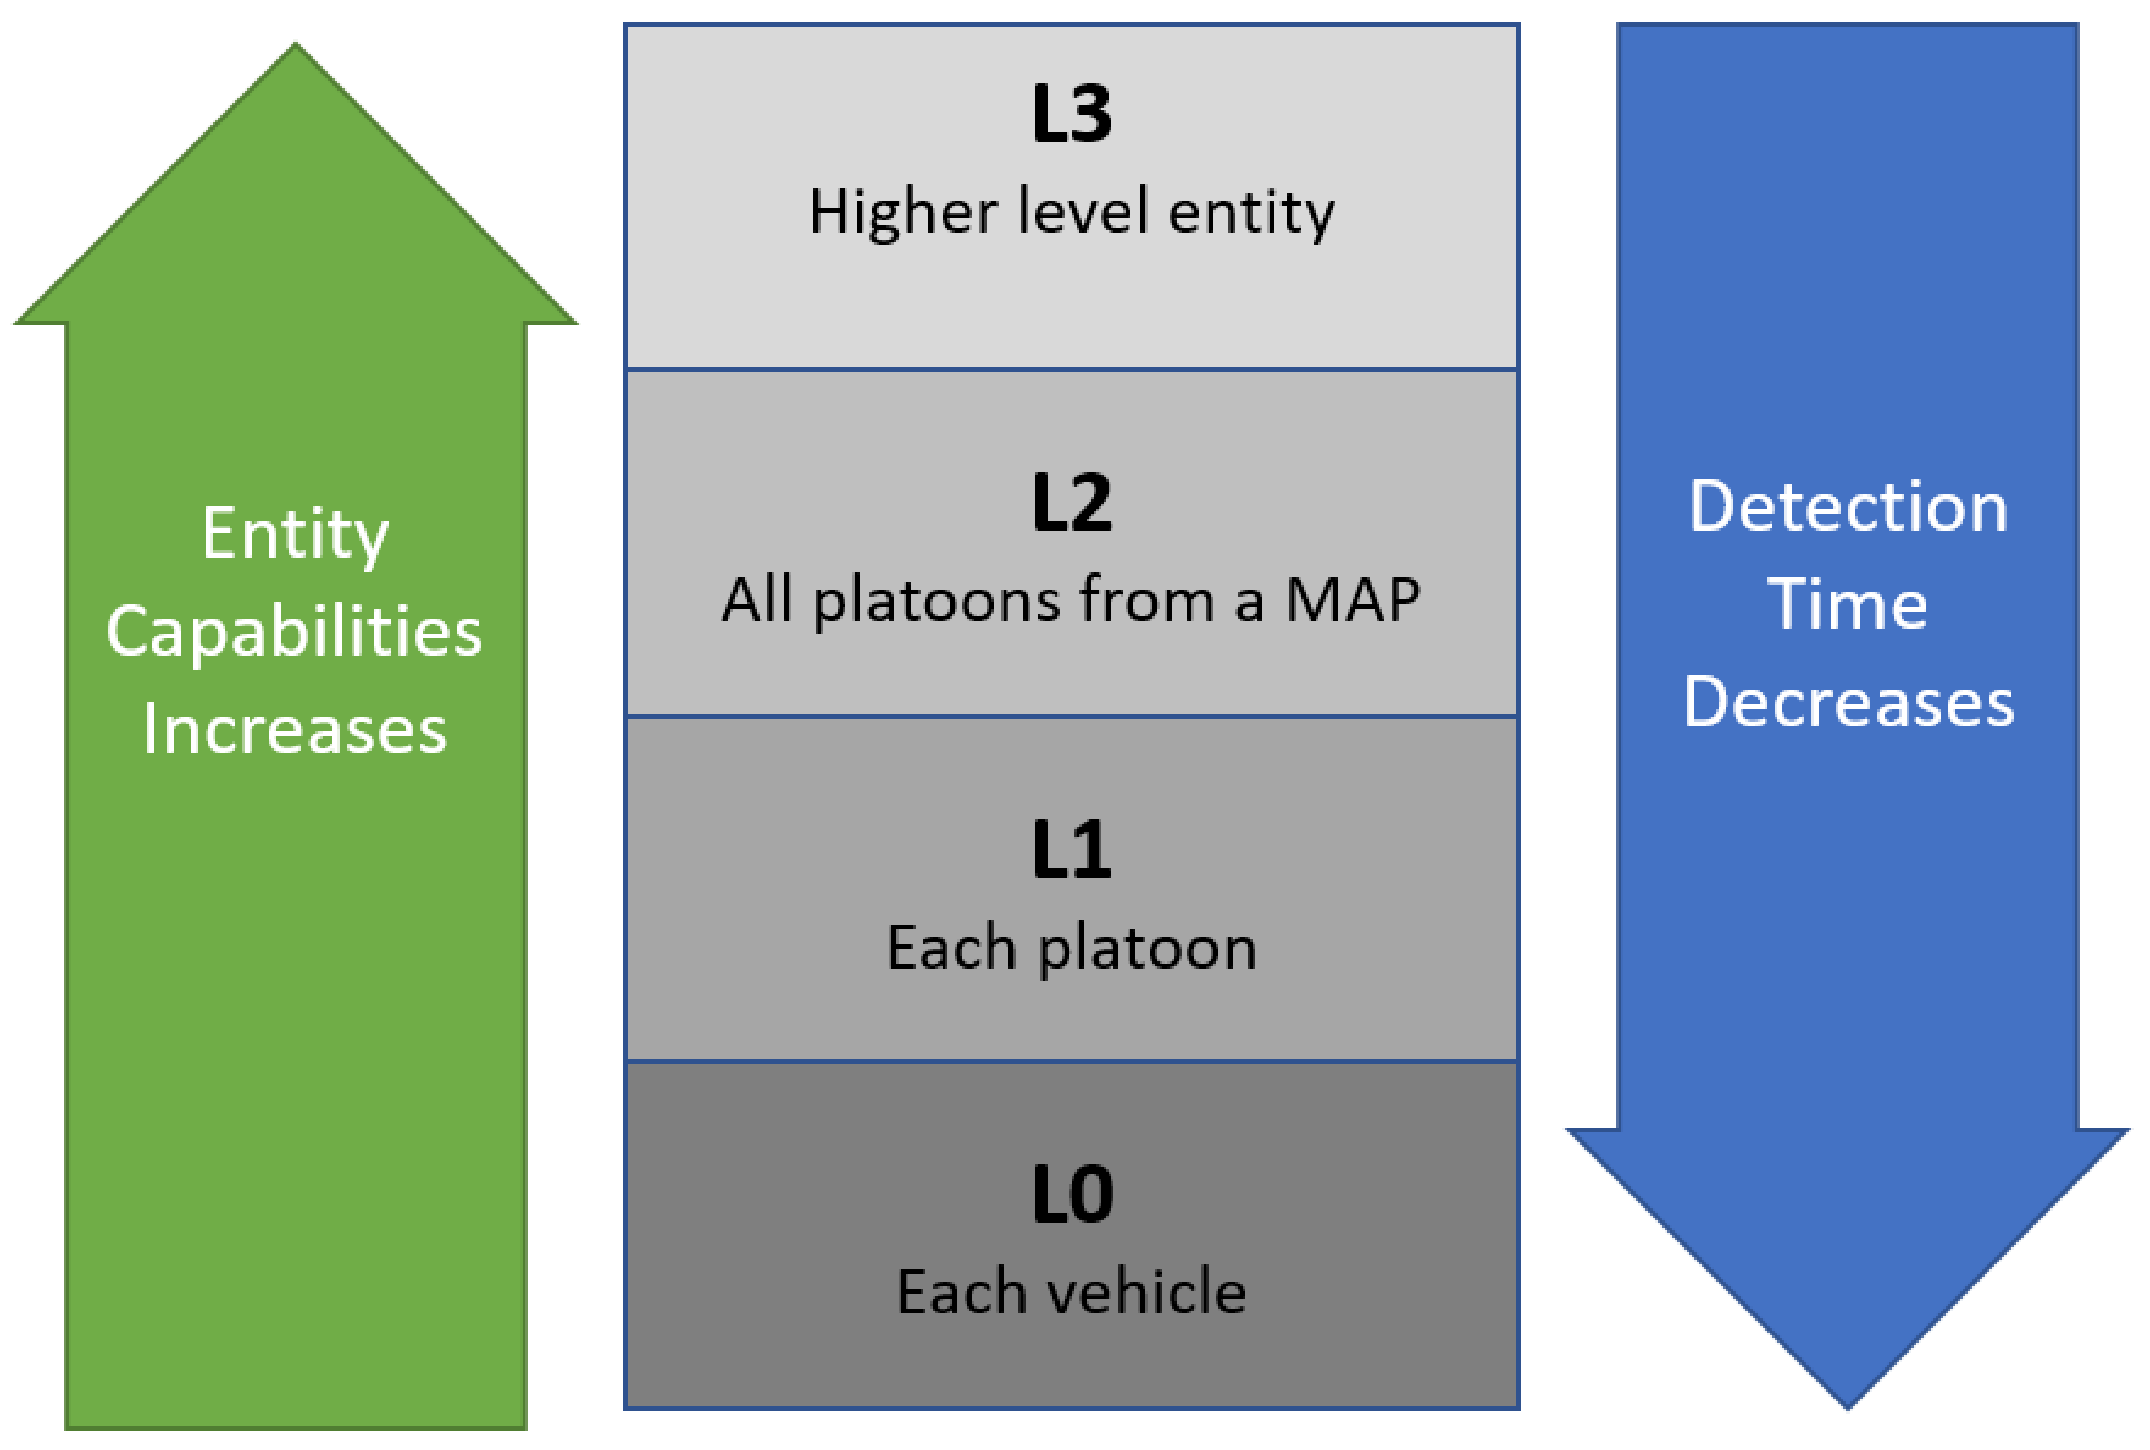
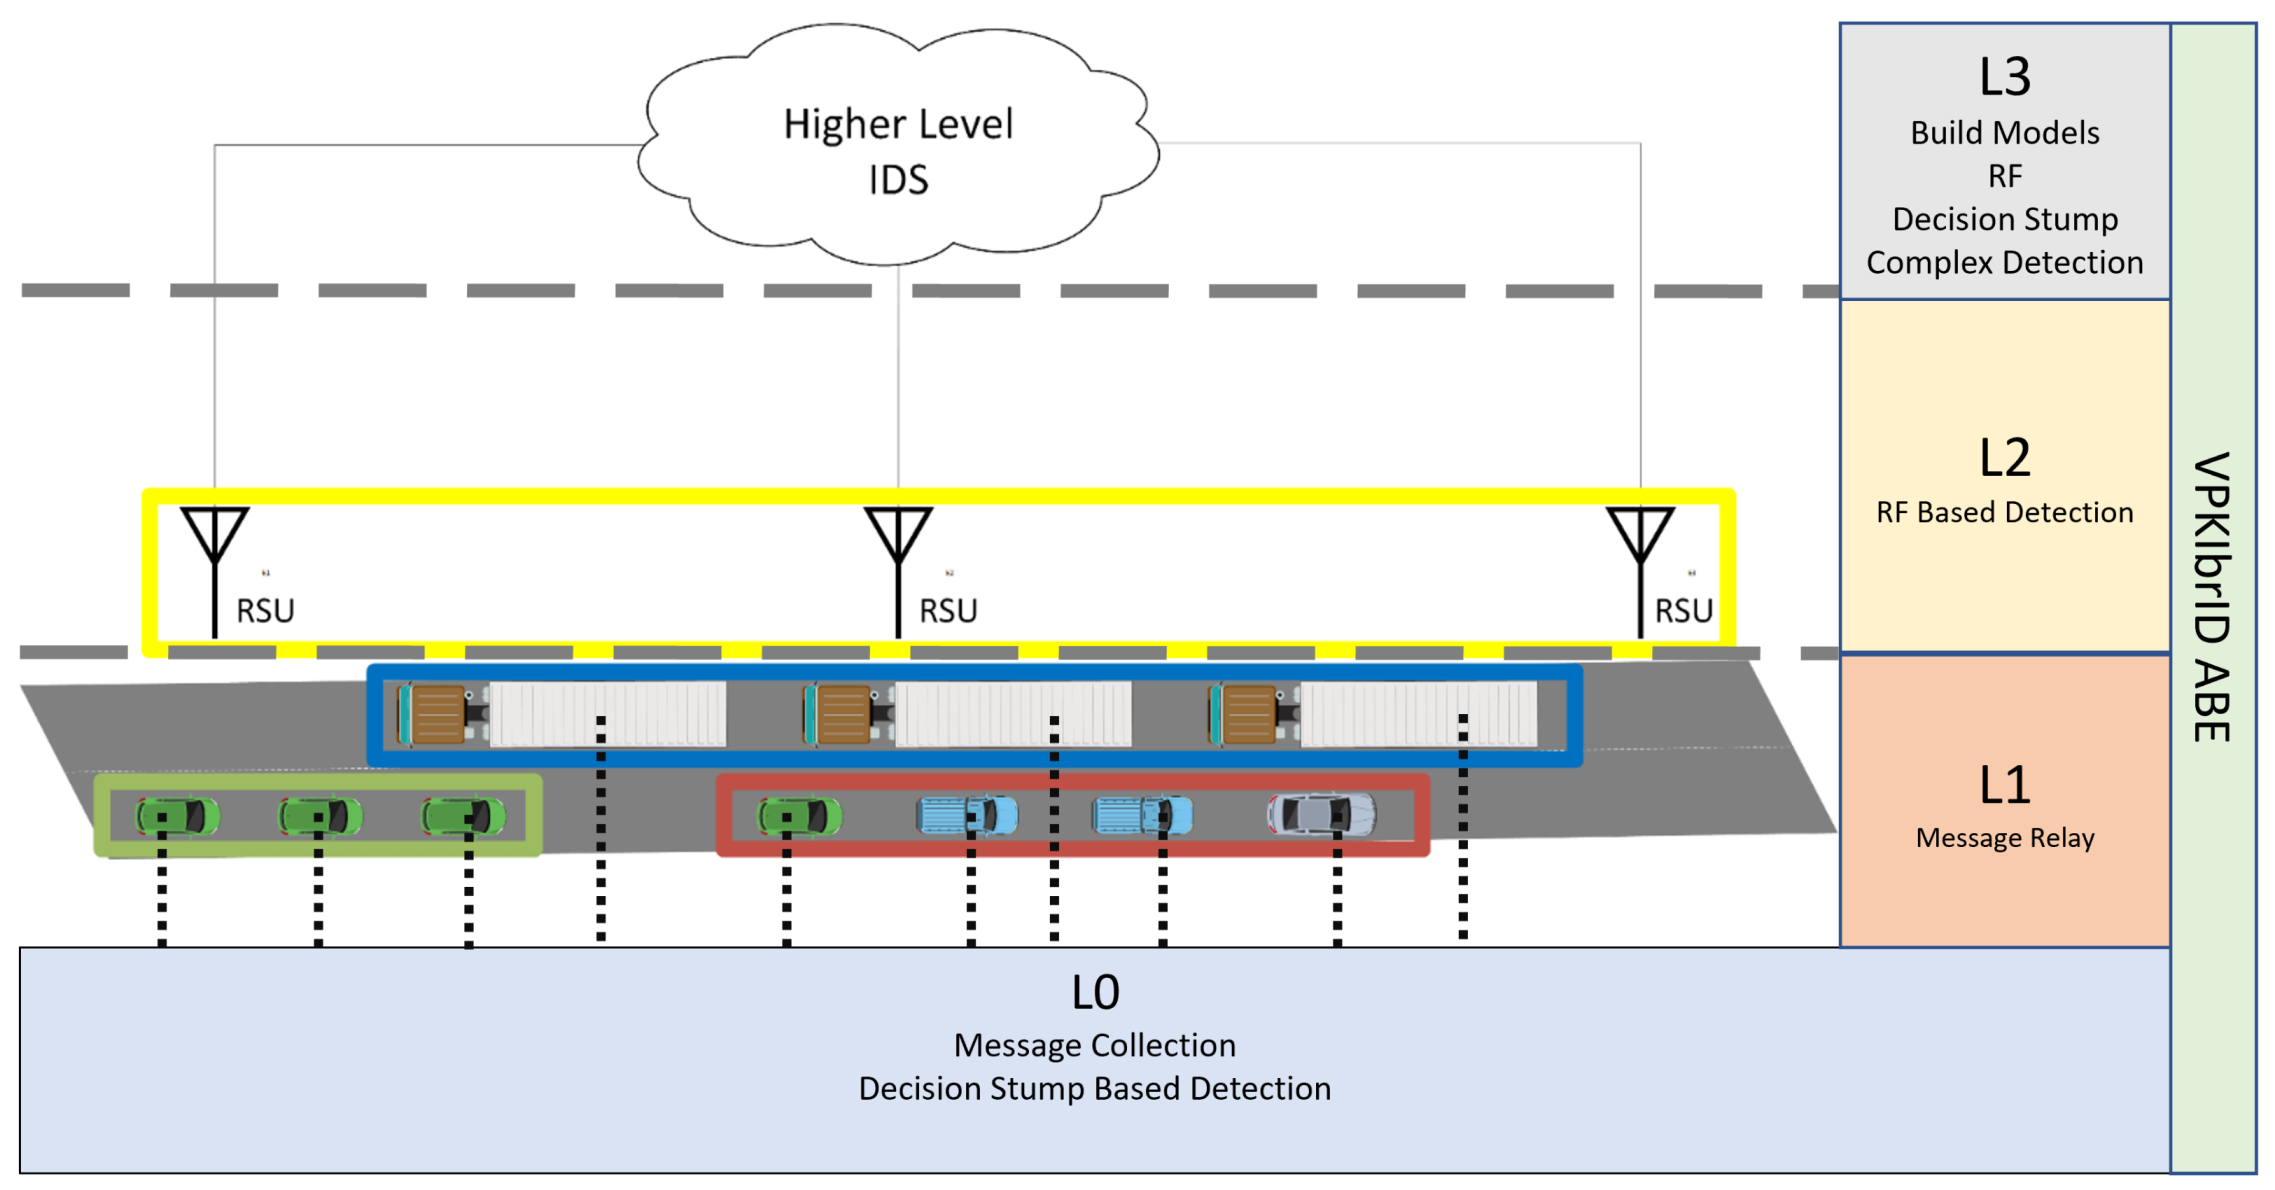
This work aims to propose an Intelligent Hierarchical Security Framework for VANETs, which can detect multiple types of attacks at multiple levels while also providing strong security mechanisms for all the entities to be able to have reliable communications.
This section describes the architecture of the framework, as well as the underlying security framework and the interactions between all the entities.

3.1. Architecture

The architecture of the IDS is based on a hierarchy. Thus, it presents multiple levels, each composed of multiple clusters of entities that share the same characteristics, functionalities, and needs. Therefore, the design of the architecture should facilitate the detection to be made at several levels, carefully evaluating each cluster’s best functions and detection types, according to their capabilities—processing power, storage capacity, etc.—and needs—detection time, delay, accuracy.
The solutions should also encompass a security framework to enable the secure exchange of information between the cluster nodes, considering the needs and requirements of VANET applications. In addition, the security frameworks should provide an underlying communication secure channel that should facilitate secure broadcast communications, authentication at multiple levels (driver authentication, entity authentication), privacy, and confidentiality, without disregarding the availability and latency requirements.
Figure 2 presents the architecture from the functional point of view. It includes the layer division and the secure channel across the layers. The goal of the design was to attribute more complex and CPU-heavy functions to the upper layers, reserving quicker and lighter operations for the lower layers. Hence, this takes advantage of the characteristics of the nodes at each layer and provides quick responses at the lower layers. The architecture is divided into the following levels:
  • L 0 —Each vehicle on the map. These are the smallest cluster composed of only one entity
  • L 1 —A group of vehicles organized into a single cluster;
  • L 2 —All the vehicle clusters within a geographical region;
  • L 3 —Cluster of all geographic maps;
L 0 is the lowest level in the hierarchy. It is made by a single vehicle that is the least powerful entity in the network, containing less CPU power and storage capacity. However, these are the entities closer to the communications. They receive the messages directly and need to analyze them as quickly as possible to allow a decision in usable time. If the detection at this level is too slow or heavy, it may facilitate a DoS attack, hence the functionality that was chosen for this entity. It will receive messages from the other entities and only apply Rule-based detection, one of the quickest types of detection. At this level, quick decisions may be more important than the overall accuracy. However, the rule-based detection needs to have a very low rate of false positives when analyzing the normal messages; otherwise, it will discard authentic messages.
L 1 is the first level composed of more than one entity. It is formed of multiple vehicles that compose a cluster. The vehicles can be grouped, for example, according to their travel path and speeds. This facilitates the sharing of information during bigger intervals of time, as they will be traveling in the same route in communication range from each other. This level will not perform any type of detection. The entities that compose it are the same type as the node before and, thus, do not present any advantage of CPU power or storage capacity. The only difference is the time the detection takes to reach the entity that needs the response. So, at this level, all the entities will send the messages to the cluster head (platooning leader), and this entity will relay the messages to the node above.
L 2 is a cluster with entirely different characteristics from the previous clusters. It is composed of infrastructural nodes capable of much more complex and heavy operations. Additionally, it can have hardwired communications with the above level, being able to communicate much more data. The RSUs will receive the messages from the nodes below and simultaneously analyze them and forward them to the next node. If an attack is found, it is communicated immediately to the sender. They can also trigger a system-wide warning and warn the nodes above to blacklist the attackers. These nodes will use more complex and powerful ML algorithms to detect the attacks, trading detection time for better accuracy. The RSUs are not as close to the attacks and do not need to detect immediately; it is more important to have better accuracy at this level.
L 3 level is the highest level in the hierarchy. It comprises the most powerful entities that may carry much more complex operations and store messages, models, and rules. In addition, these entities are generally powerful backend servers with high-performance CPUs. Hence, L 3 entities can collect the messages sent from all the bellow nodes and analyze them, creating ML models and rules to be used by the other levels. These high-level entities are very far from the nodes needing detection; thus, the detection time is not an issue here. They can also perform “offline” detection, using the result to trigger a system-wide response, blacklist attackers, and, if needed, notify the authorities. So, at this level, the goal is to use the more complex detection, which is slower but may detect attacks that are undetectable by other entities.
The resulting architecture is presented in Figure 3. The figure is divided into two blocks, representing the network level at which each node is located. The levels L 0 and L 1 are in the VANET. The node L 2 connects the two types of network, and the node L 3 is located on the Internet, with only cabled communications; the right side depicts the communication of the CAM messages from the sending vehicle to node L 3 . Each time the message has a yellow padlock, it means that it is encrypted. As shown in the figure, the multiple nodes also forward the messages and group them into bigger blocks; the left side depicts the communication of the models and rules from the L 3 nodes to the L 0 . The rules are shown in orange and the models in green. Additionally, Figure 3 shows which function each cluster has on top of forwarding messages. Nodes in L 0 use the rules to analyze the collected data and, in L 2 , they use the ML models.

3.2. Secure Communications

The security implementation in this architecture is represented in Figure 3 by the blue rectangle across all the layers. It provides multiple communication types allowing entities to take advantage of the better suited for the situation. For example, one of the VPKIbrID modes uses PKI, which is more suited for unicast communications, with only one receiver for the sent message. The other uses ABE, which is useful in situations where there are several targets for one message. Using VPKIbrID-ABE, the sending entity may encrypt the message for multiple entities, using their corresponding attributes. In this case, the VPKIbrID-ABE seems to be the better suited, as most of the communications will have multiple targets, at least when happening between clusters. However, this mode is slower and heavier than the PKI mode. Still, the VPKIbrID provides the possibility to use key cashing, significantly increasing its performance. For example, when receiving CAMs, the vehicles can encrypt the received messages using the attributes “ L 2 L 3 1 o f 2 ”; thus, all the clusters L 2 or L 3 entities can read the messages. The field 1of2 means that only one attribute needs to be fulfilled. It is even possible to use attributes like “ L 2 -company1 L 3 -company1 1 o f 2 ,” specifying that only the nodes from clusters L 2 or L 3 from company1 can decrypt the message.
Multiple entities in the architecture need to communicate to exchange the information necessary for the detection. The lower entities send the received messages for the upper nodes (Upstream communication, Section 3.2.1), and the higher-level entities send the models or rules created for the lower entities (Downstream communication, Section 3.2.2).

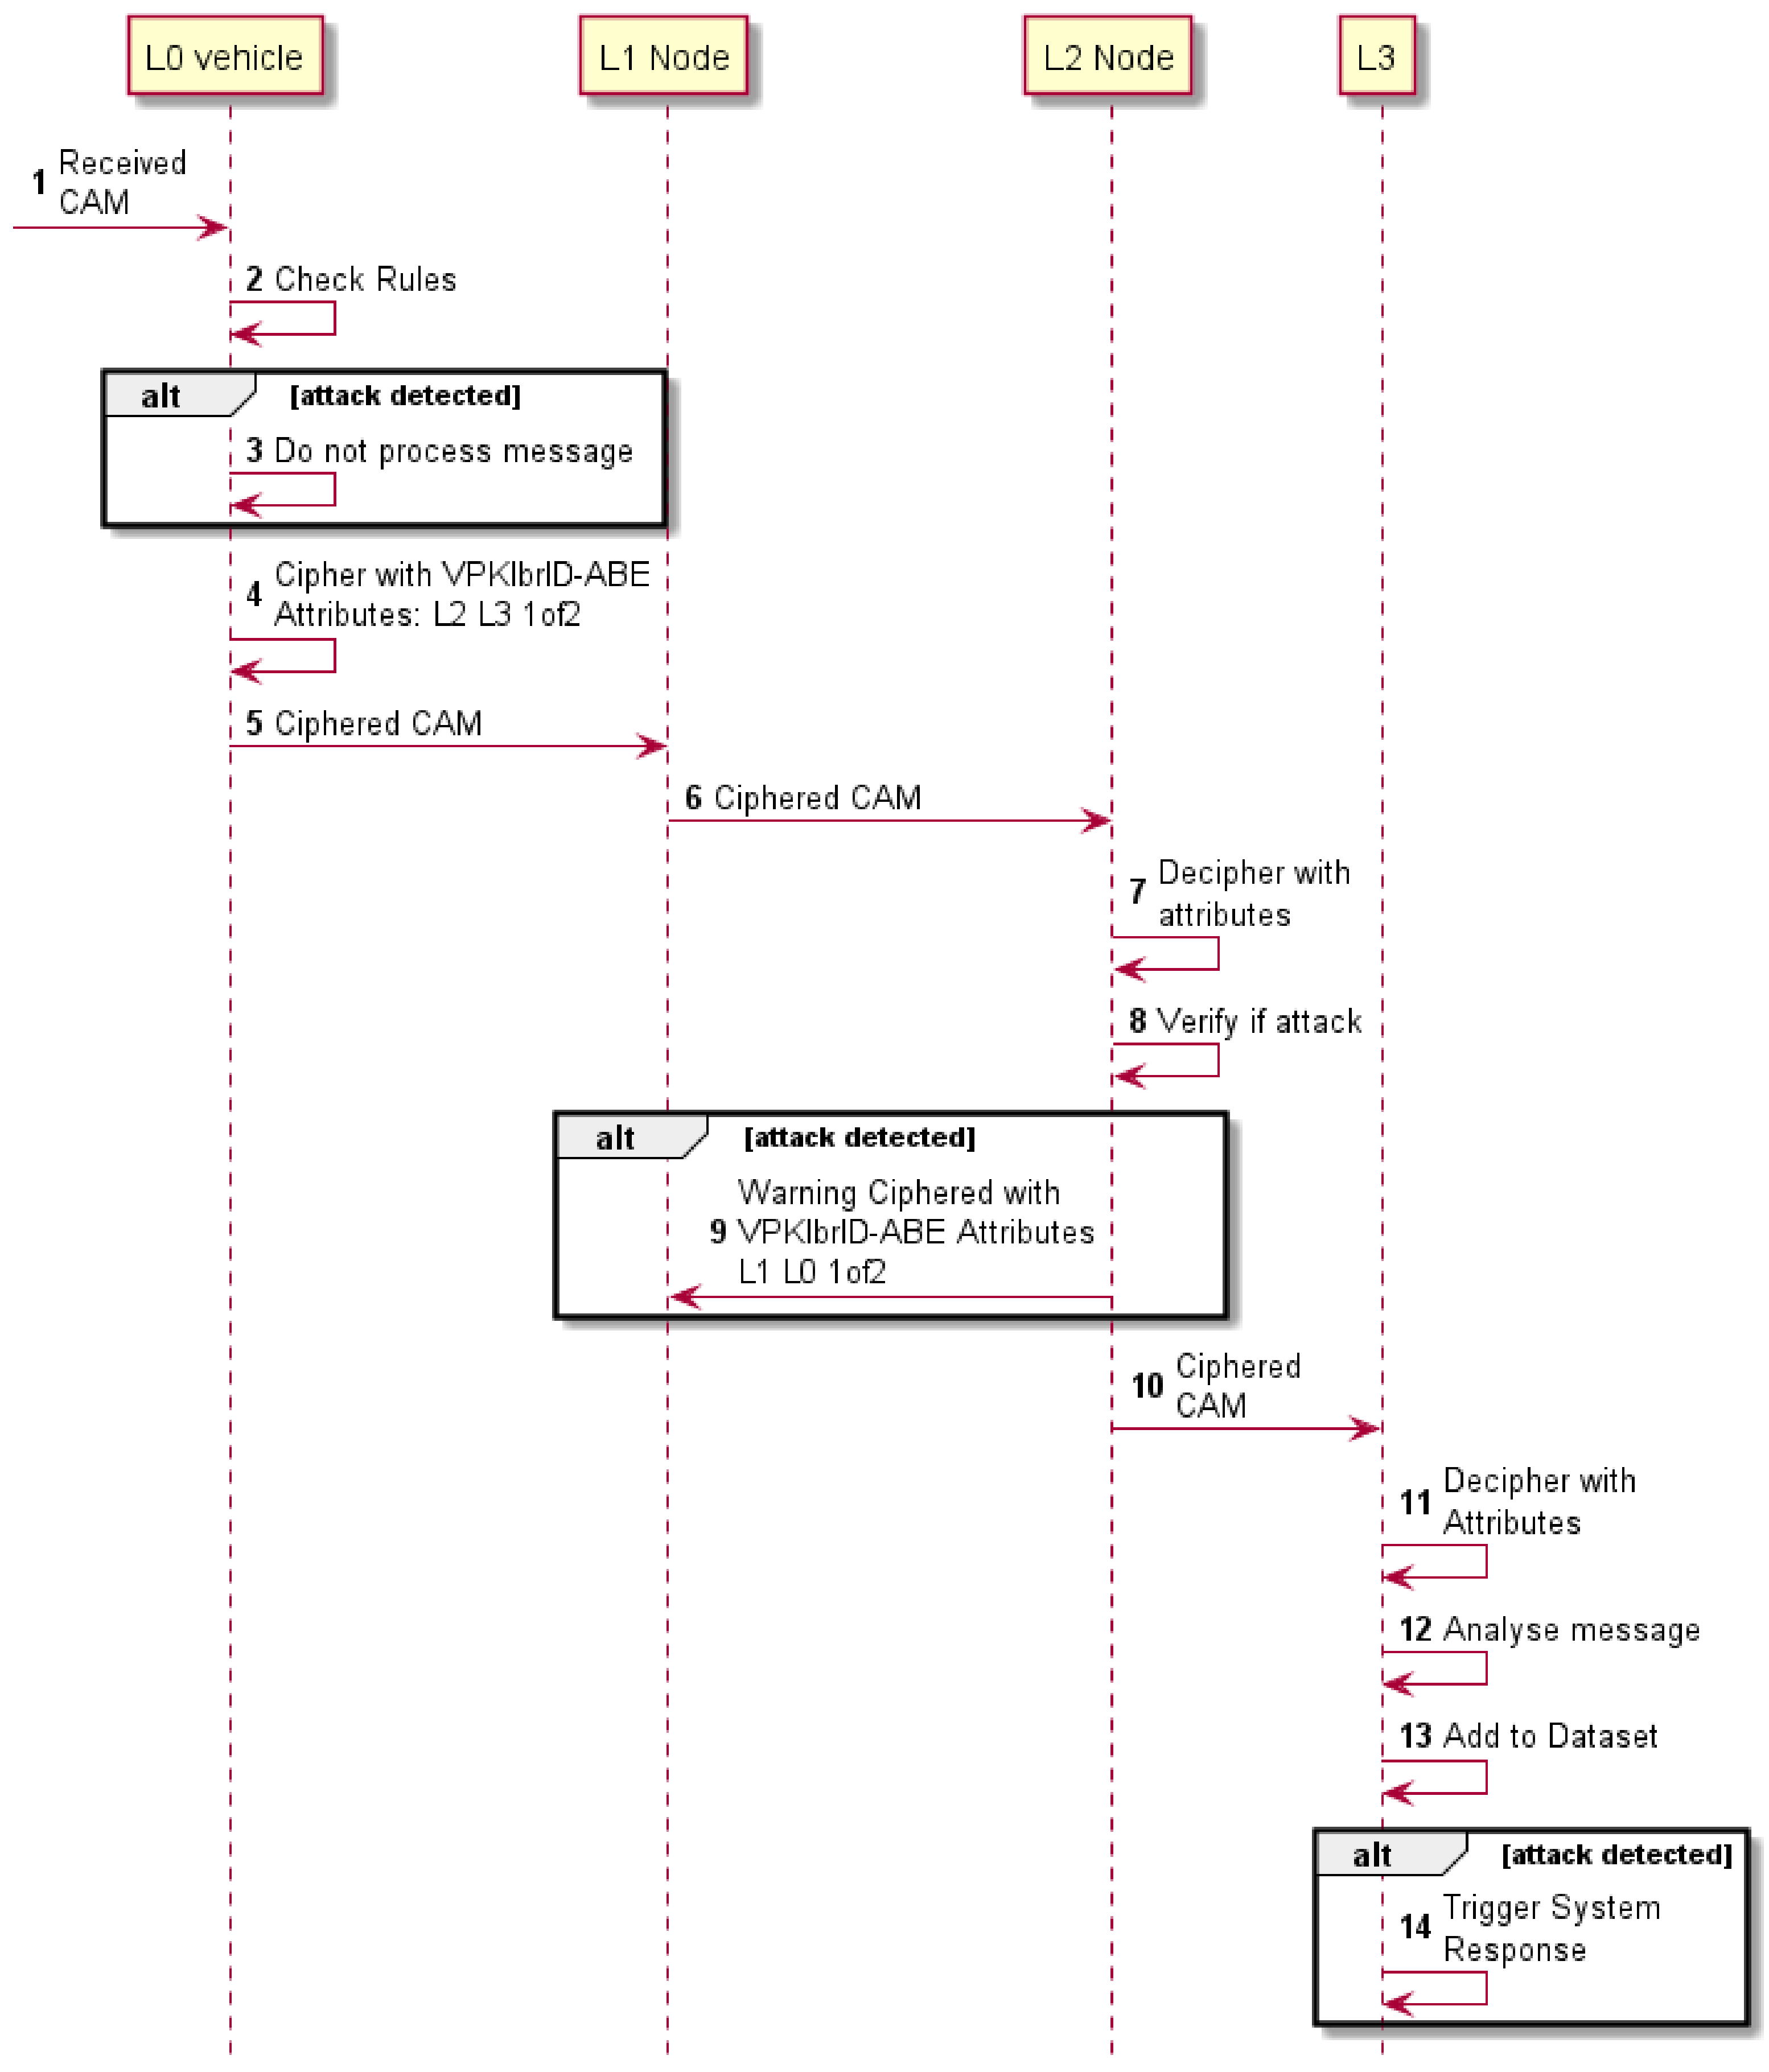
3.2.1. Upstream Communication

The upstream communication refers to messages sent from the nodes in level L 0 to the upper nodes in level L 3 . In this case, the vehicles receive the CAMs sent from other vehicles and, after analyzing them, send them to the other levels. The messages are going to be processed both in nodes L 2 and L 3 . So, the encryption mechanism needs to be able to encrypt the message so that entities in both nodes can decrypt them without needing multiple encryptions. Otherwise, if the vehicles, an already low resource entity that needs to be constantly analyzing the received messages would also need to encrypt the messages multiple times, would easily be overwhelmed. Thus, VPKIbrID-ABE seems to be the optimal choice for this scenario, mainly when taking advantage of the key caching mechanism. The entities receiving the data have the same attributes during long periods, being the perfect scenario for key caching. If L 2 and L 3 nodes detect any attacks in the messages received they can send the warnings encrypted using ABE to the nodes on L 0 and L 1 .
Figure 4 shows the complete interaction from the vehicles ( L 0 ) to the L 3 whose description follows. Firstly, the L 0 vehicle receives a CAM (1), and using the rules sent by the L 3 entity, verifies if it is any attack (2). If so, the message will not be processed by the vehicle (3); the message is then ciphered (4) and sent to the upper level (5). The level L 1 only acts as a relay. So it will do so for the level L 2 (6). L 2 will decipher the message (7) and verify if it is an attack using the models built by the level L 3 (8). If an attack is detected, the other entities are warned about the attack. So, a message is sent ciphered using the attributes “ L 0 L 1 1 o f 2 ” (9), enabling all the lower entities to read the message. Regardless of whether it is an attack, the message is relayed to the upper level (10). The next level will then decipher the message (11), verify if it is an attack (12), and add it to the dataset (13). If an attack is detected, a system-wide warning is triggered (14).

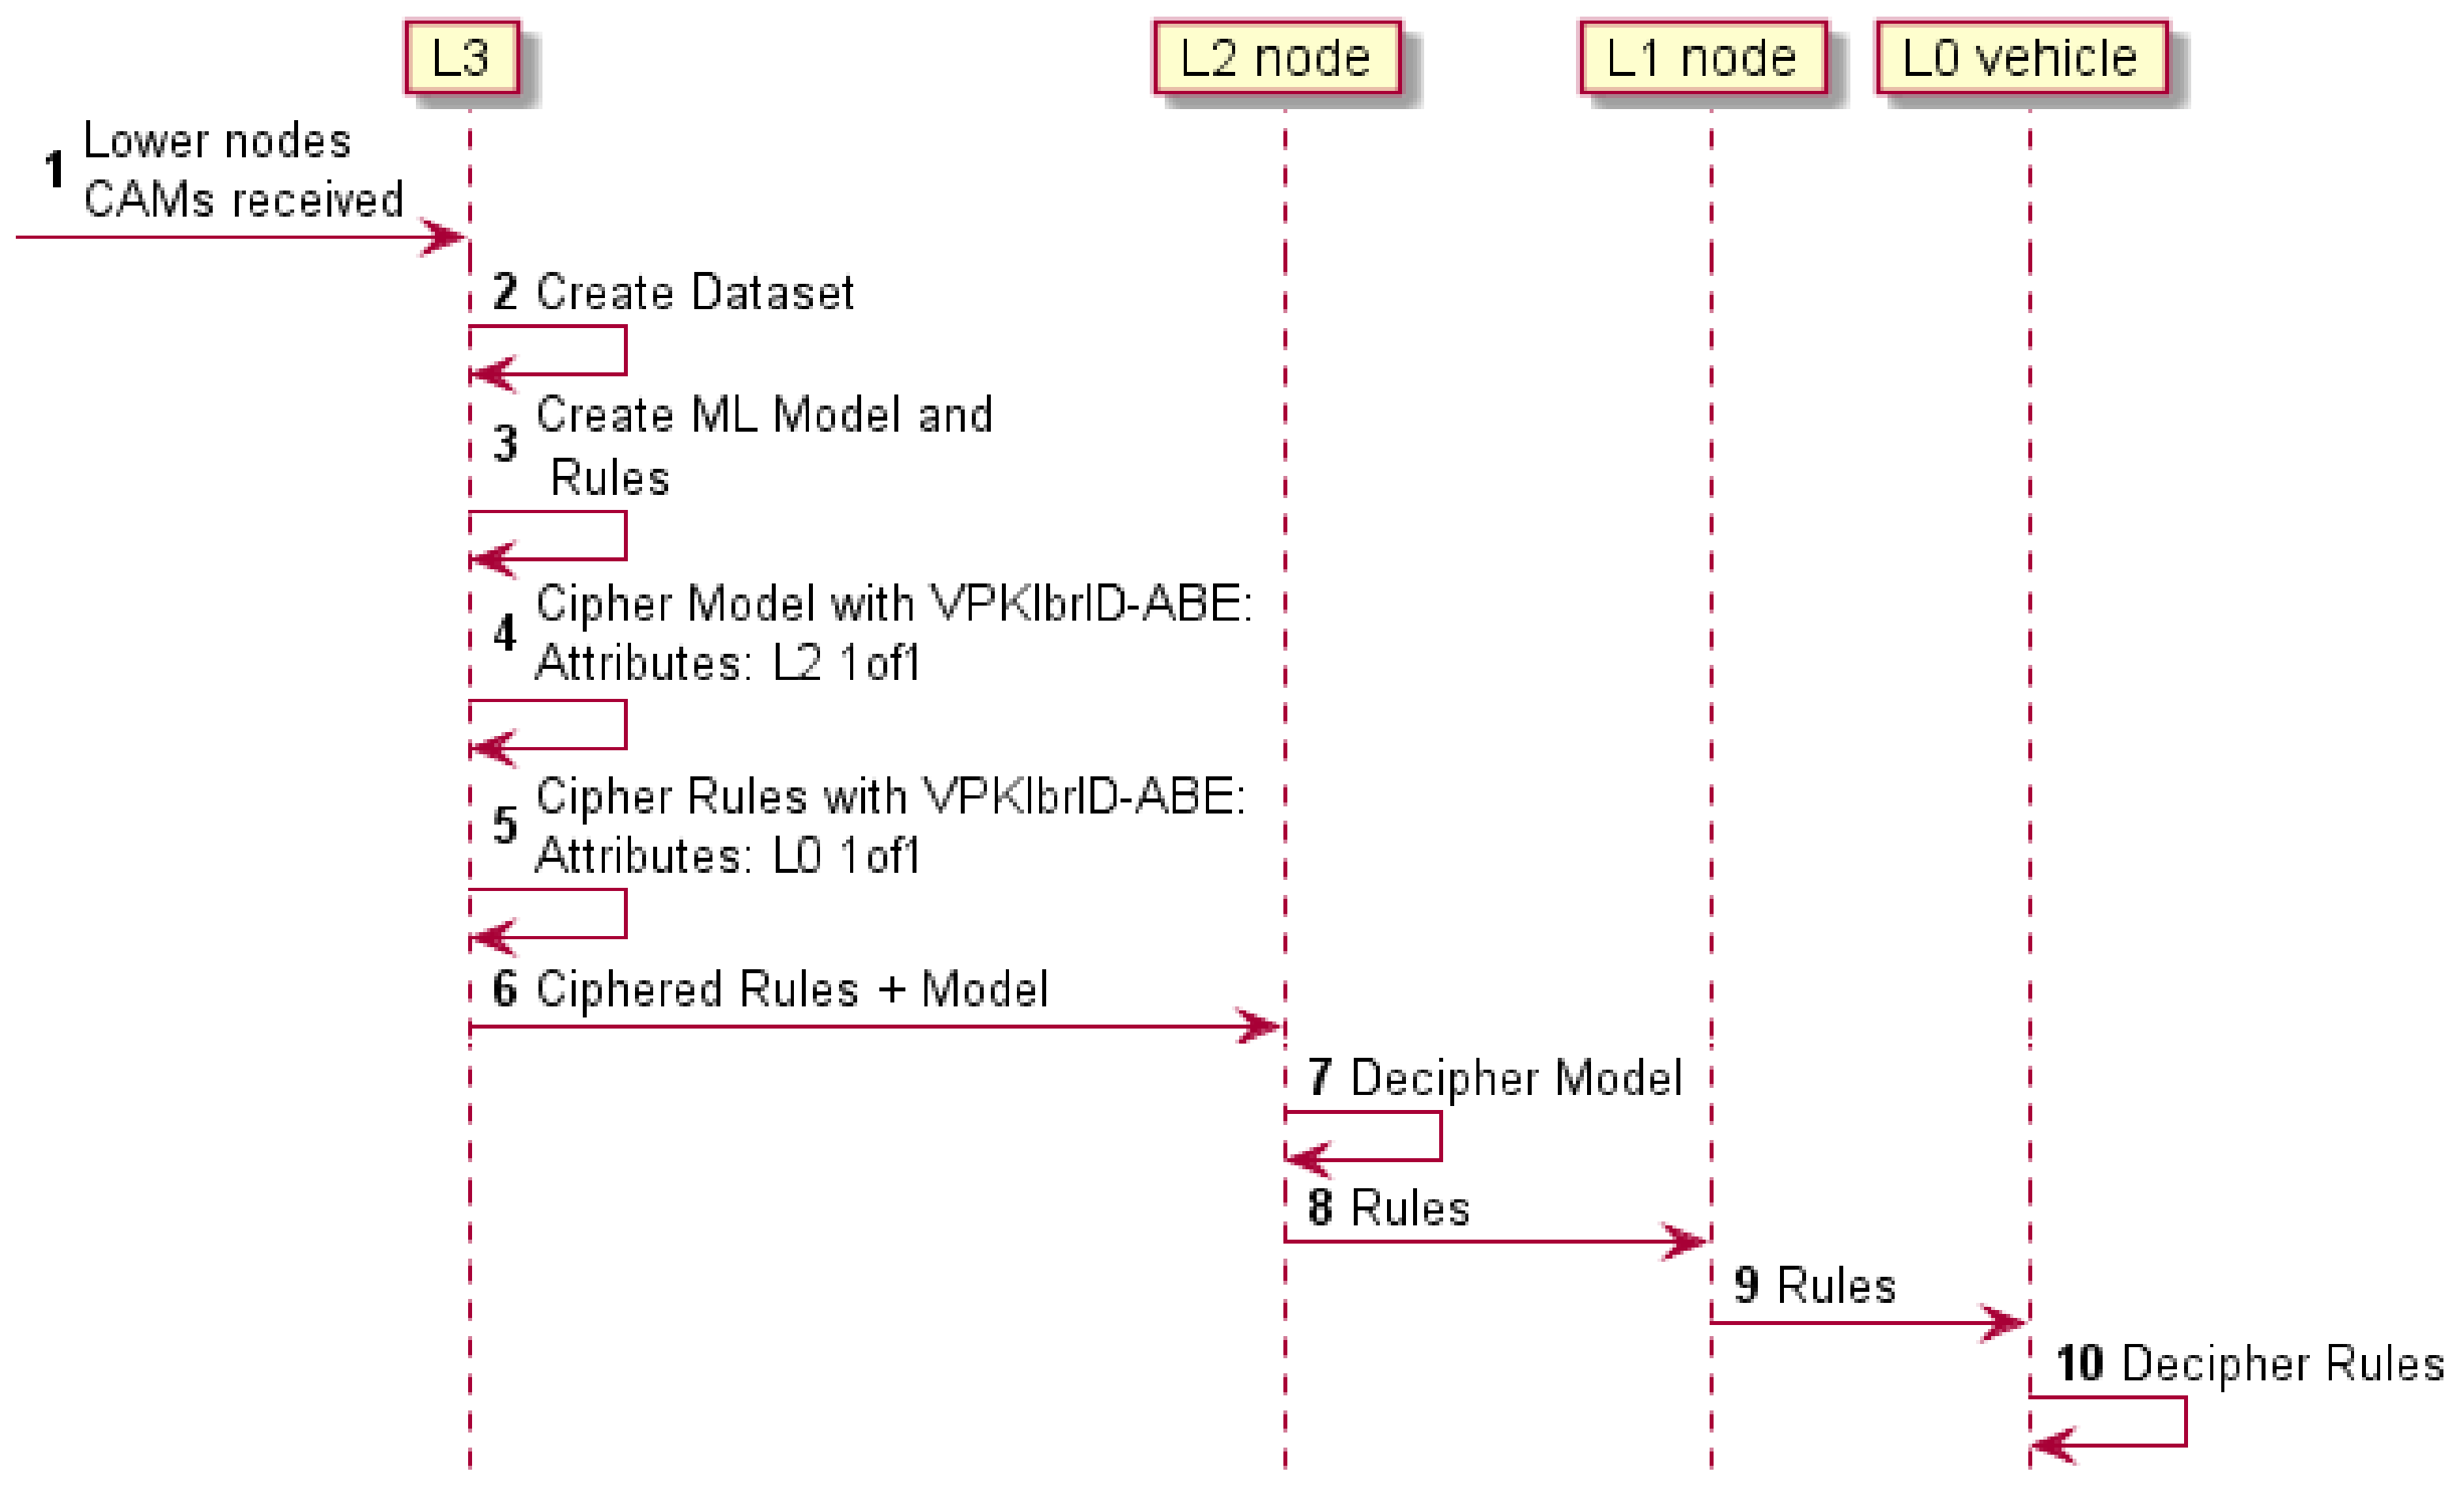
3.2.2. Downstream Communication

The downstream communication is exactly the opposite of the previous type. This communication process happens when the higher-level nodes, L 3 , need to communicate the computed rules and ML models to the lower nodes, in this case, to the L 0 and L 2 nodes, respectively. This is less complex than the upstream communication because there is no warning going in the opposite direction. This communication mode also takes advantage of the encryption to multiple targets provided by the ABE mode of the VPKIbrID security framework. It enables the higher-level entities to send the models and rules for all the nodes in L 2 and L 0 levels simultaneously using the attributes that describe the cluster where they are located instead of the node itself. Otherwise, the L 3 nodes would have to send messages individually to each target, with the risk of saturating the communication channels.
The top-level entities can then use the attributes “ L 2 1 o f 1 ” and “ L 0 1 o f 1 ” to cipher the created model and rule, respectively. This rule ensures that only the nodes in level L 2 will receive this particular model, and the vehicles in L 0 will receive these rules. The process is shown in mode detail in Figure 5. Before the process is started, node L 3 needs to receive multiple CAMs from the lower nodes (1). These will be used to build a dataset (2), which will be analyzed to create rules and models (3) for the other levels. The models will be ciphered with different rules for the different levels (4 and 5). After being correctly secured, it will be sent for level L 2 (6). This level will decipher its model (7) and relay the rules for the lower level (8). The level L 1 does not perform any detection and thus does not need any rules or models, and forwards (9) the received rules for the level L 0 . These nodes will be able to decipher the rules (10). The complete interaction is shown in Figure 5.

4. Clustering, Preprocessing and Analysis
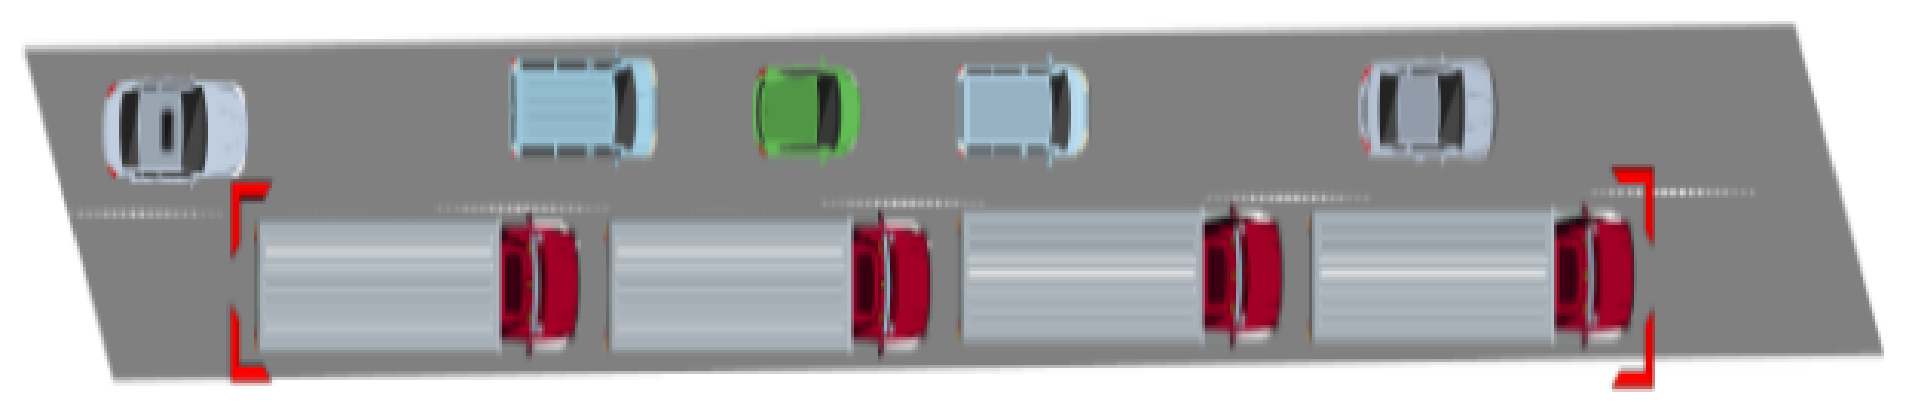
The datasets described in Section 2.2 are raw data containing all the messages received by any vehicle in the network. However, the IDS in this work should only consider the messages received from vehicles from its clusters. Firstly, the clusters need to be defined, defining which entities belong to each cluster at each level, according to a logical division; then, the training datasets are filtered, eliminating any message that does not belong to each of those vehicles. The test datasets contain all the data, as the goal is just to have the most test data possible for evaluating the IDS’s detection capabilities. This process is described in Section 4.1.
Additionally, the authors’ datasets contain multiple parameters, which can accurately describe the vehicle’s movement. However, not all of them have significance for the detection and may even create overfitting or bias learning. Section 4.2 describes the manipulation of the datasets and the training and testing of the IDS.

4.1. Clustering

The previously presented architecture is an abstraction, simply indicating each cluster’s functions and network location. However, for its implementation and testing, a clear definition of the cluster is needed. Depending on the implementation, multiple clustering algorithms can be used. There are multiple algorithms and methods to create clusters that agglomerate the nodes according to some characteristic or variable.
The levels L 3 and L 0 are clear. The first is a high-level entity that receives all the data from the previous levels and the latter is a single vehicle on the road.
The levels L 2 and L 1 , however, need to be organized into clusters. The level L 2 clusters can be defined by using the already natural separation offered by the collected datasets. These are divided into 7 (6 for testing and 1 for training). So, this division provides 6 different clusters (the testing dataset is not included) that are composed of all the L 1 nodes in that geographical region.
The L 1 clusters are, in this implementation, organized into Platoonings, as described in Ribeiro et al. [36], facilitating the constructions of the clusters. Figure 6 shows an example of a platooning, the cluster of trucks moving in a coordinated convoy inside the red brackets. The other vehicles are non-platooning vehicles traveling along the same road.
Platooning is an ITS application that allows vehicles to travel in a convoy manner very close to each other with constant speeds and gaps [36] (Figure 6). It may be composed of several vehicle types, including trucks, buses, and passenger vehicles. Each vehicle can either be a follower or a leader [37]. The leader controls the platooning behavior, and the follower follows its orders. The information between vehicles is exchanged using Vehicle to Vehicle (V2V) communications as described in Ribeiro et al. [38].
The Platoonings were built by running several simulations and analyzing their output in conjunction with the configuration files. Then the vehicles that traveled the same path were grouped together. The simulations were performed using SUMO and VSimRTI with the code described and published in a past research work [32].
The IDS can only use data collected by one of its nodes. So, even though the rest of the vehicles in the simulation may receive messages, these will not be collected. However, any vehicle in the simulation can become an attacker, either belonging to the platooning or not.
The clusters are shown in Table 3. The cluster-level decreases left to right, with the higher level on the left and lower on the right. The leftmost column, “ L 2 ,” identifies each of the geographical maps from which the dataset was obtained, represented by “Map x,” where the x indicates the map number. Next, the column “ L 1 ” identifies each platooning convoy that moves within each map. So, “Platoon x.y” identifies the “y” platooning in the geographical map x. Finally, the third column, L 0 , identifies the individual vehicles that compose each platooning. The identification of each vehicle was the one used by the simulator (by convenience, it was shortened from “veh_z” to “v_z”). Thus, the ID of a vehicle may appear repeated in different Maps, although they refer to different vehicles.

4.2. Methodology

Most of the ML-based IDSs found in the literature use the IDS, an oracle-like entity capable of listening to all network messages. However, this approach is unreal, as the IDS can at most access to the messages collected by its nodes. So, the datasets were filtered using the division presented in Table 3, maintaining only the messages received from each entity indicated for each map. Thus, the quantity of the data available for the IDS training is reduced.
The parameters in the datasets allow the message behavior to be completely and accurately followed, but some of these fields may create errors or overfitting. Even though the datasets were obtained from different maps, the simulator repeats the same vehicle IDs in the different maps. So, the sender or receiver ID parameters should not be associated with the attacks. The same happens to the generationTime and receiverTime. These are also dependent on the simulation.
All the elevation, latitude, longitude, and acceleration values are kept between the same bounds for attacks and normal messages. Thus, these are not of major significance. The diffPos, diffSpeed, diffHeading, diffElevation, diffAcc, and diffTime seem much more significant because they indicate the difference between two consecutive messages received from the same vehicle. Thus, the parameters kept were diffPos, diffSpeed, diffHeading, diffElevation, diffAcc, and diffTime. The parameter isAttack is the label that indicates which type of attack the message is, so it is maintained as well. The isAttack parameter can assume any of the following values: 0 (no attack), 1 (DoS), 2 (fabrication attack speed), 3 (fabrication attack acceleration), 4 (fabrication attack heading). So, the output of the ML engine is the type of attack detected. The outputs and inputs of the ML algorithms can be seen in Figure 7.
The order of the dataset can influence the final results. Thus, the datasets used in evaluations were built in the following way: First, we use the datasets resulting from the message filtering and join them by their numbering order, i.e., the dataset from the geographical Map 1, then the dataset from Map 2, and so on. This process was repeated for each of the attacks, obtaining 4 datasets, one for each attack. Then the resulting datasets were joined, starting with the dataset containing the DoS attacks, then the speed fabrication attack, followed by the acceleration fabrication attack, and, finally, the heading fabrication attack. The resulting dataset is available at https://zenodo.org/record/5567417 (accessed 7 October 2021) [39].
The most common way of training and testing the ML algorithms is to split the data into test and training data. However, having datasets originating from different sources allows using different datasets to train and test the ML algorithms. Thus, the datasets are divided into two groups. The ones originating from Maps 1 through 6 are the training datasets and the dataset originating from Map 7, the test dataset, providing a more accurate evaluation of the trained IDS. Dataset 7 was obtained from the more complex map, with multiple road types and more complex traffic and vehicle behavior. Table 4 contains the total number of messages, normal messages, and messages per attack for both training and test datasets. Although the test dataset is composed only of the data from the geographical map 7, unlike the training that has data from 6 different maps, it has the biggest size. Map 7 is the most complex one. It has the biggest size with 15,083 m of road, 176 vehicles, and a vehicle density of 35.05. The second biggest map has 11,249 m of road, 63 vehicles, and 18.21 of average vehicle density [32].
Due to the characteristics of the attacks, the DoS attack produces much more messages. The non-attack and DoS messages are more than 97% of the training and test datasets’ total data.
Weka was the tool chosen to perform the tests. It does not allow the same granularity in configurations as other tools, but it has multiple already available algorithms that can be modified with simple clicks. It uses a proprietary file format, ARFF, which is very similar to CSV but contains a header indicating the name and type of each parameter. So, after filtering the data according to Table 3 and preprocessing it, removing the extra parameters, it was fed to the multiple algorithms provided by Weka. First, it creates the model that was then used to classify the test dataset.

5. Evaluation and Results

Multiple types of attack detection have been tested. Thus, the results presented in this section evaluate the detection capabilities of each algorithm in each category.
First, we show the results obtained using the ML algorithms from weka, including rules. These also include the size of the built models and the time taken to train and test all the datasets. Then, the algorithms that can better detect each of the attacks are joined using an ensemble algorithm. Finally, the rule-based model is evaluated in a more individual and complete way, trying to assess its capabilities.

5.1. Evaluation Using Multiple ML Approaches

Table 5 presents the results obtained from the classification of the test datasets using multiple algorithms. The first three columns represent the accuracy Mean Absolute Error (MAE) and Root Mean Square Error (RMSE) values. The individual True Positive Rate (TPR) and FPR are then presented for each different attack. Finally, the last two columns show the average TPR and FPR for each algorithm (the TPR and FPR for the normal messages are not included in the calculated average).
Usually, the first three columns are representative of the model quality. However, this is not accurate in this case due to the characteristics of the datasets. Table 4 shows an unbalance between the collected datasets as the nonattack and DoS messages make 97% of the total. So, if the ml algorithm can only detect both of these correctly, it will have an accuracy of 97%.
Thus, instead of looking at the accuracy, the individual TPR and FPR can help find a better solution. The goal is to find an algorithm that maximizes the TPR while minimizing the FPR. The average TPR in the results presented varies from 0.26 to 0.88, with both J48 and Random Forrest performing the best. For the average FPR, all algorithms perform quite well, with very low values.
The results from Table 5 indicate that Multilayer Perceptron (MLP) can better detect the normal messages and DoS attacks, with 1.00 TPR for both and only 0.05 FPR for the normal messages. Nonetheless, it cannot detect any other attack accurately. Random Forest can better detect Speed Fabrication attack and Heading Fabrication attack with a correspondent 0.78 and 0.90 TPR and 0.01 and 0 FPR. The Acceleration Fabrication attack is better detected using J48, which can do so with 0.78 TPR and 0.01 FPR. However, the best overall performance indicated by the average TPR and FPR shows a tie between Random Forrest and J48 (0.88 average TPR) with a slight advantage for the Random Forrest that presents a higher accuracy.
Table 6 presents the sizes of the models created by weka for each algorithm and the times needed for training and testing it. This table can help to decide which algorithm is better suited for each level, where the lower layers benefit from smaller models (less traffic) and quicker detection. The results presented show that Logistic Model Tree (LMT) is clearly the slowest to train. However, Random Forrest is the slowest to evaluate all the messages from the test dataset. Decision Stump, while not being the quickest to train it, is the quickest to detect the attacks. Moreover, it is the lighter model needing only 3 KB to be transmitted. Additionally, the decision stump algorithm can easily be translated into a few if statements, needing, in reality, only a few bytes. On the other side, Random Forrest is the heavier algorithm needing 54,497 KBs.

5.2. Ensemble-Based Evaluation

The results do not need to be applied individually. Using an ML technique called ensemble learning, multiple algorithms can be used together to take advantage of each algorithm’s properties. This can be especially useful in this case, as each algorithm performs well in one attack but poorly in others. Weka supports two ensemble techniques that we used; stacking and voting. Both methods use several algorithms to achieve better results. Stacking calculates each model’s outputs and then applies another ML algorithm (meta classifier) to the output. Voting may use different methods: the most voted option, average of probabilities, minimum of probabilities, maximum probability, and product of probabilities.
Both ensemble techniques were used to evaluate the datasets using the following algorithms: Random Forrest, J48, and MLP. The configurations of the selected algorithms are presented in Table 7. The algorithm used as the meta classifier was Random Forrest. It was the algorithm with the better overall performance, being the ideal candidate. Additionally, a custom stacking technique was implemented. Instead of using the meta classifier, it uses the algorithms in the order that can benefit each one’s properties. So, each instance of the dataset is evaluated using the following algorithm: (1) Apply Random Forrest. If speed or heading fabrication attack is detected, the algorithm stops; otherwise, it goes to the next step. Random Forrest can detect Speed and Heading fabrication with almost no False-Positives, so if one of those attacks is detected, it has a high probability of being correct. (2) Apply J48, if an acceleration fabrication attack is detected, the algorithm stops; otherwise, it goes to the next step. The reasoning is similar to the previous step. (3) Apply MLP, this is the last step, and if no attack is detected at this point, then the message is considered normal. MLP is the last algorithm to be applied as it is the one with a higher FPR at detecting normal messages. Otherwise, it could classify the message as normal, even if it was an attack. The algorithm is shown in Figure 8.
The results from the ensemble learning are presented in Table 8.
These show that the detection capabilities can be increased using an ensemble technique, mainly the custom one. It has a small increase over the best performant single algorithm, Random Forrest, ranging from 0.01 to 0.02 across all the message types, with the overall average TPR also increasing from 0.88 to 0.89.

5.3. Rule-Based Evaluation

Despite the accuracy of the algorithms, the lower levels need to have quick and light detections. Decision Stump is a one-level decision tree. It creates very basic rules, usually an if statement that can quickly perform decisions. Additionally, it has a smaller size and can easily be sent through the network. So, a Decision Stump algorithm was fed datasets containing only one type of attack at a time. As it is a one-level decision tree, it will only create a rule for each time it is trained. Therefore, in reality, four different rules are being created. The test dataset used was the same as in the other tests. The results obtained are indicated in Table 9. Each line corresponds to a different attack. The columns represent the TPR and FPR for the detection of normal messages or attacks. As the Decision Stump algorithm is a one-step decision tree, it will only create a rule for the attack fed. Thus, it will only detect the attack it was created to detect. It can detect Normal messages and DoS quite well (0.99 TPR), but it is quite poor in the other attacks. On the plus side, it has very low FPR when detecting any of the attacks. Thus, it has a very low danger of discarding authentic messages.
In all the analyzed algorithms, detecting the fabrication attacks seems less accurate than detecting DoS. The unbalance in detecting the fabrication attacks may be due to the number of messages for each attack class. DoS has more messages, allowing the ML algorithm to be better fitted. The same happens for the Decision Stump. As it is shown, the attack with more messages, DoS, has better detection performance.

6. Intelligent Hierarchical Security Framework for VANETs Detection Algorithms and Use-Case
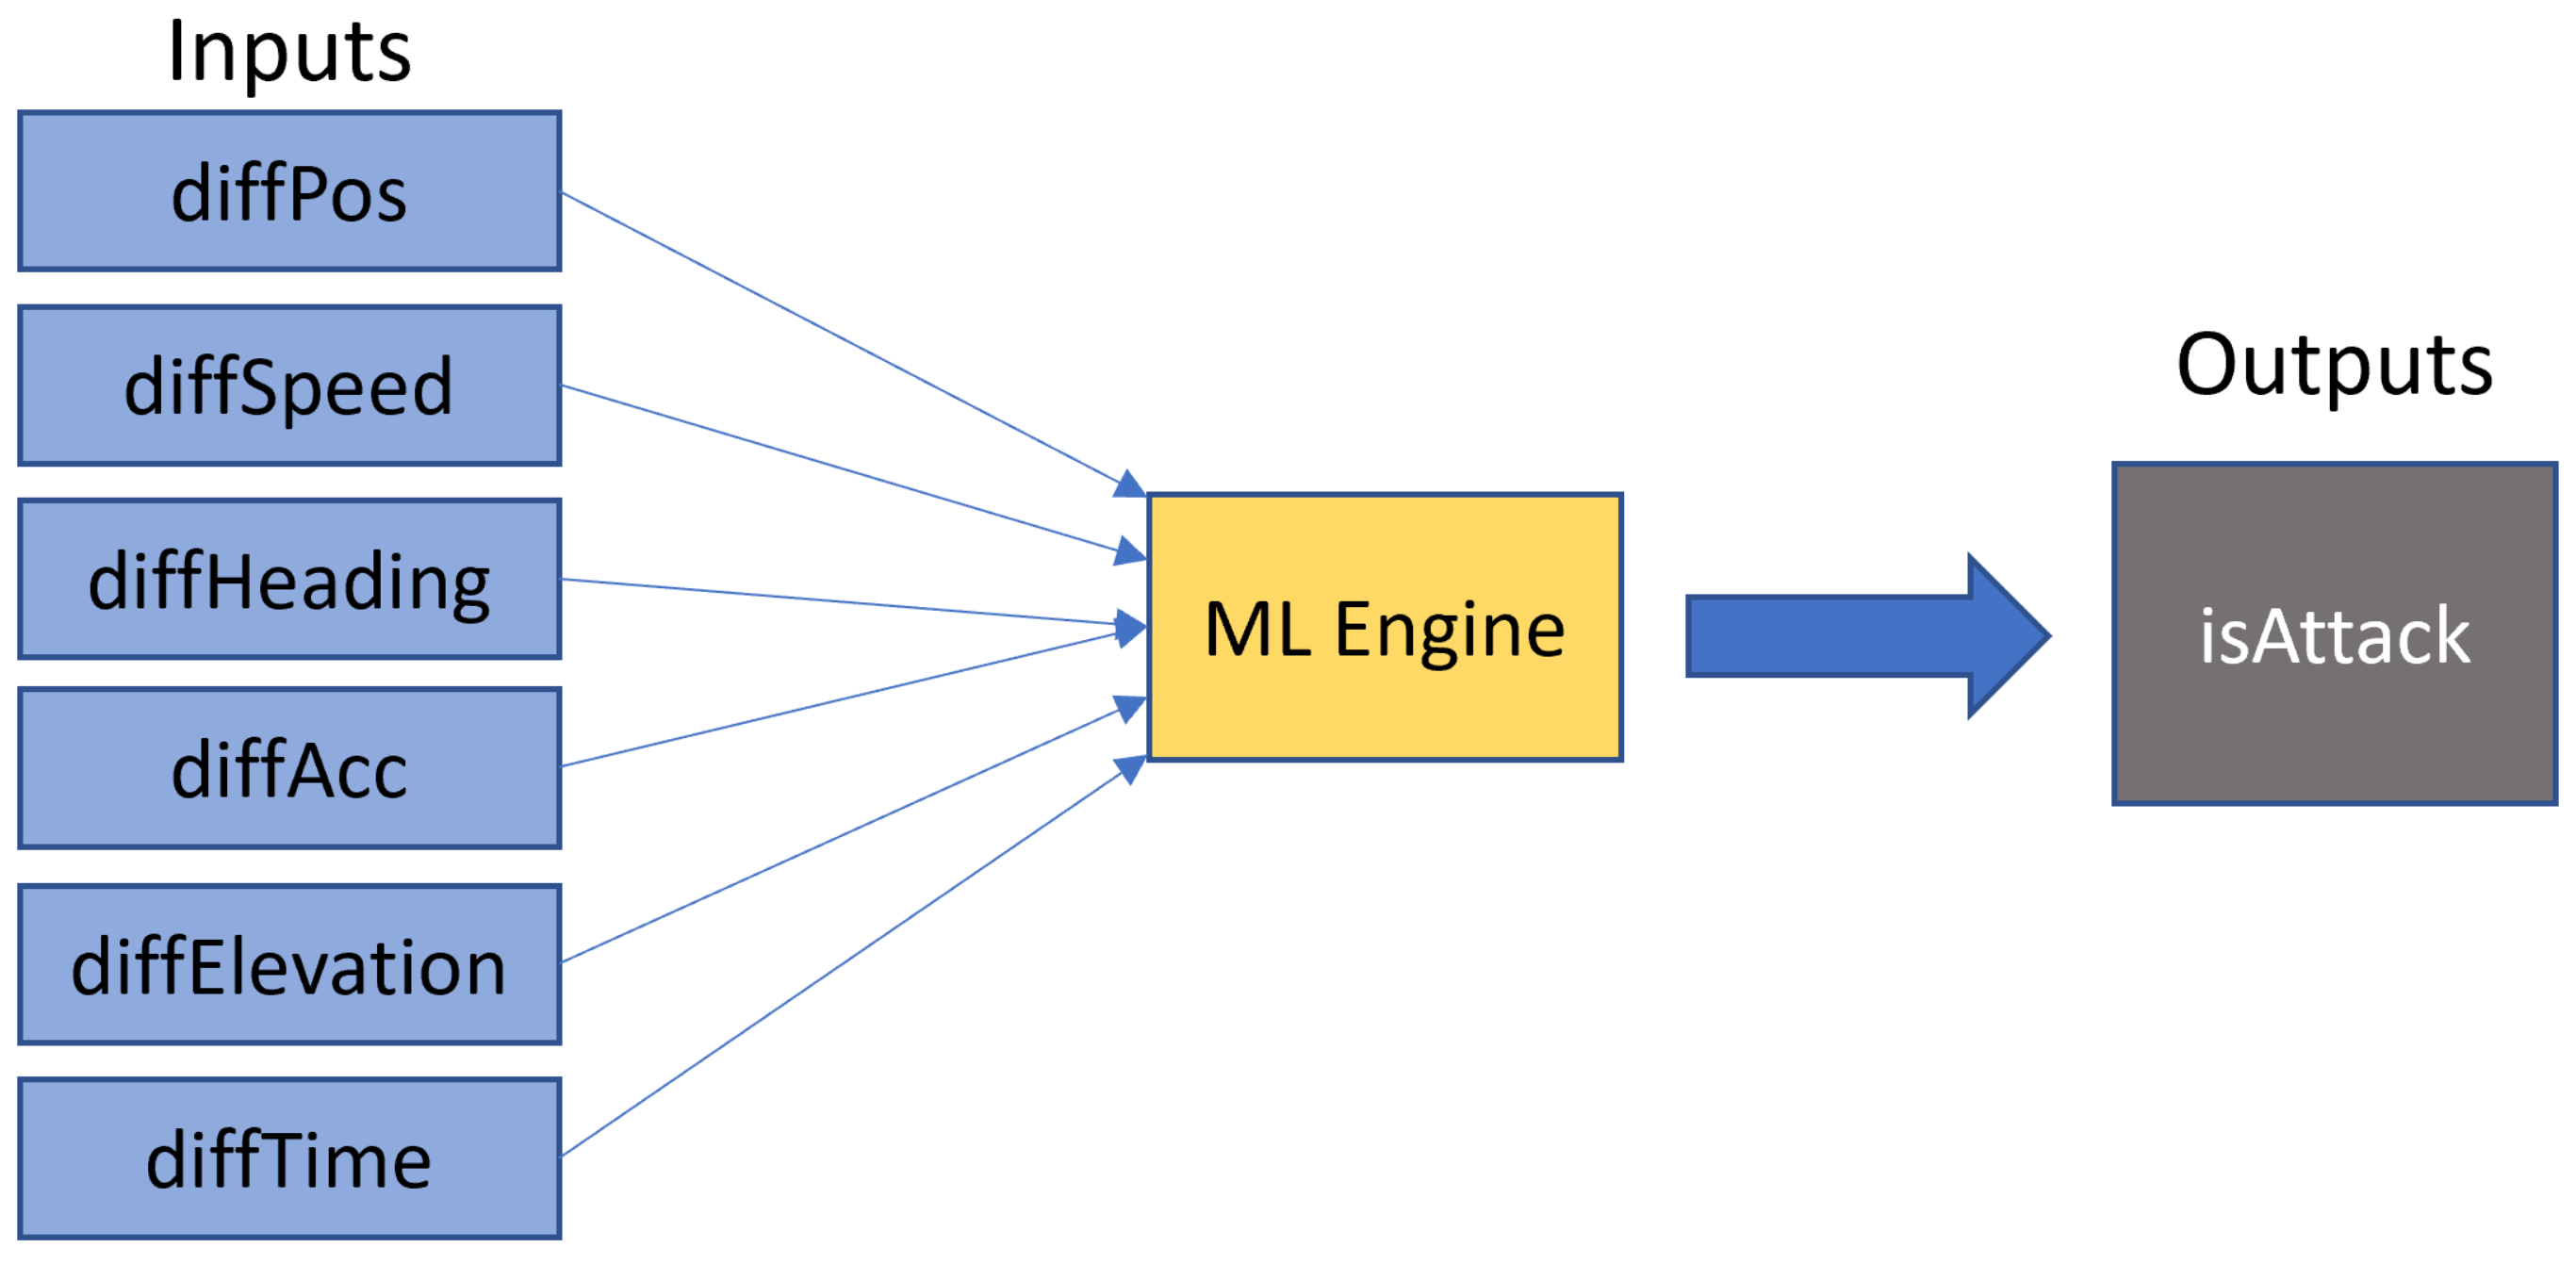
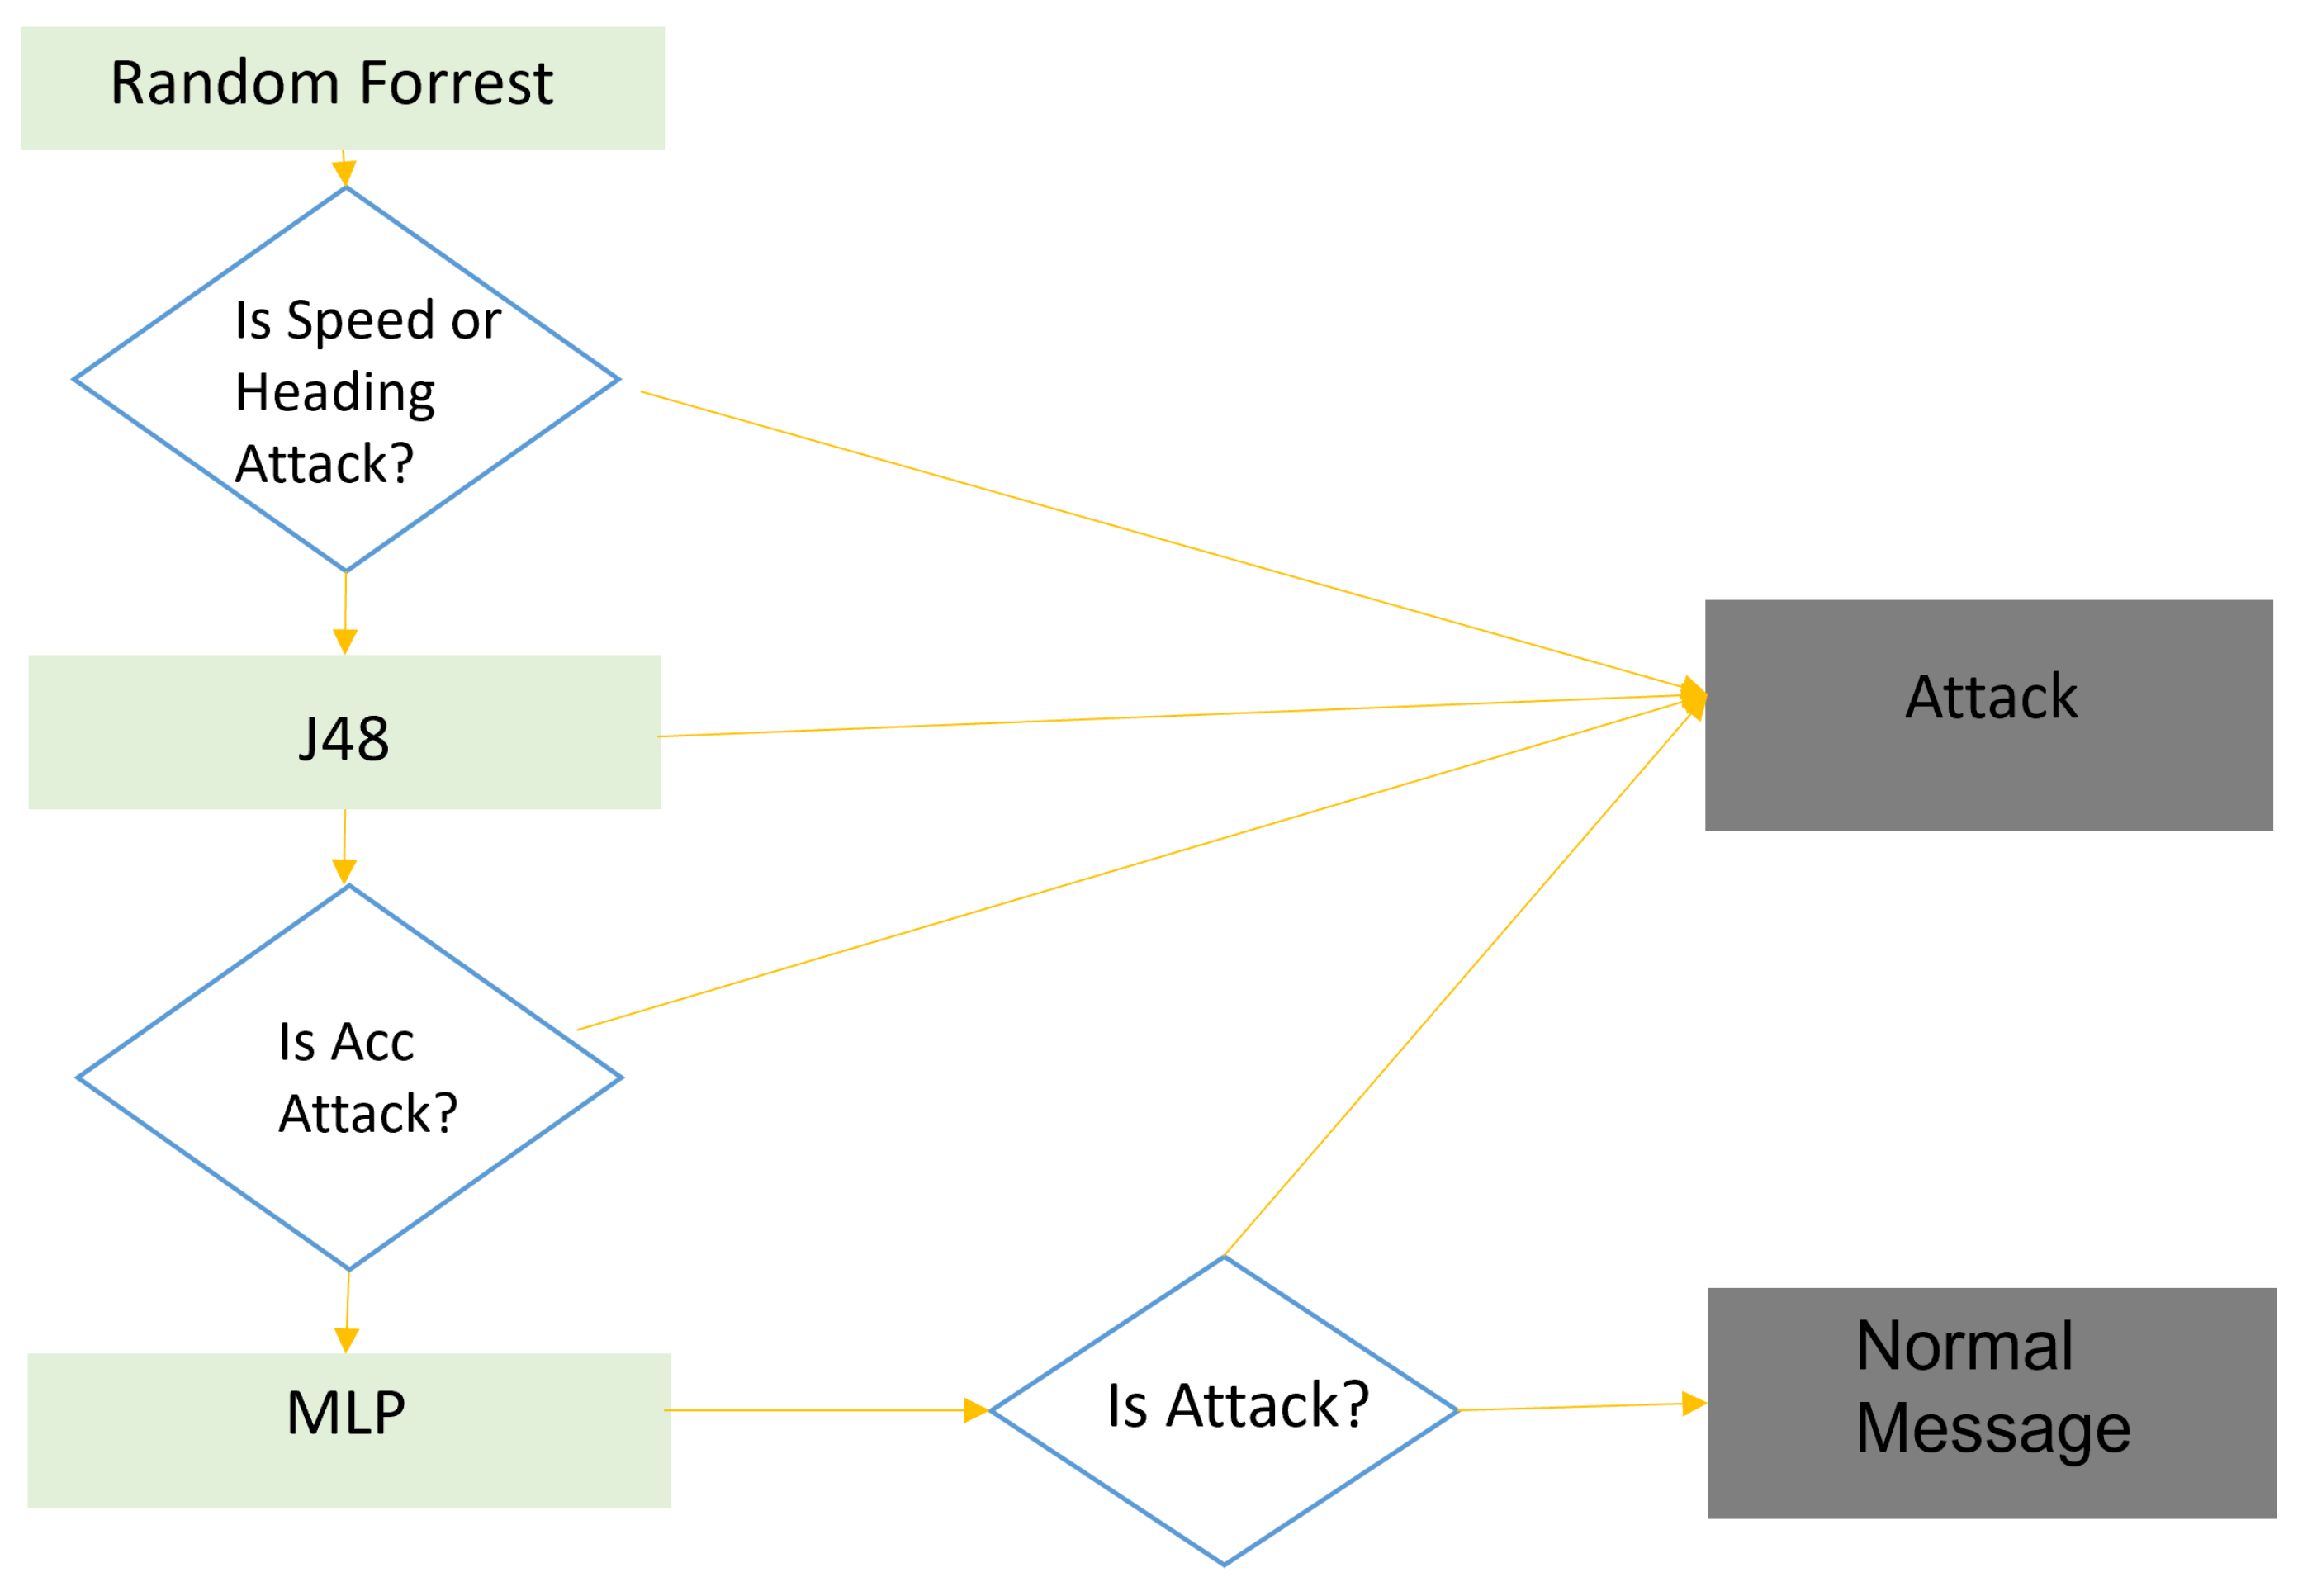
The goal of dividing the architecture into multiple cluster levels was to attribute different roles and capabilities to each entity, depending on its capabilities and needs, resulting in four different levels. The capabilities and needs grow inversely from each other, as shown in Figure 9, with higher levels more capabilities and fewer needs in terms of detection time. These entities are far from the entities receiving the CAMs and are not able to respond in time. The lower entities need to have a quick decision but have fewer capabilities.

6.1. L 0 Detection

The first level, with fewer capabilities but higher speed demand, is the L 0 . These nodes are simply vehicles on the road. Although new advancements in technology may provide better communication devices with more computing power, these nodes are usually less powerful than those in the above nodes. Additionally, these receive many messages from the surrounding vehicles. Because they are an easy target for DoS, any more computation power or time in the message analysis may be enough to overwhelm them. So, this entity should also not be overwhelmed with the need to build rules or machine learning models, and, at this level, the detection tool should be as quick and light as possible.
The results presented in Section 5, indicating the performance of each algorithm, show Random Forrest with the best overall performance. However, this algorithm is heavy, slow, and needs some computing power. So, a lighter algorithm should be equated at this level. One of the other algorithms we tested was Decision Stump. It is an algorithm that generates rules that other nodes can easily use for detection. It is a one-level decision tree, and it creates basic rules with only an “if” statement, which is traduced in very high detection speed.
Decision Stump presents a good tradeoff between speed and accuracy. On the plus side, it detects DoS with an accuracy of 0.94 and Fabrication with the tampered speed with 0.47 accuracy. This algorithm also classifies almost all the normal messages with a very low FPR, not discarding authentic messages. It is a very light and quick algorithm, and, even though it does not have the best accuracy, it seems a good choice to be used as a first defense line. The nodes at level L 0 will also send the received CAMs to the nodes above for further analysis.

6.2. L 1 Detection

Level L 1 is the next level on the hierarchy. It is a group of vehicles organized into a cluster. Hence, this has very similar characteristics to the cluster below as all its entities are still vehicles. Thus, this level does not present more computing power or storage capacity than the level L 0 . Thus, using the same algorithm in two consecutive levels does not seem useful, as the rules would probably detect the exact same messages. Thus the nodes on this level will only perform forwarding of the received messages to the nodes above. Hence, the best situation seems to be that all nodes communicate the received messages to the cluster-head (the platooning leader), then group them together and send them to a node in level L 2 .

6.3. L 2 Detection

Level L 2 is the first cluster with infrastructural entities. These entities may have much more CPU power and storage capacity as they have few power limitations. However, these are still not the most powerful entities. The RSUs are mainly communication entities and not exactly made for processing information.
The decision at this level does not need to be as fast as in the level L 0 . Although these entities are close enough that they may be able to produce decisions in useful time, this will not be immediate because of the time needed for the communications. So, L 2 nodes can use more heavy ML algorithms focusing on detection accuracy instead of speed. Nevertheless, the L 2 nodes will still forward all the received messages to the above nodes to correctly analyze them and create models. Therefore, even with more power available, these nodes are still not the best choice for creating models and rules. The main issue at this level is the narrowed vision of the network. L 2 nodes do not have a view of the network as broad as L 3 and may create biased models that would tamper with the detection in the levels below, creating models with low accuracy, as shown in [9].
This level may use a more complex algorithm that is more CPU-heavy. The one presenting the best accuracy is Random Forrest, with the best overall performance with low false positives. It has an accuracy of 0.98 with an average TPR of 0.85 and only 0.01 in FPR. This algorithm is particularly good at detecting DoS and fabrication attacks with the tampered heading. In addition, the very low FPR is very good because it indicates that almost no normal message is wrongly classified as an attack, decreasing the possibility of discarding normal messages.

6.4. L 3 Detection

Level L 3 is the highest level in the architecture and, thus, it has the most powerful entities with the most storage capacity. Furthermore, the L 3 entities are all infrastructural, with all the communications made through high-capacity cabled connections. Hence, they do not have any problem with the size of data to be transmitted. Moreover, these are backend servers designed for complex and heavy computations, so they can carry multiple operations.
First, these receive and analyze the data sent from the levels below, storing it to analyze further or prove detected attacks. The data storage also allows “offline” detection using more complex ML algorithms. However, due to the sheer size of the data received at this level, the detection will also be slower. Therefore, the L 3 level has the perfect conditions to use ensemble detection. It is a more complex type of ML that uses multiple algorithms to detect attacks. This case uses MLP, Random Forrest, and J48, combined using the custom stacking algorithm. It has a small increase in performance, with a higher TPR and smaller FPR than the Random Forrest algorithm used in the level below. At this level, it does not make much sense to try and warn the vehicle that received the message because it may not be possible to do so in a usable time. However, it can trigger a system-wide response, blacklisting the attacking vehicle and, if needed, warn the authorities.
However, and perhaps the main job of the L 3 level is to create rules and models to be used by the nodes below. As previously mentioned, the entities forming the L 3 level are the more powerful in the architecture with a wider view of the overall system. Thus, they can detect attacks much more accurately, as shown in [9], without compromising their performance. So, due to their more complete vision of the system, they are more suited to analyze the data and create models and rules as this is a more CPU expensive operation than using the models or rules for the detection. These models can be constantly updated and sent to the nodes below.

6.5. Hierarchical Intelligent IDS Architecture: Application Use-Case

In this section, the components described and chosen in the previous sections are organized into a more refined architecture. This includes the framework for secure communications across all the architecture levels, the role for each entity, and the ML applied at each level. The goal was to design an easy to deploy architecture that took advantage of the multiple layers to attribute roles well suited for the characteristics of each level’s entities. Furthermore, we carefully chose ML techniques that could balance accuracy with each entity’s capabilities, providing good accuracy without overwhelming the nodes at each level. Finally, the security model was chosen based on the security features provided including, authentications of drivers and vehicles and confidentiality and privacy. Also, the choice was impacted by the communication modes offered by the security framework chosen, mainly the encryption capability for multiple targets. The architecture with all the components, roles, and technologies is shown in Figure 10. It shows a real-world use case implementation, using the platooning as the most basic cluster and, at the level L 2 , a cluster between multiple RSUs. The latter may be multiple RSUs that constitute a specific geographical map working together to detect attacks and gather messages. The higher entity is represented by the cloud in the infrastructural network.
The level L 0 entities are the multiple vehicles on the road; these can be road vehicles, from truck to passenger vehicle or motorcycle. Their functionality and detection type are indicated in the bottom blue rectangle. These will perform message collection, collecting the CAMs sent by other vehicles, and perform the first line of defense, using Decision Stump, the lightest and quick detection type.
Then, the green, red and blue rectangles represent multiple L 0 clusters. These are platooning of vehicles that can be composed of different types of vehicles. For example, blue platooning is formed exclusively of trucks, while the other two can encompass multiple vehicle types. These will only act as message relays (orange square on the right), forwarding information from lower to upper nodes and vice-versa.
The yellow rectangle cluster represents the L 2 , grouping multiple RSUs together. These will receive messages from the nodes below and use the LMT algorithm to perform a more robust detection. These are the first infrastructural entities in the architecture.
Finally, the higher level, L 3 , is represented by a cloud as this is usually composed of high-capacity backend servers similar to a cloud. It is the level with the most powerful entities being able of more complex operations. So, the entities will perform the most complex decision using an ensemble learning algorithm at this level. Furthermore, they are responsible for generating models and rules for the nodes below, taking advantage of their more powerful CPUs.
The green rectangle, vertical on the right, across all levels represents the security framework. Although the security model that was chosen, VPKIbrID, has more than one encryption mode, the VPKIbrID-ABE seems more indicated to communicate between the layers as most of the messages sent over the network have multiple targets. The model should be used with the key cashing, which enables much faster and lighter encryptions. However, the nodes can use the PKI mode to communicate between themselves, as described in a previous work [37].

7. Conclusions

In this paper, an Intelligent Hierarchical Security Framework for VANETs is proposed, which ensures mechanisms for attack detection and supports secure communication. Communication between all entities is secured using the VPKIbrID model and its ABE mode allows communication to multiple targets without individually encrypting the data. Attack detection is done at multiple levels, using different algorithms for each level, according to the corresponding needs and characteristics. Multiple algorithms, available in Weka, were tested and selected in order to achieve a high level of detection. Multiple tests were also performed using ensemble techniques in order to verify the improvements of the detection capabilities of the IDS.
Results show that the different algorithms are most useful at specific hierarchical layers. At the first layer, L 0 , Decision Stump seems to be the most suitable. It does not have the best detection accuracy, but it makes up for it in terms of speed and complexity. This algorithm generates only a few “IF” statements, and is very fast at performing detection.
The L 1 level is the platoon level. Its cluster head is also a vehicle to ensure that the necessary computation power is not increased. The best role of this entity is to serve as a relay for messages collected using rules established from the high hierarchy levels.
At the next level, L 2 is at the RSU level, one can expect the availability of higher computational power. This level can use a heavier algorithm. More accurate detection was obtained using Random Forrest, which is a better choice to be used at this level.
The top level ( L 3 ) is reserved for the most CPU-hungry algorithm. It uses a combination between the decisions of the MLP, J48, and Random Forrest algorithm, using a custom staking algorithm. The middle layers ( L 1 and L 2 ) are also responsible for relaying the messages received from the nodes below. The lower layer will pick up all messages in range.
The framework created is then applied to a specific use case, with platooning as the implementation of a clustering level. The results obtained indicate excellent performance in detecting DoS and non-attack messages, but performance declines in comparison to other types of attacks. This may be due to the imbalance of the types of attacks that exist in the datasets. Therefore, it makes sense to produce more datasets using different maps and other crafting attacks.
Additionally, this work could benefit from more datasets, preferably from third-parties and, ideally, from the real world, to confirm the results obtained. It is also important to carry out a study on the impact of the burden of the amount of data communicated between the different levels, analyzing the usage of compression to reduce the size of the communication data.

Author Contributions

Author Contributions: The first author, F.G., is the major contributor to this work; A.S. and J.M. supervised all the research work. Conceptualization: F.G., A.S., J.M.; Methodology: A.S., J.M., F.G.; Original draft: F.G.; Validation: F.G., J.M., A.S.; Writing-Review and editing: A.S., J.M., F.G. All authors have read and agreed to the published version of the manuscript.

Funding

This work has been supported by national funds through FCT – Fundação para a Ciência e Tecnologia within the Project Scope: UIDB/00319/2020.

Data Availability Statement

The data presented in this study are openly available in Zenodo at https://doi.org/10.5281/zenodo.4304411 and https://zenodo.org/record/5567417 (accessed on 12 September 2021), reference numbers [32,39]. The first datasets were the raw data and the second the ones obtained after filtering and used for the test and training of the ML algorithms in this work. The datasets were produced using the code available at https://github.com/fabio-r-goncalves/dataset-collection (accessed on 12 September 2021).

Conflicts of Interest

The authors declare no conflict of interest.

Abbreviations

The following abbreviations are used in this manuscript:
ABEAttribute-Based Encryption
CACertification Authority
CAMContext Awareness Message
DCAITIDaimler Center for Automotive IT Innovations
DoSDenial of Service
DSRCDedicated Short Range Communications
FPRFalse Positive Rate
IdMIdentity Manager
IDSIntrusion Detection System
IEEEInstitute of Electrical and Electronics Engineers
ITSIntelligent Transportation Systems
LMTLogistic Model Tree
LTCLong-Term Certificate
MAEMean Absolute Error
MLMachine Learning
MLPMultilayer Perceptron
ns-3Network Simulator 3
OBUOn-Board Unit
PCPseudonym Certificate
PKIPublic Key Infrastructure
RMSERoot Mean Square Error
RSURoad Side Unit
SLRSystematic Literature Review
SUMOSimulation of Urban Mobility
SVMSupport Vector Machine
TATrusted Authority
TPRTrue Positive Rate
VANETVehicular Ad hoc Network
V2VVehicle to Vehicle
VPKIbrIDVehicular Ad hoc Network Public Key Infrastructure and Attribute-Based Encryption with Identity Manager Hybrid
VPKIbrID-ABEVPKIbrID Attribute-Based Encryption
VPKIbrID-PKIVPKIbrID Public Key Infrastructure
VSimRTIV2X Simulation Runtime Infrastructure

References

  1. Cseh, C. Architecture of the dedicated short-range communications (DSRC) protocol. In Proceedings of the VTC 98. 48th IEEE Vehicular Technology Conference, Ottawa, ON, Canada, 21–21 May 1998; Volume 3, pp. 2095–2099. [Google Scholar] [CrossRef]
  2. IEEE. IEEE Standard for Information Technology—Local and Metropolitan Area Networks—Specific Requirements—Part 11: Wireless LAN Medium Access Control (MAC) and Physical Layer (PHY) Specifications Amendment 6: Wireless Access in Vehicular Environments; IEEE: Piscataway, NJ, USA, 2010; pp. 1–51. [Google Scholar] [CrossRef]
  3. Dias, B.; Santos, A.; Costa, A.; Ribeiro, B.; Goncalves, F.; Macedo, J.; Nicolau, M.J.; Gama, O.; Sousa, S. Agnostic and Modular Architecture for the Development of Cooperative ITS Applications. J. Commun. Softw. Syst. 2018, 14, 218–227. [Google Scholar] [CrossRef]
  4. Engoulou, R.G.; Bellaiche, M.; Pierre, S.; Quintero, A. VANET security surveys. Comput. Commun. 2014, 44, 1–13. [Google Scholar] [CrossRef]
  5. Mitchell, R.; Chen, I.R. A survey of intrusion detection in wireless network applications. Comput. Commun. 2014, 42, 1–23. [Google Scholar] [CrossRef] [Green Version]
  6. Witten, I.H.; Frank, E. Data Mining: Practical Machine Learning Tools and Techniques; Morgan Kaufmann: San Francisco, CA, USA, 2016; Chapter 7; pp. 1–45. [Google Scholar] [CrossRef] [Green Version]
  7. Aburomman, A.A.; Reaz, M.B.I. Survey of learning methods in intrusion detection systems. In Proceedings of the 2016 International Conference on Advances in Electrical, Electronic and Systems Engineering (ICAEES), Putrajaya, Malaysia, 14–16 November 2016; pp. 362–365. [Google Scholar] [CrossRef]
  8. Goncalves, F.; Ribeiro, B.; Gama, O.; Santos, A.; Costa, A.; Dias, B.; Macedo, J.; Nicolau, M.J. A Systematic Review on Intelligent Intrusion Detection Systems for VANETs. In Proceedings of the 2019 11th International Congress on Ultra Modern Telecommunications and Control Systems and Workshops (ICUMT), Dublin, Ireland, 28–30 October 2019; pp. 1–10. [Google Scholar] [CrossRef]
  9. Goncalves, F.; Macedo, J.; Santos, A. Evaluation of VANET Datasets in context of an Intrusion Detection System. In Proceedings of the 29th International Conference on Software, Telecommunications and Computer Networks (SoftCOM 2021), Split, Croatia, 23–25 September 2021. [Google Scholar]
  10. Raya, M.; Hubaux, J.P. The security of VANETs. In Proceedings of the 2nd ACM international workshop on Vehicular ad hoc networks—VANET’05, Cologne, Germany, 2 September 2005; pp. 93–94. [Google Scholar] [CrossRef]
  11. Hesham, A.; Abdel-Hamid, A.; El-Nasr, M.A. A dynamic key distribution protocol for PKI-based VANETs. IFIP Wirel. Days 2011, 1, 1–3. [Google Scholar] [CrossRef]
  12. Bellur, B. Certificate Assignment Strategies for a PKI-Based Security Architecture in a Vehicular Network. In Proceedings of the IEEE GLOBECOM 2008—2008 IEEE Global Telecommunications Conference, New Orleans, LA, USA, 30 November–4 December 2008; pp. 1–6. [Google Scholar] [CrossRef]
  13. Liu, Q.; Wu, Q.; Yong, L. A hierarchical security architecture of VANET. Cyberspace Technol. 2013, 6–10. [Google Scholar] [CrossRef]
  14. Wagan, A.A.; Mughal, B.M.; Hasbullah, H.; Iskandar, B.S. VANET Security Framework for Trusted Grouping using TPM Hardware. In Proceedings of the 2010 Second International Conference on Communication Software and Networks, Singapore, 26–28 February 2010; pp. 309–312. [Google Scholar] [CrossRef]
  15. Bariah, L.; Shehada, D.; Salahat, E.; Yeun, C.Y. Recent advances in VANET security: A survey. In Proceedings of the 2015 IEEE 82nd Vehicular Technology Conference, VTC Fall 2015, Boston, MA, USA, 6–9 September 2015. [Google Scholar] [CrossRef]
  16. Gad, A.R.; Nashat, A.A.; Barkat, T.M. Intrusion Detection System Using Machine Learning for Vehicular Ad Hoc Networks Based on ToN-IoT Dataset. IEEE Access 2021, 9, 142206–142217. [Google Scholar] [CrossRef]
  17. Moustafa, N. TON-IOT. Dataset. Available online: https://research.unsw.edu.au/projects/toniot-datasets (accessed on 5 October 2021).
  18. Alsarhan, A.; Alauthman, M.; Alshdaifat, E.; Al-Ghuwairi, A.R.; Al-Dubai, A. Machine Learning-driven optimization for SVM-based intrusion detection system in vehicular ad hoc networks. J. Ambient. Intell. Humaniz. Comput. 2021, 1–10. [Google Scholar] [CrossRef]
  19. Kosmanos, D.; Pappas, A.; Maglaras, L.; Moschoyiannis, S.; Aparicio-Navarro, F.J.; Argyriou, A.; Janicke, H. A novel Intrusion Detection System against spoofing attacks in connected Electric Vehicles. Array 2020, 5, 100013. [Google Scholar] [CrossRef]
  20. Song, J.; Takakura, H.; Okabe, Y.; Eto, M.; Inoue, D.; Nakao, K. Statistical analysis of honeypot data and building of Kyoto 2006+ dataset for NIDS evaluation. In Proceedings of the First Workshop on Building Analysis Datasets and Gathering Experience Returns for Security—BADGERS ’11, Kyoto, Japan, 5 November 2011; pp. 29–36. [Google Scholar] [CrossRef]
  21. Tavallaee, M.; Bagheri, E.; Lu, W.; Ghorbani, A.A. A detailed analysis of the KDD CUP 99 data set. In Proceedings of the IEEE Symposium on Computational Intelligence for Security and Defense Applications, CISDA 2009, CISDA’09, Ottawa, ON, Canada, 8–10 July 2009; pp. 53–58. [Google Scholar] [CrossRef] [Green Version]
  22. Misra, S.; Krishna, P.V.; Abraham, K.I. A stochastic learning automata-based solution for intrusion detection in vehicular ad hoc networks. Secur. Commun. Netw. 2011, 4, 666–677. [Google Scholar] [CrossRef]
  23. Tian, D.; Wang, Y.; Lu, G.; Yu, G. A vehicular ad hoc networks intrusion detection system based on BUSNet. In Proceedings of the 2010 2nd International Conference on Future Computer and Communication, ICFCC 2010, Wuhan, China, 21–24 May 22010; Volume 1, pp. 1–229. [Google Scholar] [CrossRef]
  24. Liu, X.; Yan, G.; Rawat, D.B.; Deng, S. Data mining intrusion detection in vehicular ad hoc network. IEICE Trans. Inf. Syst. 2014, E97-D, 1719–1726. [Google Scholar] [CrossRef] [Green Version]
  25. Sedjelmaci, H.; Senouci, S.M. An accurate and efficient collaborative intrusion detection framework to secure vehicular networks. Comput. Electr. Eng. 2015, 43, 33–47. [Google Scholar] [CrossRef]
  26. Ali Alheeti, K.M.; McDonald-Maier, K. Hybrid intrusion detection in connected self-driving vehicles. In Proceedings of the 2016 22nd International Conference on Automation and Computing, ICAC 2016: Tackling the New Challenges in Automation and Computing, Colchester, UK, 7–8 September 2016; pp. 456–461. [Google Scholar] [CrossRef]
  27. Wahab, O.A.; Mourad, A.; Otrok, H.; Bentahar, J. CEAP: SVM-based intelligent detection model for clustered vehicular ad hoc networks. Expert Syst. Appl. 2016, 50, 40–54. [Google Scholar] [CrossRef]
  28. Sharma, S.; Kaul, A. Hybrid fuzzy multi-criteria decision making based multi cluster head dolphin swarm optimized IDS for VANET. Veh. Commun. 2018, 12, 23–38. [Google Scholar] [CrossRef]
  29. Tan, H.; Gui, Z.; Chung, I. A Secure and Efficient Certificateless Authentication Scheme With Unsupervised Anomaly Detection in VANETs. IEEE Access 2018, 6, 74260–74276. [Google Scholar] [CrossRef]
  30. Zhang, T.; Zhu, Q. Distributed Privacy-Preserving Collaborative Intrusion Detection Systems for VANETs. IEEE Trans. Signal Inf. Process. Over Netw. 2018, 4, 148–161. [Google Scholar] [CrossRef]
  31. Ayoob, A.; Su, G.; Al, G. Hierarchical Growing Neural Gas Network (HGNG)-Based Semicooperative Feature Classifier for IDS in Vehicular Ad Hoc Network (VANET). J. Sens. Actuator Netw. 2018, 7, 41. [Google Scholar] [CrossRef] [Green Version]
  32. Gonçalves, F.; Ribeiro, B.; Gama, Ó.; Santos, J.; Costa, A.; Dias, B.; Nicolau, M.J.; Macedo, J.; Santos, A. Synthesizing Datasets with Security Threats for Vehicular Ad-Hoc Networks. In Proceedings of the IEEE Globecom 2020: 2020 IEEE Global Communications Conference (GLOBECOM’2020), Taipei, Taiwan, 7–11 December 2020. [Google Scholar]
  33. DCAITI. VSimRTI. Available online: https://www.dcaiti.tu-berlin.de/research/simulation/ (accessed on 12 November 2020).
  34. ETSI. ETSI EN 302 637-2 V1.3.1 Intelligent Transport Systems (ITS); Vehicular Communications; Basic Set of Applications; Part 2: Specification of Cooperative Awareness Basic Service; ETSI: Sophia, France, 2014. [Google Scholar]
  35. Gonçalves, F.; Santos, A.; Costa, A.; Dias, B.; Ribeiro, B.; Macedo, J.; Nicolau, M.J.N.; Sousa, S.; Gama, O.; Barros, S.; et al. Hybrid Model for Secure Communications and Identity Management in Vehicular Ad Hoc Networks. In Proceedings of the 9th International Congress on Ultra Modern Telecommunications and Control Systems (ICUMT’2017), Munich, Germany, 6–8 November 2017; pp. 414–422. [Google Scholar]
  36. Ribeiro, B.; Gonçalves, F.; Hapanchak, V.; Gama, Ó.; Barros, S.; Araújo, P.; Costa, A.; Nicolau, M.J.; Dias, B.; Macedo, J.; et al. PlaSA-Platooning Service Architecture. In Proceedings of the 8th ACM Symposium on Design and Analysis of Intelligent Vehicular Networks and Applications, Montreal, QC, Canada, 28 October–2 November 2018; pp. 80–87. [Google Scholar]
  37. Gonçalves, F.; Ribeiro, B.; Hapanchak, V.; Barros, S.; Gama, O.; Araújo, P.; Nicolau, M.J.; Dias, B.; Macedo, J.; Costa, A.; et al. Secure Management of Autonomous Vehicle Platooning. In Proceedings of the 14th ACM International Symposium on QoS and Security for Wireless and Mobile Networks, Q2SWinet’18, Montreal, QC, Canada, 28 October–2 November 2018; ACM: New York, NY, USA, 2018; pp. 15–22. [Google Scholar] [CrossRef]
  38. Ribeiro, B.; Gonçalves, F.; Santos, A.; Nicolau, M.; Dias, B.; Macedo, J.; Costa, A. Simulation and Testing of a Platooning Management Protocol Implementation. In Proceedings of the International Conference on Wired/Wireless Internet Communication, St. Petersburg, Russia, 21–23 June 2017; pp. 174–185. [Google Scholar] [CrossRef] [Green Version]
  39. Gonçalves, F.; Santos, A.; Macedo, J. V2X Security Threats for Cluser-Based Evaluation [Data Set]; Zenodo: Genève, Switzerland, 2021. [Google Scholar] [CrossRef]
Figure 1. VPKIbrID Security Model(From [35]).
Information 12 00455 g001
Figure 2. Intelligent Hierarchical IDS Security Framework Functional Architecture.
Information 12 00455 g002
Figure 3. Intelligent Hierarchical IDS Security Framework Architecture.
Information 12 00455 g003
Figure 4. CAM upstream communications and processing.
Information 12 00455 g004
Figure 5. Rules and models communication downstream communication.
Information 12 00455 g005
Figure 6. Platooning Example (Trucks between brackets).
Information 12 00455 g006
Figure 7. Inputs and Ouputs of ML engine.
Information 12 00455 g007
Figure 8. Custom Stacking Algorithm.
Information 12 00455 g008
Figure 9. Cluster level needs vs. characteristics.
Information 12 00455 g009
Figure 10. Intelligent Hierarchical IDS Security Framework—A platooning application.
Information 12 00455 g010
Table 2. CAM generation parameters—EN 302 637-2 [34].
FieldValue
Max Interval>1000 ms
Min Interval<100 ms
Position Change>4 m
Heading Change>4.0 degress
Velocity Change>0.5 m/s
Table 3. Cluster division using the entities from the dataset.
L 2 L 1 L 0
Map 1Platoon 1.1v_0, v_1, v_2, v_3, v_4
Platoon 1.2v_14, v_15, v_17, v_21
Platoon 1.3v_16, v_18, v_20, v_23, v_26
Map 2Platoon 2.1v_0, v_6, v_12, v_18, v_24
Platoon 2.2v_1, v_7, v_13, v_19, v_25, v_23, v_26
Platoon 2.3v_32, v_35, v_37, v_40, v_43
Platoon 2.4v_38, v_41, v_44, v_45, v_46, v_47, v_50
Platoon 2.5v_49, v_52, v_54, v_56, v_59
Platoon 2.6v_48, v_51, v_53, v_55
Map 3Platoon 3.1v_1, v_3, v_7, v_10, v_12
Platoon 3.2v_13, v_15, v_17, v_18, v_19
Map 4Platoon 4.1v_4, v_5, v_7, v_10, v_11
Platoon 4.2v_18, v_20, v_23, v_25
Platoon 4.3v_32, v_25, v_27, v_40, v_43
Platoon 4.4v_38, v_41, v_44, v_45, v_46, v_47, v_50
Platoon 4.5v_49, v_52, v_54, v_56, v_59
Platoon 4.6v_48, v_51, v_53, v_55
Map 5Platoon 5.1v_2, v_3, v_5, v_7
Platoon 5.2v_10, v_12, v_14
Platoon 5.3v_19, v_21, v_23, v_25, v_26
Map 6Platoon 6.1v_0, v_1, v_2, v_3, v_4, v_6, v_8
Platoon 6.2v_14, v_15, v_17, v_19, v_21, v_24, v_27
Platoon 6.3v_16, v_18, v_20, v_23
Table 4. Contents of the test and training datasets per message type.
TrainingTest
ParameterValue% of TotalValue% of Total
Messages (Total)2,491,271100.0017,237,722100.00
Non-Attack1,508,87360.579,062,02352.57
DoS912,87536.647,756,81745.00
Fab. Speed30,0021.20172,8921.00
Fab. Acc23,8190.9562,6860.36
Fab. Heading15,7020.63183,3041.06
Table 5. Results obtained from the ML classification.
NormalDoSSpeedAccHeading
AlgorithmAccuracyMAERMSETPRFPRTPRFPRTPRFPRTPRFPRTPRFPRAvg TPRAvg FPR
Random Forest0.980.020.080.980.020.980.000.770.010.770.000.900.000.880.01
MLP0.980.010.091.000.051.000.000.260.000.100.000.000.000.470.06
J480.970.010.110.970.020.980.000.770.010.780.010.890.010.880.01
REP Tree0.970.010.100.970.020.990.000,710.010.620.010.870.000.830.01
LMT0.970.010.100.980.030.980.000.760.000.760.000.890.000.870.01
Random Tree0.970.010.110.970.030.980.010.690.010.610.010.860.000.820.01
Hoeffding Tree0.960.050.120.980.060.970.000.640.000.280.000.620.000.700.01
Logistic0.950.040.130.990.090.960.010.000.000.000.000.000.000.390.02
OneR0.940.030.160.990.130.920.010.000.000.000.000.000.000.380.03
Decision Stump0.940.040.160.990.130.920.010.000.000.000.000.000.000.380.02
SMO0.920.240.320.910.051.000.100.000.000.000.000.000.000.380.02
PART0.970.010.110.970,020.990.000.660.000.630.010.840.000.820.01
Naive Bayes0.850.060.240.740.030.990.210.750.010.530.010.530.010.650.06
Decision Table0.660.180.291.000.710.310.000.000.000.000.000.000.000.260.14
Table 6. Comparison of the size and elapsed time taken during training and testing.
AlgorithmTrain Time (s)Test Time (s)Size (KB)
LMT21,879231225
Decision Table451416929,684
PART31282814860
Random Forrest301447654,497
SMO26882310
MLP11762516
J48335311024
Logistic139309
REPTree12319791
HoeffdingTree1077512
Decision Stump7153
OneR72917
Naive Bayes4795
Table 7. Configuration of the algorithms for the ensemble learning.
MLP RF J48
batchSize100 batchSize100 batchSize100
numDecimalPlaces2 numDecimalPlaces2 numDecimalPlaces2
hiddenLayersa bagSizePercent100 confidenceFactor0.25
learningRate0.3 maxDepth0 minNumObj2
momentum0.2 numExecutionSlots1 numFolds3
seed0 numFeatures0 seed1
trainingTime500 numIterations100
validationSetSize0 seed1
validationThreshold20
Table 8. Results for the classification using Ensemble learning.
NormalDoSSpeedAccHeading
EnsembleAccuracyTPRFPRTPRFPRTPRFPRTPRFPRTPRFPRAvg TPRAvg FPR
Stacking Custom0.980.980.010.990.000.790.000.790.010.900.000.890.00
Stacking0.980.980.020.980.000.790.000.670.000.900.000.860.00
Vote Major0.980.990.020.990.000.760.000.720.000.870.000.870.00
Vote Average0.980.990.020.990.000.750.000.710.000.880.000.860.00
Vote Maximum0.970.970.030.980.000.770.000.770.010.610.000.820.01
Vote Product0.970.970.030.980.000.770.000.760.010.840.000.860.01
Vote Minimum0.970.970.030.980.000.770.000.770.010.610.000.820.01
Table 9. In-depth evaluation of the Decision Stump Algorithm.
NormalAttack
Attack TypeTPRFPRTPRFPR
DoS0.990.10.940.01
Speed1.001.000.470.00
Acceleration1.001.000.000.00
Heading0.990.990.470.00
Publisher’s Note: MDPI stays neutral with regard to jurisdictional claims in published maps and institutional affiliations.

