Article

Comparison of Methods to Evaluate the Influence of an Automated Vehicle’s Driving Behavior on Pedestrians: Wizard of Oz, Virtual Reality, and Video

1
Chair of Ergonomics, Technical University of Munich, 85748 Garching, Germany
2
BMW Group, New Technologies, 85748 Garching, Germany
*
Author to whom correspondence should be addressed.
Information 2020, 11(6), 291; https://doi.org/10.3390/info11060291
Submission received: 5 May 2020 / Revised: 22 May 2020 / Accepted: 26 May 2020 / Published: 29 May 2020

Abstract

:
Integrating automated vehicles into mixed traffic entails several challenges. Their driving behavior must be designed such that is understandable for all human road users, and that it ensures an efficient and safe traffic system. Previous studies investigated these issues, especially regarding the communication between automated vehicles and pedestrians. These studies used different methods, e.g., videos, virtual reality, or Wizard of Oz vehicles. However, the extent of transferability between these studies is still unknown. Therefore, we replicated the same study design in four different settings: two video, one virtual reality, and one Wizard of Oz setup. In the first video setup, videos from the virtual reality setup were used, while in the second setup, we filmed the Wizard of Oz vehicle. In all studies, participants stood at the roadside in a shared space. An automated vehicle approached from the left, using different driving profiles characterized by changing speed to communicate its intention to let the pedestrians cross the road. Participants were asked to recognize the intention of the automated vehicle and to press a button as soon as they realized this intention. Results revealed differences in the intention recognition time between the four study setups, as well as in the correct intention rate. The results from vehicle–pedestrian interaction studies published in recent years that used different study settings can therefore only be compared to each other to a limited extent.

1. Introduction

An increasing number of automated functions are being integrated into vehicles, and it is only a question of time before the first conditionally automated vehicles (AVs) [1] are driving on public highways. In the long term, AVs will also travel in urban spaces that are characterized by an increased complexity compared to driving on highways [2]. In both scenarios, in addition to AVs, human road users (HRUs) will continue to participate in the traffic system. For this reason, AVs must not only be able to detect HRUs, but they must also communicate with them to ensure safe and efficient interaction. Explicit and implicit communication already takes place in road traffic today. For example, in terms of explicit communication, human drivers flash their headlights or deploy the horn to communicate their intentions [3]. For AVs, besides the existing communication forms, it is also possible to extend the explicit communication by using external human–machine interfaces (eHMIs) (e.g., [4,5,6,7,8,9,10,11]), such as light strips [6,12] or displays [4,7,13].
However, it is still unknown whether AVs require eHMIs. In addition, it has not yet been fully investigated as to what driving profile AVs should follow, and if these trajectories should differ from situation to situation. The driving profile and eHMI might influence traffic safety, as well as the communication between AVs and other HRUs.
Several studies have already been carried out to investigate the influence of AV markings, eHMIs and driving profiles. Most studies focused on the interaction between AVs and pedestrians, using different methods, e.g., images, videos, virtual reality (VR), or Wizard of Oz (WoZ) vehicles. More recently, driving simulator studies subsequently investigated the interaction between AVs and human drivers. However, the extent of transferability of results between these studies is still unknown.

1.1. Images

One method suggested by researchers for development process for human machine interactions are images. For a comparison of 30 early stage design concepts of eHMIs within a short space of time, images were used [14]. Participants had to rate their understanding of the different concepts. The results presented gave no clear recommendation regarding the concepts, but the conclusion of the paper was that the method is suitable for evaluating design elements at an early stage [14]. The method of presenting photos to participants to evaluate the AV’s communication strategies was also used in a preliminary study by [15]. Photos of an approaching vehicle were shown to the participants, who were then asked what they would focus on when crossing the street [15]. The authors found out that pedestrians pay particular attention to the AV’s braking behavior before crossing the road [15]. Most participants would even wait for a complete standstill, especially when they did not see a driver in the AV [15]. Reference [16] used images of different vehicles to evaluate which vehicle type is most suitable for a subsequent video-based survey.
To sum up, these references suggest that the image setup can be useful for gleaning initial impressions for subsequent studies and for evaluating early stage design concepts.

1.2. Videos

The subsequent video experiment of [16] was used to evaluate the crossing behavior of participants at an unmarked road, depending on different vehicles driving behavior and the automation state of the vehicle [16]. Again, it was shown that the braking behavior plays an important role in the pedestrians’ decision to cross the road independent of the vehicle’s automation status or the presence of a driver [16].
Additional eHMIs have a positive impact on the imagined crossing behavior of pedestrians [13]. During the braking process, eHMIs have influenced the subjective feeling of participants that it is safe to cross [17]. The eHMIs should be installed on the roof, windscreen, or grille; however, projections and eHMIs on wheels should be avoided [17].
The video studies presented were used to identify possible differences between different implicit and explicit AV communication forms.

1.3. Virtual Reality

Whereas the participants in the video studies sat in front of a monitor, for VR, participants usually saw the environment, including the AV, through a head-mounted display.
The results from a VR study show that pedestrians react with confusion and mistrust to atypical trajectories compared to conventional trajectories [18]. This gives a first hint that VR is a good tool for evaluating pedestrian–vehicle interaction [18]. Other results illustrate that pedestrians understand the AV’s driving behavior and recommend early deceleration when yielding [15]. A hard initial braking with a pitch reduced the time pedestrians need to realize an AV’s yielding intention [19]. Moreover, defensive driving strategies led to pedestrians starting to cross at an earlier point in time [19].
In addition, eHMIs enhance the interaction between pedestrians and AVs [4] and improve the perceived safety and comfort of participants introduced to the eHMI, when encountering an AV [20]. However, the vehicle size has a small effect on the perceived safety [4]. Larger vehicles reduce the perceived safety of participants [4]. The authors of [21] integrated display into their AV mimicking eyes looking at the pedestrians. These “eyes” help pedestrians to feel safer crossing the street and make their decision to cross quicker [21]. However, eHMIs do not necessarily have the same advantages in all countries: using an eHMI when yielding helps pedestrians in Germany and the United States to realize the AV’s intention; however, this effect is not apparent for those in China [6]. In addition, the results have shown that, across Germany, the United States, and China, eHMIs deteriorate the pedestrians’ recognition of the AV’s passing intention [6]. Moreover, the implemented test environment had an influence, and especially the sound. The study by [22] showed that a spatial audio enhanced task performance compared to unimodal muting.
In summary, it can be stated that many questions concerning explicit and implicit communication of AVs have been carried out in VR. VR setups were especially advantageous due to the cost-effective implementation of a study design that can be replicated in different countries. In addition, setup is more immersive than video or image setups.

1.4. Wizard of Oz

To investigate the interaction of a user with a computer system that is not yet fully developed, a WoZ approach can be used [23]. In this approach, an investigator—who is hidden from the user—simulates the system [23]. In most WoZ studies that examine the interaction between AVs and pedestrians, seat covers are used to hide the driver from the pedestrians’ view, so as to simulate an AV [24,25,26,27,28]. The results of WoZ studies demonstrated that being able to see the driver is not very important for pedestrians [12,25,28]. In the study by [12], only half of the sample recognized the driver; however, when asked directly, they expressed that they felt safer when a driver is present. This result stands in contrast to the results of [28], where the perceived safety was not influenced by being able to see the driver. As a reason for their increased feeling of safety in the study of [12], some participants did not mention the eHMI, but instead mentioned the driving strategy of the AV [12]. This is in line with the results of [8], who stated that pedestrians rely on proven methods, and therefore focus on the driving behavior of vehicles rather than on additional eHMIs. The results also demonstrate that not every eHMI is suitable for communication with pedestrians [12]. The pedestrians did not relate the cyan light bar consisting of 12 LEDs on the roof used in the study to themselves, and could not understand the vehicle’s intention as communicated by the eHMI [12].
In recent years, the number of WoZ studies has increased. With the WoZ setup, similar questions were investigated as with the VR setup, but the WoZ method is closer to reality. However, the use of a vehicle, a trained driver, a test track, the objective data measurement, and the safety protocol in WoZ studies are complex and cost-intensive.

1.5. Driving Simulator

While the design of AV communication initially focused on pedestrian–vehicle interaction, current studies also deal with human driver–AV interaction. In order to evaluate the influence of different driving strategies and eHMIs on other drivers, simulator studies have been conducted. Reference [7] examined the potential of eHMIs in bottlenecks and recommends the use of eHMIs due to a reduced passing time compared to a condition without an interface. However, labeling an AV did not have an influence on drivers in a simulation setup [9,11].
Investigated driver–AV interaction via a driving-simulator has the benefit of a risk-free setup, compared to WoZ setups.

1.6. Objectives

With regard to the different results, the question arises as to the method by which the communication of AVs should be investigated to obtain valid results. Furthermore, it is unclear whether the obtained results can be compared with each other and whether recommendations should be derived from the different studies.
To answer the question of comparability, we replicated the same study design in four different setups: two videos, one VR, and one WoZ approach. The video setup was divided in two parts: In the first part, we used videos from the VR setup, and in the second part, we filmed the WoZ vehicle. To the knowledge of the authors, such a thorough method validation has not been contributed to the state of the art yet.
Based on the previous results, we focused on the comparison of AVs’ driving behavior without the use of eHMIs. In particular, the results for the video, VR and driving simulator studies revealed a positive impact of eHMIs on pedestrians’ intention-recognition and the imagined crossing behavior. This contrasts with the results of the WoZ studies, in which hardly any effects were found for eHMIs, and in which driving behavior likely plays a greater role in the pedestrians’ decision to cross the road. Across all methods, it can be seen that the driving behavior has an influence on the crossing behavior of pedestrians.
Images were excluded as a method variant in this study because they do not illustrate vehicle dynamics. The focus was on pedestrian–AV interaction, as this is the focus of most published studies. For this reason, driving simulator studies are not included in the comparison, as they investigate human driver–AV interaction.

2. Materials and Methods

2.1. Procedure

A study plan was implemented in three different setups, namely WoZ, VR, and videos, of both setups. The studies were conducted in Germany, which implicates that the motorized traffic was driving on the right lane. In all setups, participants stood at the roadside, in a shared space. An AV approached from the left, using different driving profiles, characterized by changing speed, to communicate whether the HRU—in this case, a pedestrian—was allowed to go first or should wait. Participants were asked to recognize the AV’s intention and to press a button when they thought they realized the intention (intention recognition time, IRT).
In the WoZ study, we used the button of a light barrier system. The vehicle activated the sensors after driving over a determined point and a light flashed, when participants pressed the button. This light was visible to the driver, so that he could accelerate to the original speed. Therefore, the rest of the driving profile did not influence pedestrians [24].
In the VR study, participants were asked to press a button on a remote control, and the simulation stopped simultaneously. Additionally, we tracked the walking movement. In this variant, we replicated all driving profiles and asked participants not to press the button, but to cross the virtual street. However, for safety reasons, we did not ask participants in the WoZ setup to cross the street.
In the video setup, participants saw all trials on a monitor. They were asked to press a key on the keyboard, at the moment they realized the intention, upon which the video disappeared.
After each trial, participants had to answer a small number of questionnaire items in each study setup.

2.2. Apparatus

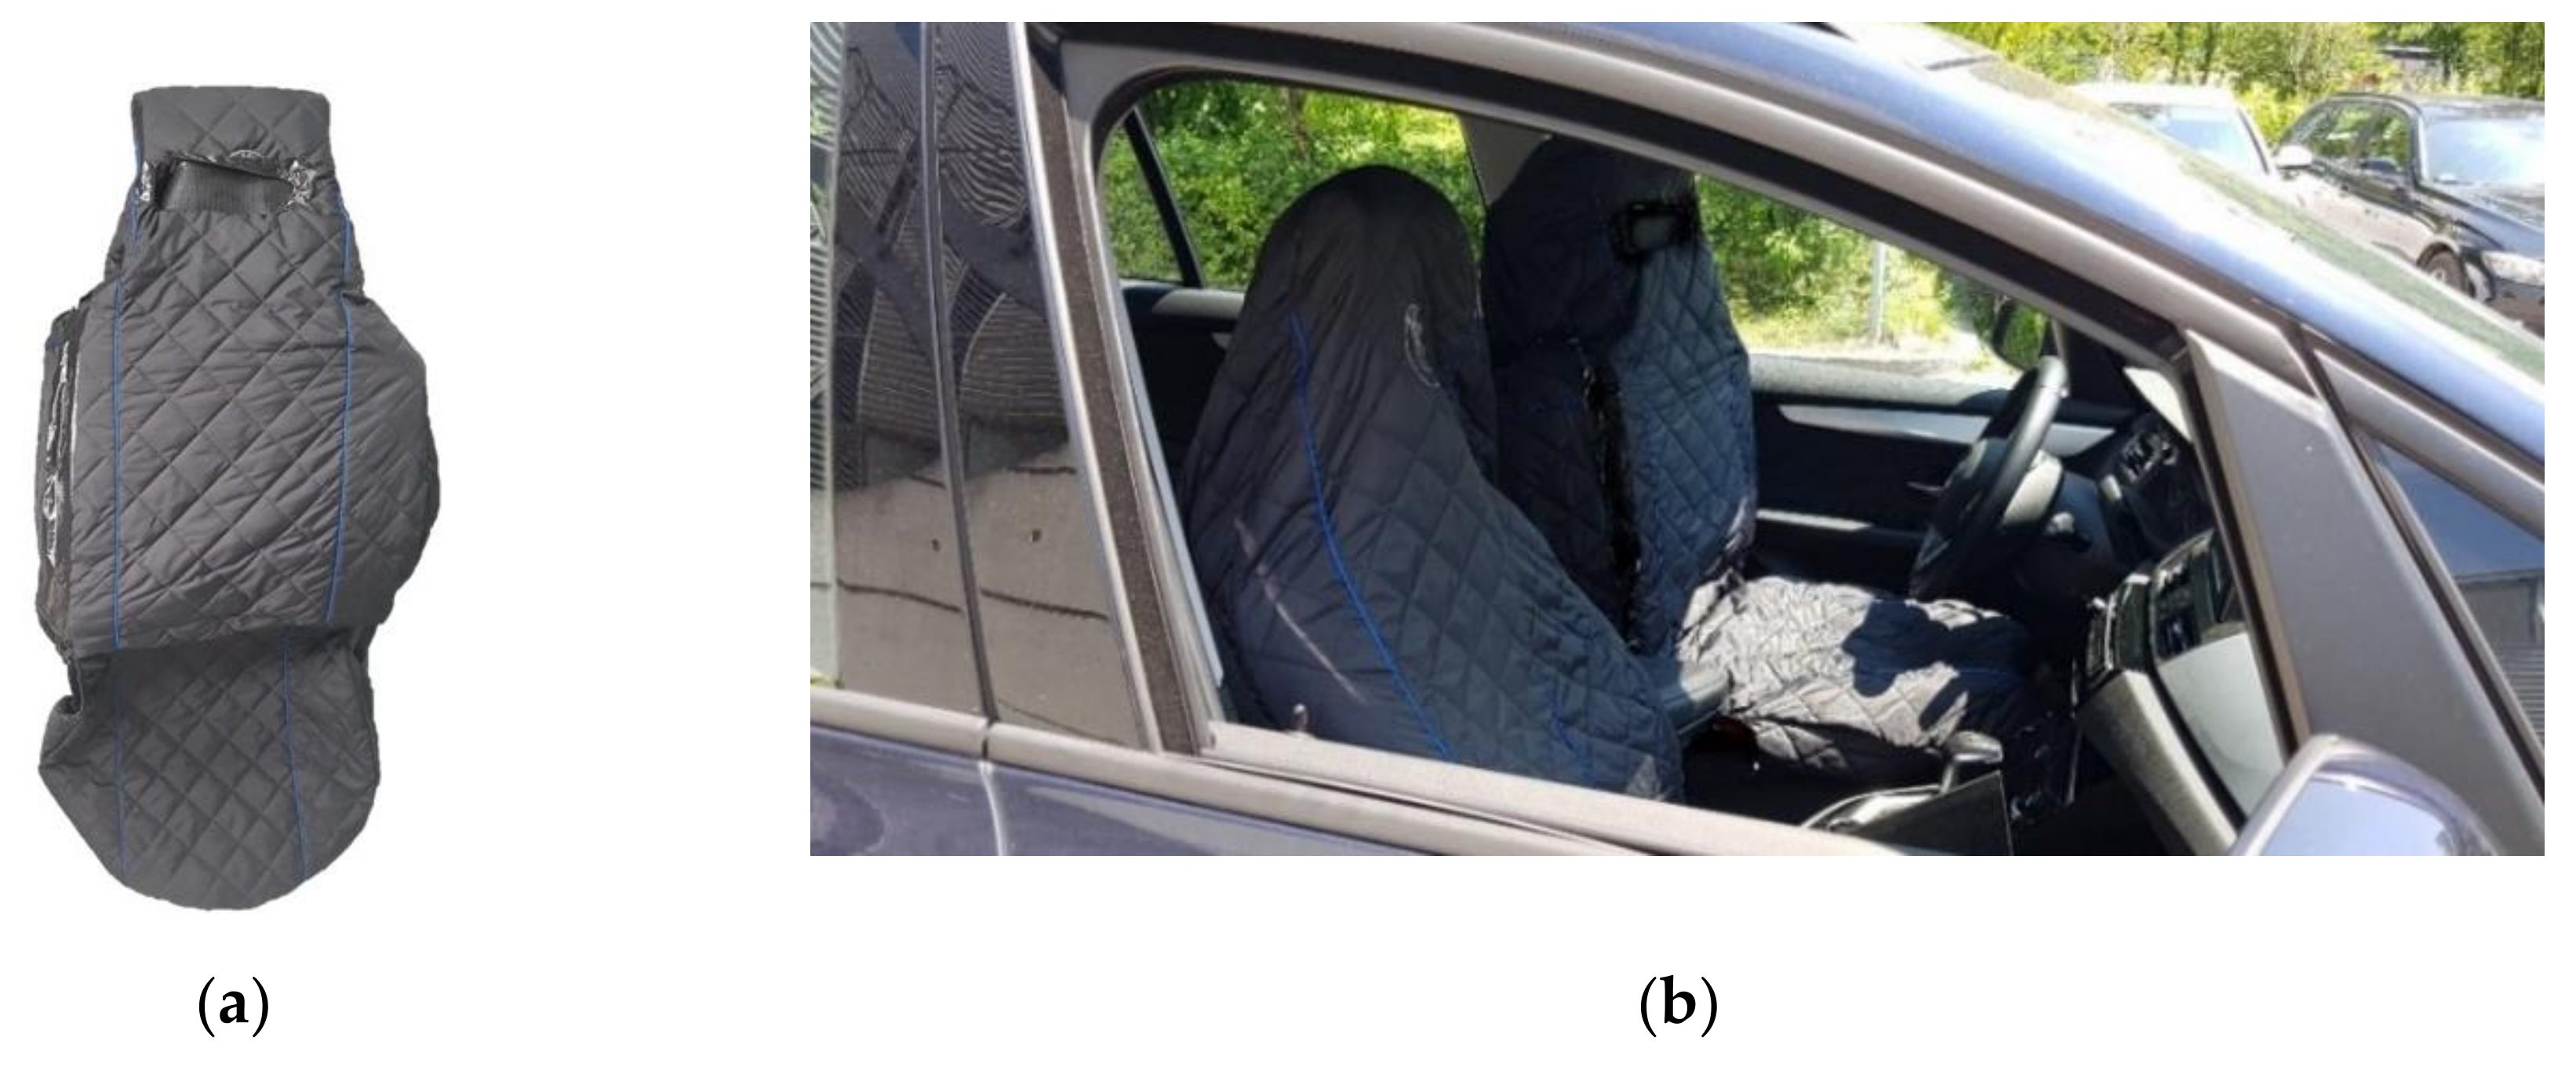
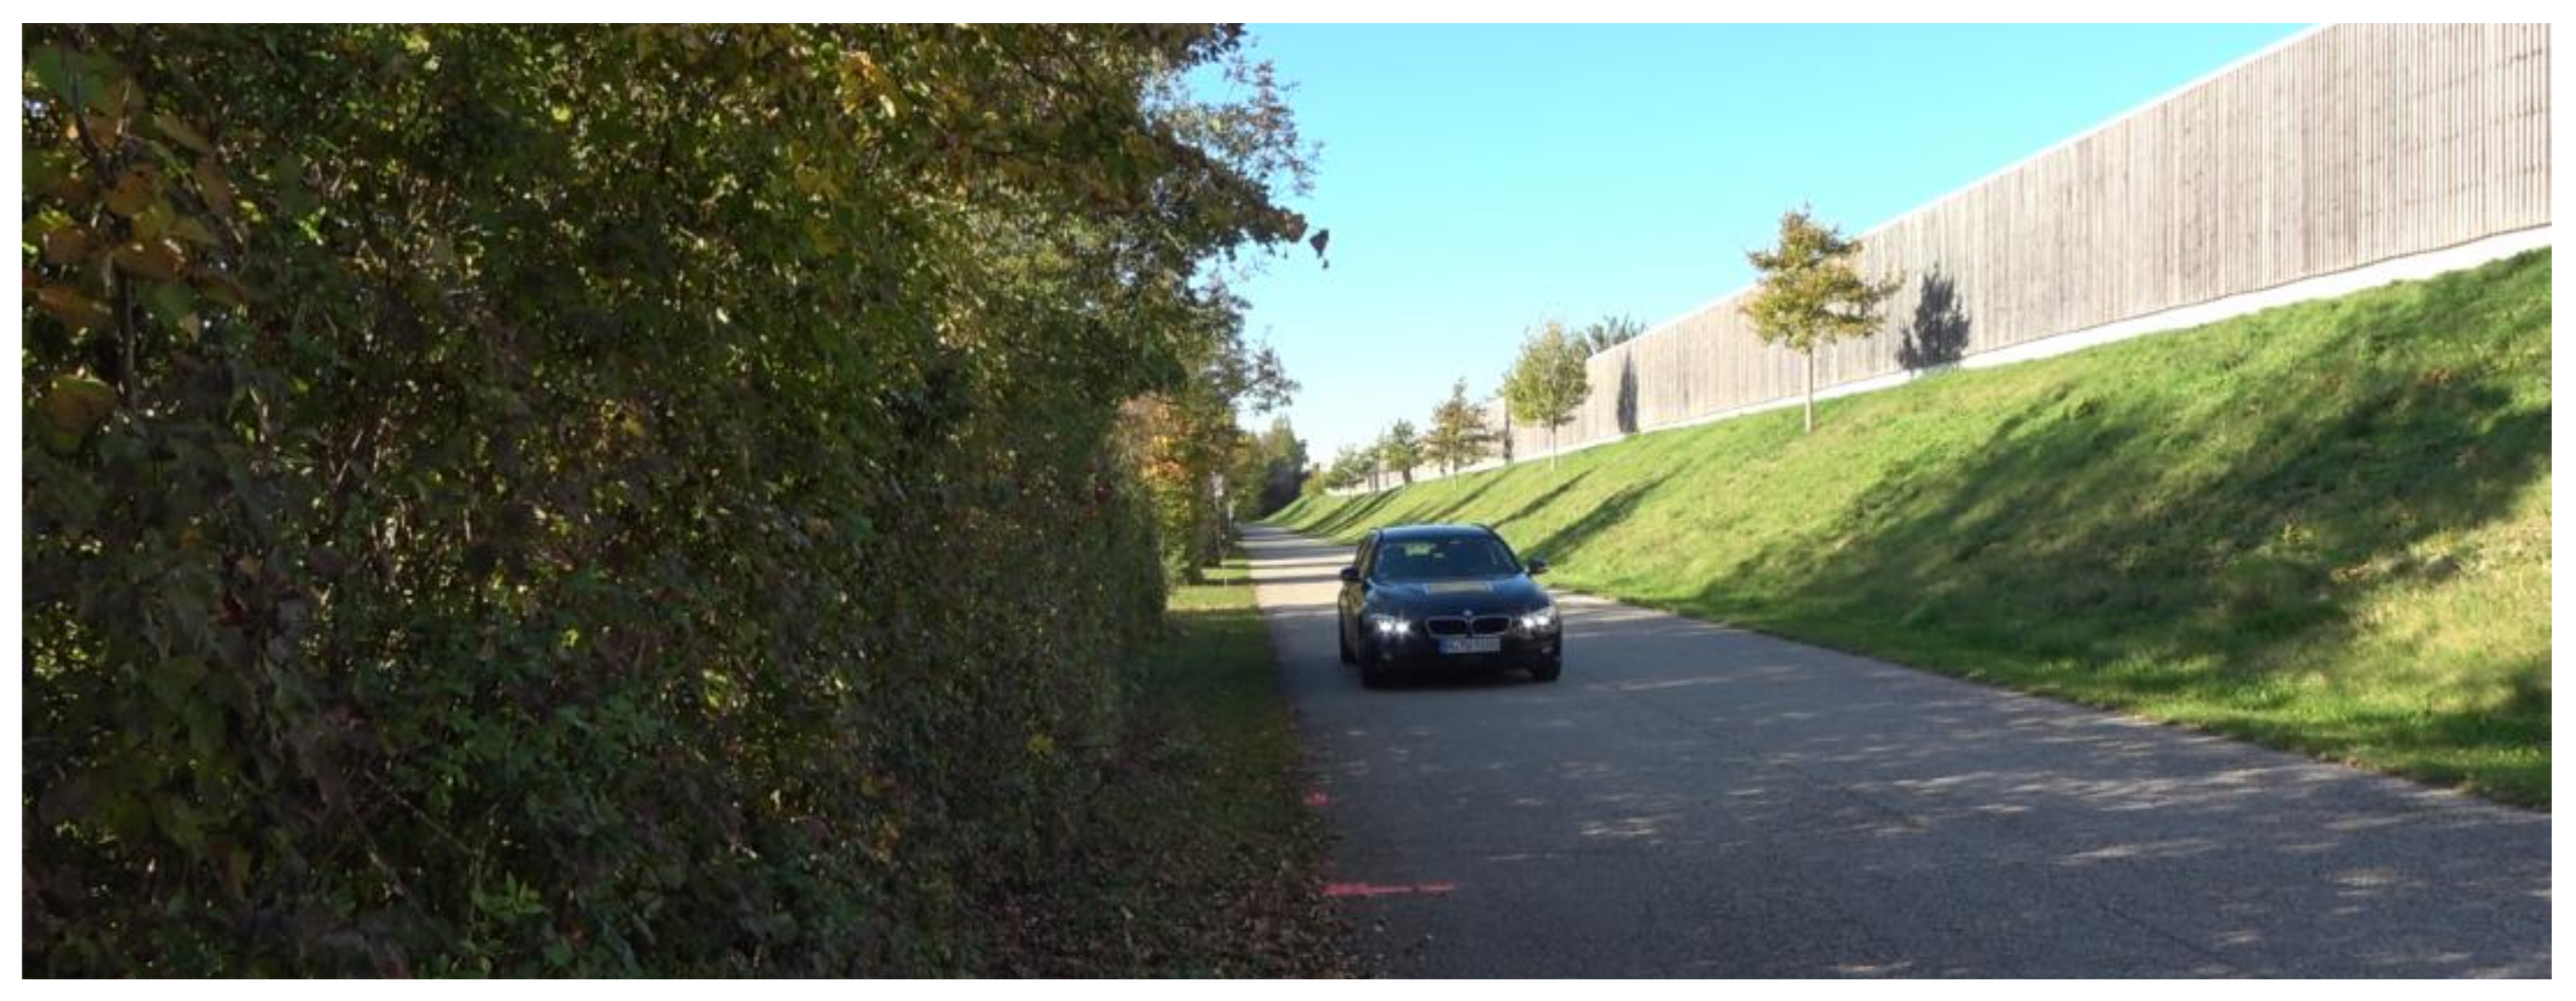
2.2.1. Wizard of Oz Setup

The WoZ vehicle was a BMW 2 series (F46, 220d xDrive) with automatic transmission and equipped with a speed limiter (Figure 1 and Figure 2). The vehicle was marked as an “automated test vehicle” with two magnetic signs. A non-professional driver drove the vehicle and was hidden from the pedestrians’ view by a seat cover (Figure 1). The driver practiced the trajectories, so that there was little deviation with each repetition [24]. We implemented the light barrier system SmartSpeed Pro of the company Fusion Sport, connected to a remote control with one button via Bluetooth, and recorded at a sampling rate of 1000 Hz.

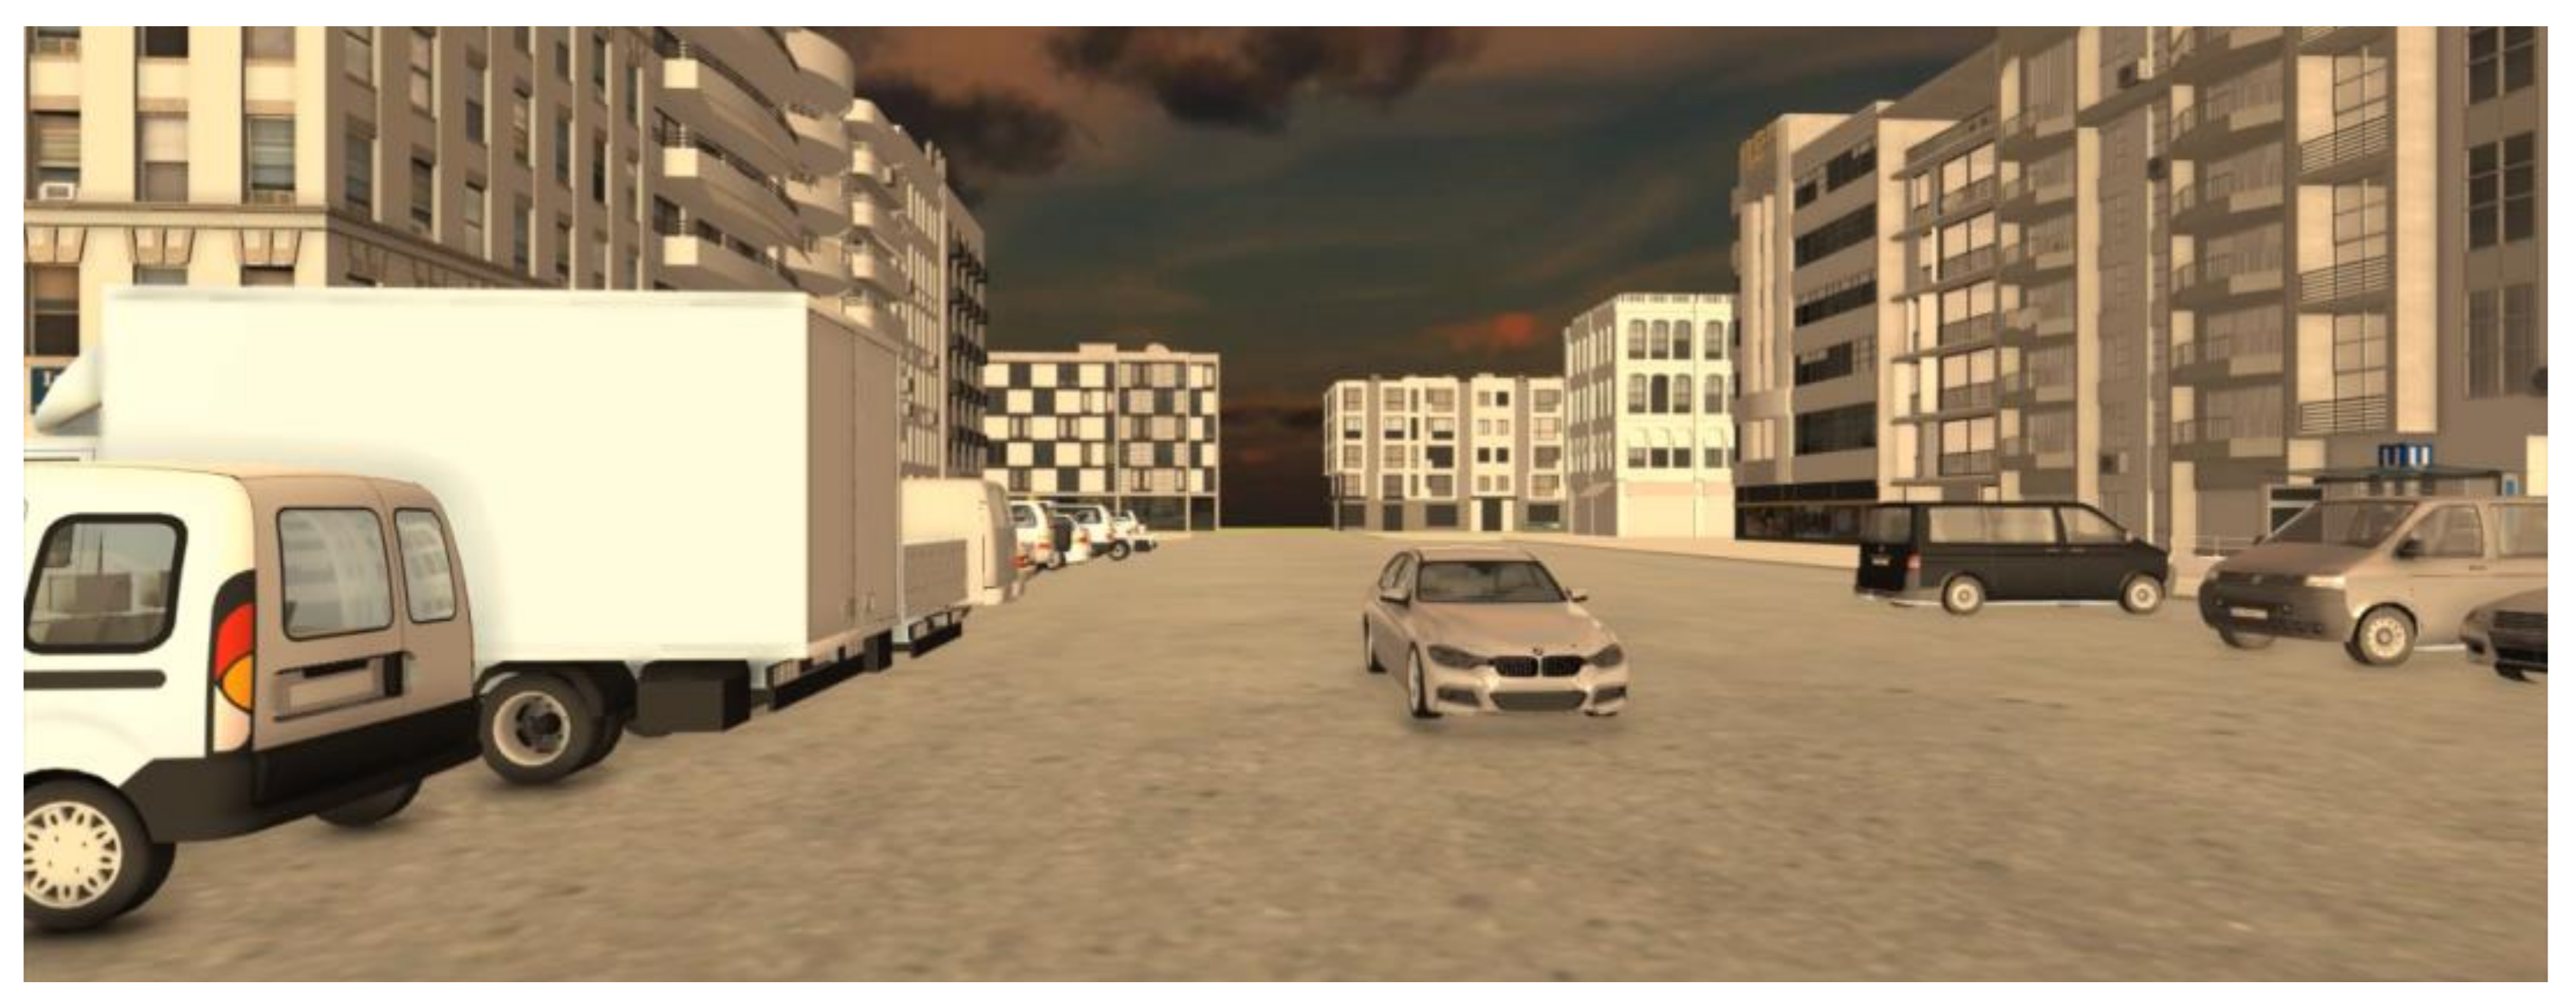
2.2.2. Virtual Reality Setup

An HTC Vive Pro VR setup with a head-mounted display, two infrared sensors, two trackers, and one remote controller wereused for the VR study setup. All participants held the remote control in their hand, and a tracker was attached to each foot. The simulation software is based on Unity 3D, and a simulated BMW 3 series (F30) was used (Figure 3). The vehicle had no driver, but also no additional markings. The investigator could manipulate the driving behavior by adding a trajectory path and maneuver points. Driving data and the triggering of the button were recorded at 5 Hz. However, no sound was utilized, due to technical reasons.

2.2.3. Video Setups

We filmed the WoZ vehicle, using a SONY FDR-AX53 with a 26.8 mm wide-angle lens (Figure 2). The camera was mounted on a tripod at a height of 1.61 m, at the same position the participants were standing in the WoZ study. The videos from the VR setup were recorded, using the open-source software OBS (Open Broadcaster Software) studio, and the viewing height was also 1.61 m (Figure 3). The videos were incorporated via HTML, and the survey was accessible from a website. However, since the videos were too large for low internet capacity, most participants watched the videos in the premises of the Chair of Ergonomics (Technical University of Munich) or BMW. The invited participants saw the videos on a 24” monitor. For all videos, no sound was recorded.

2.3. Study Design and Variables

For all four study setups, almost the same study design was implemented. However, there were some small differences between the study setups:
  • For the WoZ setup, participants saw each driving profile twice.
  • For the VR setup, we added the condition “walking” instead of a second trial, since we did not let participants cross the road in the WoZ setup for safety reasons. One group of participants started walking when they thought it was safe to cross, and afterward, they were asked to press the button at the moment they realized the AV’s intention. The other group started with the IRT condition and walked in the second part of the study. The allocation of participants was randomized.
  • In the video setups, each participant saw the two video types, WoZ and VR, in a randomized order.
We randomized two AV intentions: either the AV goes first, or to Let the HRU go first. For both intentions, an unambiguous and ambiguous driving profile was presented to the participants. To communicate the intentions, altered driving strategies were used that differed in the longitudinal dynamics.

2.3.1. Independent Variables

A within-subject design with two AV intentions (Let the HRU go first and AV goes first) and—for each of these intentions—an unambiguous and an ambiguous driving profile was implemented. Previous studies showed that the IRT is not sensitive enough to evince differences in driving profiles that are rated very well by humans; thus, we chose highly opposite profiles to apply the IRT [24,25]. All profiles were extracted from human trajectories: In a previous study, participants drove three times, in an unambiguous and ambiguous way, to communicate both intentions to a pedestrian. After each trial, participants rated how satisfied they were with the respective driving profile. We extracted the best rated profiles and defined the specified target trajectories. For the factor “Unambiguity of Driving Profiles” the driver drove either in an understandable or misleading way, to communicate both intentions.
For both intentions, the vehicle accelerated to 28.5 km/h on a 100 m test track. All indicated distances refer to the vehicle’s front bumper. If the AV goes first, it had a speed of at least 20 km/h when passing the pedestrian. For the second intention, to Let the HRU go first the AV decelerated and came to a full stop.
The driving profile AV goes first, unambiguous is defined by a constant speed of 28.5 km/h. In contrast, for the profile AV goes first, ambiguous the vehicle accelerated to 28.5 km/h and decelerated to 13 km/h after 60 m. After another 32.6 m (7.4 m distance from the pedestrian’s position), the vehicle accelerated again (Figure 4).
For the intention Let the HRU go first the vehicle decelerated in two different ways. For the driving profile Let the HRU go first, unambiguous the vehicle decelerated by at most 1.5 m/s2 at a distance of 60 m from the start position. Thus, it started decelerating at the same point as in the driving profile AV goes first, ambiguous. The vehicle stopped completely 7.4 m away from the pedestrian—the same point at which the vehicle accelerated in the AV goes first, ambiguous profile. In contrast to the smooth deceleration (at max. 1.5 m/s2) for the unambiguous profile, the vehicle decelerated by at most 4.1 m/s2 for the driving profile Let the HRU go first, ambiguous. The braking process started at 85.2 m from the starting position; hence, the vehicle slowed down in 25.2 m distance to the braking point for the unambiguous driving profile. The vehicle stopped completely after a driving distance of 95.7 m, 4.3 m away from the pedestrian’s position.

2.3.2. Dependent Variables

As mentioned, participants pressed a button when they thought they had recognized the vehicle’s intention [15,24,25]. We measured the time lapse between the vehicle being at a 40 m distance from the pedestrian’s position and the moment at which the participants pressed the button. This time lapse, the IRT, was measured for each trial.
After each trial, participants filled out a five-item questionnaire. This questionnaire was already published in [24] and based on previous studies [15,25]. Based on the IRT, the participants were asked about the vehicle’s assumed intention (Let the HRU go first or AV goes first) and whether they would cross the street at the moment they recognized the intention. Then, pedestrians evaluated their certainty about the vehicle’s intention (very uncertain to very certain), the vehicle’s driving behavior (very poor to very good), and the perceived criticality of the situation (very critical to very uncritical) on a five-point Likert scale [24]. In the video study, participants were also asked if the video activity had run smoothly from a technical point of view. This item was used to exclude data from the evaluation if videos had frozen during playback.
In order to track the walking movement in the VR setup, we asked participants not to press the button, but to cross the virtual street. The trackers on each foot detected when the participant walked over a virtual line. This line was located about one meter from the participants’ starting position. In order to be able to compare the time at the beginning of road crossing with the IRT, the times were synchronized: In both cases, the time measurement started at a 40 m distance from the pedestrian’s position. However, the IRT was always independent from the walking movement (Figure 5).

2.4. Sample

For the VR setup, 37 participants (23 male and 14 female) with a mean age of M = 27.32 years (SD = 9.93 years) and for the WoZ experiment 34 participants (24 male and 10 female) with a mean age of M = 40.94 years (SD = 21.39 years) were recruited via BMW and postings at the Technical University of Munich (Table 1). In the video setup, from altogether 46 participants (20 male and 26 female) with a mean age of M = 30.50 years (SD = 11.55 years), 28 participants were recruited via emailing lists among BMW employees and postings at the Technical University of Munich, and the remaining participants participated online. All participants received compensation; however, in the video setup, participants either received monetary compensation or—the participants who participated online—were entered into a lottery for vouchers for an electronic commerce company.
On average, participants travel as pedestrians in traffic M = 7.06 h (SD = 6.33 h) per week in the WoZ setup, M = 8.03 h (SD = 6.01 h) per week in the VR setup, and M = 6.57 h (SD = 5.76 h) per week in the video setup.

2.5. Analysis

The different study setups (WoZ, VR, and video) were compared with a between subject design. However, for the video setups, we had two kinds of videos (video WoZ and video VR) and dependent samples. The samples of the WoZ, VR and the two video setups are independent. We were only interested in the comparison between WoZ and VR; WoZ and video WoZ setup; and VR and the video VR study (Figure 5). Therefore, all outcomes are related to these comparisons. Moreover, as a result of the different nature of the samples (the samples of the two video setups are dependent and the other samples independent), a statistical analysis was not useful for all results and most data were compared descriptively.
For the WoZ setup, we had to exclude three participants, because they did not understand the task. In the VR setup, seven participants did not press the button. Therefore, the IRT was evaluated for only 30 participants; however, subjective data are still described for all 37 participants. For the video setups, we asked participants to answer if the video ran smoothly from a technical point of view. All trials in which participants indicated technical problems were excluded from the evaluation.
Due to the different setups, we had dissimilar maximum values for the IRT: in the WoZ setup, the driving behavior varied from trial to trial because of the human driver [24]. Accordingly, the videos of the WoZ setup are also dependent on the driver. Both videos were cut at the moment the AV came to a complete stop or had passed the pedestrian. The time may vary due to human error, so the lengths of the routes were calculated to specify the maximum IRTs. Therefore, it is not possible to compare the absolute values of the IRT between the different setups. However, we had the participants’ answers about the vehicle’s assumed intention and if they would cross the street. Both dependent variables are related to the IRT, but can still be evaluated.

3. Results

This section is divided into five subsections. In the first three subsections, the setups are compared with each other with regard to the frequency of misinterpretations of intentions (Section 3.1), the mentioned crossing behavior (Section 3.2), and the time of decision (Section 3.3). In Section 3.4, we analyzed for each setup, separately, whether the unambiguity of driving profiles led to different IRTs and evaluations of driving behavior. In Section 3.5., IRT is compared to the start of crossing behavior for the VR setup.

3.1. Misinterpretations of Intentions

Table 2 presents the misinterpretation rate for the intention Let the HRU go first, while Table 3 illustrates the misinterpretation rate for the intention AV goes first for all setups. The results of the misinterpretations of intentions for the WoZ study were already published in [24].
For the intention Let the HRU go first, we found correct interpretation rates of 100% (WoZ), 97% (VR), 96% (video VR), and 89% (video WoZ) for the unambiguous driving profile. In contrast, the interpretation for the ambiguous driving profile was only correct in 23% (WoZ), 36% (video VR), 39% (video WoZ), and 70% (VR) of all trials.
For the intention AV goes first, the results showed a similar outcome. For the unambiguous driving profile, we found correct interpretation rates of 93% (video WoZ), 97% (WoZ and VR), and 98% (video VR). In contrast, the interpretation for the ambiguous driving profile was only correct in 29% (WoZ), 60% (VR), 68% (video WoZ), and 72% (video VR) of all trials.
To sum up, for all methods, the ambiguous driving profiles lead to higher misinterpretation rates, compared to the unambiguous profiles. This effect can especially be seen for the WoZ setup, whereas the effect is more moderate for the VR setup. However, for the video setups we found different results. The misinterpretation rate for the intention Let the HRU go first is between the rate for the WoZ and VR setup for both video setups. In contrast, for the intention AV goes first the misinterpretation rate is lower than for the WoZ and VR setup for both video setups.

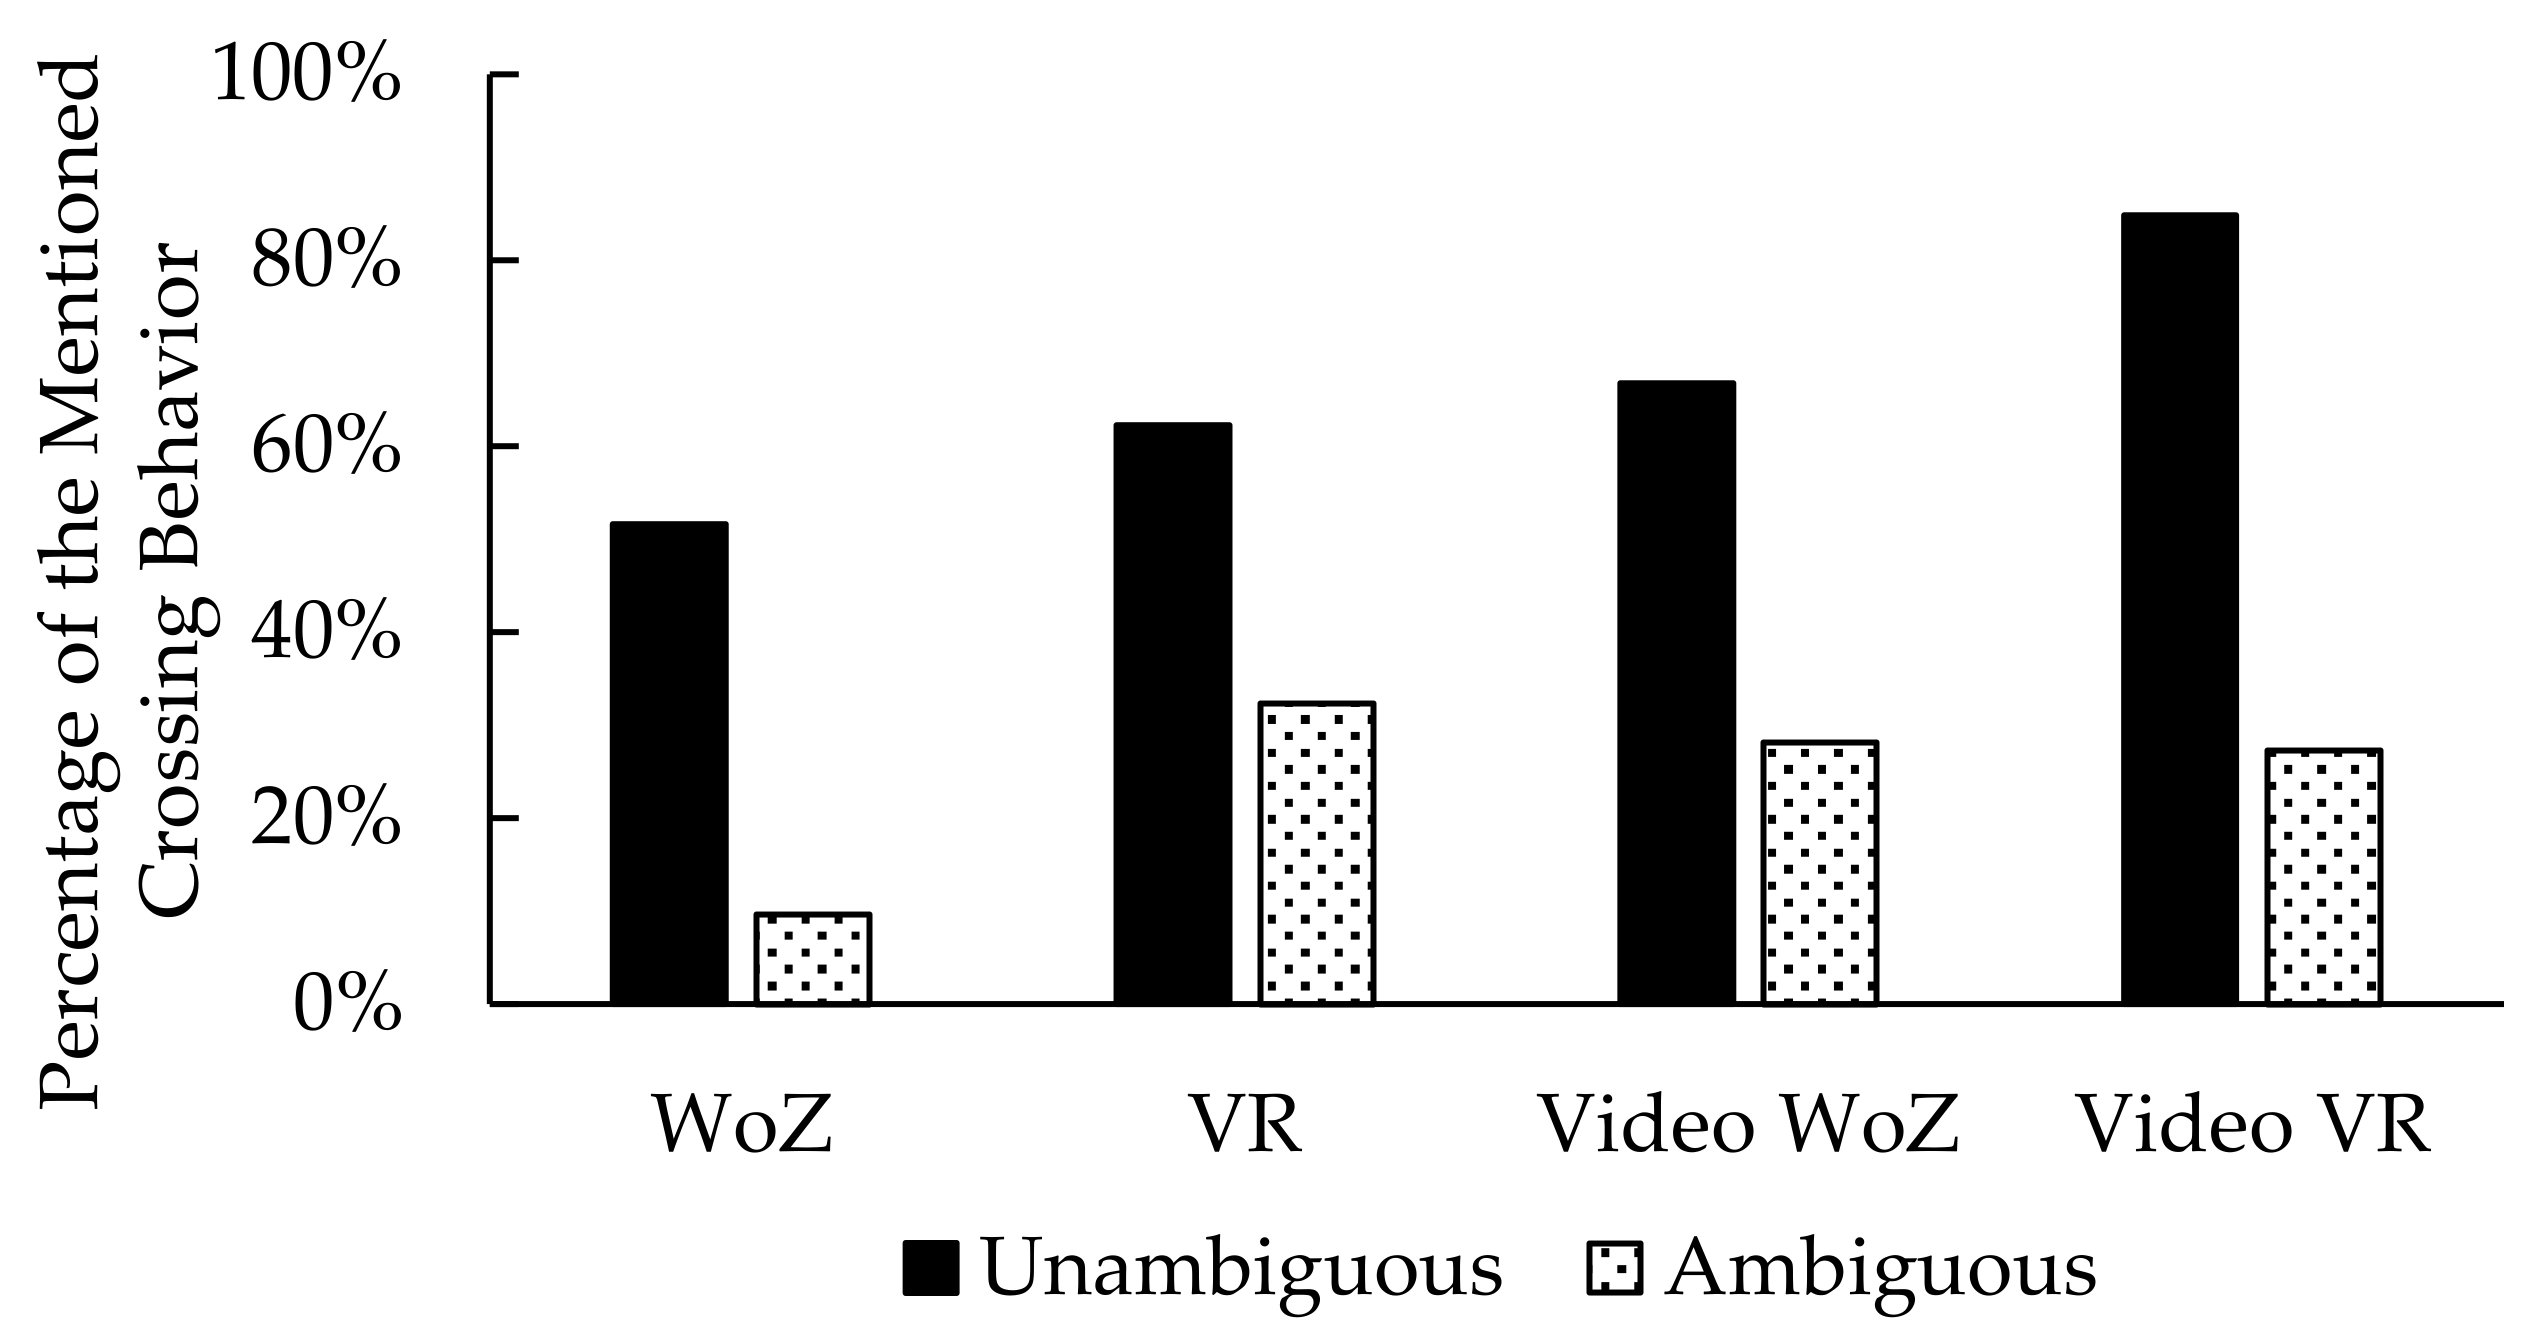
3.2. Mentioned Crossing Behavior

Besides the vehicle’s assumed intention, we asked participants if they would cross the street. Table 4, Table 5, Table 6 and Table 7 present the mentioned crossing behavior for all four intentions and setups. The tables are subdivided into the correctly or incorrectly recognized intention and the respective mentioned crossing behavior.
In total, 52% of all participants correctly realized the intention for Let the HRU go first, unambiguous and would have crossed the road in the WoZ study. This value is higher for the other study setups: 62% for the VR setup, 67% for the video WoZ setup, and 85% for the video VR setup (Table 4). Compared to the ambiguous driving profile, more participants would have crossed the road (Table 5). The tendency for the WoZ and the VR setup is the same: More participants would have crossed the road in the VR setup, as compared to the WoZ setup (Figure 6). Nevertheless, for the unambiguous driving profile, the highest number of participants crossed the road for both video setups, whereas for the ambiguous driving profile, the fewest participants crossed the road for the video setups (Figure 6).
For the intention AV goes first, it poses a safety risk if participants misunderstand the intention and would still cross the road. That risk is higher for the ambiguous driving profile for all study setups than for the unambiguous driving profile (Figure 7). Especially for the ambiguous driving profile, fewer participants would have crossed the road by mistake in the VR setup (16%), as compared to the WoZ setup (23%). The result for the video WoZ setup had the same tendency as the WoZ setup (WoZ: 23%, video WoZ: 22%; Table 7); in addition, the video VR setup had the same tendency as the VR setup (VR: 16%; video VR: 16%; Table 7). However, for the unambiguous driving profile, the collision risk was comparatively low for all four study setups (Table 6).

3.3. Time of Decision

For the time of decision, we evaluated how often the participants waited to press the button until the AV came to a complete standstill or passed by for each setup. To analyze this, only correct answers were included. Therefore, n varies for the different driving strategies and settings.
The results showed that, for the WoZ setup, only one participant waited until the AV passed by. However, in the other three setups, more participants waited for a complete standstill when faced with the ambiguous driving profile, compared to the unambiguous driving profile (Table 8). For the intention AV goes first, more participants waited in the VR and video VR setup for the AV to pass by with the ambiguous driving profile, as compared to the unambiguous profile. Only for the video WoZ setup did more participants wait for a complete standstill when faced with the unambiguous driving profile (Table 8).

3.4. Unambiguity of Driving Profiles: Subjective Data and Intention Recognition Time

To evaluate the subjective data and the IRT, we only used correct answers. As we focused only on the comparison between WoZ and VR, WoZ and video WoZ, VR and video VR, and video WoZ and video VR (Figure 5), we calculated planned contrasts between those setups and compared the p-values with a Bonferroni-corrected alpha of 0.0125. For the comparison between the independent samples, Mann–Whitney U-tests were calculated, and for the comparison between the two video setups (in which the samples are dependent), Wilcoxon tests were calculated (Figure 8).
As already published in [24] for the WoZ setup, we also tested whether the driving profiles led to different IRTs and evaluations of driving behavior. Therefore, we used the mean of the repeated measurements for every dependent variable for each driving profile for the results of the WoZ setup. Hence, two non-parametric Wilcoxon tests were calculated for all dependent variables (one for each intention), and we compared the p-values with an alpha of 0.05.

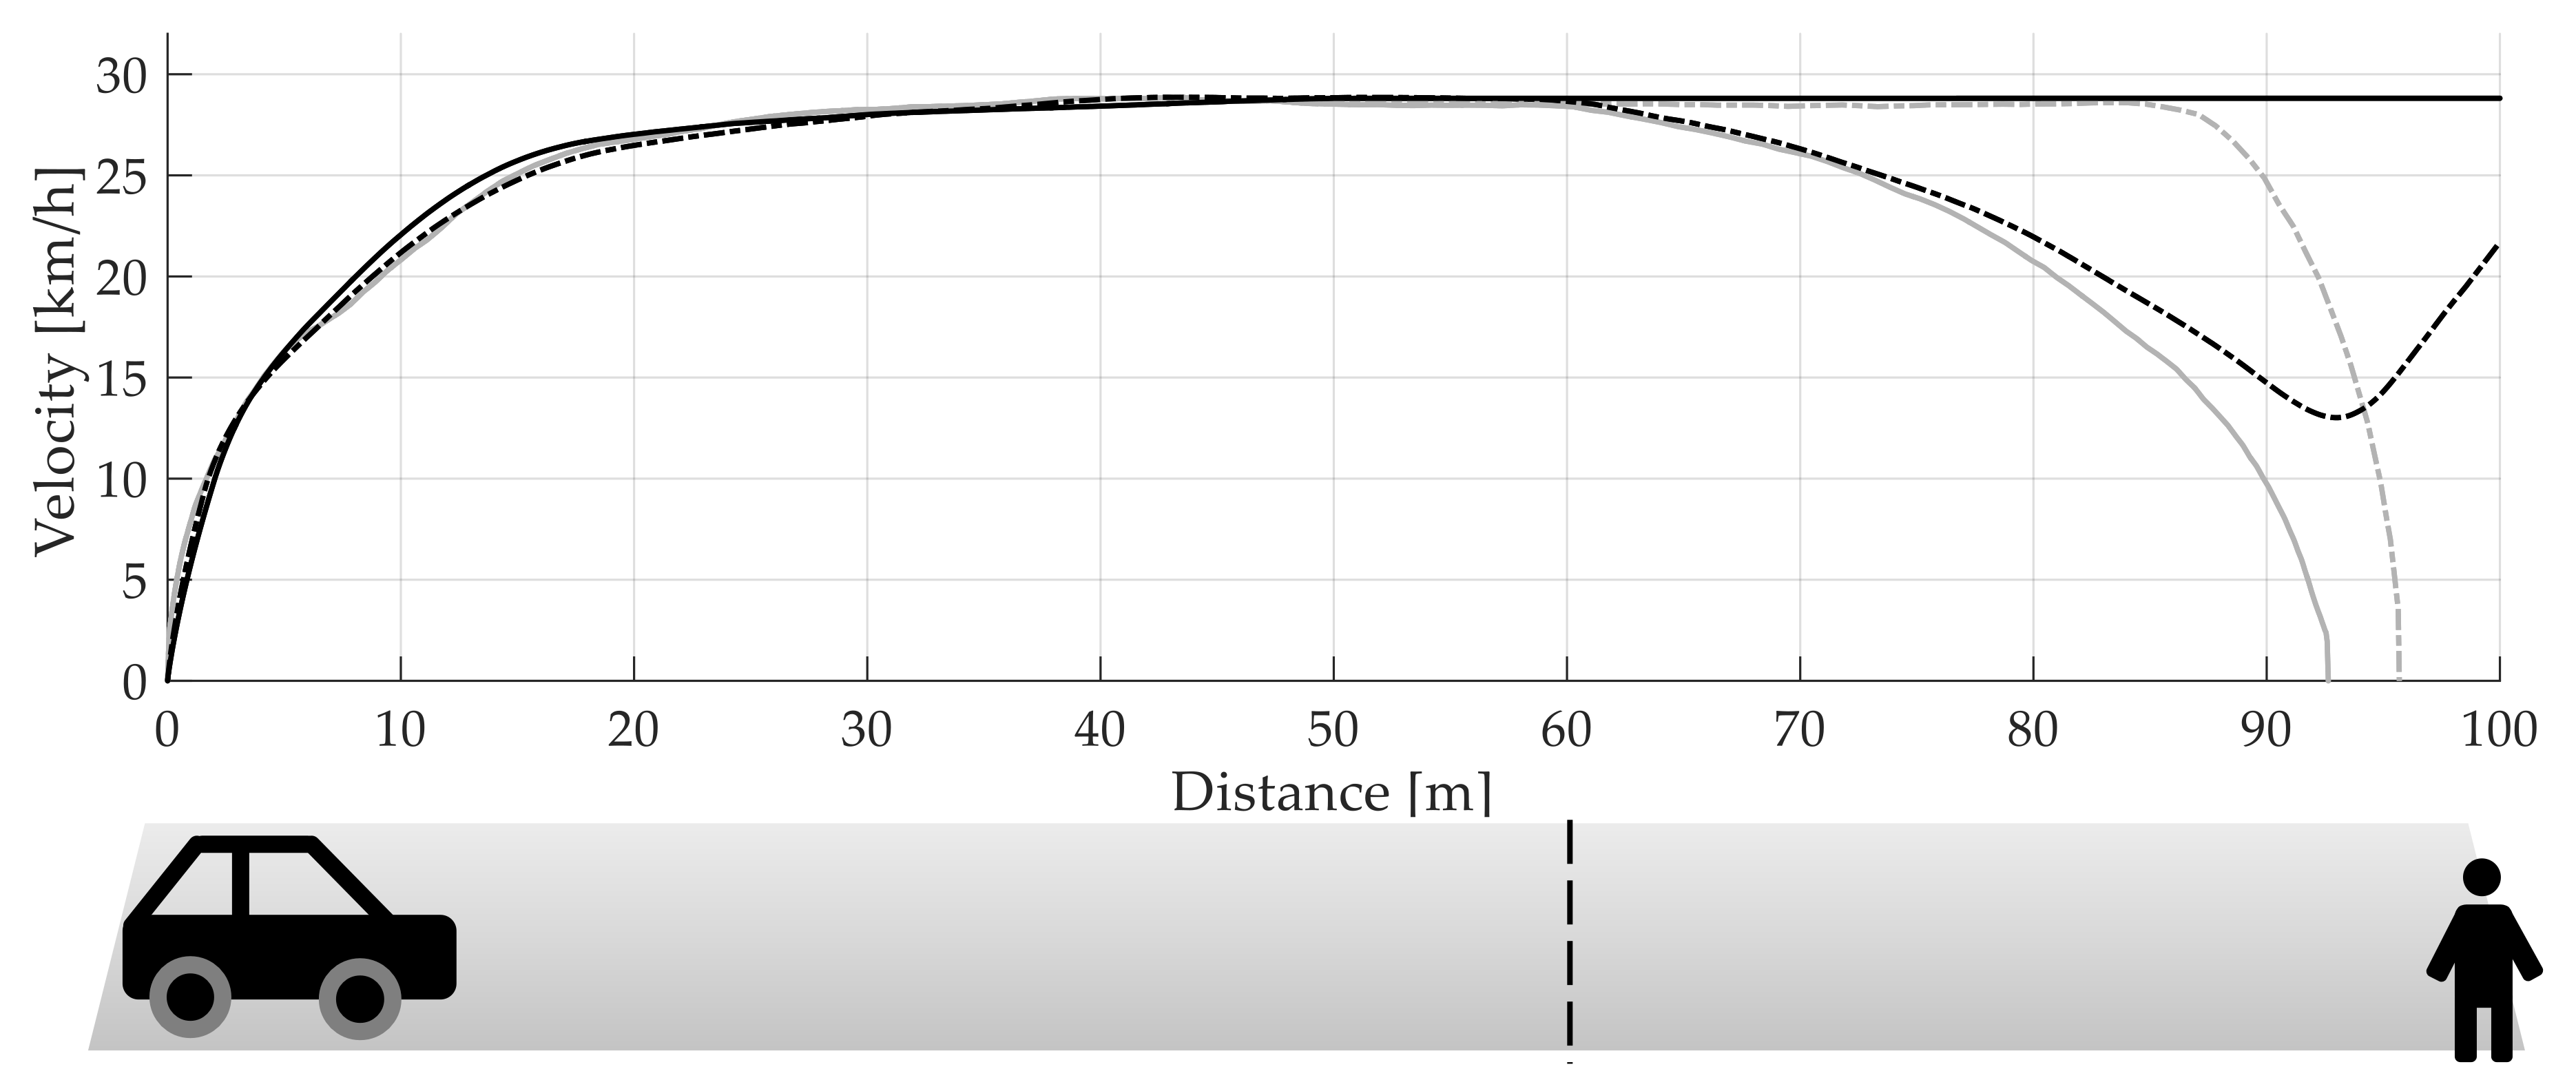
3.4.1. Intention Recognition Time

The Wilcoxon tests only revealed significant differences for the intention Let the HRU go first for the two video setups. Moreover, the IRT was higher for the ambiguous driving profile for the WoZ, VR and video WoZ setups, whereas for the video VR setup, the IRT was higher for the unambiguous driving profile (Table 9).
However, for the intention AV goes first, significant differences for all four setups comparing the unambiguous and ambiguous driving profile were found (Table 9). For all four setups, participants needed more time to correctly interpret the ambiguous driving profile.

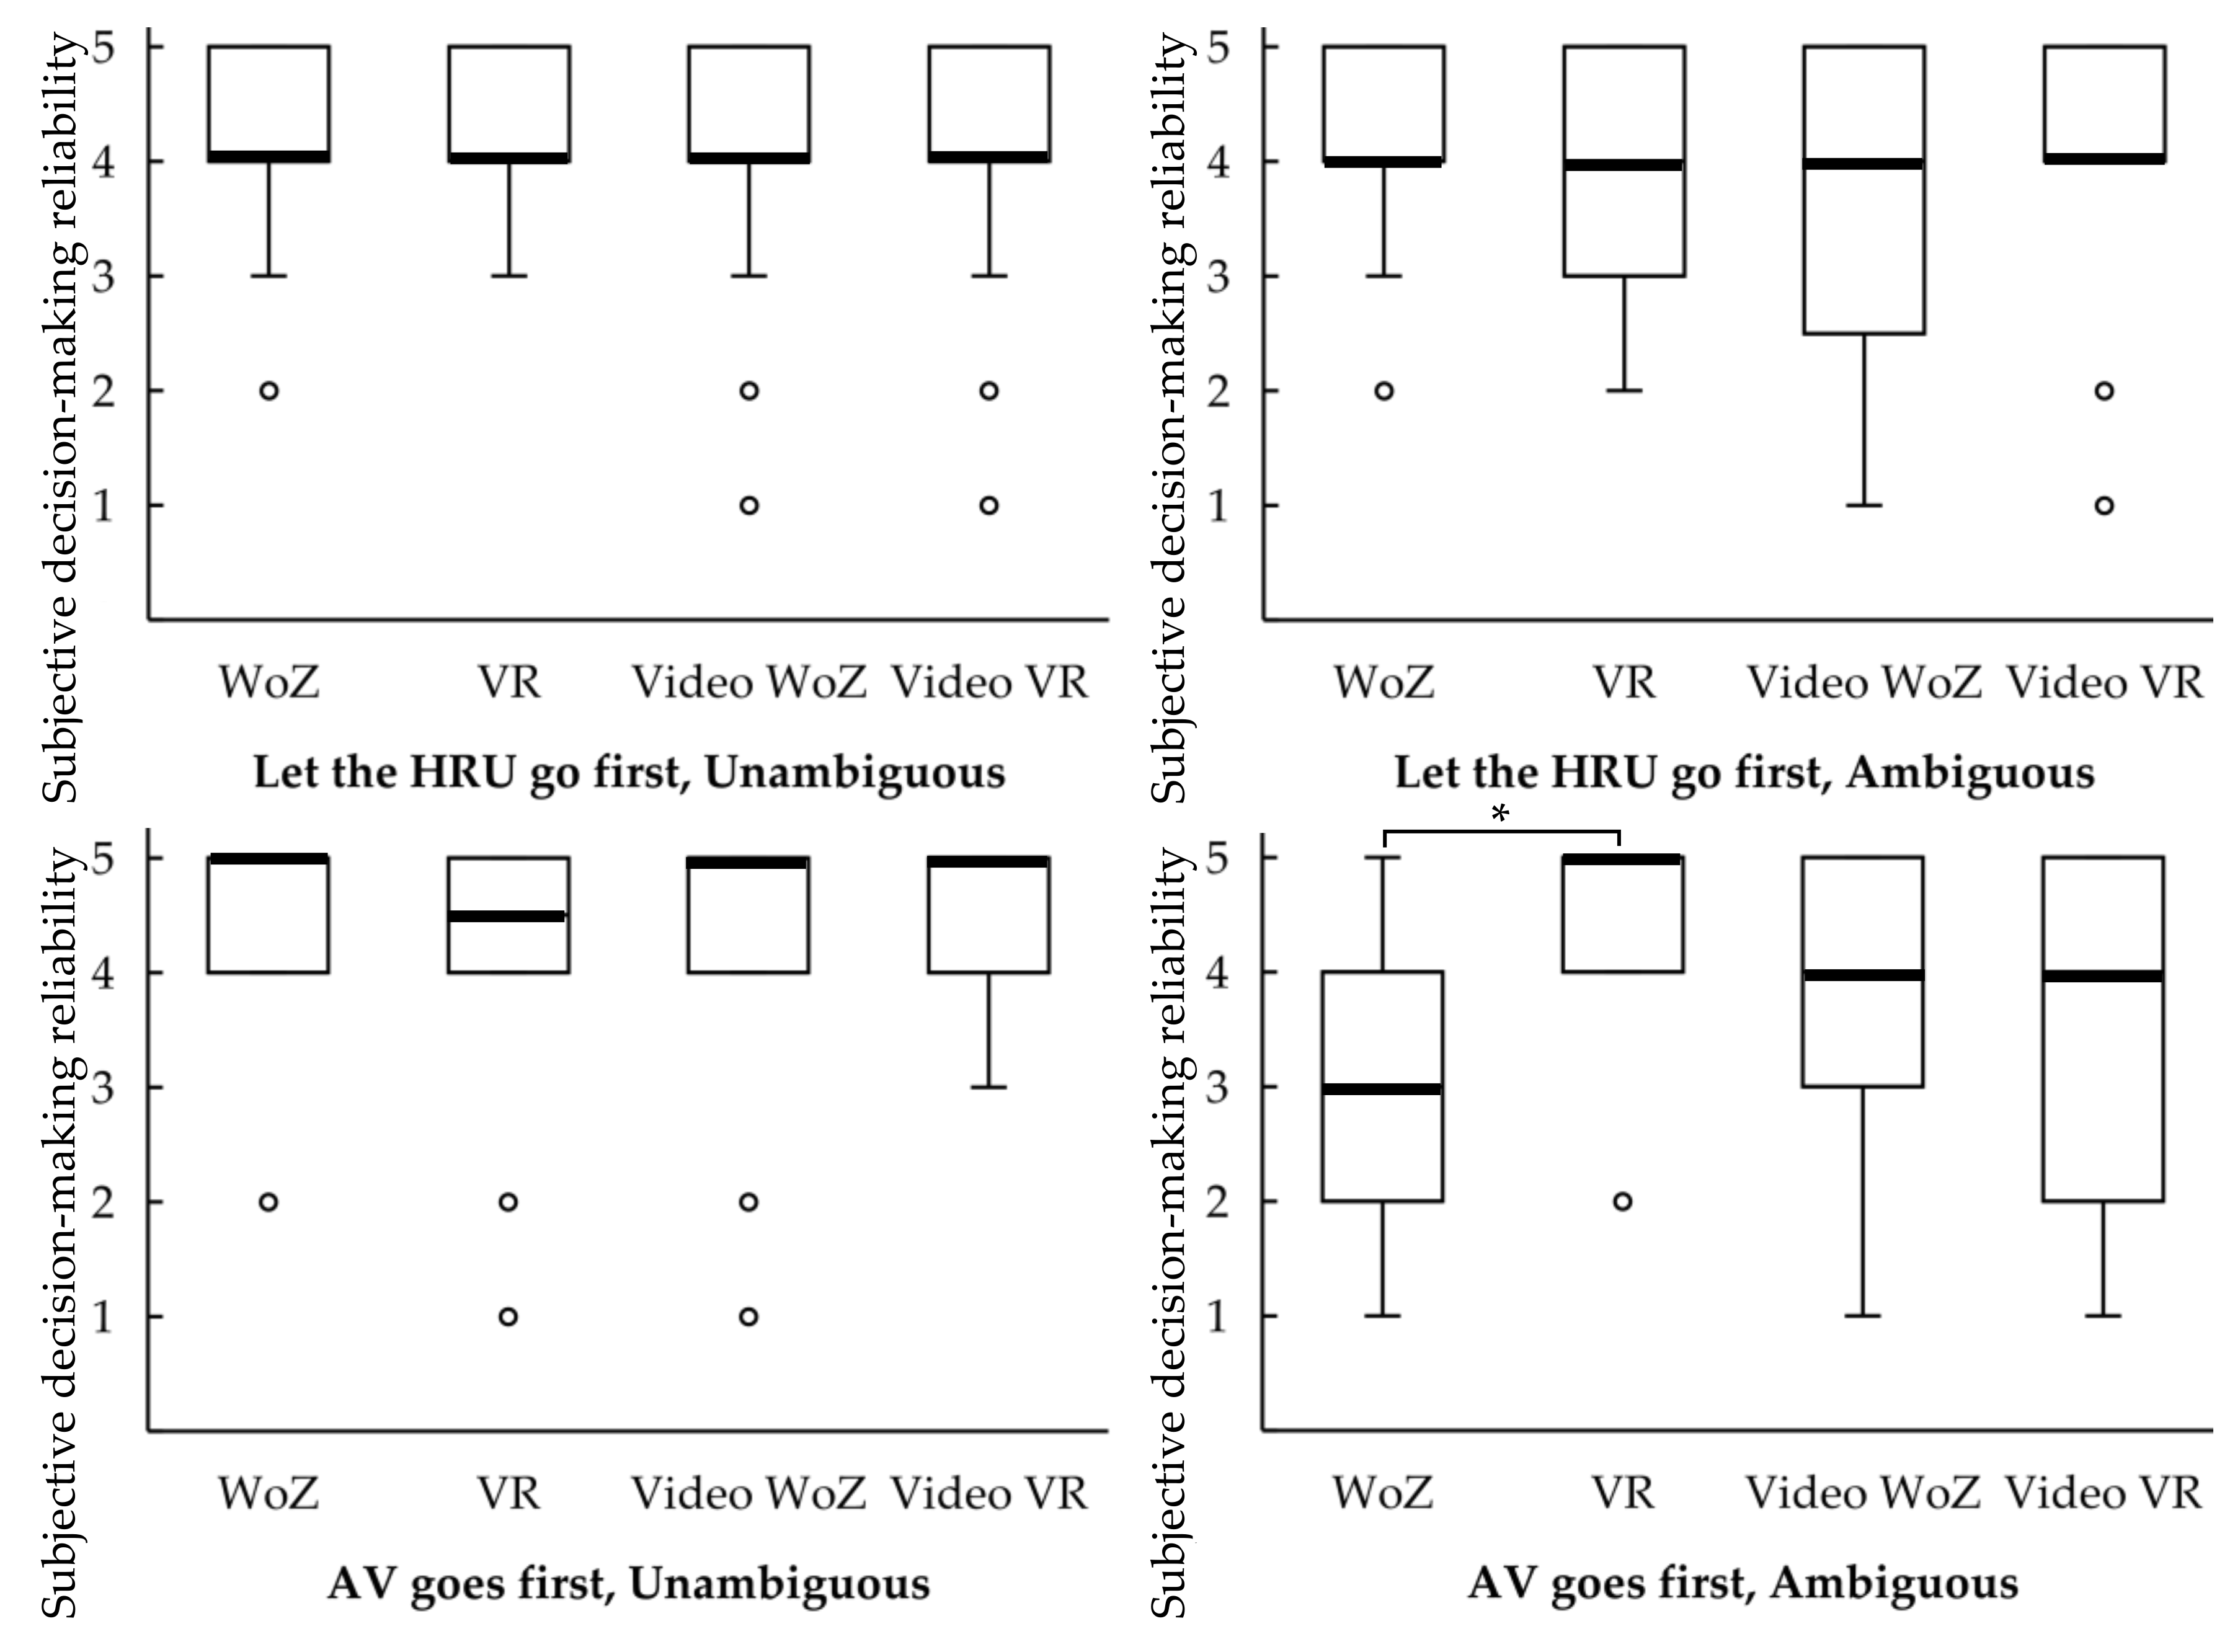
3.4.2. Subjective Decision-Making Reliability

For the intention Let the HRU go first, unambiguous (z = −1.38, p = 0.167), the intention Let the HRU go first, ambiguous (z = −0.14, p = 0.892), and the intention AV goes first, unambiguous (z = −2.35, p = 0.019), we did not find significant differences between the WoZ and VR setups after the Bonferroni correction. However, for the intention AV goes first, ambiguous, there was a significantly higher subjective decision-making reliability (z = −2.84, p = 0.004, r = 0.45) for the VR setup (Mdn = 5.0), as compared to the WoZ setup (Mdn = 3.0; Figure 9).
The comparison between VR and video VR revealed no significant differences for any of the four intentions (Let the HRU go first, unambiguous: z = −0.58, p = 0.561; Let the HRU go first, ambiguous: z = −0.08, p = 0.934; AV goes first, unambiguous: z = −0.05, p = 0.963; AV goes first, ambiguous: z = −1.43, p = 0.154).
In addition, the results for the subjective decision-making reliability of the WoZ and the video WoZ setups revealed no significant differences (Let the HRU go first, unambiguous: z = −1.61, p = 0.107; Let the HRU go first, ambiguous: z = −0.324, p = 0.746; AV goes first, unambiguous: z = −1.39, p = 0.163; AV goes first, ambiguous: z = −2.01, p = 0.045).
We also found no significant differences for the video VR and the video WoZ setups (Let the HRU go first, unambiguous: z = −2.39, p = 0.017; Let the HRU go first, ambiguous: z = −0.33, p = 0.740; AV goes first, unambiguous: z = −0.43, p = 0.668; AV goes first, ambiguous: z = −0.53, p = 0.595).
The boxplots (Figure 9) illustrated that the inter-quartile ranges (IQRs) for the WoZ setup for the intention Let the HRU go first are both comparatively small. In contrast, for the intention AV goes first the boxplots differ in their IQRs with regard to the unambiguous and the ambiguous driving profile: The range for the ambiguous driving profile is greater than the range for the unambiguous driving profile. The boxplots for the VR setup revealed a different result: the IQRs for the intention AV goes first are both small. For the intention Let the HRU go first the range is greater for the ambiguous driving profile than for the unambiguous profile. As presented in Section 3.3, more participants in the VR setup waited for a complete standstill or for the vehicle to pass before answering the questions. For both driving strategies, the participants who waited for the complete driving strategy were very confident in their decision (first quartile, median, and third quartile: 5.0). For the other participants, the boxplots are very tall (first quartile: 2.8, median: 4.0, and third quartile: 4.3).
The IQRs for the video setups are relatively small for the unambiguous driving profiles, but comparatively large for the AV goes first, ambiguous driving profile. This is comparable with the boxplots from the WoZ setup. However, for the intention Let the HRU go first, ambiguous, the IQR for the video WoZ setup is much greater than for the video VR setup and the WoZ setup. For both video setups, the number of participants who waited for the complete driving profile is relatively high (Table 8).
For the intention Let the HRU go first, none of the setups showed a significant difference in terms of decision-making reliability between the ambiguous and the unambiguous driving profile. For the WoZ setup, the subjective decision-making reliability revealed a significant difference for the driving profile AV goes first between the unambiguous and the ambiguous driving profile (Table 10; the median in Table 10 for the WoZ setup differs from the median in Figure 9, since we used the mean of the repeated measurements for comparison within the setup). The participants were more confident with their decision when the driving profile was unambiguous. This is comparable with the results from both video setups, even if these were not significant.

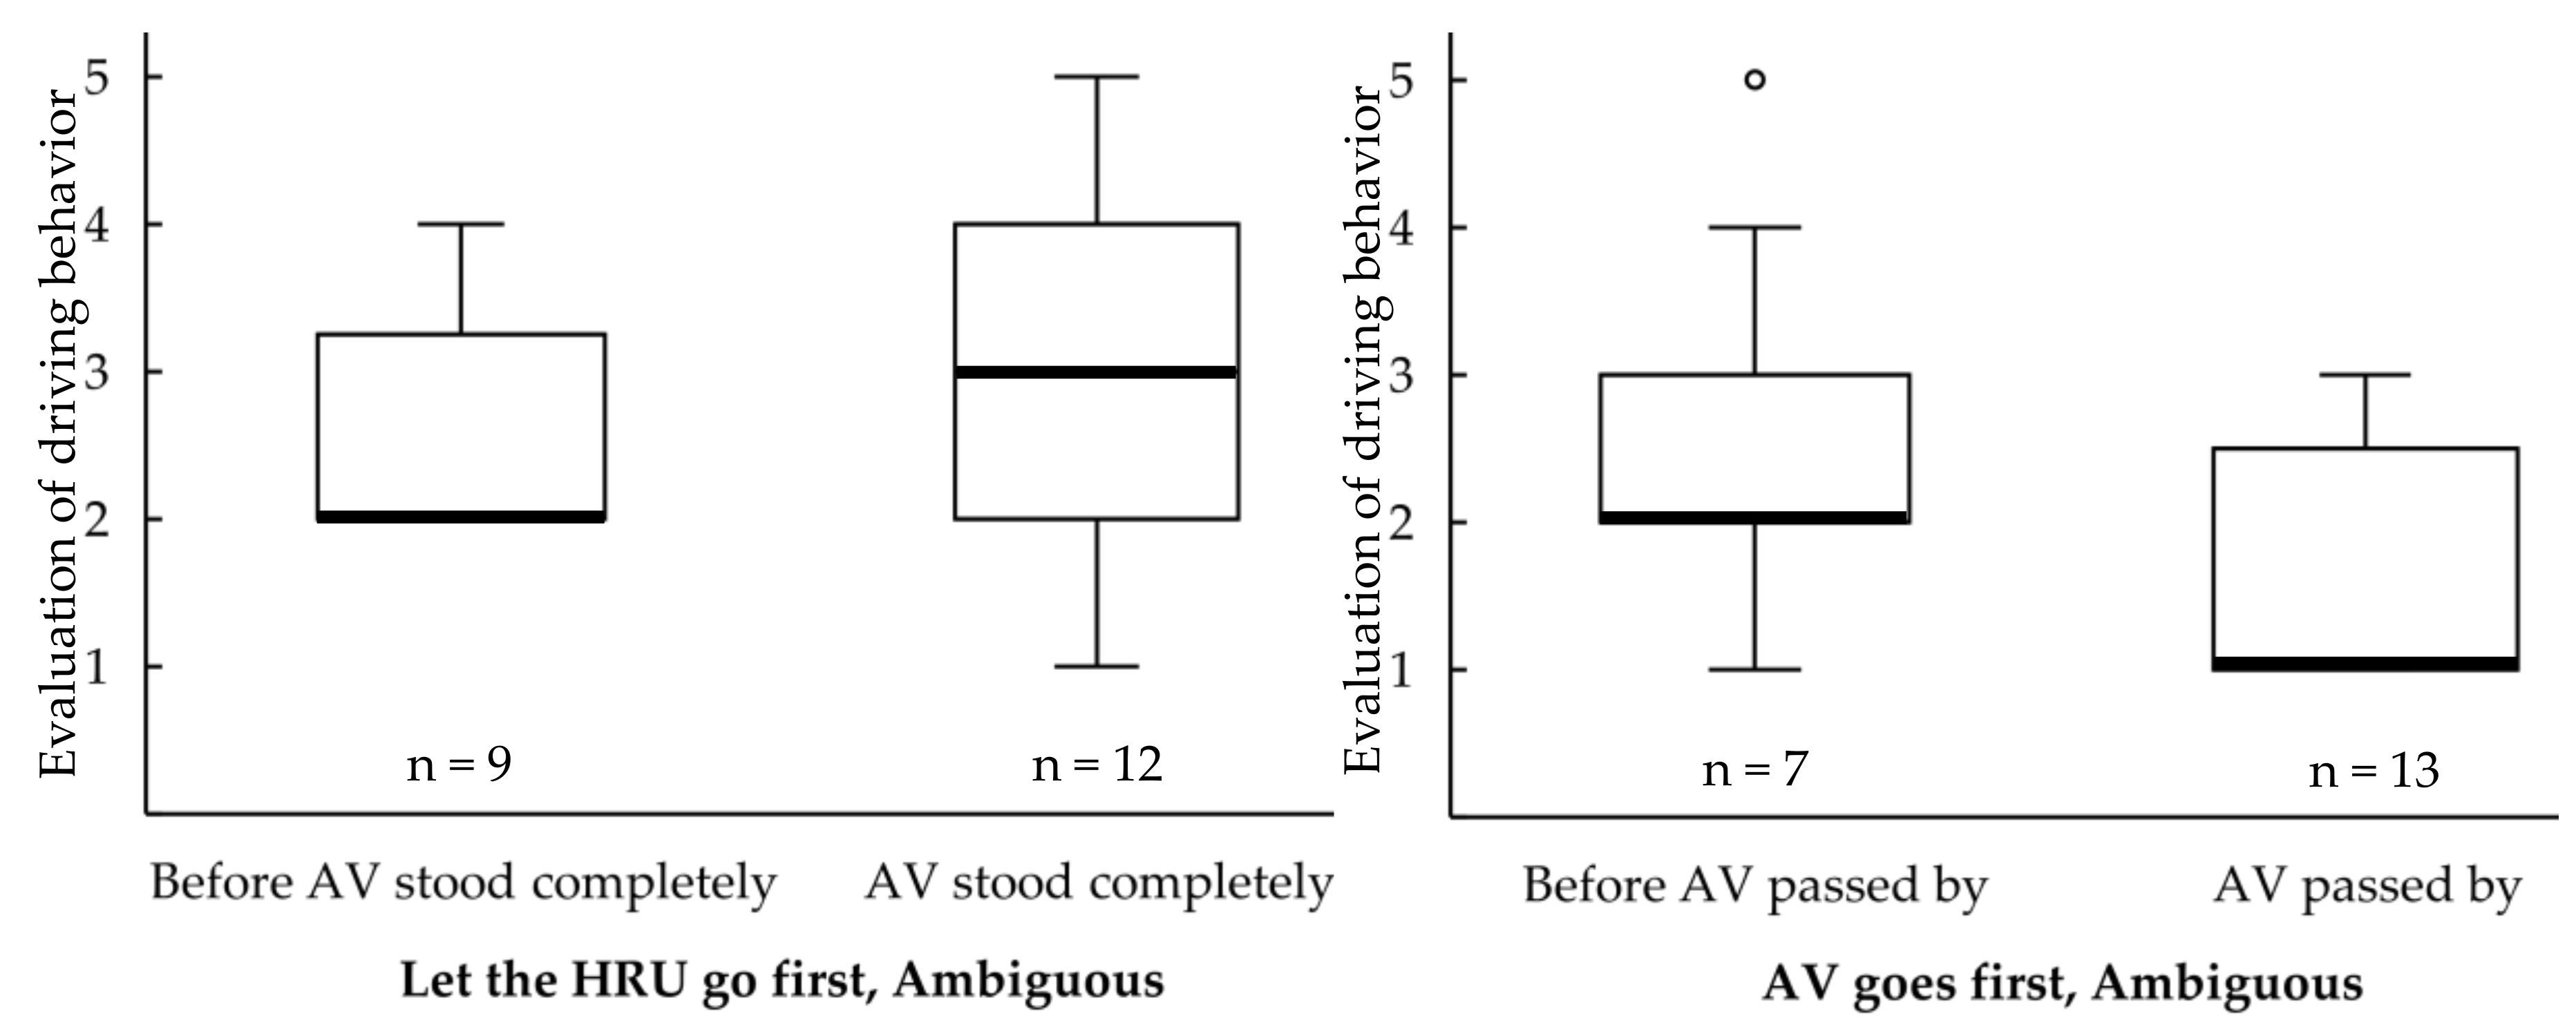
3.4.3. Evaluation of Driving Behavior

Just as for the subjective decision-making reliability, the differences for the evaluation of driving behavior showed no significant differences for the intention Let the HRU go first, unambiguous (z = −0.38, p = 0.702) and the intention Let the HRU go first, ambiguous (z = −1.42, p = 0.156). We also found no significant difference for the intention AV goes first, ambiguous (z = −0.34, p = 0.734). However, the participants rated the driving behavior significantly better in the WoZ setup (Mdn = 4.0) than in the VR setup (Mdn = 4.0) (z = −4.59, p ≤ 0.001, r = 0.47) for the intention AV goes first, unambiguous (Figure 10).
The comparison between the WoZ and the video WoZ setup showed a significant difference for the intention Let the HRU go first, unambiguous (z = −3.12, p = 0.002, r = 0.33). The rating is better for the WoZ setup (Mdn = 4.0) than for the video WoZ setup (Mdn = 4.0). Moreover, the intention AV goes first, unambiguous revealed a significantly better rating for the WoZ setup (Mdn = 4.0) than for the video WoZ setup (Mdn = 4.0; z = −4.20, p ≤ 0.001, r = 0.42). For the intention Let the HRU go first, ambiguous (z = −2.04, p = 0.041), and AV goes first, ambiguous (z = −0.42, p = 0.678) no significant differences were found.
No significant differences for all intentions were found when comparing the VR and video VR setup (Let the HRU go first, unambiguous: z = −1.63, p = 0.103; Let the HRU go first, ambiguous: z = −1.00, p = 0.319; AV goes first, unambiguous: z = −0.08, p = 0.936; AV goes first, ambiguous: z = −0.11, p = 0.909), as well as video WoZ and video VR setups (Let the HRU go first, unambiguous: z = −0.28, p = 0.776; Let the HRU go first, ambiguous: z = −0.14, p = 0.890; AV goes first, unambiguous: z = −1.08, p = 0.279; AV goes first, ambiguous: z = −1.04, p = 0.299).
The IQRs for all boxplots for the WoZ setups are comparatively small. However, with the exception of the intention AV goes first, unambiguous, the IQRs for the VR setup are rather large. For the mentioned intention, very few participants (6%) waited until the vehicle had passed by (Table 8). The large IQRs for both ambiguous driving profiles might have occurred due to those participants who waited to see the entirety of the driving profiles (Figure 11). However, this does not explain the larger IQR for the intention Let the HRU go first, unambiguous, because only four participants waited for the complete standstill of the AV (Table 8). In addition, the boxplots for both video setups revealed different IQRs that cannot be explained by the fact that some participants waited. However, all boxplots illustrate that the unambiguous driving profiles tend to be rated better than the ambiguous driving profiles (Figure 10).
The evaluation of the driving behavior showed significant differences for all four setups and both driving strategies (Let the HRU go first and AV goes first), between the unambiguous and ambiguous driving profiles. The participants rated the unambiguous driving profiles better than the ambiguous driving profiles in all four setups (Table 11). Here, the deviating median listed in the table and boxplots results from using the mean of the repeated measurements for the WoZ setup.

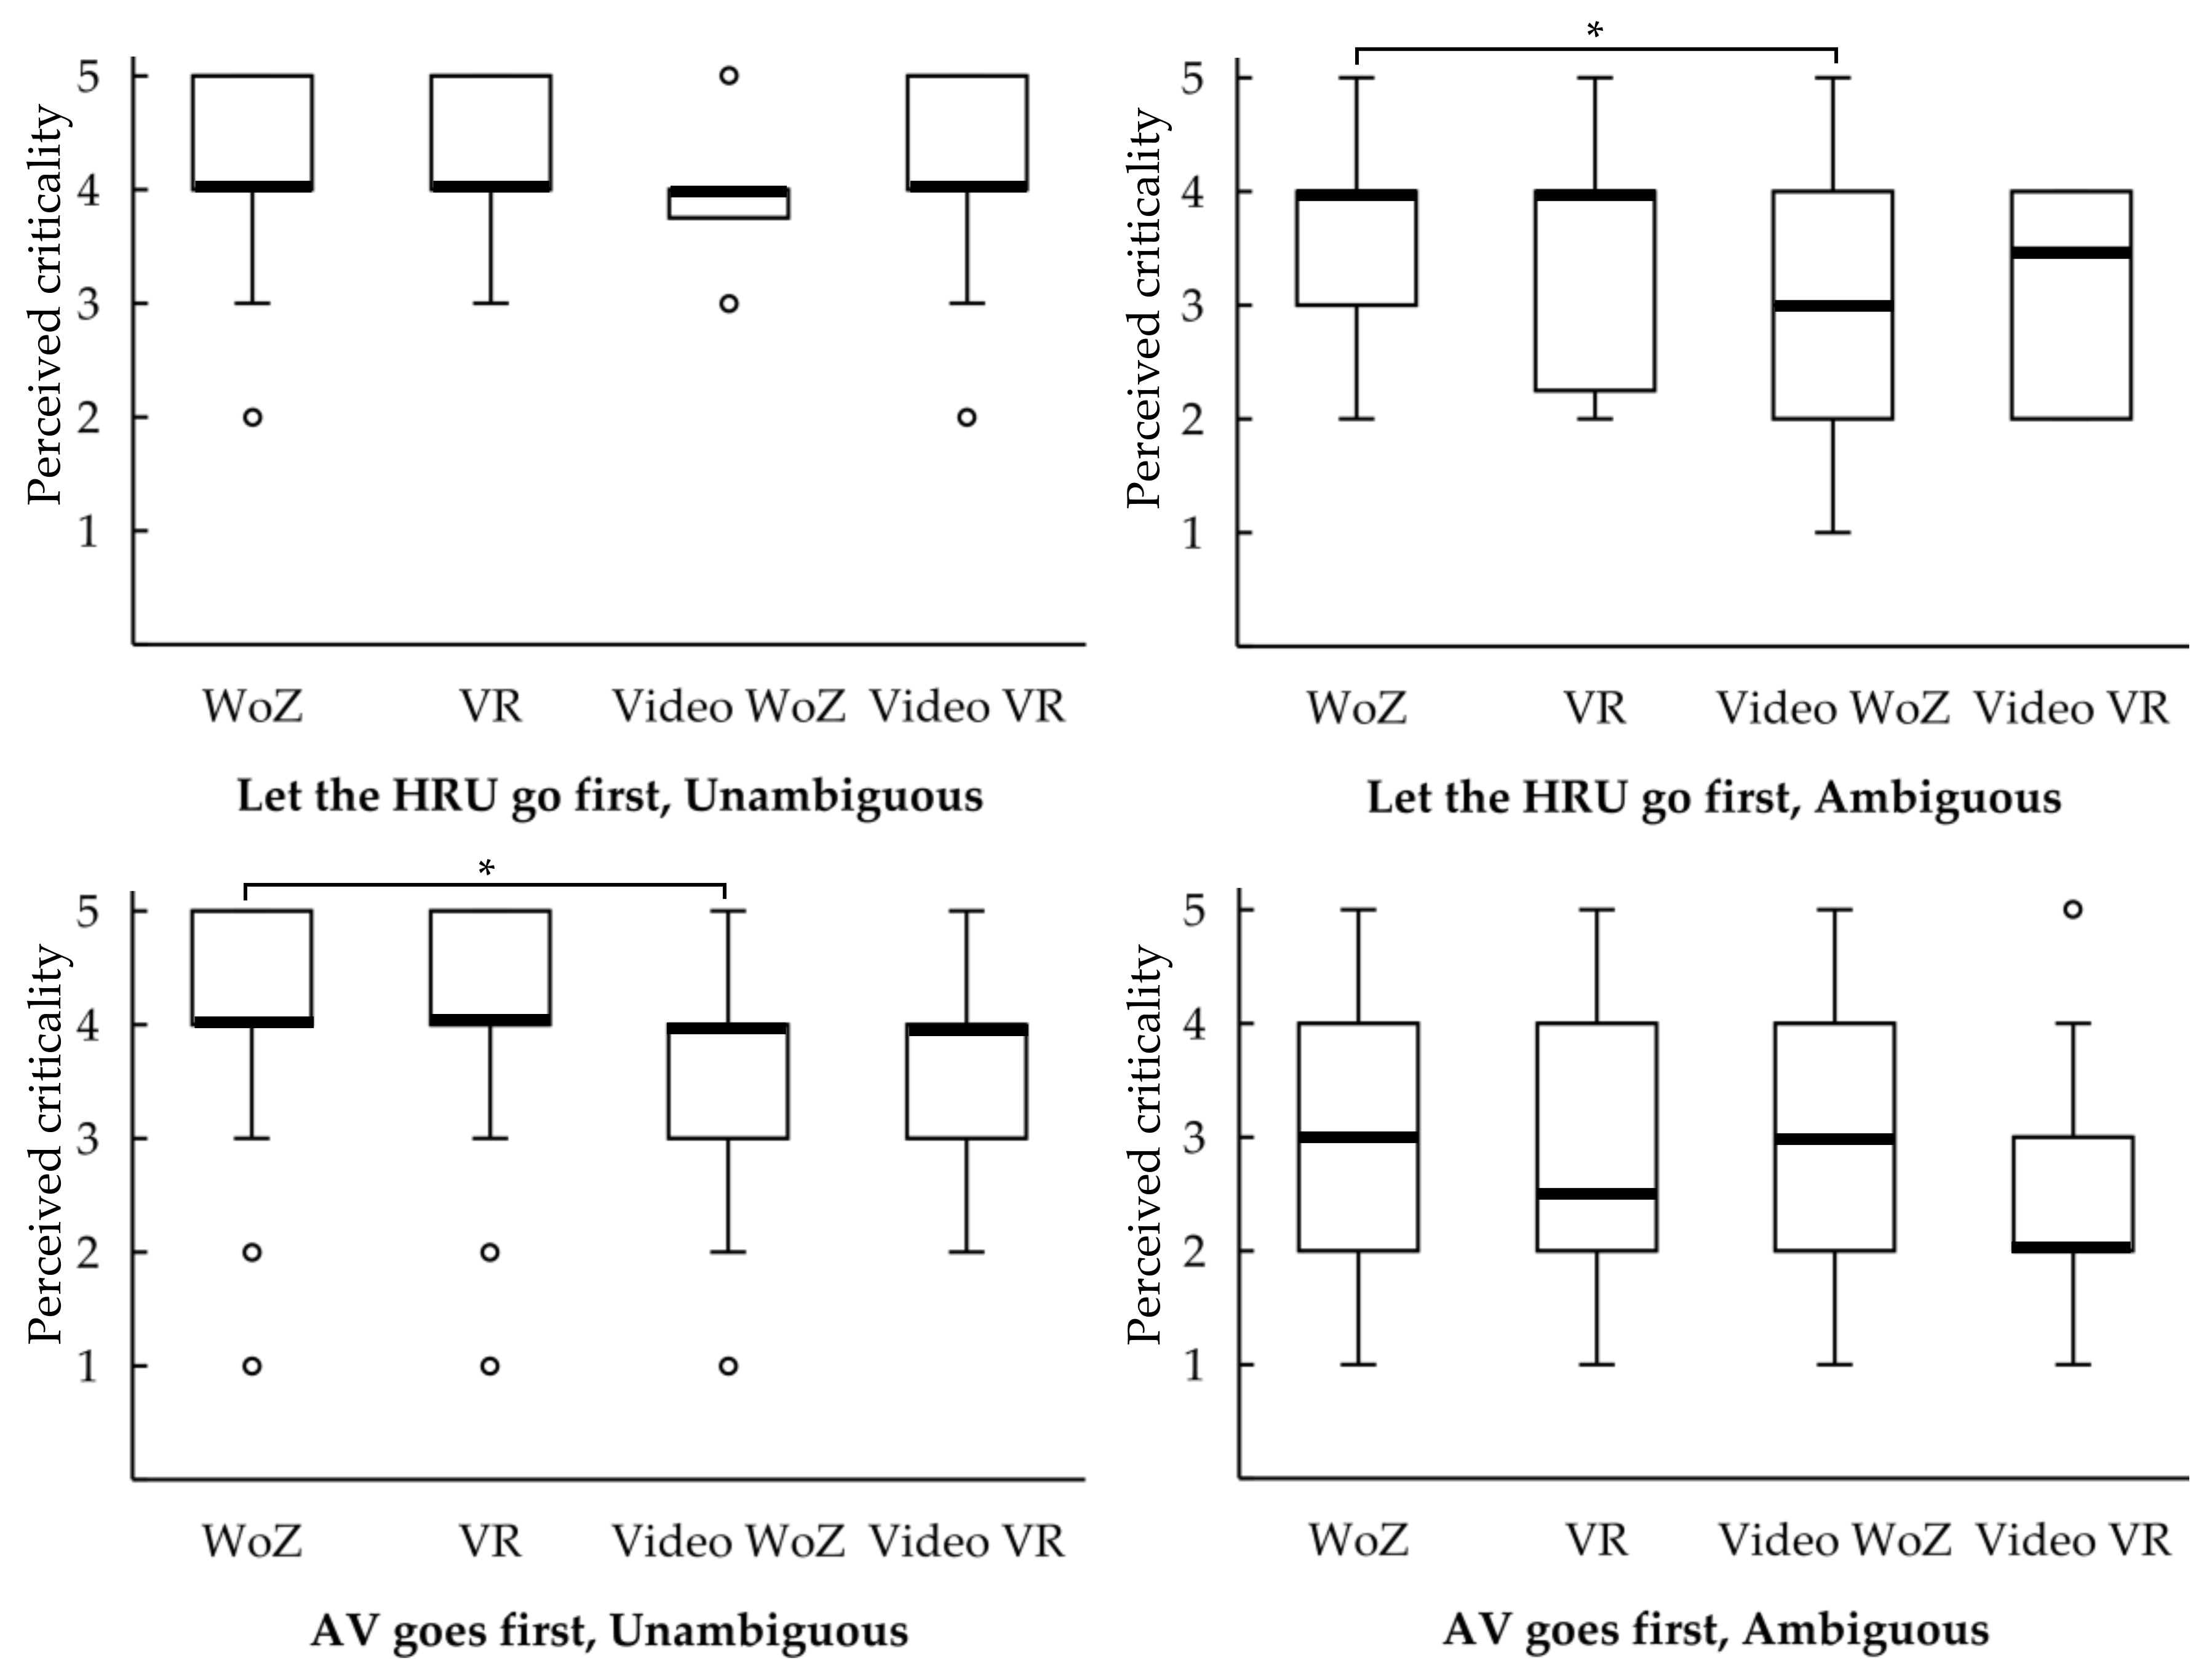
3.4.4. Perceived Criticality

In terms of perceived criticality, no significant differences were revealed between the WoZ and VR setups (Let the HRU go first, unambiguous: z = −0.32, p = 0.749; Let the HRU go first, ambiguous: z = −0.46, p = 0.645; AV goes first, unambiguous: z = −1.44, p = 0.151; AV goes first, ambiguous: z = −0.25, p = 0.801).
However, we found significant differences for the intention Let the HRU go first, ambiguous (z = −2.56, p = 0.011, r = 0.26) and the intention AV goes first, unambiguous (z = −2.79, p = 0.005, r = 0.28) between the WoZ and the video WoZ setups (Figure 12). For both intentions, the perceived criticality is higher for the WoZ setup (for both intentions: Mdn = 4.0), as compared to the video WoZ setup (Let the HRU go first, ambiguous: Mdn = 3.0; AV goes first, unambiguous: Mdn = 4.0). For the intention Let the HRU go first, unambiguous (z = −1.44, p = 0.151) and for the intention AV goes first, unambiguous (z = −0.10, p = 0.917), no significant differences were found.
Moreover, the VR and video VR setup (Let the HRU go first, unambiguous: z = −1.50, p = 0.134; Let the HRU go first, ambiguous: z = −1.03, p = 0.305; AV goes first, unambiguous: z = −1.14, p = 0.255; Go first, ambiguous: z = −0.43, p = 0.595) revealed no significant differences.
Furthermore, no differences were found for the perceived criticality between the video VR and video WoZ setup (Let the HRU go first, unambiguous: z = 0.00, p ≥ 0.999; Let the HRU go first, ambiguous: z = −0.82, p = 0.412; AV goes first, unambiguous: z = −1.89, p = 0.059; AV goes first, ambiguous: z = −0.86, p = 0.388).
All boxplots illustrate that the ambiguous driving profiles tend to be rated more critically than the unambiguous driving profiles (Figure 12). The boxplots for both ambiguous driving profiles showed larger IQRs for all setups compared to the unambiguous driving profiles. The only exception is the boxplot for the intention AV goes first, ambiguous for the video VR setup: The IQRs are not larger for the ambiguous driving profile than for the unambiguous driving profile. This is independent of whether the participants waited to see the entirety of the driving profile (IQRs for both groups: first quartile: 2.0, median: 2.0, third quartile: 3.0).
We also evaluated the extent to which the unambiguity influences the perceived criticality for all setups. In all four setups, participants rated the situation to be significantly less critical if the driving profile was unambiguous for both intentions (Table 12). As before, the median in the boxplot differs from the median listed in the table for the WoZ setup, because the mean of the repeated measurements for the comparison was used for the table (Table 12).

3.5. VR Study: IRT vs. Start of Road Crossing

As mentioned in Section 2.3.2, we asked participants in the VR setup to cross the street instead of pressing a button. Reaction times such as IRTs and the crossing time were not normally distributed. Therefore, two Wilcoxon tests were calculated to evaluate possible differences between the IRT and the crossing time for the intention Let the HRU go first.
The results revealed that participants made their decision for the intention Let the HRU go first, unambiguous earlier (IRT, Mdn = 4.5 s) and waited significantly longer to cross the street (Mdn = 7.2 s; z = −5.09, p ≤ 0.001, r = 0.87). A comparable result was found for the intention Let the HRU go first, ambiguous (z = −3.90, p ≤ 0.001, r = 0.76). Participants made their decision first (IRT, Mdn = 4.8 s) and crossed the street later (Mdn = 6.9 s). This leads to lower misinterpretation rates for all intentions (Table 13).
Just as with the IRT, there are no significant differences between the unambiguous and the ambiguous driving profiles for the start of road crossing (z = −0.77, p = 0.442).

4. Discussion

The aim of the study was to compare different study setups that can be used to evaluate the driving behavior of AVs, in order to be able to give indications as to whether already-conducted studies can be compared with each other. Therefore, we replicated the same study design in four different settings: WoZ, VR, video WoZ, and video VR. In all studies, participants stood at the roadside in a shared space. An AV approached from the left, using different driving profiles, characterized by changing speed as a way of communicating its intention to let the pedestrian cross the road. Participants were asked to recognize the intention of the AV and to press a button as soon as they had realized this intention.
Since the WoZ setup is the closest to reality, the authors assume that the values measured in this setup are the most realistic ones. The other setups were related to the results of the WoZ setup.
The misinterpretation rates for the ambiguous driving profiles were underestimated in VR, video WoZ, and video VR, as compared to the WoZ setup: The misinterpretation rate is lower in those setups. However, differences between unambiguous and ambiguous driving strategies were revealed in all setups, since the misinterpretation rate was higher for ambiguous driving profiles compared to the unambiguous profiles. This coincides with the results of previous studies, employing video, VR, and WoZ setups, where pedestrians refer to differences in driving strategies when crossing the road (e.g., [8,12,15,16,19]).
For the intention Let the HRU go first, it was preferable that participants recognize the intention correctly and cross the road before the AV had to come to a standstill. The results for the crossing behavior showed that the proportion of those pedestrians is overestimated in VR, video WoZ, and video VR, as compared to the WoZ setup for the unambiguous and the ambiguous driving profile. While the results for both video setups for the intention Let the HRU go first, ambiguous are approximately the same (∆ 1%), there is a rather high discrepancy for the intention Let the HRU go first, unambiguous (∆ 18%). This result suggests that the crossing behavior is dependent on the type of video.
As mentioned in the results, it poses a safety risk if participants misunderstand the intention and cross the road for the intention AV goes first. As for the misinterpretation rate, all setups detect this risk especially for the ambiguous driving profile. While the risk for the unambiguous driving strategy is assessed almost equally by all setups, the risk was underestimated in the VR setup for the ambiguous driving profile compared to the WoZ setup (WoZ vs. VR: AV goes first, unambiguous ∆ 1%, AV goes first, ambiguous ∆ 6%). Just like the results for the intention Let the HRU go first, unambiguous, the results for the intention AV goes first, ambiguous are also dependent on the choice of video: The video WoZ setup can reproduce the critical crossing rate from the WoZ setup (∆ <1%), and the video VR can reproduce the results from the VR setup (∆ <1%).
The comparison also showed that, in the WoZ setup, only one participant waited to see the whole driving profile; all others had made their decision before this point. In the VR setup, a total of 20% of all participants who correctly realized the intention, waited to make their decision until the end of the driving profile. That rate is higher for the ambiguous driving profile (39%) compared to the unambiguous profile (9%). Therefore, it seems that the perception of the driving profiles is more difficult for participants in a VR setup. However, understanding intentions by using the driving profiles appears to be even more difficult when only seeing videos. Most participants waited until the end of the driving profile (46%) in the video WoZ setup; however, also in the video VR setup, many participants waited to see the whole driving profile (32%). It is possible to differentiate between unambiguous and ambiguous driving profiles with just the results of a VR or a video study, but the results are not transferable to reality, because the pedestrians made their decisions in the WoZ setup at an earlier stage.
The results for the subjective decision-making reliability let no clear statement be made regarding the significance tests. The different IQRs result from participants who waited until the vehicle stood completely or had passed by, depending on the study setup. However, the results for the WoZ setup revealed the greatest IQR for the intention AV goes first, ambiguous. In addition, the comparison between the AV goes first, unambiguous and AV goes first, ambiguous driving profile in the WoZ setup showed the only significant difference across all setups. The results indicate that the AV goes first, ambiguous profile leads to the most uncertainties. In contrast, the AV goes first, unambiguous profile revealed the shortest IQRs across all setups. A reason could be that, in this driving strategy, the AV does not change its speed.
This can also be seen for the evaluation of the driving profile: in all four setups, the IQRs for the intention AV goes first, unambiguous were short. The driving strategy led to clear trends in the evaluations. With one exception, the intention AV goes first, ambiguous, the driving strategies were rated better in the WoZ setup. The intention AV goes first, ambiguous is rated equally bad in all setups. When looking at the boxplots and the significance tests, it becomes clear that the item can be used to distinguish between unambiguous and ambiguous driving strategies in all settings. This effect can especially be seen for the WoZ setup, because the effect size is greatest for this setup, compared to the other three setups. However, the IQRs for the VR setup to some extent—but especially for the video setups—cannot be explained by the results. This could be due to perception and/or decision artefacts.
The perceived criticality is higher in the WoZ setup for some intentions, as compared to the video WoZ setup. However, there is no clear tendency for the perceived criticality to be systematically underestimated in the video setups or the VR setup. It is possible in all setups to differentiate between the unambiguous and ambiguous driving profiles. However, the effect size is greatest for the WoZ setup.
In addition to the setup comparison, the VR setup was used to check how the IRT metrics differ in terms of the start of road crossing. Results revealed that participants made their decision regarding the AV’s intention significantly earlier than they would cross the road. A motor process must be performed for both metrics; however, more time is needed to walk one meter than to press a button. Nevertheless, this does not explain the time difference of 2.7 s between IRT and the start of road crossing for the unambiguous and 2.1 s for the ambiguous driving profile. However, it can be assumed that pedestrians assess the AV’s driving behavior at an early stage, but wait until they are certain in their decision before crossing the road. Due to the longer time period, participants saw more of the whole driving profile and made more correct decisions, compared to the IRT metric. However, for the intention AV goes first, ambiguous, two persons still crossed the road by mistake. In real-life traffic situations, but also in the WoZ setup, this behavior would probably have led to an accident.

5. Limitations

Even though we tried to replicate the setups as much as possible, there were small differences: In the VR and video setups, for example, no engine sound was presented to the participants. Compared to the results from [22], this might deteriorate the task performance. Furthermore, the environment varied in the WoZ (rather rural) and VR setup (rather urban).
In addition, in the WoZ setup the driver accelerated to the original speed at the moment the participants pressed the button, so that they were not influenced by the remaining driving profile. In the VR setup and both video setups, the video was frozen the moment participants pressed the button. These limitations might have led to differences between the setups.
Although all vehicles were BMWs, a BMW 2 series was used in the WoZ setup, and a BMW 3 series was used in the VR setup. As mentioned, Ref. [4] found a significant effect for different vehicles sizes. However, the authors compared a Smart Fortwo, a BMW Z4, and a Ford F150; therefore, the different sizes of the vehicles were comparatively large compared with our vehicles. In addition, the differences found had only a small effect [4].
Furthermore, there are also weaknesses in the analysis: Equivalence tests should have been carried out instead of significance tests for differences. Unfortunately, the prerequisites were not met, due to the ordinal-scaled data and small sample sizes. For this reason, the authors have limited themselves to report descriptive data for most results.
Methodologically, it was not possible to compare IRT between the studies, because the different times measurements calculating the IRT were not synchronized. We implemented the driving profiles for the VR setup as a replicate from the specification. However, due to the low sampling rate of 5 Hz, differences of a maximum of 200 ms may occur. For the video VR setup, the videos were screened on the monitor, and for the video WoZ setup, a driving throughput was recorded. Due to the cutting of the video sequences, the driving data can no longer be clearly calculated for the respective video. This makes it impossible to use the absolute IRT values for the setup comparison. However, the comparison within the setup is possible, even if the driving profiles themselves are of different lengths
Furthermore, it would have been useful to add a setup in which a programmable vehicle runs the given profiles, since the driving strategies in the WoZ differ for each trial, because a human driver is not able to precisely replicate a given driving profile [24].

6. Conclusions

To sum up, it can be stated that the WoZ setup is a useful approach to evaluate large differences between trajectories. However, small changes in driving behavior cannot be assessed, as a human driver is not able to replicate these [24]. Using the misinterpretation and crossing rate, it is possible to differentiate between unambiguous and ambiguous driving profiles in VR setups. Nevertheless, the collision risk would be underestimated in the VR setup compared to the WoZ setup, because less participants would have crossed the road by mistake in the VR setup. Conclusions as to absolute values are not possible in the VR setup. It is possible to detect a potential ambiguous driving profile when using a video setup. However, the type of video influences, among other things, the collision risk. Additionally, it is possible that perception and decision artefacts will emerge in a video study.

Author Contributions

Conceptualization, T.F., E.S., and K.B.; methodology, T.F..; formal analysis, T.F.; investigation, T.F.; resources, T.F., E.S., and K.B.; data curation, T.F.; writing—original draft preparation, T.F.; writing—review and editing, T.F., E.S., and K.B.; visualization, T.F. and E.S.; supervision, T.F. and K.B. All authors have read and agreed to the published version of the manuscript.

Funding

This research received no external funding.

Acknowledgments

The authors would like to thank Lars Michalowski for support in conducting the Wizard of Oz and the VR study.

Conflicts of Interest

The authors declare no conflict of interest.

References

  1. SAE International. Taxonomy and Definitions for Terms Related to Driving Automation Systems for On-Road Motor Vehicles (J3016); SAE International: Warrendale, PA, USA, 2018. [Google Scholar]
  2. Schneemann, F.; Gohl, I. Analyzing driver-pedestrian interaction at crosswalks: A contribution to autonomous driving in urban environments. In Proceedings of the IEEE Intelligent Vehicles Symposium (IV), Gothenburg, Sweden, 19–22 June 2016; pp. 38–43, ISBN 978-1-5090-1821-5. [Google Scholar]
  3. Fuest, T.; Sorokin, L.; Bellem, H.; Bengler, K. Taxonomy of Traffic Situations for the Interaction between Automated Vehicles and Human Road Users. In Advances in Human Aspects of Transportation. AHFE 2017. Advances in Intelligent Systems and Computing; Stanton, N.A., Ed.; Springer International Publishing: Cham, Switzerland, 2018; Volume 597, pp. 708–719. [Google Scholar] [CrossRef]
  4. De Clercq, K.; Dietrich, A.; Núñez Velasco, J.P.; de Winter, J.; Happee, R. External Human-Machine Interfaces on Automated Vehicles: Effects on Pedestrian Crossing Decisions. Hum. Factors 2019, 61, 8. [Google Scholar] [CrossRef] [Green Version]
  5. Burns, C.G.; Oliveira, L.; Thomas, P.; Iyer, S.; Birrell, S. Pedestrian Decision-Making Responses to External Human-Machine Interface Designs for Autonomous Vehicles. In Proceedings of the IEEE Intelligent Vehicles Symposium (IV), Paris, France, 9–12 June 2019; pp. 70–75. [Google Scholar]
  6. Weber, F.; Chadowitz, R.; Schmidt, K.; Messerschmidt, J.; Fuest, T. Crossing the Street Across the Globe: A Study on the Effects of eHMI on Pedestrians in the US, Germany and China. In HCI in Mobility, Transport, and Automotive Systems; Krömker, H., Ed.; Springer International Publishing: Cham, Switzerland, 2019; pp. 515–530. ISBN 978-3-030-22665-7. [Google Scholar]
  7. Rettenmaier, M.; Pietsch, M.; Schmidtler, J.; Bengler, K. Passing through the Bottleneck—The Potential of External Human-Machine Interfaces. In Proceedings of the IEEE Intelligent Vehicles Symposium (IV), Paris, France, 9–12 June 2019; pp. 1687–1692. [Google Scholar] [CrossRef]
  8. Clamann, M.; Aubert, M.; Cummings, M.L. Evaluation of Vehicle-to-Pedestrian Communication Displays for Autonomous Vehicles. In Proceedings of the Transportation Research Board 96th Annual Meeting, Washington, DC, USA, 8–12 January 2017. [Google Scholar]
  9. Kühn, M.; Stange, V.; Vollrath, M. Menschliche Reaktion auf hochautomatisierte Fahrzeuge im Mischverkehr auf der Autobahn. In VDI Tagung Mensch-Maschine-Mobilität 2019—Der (Mit-)Fahrer im 21.Jahrhundert!? VDI Verlag: Düsseldorf, Germany, 2019; pp. 169–184. [Google Scholar]
  10. Bengler, K.; Rettenmaier, M.; Fritz, N.; Feierle, A. From HMI to HMIs: Towards an HMI Framework for Automated Driving. Information 2020, 11, 61. [Google Scholar] [CrossRef] [Green Version]
  11. Fuest, T.; Feierle, A.; Schmidt, E.; Bengler, K. Effects of Marking Automated Vehicles on Human Drivers on Highways. Information 2020, 11, 286. [Google Scholar] [CrossRef]
  12. Hensch, A.-C.; Neumann, I.; Beggiato, M.; Halama, J.; Krems, J.F. Effects of a light-based communication approach as an external HMI for Automated Vehicles—A Wizard-of-Oz Study. ToTS 2020, 10, 18–32. [Google Scholar] [CrossRef] [Green Version]
  13. Song, Y.E.; Lehsing, C.; Fuest, T.; Bengler, K. External HMIs and Their Effect on the Interaction between Pedestrians and Automated Vehicles. In Intelligent Human Systems Integration; Karwowski, W., Ahram, T., Eds.; Springer International Publishing: Cham, Switzerland, 2018; pp. 13–18. ISBN 978-3-319-73887-1. [Google Scholar]
  14. Fridman, L.; Mehler, B.; Xia, L.; Yang, Y.; Facusse, L.Y.; Reimer, B. To Walk or Not to Walk: Crowdsourced Assessment of External Vehicle-to-Pedestrian Displays. In Proceedings of the 98th Annual Transportation Research Board Meeting, Washington, DC, USA, 12–17 January 2019. [Google Scholar]
  15. Fuest, T.; Maier, A.S.; Bellem, H.; Bengler, K. How Should an Automated Vehicle Communicate Its Intention to a Pedestrian?—A Virtual Reality Study. In Human Systems Engineering and Design II; Ahram, T., Karwowski, W., Pickl, S., Taiar, R., Eds.; Springer International Publishing: Cham, Switzerland, 2020; pp. 195–201. [Google Scholar] [CrossRef]
  16. Dey, D.; Martens, M.; Eggen, B.; Terken, J. Pedestrian road-crossing willingness as a function of vehicle automation, external appearance, and driving behaviour. Transp. Res. Part F Traffic Psychol. Behav. 2019, 65, 191–205. [Google Scholar] [CrossRef]
  17. Eisma, Y.B.; van Bergen, S.; ter Brake, S.M.; Hensen, M.T.T.; Tempelaar, W.J.; de Winter, J.C.F. External Human-Machine Interfaces: The Effect of Display Location on Crossing Intentions and Eye Movements. Information 2020, 11, 13. [Google Scholar] [CrossRef] [Green Version]
  18. Schmidt, H.; Terwilliger, J.; AlAdawy, D.; Fridman, L. Hacking Nonverbal Communication between Pedestrians and Vehicles in Virtual Reality. arXiv 2019, arXiv:1904.01931. [Google Scholar]
  19. Dietrich, A.; Maruhn, P.; Schwarze, L.; Bengler, K. Implicit Communication of Automated Vehicles in Urban Scenarios: Effects of Pitch and Deceleration on Pedestrian Crossing Behavior. In Human Systems Engineering and Design II; Ahram, T., Karwowski, W., Pickl, S., Taiar, R., Eds.; Springer International Publishing: Cham, Switzerland, 2020; pp. 176–181. ISBN 978-3-030-27927-1. [Google Scholar]
  20. Böckle, M.-P.; Brenden, A.P.; Klingegård, M.; Habibovic, A.; Bout, M. SAV2P—Exploring the Impact of an Interface for Shared Automated Vehicles on Pedestrians’ Experience. In Proceedings of the 9th International Conference on Automotive User Interfaces and Interactive Vehicular Applications Adjunct(Automotive UI ’17), Oldenburg, Germany, 24–27 September 2017; Löcken, A., Boll, S., Politis, I., Osswald, S., Schroeter, R., Large, D., Baumann, M., Alvarez, I., Chuang, L., Feuerstack, S., et al., Eds.; ACM Press: New York, NY, USA, 2017; pp. 136–140. [Google Scholar]
  21. Chang, C.-M.; Toda, K.; Sakamoto, D.; Igarashi, T. Eyes on a Car: an Interface Design for Communication between an Autonomous Car and a Pedestrian. In Proceedings of the 9th International Conference on Automotive User Interfaces and Interactive Vehicular Applications (Automotive UI ’17), Oldenburg, Germany, 24–27 September2017; Boll, S., Pfleging, B., Politis, I., Large, D., Domnez, B., Eds.; ACM Press: New York, NY, USA, 2017; pp. 65–73. [Google Scholar]
  22. Bernhard, M.; Grosse, K.; Wimmer, M. Bimodal Task-Facilitation in a Virtual Traffic Scenario through Spatialized Sound Rendering. ACM Trans. Appl. Percept. 2011, 8, 1–22. [Google Scholar] [CrossRef]
  23. Fraser, N.M.; Gilbert, G.N. Simulating speech systems. Comput. Speech Lang. 1991, 5, 81–99. [Google Scholar] [CrossRef]
  24. Fuest, T.; Michalowski, L.; Schmidt, E.; Bengler, K. Reproducibility of Driving Profiles—Application of the Wizard of Oz Method for Vehicle Pedestrian Interaction. In Proceedings of the IEEE Intelligent Transportation Systems Conference (ITSC), Auckland, New Zealand, 27–30 October 2019; pp. 3954–3959. [Google Scholar] [CrossRef]
  25. Fuest, T.; Michalowski, L.; Träris, L.; Bellem, H.; Bengler, K. Using the Driving Behavior of an Automated Vehicle to Communicate Intentions—A Wizard of Oz Study. In Proceedings of the 21st International Conference on Intelligent Transportation Systems (ITSC), Maui, HI, USA, 4–7 November 2018; pp. 3596–3601. [Google Scholar] [CrossRef]
  26. Currano, R.; Park, S.Y.; Domingo, L.; Garcia-Mancilla, J.; Santana-Mancilla, P.C.; Gonzalez, V.M.; Ju, W. ¡Vamos! Observations of Pedestrian Interactions with Driverless Cars in Mexico. In Proceedings of the 10th International Conference on Automotive User Interfaces and Interactive Vehicular Applications—AutomotiveUI’18, Toronto, ON, Canada, 23–25 September 2018; ACM Press: New York, NY, USA, 2018; pp. 210–220. [Google Scholar]
  27. Rothenbücher, D.; Li, J.; Sirkin, D.; Mok, B.; Ju, W. Ghost Driver: A Field Study Investigating the Interaction Between Pedestrians and Driverless Vehicles. In Proceedings of the 7th International Conference on Automotive User Interfaces and Interactive Vehicular Applications—AutomotiveUI’15, Nottingham, UK, 1–3 September 2015; Burnett, G., Gabbard, J., Green, P., Osswald, S., Eds.; ACM Press: New York, NY, USA, 2015; pp. 44–49. [Google Scholar]
  28. Joisten, P.; Alexandi, E.; Drews, R.; Klassen, L.; Petersohn, P.; Pick, A.; Schwindt, S.; Abendroth, B. Displaying Vehicle Driving Mode—Effects on Pedestrian Behavior and Perceived Safety. In Human Systems Engineering and Design II; Ahram, T., Karwowski, W., Pickl, S., Taiar, R., Eds.; Springer International Publishing: Cham, Switzerland, 2020; pp. 250–256. ISBN 978-3-030-27927-1. [Google Scholar]
Figure 1. Wizard of Oz vehicle: (a) seat cover used to hide the driver; (b) driver hidden under the seat cover [24].
Information 11 00291 g001
Figure 2. Wizard of Oz setup.
Information 11 00291 g002
Figure 3. Virtual reality setup.
Information 11 00291 g003
Figure 4. Unambiguous (solid lines) and ambiguous (dashed lines) target trajectory for the intentions Let the HRU go first (gray lines) and AV goes first (black lines). The vertical dashed line represents the position of the beginning of the time measurement.
Information 11 00291 g004
Figure 5. Comparison of the different setups.
Information 11 00291 g005
Figure 6. Mentioned crossing behavior for the intention Let the HRU go first, for the participants who understood the intention correctly.
Information 11 00291 g006
Figure 7. Mentioned crossing behavior for the intention AV goes first, for the participants who misunderstood the intention.
Information 11 00291 g007
Figure 8. Comparison for the subjective data.
Information 11 00291 g008
Figure 9. Boxplots for the subjective decision-making reliability (1 = very uncertain; 5 = very certain), segregated by setup (* = p < 0.0125).
Information 11 00291 g009
Figure 10. Boxplots for evaluation of driving behavior (1 = very poor, 5 = very good), segregated by setup (* = p < 0.0125).[M1] [W2]
Information 11 00291 g010
Figure 11. Boxplots for evaluation of driving behavior (1 = very poor, 5 = very good) for the VR setup, segregated by time of decision (before the AV reached standstill or after the AV reached standstill, and before the AV passed by or waited until the AV passed by).[M3] [W4]
Information 11 00291 g011
Figure 12. Boxplots for perceived criticality (1 = very critical, 5 = very uncritical), segregated by setups (* = p < 0.0125).
Information 11 00291 g012
Table 1. Samples for all study setups.
WoZVRVideo
SampleN = 34N = 37N = 46
ø-age (years)M = 40.94, SD = 21.39
Min. = 17, Max. = 81
M = 27.32, SD = 9.93
Min. = 20, Max. = 79
M = 30.50, SD = 11.55
Min. = 17, Max. = 67
Sex♂ = 24
♀ = 10
♂ = 23
♀ = 14
♂ = 20
♀ = 26
Travel as pedestrians in traffic (h per week)M = 7.06, SD = 6.33
Min. = 1, Max. = 25
M = 8.03, SD = 6.01
Min. = 1, Max. = 30
M = 6.57, SD = 5.76
Min. = 1, Max. = 30
Table 2. Misinterpretations of the intention Let the HRU go first.
WoZVRVideo WoZVideo VR
Unambiguous0.0% (0)
n = 62
2.7% (1)
n = 37
11.1% (4)
n = 36
4.3% (2)
n = 46
Ambiguous77.4% (48)
n = 62
29.7% (11)
n = 37
61.5% (24)
n = 39
63.6% (28)
n = 44
Table 3. Misinterpretations of the intention AV goes first.
WoZVRVideo WoZVideo VR
Unambiguous3.2% (2)
n = 62
2.7% (1)
n = 37
7.3% (3)
n = 41
2.4% (1)
n = 42
Ambiguous71.0% (44)
n = 62
40.5% (15)
n = 37
31.7% (13)
n = 41
27.9% (12)
n = 43
Table 4. Mentioned crossing behavior for the intention Let the HRU go first, unambiguous.
WoZVRVideo WoZVideo VR
Intention Recognition Intention Recognition Intention Recognition Intention Recognition
CorrectFalse CorrectFalse CorrectFalse CorrectFalse
CrossingYes51.6%
(32)
0.0%
(0)
CrossingYes62.2%
(23)
0.0%
(0)
CrossingYes66.7%
(24)
0.0%
(0)
CrossingYes84.8%
(39)
0.0%
(0)
No48.4%
(30)
0.0%
(0)
No35.1%
(13)
2.7%
(1)
No22.2%
(8)
11.1%
(4)
No10.9%
(5)
4.3%
(2)
Table 5. Mentioned crossing behavior for the intention Let the HRU go first, ambiguous.
WoZVRVideo WoZVideo VR
Intention Recognition Intention Recognition Intention Recognition Intention Recognition
CorrectFalse CorrectFalse CorrectFalse CorrectFalse
CrossingYes9.7%
(6)
0.0%
(0)
CrossingYes32.4%
(12)
0.0%
(0)
CrossingYes28.2% (11)0.0% (0)CrossingYes27.3% (12)2.3% (1)
No12.9%
(8)
77.4%
(48)
No37.8%
(14)
29.7%
(11)
No10.3% (4)61.5% (24)No9.1% (4)61.4% (27)
Table 6. Mentioned crossing behavior for the intention AV goes first, unambiguous.
WoZVRVideo WoZVideo VR
Intention Recognition Intention Recognition Intention Recognition Intention Recognition
CorrectFalse CorrectFalse CorrectFalse CorrectFalse
CrossingYes0.0%
(0)
3.2%
(2)
CrossingYes0.0%
(0)
2.7%
(1)
CrossingYes0.0%
(0)
7.3%
(3)
CrossingYes0.0%
(0)
0.0%
(0)
No96.8%
(60)
0.0%
(0)
No97.3%
(36)
0.0%
(0)
No92.7%
(38)
0.0%
(0)
No97.6%
(41)
2.4%
(1)
Table 7. Mentioned crossing behavior for the intention AV goes first, ambiguous.
WoZVRVideo WoZVideo VR
Intention Recognition Intention Recognition Intention Recognition Intention Recognition
CorrectFalse CorrectFalse CorrectFalse CorrectFalse
CrossingYes0.0%
(0)
22.6%
(14)
CrossingYes0.0%
(0)
16.2%
(6)
CrossingYes2.4%
(1)
22.0%
(9)
CrossingYes2.3%
(1)
16.3%
(7)
No29.0%
(18)
48.4%
(30)
No59.5%
(22)
24.3%
(9)
No65.8%
(27)
9.8%
(4)
No69.8%
(30)
11.6%
(5)
Table 8. Percentage and number of participants waited to press the button until the AV came to a complete standstill or passed by, for each setup.
WoZVRVideo WoZVideo VR
Let the HRU go first, Unambiguous0.0% (0)
n = 62
11.1% (4)
n = 36
43.8% (14)
n = 32
13.6% (6)
n = 44
Let the HRU go first, Ambiguous0.0% (0)
n = 14
42.9% (9)
n = 21
73.3% (11)
n = 15
87.5% (14)
n = 16
AV goes first, Unambiguous0.0% (0)
n = 60
6.1% (2)
n = 33
42.1% (16)
n = 38
22.0% (9)
n = 41
AV goes first, Ambiguous1.6% (1)
n = 18
35.0% (7)
n = 20
39.3% (11)
n = 28
41.9% (13)
n = 31
Table 9. Median (Mdn) of the IRT (measured in seconds), segregated by setup.
WoZVRVideo WoZVideo VR
Let the HRU go first, Unambiguous4.1 s4.5 s5.3 s5.6 s
Let the HRU go first, Ambiguous4.2 s4.8 s6.5 s5.5 s
z = −0.62
p = 0.534
(n = 11)
z = −0.45
p = 0.657
(n = 26)
z = −3.26
p = 0.001
r = 0.87
(n = 14)
z = −2.80
p = 0.005
r = 0.70
(n = 16)
AV goes first, Unambiguous3.3 s3.8 s4.7 s4.4 s
AV goes first, Ambiguous4.6 s5.3 s6.7 s6.8 s
z = −2.85
p = 0.004
r = 0.86
(n = 11)
z = −2.82
p = 0.005
r = 0.81
(n = 12)
z = −3.75
p ≤ 0.001
r = 0.74
(n = 26)
z = −4.72
p ≤ 0.001
r = 0.88
(n = 29)
Table 10. Median (Mdn) of the subjective decision-making reliability (1 = very uncertain, 5 = very certain), segregated by setup.
WoZVRVideo WoZVideo VR
Let the HRU go first, Unambiguous4.54.04.04.0
Let the HRU go first, Ambiguous4.04.04.04.0
z = −1.21
p = 0.226
(n = 11)
z = −0.83
p = 0.406
(n = 26)
z = −0.98,
p = 0.329
(n = 14)
z = −0.50
p = 0.615
(n = 16)
AV goes first, Unambiguous5.04.55.05.0
AV goes first, Ambiguous3.05.04.04.0
z = −2.94
p = 0.003
r = 0.89
(n = 11)
z = −0.88
p = 0.377
(n = 22)
z = −1.83
p = 0.068
(n = 26)
z = −1.84
p = 0.066
(n = 29)
Table 11. Median (Mdn) of the evaluation of driving behavior (1 = very poor, 5 = very good), segregated by setup.
WoZVRVideo WoZVideo VR
Let the HRU go first, Unambiguous4.54.04.04.0
Let the HRU go first, Ambiguous3.53.02.02.0
z = −2.70,
p = 0.007,
r = 0.81
(n = 11)
z = −3.79,
p ≤ 0.001,
r = 0.74
(n = 26)
z = −2.99
p = 0.003
r = 0.80
(n = 14)
z = −2.56
p = 0.011
r = 0.64
(n = 16)
AV goes first, Unambiguous4.54.03.53.0
AV goes first, Ambiguous2.02.02.02.0
z = −2.96
p = 0.003
r = 0.89
(n = 11)
z = −3.01
p = 0.003
r = 0.64
(n = 22)
z = −3.03
p = 0.002
r = 0.59
(n = 26)
z = −3.20
p = 0.001
r = 0.59
(n = 29)
Table 12. Median (Mdn) of the perceived criticality (1 = very critical, 5 = very uncritical), segregated by setup.
WoZVRVideo WoZVideo VR
Let the HRU go first, Unambiguous4.54.04.04.0
Let the HRU go first, Ambiguous4.04.03.03.5
z = −2.41
p = 0.016
r = 0.73
(n = 11)
z = −2.98
p = 0.003
r = 0.58
(n = 26)
z = −2.57
p = 0.010
r = 0.69
(n = 14)
z = −2.23
p = 0.026
r = 0.56
(n = 16)
AV goes first, Unambiguous4.54.04.04.0
AV goes first, Ambiguous3.02.53.02.0
z = −2.82
p = 0.005
r = 0.85
(n = 11)
z = −2.42
p = 0.016
r = 0.52
(n = 22)
z = −2.02
p = 0.043
r = 0.40
(n = 26)
z = −2.98
p = 0.003
r = 0.55
(n = 29)
Table 13. Misinterpretations of the intentions for the metrics IRT and start of road crossing.
Let the HRU Go First,
Unambiguous
Let the HRU Go First,
Ambiguous
AV Goes First,
Unambiguous
AV Goes First,
Ambiguous
IRT2.7% (1)
n = 37
29.7% (11)
n = 37
2.7% (1)
n = 37
40.5% (15)
n = 37
Start of Road Crossing2.7% (1)
n = 37
2.7% (1)
n = 37
2.7% (1)
n = 37
5.4% (2)
n = 37

