Article

Online At-Risk Student Identification using RNN-GRU Joint Neural Networks

1
School of Computer Science, Nanjing University of Posts and Telecommunications, Nanjing 210023, China
2
School of Overseas Education, Nanjing University of Posts and Telecommunications, Nanjing 210023, China
3
School of Educational Science and Technology, Nanjing University of Posts and Telecommunications, Nanjing 210023, China
*
Authors to whom correspondence should be addressed.
Information 2020, 11(10), 474; https://doi.org/10.3390/info11100474
Submission received: 10 August 2020 / Revised: 20 September 2020 / Accepted: 30 September 2020 / Published: 9 October 2020
(This article belongs to the Special Issue Artificial Intelligence Applications for Education)

Abstract

:
Although online learning platforms are gradually becoming commonplace in modern society, learners’ high dropout rates and serious academic performance require more attention within the virtual learning environment (VLE). This study aims to predict students’ performance in a specific course as it is continuously running, using the statistic personal biographical information and sequential behavior data with VLE. To achieve this goal, a novel recurrent neural network (RNN)-gated recurrent unit (GRU) joint neural network is proposed to fit both static and sequential data, where the data completion mechanism is also adopted to fill the missing stream data. To incorporate the sequential relationship of learning data, three kinds of time-series deep neural network algorithms: simple RNN, GRU, and LSTM are first taken into consideration as baseline models. Their performances are compared in identifying at-risk students. Experimental results on Open University Learning Analytics Dataset (OULAD) show that simple methods like GRU and simple RNN have better results than the relatively complex LSTM model. The results also reveal that different models have different peak performance time, which results in the proposed joint model that achieves over 80% prediction accuracy of at-risk students at the end of the semester.

1. Introduction

With the exponential evolution of science and technology, educational tools make dramatic changes in recent decades. Virtual Learning Environments (VLEs) like Massive Open Online Courses (MOOCs), which provide lecture videos, online assessments, discussion forums, and even live video discussions via the Internt [1], has become commonplace especially in the period of the COVID-19 outbreak. Two of the benefits it brings account for the increasing adoption of online learning. Firstly, VLEs provide convenience for participants to enroll courses by breaking time and distance limitations. Moreover, online learning platforms based on the Internet are able to record a type of data, including data from a user’s VLEs and other learning systems, which is called trace data [2] and profoundly help to provide personalized educational service after necessary analysis. However, online learning emerges in serious situations with a high dropout rate and heavy academic failure. Researches on distance education claim that the completion rate of courses is usually less than 7% [3]. For instance, the dropout rate of Coursera ranges from 91% to 93% [4] and similar conditions happened in the Open University of the United Kingdom [5]. Unfortunately, such a withdrawal rate is even higher than that of the traditional brick-and-mortar-based education [3], which notoriously throws the reliability of VLEs into doubt. Hence, identifying final students’ outcomes in a timely manner ensures no delay in helping online platforms to make an instant intervention, which can assist underachievers to improve their performance.
By virtue of the rapid development of big data, Data Mining (DM) has emerged and gained an important role in data analysis, which is properly defined as the extraction of data from a dataset, and discovering useful information from it [6]. Educational Data Mining (EDM), as a sub-area of DM, has great market potential and generates effective outcomes for learning data. Therefore, the reliable educational dataset as a precondition of EDM is necessarily crucial. Nonetheless, a considerable number of datasets that depend on VLEs are unsuitable for the prediction of academic performance with binary reasons. Firstly, researchers tend to have difficulties capturing learners’ data from online learning platforms due to various privacy issues. The work done by May et al. [7] proved that it is not always straightforward or simple to promise absolute privacy, confidentiality, and anonymity while using open VLE. Hence, the platforms are usually reluctant to publish their data. Actually, the datasets with anonymous processing and high privacy level are likely to be adopted for studies. In the second place, differential datasets from numerous diversity of VLEs focus on different perspectives of students, contributing to paying close attention to certain features but ignoring others. For example, the KDD Cup dataset extracted from XuetangX MOOC platform [8] fails to include any demographic or historical data from past courses. Additionally, some datasets lack the behavioral aspect of learners like the Academic Performance dataset [9]. In the Coursera platform, some researchers searched only in the discussion forums for analyzing the cognitive process [10], but others dealt with learners’ clickstreams in videos for predicting the learners’ future behavior [11]. Ultimately, this paper chooses the Open University Learning Analytics Dataset (OULAD), because the gathered data with anonymization [12] covers all the learners’ individual differences including the demographic data, the summary of their daily activities when they interact with the VLE and course assessment outcome [13].
In this paper, we develop a novel joint model to predict students’ performance based on their historic data in the current course. Therefore, a novel framework is raised for the sake of data pre-processing and OULAD dataset preparation. In addition, we also compare three recurrent neural network (RNN) algorithms in extracting time series features from interaction history and assessment logs, which are usually used for EDM and ensure highly efficient and accurate prediction in handling stream data. The contributions of this study are as follows:
  • Firstly, this study proposes a novel joint neural network model framework to identify at-risk students accurately based on their demographics information and interaction stream data.
  • Secondly, the data completion method was adopted for completing missing stream data, which enabled the model to be trained and validated on varying-length courses.
  • Thirdly, the experiments prove that gated recurrent unit (GRU) and simple RNN perform better in analyzing academic stream information than the LSTM model.
The organization of this paper is as follows. Section 2 briefly reviews the most relevant work via a literature survey. Section 3 presents the methods of data pre-processing and the neural networks used in the experiment. Section 4 formulates the experimental setup and discussion. The conclusion with a summary of the whole work and future directions are illustrated in Section 5.

2. Related Work

2.1. Educational Data Mining

Data Mining(DM) is used to extract data and discover useful information from a dataset [6], which has emerged and gained rapid development in recent decades when more data are available for analyzing. Fayyad et al. [14] used DM to analyze the collected data and enhance the decision-making process based on the analyzed result. DM has been widely applied in many fields like anomaly detection, intrusion detection, and domain detection [15,16,17].
Concerning education, educational data mining (EDM) is about analyzing data collected from teaching environments by designing methods and algorithms [18]. Romero et al. [19] conducted a review in 2007, including DM techniques used in different teaching environments, which analyzed how specific DM techniques, like text mining and statistics have been applied in online lessons. Their further research involved more factors associated with the participant groups, the type of educational settings, and the data offered. It illustrated the most common tasks handled by EDM techniques in the educational environment [20].
EDM techniques are widely used in solving learning problems. Computer-supported collaborative learning was applied by Perera et al. [21] to extract collaborative patterns in discussions, education environments, and Gaudioso et al. [22] used EDM technology to support teachers in collaborative participant modeling. EDM can also be used to identify aspects related to participants’ dropout intention and classify students who tend to drop out based on their historic data [23,24,25]. Researchers designed personalized learning and course recommendations for students based on EDM results used to predict students’ outcome [26] and enhance learning and teaching behaviour [14]. Based on data from log event files, Ben-Zadok et al. [27] demonstrated the use of EDM to increase students’ exposure to different topics, enabling teachers to analyze students’ learning processes, according to their preferences and actual behavior to meet their diverse learning requirements. A study by Sabourin et al. [28] used EDM on self-regulated learning behaviors to predict student self-regulation capabilities.

2.2. Student Performance Prediction

Many studies have applied machine-learning approaches and deep-learning approaches for predicting the students’ performance [29,30] and optimizing the learning settings [31] when more students’ behavior data are available due to the development of technology-enhanced learning environments like MOOCs and Learning Management Systems (LMSs). Predicting students’ outcomes during the course is crucial in MOOCs and LMSs because it can help teachers recognize at-risk students and assist them in passing the course. Several works have been done in at-risk student identification.
A variety of previous researches on predicting students’ performance used traditional machine learning approaches to fit demographic information, interaction logs, or both. Logistic Regression (LR) was typically employed in models predicting students at-risk of failure and showed promising predictive results. Wilson et al. [32] applied an LR on participants’ demographic information that corresponds to their writing tasks and personal abilities, and the produced model showed a promising area under the curve (AUC) score, at 0.89. Marbouti et al. [33] also employed LR to evaluate student performance in advance of the course with attributes of their attendances and assessment behavior. Silveira et al. [2] compared LR, SVM, Naive Bayes and J48 in predicting academic success/failure based on the institutional data and trace data generated by a VLE, and the algorithm J48 presented the best classification accuracy and had the best execution time (excluding Naive Bayes). These machine learning methods show promising results in predicting students’ performance with fix-length data.
When much data generated by VLEs are time series, such as clickstream, assessment stream, and interaction event logs, traditional machine learning methods failed to use those various lengths of data for predicting outcomes. Many deep-learning based models are used to solve these kinds of data recently. Aljohani et al. [34] deployed a deep LSTM model classifying students’ outcome from sequential data, and the proposed LSTM model achieved the best result with 0.7579 recall score and 0.9346 precision score, and outperformed the baseline LR and ANNs by 18.48% and 12.31% accuracy scores, respectively. Karimi et al. [35] developed a model called Deep Online Performance Evaluation (DOPE) for performance prediction, which represented the online learning system as a knowledge graph and used a relational graph neural network to learn student and course embeddings from historical data. An LSTM was utilized for harnessing the student behavior data into a condensed encoding. Their experiments showed the feasibility of DOPE, which could identify at-risk students of on-going courses. All these models used sequential data from interaction event logs but ignored the assessment data which was also is available during the procession of courses. In contrast, our model used both these stream data and thus achieved better predictive results.

3. Method

The dataset we used is the Open University Learning Analytics dataset (OULAD), which constitutes demographics information, course information, mutual information, and assessment performance of 32,593 participants for no more than nine months, during 2014 and 2015 [12]. It is composed of seven different courses, and each course presented at least twice and was started at different months in a year. The participants’ final performance was grouped into four classes: withdrawal, fail, pass, and distinction.
Mutual information indicates the interaction of students with the VLE, and the interaction was logged in the number of clicks daily for each course. The type of interaction was categorized into 20 classes, meaning different click actions, such as visiting the recommended URL and resource, completing quizzes, and filling in questionnaires. Assessment information presents the type, weight, and expected deadline for each assessment, and the results of students’ submission. Figure 1 shows the distribution of student numbers with pass or fail outcomes based on students’ interaction with the VLE. It is clear that students who get higher scores in assessments and interact with the learning environment frequently are more expected to pass the course, while those who fail the course tend to have lower scores in assessments and fewer clicks to the VLE. As a result, assessment performance history and mutual history can be used to predict whether a student is at risk during any online courses.
Since part of the course’s nature varies from semester to semester, such as the length of the course, the type and number of assignments for the course, the time-series model shows promising results in dealing with these variable-length data. While not every student submitted all assignments for each course and VLE history was not logged every week, data inpainting is needed for data pre-processing to complete the unsubmitted assessment and unrecorded weekly VLE interaction. Many approaches on this dataset train and test on one course after the selected course ends, making the method less meaningful. Our proposed approach can train and validate history courses’ information effectively and show promising results on the current course. The following subsections will describe each module in the proposed pipeline in detail.

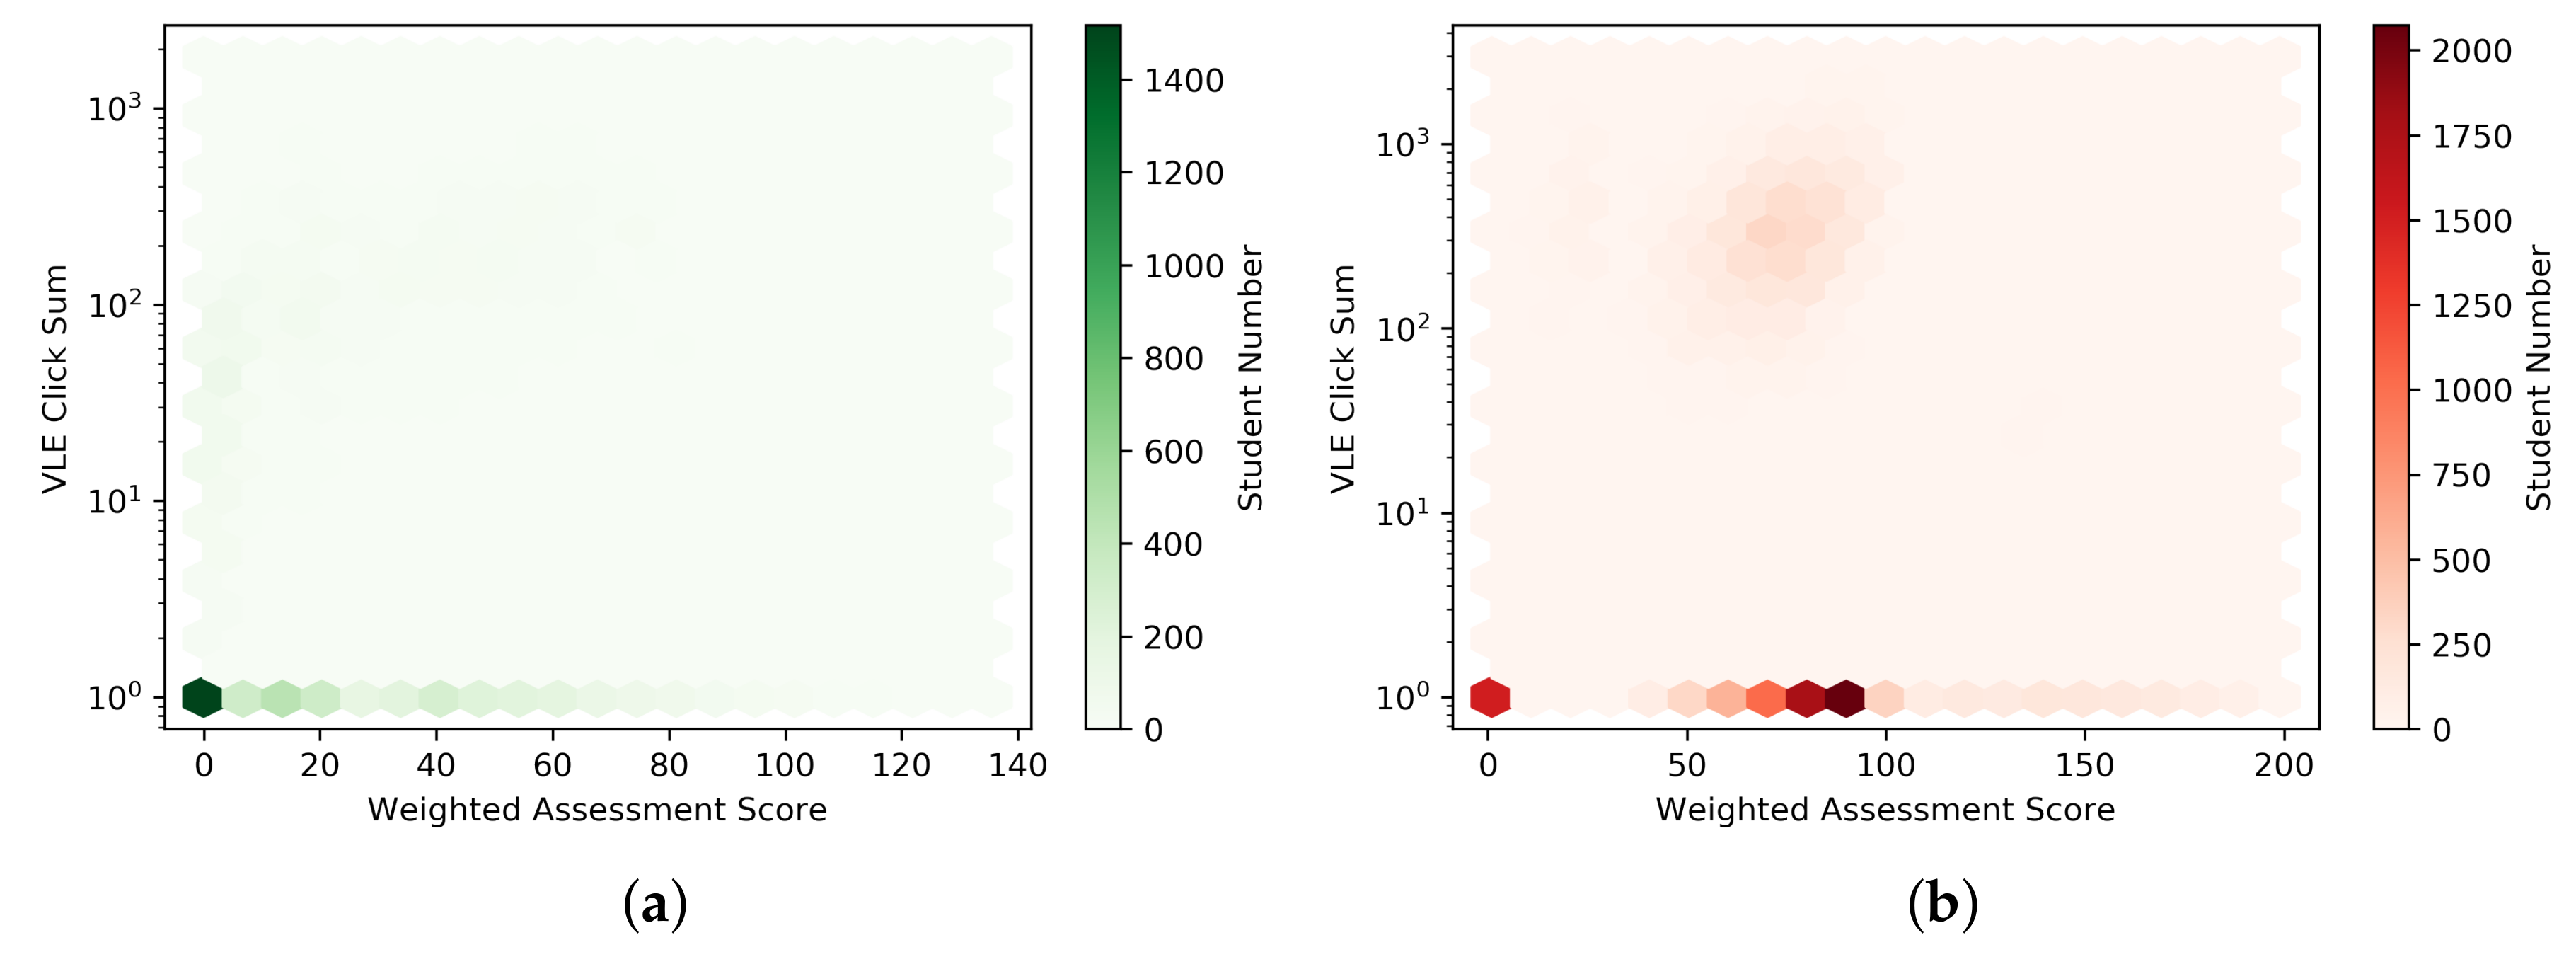
3.1. Data Pre-Processing
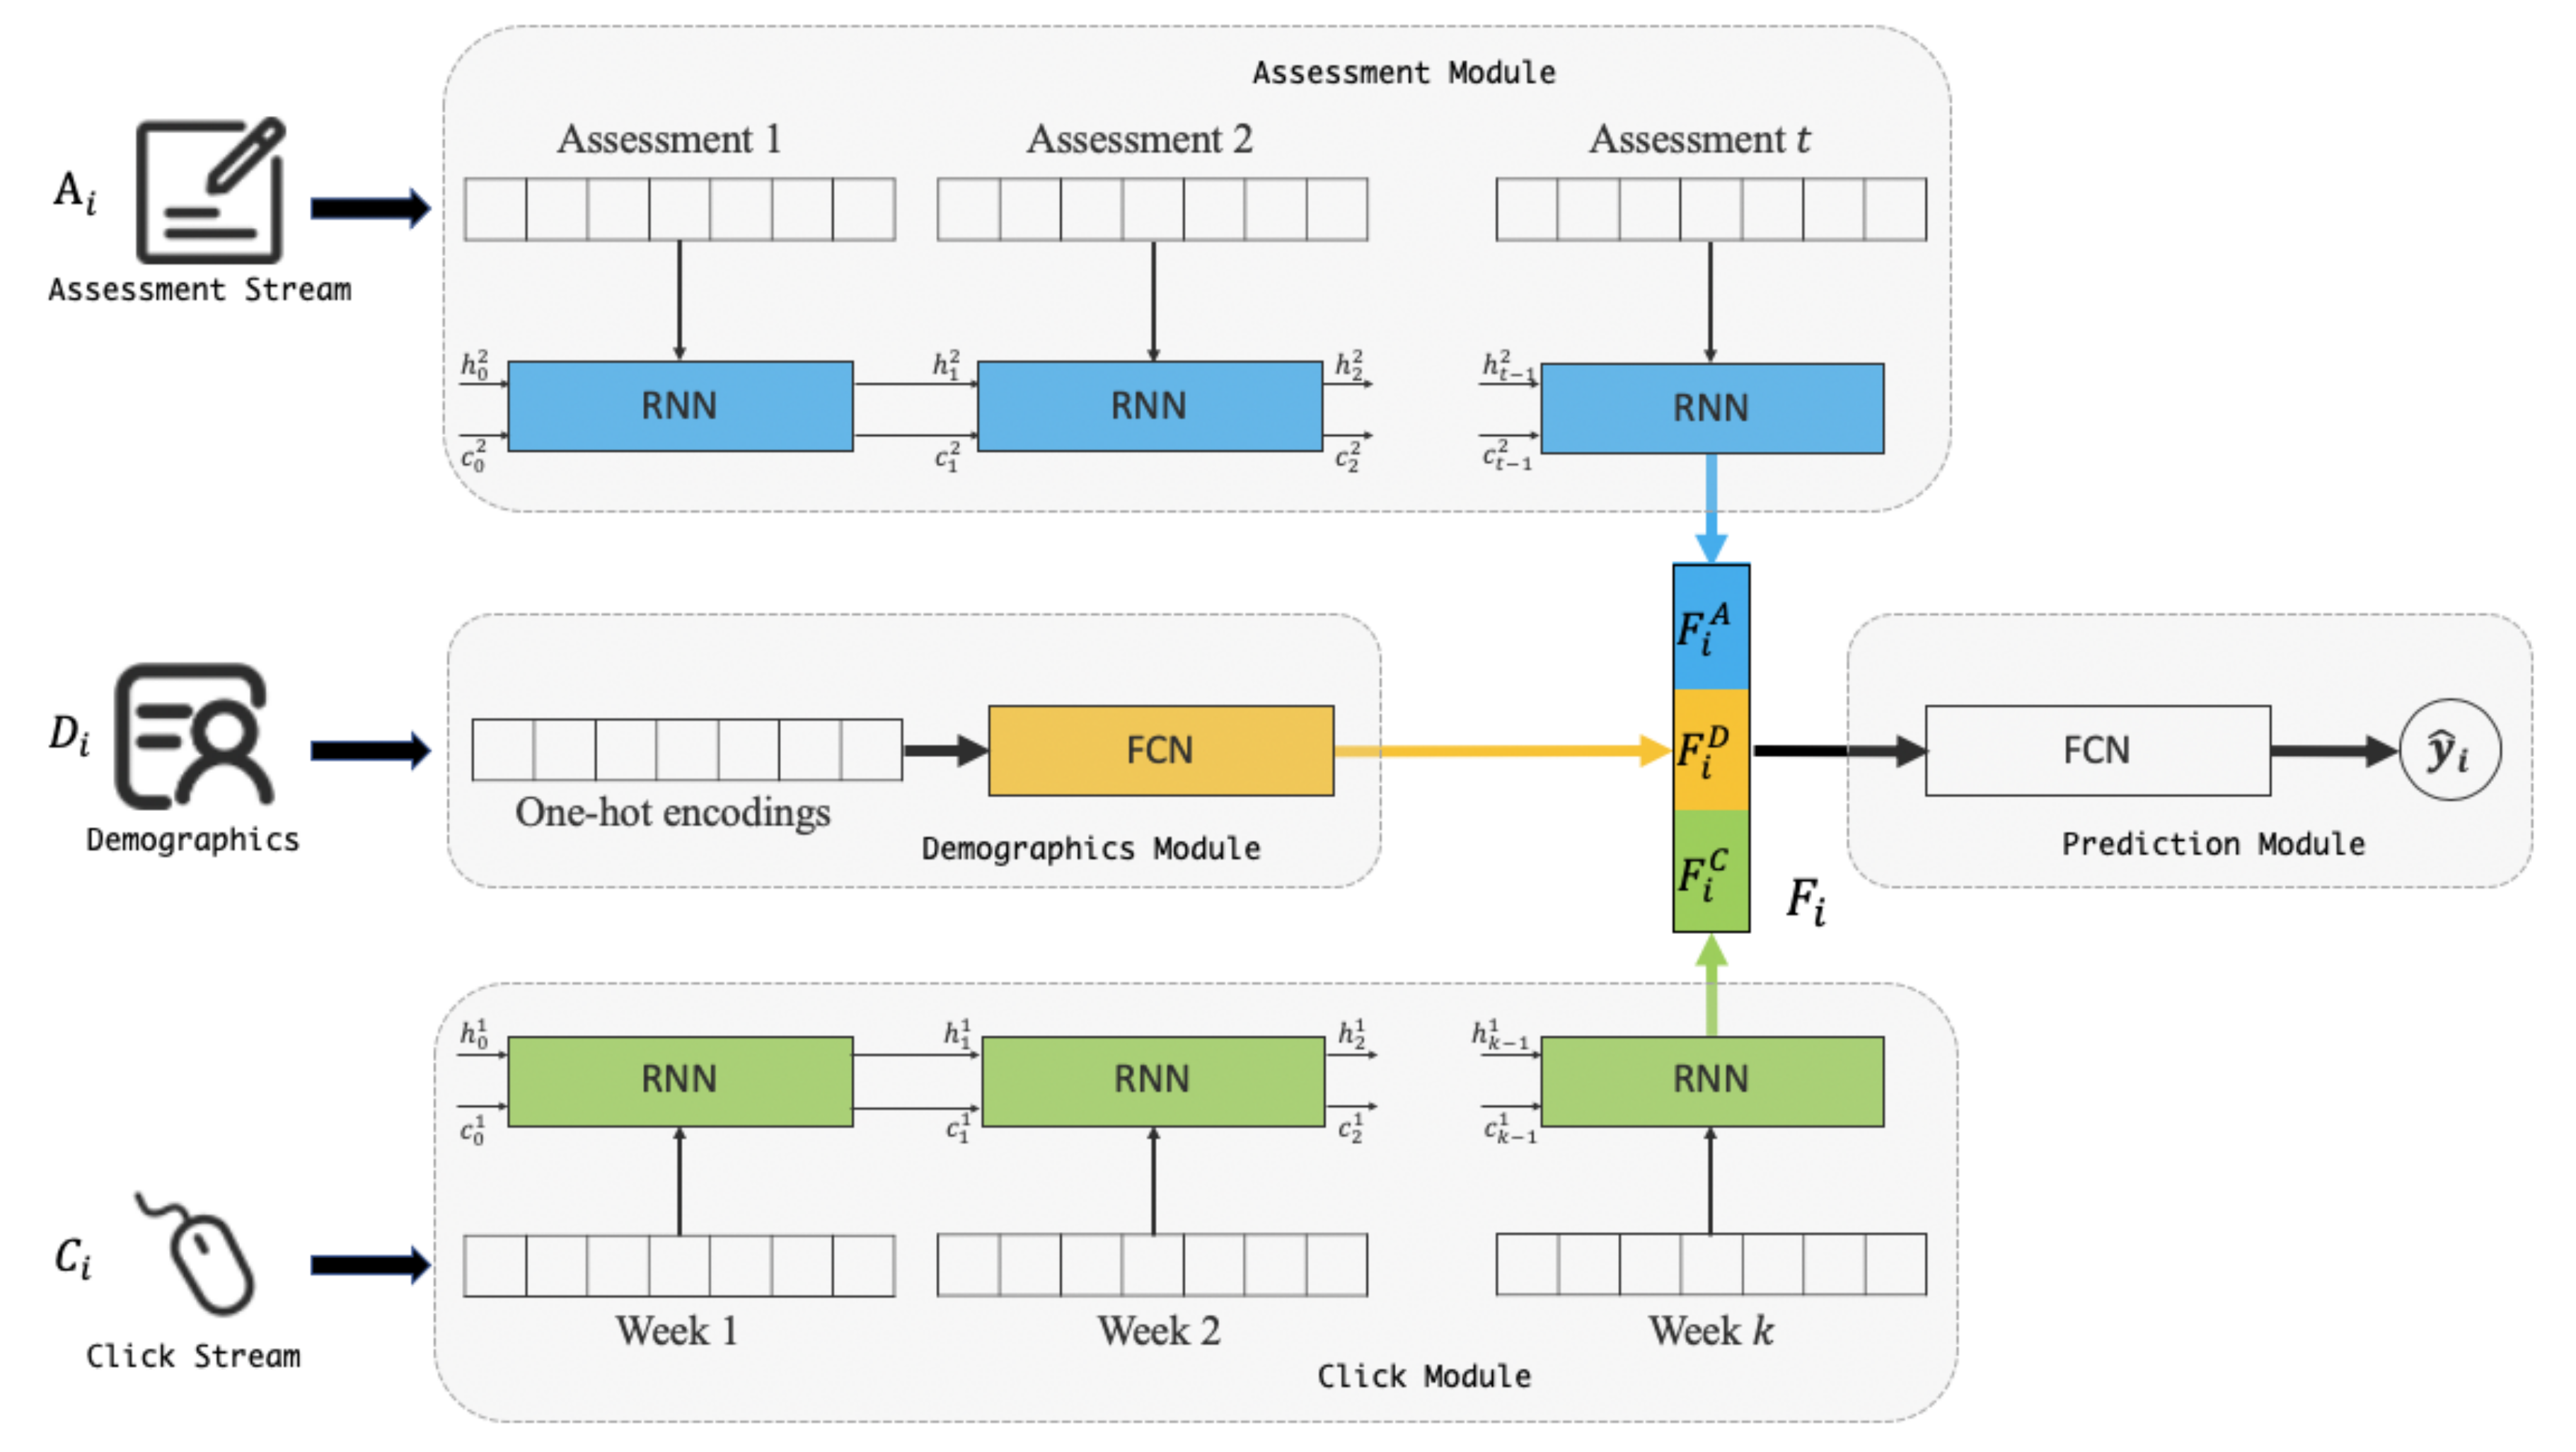
As mentioned above, we expect that the length of the assessment stream and the clickstream for each student are the same so that the data can be applied in time-series models. To achieve this, we used data completion to fill in the missing data. Specifically, when the number and type of assessments are fixed for each course, we added each student’s unsubmitted assessment to the assessment table and assigned a zero score. The VLE data were organized in week-wise manners, meaning the sum of clicks for each type of VLE activities in one week. While some students did not access the VLE for several weeks, we supplemented the interaction data for missed weeks and assigned a zero score. Demographics in this paper indicate data about the information of one student, such as the geographic region, gender and the highest education. When most personal attributes are unordered, we converted student information into one-hot encodings. Since we aim to use history information of one course to predict the student outcome of the current course, we did the above operation on each course when courses at different semesters varied in assessments and length of course. During the training and validation procedures, we trained and validated the model on every past course iteratively. This study predicts whether or not a participant will fail in the end based on his/her information and interaction at the current course. We combined ‘distinction’ labels and ‘pass’ labels into ‘pass’ labels and ignored the ‘withdrawal’ instances.

3.2. Approach

RNNs are the default choice for sequence modeling tasks because of their exceptional ability to capture temporal dependencies in sequential data. There are several variants of RNNs, such as LSTM and GRU, capable of capturing long term dependencies in sequences and have achieved state-of-the-art performances in many sequence modeling tasks.
Vanilla RNN is one of the simplest time series models, where the input and the hidden state are simply passed through a single tanh layer. The computation of hidden state h t and the output y t at time t are described mathematically in Equations (1) and (2):
h t = tanh ( W h x t + W h h t 1 )
y t = W y h t ,
where W h , W h and W y are weights in the simple RNN, and x t is the input feature at time t. All the weights are applied using matrix multiplication, and biases are added into the resulting output.
The GRU uses the reset gate and update gate to control the data stream, the reset gate means how the previous memory effects the new input, and the update gate indicates how much of the previous information to be passed along to the future. The hidden state h t in GRUs is calculated as shown in Equations (3)–(6):
z t = σ ( x t U z + h t 1 W z )
r t = σ ( x t U r + h t 1 W r )
h ˜ t = tanh ( x t U h + ( r t h t 1 ) W h )
h t = ( 1 z t ) h t 1 + z t h ˜ t
where U z , W z , U r , W r , U h , W h are the corresponding weights for the GRU, z t is the update gate, r t is the reset gate, h ˜ t denotes the candidate hidden state, and σ denotes the component-wise logistic sigmoid function.
LSTM is more complicated than GRU and has more gate and a cell state. The cell state at time t conserves the information long before t. LSTMs, more than GRUs, can remember longer sequences, so LSTMs achieve better results in projects requiring understanding long-distance relations.
Since the length of courses in MOOCs is relatively small and we tend to predict student performance at early as possible, a powerful LSTM is not necessary for this task to capture the excessive long-term dependencies in the week-wise assessment and VLE interaction data. Experimental results show that simple RNN and GRU can converge faster and achieve relatively better performances than LSTM.
The proposed work developed a new deep network to identify participants’ outcomes based on their demographics, assessment stream, and the clickstream. To achieve this purpose, we divided the model into four modules: Assessment Module, Demographics Module, Click Module, and Prediction Module, as depicted in Figure 2. Specifically, for a student i, D i , A i and C i denote his/her pre-processed demographics, assessment-wise assessment stream information and week-wise interaction stream information respectively. In the demographics module, D i is converted into a demographical feature vector F i D using FCN. The Assessment Module and Click Module are used to extract assessment-wise features F i A and week-wise features F i C , where RNNs are implemented in these modules. Finally, F i D , F i A and F i C are concatenated into a feature vector F i , representing the historical features of student i, which are used in the Prediction Module for performance prediction.

4. Experiments and Discussions

In this section, we conduct some experiments to verify the working of our proposed method and compare it with baselines. We will explain the experimental settings and baseline methods and then present the experimental results and discussions.

4.1. Experimental Settings

In this paper, we did a binary classification for online course outcome prediction. The classes ‘pass’ and ‘distinction’ were considered; ‘pass’ and ‘withdrawal’ classes were ignored. Since we intended to use the historic course information to predict the performance in the current course, we used 80% of the historical data for training and 20% for validation and fine-tuning the hyperparameters. As shown in Table 1, the code module indicates the course id, 2013 and 2014 mean the year of the course, and ‘B’ indicates that the course starts in February and ‘J’ in October.
Two fully-connected layers were implemented in the Demographics Module with 128 neurons, and three layers were used in the Prediction Module, from 384 to 1536 units. The architecture of the Assessment Module and Click Module was the same; the RNN in both modules contained seven hidden layers with 256 units. Leaky Relu was applied as the activation function after each fully-connected layer, except the last layer in the Prediction Module. ADAM [36] was used as the optimizer, and each simulation ran for 250 steps, with the learning rate set to 0.00002 with batch size 256 (students).

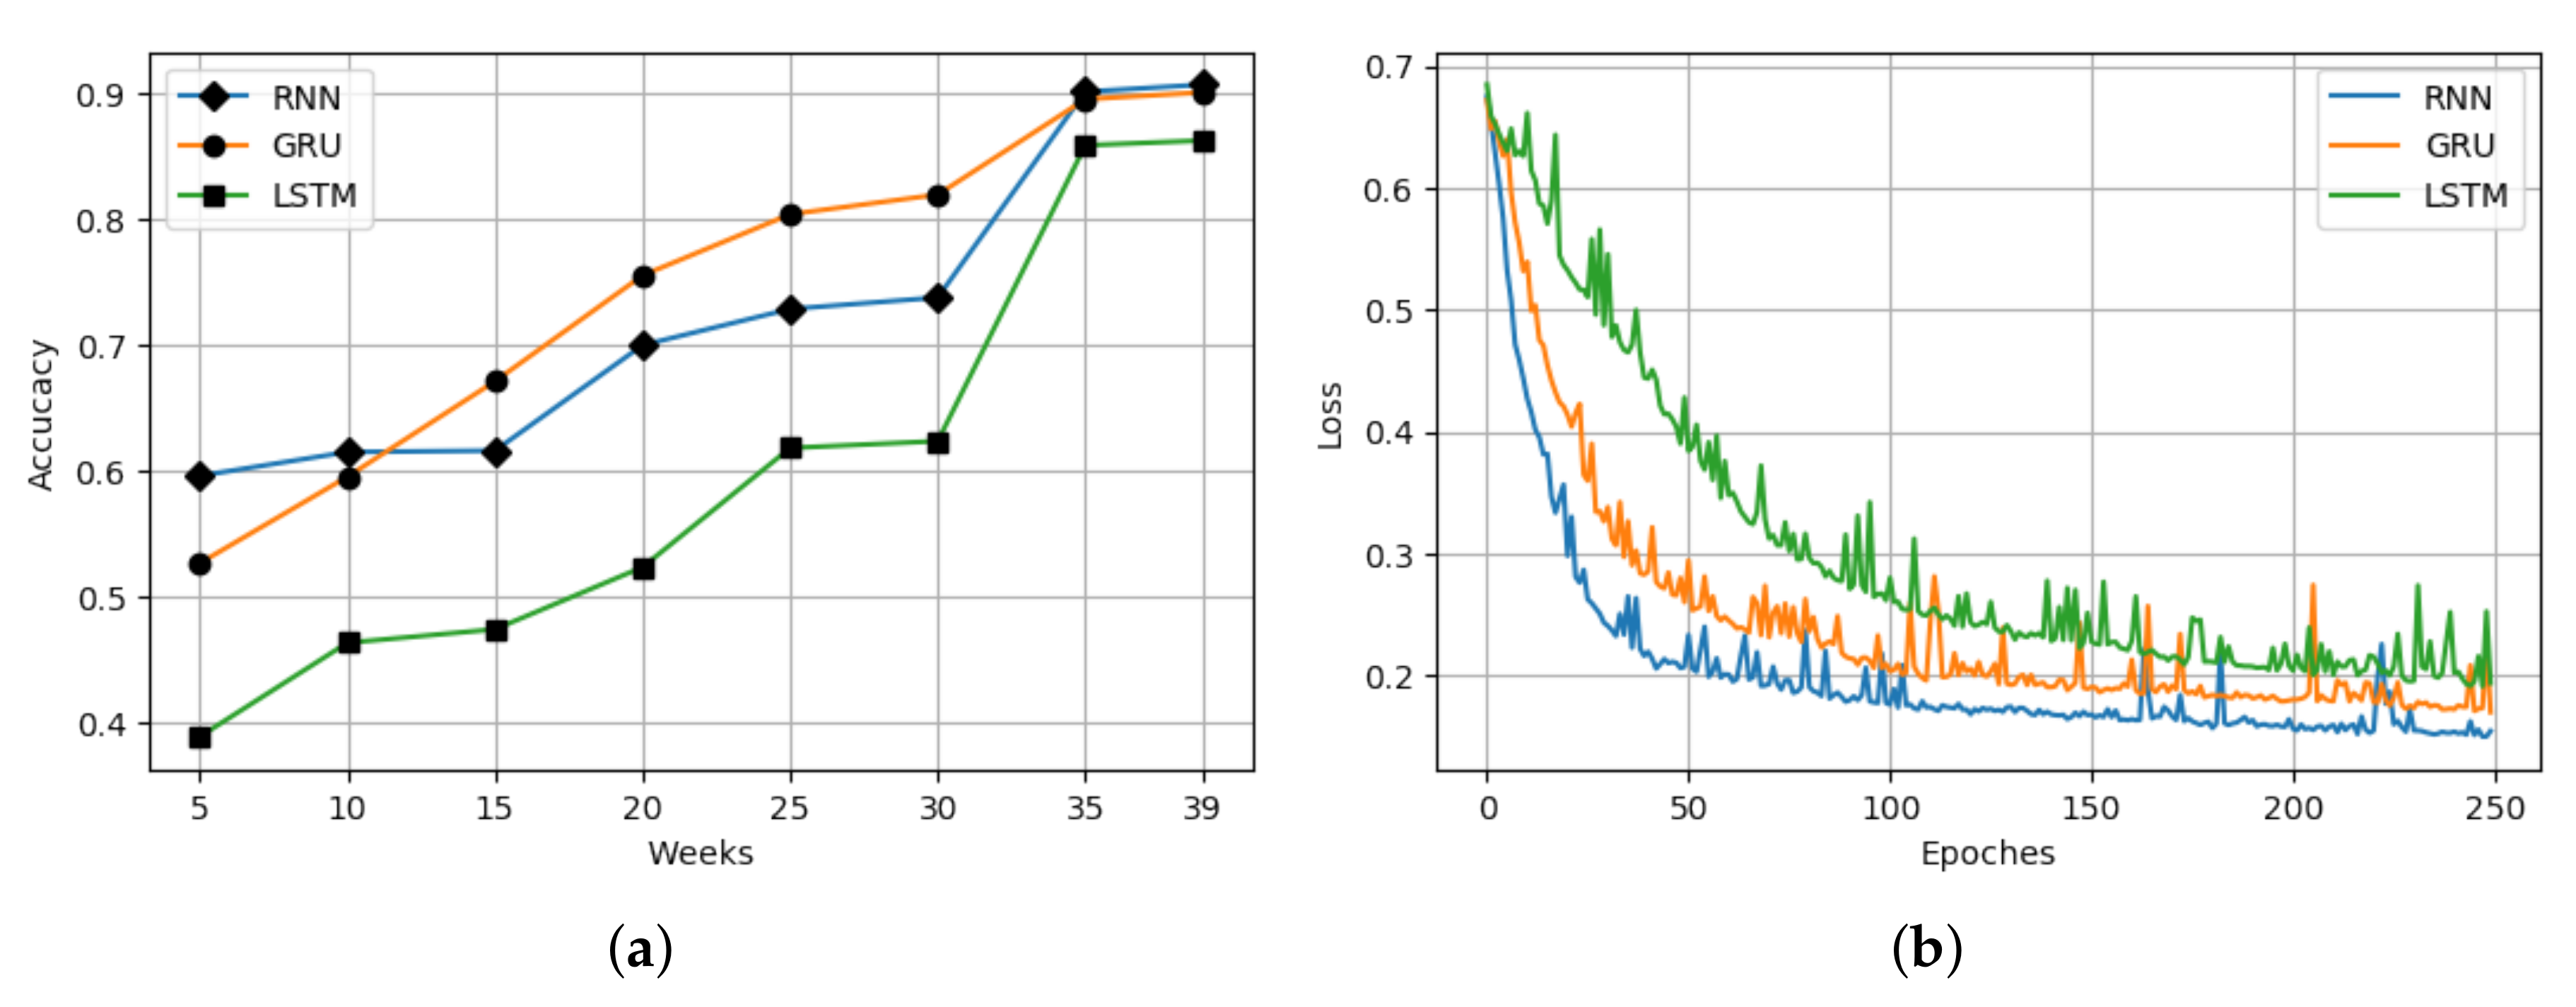
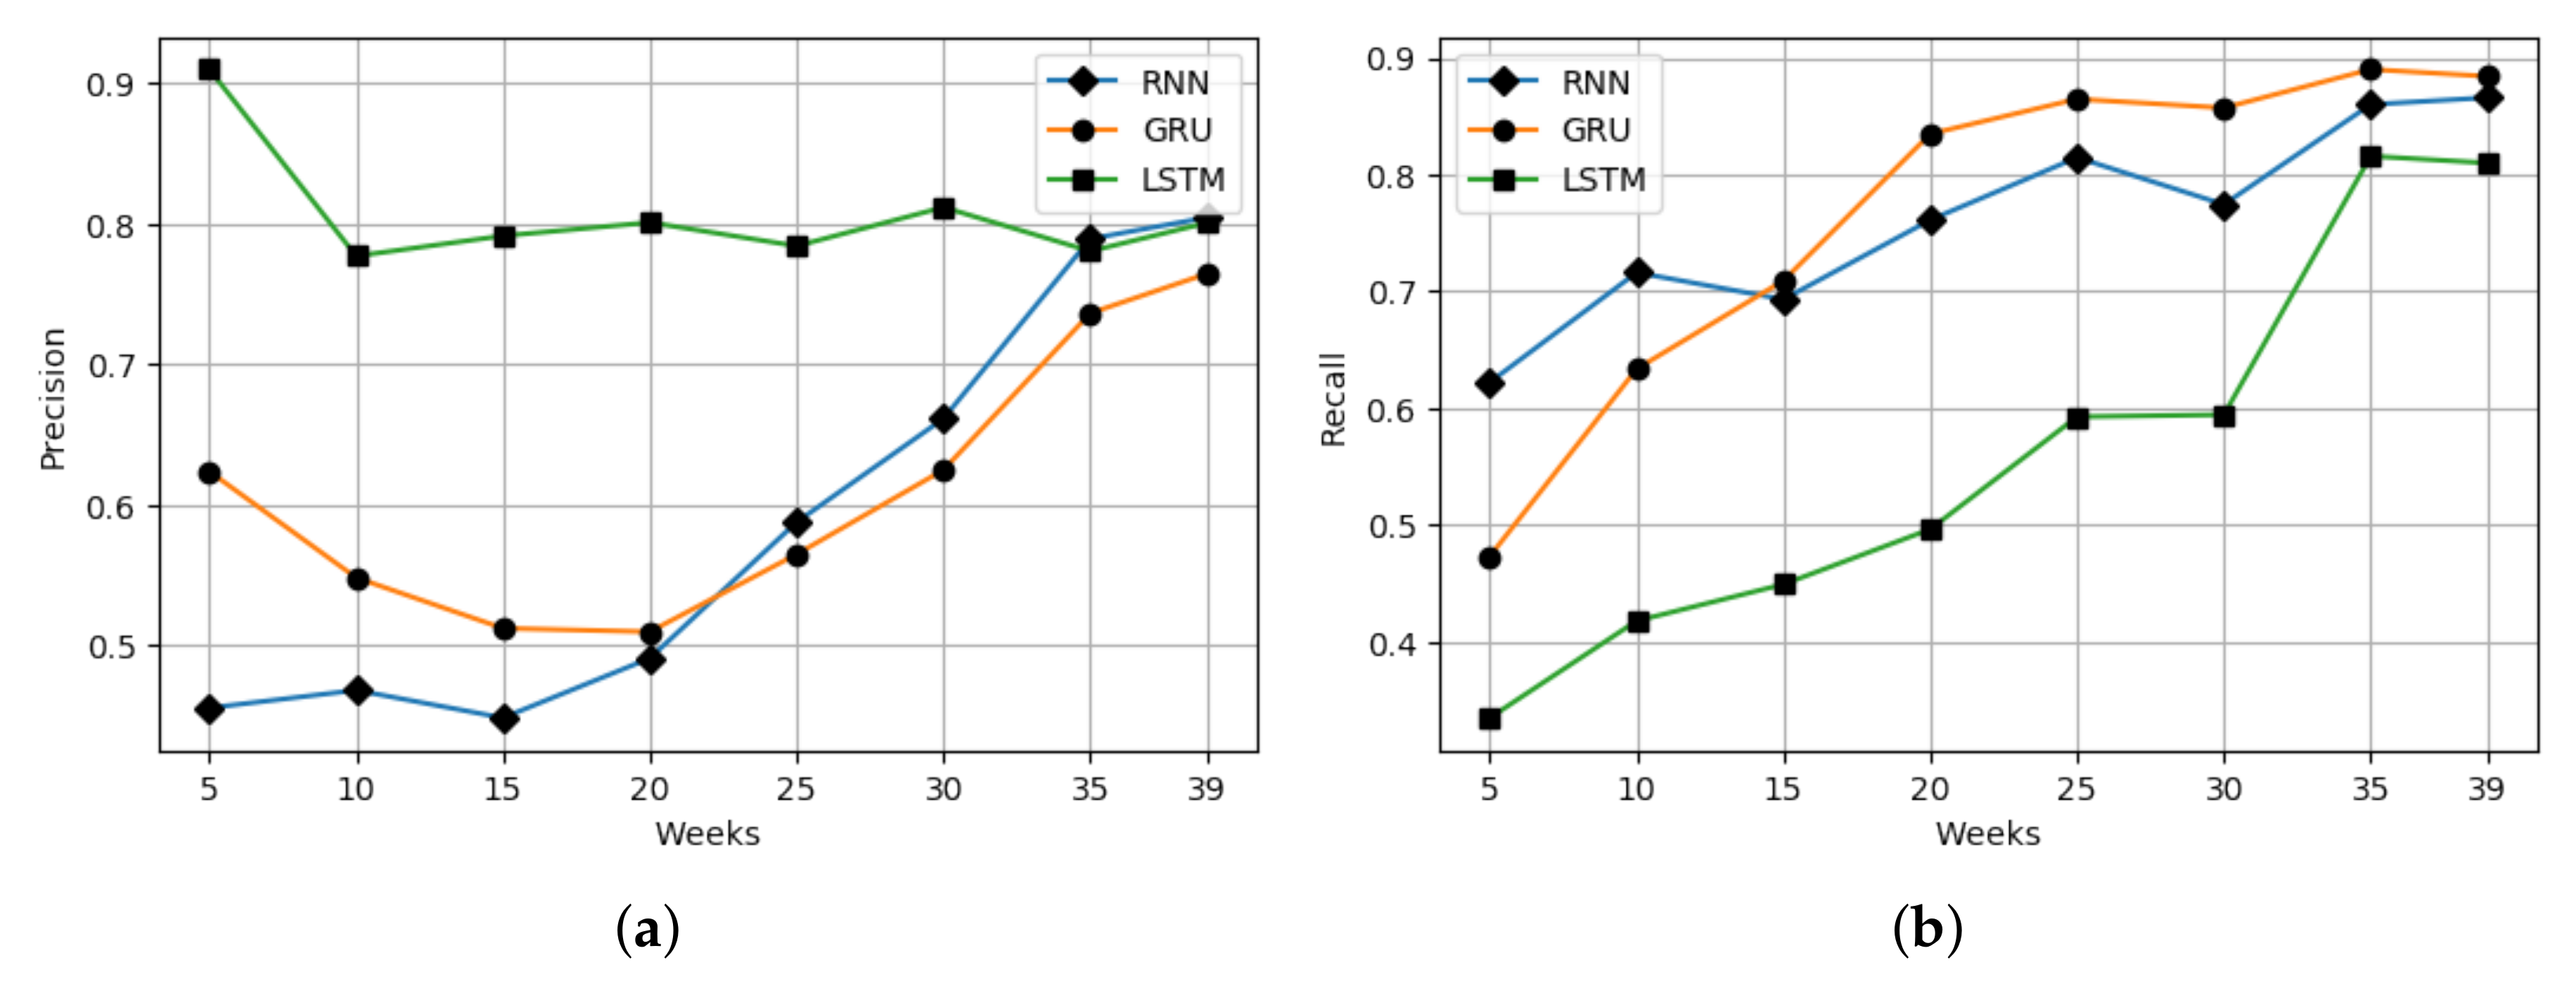
4.2. Evaluation with Baseline

We compare the simple RNN method with GRU and LSTM methods used in the Assessment Module and Click Module, while other traditional machine learning methods fail to train and test on various lengths of data. The following comparison and discussion are made based on the averaged results on all predicted courses.
After the model finished its training and validation, it was used to evaluate its performance on the test data. For the test data before week k, the demographics, click data before the k-th week, and assessment data of each deadline before the k-th week are feed into the model for prediction. As shown in Figure 3a, the forecast is made in the test set with 5 weeks to 39 weeks data, and with additional weeks, models can predict the performance with higher accuracy. Student achievement is difficult to determine based on their behavior at the very beginning of the course when fewer data can be used for prediction, and all models did not obtain promising results. The RNN-based model achieved the averaged accuracy at 60% in the 5th week, and the GRU-based model got less comparable results at 53%. In contrast, the LSTM-based model failed to predict accurately in the early stage and obtained an accuracy of less than 40% in the 5th week. As courses progress, more weeks of interaction and assessment data are available, the RNN-based model obtained accuracy from 60% at 5th week to over 90% at the 39th, the GRU-based model predicted less accurately than the RNN-based one before the 10th week, but achieved a much better result in the middle of the course, and 90% was also acquired in the last week. The LSTM-based model performed much worse than the other two methods in all course stage, which just reached at 85% in the last week from around 40% at week 5.
Since vanilla RNN is not able to capture the long-term dependence, it failed to make good use of long-term interaction data, making it less concerned with the initial data and performed worse during the middle of courses. Still, it could achieve a relatively good result at the beginning of courses when it was able to discover information in fewer stream data. LSTM uses gates and a cell state to preserve more long-term historical details. It tends to rely more heavily on long-term historical data than GRU and cannot predict in high accuracy with limited historical data. In contrast, the GRU structure is simpler than LSTM and shows less long-term dependence and some short-term dependence, which means it can focus on recent interaction data and utilize historical data.
As illustrated in Figure 3b, the RNN-based model converges faster than other methods. LSTM and GRU are more complex than basic RNN and have more weights to update, and they try to capture long-term relationships in the assessment stream and clickstream. This relationship is not tightly linked to the interactive data. The result tends to be affected by the latest behavior, making them need more epochs to learn hidden connections in the interaction stream. The GRU merges the input gate and forget gate in LSTM into an update gate, and ignores the memory unit, so it is simpler than LSTM and achieves faster convergence.
Precision and recall metrics are also frequently used in evaluating the predictive model. In this task, precision means the proportion of fail students identified correctly in students labeled as failures by the model. At the same time, the recall indicates the percentage of predicted at-risk samples by our model from failed participants in test data. As shown in Figure 4a, the LSTM-based model presented the best-averaged precision score in all course stages, showing its best ability in avoiding predicting those who will pass the course to be at-risk. Simultaneously, other methods got a lower precision score at the beginning and achieved higher scores as courses went on. Although LSTM showed better results in precision, the recall score was important in our task since we want all expected at-risk students to be detected by models as early as possible, so that teachers can give them instruction to help them pass the course. Figure 4b displays both the RNN-based model and the GRU-based model outperformed LSTM-based one in recall score throughout courses, and vanilla RNN got a higher score before week 15, and the GRU achieved better than the simple RNN after week 15. After the 35th week, the simple RNN model and the GRU model had a recall score of over 0.85, meaning that these two models can identify more than 85% of at-risk students. The following evaluation is calculated on the average metric score on all the mentioned test datasets.
Additionally, different sources of data; assessment stream, demographics, and clickstream, are compared using the GRU-based model. As illustrated in Figure 5, with more stream data applied, the model can identify at-risk students more accurately. Because assessment and click information is sparse in the early stage of courses and the generated less relevant stream data causes noise in the model in the Prediction Module, models using them perform much poorer than the model that only uses demographics before the 15th week. After 15 weeks, models that applied assessment data outperform the use click data because assessment performances are more related to students’ outcomes.

4.3. Implication of Results

This research intended to identify participants at risk of failure in VLEs at the early stages. We compared different deep time series models in predicting students’ performances based on their click behavior and assessment history with the VLE. Experimental results showed that the most complicated LSTM-based model achieved a worse predictive performance than simple RNN-based and GRU-based models, especially in the early stages, meaning excessive long-term dependencies were less useful in predicting students’ outcome. Those two models also converged quickly and required fewer memory resources than the LSTM-based model. Our predictive method enables some online learning platforms to use historical interaction data to classify the student at risk of failure for all ongoing courses. It can achieve better accuracy and recall scores as courses go on. These predictions assist the administrative authorities, the educational community, and teachers to help at-risk participants as early as possible, helping them pass the course in the end.

5. Conclusions and Future Work

Students’ demographics feature and their time-series logs are both valuable information sources for at-risk student identification. Existing studies have applied various traditional machine learning models and deep learning techniques and achieved promising results in prediction. However, they failed to use historic course information for current course prediction. In this study, we regard this problem as a sequential format and propose a novel joint neural network by combining sequential features with statistic features. Experimental results show that the proposed method makes great use of assessment and click stream data, and achieves great performance when identifying at-risk students.
In the future, a unified time-varying deep neural network model is an interesting research direction to eliminate the combination of two different models.

Author Contributions

Conceptualization, B.J., C.H., S.L. and G.Z.; Data curation, Y.H., R.C. and X.L.; Funding acquisition, B.J., C.H., S.L. and G.Z.; Investigation, C.H., S.L. and G.Z.; Methodology, B.J., Y.H. and R.C.; Project administration, B.J.; Resources, C.H., S.L. and G.Z.; Software, Y.H.; Visualization, Y.H. and X.L.; Writing—original draft, Y.H., R.C. and X.L.; Writing—review and Editing, B.J. All authors have read and agreed to the published version of the manuscript.

Funding

This research was funded by the National Natural Science Foundation of China (Grant No. 61907025, 61807020, 61702278), the Natural Science Foundation of Jiangsu Higher Education Institutions of China (Grant No. 19KJB520048), Six Talent Peaks Project in Jiangsu Province (Grant No. JY-032).

Acknowledgments

The authors would like to thank all the anonymous reviewers for their valuable suggestions to improve this work. The authors would also like to thank the Open University in UK to provide the OULAD dataset.

Conflicts of Interest

The authors declare no conflict of interest.

References

  1. Karimi, H.; Huang, J.; Derr, T. A Deep Model for Predicting Online Course Performance. Cse. Msu. Educ. 2014, 192, 302. [Google Scholar]
  2. Silveira, P.D.N.; Cury, D.; Menezes, C.; dos Santos, O.L. Analysis of classifiers in a predictive model of academic success or failure for institutional and trace data. In Proceedings of the 2019 IEEE Frontiers in Education Conference (FIE), Covington, KY, USA, 16–19 October 2019; pp. 1–8. [Google Scholar]
  3. Jiang, S.; Kotzias, D. Assessing the use of social media in massive open online courses. arXiv 2016, arXiv:1608.05668. [Google Scholar]
  4. Li, W.; Gao, M.; Li, H.; Xiong, Q.; Wen, J.; Wu, Z. Dropout prediction in MOOCs using behavior features and multi-view semi-supervised learning. In Proceedings of the 2016 International Joint Conference on Neural Networks (IJCNN), Vancouver, BC, Canada, 24–29 July 2016; pp. 3130–3137. [Google Scholar]
  5. Tan, M.; Shao, P. Prediction of student dropout in e-Learning program through the use of machine learning method. Int. J. Emerg. Technol. Learn. 2015, 10, 11–17. [Google Scholar] [CrossRef]
  6. Kaur, G.; Singh, W. Prediction of student performance using weka tool. Int. J. Eng. Sci. 2016, 17, 8–16. [Google Scholar]
  7. May, M.; Iksal, S.; Usener, C.A. The side effect of learning analytics: An empirical study on e-learning technologies and user privacy. In Communications in Computer and Information Science, Proceedings of the International Conference on Computer Supported Education, Rome, Italy, 21–23 April 2016; Springer: Cham, Switzerland, 2016; pp. 279–295. [Google Scholar]
  8. Cup, K. KDD Cup 2015: Predicting Dropouts in MOOC; Beijing, China. 2015. Available online: http://www.onlinejournal.in (accessed on 5 October 2020).
  9. Bharara, S.; Sabitha, S.; Bansal, A. Application of learning analytics using clustering data Mining for Students’ disposition analysis. Educ. Inf. Technol. 2018, 23, 957–984. [Google Scholar] [CrossRef]
  10. Wang, X.; Yang, D.; Wen, M.; Koedinger, K.; Rosé, C.P. Investigating How Student’s Cognitive Behavior in MOOC Discussion Forums Affect Learning Gains. Presented at the International Educational Data Mining Society, Madrid, Spain, 26–29 June 2015. [Google Scholar]
  11. Shridharan, M.; Willingham, A.; Spencer, J.; Yang, T.Y.; Brinton, C. Predictive learning analytics for video-watching behavior in MOOCs. In Proceedings of the 2018 52nd Annual Conference on Information Sciences and Systems (CISS), Princeton, NJ, USA, 21–23 March 2018; pp. 1–6. [Google Scholar]
  12. Kuzilek, J.; Hlosta, M.; Zdrahal, Z. Open university learning analytics dataset. Sci. Data 2017, 4, 170171. [Google Scholar] [CrossRef] [PubMed] [Green Version]
  13. Hlioui, F.; Aloui, N.; Gargouri, F. Withdrawal Prediction Framework in Virtual Learning Environment. Int. J. Serv. Sci. Manag. Eng. Technol. 2020, 11, 47–64. [Google Scholar]
  14. Fayyad, U.; Piatetsky-Shapiro, G.; Smyth, P. From data mining to knowledge discovery in databases. AI Mag. 1996, 17, 37. [Google Scholar]
  15. Injadat, M.; Salo, F.; Nassif, A.B.; Essex, A.; Shami, A. Bayesian optimization with machine learning algorithms towards anomaly detection. In Proceedings of the 2018 IEEE Global Communications Conference (GLOBECOM), Abu Dhabi, UAE, 9–13 December 2018; pp. 1–6. [Google Scholar]
  16. Yang, L.; Moubayed, A.; Hamieh, I.; Shami, A. Tree-based intelligent intrusion detection system in internet of vehicles. In Proceedings of the 2019 IEEE Global Communications Conference (GLOBECOM), Waikoloa, HI, USA, 9–13 December 2019; pp. 1–6. [Google Scholar]
  17. Moubayed, A.; Injadat, M.; Shami, A.; Lutfiyya, H. Dns typo-squatting domain detection: A data analytics & machine learning based approach. In Proceedings of the 2018 IEEE Global Communications Conference (GLOBECOM), Abu Dhabi, UAE, 9–13 December 2018; pp. 1–7. [Google Scholar]
  18. Peña-Ayala, A. Educational data mining: A survey and a data mining-based analysis of recent works. Expert Syst. Appl. 2014, 41, 1432–1462. [Google Scholar] [CrossRef]
  19. Romero, C.; Ventura, S. Educational data mining: A survey from 1995 to 2005. Expert Syst. Appl. 2007, 33, 135–146. [Google Scholar] [CrossRef]
  20. Romero, C.; Ventura, S. Educational data mining: A review of the state of the art. IEEE Trans. Syst. Man Cybern. Part C Appl. Rev. 2010, 40, 601–618. [Google Scholar] [CrossRef]
  21. Perera, D.; Kay, J.; Koprinska, I.; Yacef, K.; Zaïane, O.R. Clustering and sequential pattern mining of online collaborative learning data. IEEE Trans. Knowl. Data Eng. 2008, 21, 759–772. [Google Scholar] [CrossRef] [Green Version]
  22. Gaudioso, E.; Montero, M.; Talavera, L.; Hernandez-del Olmo, F. Supporting teachers in collaborative student modeling: A framework and an implementation. Expert Syst. Appl. 2009, 36, 2260–2265. [Google Scholar] [CrossRef] [Green Version]
  23. Cambruzzi, W.L.; Rigo, S.J.; Barbosa, J.L. Dropout prediction and reduction in distance education courses with the learning analytics multitrail approach. J. UCS 2015, 21, 23–47. [Google Scholar]
  24. Lykourentzou, I.; Giannoukos, I.; Nikolopoulos, V.; Mpardis, G.; Loumos, V. Dropout prediction in e-learning courses through the combination of machine learning techniques. Comput. Educ. 2009, 53, 950–965. [Google Scholar] [CrossRef]
  25. Márquez-Vera, C.; Cano, A.; Romero, C.; Noaman, A.Y.M.; Mousa Fardoun, H.; Ventura, S. Early dropout prediction using data mining: A case study with high school students. Expert Syst. 2016, 33, 107–124. [Google Scholar] [CrossRef]
  26. Helal, S.; Li, J.; Liu, L.; Ebrahimie, E.; Dawson, S.; Murray, D.J.; Long, Q. Predicting academic performance by considering student heterogeneity. Knowl. Based Syst. 2018, 161, 134–146. [Google Scholar] [CrossRef]
  27. Ben-Zadok, G.; Hershkovitz, A.; Mintz, E.; Nachmias, R. Examining online learning processes based on log files analysis: A case study. In Proceedings of the 5th International Conference on Multimedia and ICT in Education (m-ICTE’09), Lisbon, Portugal, 22–24 April 2009. [Google Scholar]
  28. Sabourin, J.L.; Mott, B.W.; Lester, J.C. Early Prediction of Student Self-Regulation Strategies by Combining Multiple Models. Presented at the International Educational Data Mining Society, Chania, Greece, 19–21 June 2012. [Google Scholar]
  29. Wasif, M.; Waheed, H.; Aljohani, N.; Hassan, S.U. Understanding Student Learning Behavior and Predicting Their Performance. In Cognitive Computing in Technology-Enhanced Learning; IGI Global: Hershey, PN, USA, 2019; pp. 1–28. [Google Scholar] [CrossRef]
  30. Costa, E.B.; Fonseca, B.; Santana, M.A.; de Arajo, F.F.; Rego, J. Evaluating the Effectiveness of Educational Data Mining Techniques for Early Prediction of Students’ Academic Failure in Introductory Programming Courses. Comput. Hum. Behav. 2017, 73, 247–256. [Google Scholar] [CrossRef]
  31. Yi, J.C.; Kang-Yi, C.D.; Burton, F.; Chen, H.D. Predictive analytics approach to improve and sustain college students’ non-cognitive skills and their educational outcome. Sustainability 2018, 10, 4012. [Google Scholar] [CrossRef] [Green Version]
  32. Wilson, J.; Olinghouse, N.G.; McCoach, D.B.; Santangelo, T.; Andrada, G.N. Comparing the accuracy of different scoring methods for identifying sixth graders at risk of failing a state writing assessment. Assess. Writ. 2016, 27, 11–23. [Google Scholar] [CrossRef]
  33. Marbouti, F.; Diefes-Dux, H.A.; Madhavan, K. Models for early prediction of at-risk students in a course using standards-based grading. Comput. Educ. 2016, 103, 1–15. [Google Scholar] [CrossRef] [Green Version]
  34. Aljohani, N.R.; Fayoumi, A.; Hassan, S.U. Predicting at-risk students using clickstream data in the virtual learning environment. Sustainability 2019, 11, 7238. [Google Scholar] [CrossRef] [Green Version]
  35. Karimi, H.; Derr, T.; Huang, J.; Tang, J. Online Academic Course Performance Prediction using Relational Graph Convolutional Neural Network. In Proceedings of the 13th International Conference on Educational Data Mining (EDM 2020), Fully Virtual Conference, 10–13 July 2020. [Google Scholar]
  36. Kingma, D.P.; Ba, J. Adam: A method for stochastic optimization. arXiv 2014, arXiv:1412.6980. [Google Scholar]
Figure 1. The distribution of virtual learning environment (VLE) click sum and weighted assessment score for students, click sum means the total number of clicks on VLE per students. (a): The VLE click sum and weighted assessment score for students who failed the course; (b): the VLE click sum and weighted assessment score for students who passed the course.
Information 11 00474 g001
Figure 2. Overview of the proposed approach.
Information 11 00474 g002
Figure 3. Averaged prediction results over all courses for all weeks. (a): Averaged testing accuracy for all models across weeks; (b): averaged loss value of all models across 250 epochs.
Information 11 00474 g003
Figure 4. Averaged week-wise testing metric. (a): Averaged precision score of compared models across weeks; (b): averaged recall score of compared models across weeks.
Information 11 00474 g004
Figure 5. Comparison between models across different data sources.
Information 11 00474 g005
Table 1. Summary of the dataset.
Code ModuleTrain/Validation DataTest Data
AAA2013J2014J
BBB2013B2013J
2013B, 2013J2014B
2013B, 2013J, 2014B2014J
CCC2014B2014J
DDD2013B2013J
2013B, 2013J2014B
2013B, 2013J, 2014B2014J
EEE2013J2014B
2013J, 2014B2014J
FFF2013B2013J
2013B, 2013J2014B
2013B, 2013J, 2014B2014J
GGG2013J2014B
2013J, 2014B2014J

