Article

WebPGA: An Educational Technology That Supports Learning by Reviewing Paper-Based Programming Assessments

1
School of Computing and Augmented Intelligence, Arizona State University, Tempe, AZ 85281, USA
2
Department of Computer Science and Engineering, Santa Clara University, Santa Clara, CA 95053, USA
*
Author to whom correspondence should be addressed.
Information 2021, 12(11), 450; https://doi.org/10.3390/info12110450
Submission received: 27 September 2021 / Revised: 28 October 2021 / Accepted: 28 October 2021 / Published: 29 October 2021
(This article belongs to the Special Issue Artificial Intelligence Applications for Education)

Abstract

:
Providing feedback to students is one of the most effective ways to enhance their learning. With the advancement of technology, many tools have been developed to provide personalized feedback. However, these systems are only beneficial when interactions are done on digital platforms. As paper-based assessment is still a dominantly preferred evaluation method, particularly in large blended-instruction classes, the sole use of electronic educational systems presents a gap between how students learn the subject from the physical and digital world. This has motivated the design and the development of a new educational technology that facilitates the digitization, grading, and distribution of paper-based assessments to support blended-instruction classes. With the aid of this technology, different learning analytics can be readily captured. A retrospective analysis was conducted to understand the students’ behaviors in an Object-Oriented Programming and Data Structures class from a public university. Their behavioral differences and the associated learning impacts were analyzed by leveraging their digital footprints. Results showed that students made significant efforts in reviewing their examinations. Notably, the high-achieving and the improving students spent more time reviewing their mistakes and started doing so as soon as the assessment became available. Finally, when students were guided in the reviewing process, they were able to identify items where they had misconceptions.

1. Introduction

In today’s blended learning environments, paper-based examination is still one of the most popular methods for assessing students’ performance. Despite a wide range of computer-based approaches to conducting examinations, the traditional paper-based method still appeals to the teachers due to its flexibility and simplicity. It gives them a straightforward way to manage their class due to the required physical presence. For example, academic dishonesty could be deterred through in-person proctoring. However, the same conventional class management method also presents a challenge. Grading many papers can be time-consuming. It also requires significant effort to generate meaningful and personalized feedback to students while ensuring consistency within and between the graders. Most importantly, with the trend of gradually shifting towards technologically enhanced classrooms, such as smart classrooms or online streaming classes, the traditional blended classes necessitate an upgrade.
We have started seeing the proliferation of educational technologies that integrate physical and digital learning activities. These systems, such as clickers [1] and multi-touch tabletops [2], paved the way for advanced learning analytics. However, support for personalized learning in these environments is still limited. Therefore, in this study, a web application called Web-based Programming Grading Assistant (WebPGA) was developed to capture and connect multimodal learning analytics from the physical and digital spaces in programming learning. It digitizes paper-based artifacts, such as quizzes and examinations, and provides interfaces for grading and feedback delivery at scale. The system enables students to manage their learning by consolidating assessment content, feedback, and learning outcome. WebPGA also allows us to understand better the students’ behaviors in a blended class. Thus, the focus of this study is to investigate the impacts of the technology on students’ learning.
This paper aims to answer the following research questions: RQ1: In terms of monitoring and reviewing, are there any behavioral differences between high-achieving and low-achieving students? RQ2: Are there any differences in the behavior of students when grouped according to performance trajectories (i.e., whether the student’s score in a subsequent examination improved relative to a prior one)? RQ3: What reviewing behaviors are associated with learning? RQ4: How does personalized guidance affect the behavior of students when reviewing?
The organization of this paper is as follows. Section 2 discusses the role of assessments in higher education, the importance of feedback in programming learning, the emergence of behavioral analytics, and how personalization can be leveraged in educational systems. Section 3 describes in detail the design of the research platform. Section 4 provides an overview of the study design and the data collection process. Finally, Section 5 presents the findings and discussions.

2. Literature Review

2.1. Assessments in Higher Education

Assessments play an important role in learning in higher education. It is a process where data about students are collected to identify their strengths and uncover their weaknesses [3]. It also is a tool used to evaluate the effectiveness of the teacher’s instructional strategies.
Two of the commonly used types of assessments are formative and summative assessments. Formative assessments are low-stakes and typically not graded assessments that provide students feedback on their current performance (e.g., practice quizzes). They enable students to diagnose and monitor their deficiencies, leading to improved learning. However, for it to be effective, students should be able to see the gap between their current ability and one that is expected of them and close it [4]. On the other hand, summative assessments are high-stakes assessments (i.e., graded) that aim to evaluate students’ learning. These two types are viewed as assessment for learning and assessment of learning, respectively. A third view is assessment as learning which promotes students to reflect on their work and be metacognitively aware. Activities could be in the form of self or peer assessment which leads them to identify the next step in learning. Prior definitions, however, did not explain what happens to the assessment, per se. It was only recently given an updated definition: “assessments that necessarily generate learning opportunities for students through their active engagement in seeking, interrelating, and using evidence.” [5]. This highlights the importance of the active role of the student in the process.

2.2. Role of Feedback in Learning

A student’s academic achievement is affected by several factors, such as learning experience, feedback, teaching style, and motivation. Some of these are more influential than others. Additionally, many of these are not easily quantifiable. Several papers have highlighted the importance of feedback and what constitutes an effective one. The timing of when it is delivered is also essential [6,7]. The sooner students receive their feedback, the more they can reflect on their learning. Moreover, the availability of immediate self-corrective feedback leads to an increase in the efficiency in reviewing examinations [8]. Students benefit more from feedback when assigned to individual components (e.g., rubrics), compared to just showing the overall score [7]. This would allow them to identify their misconceptions quickly. Furthermore, it was found that content feedback had significantly better learning effects than progress feedback [9]. The mere provision of feedback, however, does not guarantee an improvement in students’ learning. The student must take an active role in this process, essentially a shift from the feedback as telling mentality. [10] proposed a framework that could help develop student feedback literacy.

2.3. Technology Support in Feedback Generation

Automated grading of assessment is one of the most popular methods employed to generate and deliver feedback at scale. It guarantees the timely release of feedback to students at a lower cost. Such a method has been widely used in several educational fields, such as programming, physics, and mathematics. Examples of these systems include WEB-CAT [11] and ASSYST [12]. Usually, pattern-matching techniques are used to assess the correctness of the student’s work. This is done by performing unit tests and comparing the student’s work to an ideal solution. This approach has some drawbacks. In programming learning, the logic and the reasoning of students are being overlooked by the system as it only focuses on the concrete aspects of the solution. As a result, teachers spend extra time reviewing the student’s work after an auto-grader has evaluated it to provide personalized and better feedback. One proposed solution to address this is to crowd-source code solution, which will then be suggested to students [13]. Another approach suggests using student cohorts to provide peer feedback [14,15]. Lastly, parameterized exercises can be used to create a sizable collection of questions to facilitate automatic programming evaluation [16].
The various feedback generation techniques discussed previously are focused on evaluating digital artifacts. Less is discussed in the context of paper-based programming problems, which can be addressed by digitization. This approach provides several advantages (e.g., some default feedback can be kept on the digital pages with the predefined rubrics; submissions can be anonymized to eliminate any grader’s biases). It is worth noting that there have been some relevant innovations that attempt to address this problem, such as [17].

2.4. Behavioral Analytics in Programming Learning

Several studies have explored student modeling. Mostly, intelligent tutors and adaptive educational systems heavily rely on these student models. Student learning is typically estimated using behavior logs. In programming learning, several parameters have been used to estimate students’ knowledge of coding. One approach uses the sequence of success when solving programming problems [18]. Another approach considers the progression of the student on programming assignments [19]. Some other approaches include: how students seek programming information [20], compilation behavior when doing assignments [21], troubleshooting and testing behaviors [22], dialogue structures [23], using snapshot of a code while solving programming problems [24].

2.5. Personalized Guidance in Learning

Personalized guidance refers to a group of techniques that provide learners with a straightforward path for learning. This often requires modeling the learning content (domain) and the learning process (interactions with the system), particularly in intelligent educational systems. This allows for material to be presented to learners in a personalized sequence [25]. Additionally, it enables the learning process to be adapted so it can scaffold the learning activity [26]. Changing the link appearances on the learning resources to be able to guide students to the most appropriate and relevant ones (also known as Adaptive Hypermedia) is one of the common techniques in personalized guidance [27]. This leads to better results and higher satisfaction from learners as it helps them reach the right question at the right time. In the context of self-assessment, this increases the likelihood of students to answer a question correctly [16,28]. This heavily relies on the interaction between the artificial intelligence of the system and the intelligence of the student. The adaptive navigation support method has been used in the social learning context. For example, a system that has open social student model interfaces used greedy sequencing techniques to improve students’ level of knowledge [29]. It led to an increase in the speed of learning of strong students. It also improved the performance of students. It should be noted that the mere presence of personalized guidance in a system may not be enough to provide a learning impact. It always depends on whether students choose to follow the guidance or not [30].

3. Web-based Programming Grading Assistant (WebPGA)

WebPGA was developed to connect the physical and the digital learning spaces in programming learning. It is an improvement of PGA [31], a system that allows the grading of paper-based programming assessments using smartphones. The goal is to facilitate the digitization, grading, and distribution of paper-based assessments in a blended learning environment. Furthermore, it aims to capture the different actions performed by its users.
There are three types of users, namely: teachers, graders, and students. This section discusses in detail the pedagogical foundations and technical implementation of WebPGA. The system is divided into two components, namely the grading interface and the reviewing interface.

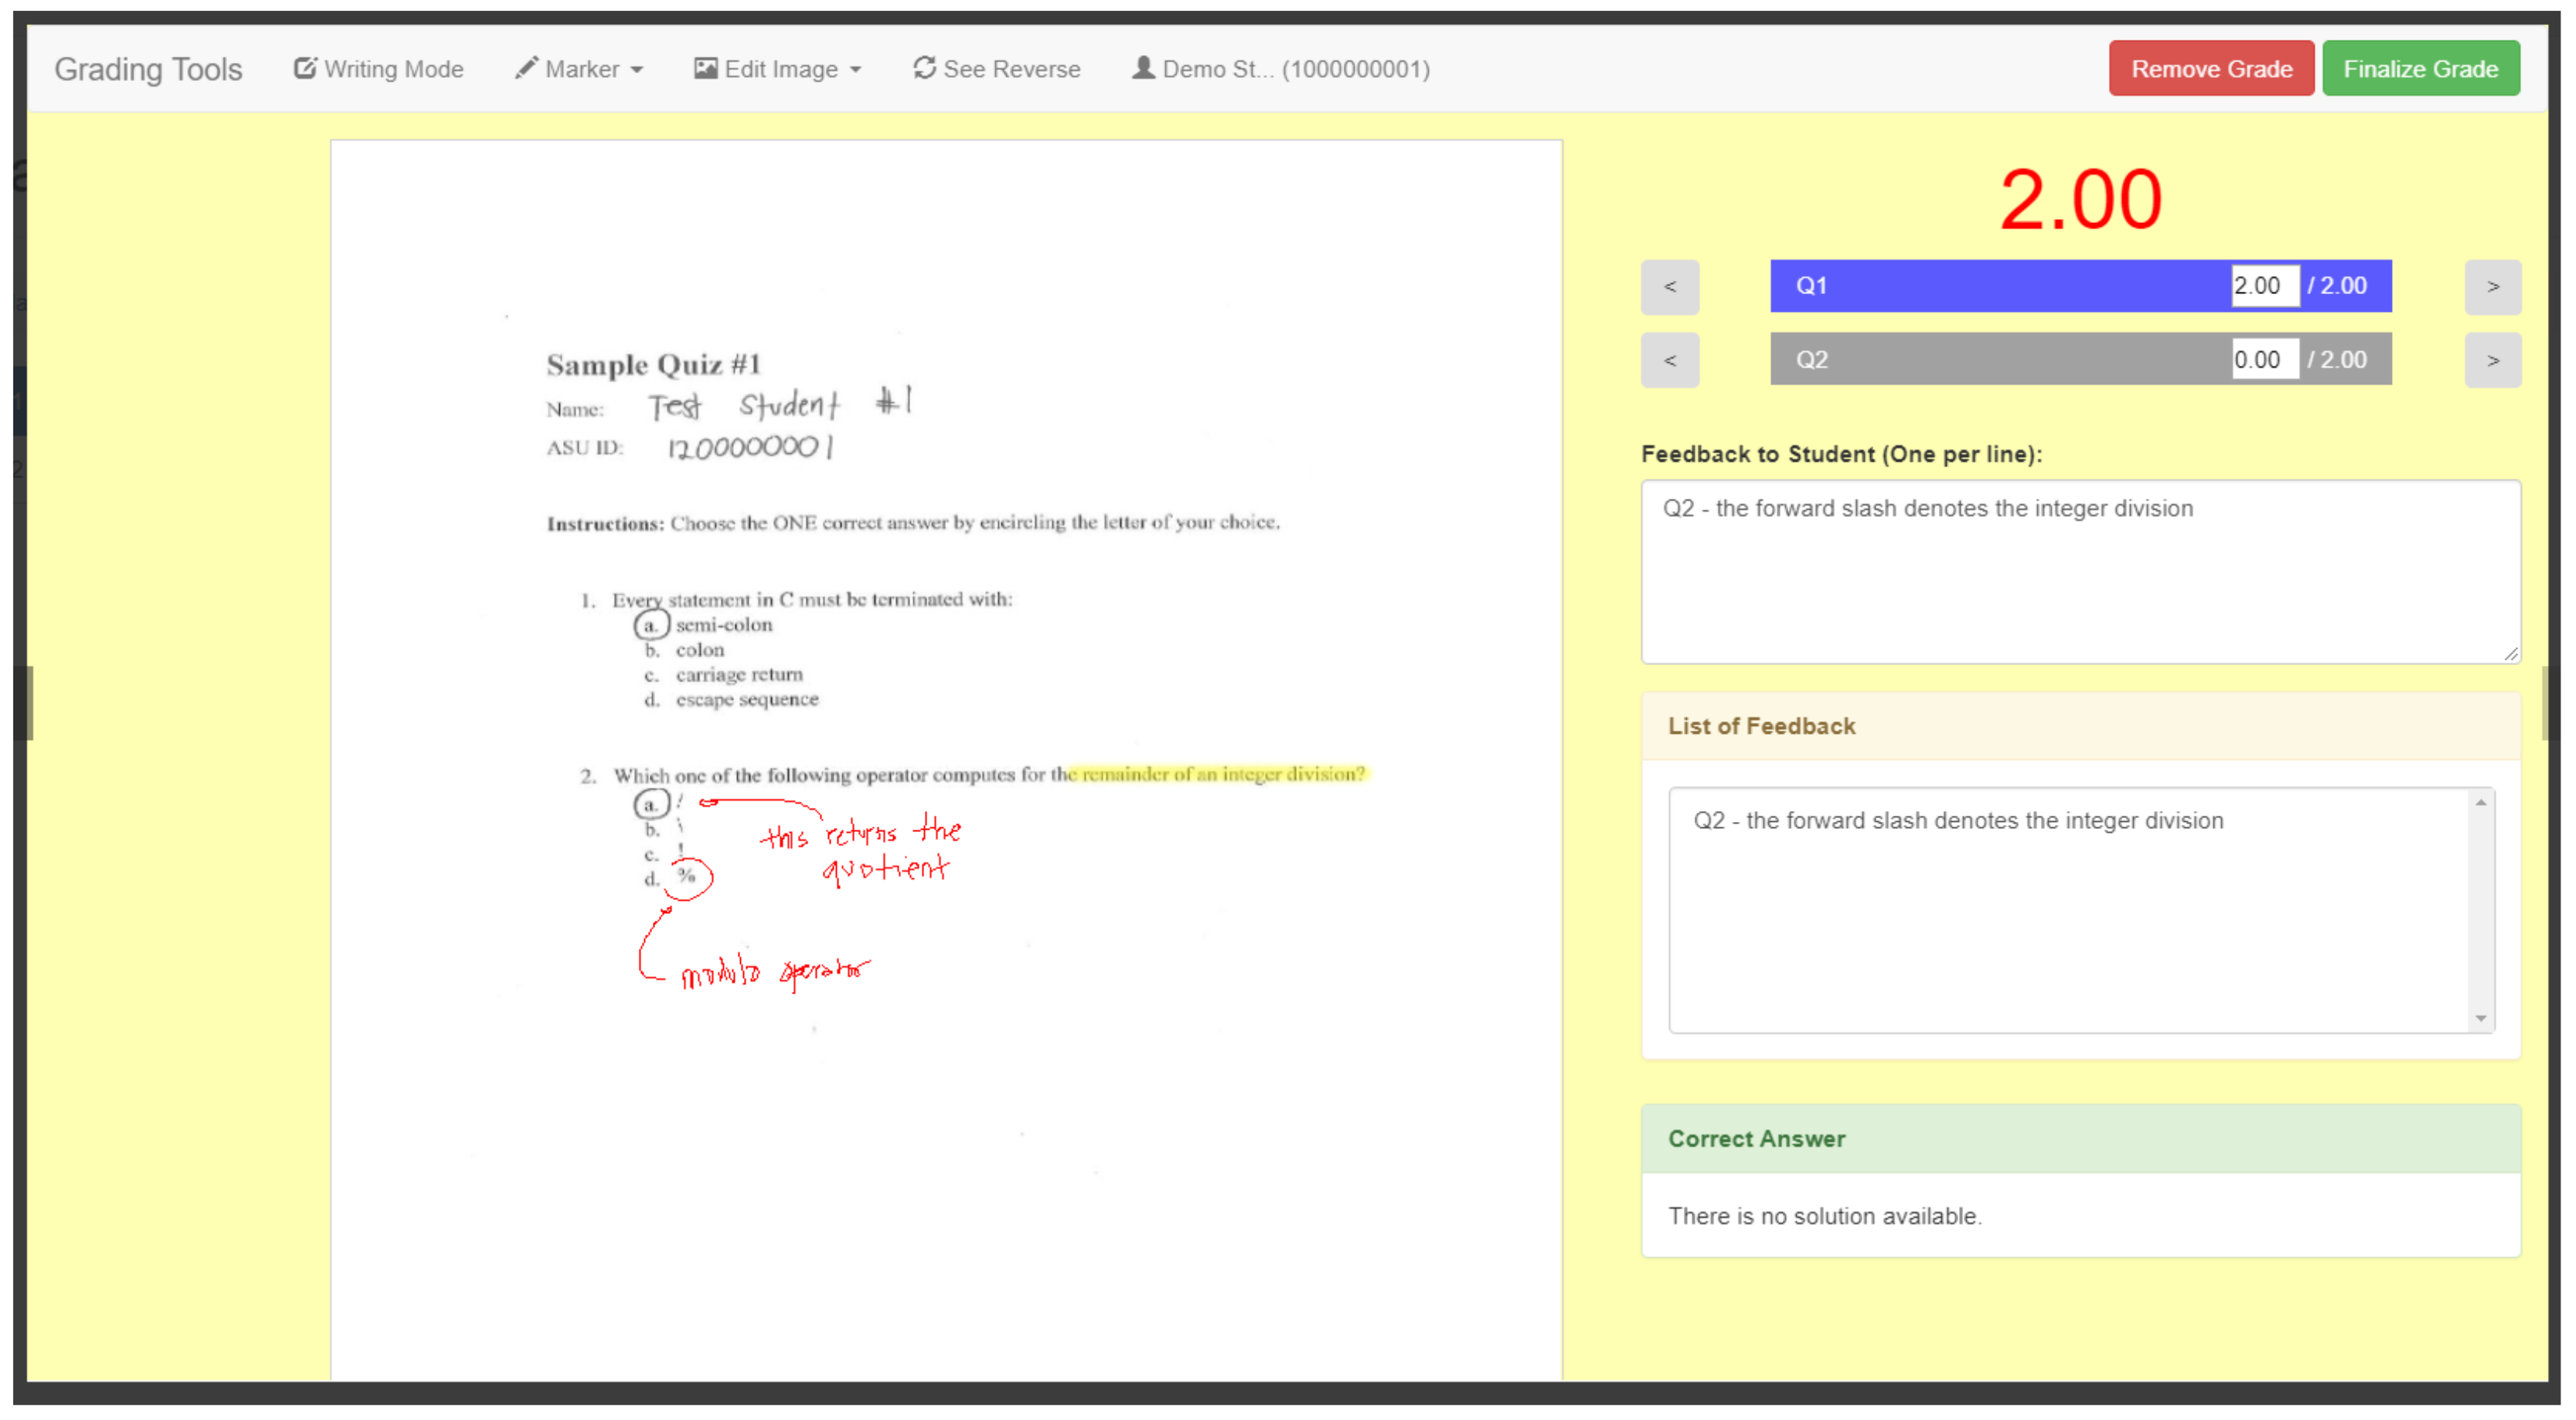
3.1. Grading Interface

Teachers and graders use the system to grade paper-based assessments and to provide their feedback. They upload the scanned images of the examination papers to the system. The features discussed in this section represent different forms of feedback that can be provided to students. Figure 1 illustrates the grading interface where teachers and graders mainly interact.

3.1.1. Image Annotation

The left panel illustrates the scanned image of the student’s paper. Using the provided markers (red or yellow), graders can write directly on top of the image. In [32], such annotations are considered useful feedback to students. In certain instances, this approach is even more convenient than typing in free-form text boxes.

3.1.2. Grading Rubrics

The right panel provides a detailed breakdown of the score obtained by the student. The top compartment displays the overall score. It is followed by a list of rubrics used to assess the work of the student as it is critical that students are informed how their work was evaluated and what was expected of them [33]. Ideally, these rubrics are associated with the knowledge components that are being evaluated in a question. This makes it easier for students to identify their misconceptions [7]. A color-coding scheme was employed to distinguish which concepts the students are struggling with easily. The color blue indicates a complete understanding, red indicates partial understanding, and gray represents a misconception.

3.1.3. Free-Form Feedback

Rubrics alone are not enough forms of feedback. In fact, formative feedback is preferred as it contributes to learning than on correctness alone [6]. Therefore, a text box was provided to allow graders to provide free-form feedback to students. This could be a justification of a deduction or a suggestion on how to improve the answer. In large classes, there is a tendency for graders to become inconsistent in the feedback they give. The system stores all the feedback given by all graders for a particular question to address this issue. These are then listed in the list box below. The feedback is arranged according to their frequency (most used to least used). Such approach was recommended in [33].

3.2. Reviewing Interface
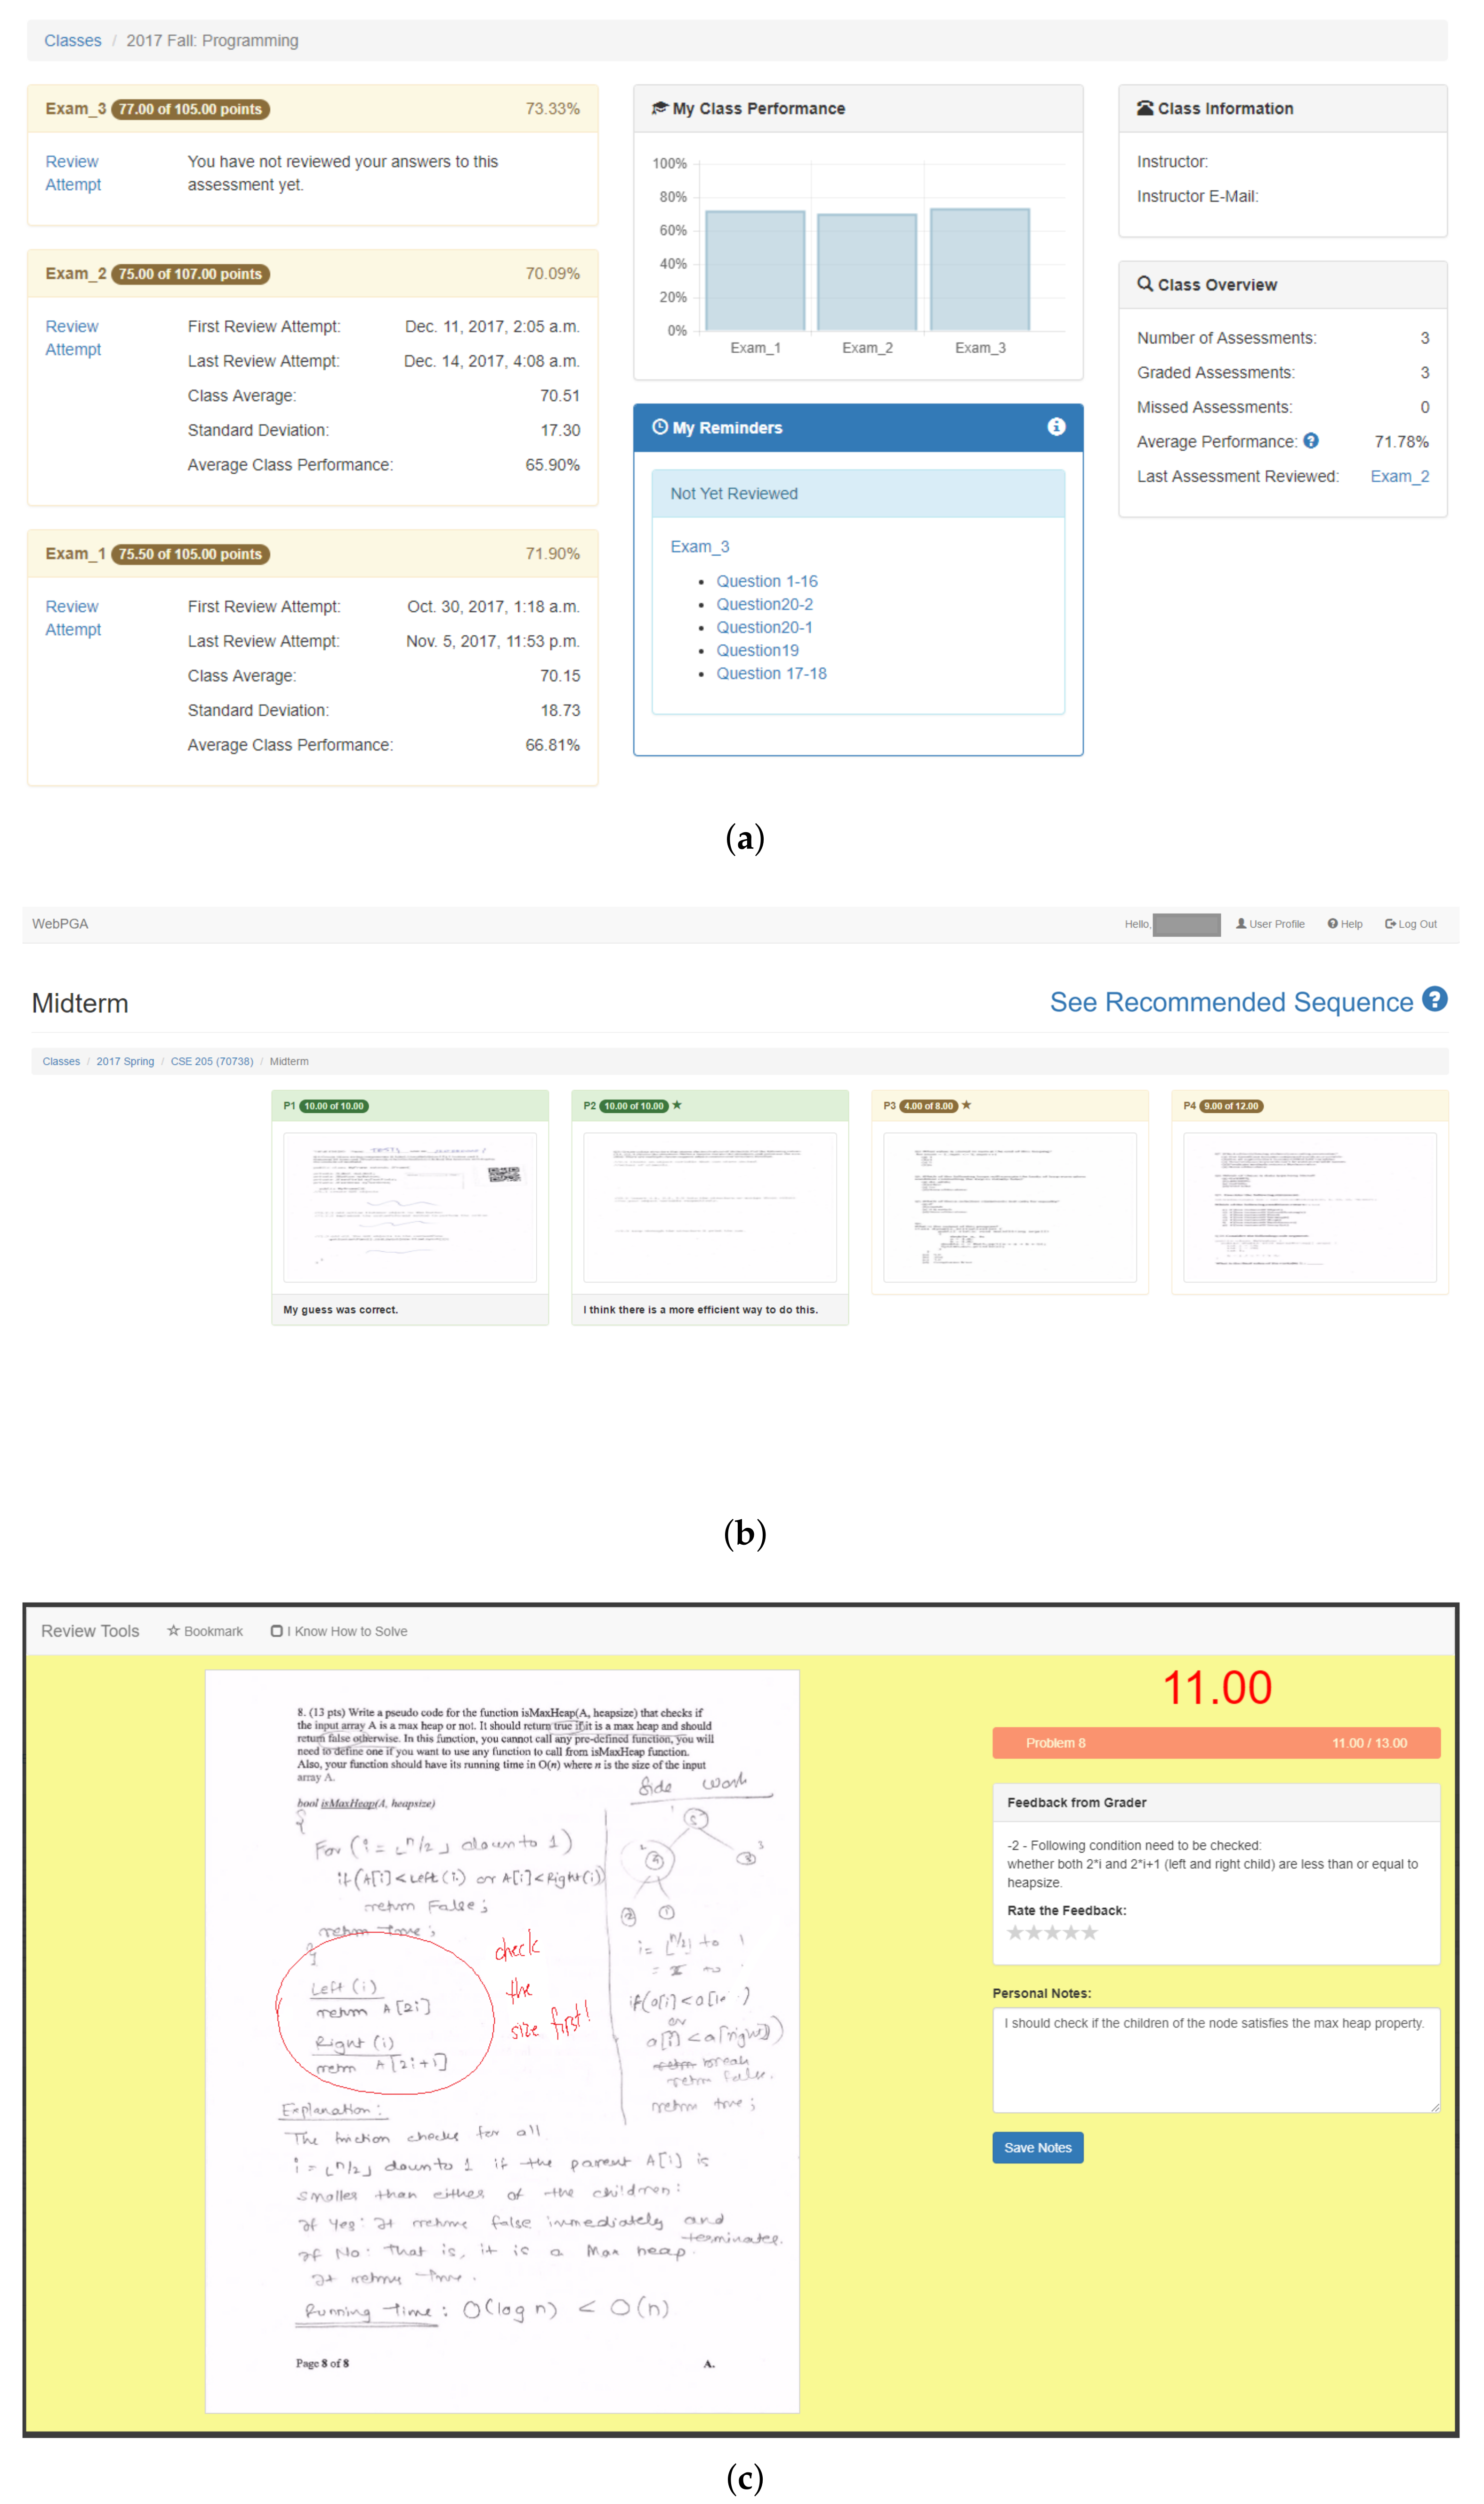
Students mainly benefit from using the system as the delivery of feedback (both summative and formative) becomes more efficient. This allows them to view their scores once they are made available conveniently. Figure 2a–c illustrate the different interfaces students interact with. These various levels uncover students’ reviewing behaviors, particularly whether they simply looked at their scores or read the feedback–a probable action in the system [34]. Such granularity allows for us to distinguish how students appreciate the varying feedback provided to them by the system.

3.2.1. Dashboard

The dashboard (Figure 2a) provides students an overview of their class performance. The left panel lists all the assessments that can be reviewed. It includes information such as the scores, the first and the latest reviews, if applicable. The assessments are arranged in a reversed chronological order. A color-coding scheme was used to highlight the importance of an assessment. The assessment panel is colored in green if the student had a perfect score. Otherwise, it is colored yellow. If the assessment is not for credit, it is colored in blue. When students click on a particular assessment to review, they are redirected to the assessment overview. The middle panel provides students with a bar chart that visualizes how they are performing in class. Below it is a personalized reminder panel which will be discussed in detail later. Lastly, the right panel provides administrative information about the class along with their performance.

3.2.2. Assessment Overview

In the assessment overview (Figure 2b), all the questions for a particular assessment are listed along with the scores obtained and personal notes made by the student. A color-coding scheme was used to make the presentation meaningful. Green means the student obtained full credit, yellow means the student obtained partial credits, and red means the student did not obtain any credit. The questions are arranged according to how they were ordered in their physical counterparts. However, students can follow the system’s personalized recommended sequence (which will be discussed later) by clicking on the “See Recommended Sequence” link in the upper right portion. When students click on a particular question thumbnail to review, they are redirected to the question overview.

3.2.3. Question Overview

In the question overview (Figure 2c), more details about the question are provided to the students. The background color of this page follows the color used in the thumbnail in the assessment overview (green, yellow, or red). The left panel illustrates the image of the answer, including any annotations made by the graders. The right panel provides the overall score for the question, the rubrics and the different scores obtained. This follows the color-coding scheme discussed in Section 3.1.2. It then shows the free-form feedback given by the grader and a 5-point Likert scale to rate their perceived quality of the feedback they received. The system records the amount of time spent by the student while in this view.
Three forms of reflection prompts were incorporated: (a) star bookmark to note the importance of or the need to reference a question in the future; (b) checkbox to express explicitly their ability to solve the problem; and (c) free-form text area where they can type elaborated notes. Such features can encourage students to do self-learning on their answers and self-reflect on their reasoning processes that could lead to a deep learning experience [35]. Such collections of bookmarks, checkboxes, and notes enable students to be more metacognitively aware of their subject matter knowledge as this captures what they have learned [36].

3.2.4. Personalization

One of the system’s design goals is to provide some interventions to help students who are falling behind in class. One issue in online learning systems (e.g., learning management systems) is the tendency of feedback to be spatially separated which hinders students from synthesizing them [37]. This could be addressed by providing personalized prompts in the system, particularly in the student dashboard and the assessment overview. Students are given personalized, actionable reminders that list all assessments or questions that have not been reviewed (the lower component of the middle panel in Figure 2a). The order of the items in the list is determined using Algorithm 1 which was designed based on prior studies [38,39]. The system assigns a higher importance to questions where the student made more mistakes (i.e., the student must review it first). From the list, if the student clicks on the name of an assessment, they are redirected to the assessment overview (Figure 2b) but with the questions arranged using Algorithm 2. On the other hand, if the student clicks on a specific question, they are redirected to the question overview (Figure 2c).
Algorithm 1 Assessment and Question Listing in the Reminders Panel
1:
procedureGetAssessmentsAndQuestions(S)
2:
    for each  A assessments of student S do
3:
        Q: = list of questions from A which are not yet reviewed
4:
        
5:
        for each  q Q do
6:
           q.normalized: = q.raw_score_of_student / q.points_worth
7:
           
8:
           if q.normalized = 1 then
9:
               Remove q from Q
10:
        
11:
        if Q.isEmpty() then continue
12:
        // Just in case there is a tie, use the next criteria
13:
        Sort Q by q.normalized in ascending, q.points_worth in descending
14:
    
15:
    // Display the latest assessment on top
16:
    Sort all assessments according to assessment_date in descending
Algorithm 2 Recommended Sequence
1:
procedureGetRecommendedSequence(A)
2:
    Q: = questions from assessment A
3:
    
4:
    for each  q Q do
5:
        q.normalized: = q.raw_score_of_student / q.points_worth
6:
    
7:
    // Just in case there is a tie, use the next criteria
8:
    Sort Q by q.normalized in ascending, q.points_worth in descending

4. Methods

To investigate the effectiveness of the educational platform, we retrospectively analyzed the reviewing behaviors of students by looking at their review actions. These are the instances where students interacted with the different views in the reviewing interface, as discussed earlier.

4.1. Data Collection

The system data from an Object-Oriented Programming and Data Structures class offered during the Spring 2018 semester in a public university were collected. This 200-level course is the second programming class taken by Computer Science major students. The class was chosen since its instructor signified interest and volunteered to use the system, mainly to facilitate the grading process. This class had a total of 3 examinations and 14 quizzes (five are for credit, and nine are non-credit). There were 187 students enrolled, but only 157 (83.96%) were included in the analysis as those who dropped the course in the middle of the semester, did not take the three examinations, or did not use the system had to be removed.

4.2. Data Processing

Students were labeled and grouped in three different ways to understand how their monitoring and reviewing behaviors affect their learning. The breakdown is summarized in Table 1. First, they were grouped according to their overall academic performance. Secondly, they were grouped according to their performance trajectory in a given period. Finally, they were grouped according to whether they were guided by the system or not.

4.2.1. Overall Academic Performance

The final grades of the students were not included in the data collection. However, the examinations have the highest contribution to the final grade. Therefore, the student’s average score for the three examinations was used to determine his or her overall academic performance in place of the final grade. Using the class average ( x ¯ = 82.28 , σ = 10.83 ) as the cut-off point, students were classified either as high-achieving or low-achieving. This cut-off value closely resembles the boundary between the A and B students and the C, D, and E students as set by the instructor.

4.2.2. Performance Trajectory

The overall performance only provides a single snapshot of the student. It is interesting to look at the different changes in how the student performed throughout the semester. Therefore, the examinations were used to divide the semester into two equal periods, namely: Exam1-Exam2 and Exam2-Exam3. In a given period, the difference between the scores in the two examinations was computed. This value was referred to as delta, which represented the magnitude of improvement or dropping of the student. For that period, a student was labeled improving if the delta was positive; dropping if negative; and retaining if zero. It should be noted that a student may belong to different groups in the two periods.

4.2.3. Reviewing Behavior

Among the 21,747 student actions captured by the system, 9851 (45.30%) were review actions. These actions have their corresponding duration, which represents the amount of time a student spent reviewing. Each review action was labeled according to the score obtained by the student in the question that was reviewed. It was labeled r_correct if the student answered the question right. Otherwise, it was labeled r_mistake.

4.2.4. Personalized Guidance

The system provides a personalized suggestion to each student, particularly on how and what to review. If a student clicked an assessment or a question from the list on the reminders panel (bottom component of the middle panel in Figure 2a); or clicked on the “See Recommended Sequence” link on the assessment overview (Figure 2b), the student was labeled Guided. Otherwise, the student was labeled Not Guided.

4.3. Data Analysis

In this study, after an assessment was graded, the teacher made an announcement to inform students that the assessment was available for review. This announcement was made using a learning management system.
An assessment was considered reviewed if at least one of its questions was reviewed. Table 2 gives an overview of how students reviewed their examinations. This includes the average class performance, the number of students who reviewed them, and the average time it took students before they reviewed it for the first time (hereinafter referred to as reviewing delay). A downward trend can be seen for both the number of students reviewing and their reviewing delay.

5. Results and Discussion

5.1. The Learning Effects of Reviewing Behaviors

To examine the impacts of reviewing assessments on students’ learning, the efforts exerted by the high- and low-achieving students were compared and summarized in Table 3. The reviewing behaviors of the two groups were measured by (1) total number of review actions performed (review count), and (2) total time spent reviewing.

5.1.1. Impact of Assessment Types: Quizzes and Examinations

The system supports formative and summative assessments. In this class, the instructor administered three types of assessments: non-credit quizzes (used for attendance and the answers of the students are not checked), quizzes for credit (answers of the students are checked), and examinations (midterm and final). The non-credit quizzes served as a formative assessment, while the quizzes for credit and the examinations were considered summative assessments. All the review actions performed by the students were logged, regardless of the type of assessment. It is hypothesized that students would pay more attention to assessments that directly contribute to their final grades (quiz for credit and examinations). It is also hypothesized that the non-credit quizzes may affect students’ reviewing behavior since they may not have given importance to items that do not count towards their final grades. However, when the overall number of reviewing actions and the time spent of the two groups were compared, no significant difference was found. The results suggested that all students paid the same amount of attention to the graded assessments, regardless of the assessment type. It is important to note that high-achieving students have fewer mistakes to review while low-achieving students have relatively more mistakes to review. Do these students put in the same amount of effort in reviewing the right item?

5.1.2. High Achievers Focused on Reviewing Their Mistakes

To investigate further the difference of the reviewing efforts of the two groups as well as to answer RQ1, how they reviewed their graded examinations were looked into. Both groups still had a similar number of review actions performed. However, high-achieving students ( x ¯ = 8.42 minutes) spent significantly ( p < 0.05 ) lesser time reviewing all their examinations compared to low-achieving students ( x ¯ = 12.64 minutes). There are several possible explanations for this. High-achieving students would have fewer mistakes and may not have reviewed their correct answers, leading to less time on the system. It is also possible that high-achieving students already knew which items to focus on. Lastly, it is also possible that low-achieving students may have struggled to identify which questions to review and therefore spent more time. Spending more time reviewing may not necessarily be an effective strategy. A student may review several times but may not be on items that require their focus—their mistakes. To investigate this, the time spent was subdivided into two categories: on correct answers and on mistakes. Interestingly, the two groups spent a similar amount of time reviewing their correct answers. However, when reviewing mistakes, low-achieving students spent significantly more time compared to high-achieving students. This was not surprising since low achievers had more mistakes. Therefore, the review coverage for mistakes of the two groups were compared. This refers to the percentage of questions that the students actually reviewed. In this case, the percentage of their mistakes that they reviewed. Although just marginally significant ( p = 0.05 ), high-achieving students were able to review most of their mistakes compared to the low-achieving students. This would translate into an ineffective reviewing strategy for low-achieving students. They had more mistakes and did not exert enough effort to review them. This clearly exhibits a bad habit of students since they are unable to take advantage of learning from the feedback they were provided, which could help them correct any of their misconceptions. It is worth investigating in the future if such a trend becomes more pronounced with more examinations. Succeeding analyses will focus mainly on review actions on examinations.

5.1.3. Improving Students Reviewed Most of their Mistakes

The previous section looked into the main effects of the aggregated performance of the students throughout the semester. In this section, students were analyzed in a finer granularity—across examination periods. This deeper analysis allowed the dissection of the changes in students’ behavior over time and the exploration of the potential various strategies students’ employed across different examinations.
Improving students were not necessarily high achievers. The goal is to determine how students differed and what led to the improvement of their grades, essentially answering RQ2. For each group, the review coverage for both their correct answers (r_correct) and mistakes (r_mistake) were computed. This is summarized in Table 4. The retaining group was omitted because of the negligible number of students. It can be observed that on average, both groups did not review all their answers. For example, the improving students during Exam1-Exam2 period reviewed only 39% of their correct answers and 63% of their mistakes. For both periods, improving students consistently focused on reviewing most of their mistakes, demonstrated by the higher review coverage for mistakes (63% and 32%) compared to correct answers (39% and 15%). This suggests that focusing on your mistake to answer them right the next time may help in improving your grade. In the case of the dropping students, during the Exam1-Exam2 period, they also focused on reviewing their mistakes as they reviewed 64% of them. However, during the Exam2-Exam3 period, no significant difference was found in their effort in reviewing their correct answers and mistakes. It should be noted that during this period, more assessments were available for review. Interestingly, during this period, no significant difference can be seen between the strategies of the improving and the dropping students (32% and 31%, respectively). This strategy may have worked on the former group but not on the latter group. Possibly, dropping students may have overlooked their mistakes, thus were unable to take full advantage of the feedback they were given. This is an ineffective strategy and intervention strategies should be developed and applied.

5.1.4. Spending More Time Reviewing Mistakes is Associated with Improved Performance

A drop of a single point may not have a significant impact on a student’s behavior compared to a drop of 10 points. With the current grouping, there would not be any distinction between the two. Therefore, the actual values of the deltas were used instead of only the sign. These represent the magnitude of change in the performance of students in a period (magnitude). The amount of time spent by students on reviewing their mistakes was obtained (effort). For both periods, a Pearson correlation coefficient was computed to assess the relationship between the two variables. There was a significant positive correlation between the magnitude and the effort for both period ( r = 0.19 , p < 0.05 for Exam1-Exam2 and r = 0.23 , p < 0.05 for Exam2-Exam3). This means that students who improved focused on their previous mistakes.

5.1.5. Reviewing Promptly is Associated with Academic Performance

Some students attended to their graded assessments as soon as they were made available, while some waited until the last minute before the next examination. To determine the effectiveness of the reviewing strategy, students’ reviewing efficiency was examined. This was obtained by getting the average reviewing delay for all examinations reviewed by the student. A negative relationship was found ( r = 0.16 , p < 0.05 ) between their academic performance. This means that better-performing students attended and reviewed their graded examinations sooner. This initiative and motivation are among the characteristics of a self-regulated learner that lead to improved academic outcome [40]. Being more vigilant in reviewing could potentially be associated with better grades. Another interpretation is that students who obtained better grades started to prepare for an examination early seriously.
The trend on how students attended to their graded assessments is visualized in Figure 3. From this, it can be observed that students reviewed examinations sooner than quizzes (shown by the dips). However, this was not unexpected. This suggests that students were more attentive when the credit at stake was high. The steep downward trend right before examinations (particularly for Exams 2 and 3) could be due to students reviewing multiple quizzes before an examination. Eventually, students learned how to use the system, as demonstrated by the overall downward trend. They even started reviewing quizzes sooner, even if the quizzes were not for credit. This is an encouraging note and evidence of how students self-regulate their learning in reviewing assessments. Finally, when the trend lines of the two groups are compared, it can be seen that high-achieving students generally reviewed their assessments sooner (notice that the green line is generally the lowest line throughout the semester).
To answer RQ3, we look back at the findings in the prior sections to gain insight. Attending to their mistakes promptly was a key characteristic of high achievers and improving students. Such behavior could indicate a willingness to fix any inconsistencies or misconceptions. Items where they made mistakes are likely to have more feedback provided by the grader. Therefore, spending more time resulted in an improvement in their performance which is consistent with the findings in [41].

5.2. Personalized Guidance Effects: Students Reviewed More Mistakes

The personalized guidance component was introduced to highlight the items that need to be prioritized when reviewing. To answer RQ4, we looked into whether the students used this feature. Although no significant differences were found in the academic performance of those who were guided and not, a difference in their reviewing behavior was found. Students who were guided ( x ¯ = 0.76 , σ = 0.28 ) were able to significantly ( p < 0.05 ) review more of their mistakes than those who were not ( x ¯ = 0.67 , σ = 0.32 ). The results showed that the personalized reviewing sequences successfully led students to focus on reviewing their misconceptions.
Feedback is indeed essential. For students to realize this, we need to guide them. Despite the potential of personalized guidance, only a few students used it (see Table 2). This raises the question of whether the guidance provided by the system is enough or visible to them. Each student is different and needs a different form of guidance. Some do not even know that they need help [42]. As discussed by [10], there is a need for students to take an active role in the process and to come up with an effective strategy that works for them. Furthermore, the lack of difference in the overall performance between the two groups suggests that both high- and low-achieving students benefitted from this guidance. Additionally, some students who already have an effective reviewing strategy (i.e., highly self-regulated) may not need explicit guidance anymore and therefore did not use the feature.

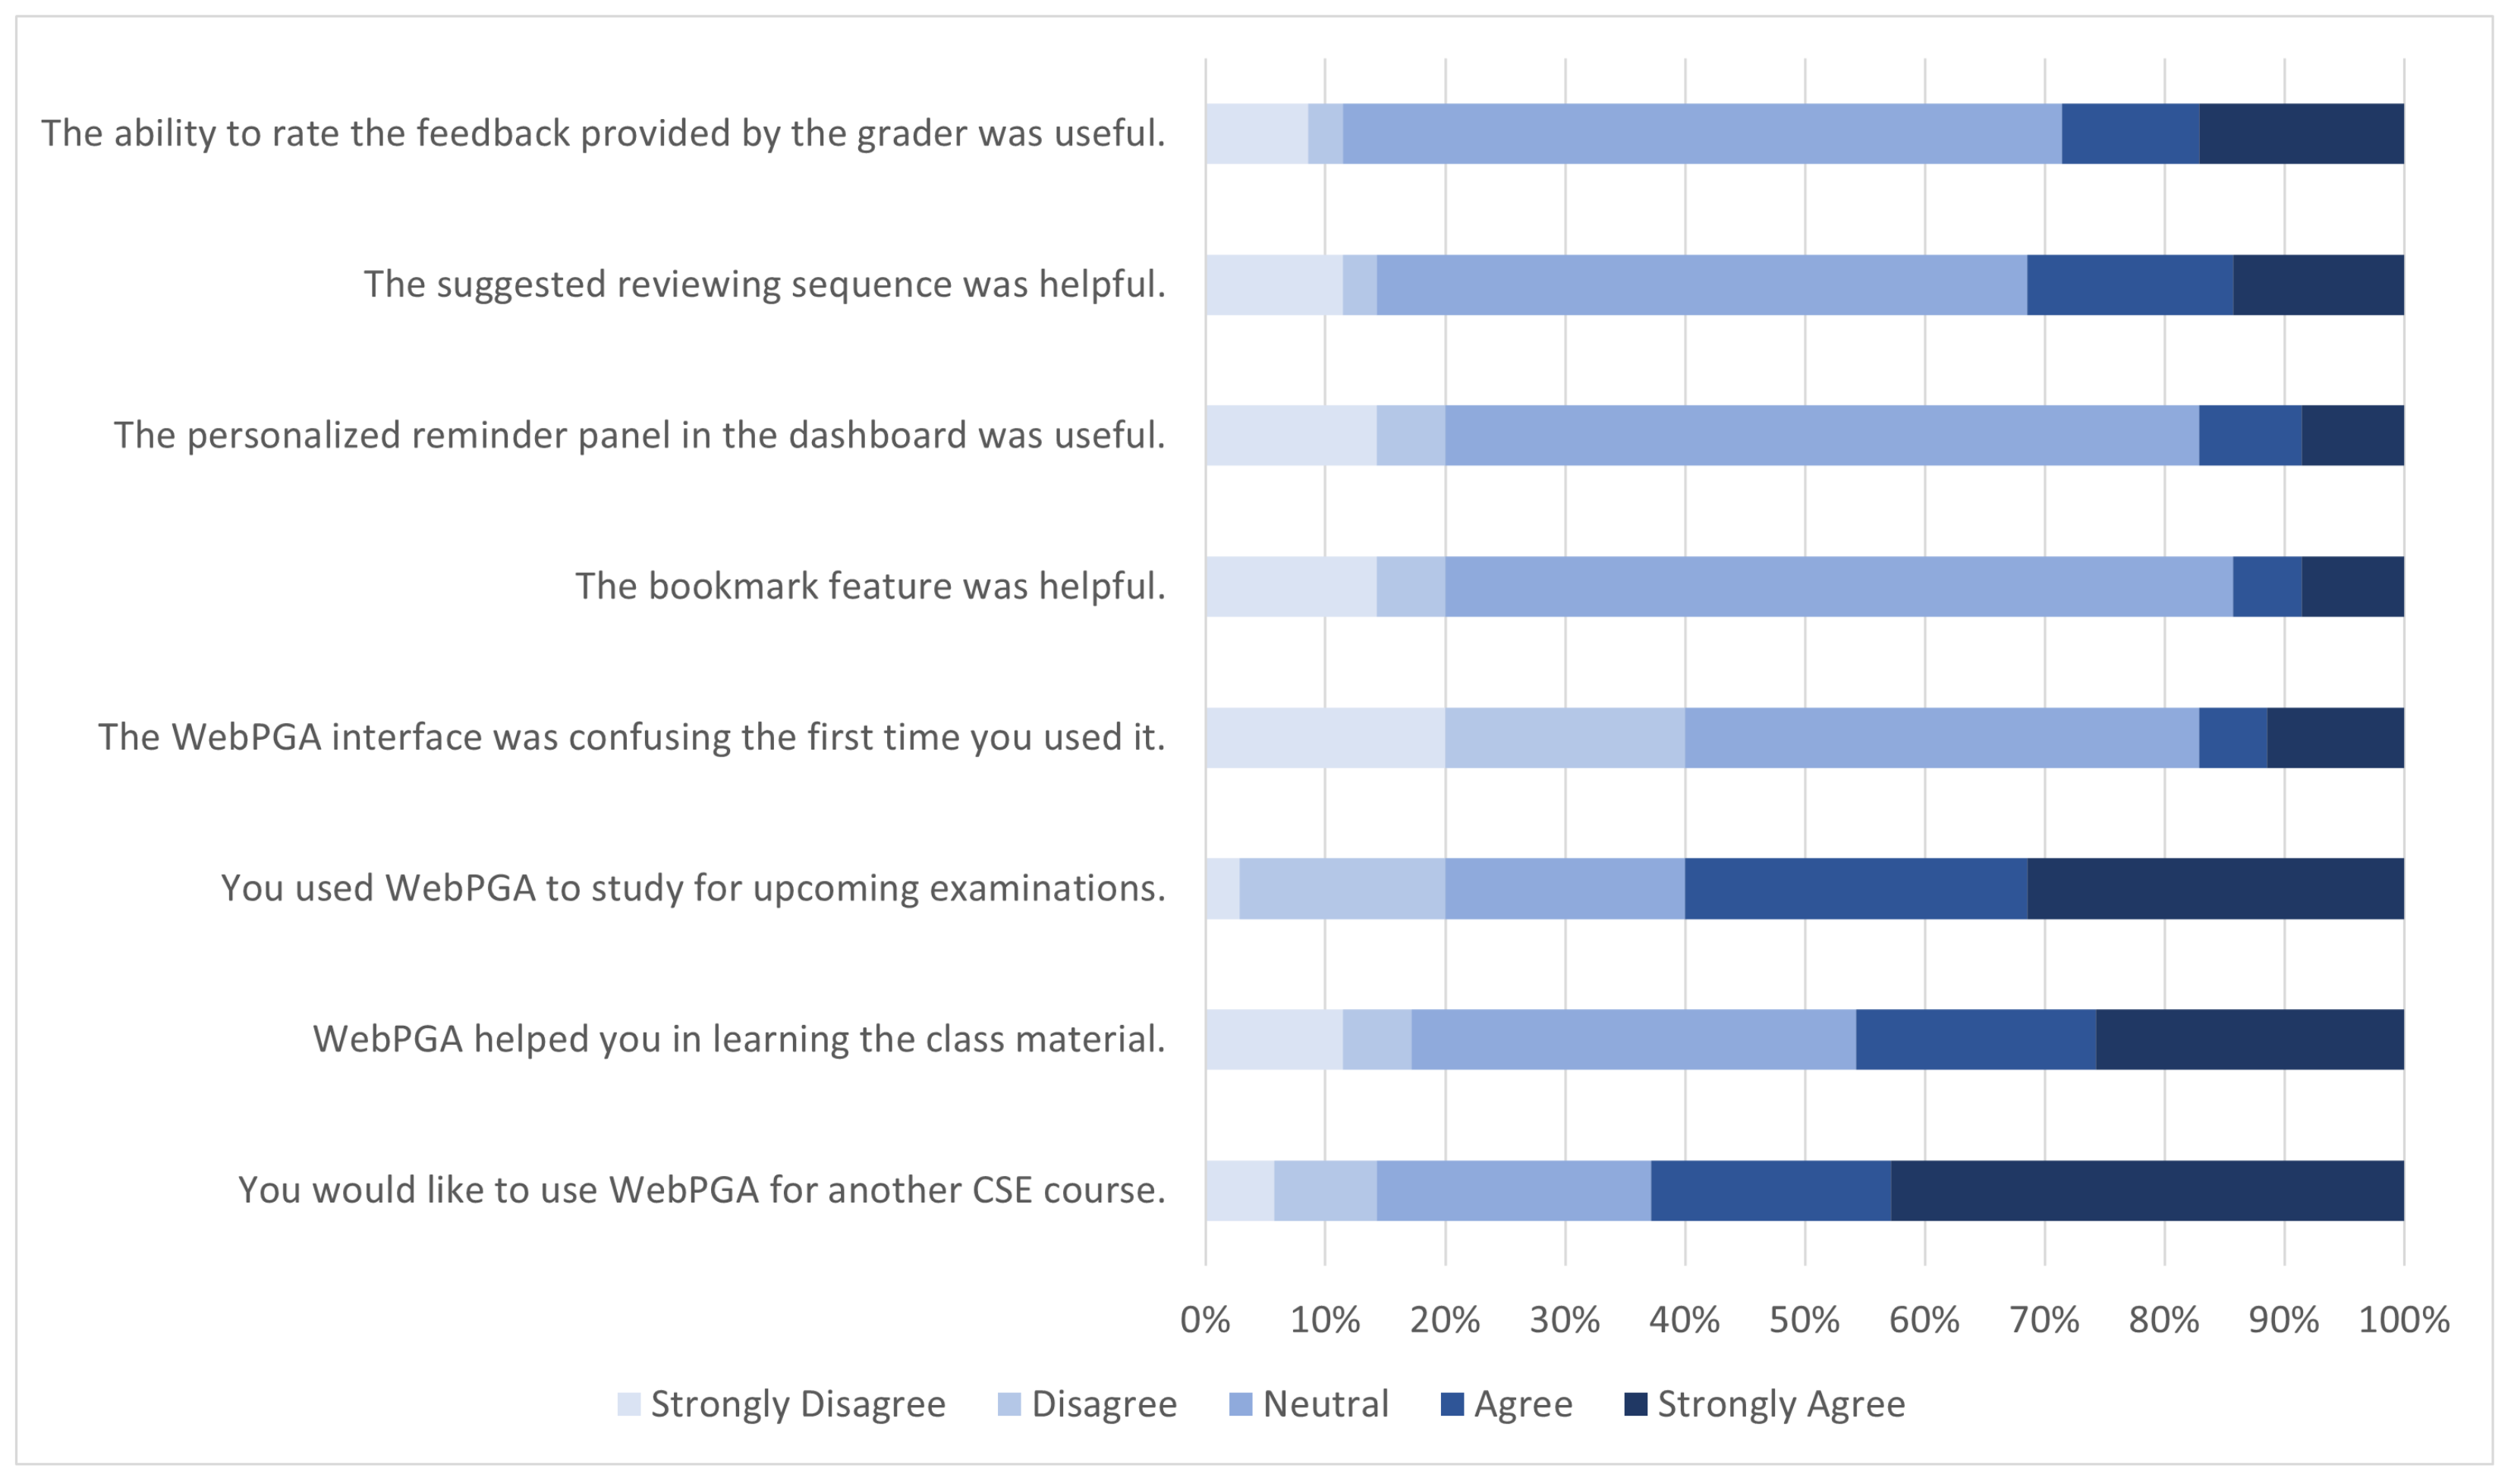
5.3. Subjective Evaluation

At the end of the semester, students were instructed to anonymously answer an online survey to rate their experience using the system. They were also asked to provide some ideas on how the system could be further improved. Only 35 students (22.29%) responded to the survey. Figure 4 shows some of the questions and the students’ responses.

5.3.1. Ease of Use

Most of the respondents found it easy to use the system. They became acquainted with it right after the first two quizzes. They indicated that they used the system to prepare for examinations. In fact, most of them wanted the system to be used in their other classes.

5.3.2. Usefulness of Features

Respondents indicated that they understood the color-coding scheme used and were aware of most of the system’s features. However, some features had low usages, particularly the bookmark and the personal notes. Generally, the respondents were neutral about the usefulness of such features. This could be attributed to the fact that some other functionalities that would motivate them to use those features were not yet implemented.

5.3.3. Future Improvement

Finally, to help improve the system, respondents were asked to provide their suggestions. One of the common responses was to include a way for them to rebut or challenge their grades. Another suggestion was to include a feature that would help them understand a specific question. With these suggestions, more interactions can be captured and could help further understand how students behave.

6. Conclusions

This paper discussed the design of an educational technology that facilitates the digitization, grading, and distribution of paper-based assessments in blended-instruction classes. This system allows for the efficient delivery of feedback to students. It can capture the various interactions of students, providing empirical data on how they review their graded paper-based assessments. Such data can be leveraged to improve the design of existing educational tools. Additionally, it can provide personalized guidance to students on how to review.
A retrospective analysis was conducted to understand the behavioral differences among the different types of students. The reviewing strategies which were associated with improvement and learning were investigated. Results showed that high achievers exerted effort to review most of their mistakes. When analyzed further in finer granularity, students who improved exhibited the same behavior. They reviewed most of their mistakes and spent more time doing so. With the personalized guidance of the system, students were able to review most of their mistakes. Better students reviewed their graded assessments sooner.
This study is subject to several limitations. This investigation focused only on students’ voluntarily reviewing behavior to signify one of the self-regulated learning processes: the abstract form of monitoring and reviewing one’s learning. More comprehensive scenarios, such as planning, comprehension monitoring, and self-explaining should also be considered. The depth of the guidance the system provided the students was not measured. A better way to quantify this should be explored to determine how it affects students’ performance. A more comprehensive algorithm should be considered for the personalized guidance to investigate whether such effect still exists. The sequence of questions that students reviewed could be studied in the future. Sequential pattern mining techniques along with clustering techniques could be used to determine whether different groups of students are exhibiting specific strategies. Students were not taught how to use the system. They had to familiarize themselves on their own. The usability of the system should be studied. Students who did not use the system were dropped from the analysis. However, the participation of these students could potentially provide new insights. This could be done through an interview or the use of self-reporting mechanisms.
The findings have implications for the future development of the system. For feedback to be effective, students must take an active role in the sense-making process to improve their performance [43]. New functionalities could be introduced to engage the students fully. For example, providing students an opportunity to discuss the feedback with their peers or their teacher. Peer evaluation could also be supported. Ultimately, the goal is to find new ways to make students feedback literate and guide them in the process.

Author Contributions

Conceptualization, Y.V.P. and I.-H.H.; data curation, Y.V.P.; formal analysis, Y.V.P. and I.-H.H.; investigation, Y.V.P.; methodology, Y.V.P. and I.-H.H.; project administration, I.-H.H.; supervision, I.-H.H.; validation, I.-H.H.; writing—original draft, Y.V.P.; writing—review & editing, Y.V.P. and I.-H.H. All authors have read and agreed to the published version of the manuscript.

Funding

This research received no external funding.

Conflicts of Interest

The authors declare no conflict of interest.

References

  1. Trees, A.R.; Jackson, M.H. The learning environment in clicker classrooms: Student processes of learning and involvement in large university-level courses using student response systems. Learn. Media Technol. 2007, 32, 21–40. [Google Scholar] [CrossRef]
  2. Martinez-Maldonado, R.; Dimitriadis, Y.; Martinez-Monés, A.; Kay, J.; Yacef, K. Capturing and analyzing verbal and physical collaborative learning interactions at an enriched interactive tabletop. Int. J. Comput.-Support. Collab. Learn. 2013, 8, 455–485. [Google Scholar] [CrossRef]
  3. Hanna, G.S.; Dettmer, P. Assessment for Effective Teaching: Using Context-Adaptive Planning; Allyn & Bacon: Boston, MA, USA, 2004. [Google Scholar]
  4. Biggs, J. Assessment and classroom learning: A role for summative assessment? Assess. Educ. Princ. Policy Pract. 1998, 5, 103–110. [Google Scholar] [CrossRef]
  5. Yan, Z.; Boud, D. Conceptualising assessment-as-learning. In Assessment as Learning; Routledge: Abingdon, UK, 2021; pp. 11–24. [Google Scholar]
  6. Hattie, J.; Timperley, H. The power of feedback. Rev. Educ. Res. 2007, 77, 81–112. [Google Scholar] [CrossRef]
  7. Kulkarni, C.E.; Bernstein, M.S.; Klemmer, S.R. PeerStudio: Rapid peer feedback emphasizes revision and improves performance. In Proceedings of the Second (2015) ACM Conference on Learning @ Scale, Vancouver, BC, Canada, 14–18 March 2015; pp. 75–84. [Google Scholar]
  8. Dihoff, R.E.; Brosvic, G.M.; Epstein, M.L.; Cook, M.J. Provision of feedback during preparation for academic testing: Learning is enhanced by immediate but not delayed feedback. Psychol. Rec. 2004, 54, 207. [Google Scholar] [CrossRef] [Green Version]
  9. Jackson, G.T.; Graesser, A.C. Content matters: An investigation of feedback categories within an ITS. Front. Artif. Intell. Appl. 2007, 158, 127. [Google Scholar]
  10. Carless, D.; Boud, D. The development of student feedback literacy: Enabling uptake of feedback. Assess. Eval. High. Educ. 2018, 43, 1315–1325. [Google Scholar] [CrossRef] [Green Version]
  11. Edwards, S.H.; Perez-Quinones, M.A. Web-CAT: Automatically grading programming assignments. ACM SIGCSE Bulletin; ACM: New York, NY, USA, 2008; Volume 40, p. 328. [Google Scholar]
  12. Jackson, D.; Usher, M. Grading student programs using ASSYST. ACM SIGCSE Bulletin; ACM: New York, NY, USA, 1997; Volume 29, pp. 335–339. [Google Scholar]
  13. Hartmann, B.; MacDougall, D.; Brandt, J.; Klemmer, S.R. What would other programmers do: Suggesting solutions to error messages. In Proceedings of the SIGCHI Conference on Human Factors in Computing Systems, Atlanta, GA, USA, 10–15 April 2010; ACM: New York, NY, USA, 2010; pp. 1019–1028. [Google Scholar]
  14. Denny, P.; Luxton-Reilly, A.; Hamer, J. Student use of the PeerWise system. ACM SIGCSE Bull. 2008, 40, 73–77. [Google Scholar] [CrossRef]
  15. Gehringer, E.F. Electronic peer review and peer grading in computer-science courses. ACM SIGCSE Bull. 2001, 33, 139–143. [Google Scholar] [CrossRef] [Green Version]
  16. Hsiao, I.H.; Sosnovsky, S.; Brusilovsky, P. Guiding students to the right questions: Adaptive navigation support in an E-Learning system for Java programming. J. Comput. Assist. Learn. 2010, 26, 270–283. [Google Scholar] [CrossRef]
  17. Singh, A.; Karayev, S.; Gutowski, K.; Abbeel, P. Gradescope: A Fast, Flexible, and Fair System for Scalable Assessment of Handwritten Work. In Proceedings of the Fourth (2017) ACM Conference on Learning @ Scale, Cambridge, MA, USA, 20–21 April 2017; ACM: New York, NY, USA, 2017; pp. 81–88. [Google Scholar]
  18. Guerra, J.; Sahebi, S.; Lin, Y.R.; Brusilovsky, P. The Problem Solving Genome: Analyzing Sequential Patterns of Student Work with Parameterized Exercises. Available online: http://d-scholarship.pitt.edu/21805/ (accessed on 14 August 2021).
  19. Piech, C.; Sahami, M.; Koller, D.; Cooper, S.; Blikstein, P. Modeling how students learn to program. In Proceedings of the 43rd ACM technical symposium on Computer Science Education, Raleigh, NC, USA, 29 February 2012–3 March 2012; pp. 153–160. [Google Scholar]
  20. Lu, Y.; Hsiao, I.H. Seeking Programming-related Information from Large Scaled Discussion Forums, Help or Harm? In Proceedings of the 9th International Conference on Educational Data Mining, Raleigh, NC, USA, 29 June–2 July 2016; pp. 442–447. [Google Scholar]
  21. Altadmri, A.; Brown, N.C. 37 million compilations: Investigating novice programming mistakes in large-scale student data. In Proceedings of the 46th ACM Technical Symposium on Computer Science Education, Kansas, MO, USA, 4–7 March 2015; pp. 522–527. [Google Scholar]
  22. Buffardi, K.; Edwards, S.H. Effective and ineffective software testing behaviors by novice programmers. In Proceedings of the Ninth Annual International ACM Conference on International Computing Education Research, San Diego, CA, USA; 12–14 August 2013; pp. 83–90. [Google Scholar]
  23. Boyer, K.E.; Phillips, R.; Ingram, A.; Ha, E.Y.; Wallis, M.; Vouk, M.; Lester, J. Investigating the relationship between dialogue structure and tutoring effectiveness: A hidden Markov modeling approach. Int. J. Artif. Intell. Educ. 2011, 21, 65–81. [Google Scholar]
  24. Carter, A.S.; Hundhausen, C.D.; Adesope, O. The normalized programming state model: Predicting student performance in computing courses based on programming behavior. In Proceedings of the Eleventh Annual International Conference on International Computing Education Research, Omaha, NE, USA, 9–13 July 2015; pp. 141–150. [Google Scholar]
  25. Chen, C.M. Intelligent web-based learning system with personalized learning path guidance. Comput. Educ. 2008, 51, 787–814. [Google Scholar] [CrossRef]
  26. Azevedo, R.; Jacobson, M.J. Advances in scaffolding learning with hypertext and hypermedia: A summary and critical analysis. Educ. Technol. Res. Dev. 2008, 56, 93–100. [Google Scholar] [CrossRef]
  27. Brusilovsky, P. Methods and techniques of adaptive hypermedia. User Model. User-Adapt. Interact. 1996, 6, 87–129. [Google Scholar] [CrossRef]
  28. Brusilovsky, P.; Sosnovsky, S. Individualized exercises for self-assessment of programming knowledge: An evaluation of QuizPACK. J. Educ. Resour. Comput. (JERIC) 2005, 5, 6. [Google Scholar] [CrossRef]
  29. Hosseini, R.; Hsiao, I.H.; Guerra, J.; Brusilovsky, P. Off the Beaten Path: The Impact of Adaptive Content Sequencing on Student Navigation in an Open Social Student Modeling Interface. In Artificial Intelligence in Education; Conati, C., Heffernan, N., Mitrovic, A., Verdejo, M.F., Eds.; Springer International Publishing: Cham, Switzerland, 2015; pp. 624–628. [Google Scholar]
  30. Hosseini, R.; Hsiao, I.H.; Guerra, J.; Brusilovsky, P. What Should I Do Next? Adaptive Sequencing in the Context of Open Social Student Modeling. In Design for Teaching and Learning in a Networked World; Conole, G., Klobučar, T., Rensing, C., Konert, J., Lavoué, E., Eds.; Springer International Publishing: Cham, Switzerland, 2015; pp. 155–168. [Google Scholar]
  31. Hsiao, I.H. Mobile Grading Paper-Based Programming Exams: Automatic Semantic Partial Credit Assignment Approach. In Adaptive and Adaptable Learning; Verbert, K., Sharples, M., Klobučar, T., Eds.; Springer International Publishing: Cham, Switzerland, 2016; pp. 110–123. [Google Scholar]
  32. Ball, E.; Franks, H.; Jenkins, J.; Mcgrath, M.; Leigh, J. Annotation is a valuable tool to enhance learning and assessment in student essays. Nurse Educ. Today 2009, 29, 284–291. [Google Scholar] [CrossRef]
  33. Biggs, J.; Tang, C. Teaching for Quality Learning at University; UK Higher Education OUP Humanities & Social Sciences Higher Education OUP; McGraw-Hill Education: New York, NY, USA, 2011. [Google Scholar]
  34. Mensink, P.J.; King, K. Student access of online feedback is modified by the availability of assessment marks, gender and academic performance. Br. J. Educ. Technol. 2020, 51, 10–22. [Google Scholar] [CrossRef]
  35. Chi, M.T. Self-explaining expository texts: The dual processes of generating inferences and repairing mental models. Adv. Instr. Psychol. 2000, 5, 161–238. [Google Scholar]
  36. Roscoe, R.D.; Chi, M.T.H. Understanding Tutor Learning: Knowledge-Building and Knowledge-Telling in Peer Tutors’ Explanations and Questions. Rev. Educ. Res. 2007, 77, 534–574. [Google Scholar] [CrossRef] [Green Version]
  37. Winstone, N.; Bourne, J.; Medland, E.; Niculescu, I.; Rees, R. “Check the grade, log out”: Students’ engagement with feedback in learning management systems. Assess. Eval. High. Educ. 2021, 46, 631–643. [Google Scholar] [CrossRef]
  38. Paredes, Y.V.; Azcona, D.; Hsiao, I.H.; Smeaton, A. Learning by Reviewing Paper-Based Programming Assessments. In European Conference on Technology Enhanced Learning, EC-TEL; Lecture Notes in Computer Science; Springer: Cham, Switzerland, 2018; Volume 11082, pp. 510–523. [Google Scholar]
  39. Paredes, Y.V.; Hsiao, I.H. Personalized guidance on how to review paper-based assessments. In Proceedings of the 26th International Conference on Computers in Education, Main Conference Proceedings, Manila, Philppines, 26–30 November 2018; pp. 26–30. [Google Scholar]
  40. Zimmerman, B.J. Self-regulated learning and academic achievement: An overview. Educ. Psychol. 1990, 25, 3–17. [Google Scholar] [CrossRef]
  41. Zimbardi, K.; Colthorpe, K.; Dekker, A.; Engstrom, C.; Bugarcic, A.; Worthy, P.; Victor, R.; Chunduri, P.; Lluka, L.; Long, P. Are they using my feedback? The extent of students’ feedback use has a large impact on subsequent academic performance. Assess. Eval. High. Educ. 2017, 42, 625–644. [Google Scholar] [CrossRef]
  42. Aleven, V.; Koedinger, K.R. Limitations of student control: Do students know when they need help? In Proceedings of the International Conference on Intelligent Tutoring Systems, Montréal, QC, Canada, 19–23 June 2000; Springer: Berlin/Heidelberg, Germany, 2000; pp. 292–303. [Google Scholar]
  43. Boud, D.; Molloy, E. Rethinking models of feedback for learning: The challenge of design. Assess. Eval. High. Educ. 2013, 38, 698–712. [Google Scholar] [CrossRef]
Figure 1. Grading interface provides the tools to assess students’ answers. The left panel presents the scanned image while the right panel contains the rubrics and a textbox to provide free-form feedback.
Information 12 00450 g001
Figure 2. The following are screenshots of the different views of the reviewing interface. (a) Student dashboard provides an overview of the student’s performance. (b) Assessment overview lists all the questions of single assessment. (c) Question overview provides a detailed view of how a question was graded.
Information 12 00450 g002
Figure 3. Comparison of how soon students review their graded assessments (reviewing delay) between the high-achieving and low-achieving group.
Information 12 00450 g003
Figure 4. The following illustrates the responses 35 students (22.29%) to an anonymous survey administered at the end of the semester. This served as a subjective evaluation of the system.
Information 12 00450 g004
Table 1. Students were grouped based on several categories, namely in terms of their (1) academic performance, (2) performance trajectory in a given period, and (3) use of the system’s personalized guidance feature.
CategoryGroupNo. of Students
Academic PerformanceHigh-achieving86
Low-achieving71
Performance TrajectoryExam1-Exam2Improving53
Dropping102
Retaining2
Exam2-Exam3Improving79
Dropping77
Retaining1
Personalized GuidanceGuided46
Not Guided111
Table 2. Overview of students’ reviewing behavior.
ExamAvg. ScoreNo. of Students Who ReviewedAvg. Reviewing Delay (Days)Std. Dev. (Days)
183.3%142 (89.87%)4.714.4
278.6%131 (82.91%)2.46.8
379.6%100 (63.29%)0.92.2
Table 3. Comparison of the system use and reviewing behaviors between the high-achieving and low-achieving students.
GroupReview CountTime Spent Reviewing Assessments (mins)Examination Review CountTime Spent Reviewing Examinations * (mins)Correct (mins)Mistakes * (mins)Review Coverage *
High48.1023.3824.958.426.511.620.73
Low47.7325.4229.3912.647.514.730.65
* p   <   0.05 .
Table 4. Comparison of review coverage across the two periods.
PeriodGroupr_correctr_mistake
Exam1-Exam2Improving *0.390.63
Dropping *0.420.64
Exam2-Exam3Improving *0.150.32
Dropping0.260.31
* p   <   0.01 .
Publisher’s Note: MDPI stays neutral with regard to jurisdictional claims in published maps and institutional affiliations.

