Article

Distribution and Sources of Organic Carbon in Surface Intertidal Sediments of the Rudong Coast, Jiangsu Province, China

1
School of Marine Science and Engineering, Nanjing Normal University, Nanjing 210023, China
2
Jiangsu Center for Collaborative Innovation in Geographical Information Resource Development and Application, Nanjing Normal University, Nanjing 210023, China
3
Yangzhou High School of Jiangsu Province, No. 18, Huaihai Road, Yangzhou 225000, China
*
Author to whom correspondence should be addressed.
J. Mar. Sci. Eng. 2021, 9(9), 992; https://doi.org/10.3390/jmse9090992
Submission received: 11 August 2021 / Revised: 1 September 2021 / Accepted: 8 September 2021 / Published: 11 September 2021
(This article belongs to the Special Issue Coastal Wetlands)

Abstract

:
In this study, total organic carbon (TOC), total nitrogen (TN), and stable carbon isotopes (δ13C) were measured in surface intertidal saltmarsh and bare tidal flat sediments along the Rudong coast. The distribution and sources of organic carbon were examined under different depositional environments based on C/N ratios and a two-terminal mixing model. The results showed that the average TOC content of the vegetated saltmarsh sediments, bare tidal flat areas near vegetation (BF1), and bare tidal flat areas far from vegetation (BF2) were 4.05, 2.72, and 1.22 mg/g, respectively. The mean δ13C value within the vegetated saltmarsh area was −22.37‰, and the C/N ratio was 9.3; the corresponding values in the BF1 area were −23.27‰ and 7.95, respectively; and in the BF2 area, the corresponding values were −21.91‰ and 5.36, respectively. These C/N ratios reflect an increasing marine contribution with distance from the vegetated zone. Combined with the two-terminal mixing model, the organic carbon in the vegetated saltmarsh sediments was dominated by terrestrial sources, while the bare tidal flat sediments were more influenced by marine sources, and the bare tidal flat sediments nearer to the vegetated zone (BF1) were influenced by a combination of vegetation, marine sources, and other terrestrial factors.

1. Introduction

Coastal zones connect the ocean and land, and are areas of dynamic land–ocean–atmosphere interaction influenced by various terrestrial and marine physical, chemical, and biological factors. This results in complex energy flows and material input and output processes, with particularly active carbon flows and transformations. Carbon in the ocean includes autochthonous organic carbon from marine benthic organisms and phytoplankton, and allochthonous organic carbon from riverine inputs and human activity. Sediments in highly productive coastal wetlands—including mangroves, saltmarshes, and seagrass beds—capture and store significant amounts of carbon, acting as carbon sinks and contributing to climate change mitigation [1,2]. The carbon captured by these processes is called “blue carbon”. Nahlik and Fennessy [3] found that the total carbon sequestered in the upper 0–1.2 m of saltmarsh and mangrove soils in the coastal zone of the United States was 0.87 PgC, while Donato [4] estimated that the amount of carbon stored in the top 0–3 m of mangrove soils in Southeast Asia is 102.3 kg C/m2. Importantly, different vegetation types have different carbon sequestration capacities, and the effects of succession between types of saltmarsh plants due to anthropogenic factors—such as poldering (using engineering techniques for the reclamation of beaches along rivers, lakes, and seashores)—remain understudied. Organic carbon makes up a large part of the global carbon pool, especially in soils and vegetation, and understanding the sources of organic carbon can help us to better use vegetation to capture carbon and form carbon sinks. We quantitatively compared organic carbon sources in surface sediments from different vegetated and non-vegetated growing areas, whereas previously most discussions have concerned only one type of vegetation or one area.
The Rudong Sea area is in the coastal area of Jiangsu Province, China, between the Yangtze River and the Yellow River estuaries. Siltation rates are high in this region, forming a unique powder sand silty coast. The introduction and growth of Spartina alterniflora, which competes with local plants for survival, contributes to the diversity and succession of vegetation in this area, which, in turn, alters the ecological structure and function of these coastal wetlands [5]. Native plants and invasive S. alterniflora are C3 and C4 plants. Differences in carbon production capacity due to differences in the photosynthetic pathways of C3 and C4 plants, and the typically longer carbon cycles in C3 plants than C4 plants, result in different carbon isotope fractionation effects in plants, and can provide a basis for carbon sources. The spatial heterogeneity of coastal wetland formation, which is directly linked to changes in sedimentation processes resulting from reclamation projects, has been the subject of much research. This includes studies of the relationship between coastal vegetation and soil properties, demonstrating their strong interactivity [6,7]. During carbon transport, transformation, and storage, the influence of vegetation as a carbon source cannot be ignored [8,9]. As such, clarifying carbon sources has great ecological significance for understanding the productivity of coastal ecosystems, as well as the transport and transformation of organic matter. Indeed, understanding these processes is essential for accurately predicting the responses of coastal wetlands to regional-scale climate change and human activity [10,11,12]. In the coastal areas of Jiangsu Province, such information is essential to inform ongoing poldering activities and wetland conservation.
In this study, the δ13C, total organic carbon (TOC) content, total nitrogen (TN) content, and C/N ratios of surface sediments from vegetated intertidal saltmarsh areas (S1, S2, and S3) and bare tidal flat sediments near (BF1) and far (BF2) from the vegetated areas are examined. These observations are used to explore the spatial distribution of organic carbon in different depositional environments. Furthermore, C/N ratios are combined with a two-terminal mixing model to examine the organic carbon sources contributing to these sediments.

2. Materials and Methods
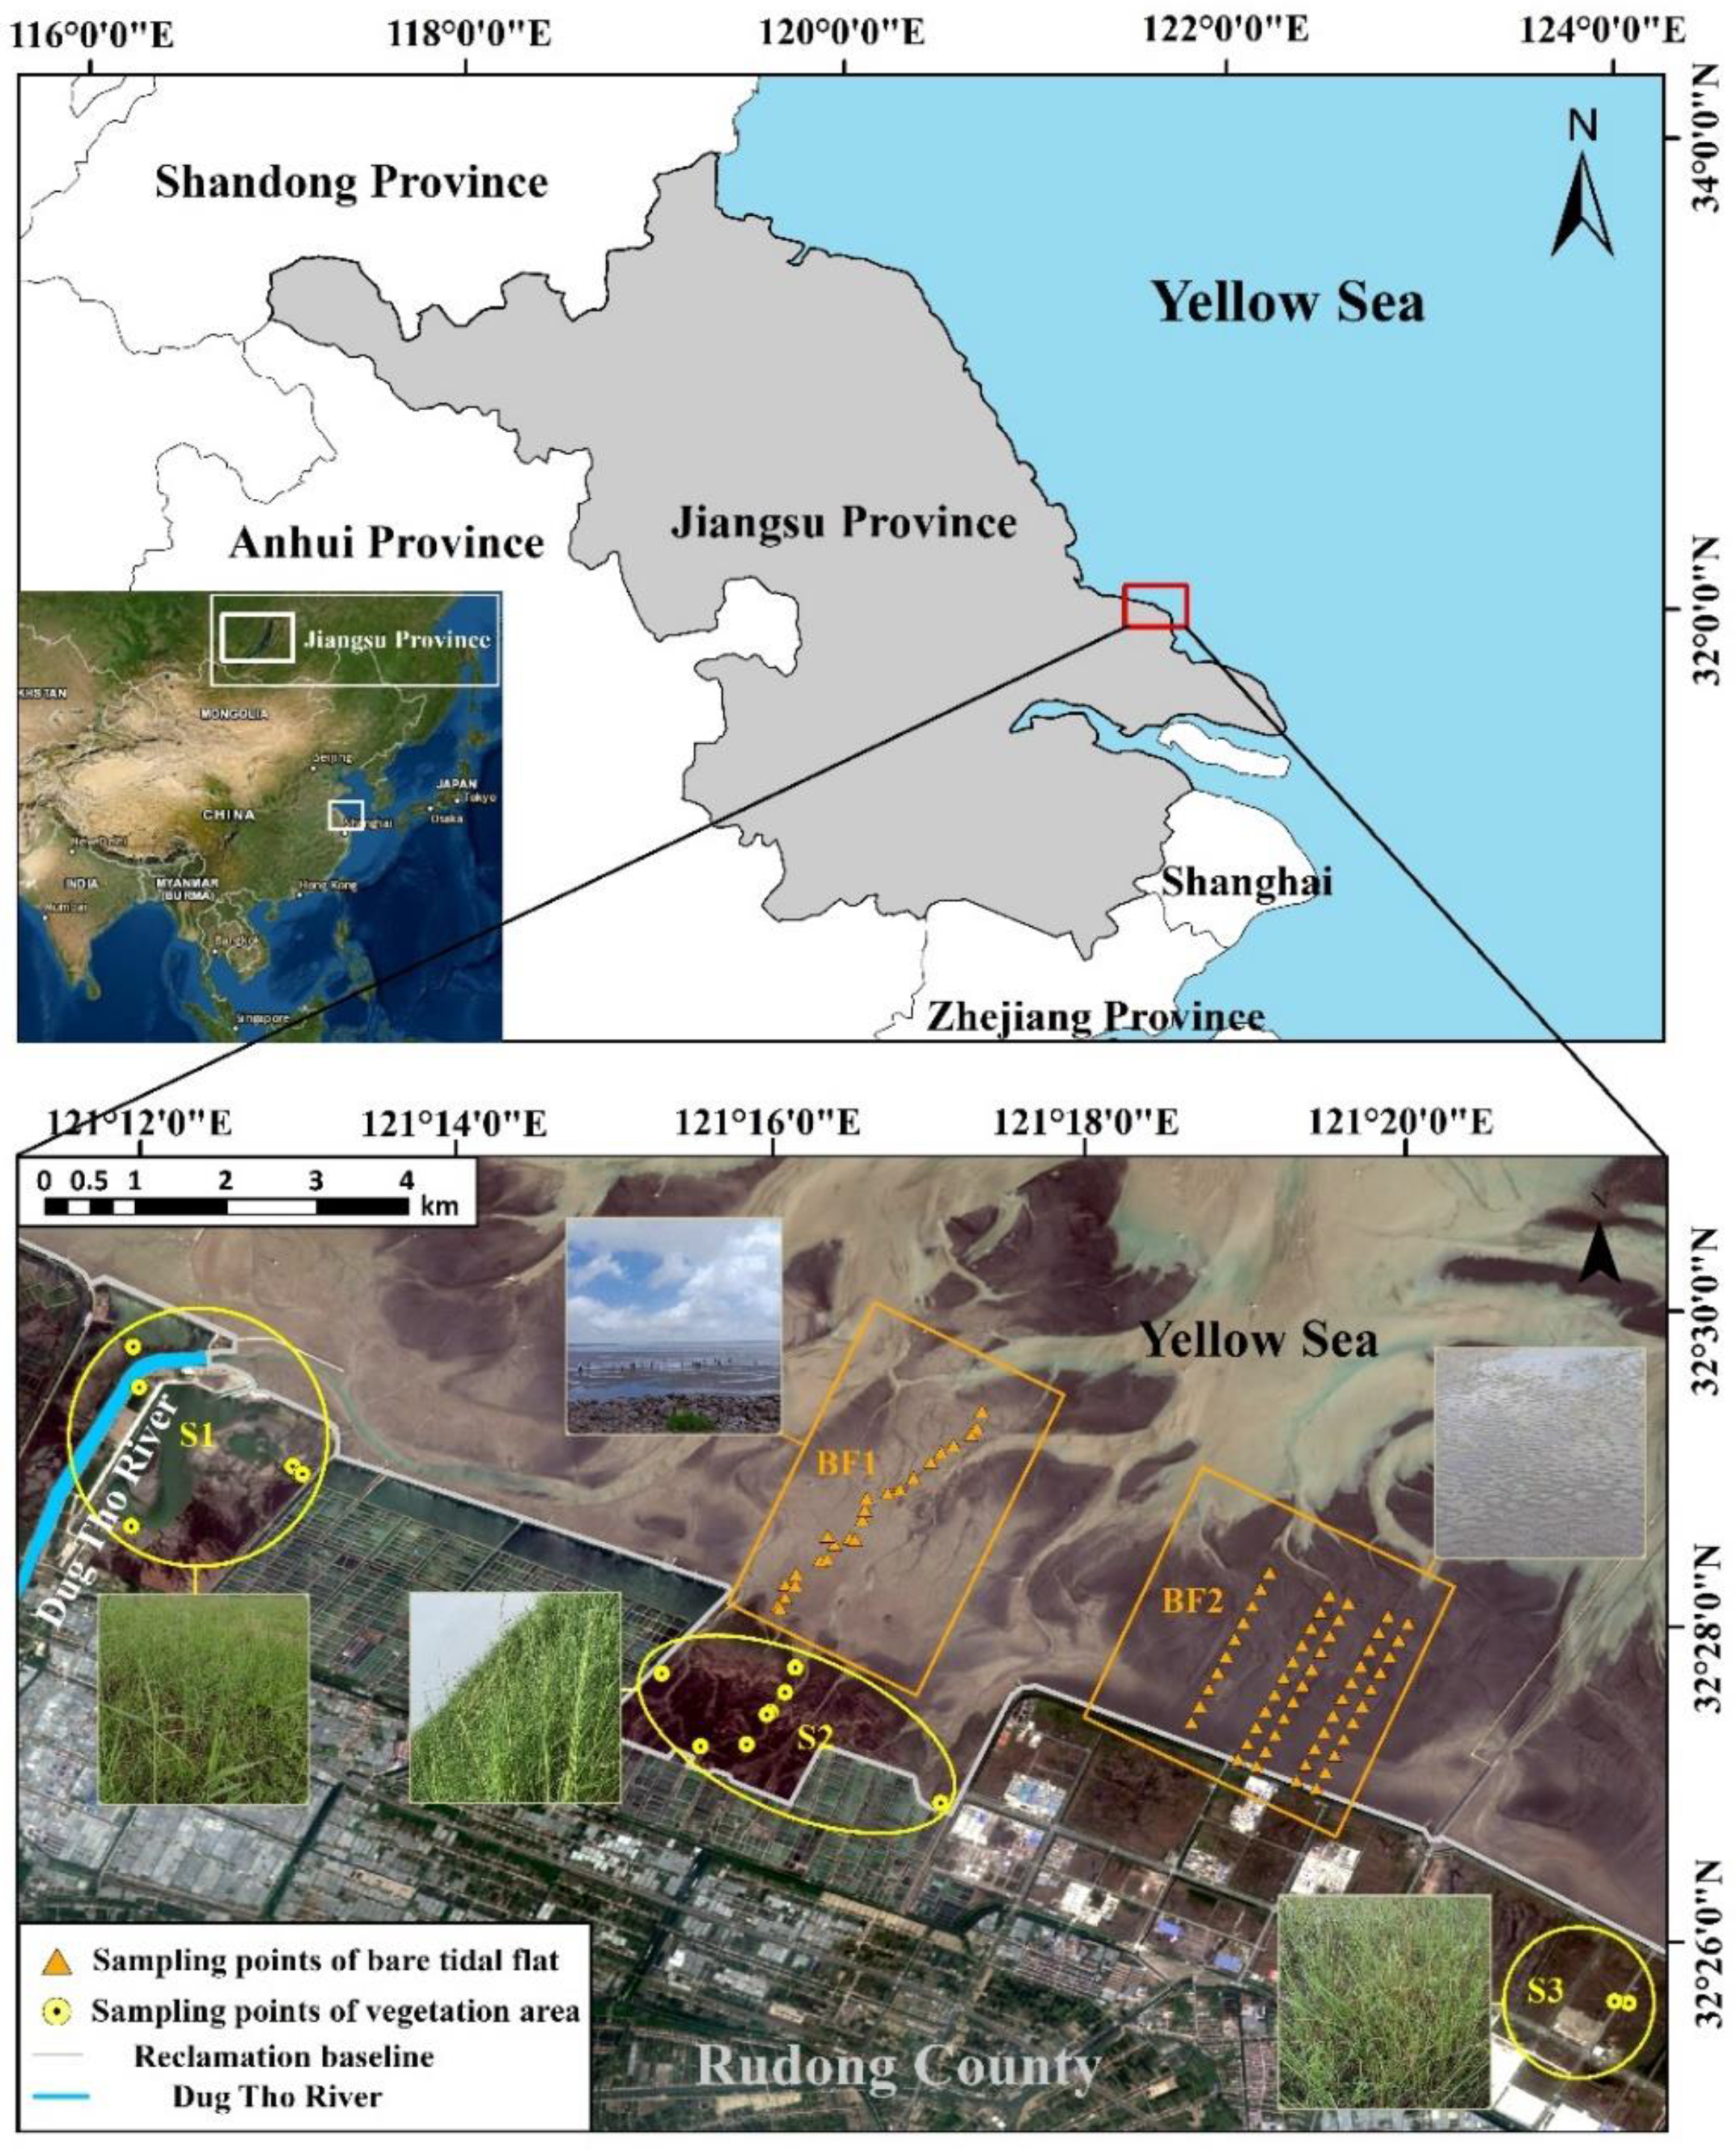
2.1. Study Area

Rudong County, Nantong City, Jiangsu Province is located on the eastern coast of China, north of the Yangtze River Delta and southeast of the South Yellow Sea radiation sandbar (Figure 1). Rudong is a typical coastal plain with flat topography and two major rivers entering the sea: the Bencha Canal, and the Dug Tho River on the northern side. Because of the large amounts of sediment carried by these rivers, and the influences of geological, hydrological, and biological natural conditions, the Rudong coastal zone is continuously silted, forming tidal flats mainly composed of silt and clay. Rudong County has a subtropical and maritime monsoon climate, with four distinct seasons: hot and rainy conditions in summer, cold and wet in winter, and mild and wet in the spring and autumn. Abundant rainfall, with an average annual precipitation of over 1000 mm and plum rains, occurs in early summer.
The particular geographical and geological setting of Rudong County provides conditions for the growth of various wetland plants, with the intertidal communities dominated by S. alterniflora, Phragmites australis, Suaeda glauca, and Imperata cylindrica. S. alterniflora is an invasive plant with strong growth and siltation-promoting properties that can replace the native species P. australis, both of which are important for coastal zone conservation [13,14]. S. glauca—a pioneer plant of salt marshes, and one of the main native plants protecting the coastal zone—is gradually being replaced by P. australis and S. alterniflora [10,15].
In recent years, large-scale reclamation has diversified the types of mudflat land in this area, and the area of reclaimed coastal mudflats in Jiangsu reached 3346 km2 from 1951 to 2015. The various human activities involved in the process of polder cultivation—such as polder farming and paddock farming—change the hydrodynamic conditions affecting the salinity and moderate moisture content of the local soil, resulting in changes in soil composition and texture [16]. This change in land use has affected the vegetation as well as the sources and composition of the organic matter in the region [17,18].

2.2. Sample Collection and Experimental Methods

2.2.1. Sample Collection

To study the distribution and sources of organic carbon in the surface sediments under different depositional environments (vegetation growth areas: S1, S2, S3; bare tidal flat areas: BF1, BF2) on the tidal flats in Rudong County, we undertook surface sediment sampling in May 2019. S1, S2, and S3 are vegetation growth areas, divided by different times of reclamation; BF1 and BF2 are areas of bare tidal flat without vegetation growth, with BF1 close to the vegetation growth area and BF2 away from the vegetation growth area. The samples were taken with a sampling shovel from 0–5 cm depth in the vegetated and bare tidal flat areas, and the collected sediments were placed in clean self-sealing bags and marked with the sample number and geographical location of each sampling site. The samples were then frozen (−20 °C) and stored for the subsequent laboratory experiments.

2.2.2. Sample Measurement

The bulk frozen sediment samples were placed in a freeze-dryer for approximately 24 h after drying, and approximately 1 g of sample was weighed and ground through a 100-mesh sieve. This material was then placed in a centrifuge tube with 2 mol/L hydrochloric acid solution to remove inorganic carbon. Once this step was complete, the samples were washed 3–4 times with Milli-Q water until neutral. The samples were freeze-dried, ground, sieved through a 100-mesh sieve once again, placed in tin foil, dried, and stored for measurement.
The organic element content (TOC and TN are used to calculate the C/N ratio) was determined using an elemental analyser (EuroVector EA3000, Milan, Italy), with the soil composition analysis standard GSS-13 (GBW07427) as a control (error analysis of C < 0.12%, error of N < 0.009%) and the soil composition analysis standard GSS-16 (GBW07430) (error analysis of C < 0.15%, error of N < 0.011%).
Stable carbon isotopes were identified using a MAT 253 plus stable isotope mass spectrometer (Thermo, Waltham, MA, USA) with an analytical error of < 0.15‰. Stable carbon isotope abundance was calculated using the following formula:
δ13C (‰) = ([Rsample]/[Rstandard] − 1) × 1000
where Rsample is the relative ratio of 13C/12C, and Rstandard is the carbon isotope ratio of the international standard substance Vienna Pee Dee Belemnite.
All pretreatments were carried out at the School of Marine Science and Engineering, Nanjing Normal University. Organic carbon, nitrogen content, and stable carbon isotopes were measured at the Nanjing Institute of Geography and Lakes, Chinese Academy of Sciences.

2.2.3. Organic Carbon Source Analysis

The differences in the types of organic matter produced by different organisms are the basis for applying the C/N ratio for provenance studies. Terrestrial plants have a low content of nitrogen, including lignin and cellulose, and show carbon-rich characteristics, with C/N ratios typically ranging from 20 to 500; more elevated plants typically have C/N ratios greater than 50. Due to their richness in proteins and other materials, aquatic plants such as marine phytoplankton show comparatively nitrogen-rich characteristics, with lower C/N ratios of around 5–9 [19,20]. While the C/N ratio can be used for source identification, this method is limited because of the decomposition of organic matter by microorganisms in the supporting sediments [21], requiring the use of additional complementary methods.
Numerous studies have shown that δ13C is an accurate indicator of sediment organic matter sources [22,23,24], with Minoura’s classical two-terminal mixing model often being applied for this purpose [25]. This technique is particularly useful for coastal and estuarine environments because of the varying characteristics and fractionation of organic carbon in different coastal plants [24,26,27]. In this study, combined with the δ13C values of local sediment samples, the terrestrial and marine organic matter endmembers were taken as −27‰ and −20‰, respectively. We also used analysis of variance (ANOVA) to analyse the significance of the different sources.
The two-terminal mixing model equation is as follows:
f = δ 13 C M a r i n e δ 13 C S e d i m e n t δ 13 C M a r i n e δ 13 C T e r r e s t r i a l
where δ 13 C M a r i n e is the marine endmember;   δ 13 C T e r r e s t r i a l is the terrestrial endmember;   δ 13 C S e d i m e n t is the δ13C value of the samples; and   f is the contribution coefficient of organic matter from terrestrial sources.

3. Results

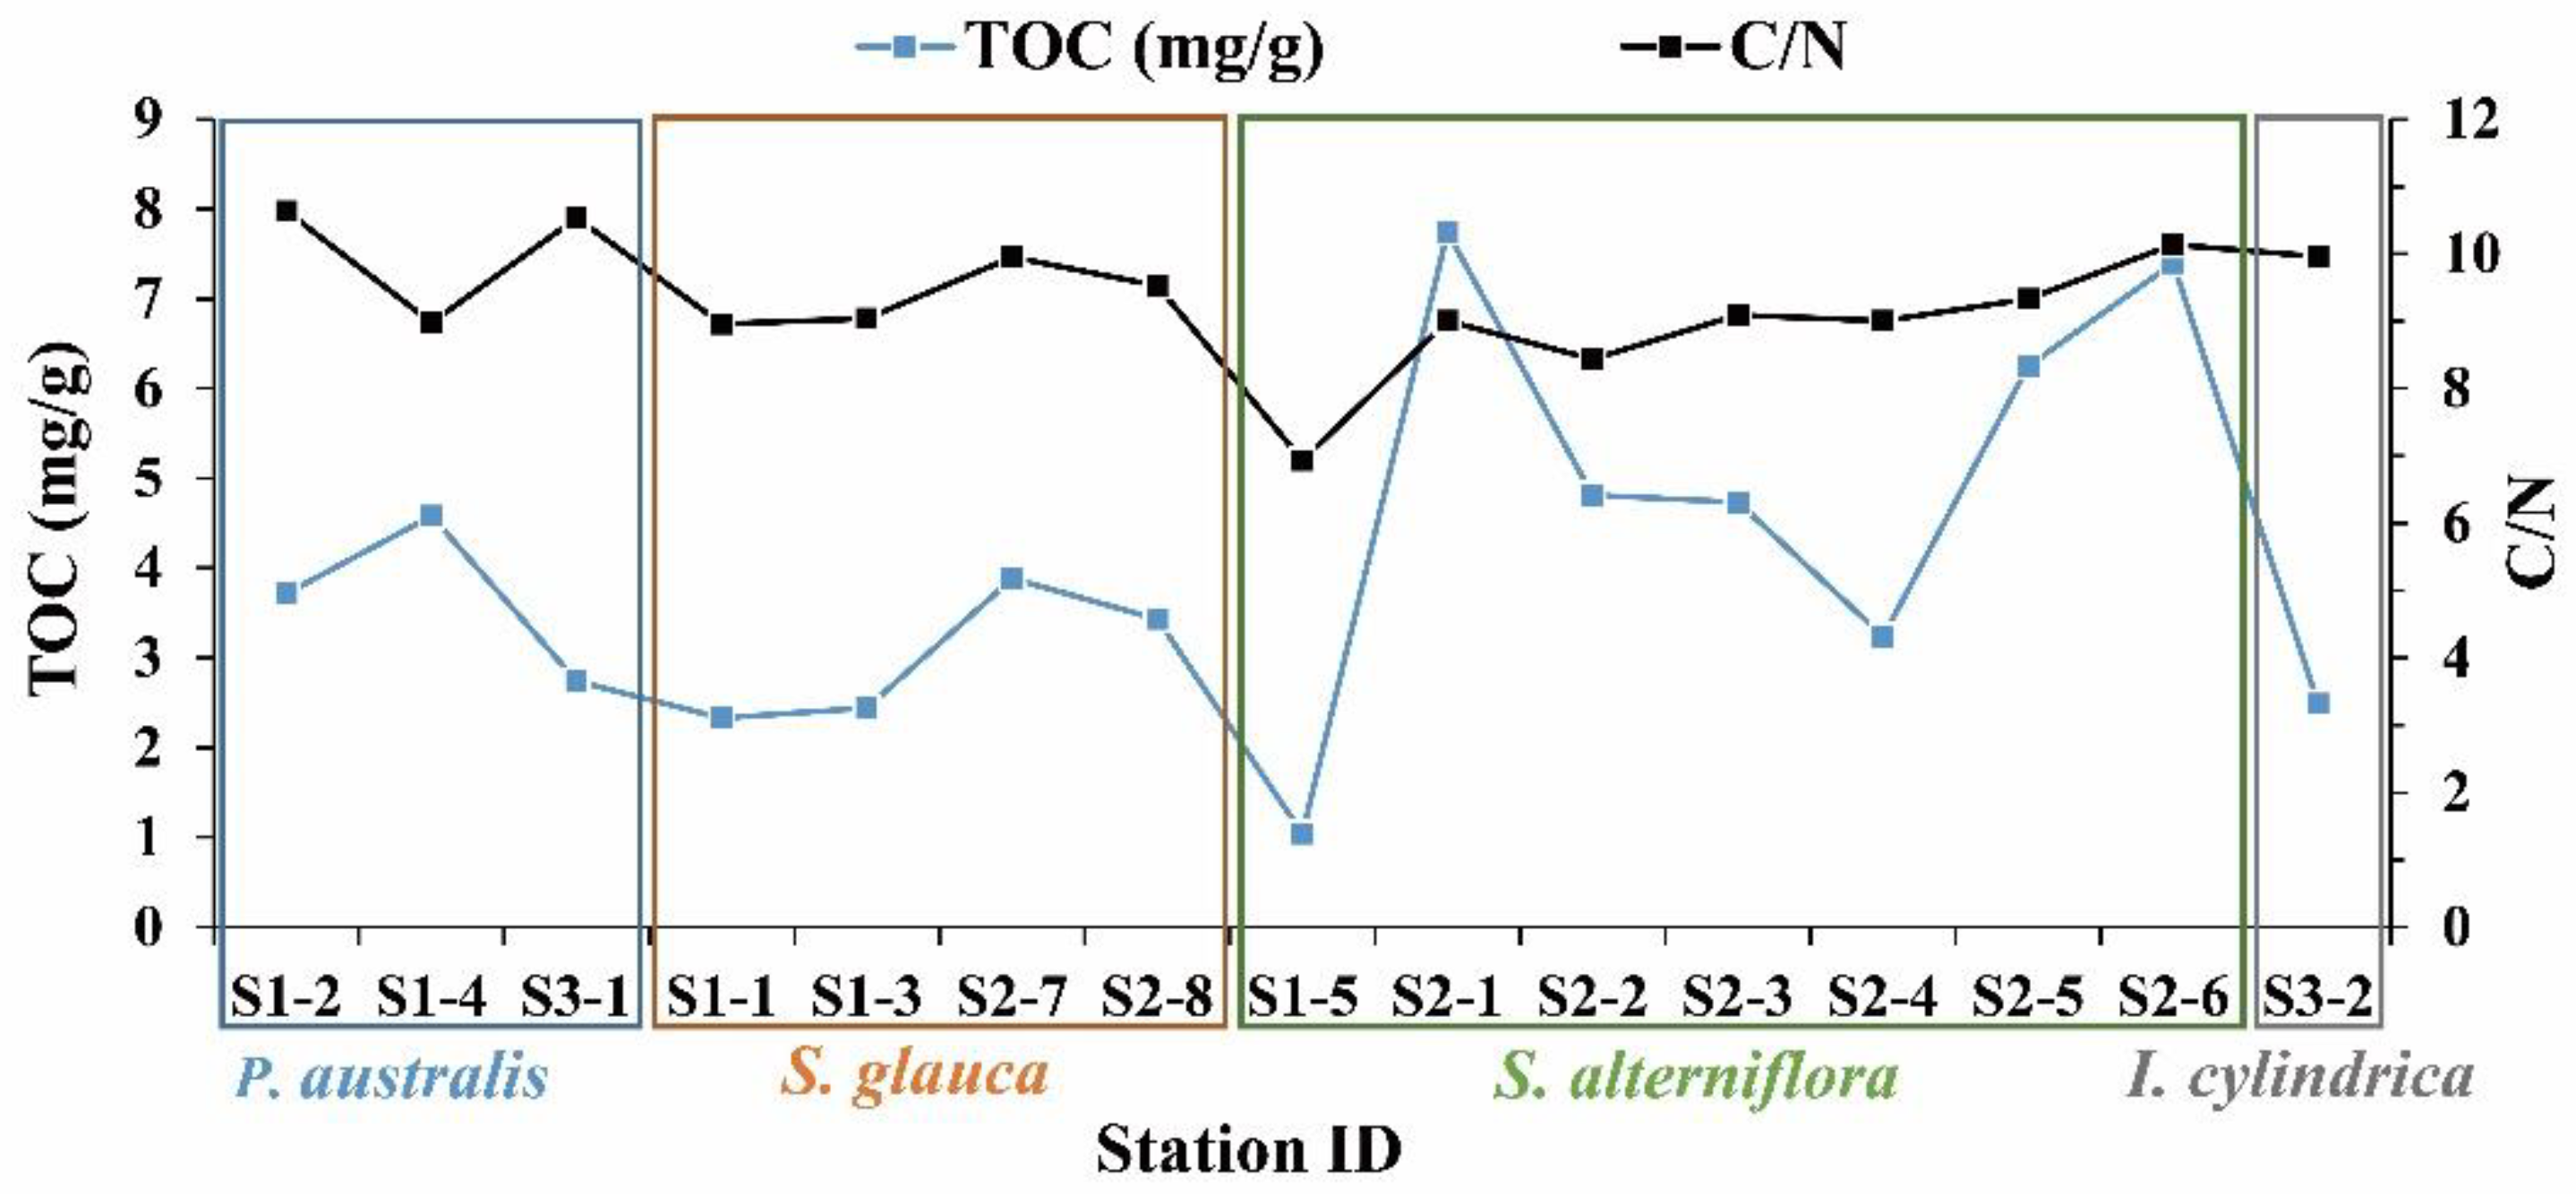
3.1. Distribution of TOC and C/N in Surface Sediments

3.1.1. Vegetated Saltmarsh Areas

The TOC of the surface sediments in the vegetated saltmarsh area ranged from 1.04 to 7.74 mg/g, with a mean of 4.05 ± 1.84 mg/g; C/N ranged from 6.93 to 10.63, with a mean of 9.3 ± 0.89 (Table 1). The vegetation types in the sampled wetland areas were dominated by S. alterniflora, P. australis, S. glauca, and I. cylindrica, which show a successional sequence in the listed order. Figure 2 shows that the carbon content varied greatly between the sediments with different vegetation types; the average TOC of sediments supporting P. australis was 3.68 mg/g, compared to 3.02 mg/g for S. glauca, 5.03 mg/g for S. alterniflora, and 2.49 mg/g for I. cylindrica. The organic carbon content of the S. alterniflora sediment was significantly higher than that of the other vegetation types. The growing areas of S. alterniflora are less influenced by other environmental factors (such as reclamation activities), suggesting that S. alterniflora contributes greatly to the carbon storage of these sediments. The C/N ratios of higher terrestrial plants are generally > 15 [28], while the C/N ratios of surface sediments in the study area ranged from approximately 7 to 11, which likely indicates a mix of both terrestrial and marine organic carbon sources.

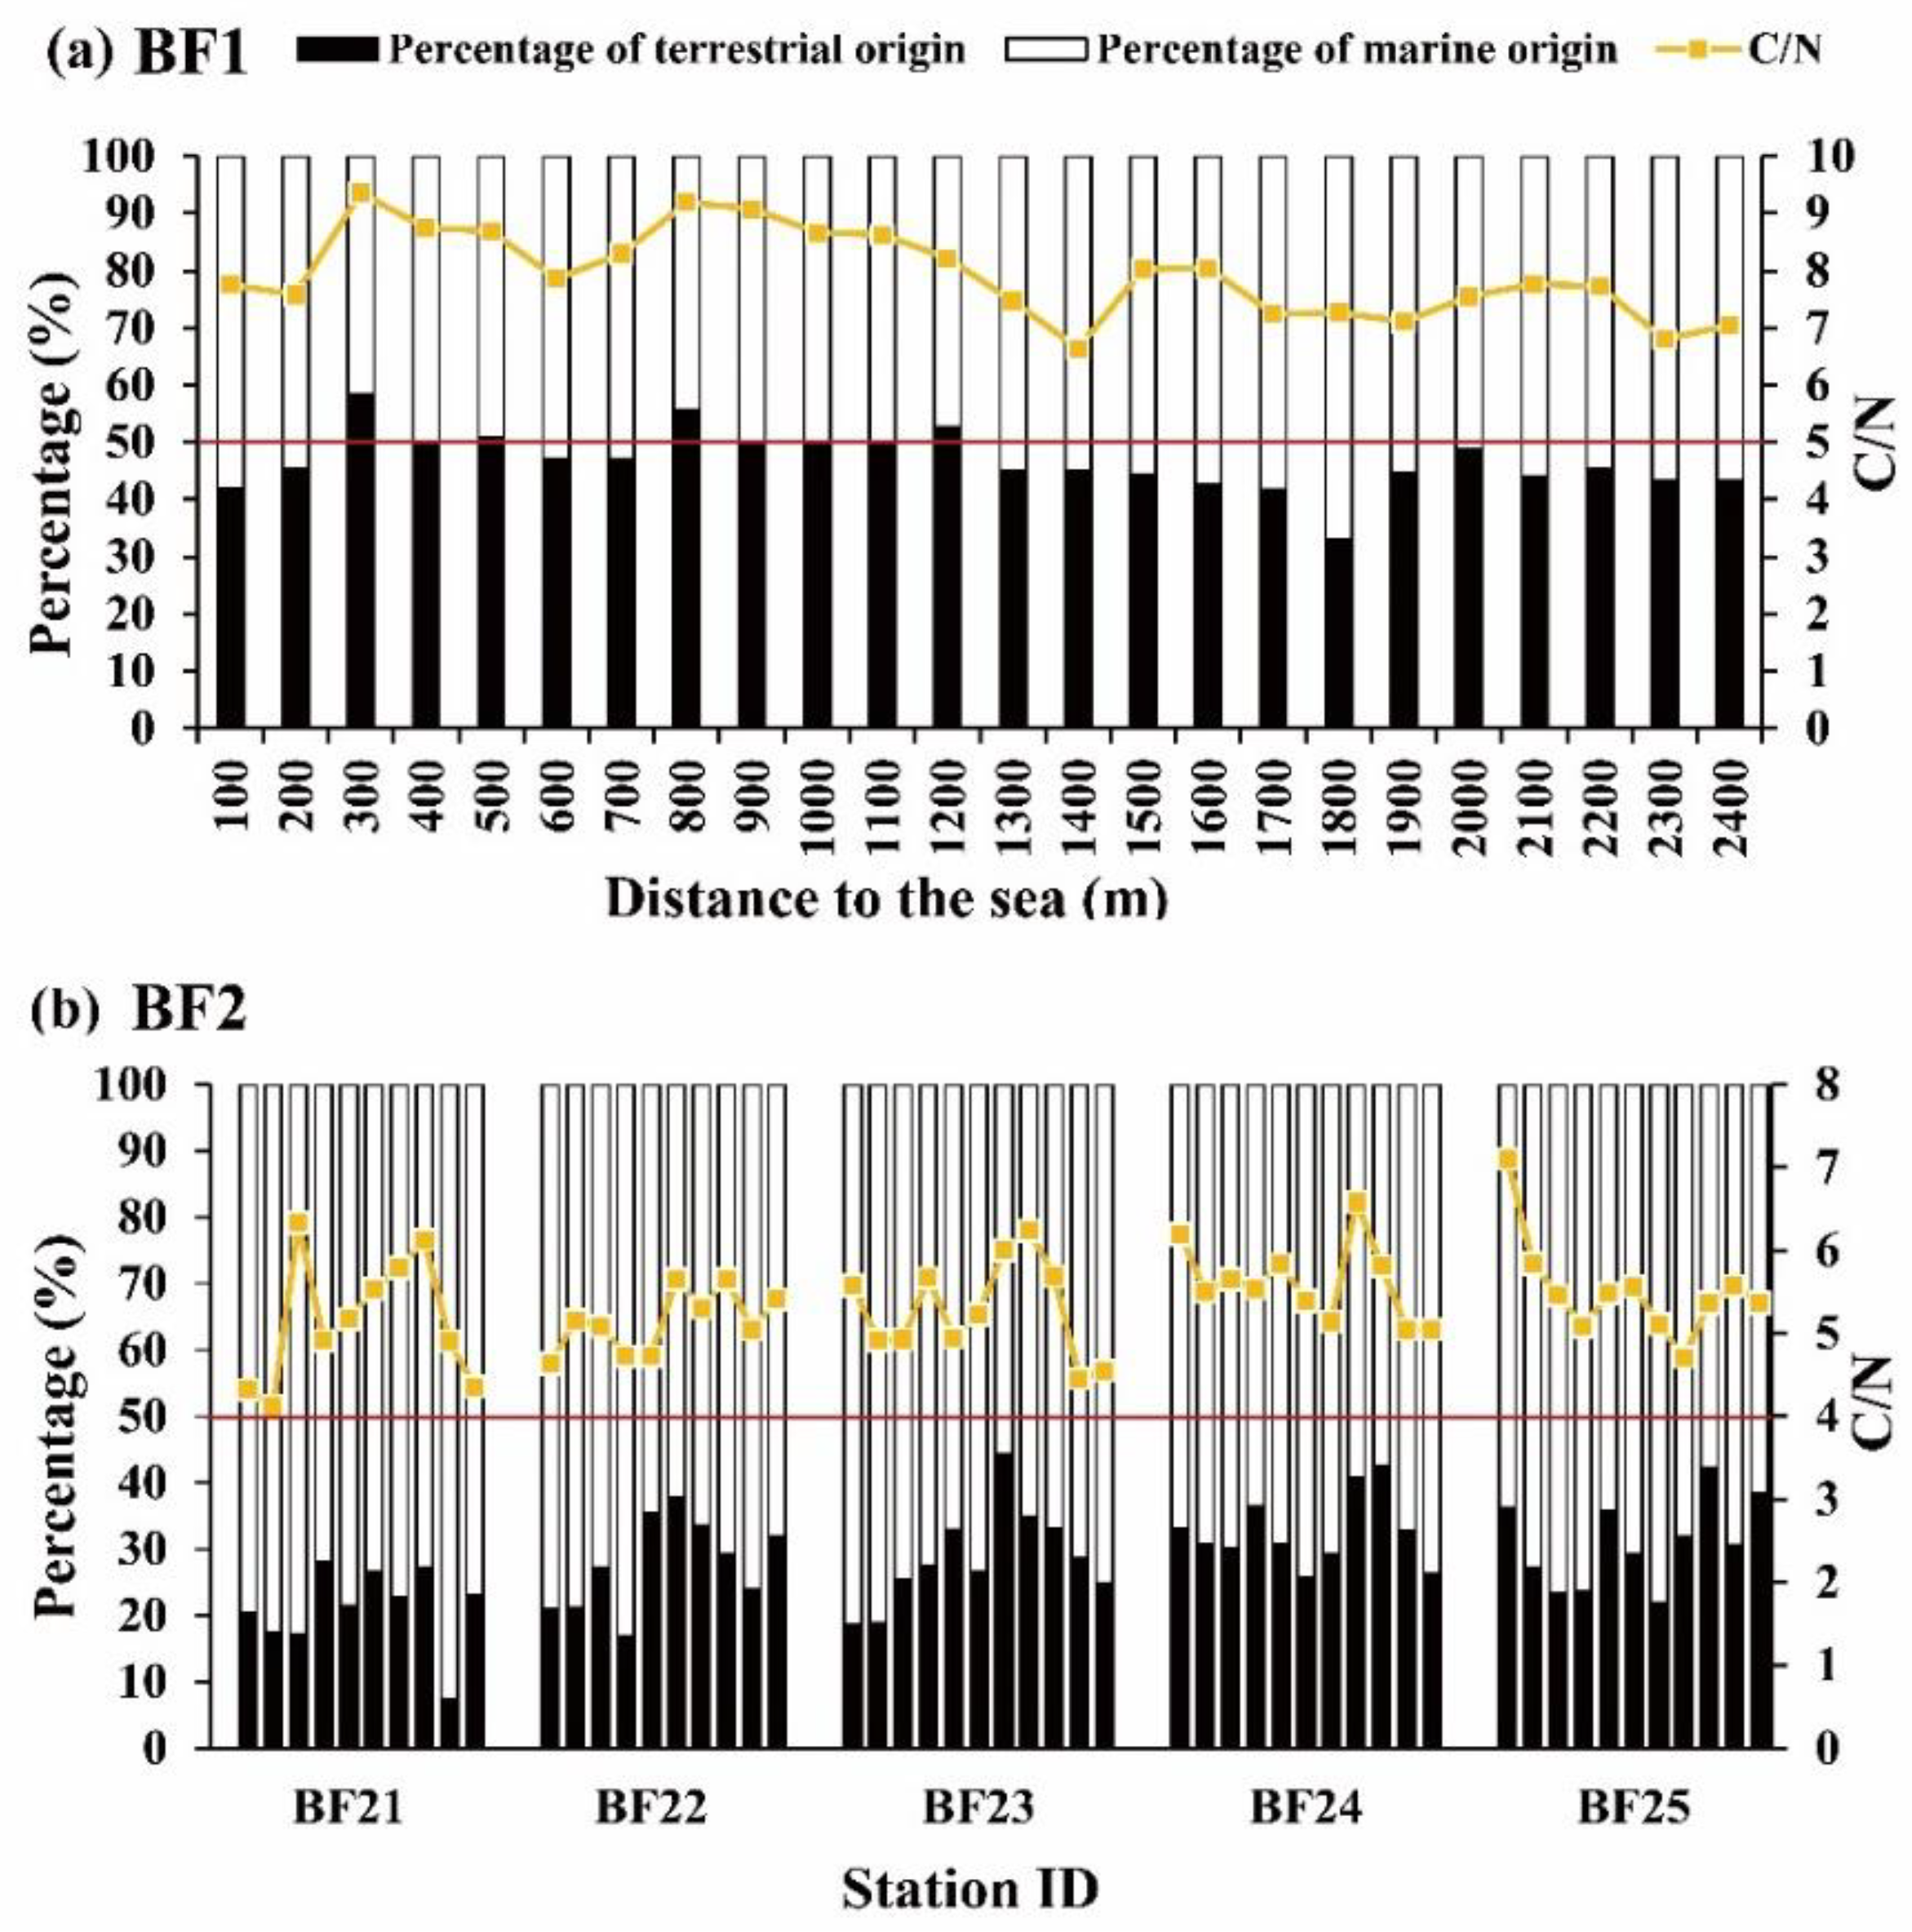
3.1.2. Bare Tidal Flat Sediments

The TOC content of the bare tidal flat sediments closest to the vegetated area (BF1) ranged from 1.09 to 4.58 mg/g, with a mean of 2.72 ± 0.98 mg/g, while the C/N ratio ranged from 6.64 to 9.35, with a mean of 7.95 ± 0.74. The TOC content of the tidal flat sediments further away from the vegetated area (BF2) ranged from 0.98 to 1.63 mg/g, with a mean of 1.22 ± 0.25 mg/g, which was significantly lower than for the BF1 sediments. Similarly, the C/N values for the BF2 sediments were lower than for the BF1 sediments, ranging from 4.95 to 5.88, with a mean of 5.36 ± 0.58 (Figure 3). This trend corresponds to BF2 being farther away from the area of S. alterniflora growth, and being less influenced by human activity. Figure 3 also indicates a correlation between TOC content, C/N ratios, and distance from the coast—specifically, the farther the distance from the coast, the lower the TOC content and C/N ratio. This trend was stronger at BF1 (TOC: R2 = 0.4449; C/N: R2 = 0.383) than at BF2 (TOC: R2 = 0.1066; C/N: R2 = 0.0699). The C/N ratio measured in the bare tidal flat areas ranged from 4 to 9.5, which was lower than the 7–11 range of the vegetated saltmarsh sediment.

3.2. Stable Carbon Isotopes in Tidal Flats

3.2.1. δ13C of Vegetated Saltmarsh Sediments

Surface sediment samples were collected from representative vegetation growth areas of P. australis, S. glauca (C3 plants), S. alterniflora, and I. cylindrica (C4 plants) for δ 13C analysis. The results showed that the δ 13C values of the vegetated saltmarsh sediment ranged from −24.25‰ to −18.82‰, with a mean of −22.37 ± 1.31‰ (Table 2). The δ13C values of the sediment from the area populated by C3 plants ranged from −24.25‰ to −21.12‰, with a mean of −22.82 ± 1.2‰, compared a range of −23.05‰ to −18.82‰ and a mean of −21.97 ± 1.27‰ for the area colonised by C4 vegetation.

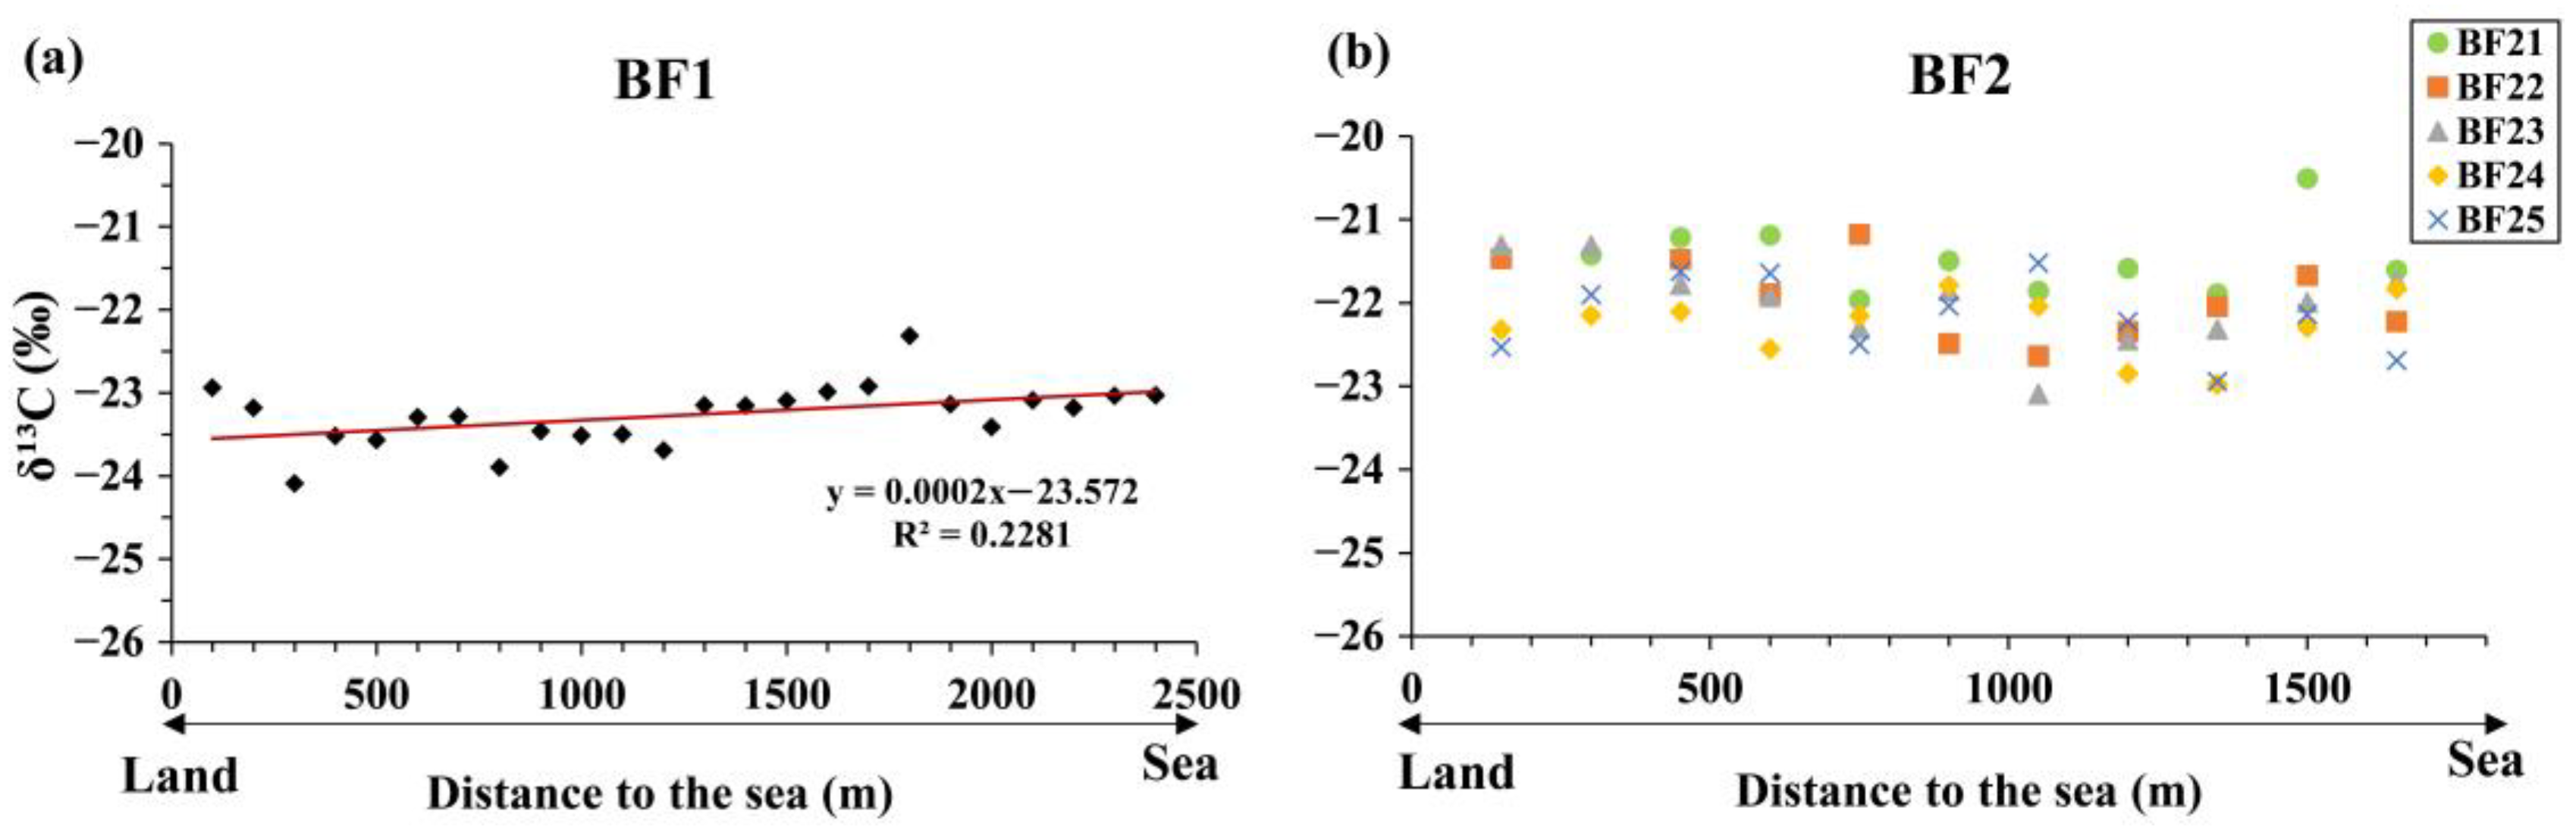
3.2.2. δ13C of Bare Tidal Flat Sediments

The δ13C values of the sediment from BF1 ranged from −24.09‰ to −22.31‰, with an average value of −23.27 ± 0.36‰, compared to a range of −23‰ to −21‰ (Figure 4) and a mean of −21.91 ± 0.74‰ for BF2. Through correlation analysis and ANOVA, we found that 𝛿13C values did not vary significantly with distance from the sea, yielding only a weak correlation (R2 = 0.228, p < 0.01).

3.3. Organic Carbon Sources

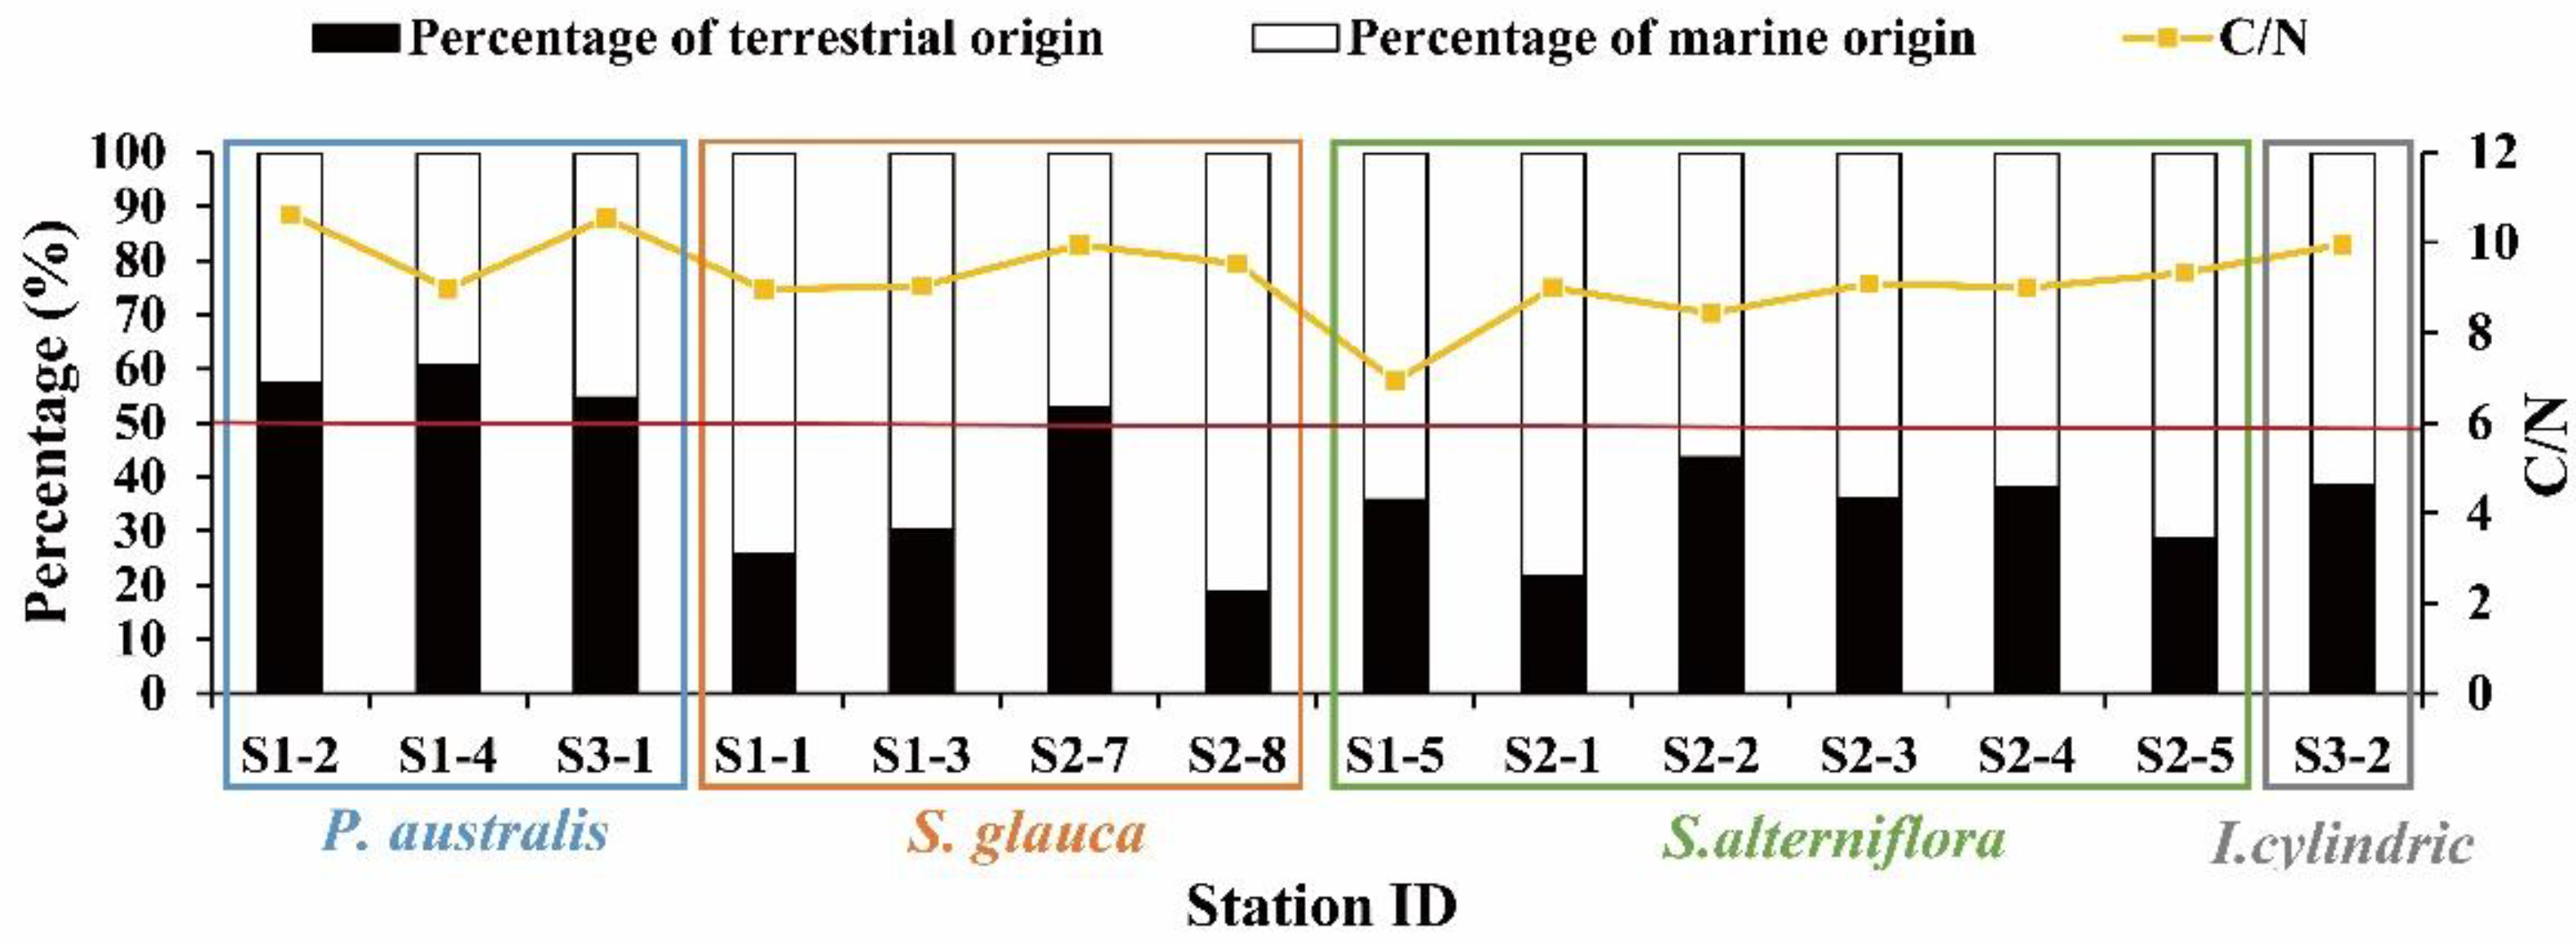
3.3.1. Vegetated Saltmarsh Sediments

The results of the two-terminal mixing model showed that the proportion of organic carbon contribution from terrestrial sources in the vegetated area of the Rudong coastal zone ranged from 18.67% to 60.71%, while the contribution from marine sources ranged from 39.29% to 81.33%. These value ranges are large, although the overall contribution of marine sources was higher than that of terrestrial sources. The organic carbon sources were complex, with high variability between the vegetated saltmarsh sampling points. The overall C/N ratio ranged from 6 to 11, and the organic carbon sources were mainly marine. We divided the study area according to the different vegetation types, with the different organic carbon sources shown in Figure 5. In the P. australis growing area, the mean terrestrial organic carbon contribution was 57.62%, and the C/N ratio was 10.05; in the S. glauca growing area, the mean terrestrial organic carbon contribution was 31.83%, and the C/N ratio was 9.37; in the S. alterniflora growing area, the mean terrestrial organic carbon contribution was 33.94%, and the C/N ratio was 8.63; and in the I. cylindrica growing area, the mean terrestrial organic carbon contribution was 38.3%, and the C/N ratio was 9.96. Based on these results, the proportion of terrestrial carbon sources was highest in the sediment colonised by P. australis. In comparison, the contribution from marine sources was larger in the S. glauca growing area.

3.3.2. Bare Tidal Flat Sediments

The C/N ratio of the surface sediments in the BF1 area varied between 6 and 10, with a mean of 7.95 ± 0.74, with a corresponding range in the BF2 area of 4 and 6 and a mean of 5.36 ± 0.58. Based on the two-terminal mixing model, 33.03–58.39% of the organic carbon in the BF1 sediments was from terrestrial sources (mean = 46.66% ± 0.05%), while 41.61–66.97% was from marine sources (mean = 53.34% ± 0.05%). In the BF2 sediments, 7.3–44.26% of the organic carbon came from terrestrial sources (mean = 28.35% ± 0.07%), while 55.74–92.7% came from marine sources (mean = 71.65% ± 0.07%). Overall, the BF2 sediments had a significantly higher proportion of organic carbon from marine sources than the BF1 sediments (p < 0.05, Figure 6). The BF1 area was closer to the area of S. alterniflora growth, although in comparison to the 𝛿13C values of this C4 plant of approximately −14‰, the δ13C values of the associated sediments were more negative. Although dominated by marine sources, the BF1 area had a relatively higher proportion of organic carbon from terrestrial sources, such as vegetated land and rivers. Comparatively, the BF2 area is far from the vegetated area and outside the polder area, being dominated by marine autochthonous organic carbon sources.

3.4. Correlation Analysis Results

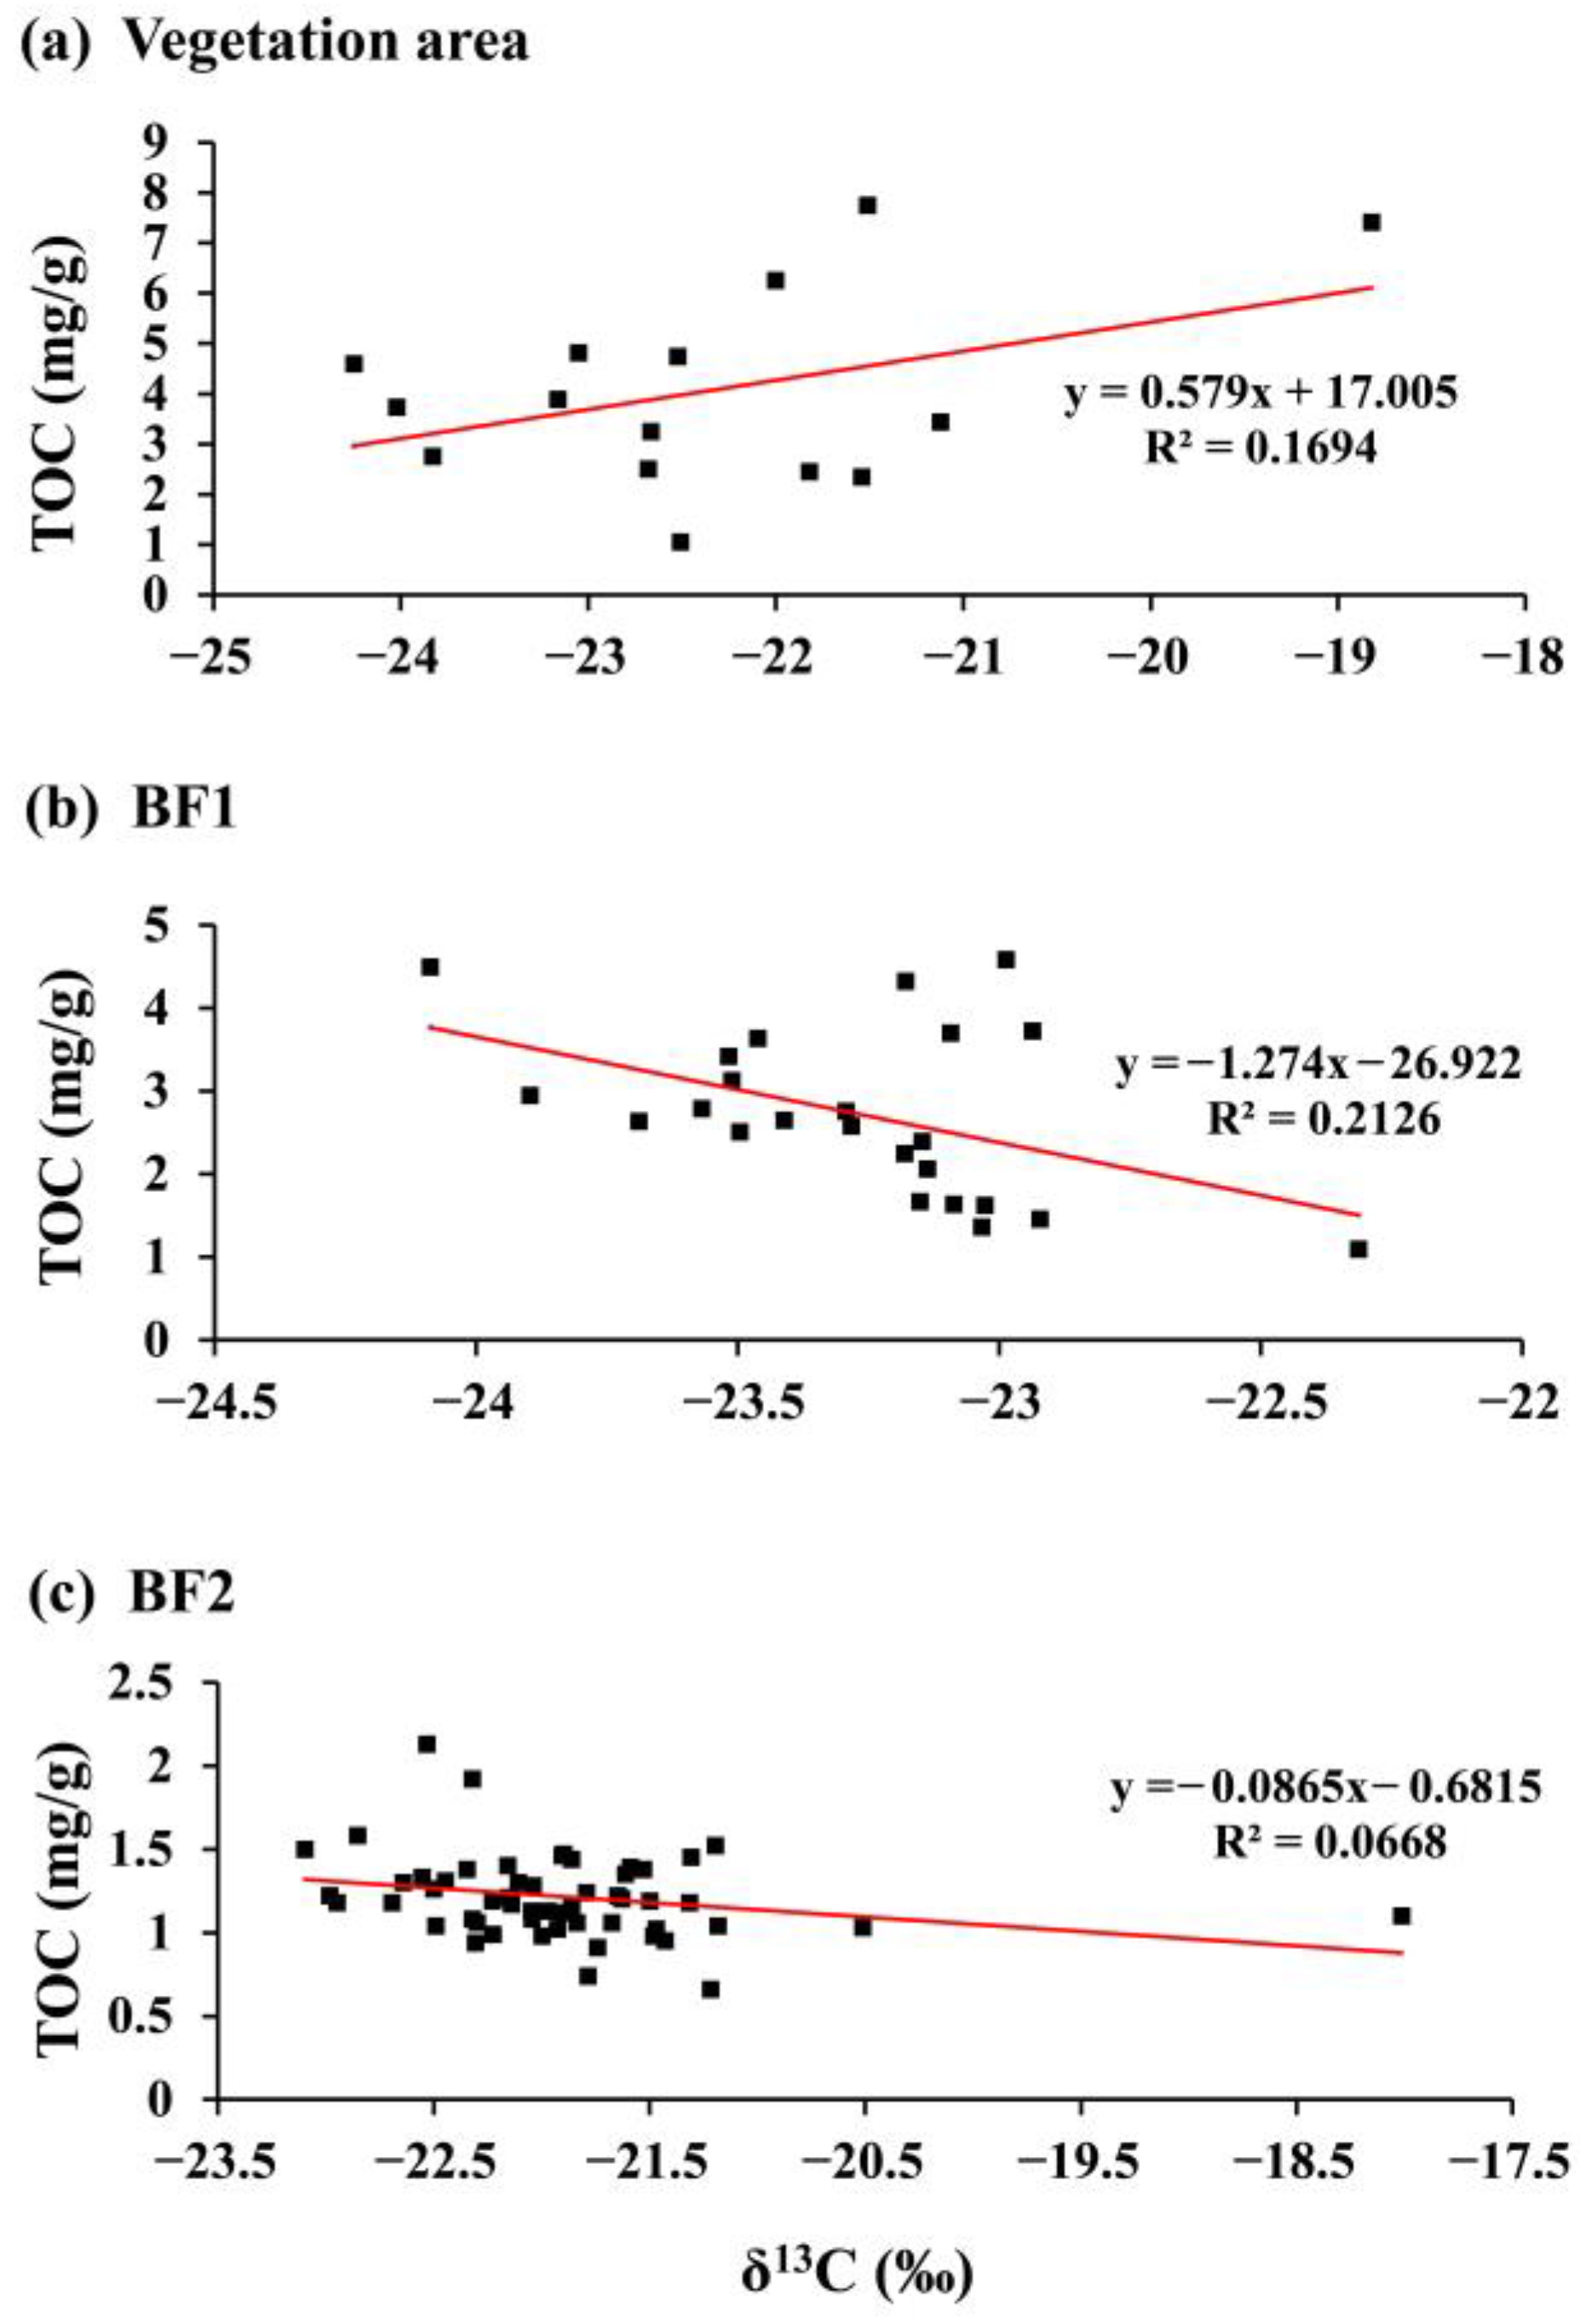
3.4.1. Surface Sediment δ13C Values and TOC

To investigate the effect of saltmarsh vegetation on organic carbon, we performed a correlation analysis and ANOVA between surface sediment δ13C values and TOC in the studied vegetated saltmarsh and non-vegetated (tidal flat) areas. The resulting correlations varied between the three studied areas: in the vegetated saltmarsh area, δ13C values and TOC showed a weak positive correlation (R2 = 0.17, p < 0.01), whereas a weak negative correlation was found in the bare tidal flat area near to the saltmarsh (BF1: R2 = 0.21, p < 0.01), and the correlation for the area far from the saltmarsh was not significant (BF2: R2 = 0.07, p > 0.05; Figure 7).

3.4.2. Surface Sediment 𝛿13C Values and C/N Ratios

We also correlated surface sediment 𝛿13C values and C/N ratios in the vegetated growth area with the non-vegetated growth area. In our analysis (Figure 8), 𝛿13C values and C/N ratios showed no correlation in the vegetated saltmarsh area (R2 = 0.0008, p > 0.05), but a significant negative correlation in the bare tidal flat areas (R2 = 0.54, p < 0.001).

4. Discussion

4.1. Effect of Coastal Vegetation on Organic Carbon Content

As an essential nutrient for plant growth, carbon plays an important role in all plant life activities, and changes in response to external environmental stress [29]. The total organic carbon content is indicative of primary productivity to some extent, and changes in the C/N ratio are closely related to changes in TOC and TN [30]. In coastal wetlands, the main source of organic carbon is wetland plants, and the fractionation of carbon isotopes due to the diversity of plant types is an important basis for identifying the source(s) of carbon. The typical range of δ13C values for different sources of organic matter is from −34‰ to −20‰ for C3 plants, −19‰ to −9‰ for C4 plants, and −23‰ to −12‰ for algae [31], compared to −23‰ to −18‰ for marine phytoplankton and algae [32]. Our results for the Rudong coastal zone revealed that the wetland vegetation was a mixture of C3 and C4 vegetation, mainly dominated by S. alterniflora, P. australis, and S. glauca, with the C4 plants having higher 𝛿13C values than the C3 plants. In contrast, the δ13C values of the sediments colonised by C3 and C4 vegetation were not significantly different.
However, the organic carbon content of the sediments colonised by C4 vegetation was slightly higher than that of the sediments colonised by C3 vegetation, which indicates a greater contribution to the soil carbon pool by C4 vegetation. In a study of soil organic carbon dynamics in coastal wetlands in eastern China after the invasion of S. alterniflora, Zhang [33] found that soil organic carbon storage was enhanced, as the roots of this species played an important role in carbon accumulation relative to C3 vegetation. Indeed, there is a high potential for carbon accumulation in soils from the apoplankton and roots of S. alterniflora [10,33]. Zhang [33] also found that the organic matter added to the sediment colonised by S. alterniflora did not come exclusively from the vegetation itself, but partly from marine phytoplankton and other sources. Some studies [5,34,35] have found that S. alterniflora results in greater marine carbon input compared to C3 vegetation such as P. australis, which is also consistent with our results. In addition, S. alterniflora invades in a land-to-sea direction, and the 𝛿13C values of sediments have correspondingly increased with invasion time [10]. In poldered areas, the inner parts of polder dikes show a variety of vegetation symbioses, and dikes typically block tidal inflows, which can lead to a greater carbon contribution from terrestrial sources. That said, marine sources of organic matter can still dominate in the presence of salt-tolerant plants. Importantly, our results indicate that large-scale polder activities are likely to have significant impacts on the relative contributions of organic matter from different vegetation types, as well as from marine and terrestrial sources.

4.2. Surface Sediment 𝛿13C Values in Relation to TOC

Terrestrial soils are one of the direct carbon sinks for organic carbon derived from surface vegetation, the characteristics of which largely depend on vegetation type [36]. In comparison, organic carbon sources in the ocean are mainly dominated by surface sediments and suspended marine particulate matter. Based on the results from the analyses of TOC and 𝛿13C (Figure 7), the bare tidal flat area close to saltmarsh vegetation (BF1) is more influenced by organic carbon inputs from vegetation—especially S. alterniflora—and, in the outer part of the polder, sediment organic carbon content is more influenced by marine sources, including tidal hydrodynamics and phytoplankton. Furthermore, the mixture of C3 and C4 plants in the study area, as well as their differing influences on sediment stability, may also partly explain the variable carbon content of the sediments [13]. For example, in a study by Zhang [33], the observed increase in soil organic carbon content following S. alterniflora colonisation did not come exclusively from the vegetation itself but, rather, a large proportion came from C3 plants and phytoplankton.

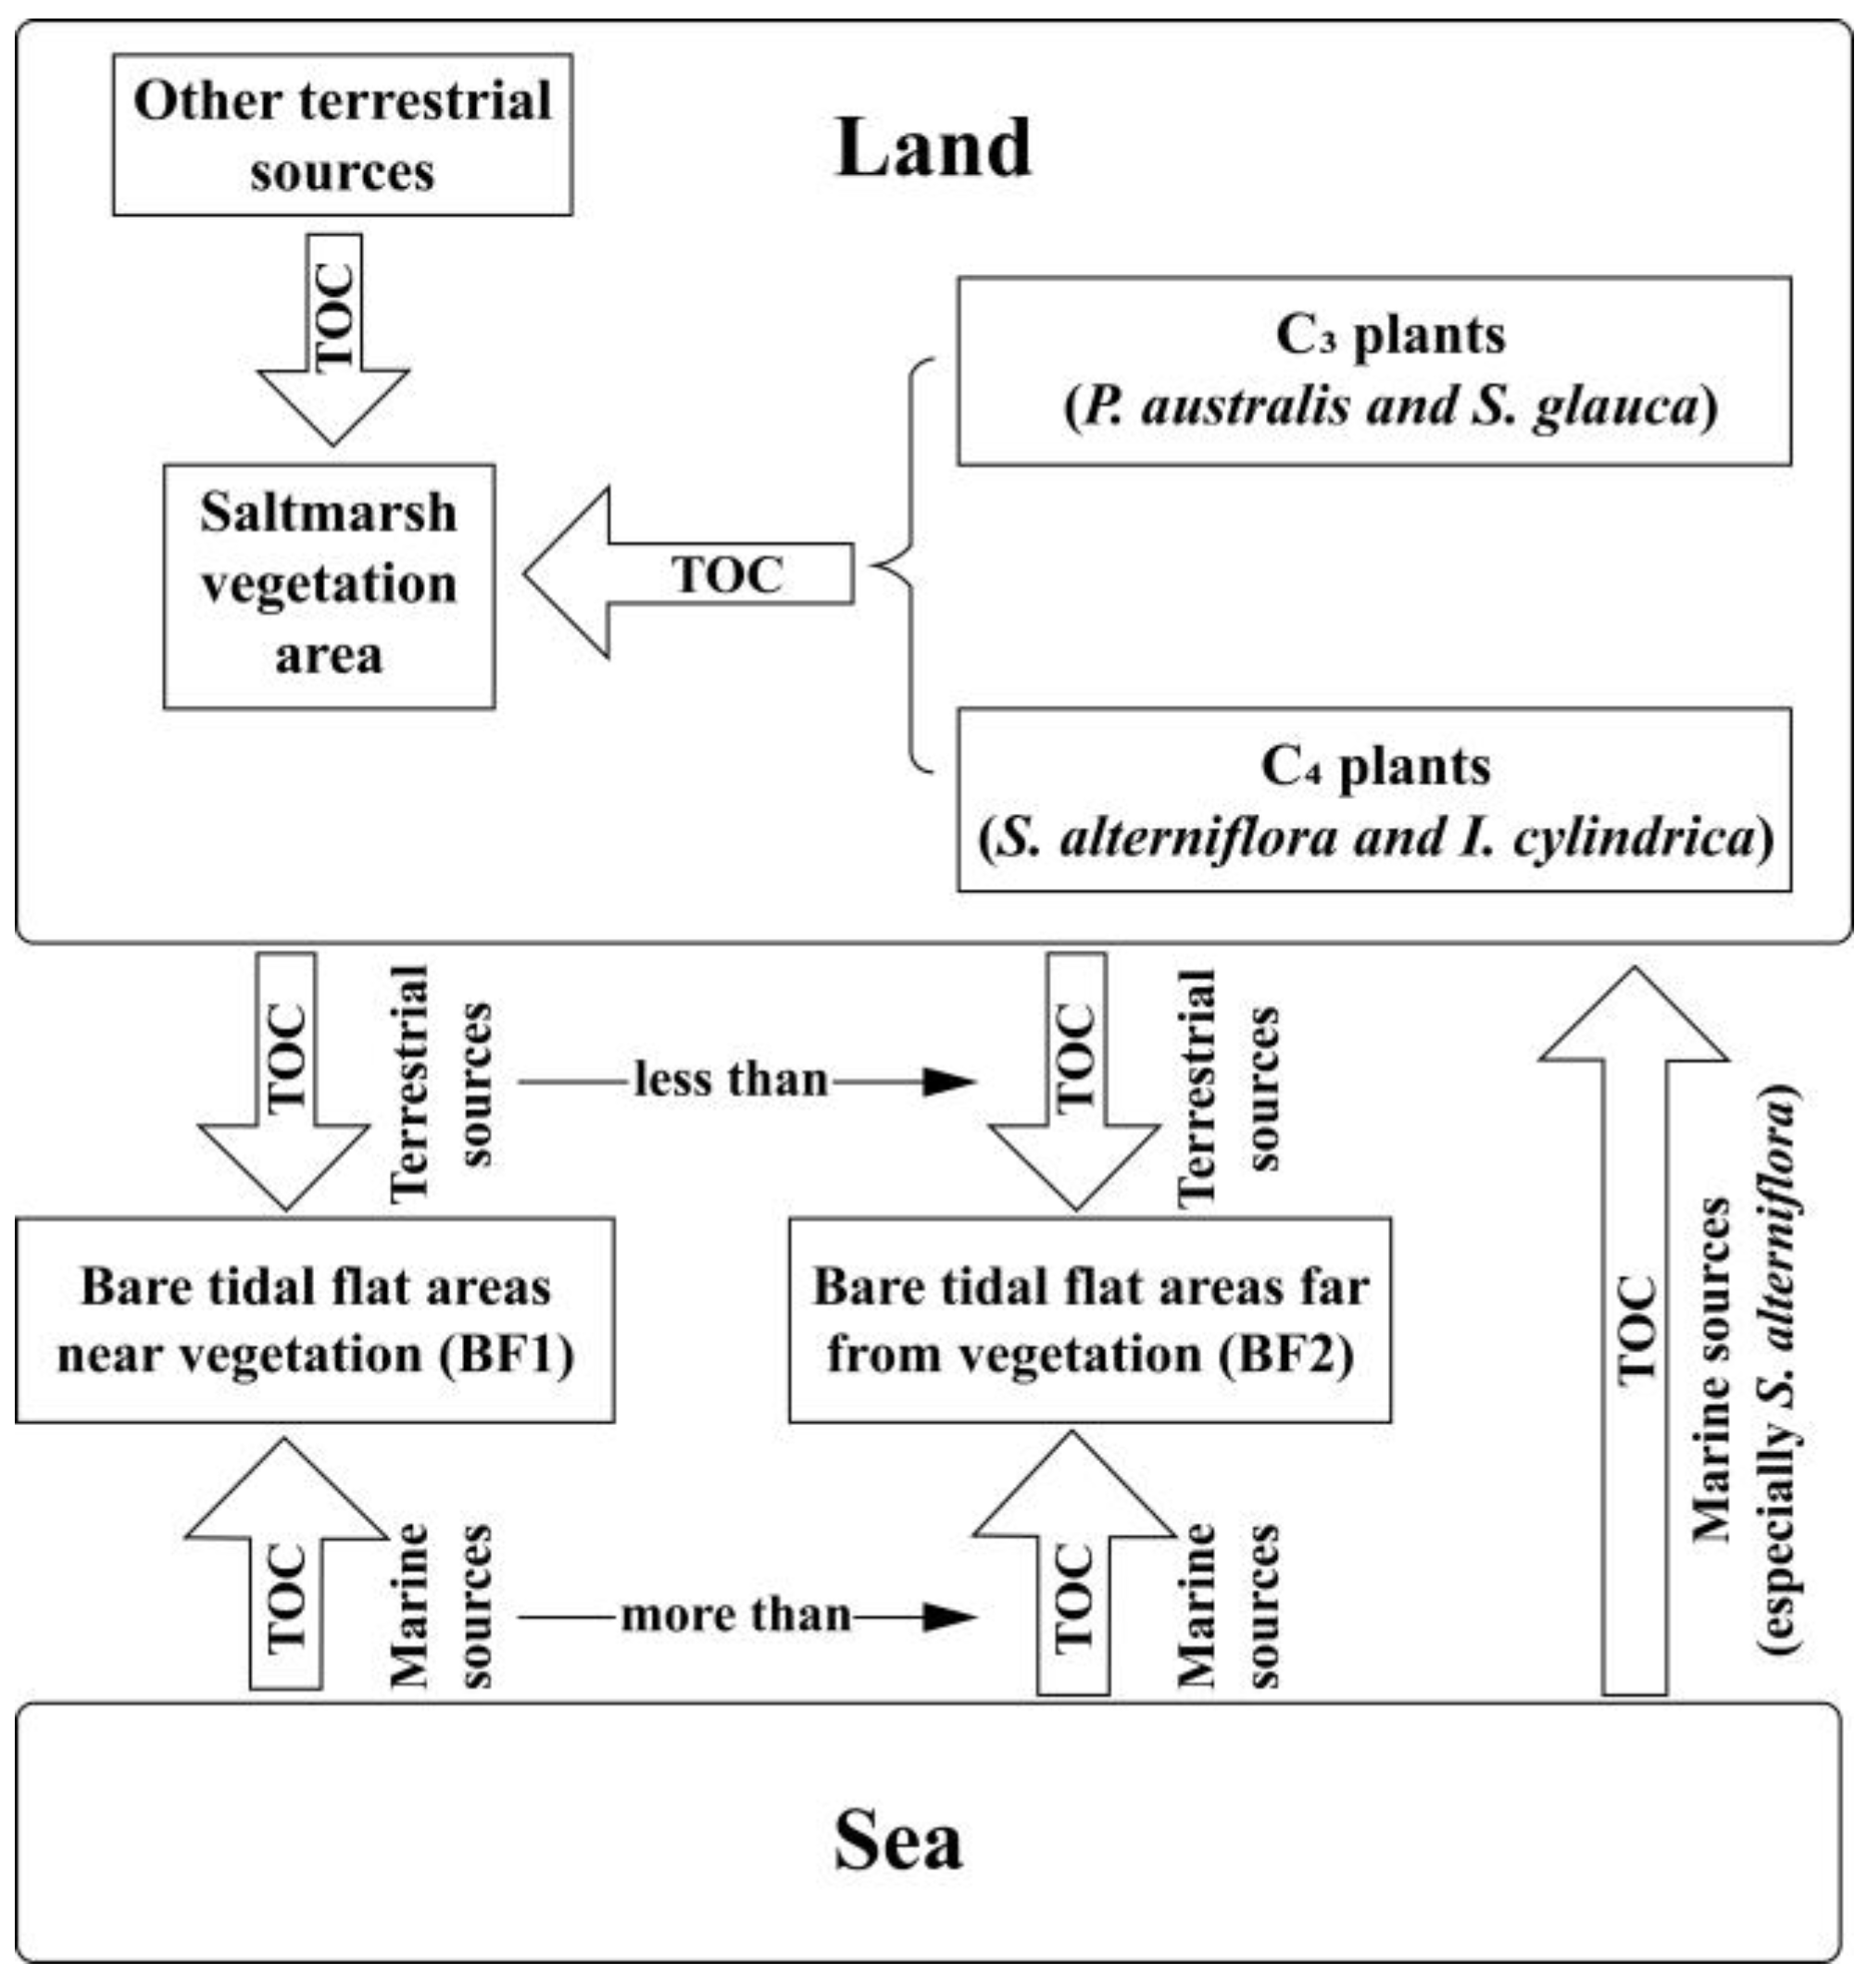
4.3. Sources and Influencing Factors of Organic Carbon in Surface Sediments

The Rudong intertidal area of Jiangsu is influenced by various factors—such as rivers, vegetation, tidal dynamics, and polder activities—that block tides, alter vegetation and, thus, affect ecology [7,37]. Yu [36] used stable carbon isotopes and C/N ratios to analyse the sources of organic carbon in 91 surface sediments of the Pearl River Delta and Estuary, concluding that this approach was effective in the study of organic carbon sources in estuarine sediments. Gireeshkumar [38] further characterised estuarine hydrodynamic conditions and anthropogenic organic carbon inputs as factors contributing to organic carbon accumulation in the surface sediments of tropical estuaries of the southwest coast of India during different monsoon periods. Kubo [39] reported evidence of seasonality in organic carbon dynamics in the surface sediments of Tokyo Bay, with high primary productivity in summer, producing and depositing large amounts of organic carbon. Based on our observations, the C/N ratios of the surface sediments in the Rudong coastal zone indicate that organic carbon sources are a mixture of marine and terrestrial types.
The mean C/N ratios of the sediments in the three studied areas (i.e., vegetated saltmarsh, bare tidal flats near to the vegetated area, and bare tidal flats far from the vegetated area) were 9.24, 7.95, and 5.35, respectively. As the C/N ratios of organic carbon from marine sources range from 5 to 9 [19,40], these data indicate progressively greater marine influence with distance from the land. However, because of the spatial heterogeneity of coastal wetlands, C/N ratios are mostly used for qualitative analysis, and do not typically accurately reflect organic carbon sources [41]. Some studies suggest that if C/N ratios strictly reflect physical sources of organic carbon then these values will be correlated with 𝛿13C values [42,43]. Based on the results from the analyses of 𝛿13C and C/N (Figure 8), the C/N ratios in the vegetated area cannot be confidently used as an indicator of organic matter sources; thus, these data need to be combined with other methods. In comparison, the bare tidal flat areas are less affected by vegetation and, consequently, the C/N ratios better indicate organic matter sources to some extent.
We further analysed the organic matter sources of the sediments by combining the two-terminal mixing model with the δ13C values. In the vegetated saltmarsh areas, the effect of vegetation type on carbon accumulation led to differences in the resulting organic matter sources, including greater marine source inputs in the area colonised by S. alterniflora. The bare tidal flat area (BF1) close to the S. alterniflora growth area was dominated by marine sources overall, but these sources were not prominent compared to the S. alterniflora growth area. Thus, we infer that in addition to the influence of S. alterniflora, the BF1 area is also influenced by other terrestrial sources of organic matter, such as rivers, tidal ditch inputs, and a combination of terrestrial and other plant debris from saltmarshes [44], alongside offshore human activity [45]. The environmental changes resulting from these activities can also potentially change the nature and content of organic carbon matter in marine sediments [46]. In contrast, BF2 shows high marine source inputs of organic carbon which, combined with the C/N ratios, are inferred to be dominated by marine phytoplankton and the soft tissues of other marine organisms (Figure 9). Gireeshkumar [38] found that 𝛿13C values gradually increased from the interior of the estuary to its seaward side, indicating an increasing contribution of marine autochthonous organic carbon. However, this phenomenon was not found to be significant in the present study. This may be due to the hydrodynamic conditions and the flat, non-vegetated areas of these tidal flat sites, which likely enable enhanced mixing of organic matter from different sources [47].

5. Conclusions

The oceans play an important role in the global carbon cycle. The introduction of blue carbon has led to thinking about how to use the ocean’s carbon cycle to reduce atmospheric CO2 and mitigate climate change, resulting in many “blue carbon” programmes including wetland vegetation restoration, increased biogenic carbon pumping, and sequestration of carbon on the seabed. Marine vegetation habitats—particularly mangroves, salt marsh vegetation, and seagrasses—are the main carbon sinks for blue carbon.
In this study, 𝛿13C, TOC content, and C/N ratios were measured in the surface sediments of the vegetated saltmarsh area and bare tidal flat areas of the Rudong coastal zone. Organic carbon sources were also quantitatively analysed using a two-terminal mixing model. Our results show that the organic carbon content of the vegetated saltmarsh sediment is higher than that of the bare tidal flat areas, with the tidal flat sediments nearer to the vegetated area (BF1) having a relatively higher organic carbon content than sediments further away (BF2). Furthermore, organic carbon sources in the C3 vegetation growth areas are dominated by terrestrial sources while, in contrast, the C4 vegetation growth areas—especially those of S. alterniflora—are dominated by marine sources. The BF1 area is influenced by the interaction between terrestrial and marine carbon sources, with the proportions being roughly equal. In comparison, the BF2 sediments have a much greater contribution of organic carbon from marine sources, including phytoplankton. The results of this study help to clarify the influence of coastal zone vegetation on the source(s) of organic carbon, which may contribute to the development of “blue carbon” programmes in the future. Further factors influencing the source of organic carbon are yet to be studied.

Author Contributions

Conceptualization, Q.S. and Y.C.; methodology, Q.M.; software, J.L.; investigation, Q.M., Q.S., Y.C., Y.M. and J.L.; data curation, Q.M. and Y.M.; writing—original draft preparation, Y.M.; writing—review and editing, Q.S.; supervision, Q.S.; project administration, Q.S. and Y.C. All authors have read and agreed to the published version of the manuscript.

Funding

This work was supported by the National Natural Science Foundation of China (Grant No. 41671195); major natural science research projects of colleges and universities in Jiangsu Province (No. 19KJA180004); and the special fund for natural resources development of Jiangsu Province (Marine Science and Technology Innovation) (No. JSZRHYKJ202002 and JSZRHYKJ202004).

Institutional Review Board Statement

Not applicable.

Informed Consent Statement

Not applicable.

Data Availability Statement

The data that support the findings of this study are available from the corresponding author upon request.

Conflicts of Interest

The authors declare no conflict of interest.

References

  1. Nellemann, C.; Corcoran, E.; Duarte, C.M.; Valdes, L.; De Young, C.; Fonseca, L.; Grimsditch, G. Blue Carbon: The Role of Healthy in Binding Carbon: A Rapid Response Assessment; United Nations Environment Programme, GRID-Arenal: Arendal, Norway, 2009. [Google Scholar]
  2. Howard, J.; Sutton-Grier, A.; Herr, D.; Kleypas, J.; Landis, E.; Mcleod, E.; Pidgeon, E.; Simpson, S. Clarifying the role of coastal and marine systems in climate mitigation. Front. Ecol. Environ. 2017, 15, 42–50. [Google Scholar] [CrossRef]
  3. Nahlik, A.M.; Fennessy, M.S. Carbon storage in US wetlands. Nat. Commun. 2016, 7, 13835. [Google Scholar] [CrossRef] [Green Version]
  4. Donato, D.C.; Boone Kauffman, J.; Murdiyarso, D.; Kurnianto, S.; Stidham, M.; Kanninen, M. Mangroves among the most carbon-rich forests in the tropics. Nat. Geosci. 2011, 4, 293–297. [Google Scholar] [CrossRef]
  5. Tang, L.; Gao, Y.; Li, B.; Wang, Q.; Wang, C.; Zhao, B. Spartina alterniflora with high tolerance to salt stress changes vegetation pattern by outcompeting native species. Ecosphere 2014, 5, 1–18. [Google Scholar] [CrossRef]
  6. Allison, S.K. Ecological Restoration and Environmental Change: Renewing Damaged Ecosystems; Routledge: London, UK, 2012. [Google Scholar]
  7. Li, C.; Tao, Y.; Zhao, M.; Yu, K.; Xu, L.; Fang, S. Soil characteristics and their potential thresholds associated with Scirpus mariqueter distribution on a reclaimed wetland coast. J. Coastal Conserv. 2018, 22, 1107–1116. [Google Scholar] [CrossRef]
  8. Cole, J.J.; Prairie, Y.T.; Caraco, N.F.; McDowell, W.H.; Tranvik, L.J.; Striegl, R.G.; Duarte, C.M.; Kortelainen, P.; Downing, J.A.; Middelburg, J.J.; et al. Plumbing the global carbon cycle: Integrating inland waters into the terrestrial carbon budget. Ecosystems 2007, 10, 172–185. [Google Scholar] [CrossRef] [Green Version]
  9. Dvorak, M.; Mora, G.; Graniero, L.E.; Surge, D. Carbon and nitrogen tracers of land use effects on net ecosystem metabolism in mangrove estuaries, southwest Florida. Estuar. Coast. Shelf Sci. 2016, 181, 14–26. [Google Scholar] [CrossRef]
  10. Yang, W.; Zhao, H.; Chen, X.; Yin, S.; Cheng, X.; An, S. Consequences of short-term C4 plant Spartina alterniflora invasions for soil organic carbon dynamics in a coastal wetland of Eastern China. Ecol. Eng. 2013, 61, 50–57. [Google Scholar] [CrossRef]
  11. Hu, L.; Shi, X.; Bai, Y.; Qiao, S.; Li, L.; Yu, Y.; Yang, G.; Ma, D.; Guo, Z. Recent organic carbon sequestration in the shelf sediments of the Bohai Sea and Yellow Sea, China. J. Mar. Syst. 2016, 155, 50–58. [Google Scholar] [CrossRef]
  12. Kang, X.; Song, J.; Yuan, H.; Li, X.; Li, N.; Duan, L. The sources and composition of organic matter in sediments of the Jiaozhou Bay: Implications for environmental changes on a centennial time scale. Acta Oceanol. Sin. 2017, 36, 68–78. [Google Scholar] [CrossRef]
  13. Lo, V.B.; Bouma, T.J.; van Belzen, J.; Van Colen, C.; Airoldi, L. Interactive effects of vegetation and sediment properties on erosion of salt marshes in the Northern Adriatic Sea. Mar. Environ. Res. 2017, 131, 32–42. [Google Scholar] [CrossRef] [PubMed]
  14. Zhang, P.; Nie, M.; Li, B.; Wu, J. The transfer and allocation of newly fixed C by invasive Spartina alterniflora and native Phragmites australis to soil microbiota. Soil Biol. Biochem. 2017, 113, 231–239. [Google Scholar] [CrossRef]
  15. Zhou, C.; An, S.; Deng, Z.; Yin, D.; Zhi, Y.; Sun, Z.; Zhao, H.; Zhou, L.; Fang, C.; Qian, C. Sulfur storage changed by exotic Spartina alterniflora in coastal saltmarshes of China. Ecol. Eng. 2009, 35, 536–543. [Google Scholar] [CrossRef]
  16. Bromberg Gedan, K.; Silliman, B.R.; Bertness, M.D. Centuries of Human-Driven Change in Salt Marsh Ecosystems. Annu. Rev. Mar. Sci. 2009, 1, 117–141. [Google Scholar] [CrossRef] [PubMed] [Green Version]
  17. Hamilton, D.P.; McBride, C.; Özkundakci, D.; Schallenberg, M.; Verburg, P.; Winton, M.D.; Kelly, D.; Hendy, C.; Ye, W. Effects of climate change on New Zealand Lakes. In Climatic Change and Global Warming of Inland Waters: Impacts and Mitigation for Ecosystems and Societies; John Wiley & Sons, Ltd.: Hoboken, NJ, USA, 2013; pp. 337–366. [Google Scholar]
  18. Capon, S.J.; Bunn, S.E. Assessing climate change risks and prioritising adaptation options using a water ecosystem services-based approach. Water Ecosyst. Serv. 2015, 17–25. [Google Scholar] [CrossRef]
  19. Middelburg, J.J.; Herman, P.M.J. Organic matter processing in tidal estuaries. Mar. Chem. 2007, 106, 127–147. [Google Scholar] [CrossRef]
  20. Hu, L.; Guo, Z.; Feng, J.; Yang, Z.; Fang, M. Distributions and sources of bulk organic matter and aliphatic hydrocarbons in surface sediments of the Bohai Sea, China. Mar. Chem. 2009, 113, 197–211. [Google Scholar] [CrossRef]
  21. Burdige, D.J. Preservation of Organic Matter in Marine Sediments: Controls, Mechanisms, and an Imbalance in Sediment Organic Carbon Budgets? Chem. Rev. 2007, 107, 467–485. [Google Scholar] [CrossRef]
  22. Ma, L.; Yang, L.; Xia, L.; Shen, M.; Yin, S.; Li, Y. Long-Term Effects of Inorganic and Organic Amendments on Organic Carbon in a Paddy Soil of the Taihu Lake Region, China. Pedosphere 2011, 21, 186–196. [Google Scholar] [CrossRef]
  23. Smith, C.B.; Cohen, M.C.L.; Pessenda, L.C.R.; França, M.C.; Guimarães, J.T.F. Holocenic proxies of sedimentary organic matter and the evolution of Lake Arari-Amazon Region. Catena 2012, 90, 26–38. [Google Scholar] [CrossRef]
  24. Zhang, L.; Yin, K.; Yang, Y.; Zhang, D. Distribution characteristics and sources of sedimentary organic matter in the pearl river estuary and adjacent coastal waters, southern China. J. Earth Sci. 2013, 24, 262–273. [Google Scholar] [CrossRef] [Green Version]
  25. Minoura, K.; Hoshino, K.; Nakamura, T.; Wada, E. Late Pleistocene-Holocene paleoproductivity circulation in the Japan Sea: Sea-level control on δ13C and δ15N records of sediment organic material. Palaeogeogr. Palaeoclimatol. Palaeoecol. 1997, 135, 41–50. [Google Scholar] [CrossRef]
  26. Vaalgamaa, S.; Sonninen, E.; Korhola, A.; Weckström, K. Identifying recent sources of organic matter enrichment and eutrophication trends at coastal sites using stable nitrogen and carbon isotope ratios in sediment cores. J. Paleolimnol. 2013, 50, 191–206. [Google Scholar] [CrossRef]
  27. Oczkowski, A.; Markham, E.; Hanson, A.; Wigand, C. Carbon stable isotopes as indicators of coastal eutrophication. Ecol. Appl. 2014, 24, 457–466. [Google Scholar] [CrossRef]
  28. Kendall, C.; Silva, S.R.; Kelly, V.J. Carbon and nitrogen isotopic compositions of particulate organic matter in four large river systems across the United States. Hydrol. Processes 2001, 15, 1301–1346. [Google Scholar] [CrossRef]
  29. Rong, Q.; Liu, J.; Cai, Y.; Lu, Z.; Zhao, Z.; Yue, W.; Xia, J. Leaf carbon, nitrogen and phosphorus stoichiometry of Tamarix chinensis Lour. in the Laizhou Bay coastal wetland, China. Ecol. Eng. 2015, 76, 57–65. [Google Scholar] [CrossRef]
  30. Liu, D.; Li, X.; Emeis, K.; Wang, Y.; Richard, P. Distribution and sources of organic matter in surface sediments of Bohai Sea near the Yellow River Estuary, China. Estuar. Coast. Shelf Sci. 2015, 165, 128–136. [Google Scholar] [CrossRef]
  31. Hedges, J.I.; Keil, R.G.; Benner, R. What happens to terrestrial organic matter in the ocean? Org. Geochem. 1997, 27, 195–212. [Google Scholar] [CrossRef]
  32. Deegan, L.A.; Garritt, R.H. Evidence for spatial variability in estuarine food webs. Mar. Ecol. Prog. Ser. 1997, 147, 31–47. [Google Scholar] [CrossRef] [Green Version]
  33. Zhang, Y.; Ding, W.; Luo, J.; Donnison, A. Changes in soil organic carbon dynamics in an Eastern Chinese coastal wetland following invasion by a C4 plant Spartina alterniflora. Soil Biol. Biochem. 2010, 42, 1712–1720. [Google Scholar] [CrossRef]
  34. Liao, C.; Luo, Y.; Jiang, L.; Zhou, X.; Wu, X.; Fang, C.; Chen, J.; Li, B. Invasion of Spartina alterniflora Enhanced Ecosystem Carbon and Nitrogen Stocks in the Yangtze Estuary, China. Ecosystems 2007, 10, 1351–1361. [Google Scholar] [CrossRef]
  35. Wang, D.; Zhang, R.; Xiong, J.; Guo, H.; Zhao, B. Contribution of invasive species Spartina alterniflora to soil organic carbon pool in coastal wetland: Stable isotope approach. Chin. J. Plant Ecol. 2015, 39, 941–949. [Google Scholar]
  36. Yu, F.; Zong, Y.; Lloyd, J.M.; Huang, G.; Leng, M.; Kendrick, C.; Lamb, A.L.; Yim, W.W.S. Bulk organic δ13C and C/N as indicators for sediment sources in the Pearl River delta and estuary, southern China. Estuar. Coast. Shelf Sci. 2010, 87, 618–630. [Google Scholar] [CrossRef]
  37. Glaeser, L.C.; Vitt, D.H.; Ebbs, S. Responses of the wetland grass, Beckmannia syzigachne, to salinity and soil wetness: Consequences for wetland reclamation in the oil sands area of Alberta, Canada. Ecol. Eng. 2016, 86, 24–30. [Google Scholar] [CrossRef] [Green Version]
  38. Gireeshkumar, T.R.; Deepulal, P.M.; Chandramohanakumar, N. Distribution and sources of sedimentary organic matter in a tropical estuary, south west coast of India (Cochin estuary): A baseline study. Mar. Pollut. Bull. 2013, 66, 239–245. [Google Scholar] [CrossRef] [PubMed]
  39. Kubo, A.; Kanda, J. Seasonal variations and sources of sedimentary organic carbon in Tokyo Bay. Mar. Pollut. Bull. 2017, 114, 637–643. [Google Scholar] [CrossRef]
  40. Cifuentes, L.A.; Coffin, R.B.; Solorzano, L.; Cardenas, W.; Espinoza, J.; Twilley, R.R. Isotopic and Elemental Variations of Carbon and Nitrogen in a Mangrove Estuary. Estuar. Coast. Shelf Sci. 1996, 43, 781–800. [Google Scholar] [CrossRef] [Green Version]
  41. Kirkby, C.A.; Kirkegaard, J.A.; Richardson, A.E.; Wade, L.J.; Blanchard, C.; Batten, G. Stable soil organic matter: A comparison of C:N:P:S ratios in Australian and other world soils. Geoderma 2011, 163, 197–208. [Google Scholar] [CrossRef]
  42. Wu, Y.; Zhang, J.; Zhang, Z.; Ren, J.; Cao, J. Seasonal variability of stable carbon and nitrogen isotope of suspended particulate matter in the Changjiang River. Oceanol. Limnol. Sin. 2002, 33, 546–552. [Google Scholar]
  43. Koziorowska, K.; Kuliński, K.; Pempkowiak, J. Sedimentary organic matter in two Spitsbergen fjords: Terrestrial and marine contributions based on carbon and nitrogen contents and stable isotopes composition. Cont. Shelf Res. 2016, 113, 38–46. [Google Scholar] [CrossRef]
  44. Mulholland, P.J.; Olsen, C.R. Marine origin of Savannah River estuary sediments: Evidence from radioactive and stable isotope tracers. Estuar. Coast. Shelf Sci. 1992, 34, 95–107. [Google Scholar] [CrossRef]
  45. Mchenga, I.S.S.; Tsuchiya, M. Nutrient dynamics in mangrove crab burrow sediments subjected to anthropogenic input. J. Sea Res. 2007, 59, 103–113. [Google Scholar] [CrossRef]
  46. Owen, R.B.; Lee, R. Human impacts on organic matter sedimentation in a proximal shelf setting, Hong Kong. Cont. Shelf Res. 2003, 24, 583–602. [Google Scholar] [CrossRef]
  47. Gao, X.; Yang, Y.; Wang, C. Geochemistry of organic carbon and nitrogen in surface sediments of coastal Bohai Bay inferred from their ratios and stable isotopic signatures. Mar. Pollut. Bull. 2012, 64, 1148–1155. [Google Scholar] [CrossRef] [PubMed]
Figure 1. Location of the study area (S: vegetation growth area; BF: bare tidal flat area).
Jmse 09 00992 g001
Figure 2. Total organic carbon (TOC) content and C/N ratios of vegetated saltmarsh sediments. Coloured boxes represent the same vegetation type growth area.
Jmse 09 00992 g002
Figure 3. Distribution of total organic carbon (TOC) and /CN ratios in (a) bare tidal flat 1 (BF1) and (b) bare tidal flat 2 (BF2).
Jmse 09 00992 g003
Figure 4. Spatial pattern of δ13C values in the surface sediments of (a) bare tidal flat 1 near to the vegetated saltmarsh area (BF1) and (b) bare tidal flat 2 far from the vegetated saltmarsh area (BF2).
Jmse 09 00992 g004
Figure 5. Organic carbon source contributions and C/N ratios of sediments from different saltmarsh vegetation growth areas. Coloured boxes represent the same vegetation type growth area. Red lines = 50% cutoff.
Jmse 09 00992 g005
Figure 6. Organic carbon source contributions and C/N ratios of sediments from bare tidal flats (a) near to the vegetated saltmarsh area (BF1) and (b) far from the vegetated saltmarsh area (BF2). Red line = 50% cutoff.
Jmse 09 00992 g006
Figure 7. Relationship between δ13C and TOC in the surface sediments of the (a) vegetated saltmarsh area and bare tidal flat areas (b) near (BF1) and (c) far (BF2) from the vegetated area.
Jmse 09 00992 g007
Figure 8. Relationship between surface sediment δ13C values and C/N ratios in (a) vegetated and (b) bare tidal flat (unvegetated) areas (BF includes BF1 and BF2).
Jmse 09 00992 g008
Figure 9. Organic carbon source relationship in Rudong coast.
Jmse 09 00992 g009
Table 1. Total organic carbon (TOC) content and C/N ratios in vegetated saltmarsh sediments.
Sample NameTOC (mg/g)C/N
S1-12.338.96
S1-23.7210.63
S1-32.449.04
S1-44.588.98
S1-51.046.93
S2-17.749.00
S2-24.818.44
S2-34.739.10
S2-43.249.00
S2-56.259.33
S2-67.410.14
S2-73.889.95
S2-83.439.53
S3-12.7410.54
S3-22.499.96
Mean ± SD4.05 ± 1.849.3 ± 0.89
Table 2. δ13C values of surface sediments in different saltmarsh plant growth areas.
Sample NameVegetation Typeδ13C of Surface Sediments (‰)Mean ± SD (‰)
S1-1C3 plants−21.54−22.82 ± 1.2
S1-2−24.02
S1-3−21.82
S1-4−24.25
S2-7−23.16
S2-8−21.12
S3-1−23.83
S1-5C4 plants−22.51−21.97 ± 1.27
S2-1−21.51
S2-2−23.05
S2-3−22.52
S2-4−22.67
S2-5−22.00
S2-6−18.82
S3-2−22.68
Publisher’s Note: MDPI stays neutral with regard to jurisdictional claims in published maps and institutional affiliations.

