1. Introduction
With the development of China’s marine industry, the management and sharing of marine and ocean resources face profound changes. The deep sea is abundant in mineral resources that are scarce on land, such as manganese nodules, cobalt-rich crusts, and polymetallic sulphides [
1]. With the consumption of mineral resources on land and the increasing demand for production, consensus is gradually being reached among countries on the exploitation of marine resources [
2,
3]. Against such a background, deep-sea mining is proposed accordingly. Hence, a series of technological developments have been carried out by various countries.
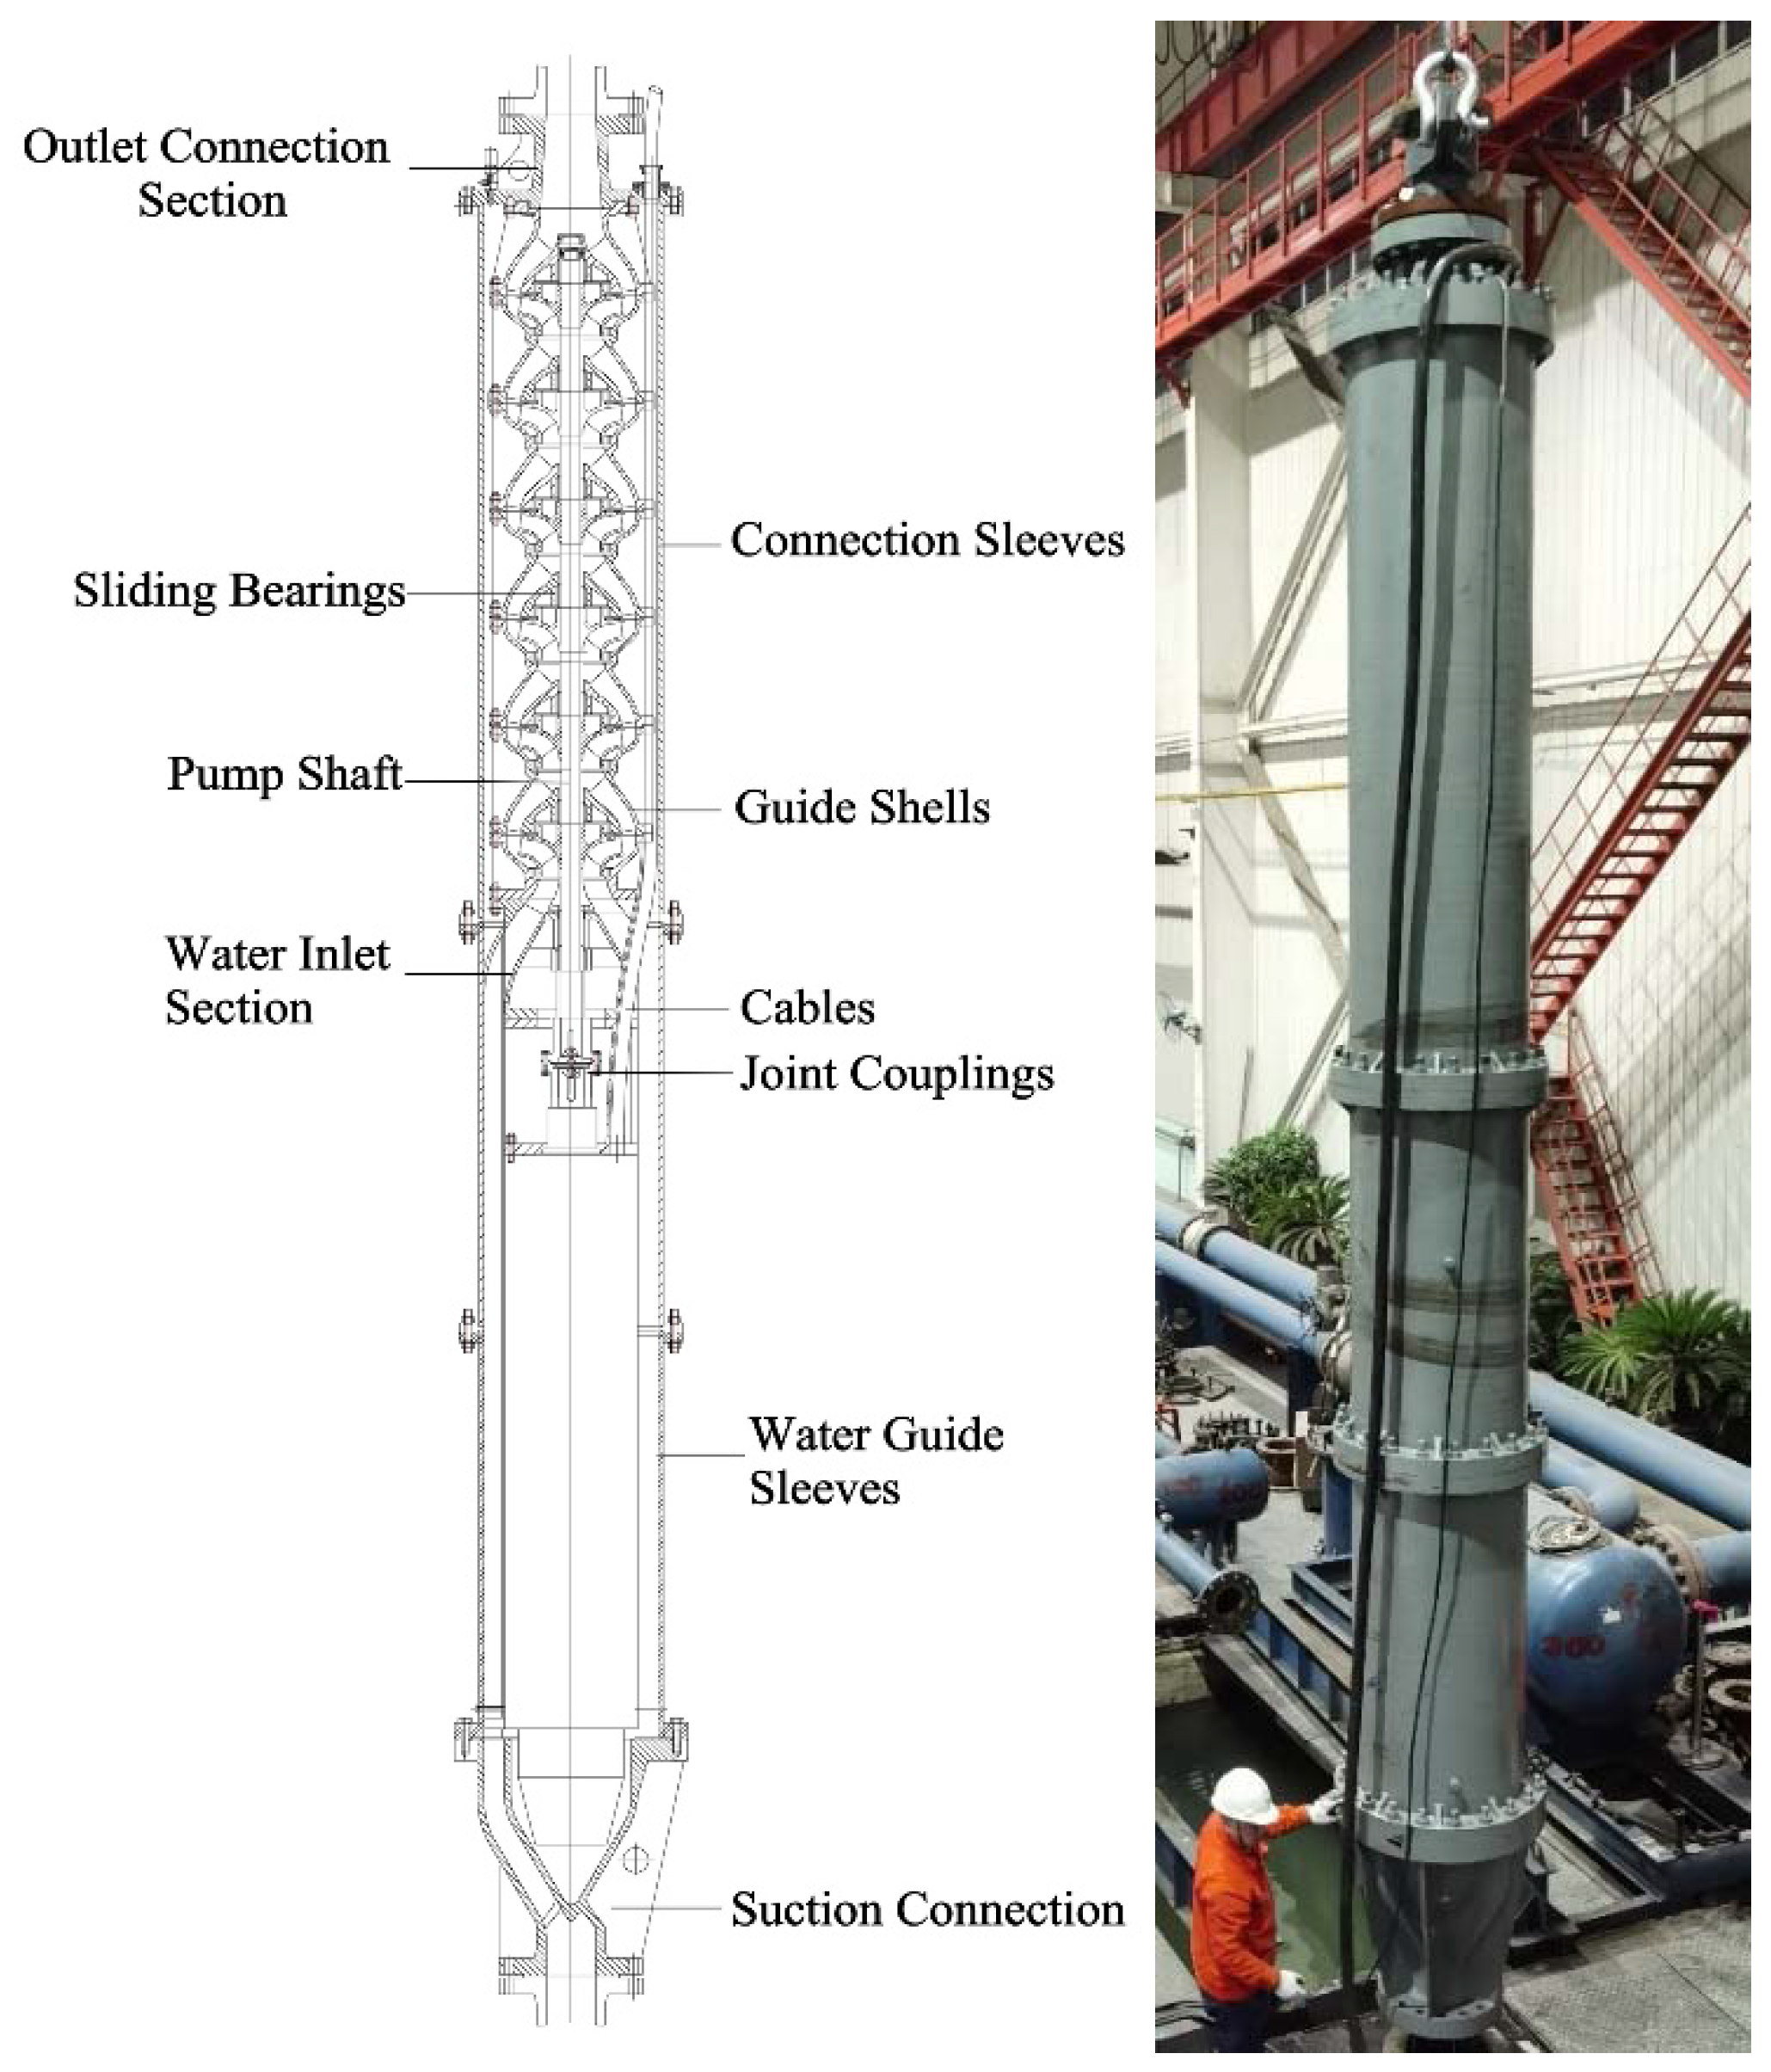
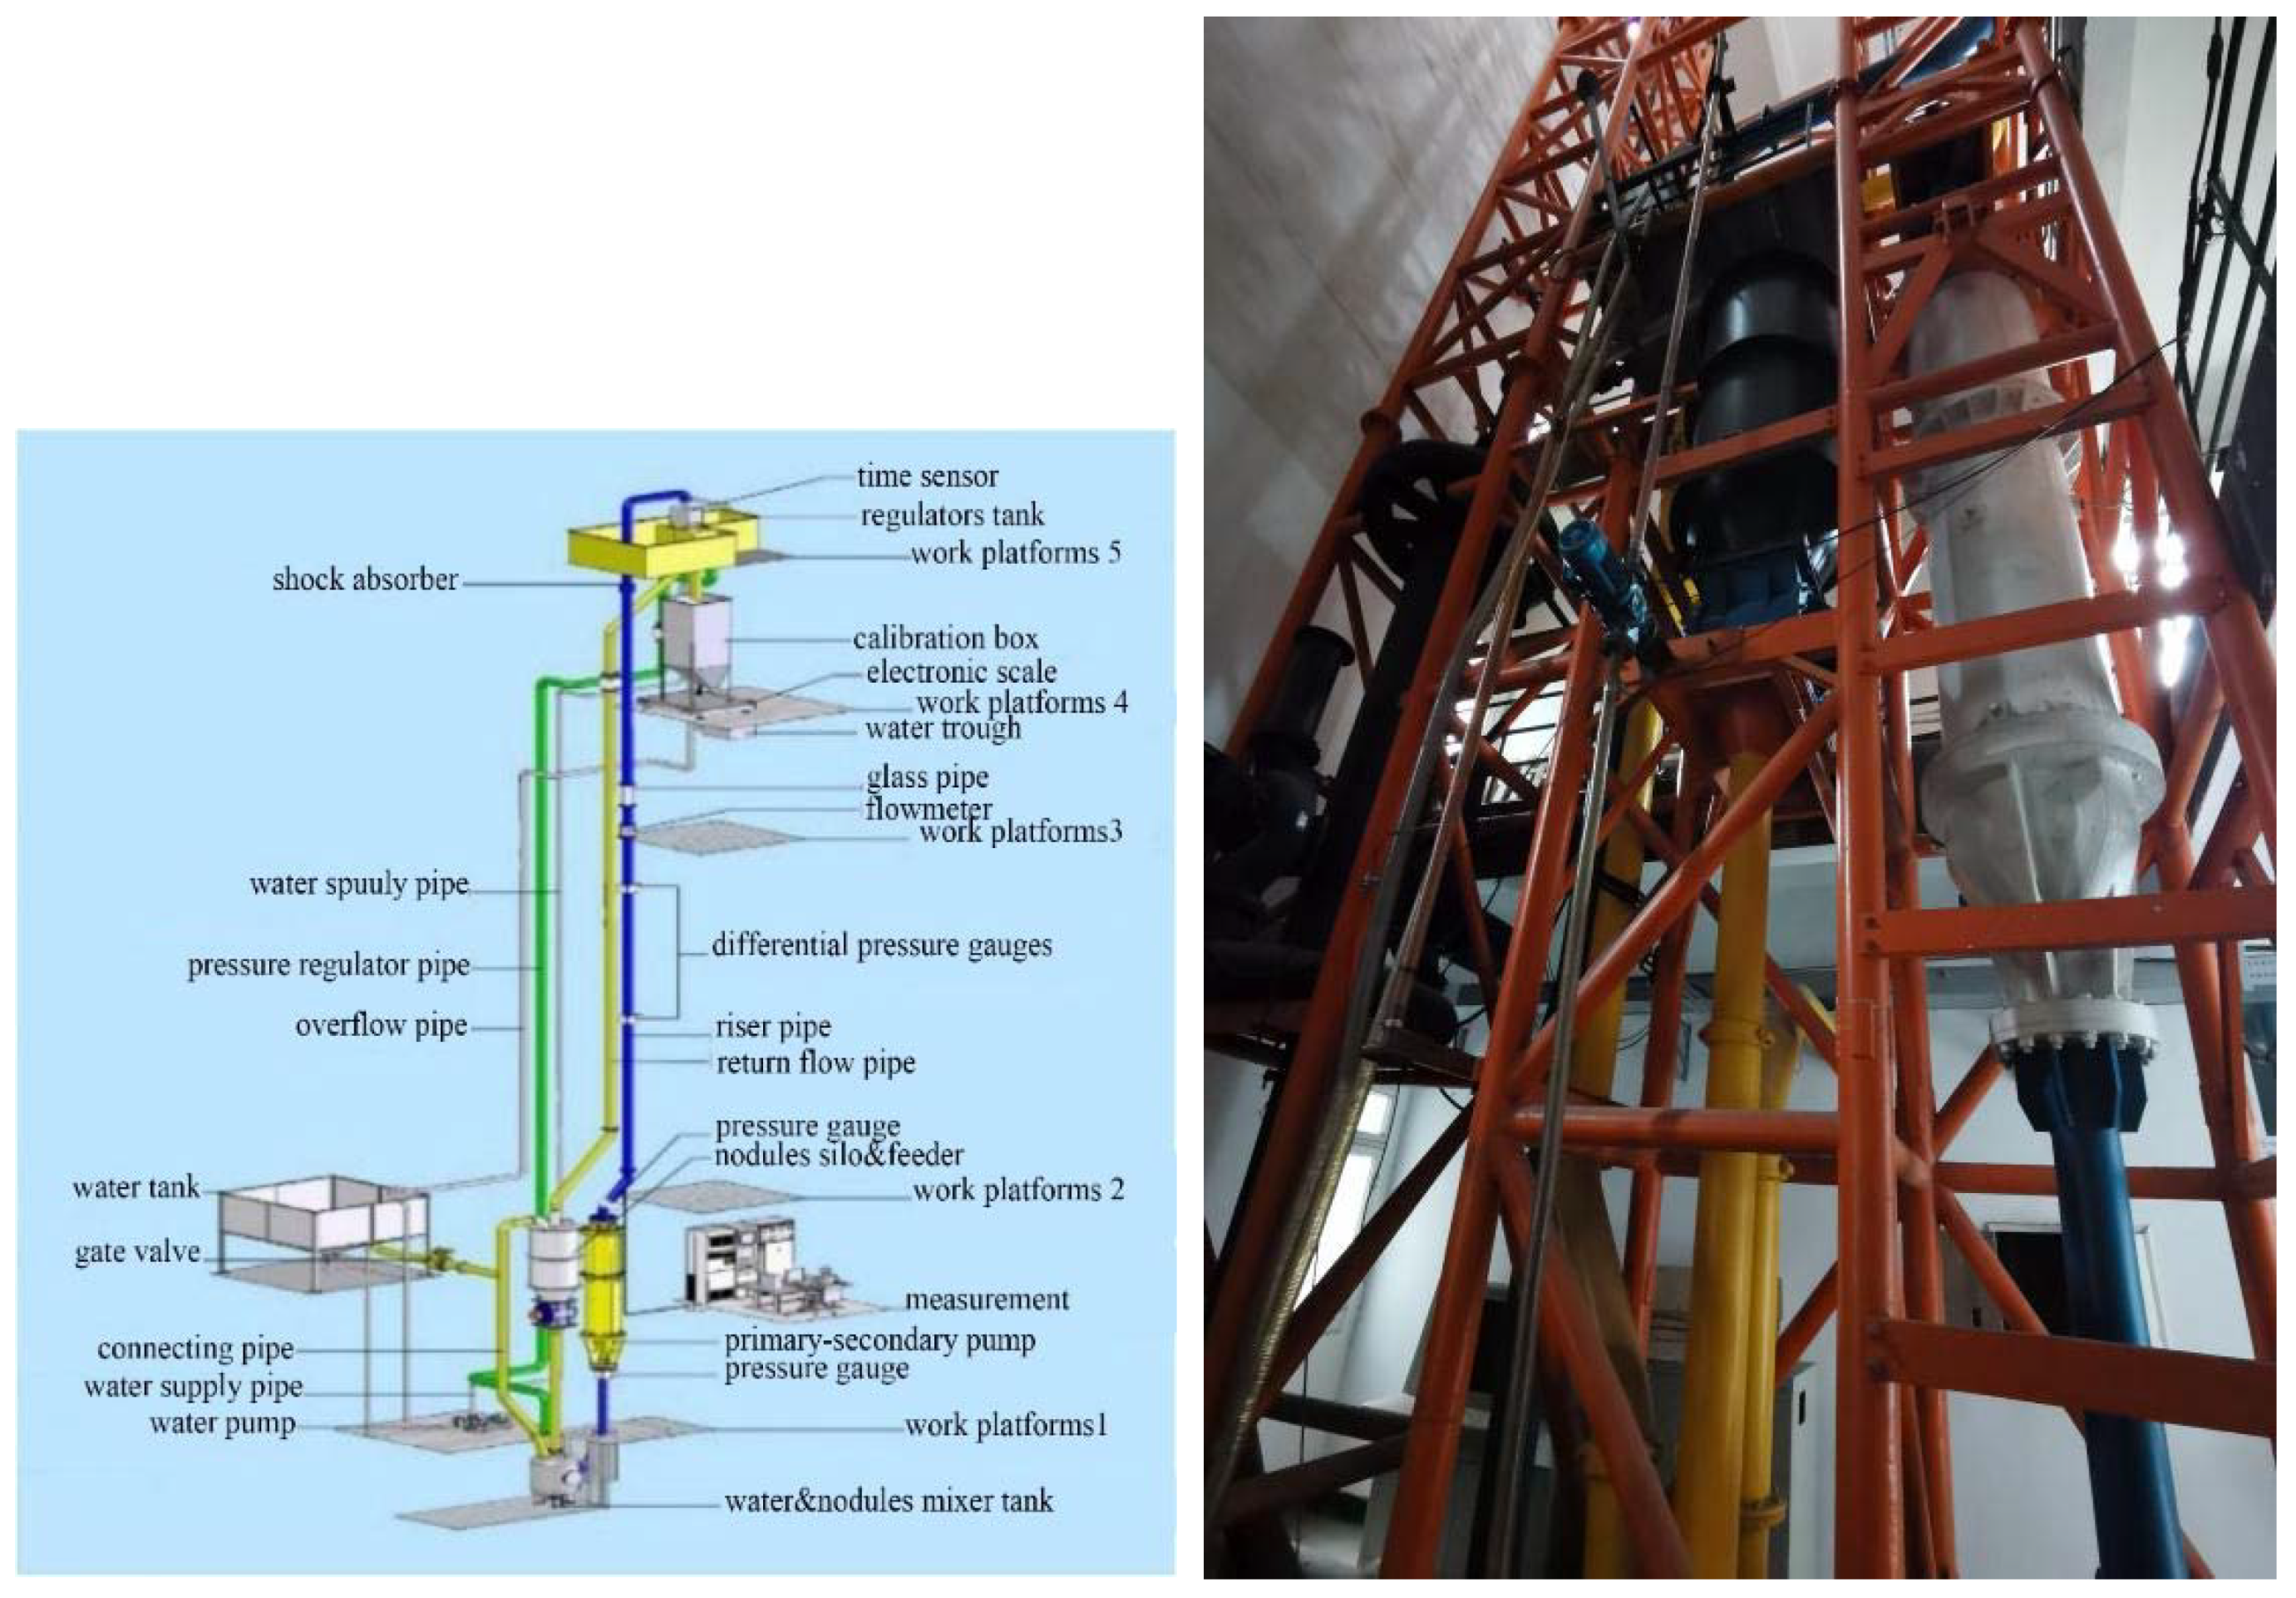
In the 1990s, China began to research deep-sea mining technologies. During the 11th Five-Year Plan, a two-stage deep-sea lifting pump was designed and manufactured. A series of experiments based on this pump was carried out. In terms of theoretical research, the solid-liquid two-phase flow mechanism of the pump has been investigated by Zou [
4]. The theory provides a theoretical basis for designing the flow channel of the deep-sea lifting pump. A series of studies on fluid velocity, concentration and pressure has also been carried out to obtain the pump’s characteristic curve. At the same time, a two-stage lifting pump was developed by Changsha Mining and Metallurgical Institute Co., Ltd. “Changsha Mining and Metallurgical Institute Co., Ltd.” is a well known research institute in Changsha, China [
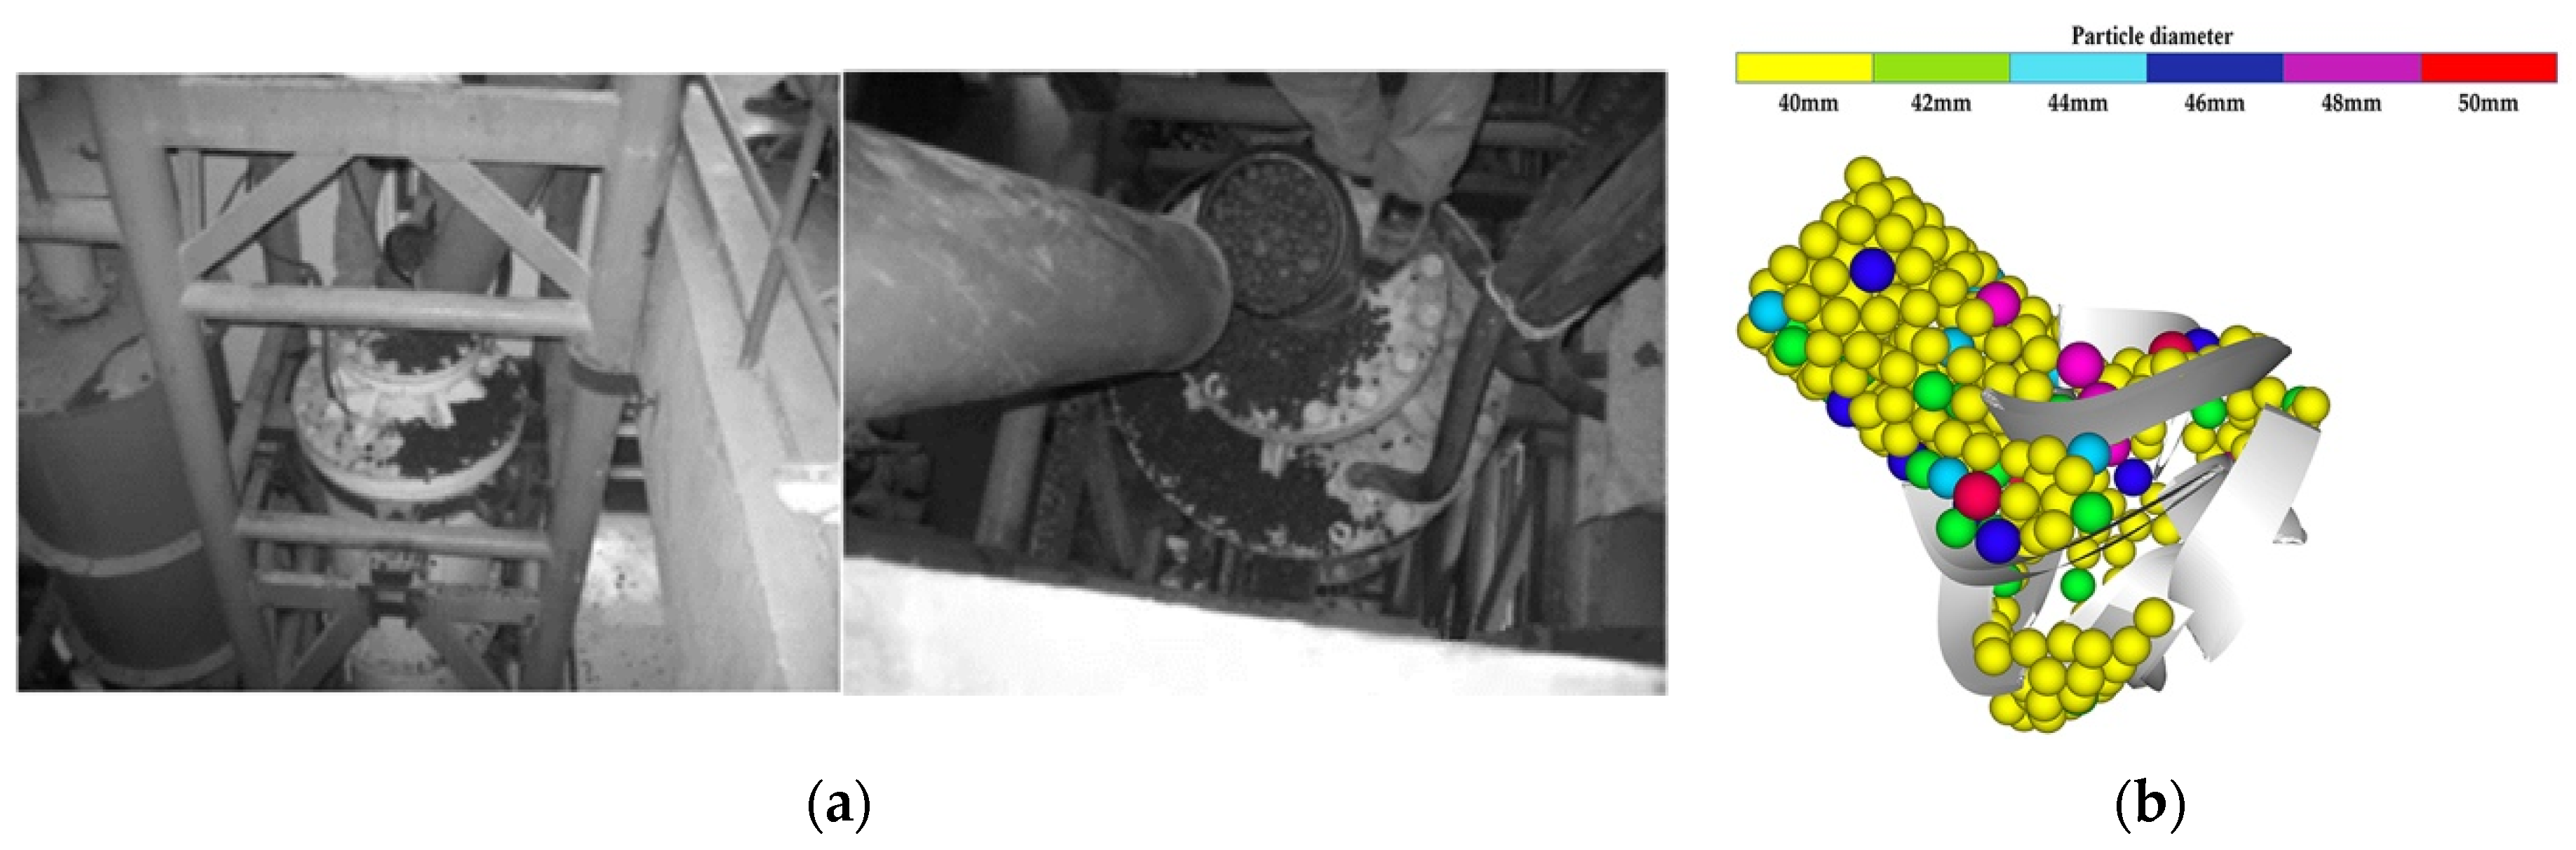
5]. However, a blockage of particles occurred in the pump’s internal flow channel when reflux containing a quantity of 50 mm particles was carried out. Therefore, relevant numerical simulation studies on such extreme situations are required before the experiments. Numerical simulations are used to clarify the safety thresholds for the particle size and concentration of the test particles and provide the relevant theoretical recommendations for the regular operation of the multistage centrifugal pump.
In Computational Fluid Dynamics (CFD) for centrifugal pumps, Plua and Hidalgo [
6] investigated the suitability of the simulation for most pumps under the N-S equation by comparing experimental data with CFD simulation data. The following relevant conclusion was drawn: the Reynolds average Navier–Stokes (RANS) turbulence model can meet the needs of most numerical pump simulations. Huang [
7] analysed the effect of the trailing edge of the blades on pressure fluctuations in the pump with CFD simulations. Zeng and Chen [
8] used the mixture multiphase flow model. The numerical simulation of the solid-liquid two-phase flow in the lifting pump was carried out in their paper. The effect of particle size on the volumetric concentration distribution of the accumulation in the pump was compared. In addition, the hydraulic performance of lifting pump with different particle sizes was also investigated to reveal the effect of particle sizes on pump characteristics.
By studying the lifting pump’s hydraulic properties problem, the governing equation of the homogenous slurries two-phase flow model was presented by Zou and Lu [
4]. The two-phase flow model of homogenate was used by Dong [
9] to divide the particle size. This homogeneous slurry model greatly facilitated the investigation of solid-liquid two-phase flow in deep-sea mining pumps. However, the DPM method is still used in this method. In this model, tiny particles are mixed with seawater as a homogenate slurry. The effect of particle action on the flow field is still neglected. The volume effect between particles and particle convection disturbance needs to be considered for the actual centrifugal pump of deep-sea mining. However, the accumulation, aggregation and collision of particles in the pump cannot be truly reflected by the DPM method. Cundall [
10] proposed the discrete element method (DEM) based on the Lagrangian method, which is widely used for the calculation of multiphase flows of particles and fluids [
11,
12].
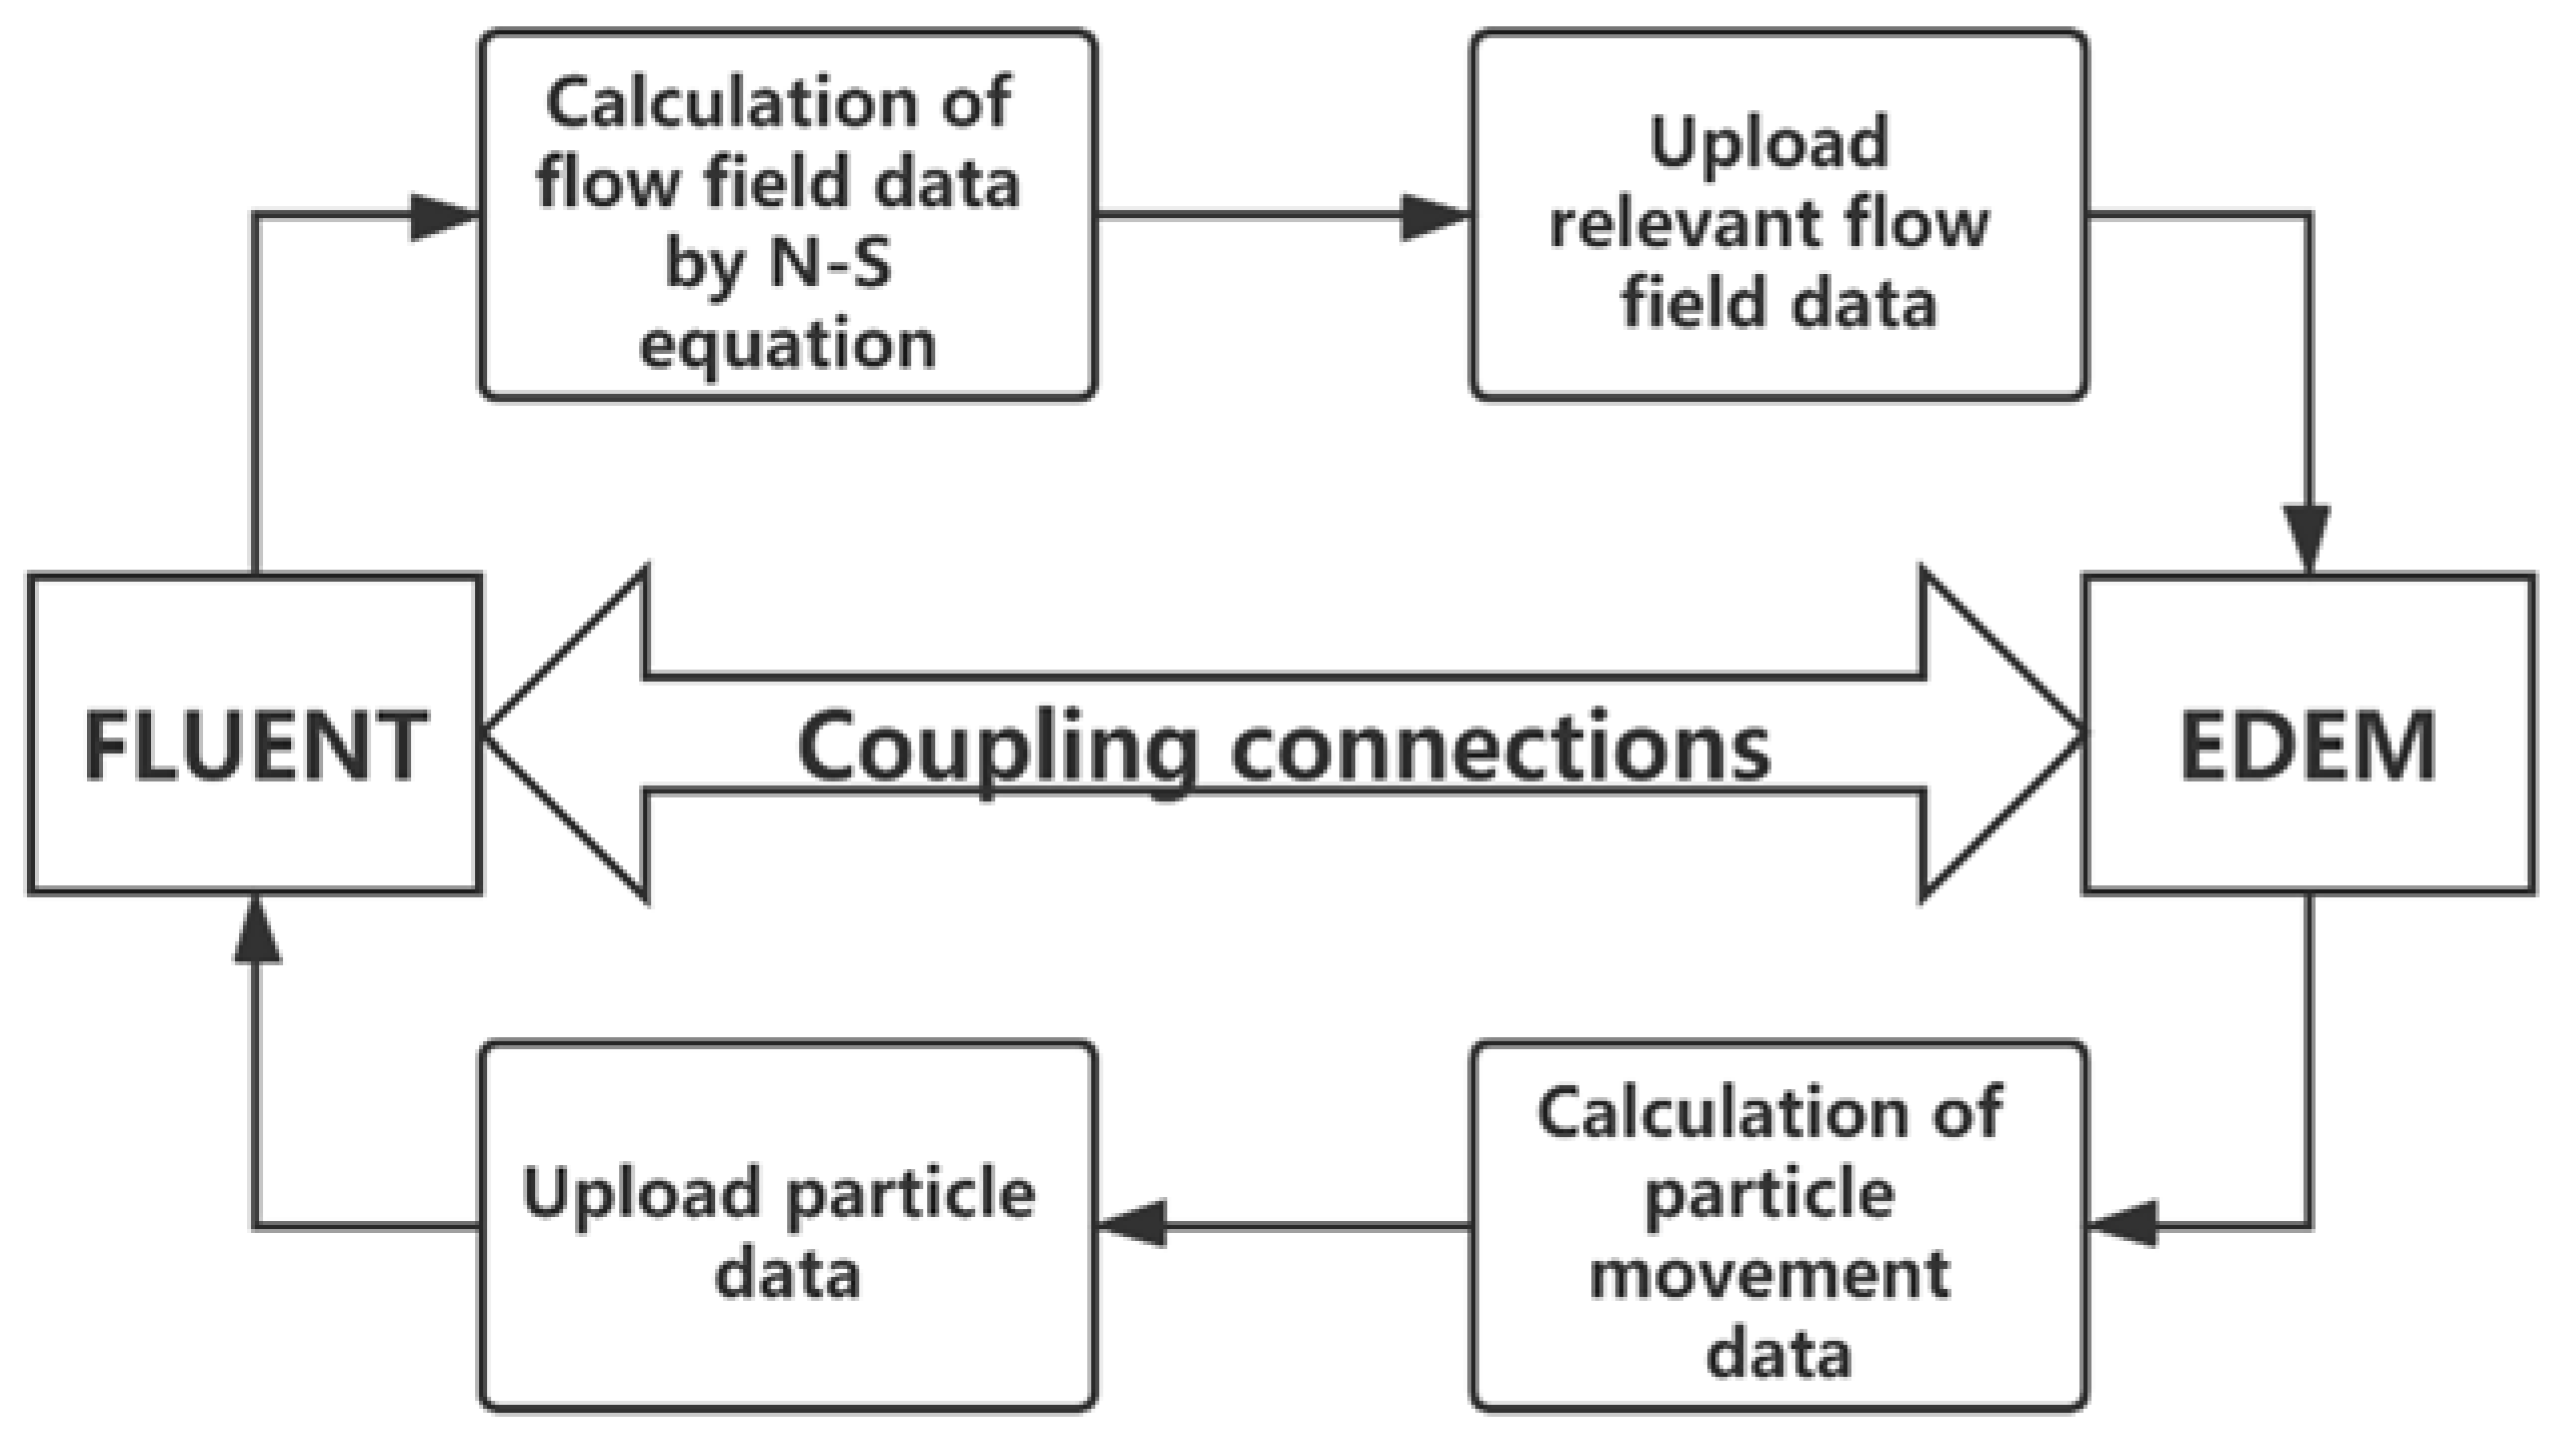
The coupling method of CFD and DEM can be applied to calculate the behaviour of particles in the flow field with excellent accuracy [
13,
14]. Li [
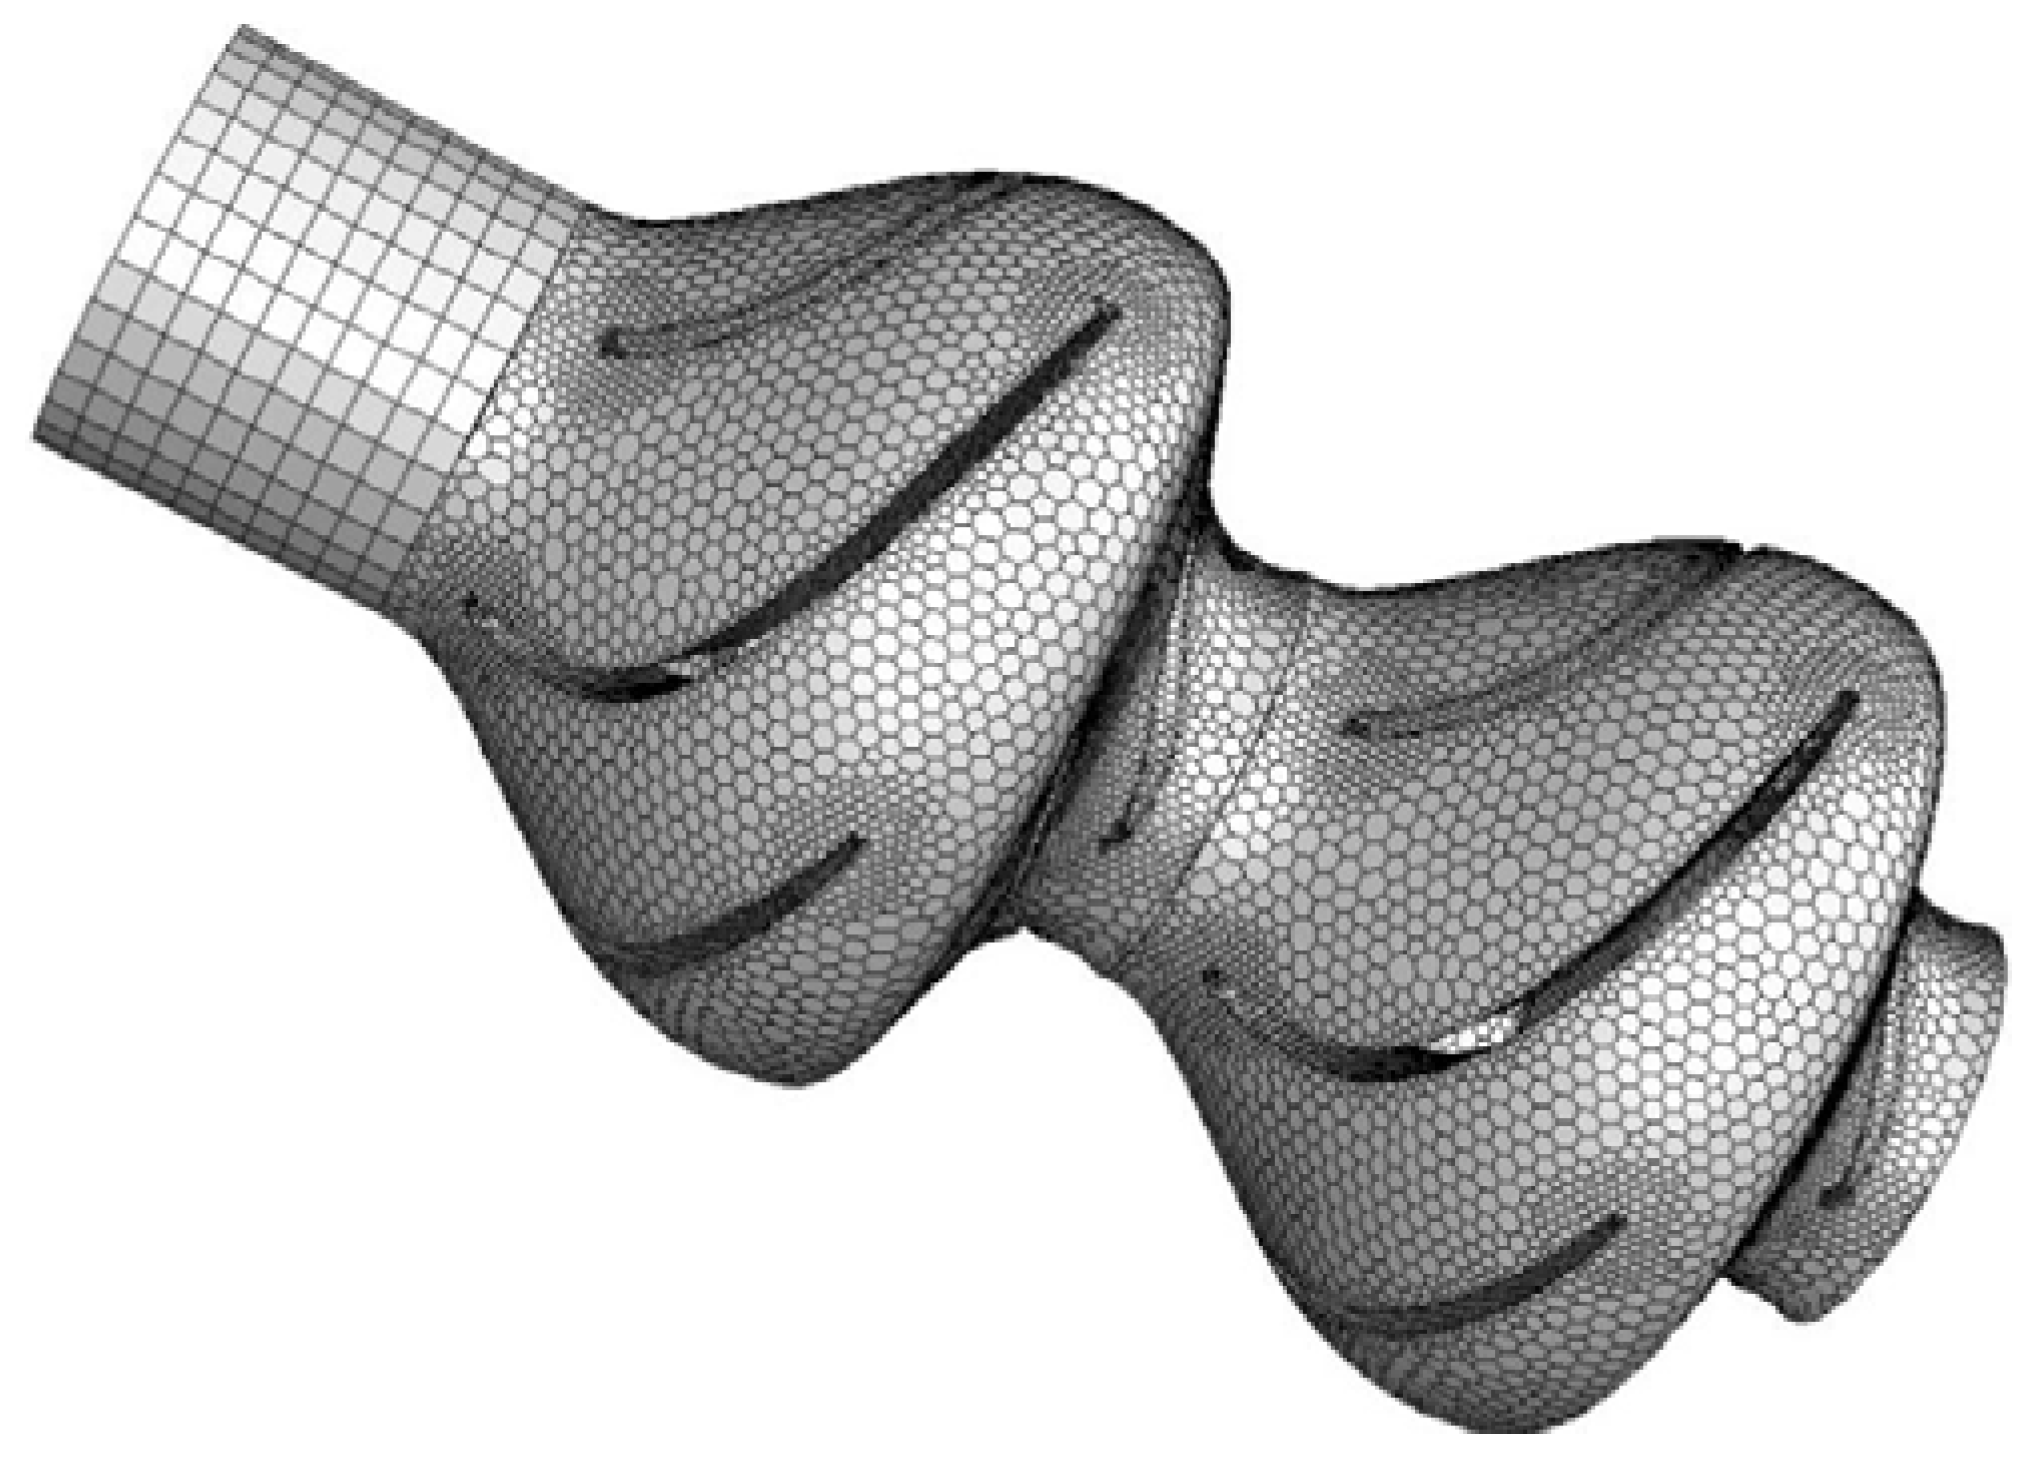
15] analysed the activity of single particle and their applications under different operating conditions by using the CFD-DEM method to model the solid-liquid two-phase of the pump, which provides the grid feasibility for implementing the coupled CFD-DEM method of the pump. Deng [
16] investigated the phenomenon of inhomogeneous local agglomeration of particles within a six-stage centrifugal pump by means of CFD-DEM. Li [
17] investigated the problem of particle backflow blockage in single-stage centrifugal pump and elucidated the effect of particle size on blockage in the pump.
At present, all the work has provided strong support for the study of solid-liquid two-phase flow in deep-sea mining centrifugal pump, and the blockage mechanism of the slurry containing coarse particles in the pump is the focus of this study. CFD-DEM coupling simulation was used to simulate the backflow of coarse particles during pump shut down, considering the accumulation, condensation, and collision between particles. The coupled simulation demonstrates the blockage of particles in the pump with different particle sizes and different particle ratios. Meanwhile, the movement of the particles in the pump and the residual mass of the particles in the pump in the case of blockage as well as the pressure variation in the area prone to blockage are analysed. Based on the above research, some suggestions have been proposed to prevent the blockage of particle reflux that can potentially occur in multistage centrifugal pumps during emergency shutdown.
4. Simulation Results
Four groups of mixed particles with different particle size distributions (10–20 mm, 20–30 mm, 30–40 mm, 40–50 mm) were set up in this paper, and the blockage mechanism of the four groups of mixed particles was simulated numerically. For example, the particle size interval is 2 mm for 10–20 mm, which means that this group contains particles with particle sizes of 10, 12, 14, 16, 18, and 20 mm at concentrations of 75%, 5%, 5%, 5%, 5%, and 5%, respectively. The other groups are similar.
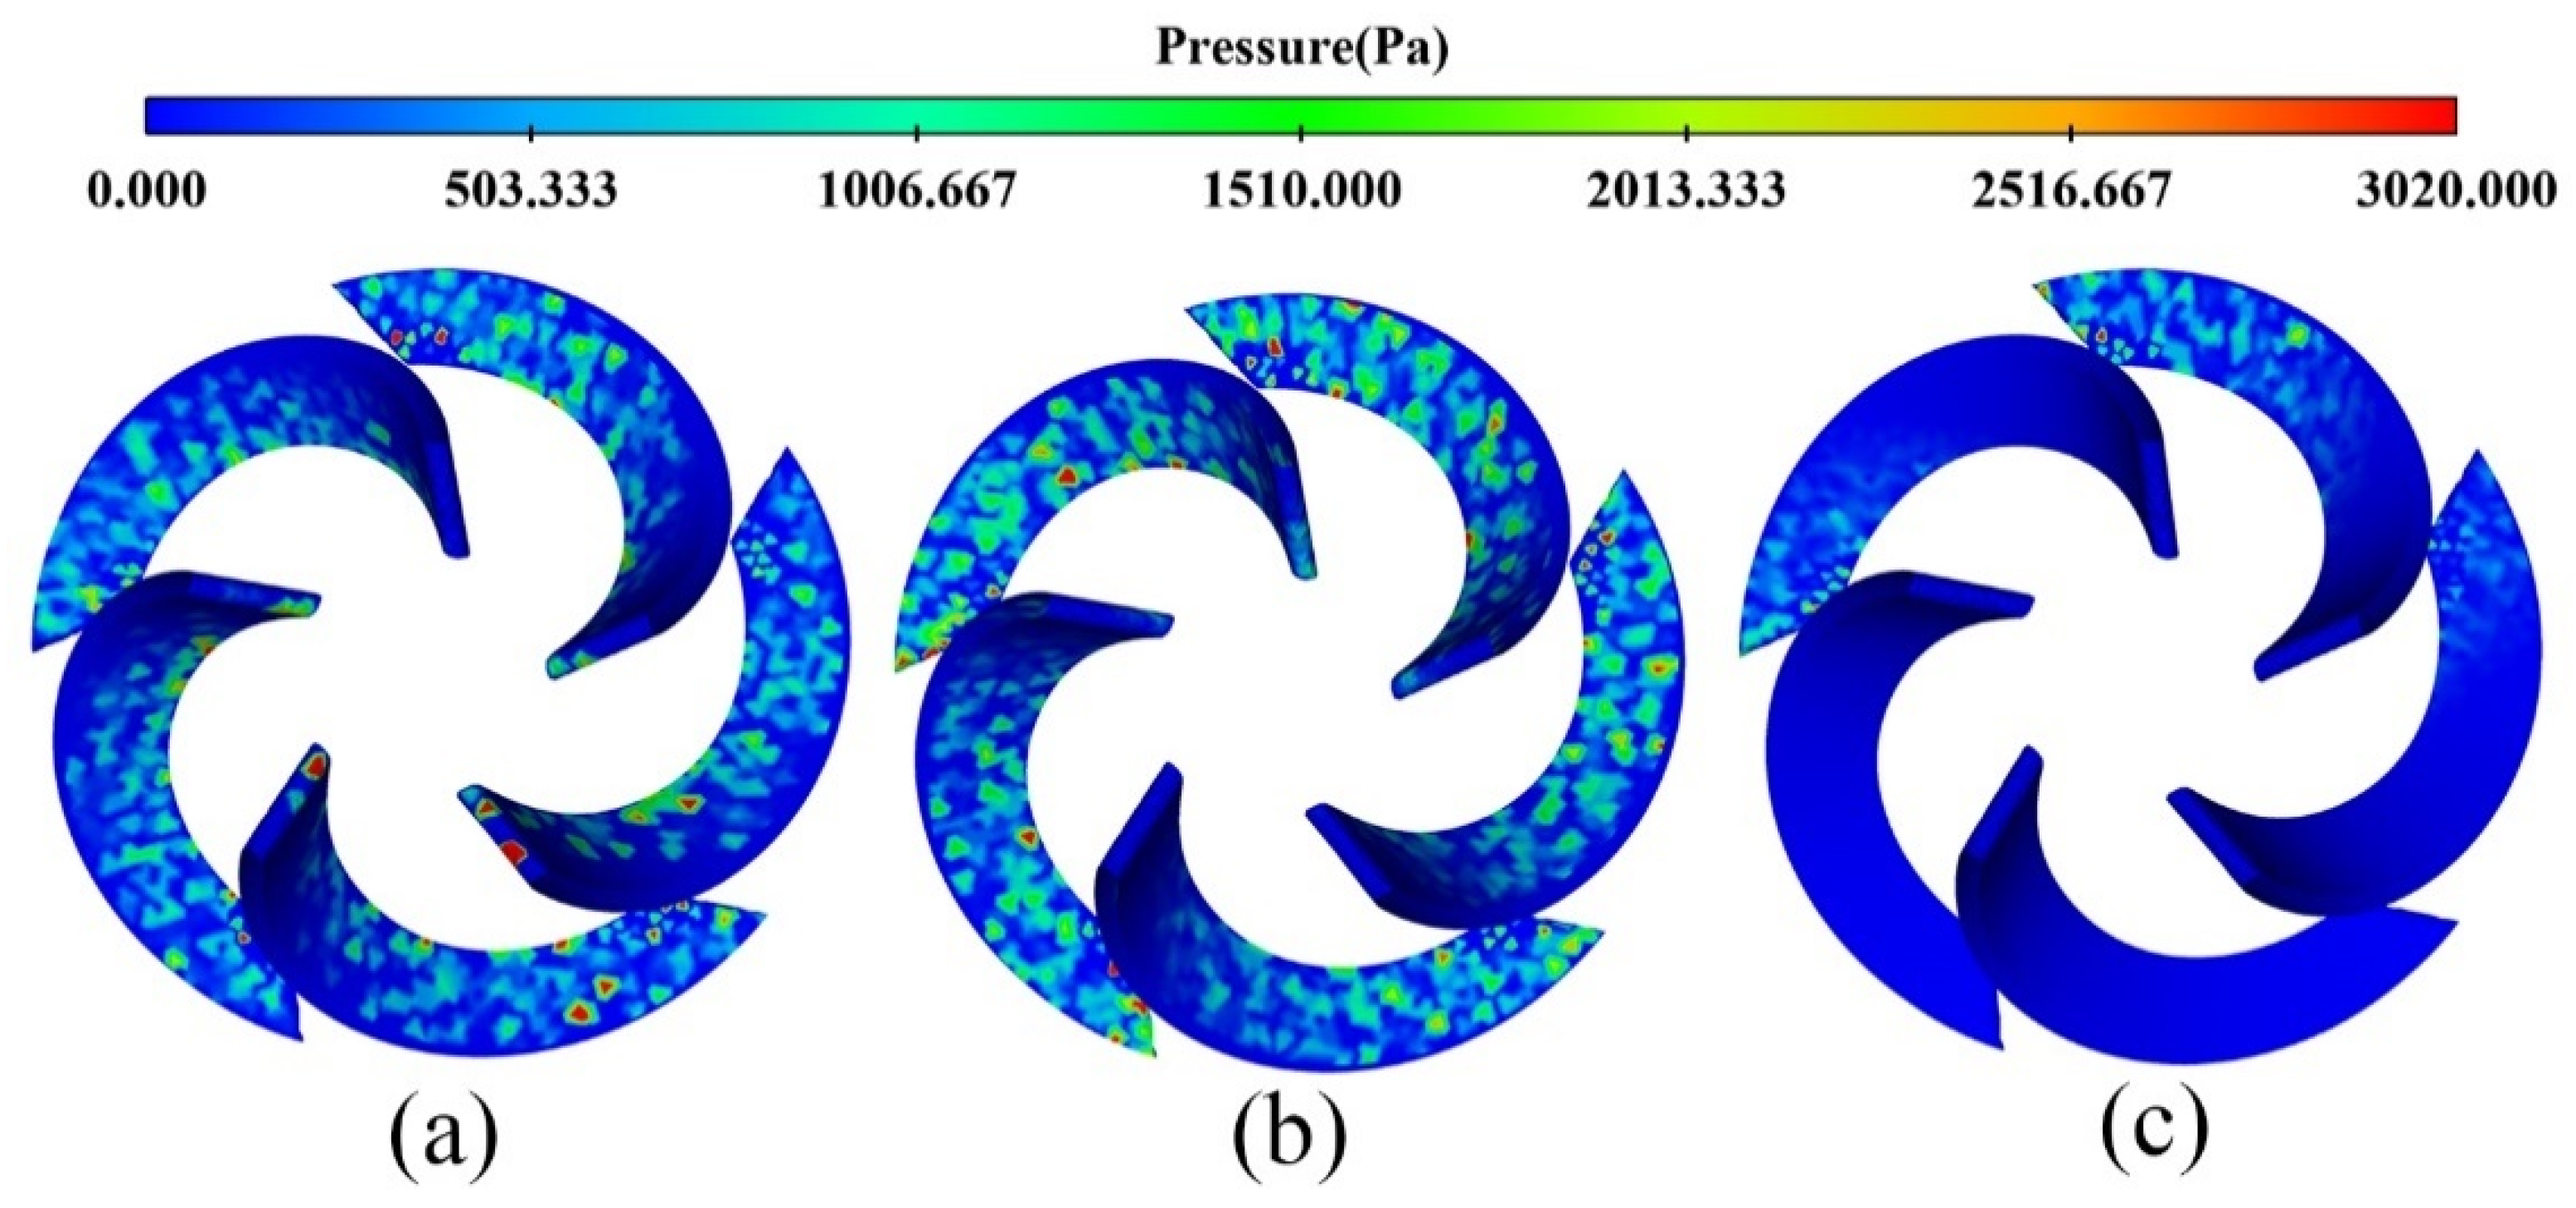
The simulated clouds of pressure on the guide vane after collision with 10–20 mm particles are shown in
Figure 8. It is noticeable when comparing
Figure 8a,b that although both high and low-pressure areas appear on the guide vanes, the high-pressure area is denser at 10 s than at 2 s. This indicates that the particles collide intensively with the guide vane at 10 s. At the same time, these areas are found in the upper half of the guide vane close to the impeller hub and in the lower half of the guide vane away from the hub. It has been revealed that when a particle moves through a fluid, under the influence of the viscosity of the fluid, a high-pressure zone will be created ahead of the direction of motion of the particle, while a low-pressure area will be formed at the end of the trajectory and on its sides. The high-pressure and low-pressure areas on the guide vane shown in the pictures prove that the particles have good movement, and stagnation or blockage occurs. As shown in
Figure 8c, except for the remaining three guide vanes, where the pressure variation zone still exists at the end of the vanes, the rest of the vanes are no longer under pressure from the particles. This demonstrates that the pre-set particles have fallen entirely, and the majority of them have passed through the interface between the guide vane and the impeller. At the same time, particles have started to flow through the impeller vanes to the next stage of the pump.
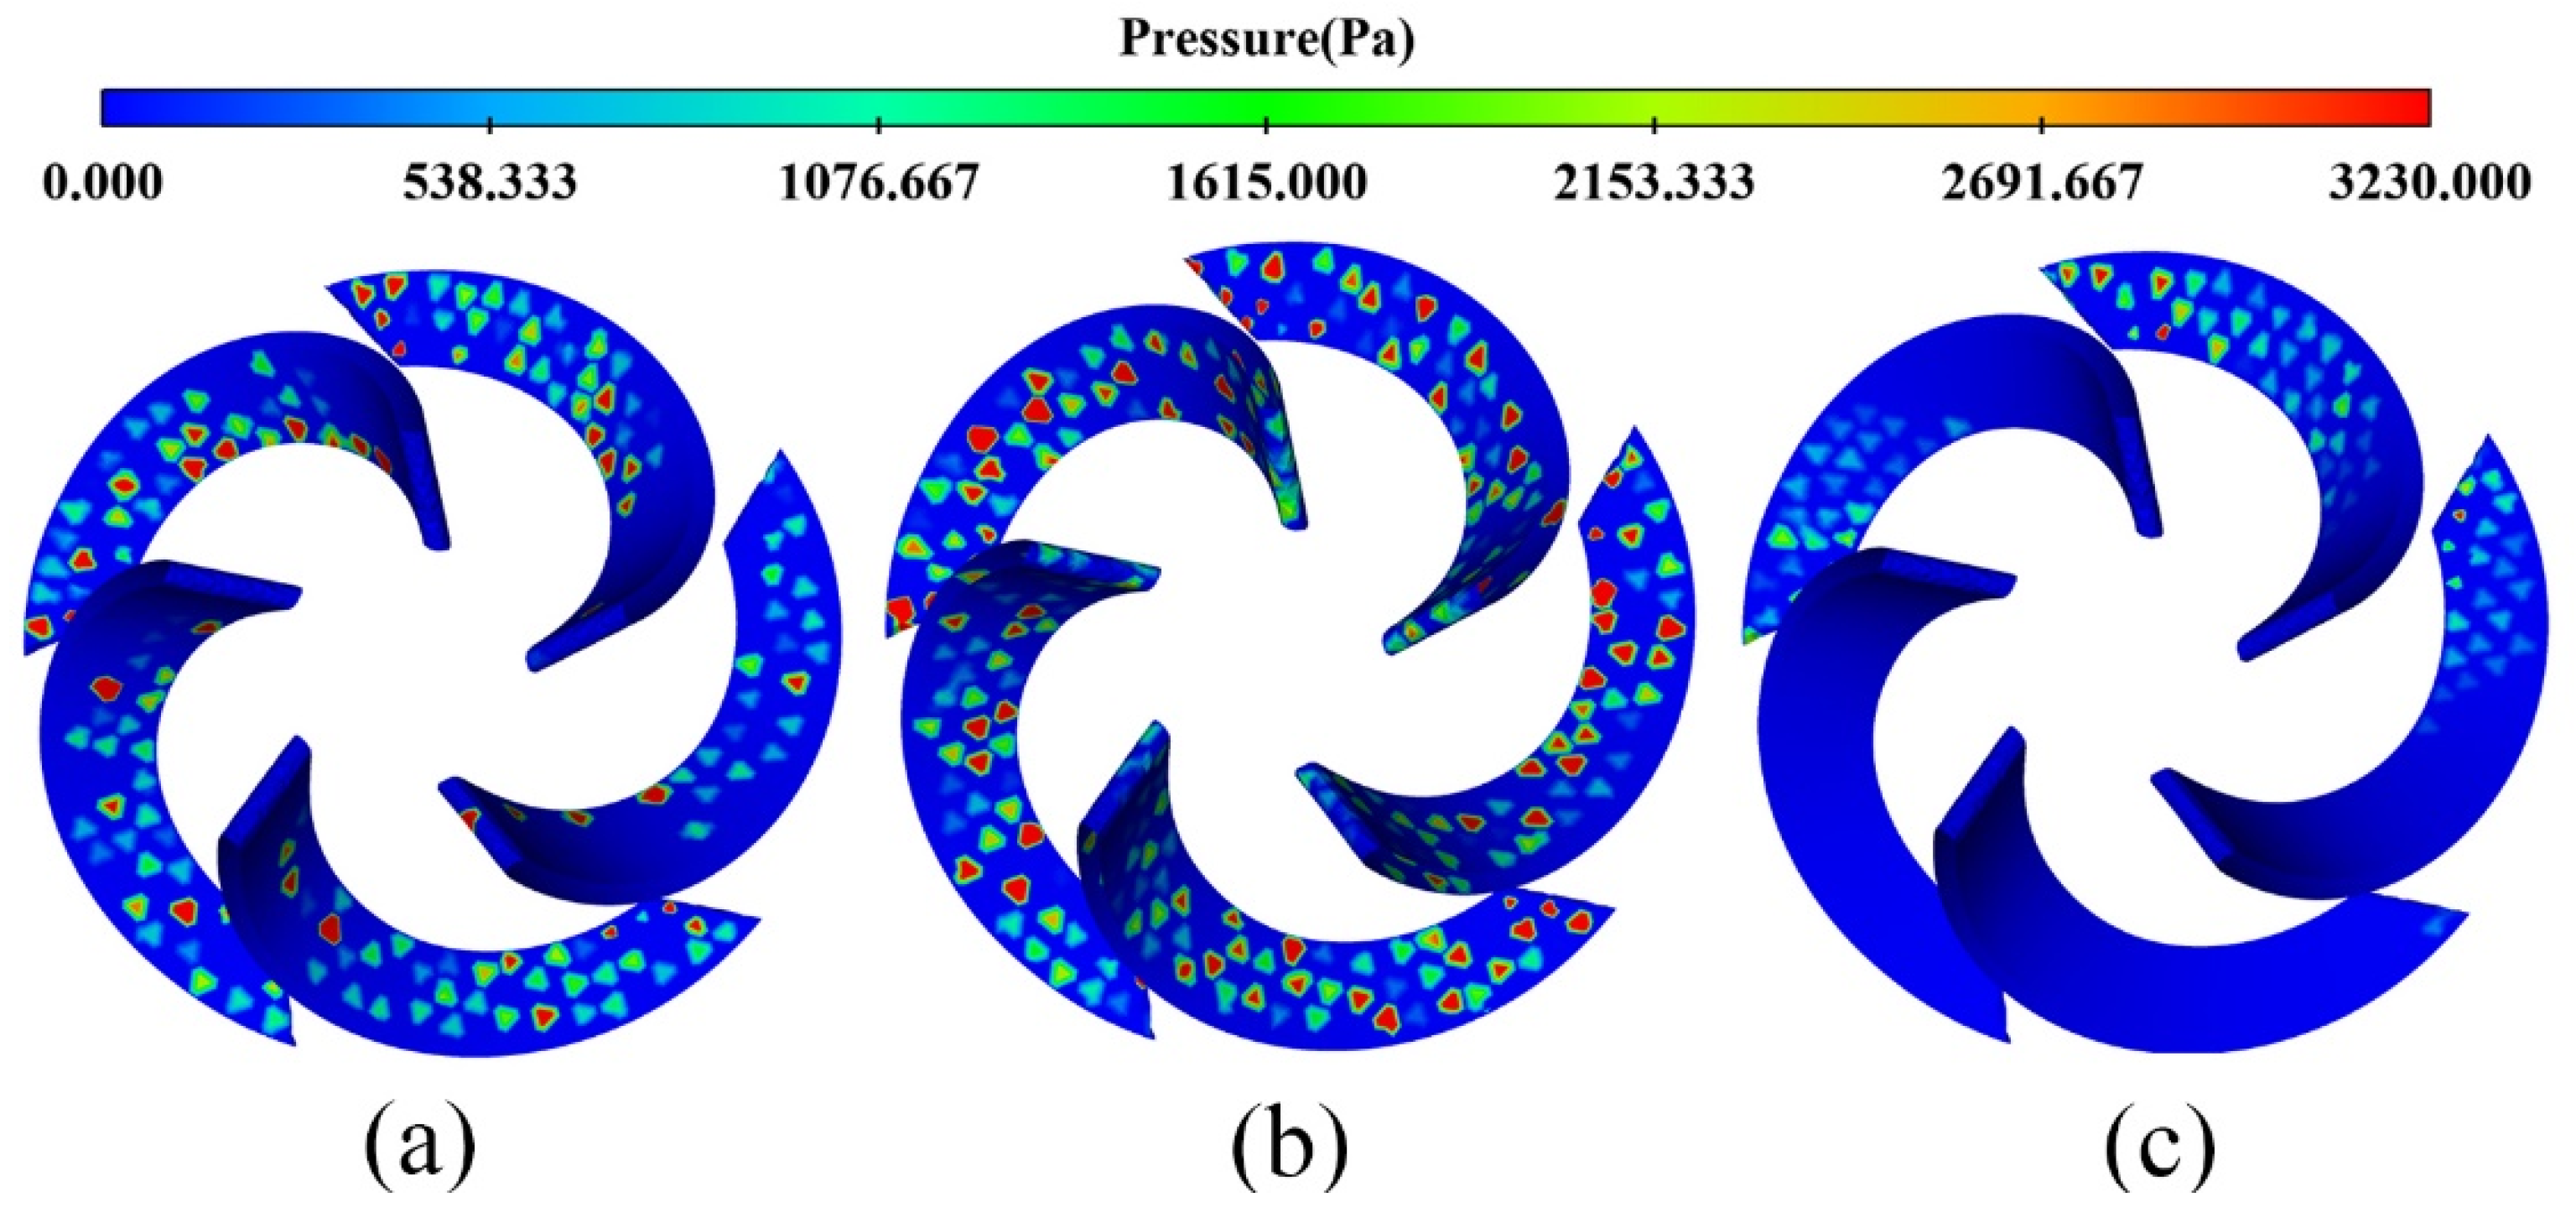
However, when studying the pressure variation of 20–30 mm particles on the guide vane of the first stage pump, the pressure zone distribution of particles on the vane was essentially the same as for 10–20 mm particles. The pressure clouds are shown in
Figure 9, and from
Figure 9b, it can be seen that the high-pressure points on the guide vane are much denser for 20–30 mm particles than for 10–20 mm particles. Those reflect that the collision of 20–30 mm particles in the guide vane channel is much larger than in the previous particle class. Meanwhile, the denser movement of particles in the flow channel means an increased risk of multiple particles squeezing each other, which increases the risk of blockages.
Comparisons between
Figure 8 and
Figure 9 reveal that the behaviour of the 10–20 mm and 20–30 mm particles was basically the same: at 2 s, the particles fall without hindrance. The particles exert pressure mainly on the middle and the lower half of the guide vanes. However, at 10 s, temporary accumulation of particles in the pump occurs because the previous particles cannot fall into the next pump stage in time. This leads to the phenomenon of pressure areas spreading all over the guide vane. At 15 s, the particles have almost finished falling. However, residual particles remain in some of the flow channels, which leads to the phenomenon of pressure zones still existing on some of the guide vanes.
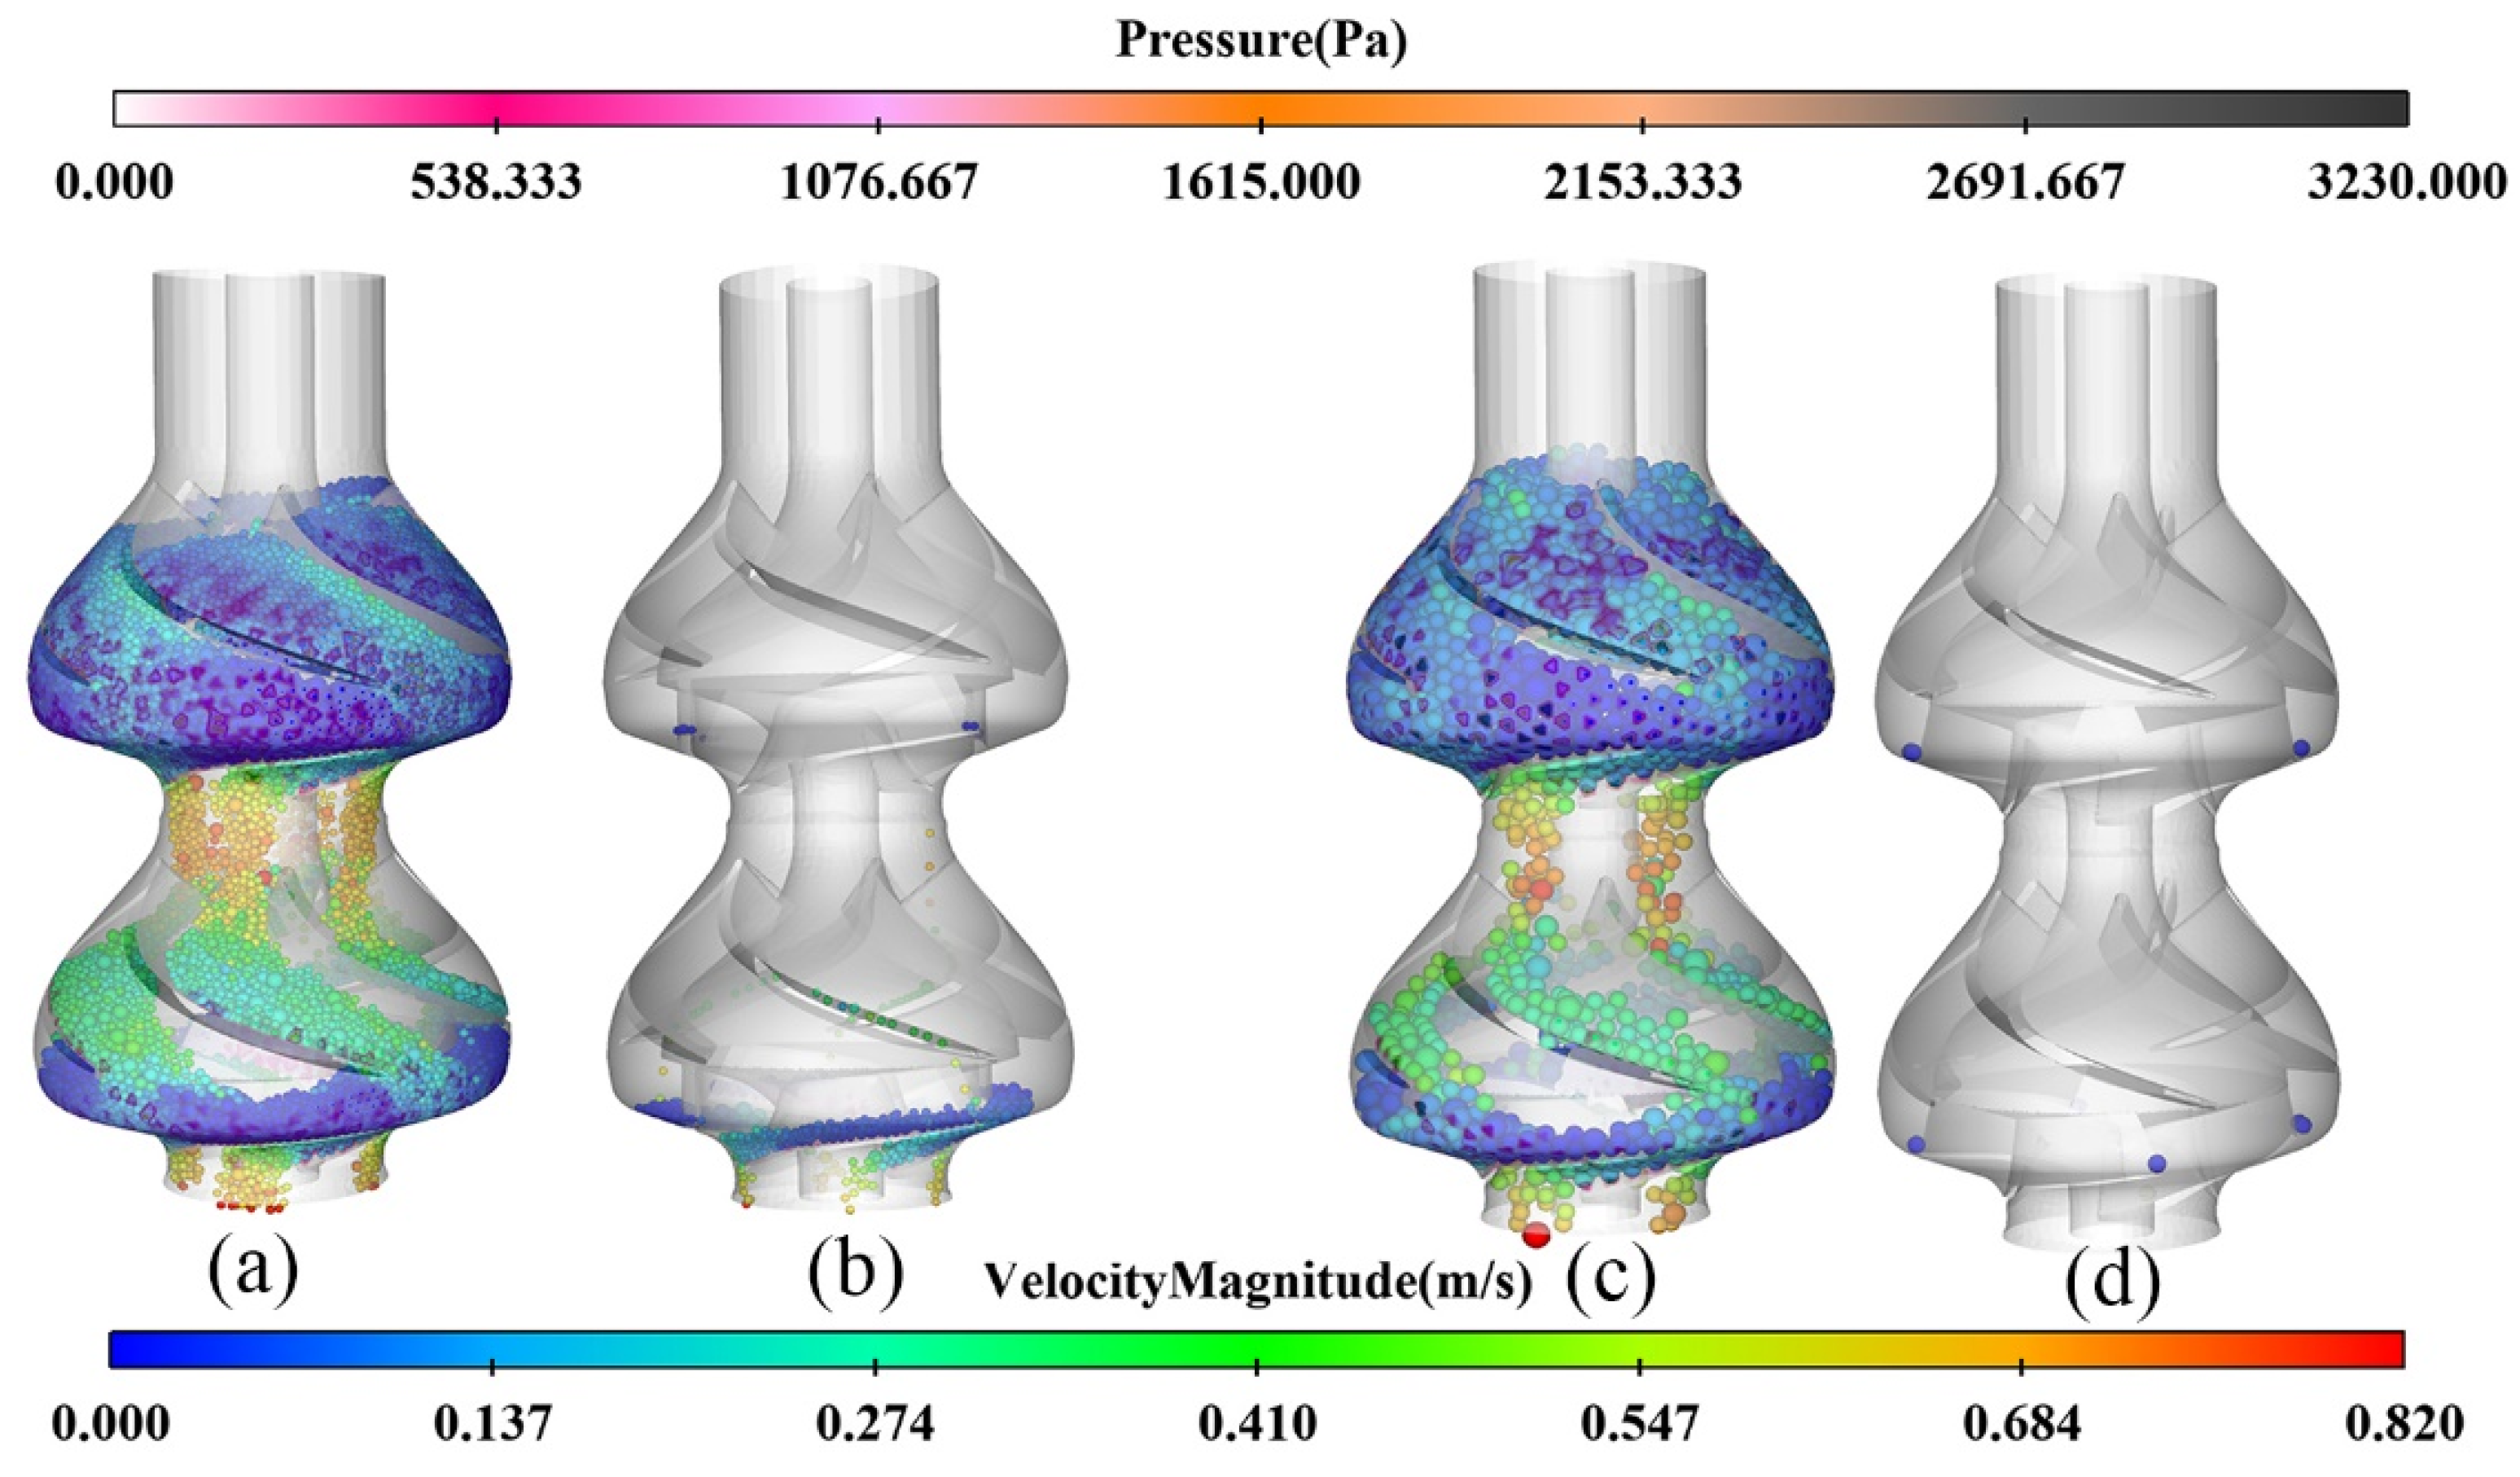
The movement and accumulation of 10–20 and 20–30 mm particles at the corresponding time points are illustrated in
Figure 10. The behaviour of two particle sizes in the pump is compared to reveal the clogging mechanism of the particles better. From
Figure 10a,c, it can be analysed that there is a velocity gradation in the particles that accumulate in the guide vane of the first stage pump.
Figure 10a shows that the particle velocity in this region ranges from 0.019 m/s to 0.165 m/s, while in
Figure 10c, it ranges from 0 m/s to 0.213 m/s. This indicates that the particles are not jammed in the flow channels. The static particles are mainly concentrated at the interface between the guide vane and the impeller. This is the temporary accumulation of particles caused by the front particles not falling in time. Furthermore, at the interface between the primary pump and the two stages, the particles can be seen falling at a speed in the range of 0.4–0.8 m/s. This indicates that the particles are not blocked in the first stage pump. Hence, it can be seen that 10–30 mm particles have good movement characteristics in the pump. Comparison of
Figure 10b,d shows that the reflux completion time for 20–30 mm particles is shorter than 10–20 mm particles. This suggests that larger particles can be better returned to the flow with the assurance of non-clogging. This is because of the restricted particle movement caused by the collision between many particles, which eventually leads to a decrease in the reflux velocity.
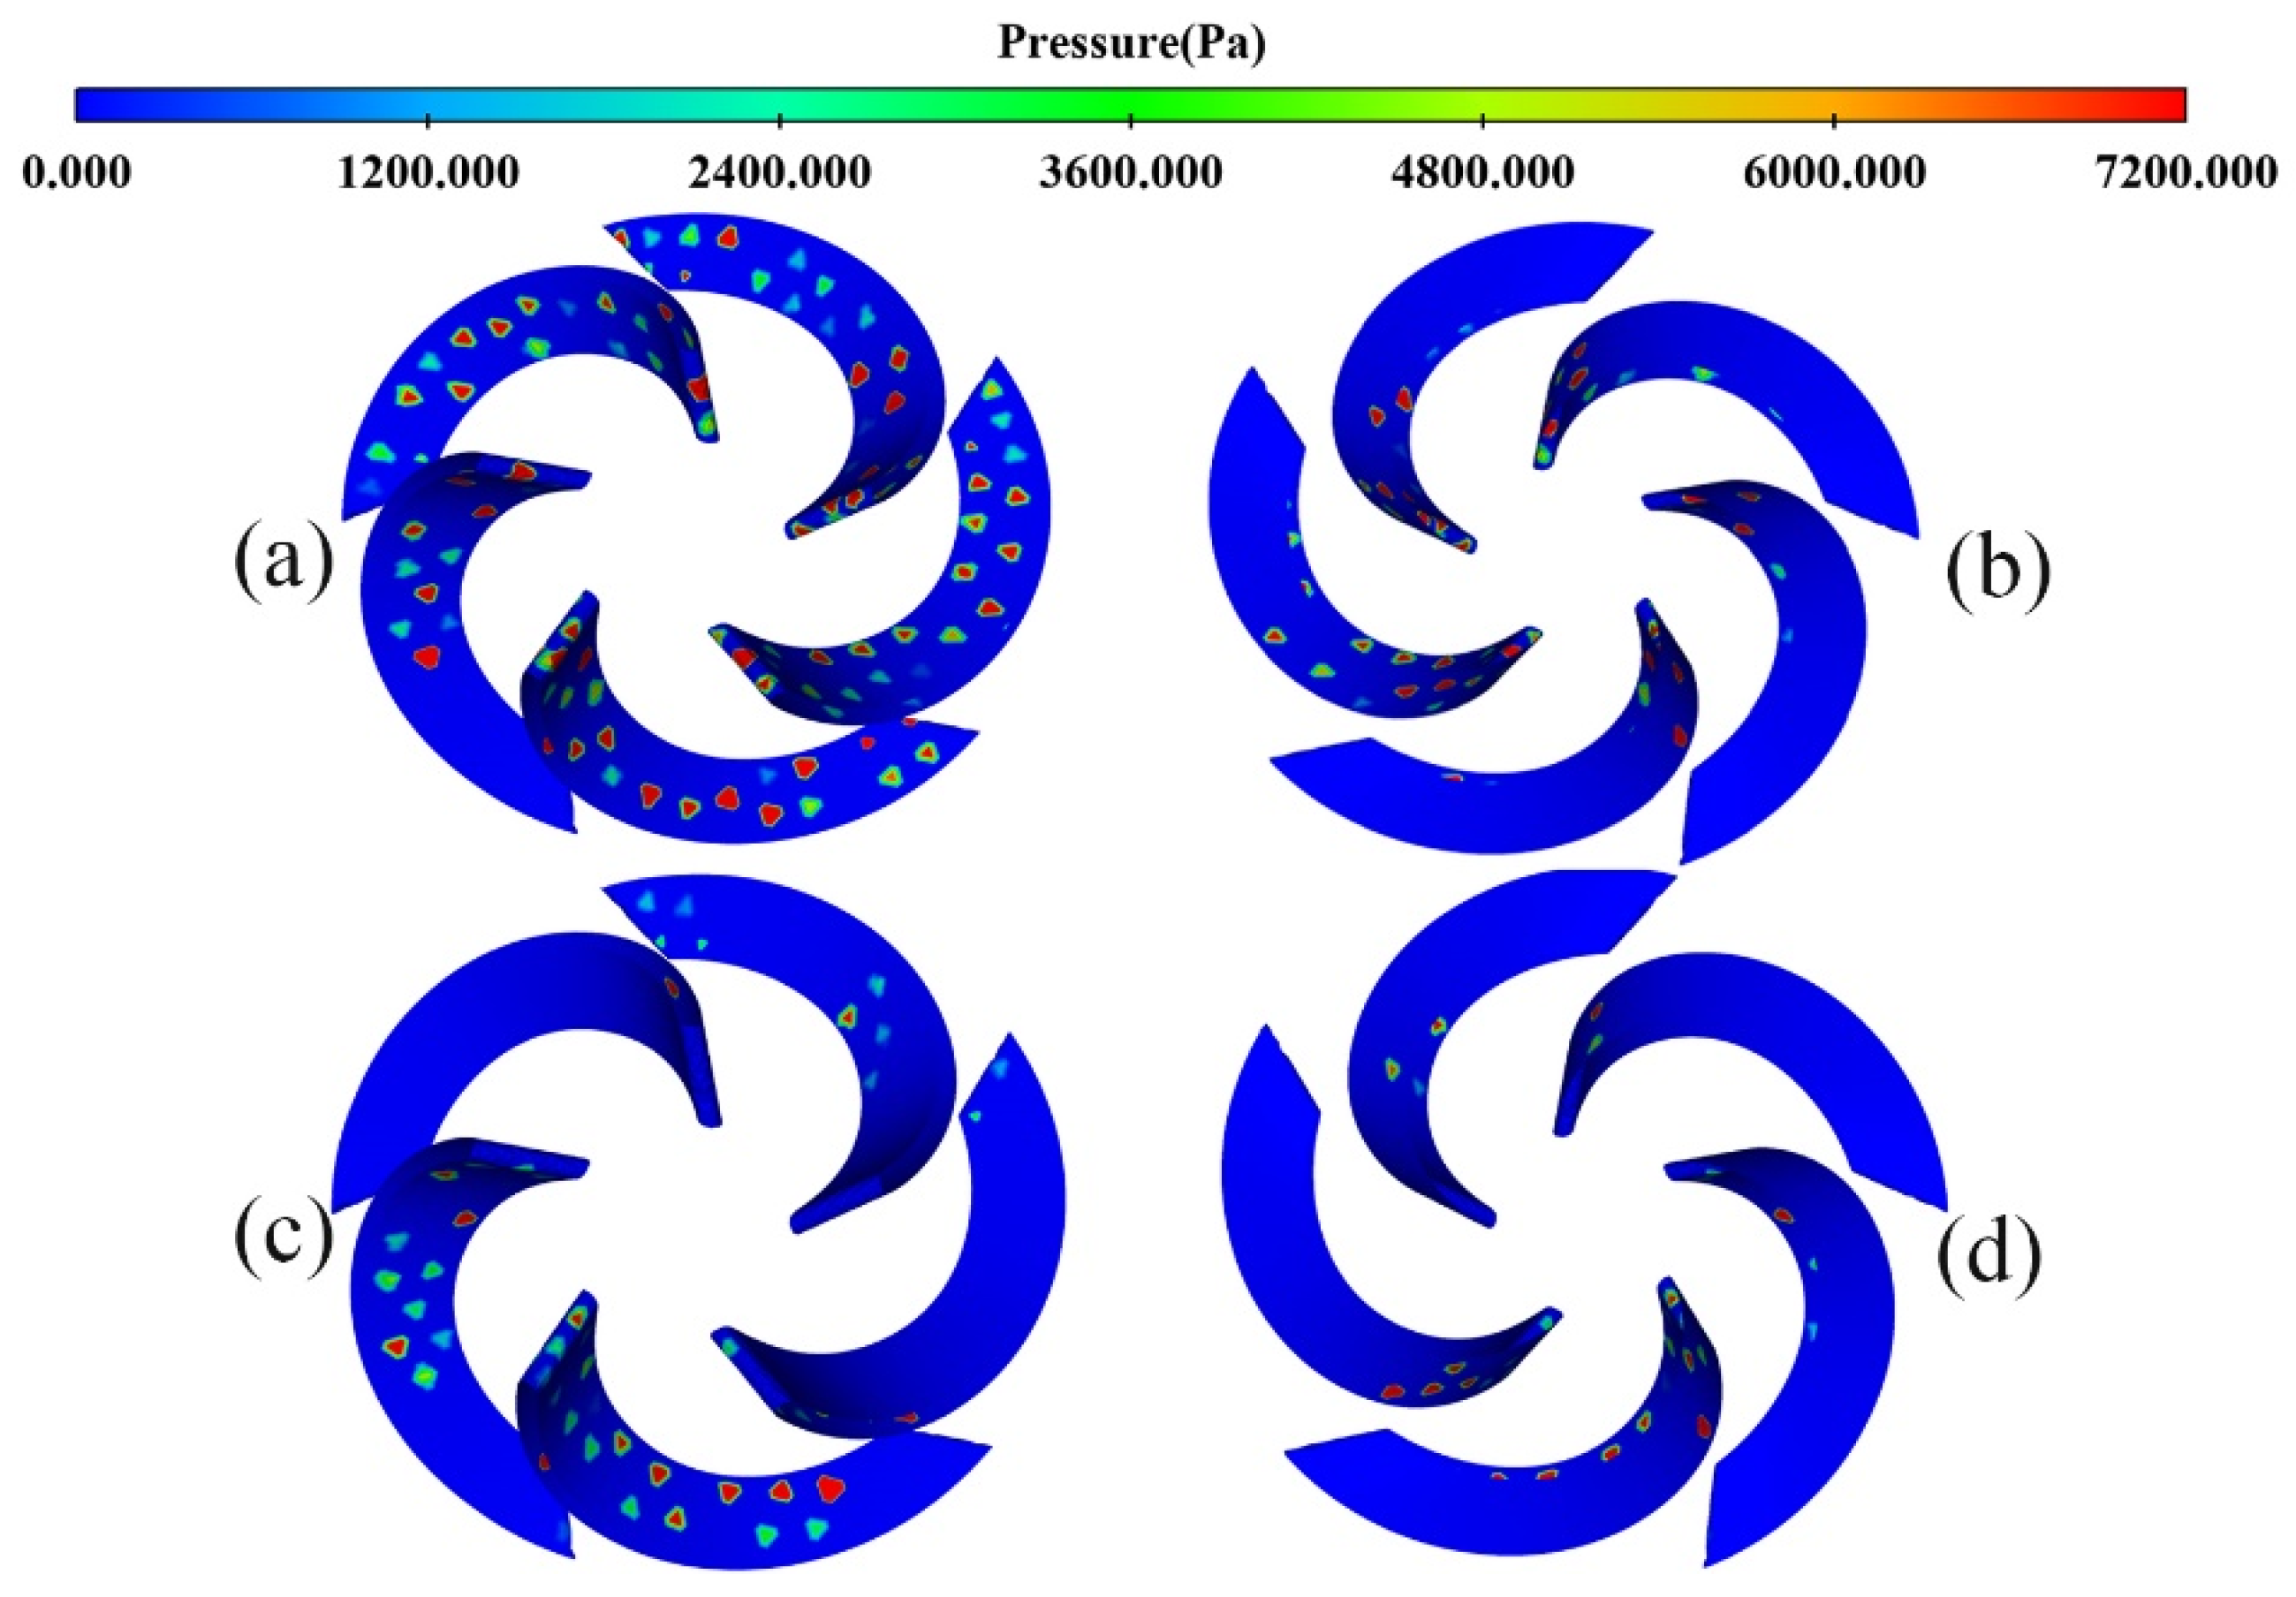
However, a more noticeable variation in particle reflux can be found in the study of
Figure 11 for 30–40 mm than for the previous particle classes. As can be seen in
Figure 11a, different pressure distribution areas are formed on the guide vanes because of particle collisions and rolling during the reflux process. In comparison with
Figure 8 and
Figure 11a, it is found that the pressure distribution area of one of the guide vanes is not continuous, and the lower half of the guide vanes is not under pressure from the particles in
Figure 11a. In our analysis, we established that the two sides of a guide vane channel are made up of the guide vane blades’ inner concave and outer convex surfaces. The high-pressure point is also found in the corresponding outer convex surface of the guide vane in the guide vane flow channel, where the pressure point is discontinuous compared to
Figure 11b. Therefore, it can be tentatively concluded that the particles are probably blocked in this channel. The high-pressure points on both sides of the flow channel reflect how the particles are clogged by the stacking of multiple particles, causing jamming. Further support for the previous speculation is provided by comparing the distribution of high-pressure points in
Figure 11c,d.
The movement of 30–40 mm particles in the pump is illustrated in
Figure 12. As shown in
Figure 12a, one of the flow channels in the first stage pump has been blocked.
Figure 12b shows the blocked section where particles remain in the first stage pump. The high-pressure area of the pump body can be analysed to reveal the blockage caused by the stacking of multiple particles, which more visually confirms the previous suspicions.
Research on the reflux of 40–50 mm particles in the pump revealed that the pressure distribution in the guide vane is similar to that of 30–40 mm particles, while the flow of particles in the pump is further changed compared to 30–40 mm particles. As shown in
Figure 13, the blockages are more severe at this particle size.
Figure 13a demonstrates the particle reflux when the simulation proceeds to 5 s. The diagram shows that particles have blocked two of the flow channels in the first stage of the pump, while the remaining flow channels have the majority of the particle flow velocity at 0.007 m/s.
Figure 13b shows the simulation as it proceeds to 10 s. As seen from
Figure 13b, the particles are completely blocked in the first stage of the pump, and all flow channels are blocked.
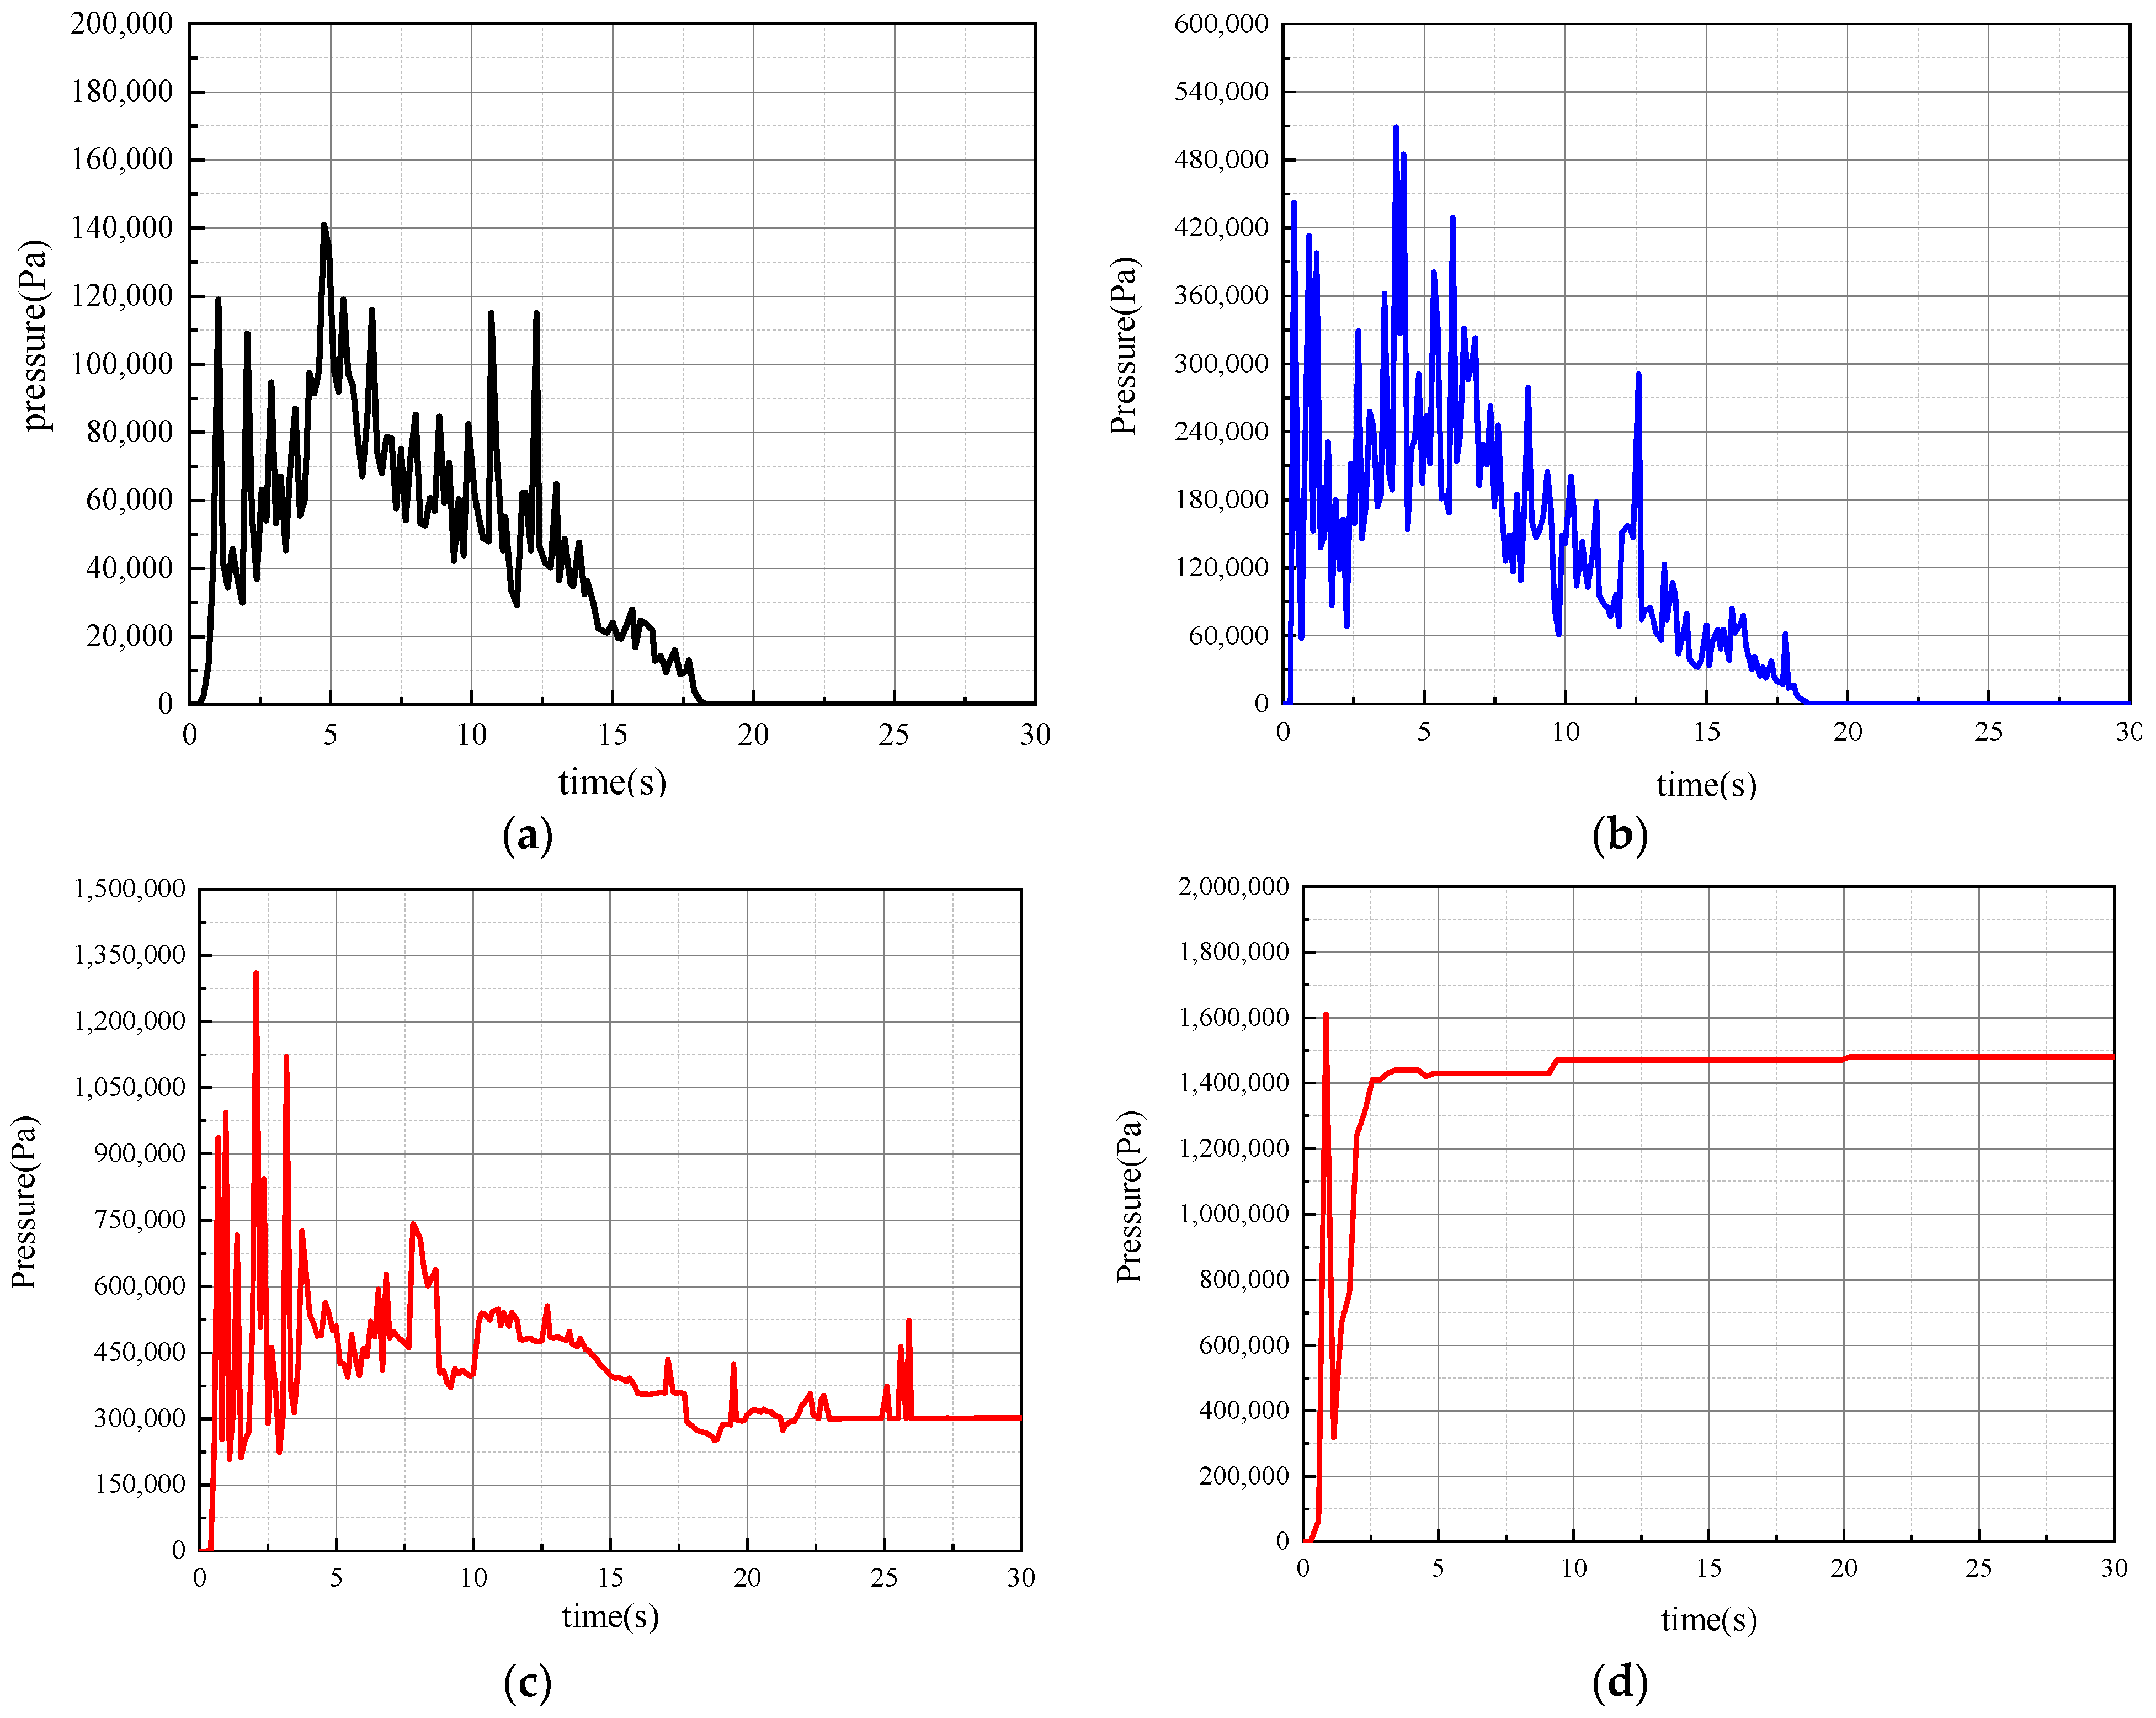
Once blockages occur in the pump, the accumulated particles will squeeze the flow channels. This will exert pressure on the components in the channels. The worse the blockage, the greater the pressure on the corresponding component. Therefore, the pressure on the components can also reflect the degree of blockage of particles in the pump. The graph in
Figure 14 shows the maximum pressure variation trend for different particle sizes on the first stage guide vane of the pump. The fluctuations of the four curves in
Figure 14 represent that the particles are capable of moving in the flow channel during that period. While when pressure is stabilised the severity of the blockage is reflected by the pressure level. As shown in
Figure 14a,b, the pressure on the guide vane for both 10–20 and 20–30 mm particles becomes 0 Pa over time. Meanwhile, the pressure of 20–30 mm particles on the guide vane is significantly higher than that of 10–20 mm particles, which can be observed from the graph. Therefore, it can be deduced that the collision level of 20–30 mm particles in the guide vane flow channel is stronger than that of 10–20 mm particles.
On the other hand, the pressure of 30–40 mm particles on the guide vane is stable at 0.3 MPa when the value ceases to vary, as shown in
Figure 14c. Therefore, a blockage of the particles in the pump can be determined at this particle size. However, 40–50 mm particles were found to block quickly in the pump, as shown in
Figure 14d. The pressure of the particles on the guide vane is maintained at 1.4 MPa. This suggests that the particles are rapidly and severely blocked in the pump.
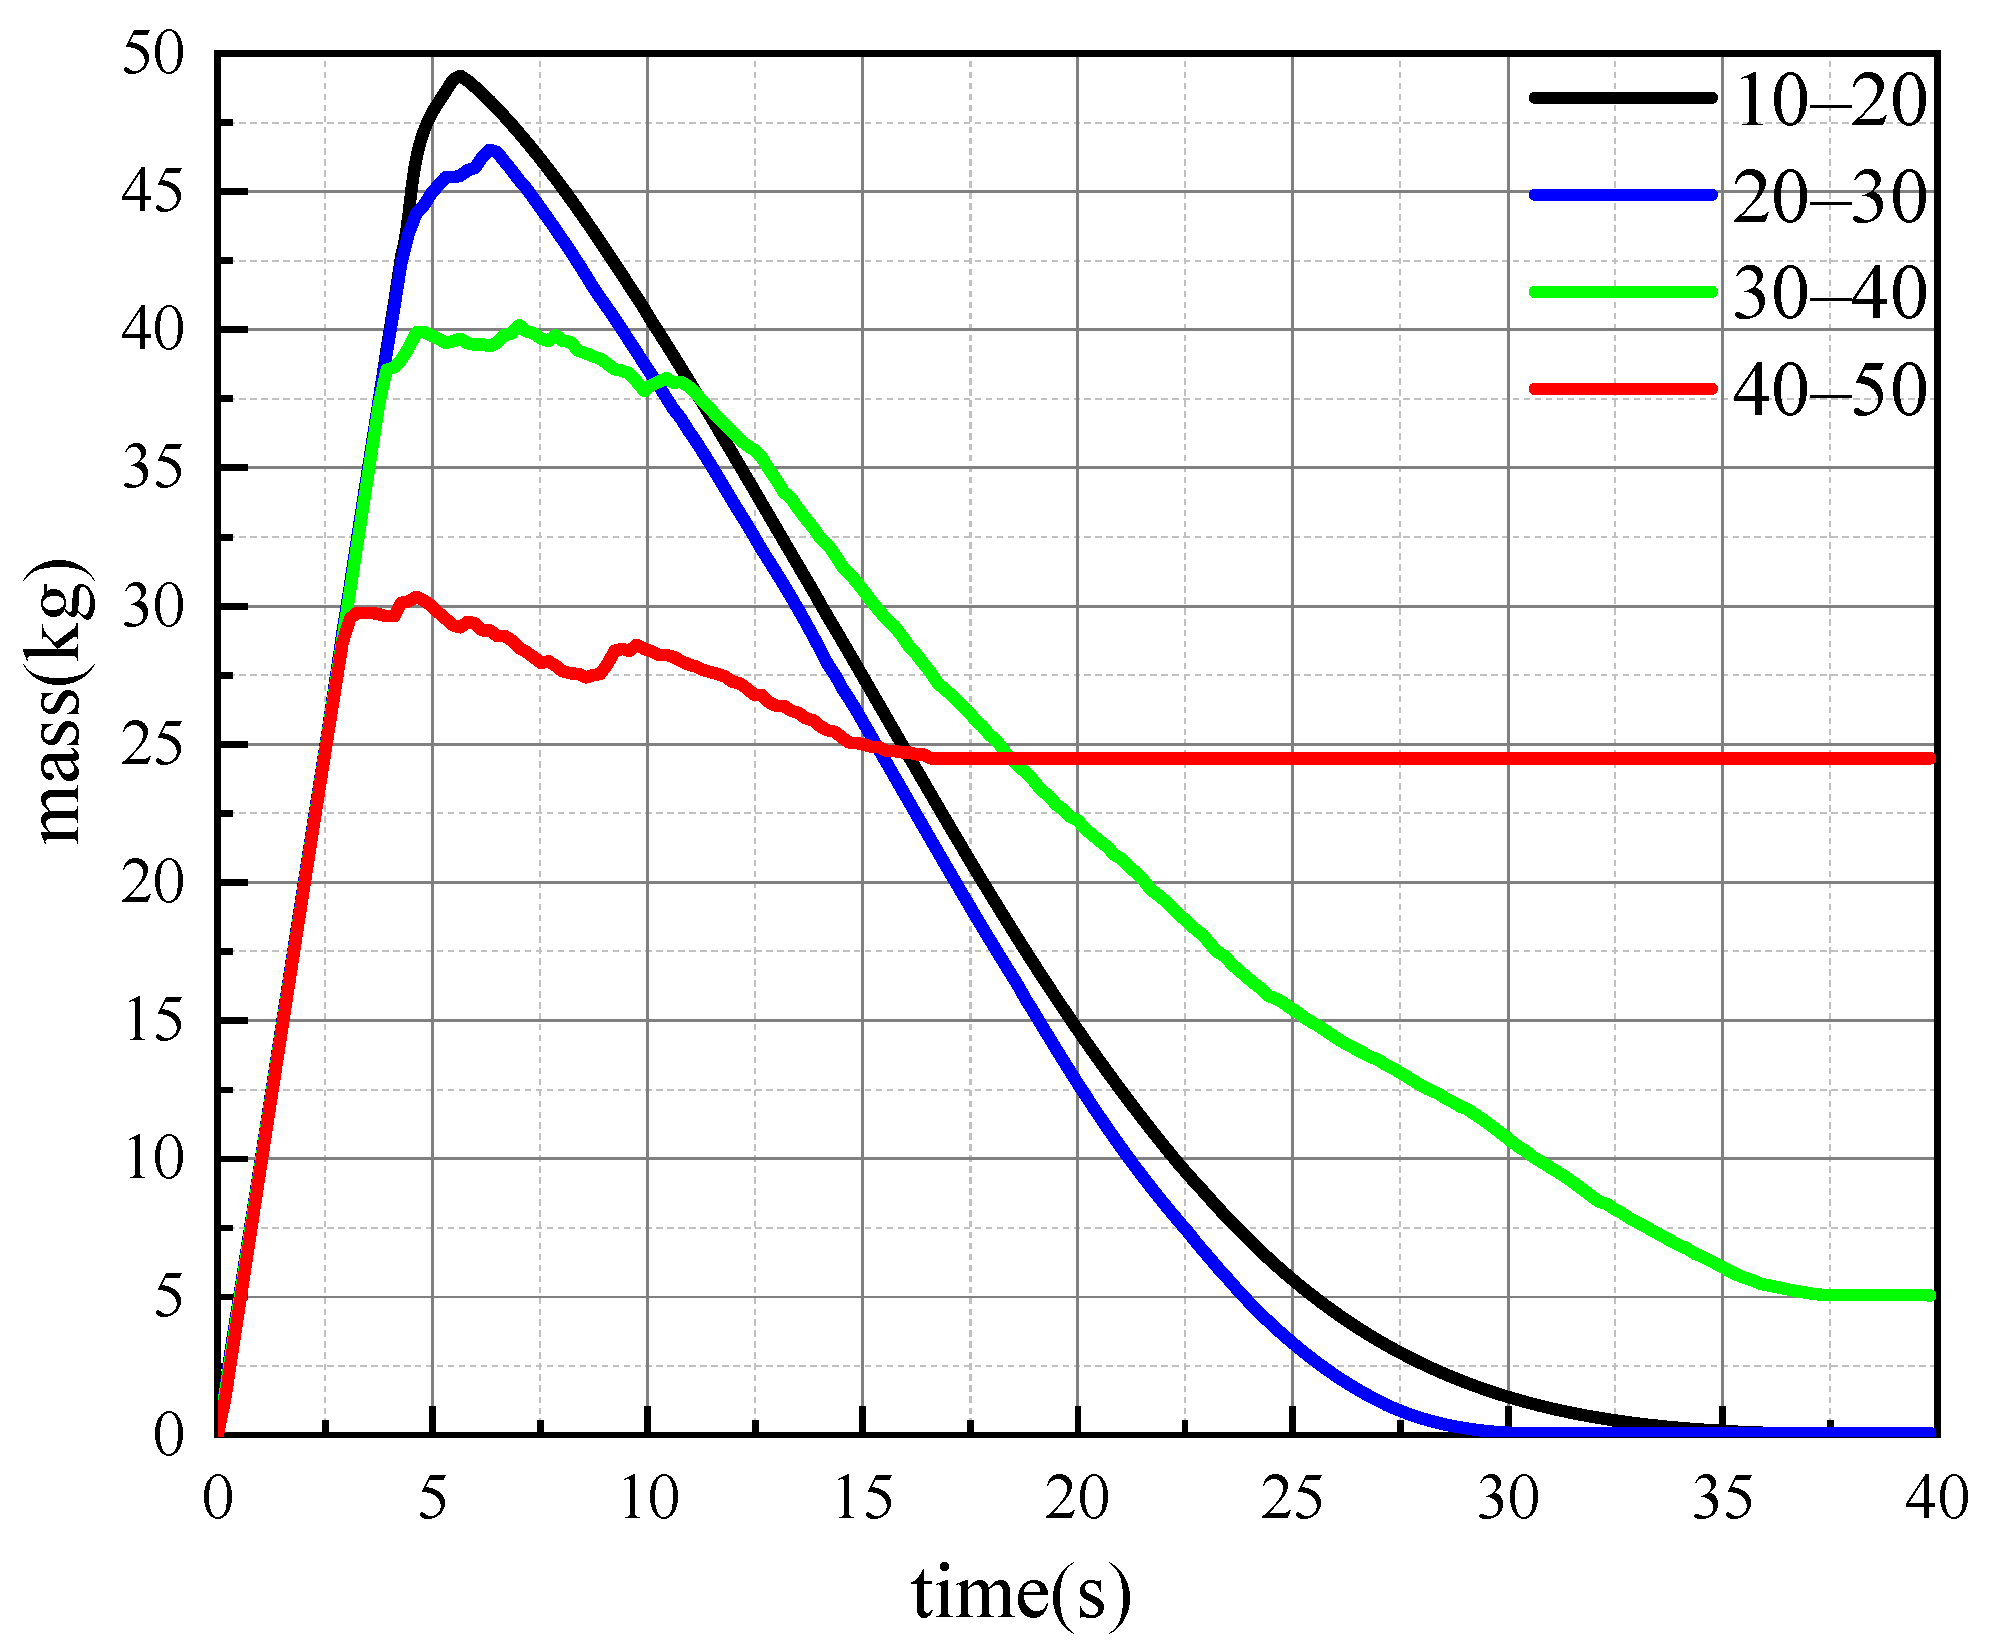
Figure 15 displays the tendency of the particle mass in the pump. As can be seen from the graphs, the total mass of 10–20 and 20–30 mm particles in the pump have almost the same tendency to change, and the particles are entirely refluxed. Simultaneously, the reflux velocity of 20–30 mm particles is slightly faster than that of 10–20 mm particles. The reflux velocity of 30–40 mm particles is significantly lower than that of the previous particle sizes, and some of the particles ultimately remain partially in the pump. There are some fluctuations in the peak part of each of the four curves, which results from the fact that the reflux velocity varies for different particle sizes. When some of the particles leave the pump from the outlet while particles are still being generated at the inlet of the pump, it can cause the curve to fluctuate. The reason why the four curves intersect at different points in time is that particles of different sizes have different levels of blockage in the pump. When particles block in the pump, it can slow down the reflux of particles in the pump. Situations such as 30–40 mm particles’ mass curves intersecting other curves can occur. In combination with
Figure 10,
Figure 12 and
Figure 13, it is caused by particles forming blocked sections in the first stage pump, where some particles are unable to complete the reflux. The mass profile of 40–50 mm particles reflects the fact that the particles are heavily blocked in the pump and the particles are unable to complete the reflux.
The effect of particle size on particle reflux can be tentatively concluded from the above simulation results. As the proportion of particle size distribution is consistent across the four groups of simulations, the effect of particle size distribution on reflux needs to be studied more directly. However, the blockage was more noticeable at 40–50 mm than at other particle sizes, and two additional groups of control trials were considered in this particle size range: simulation of the single-particle size of 40 mm and the particle size distribution of 40 mm (85% concentration), 42 mm (5% concentration), 44 mm (5% concentration), 50 mm (5% concentration).
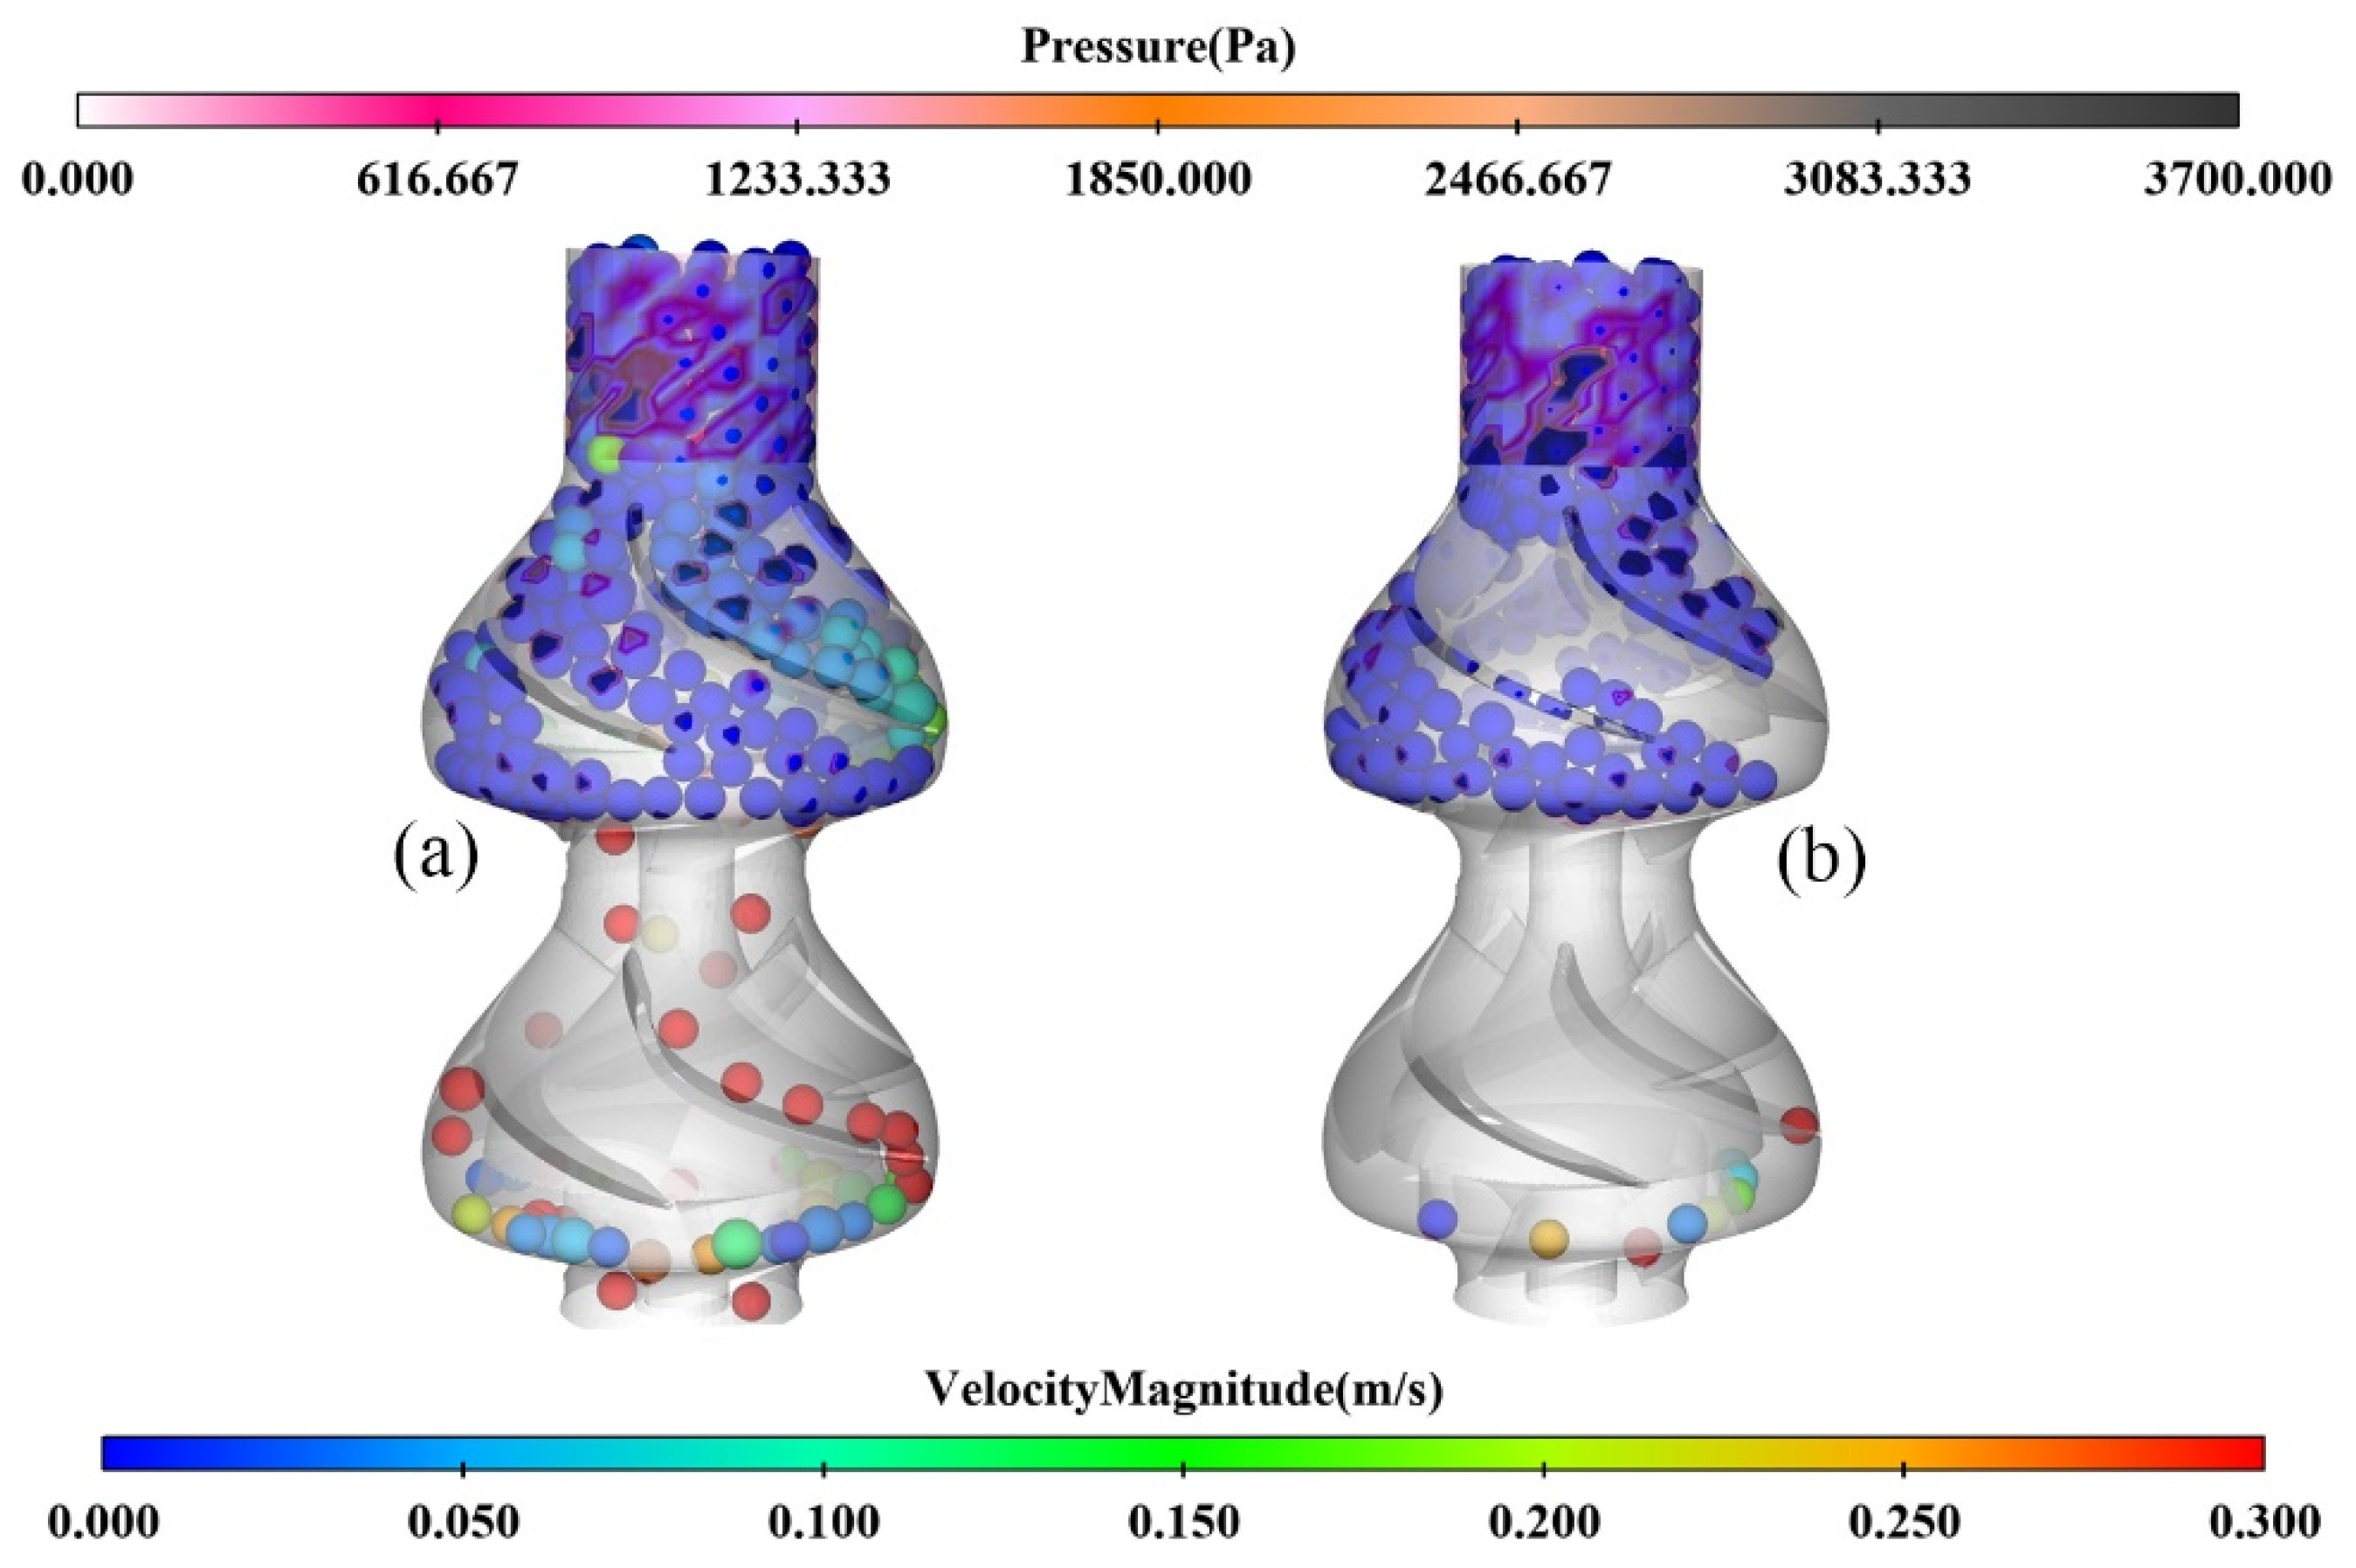
As shown in
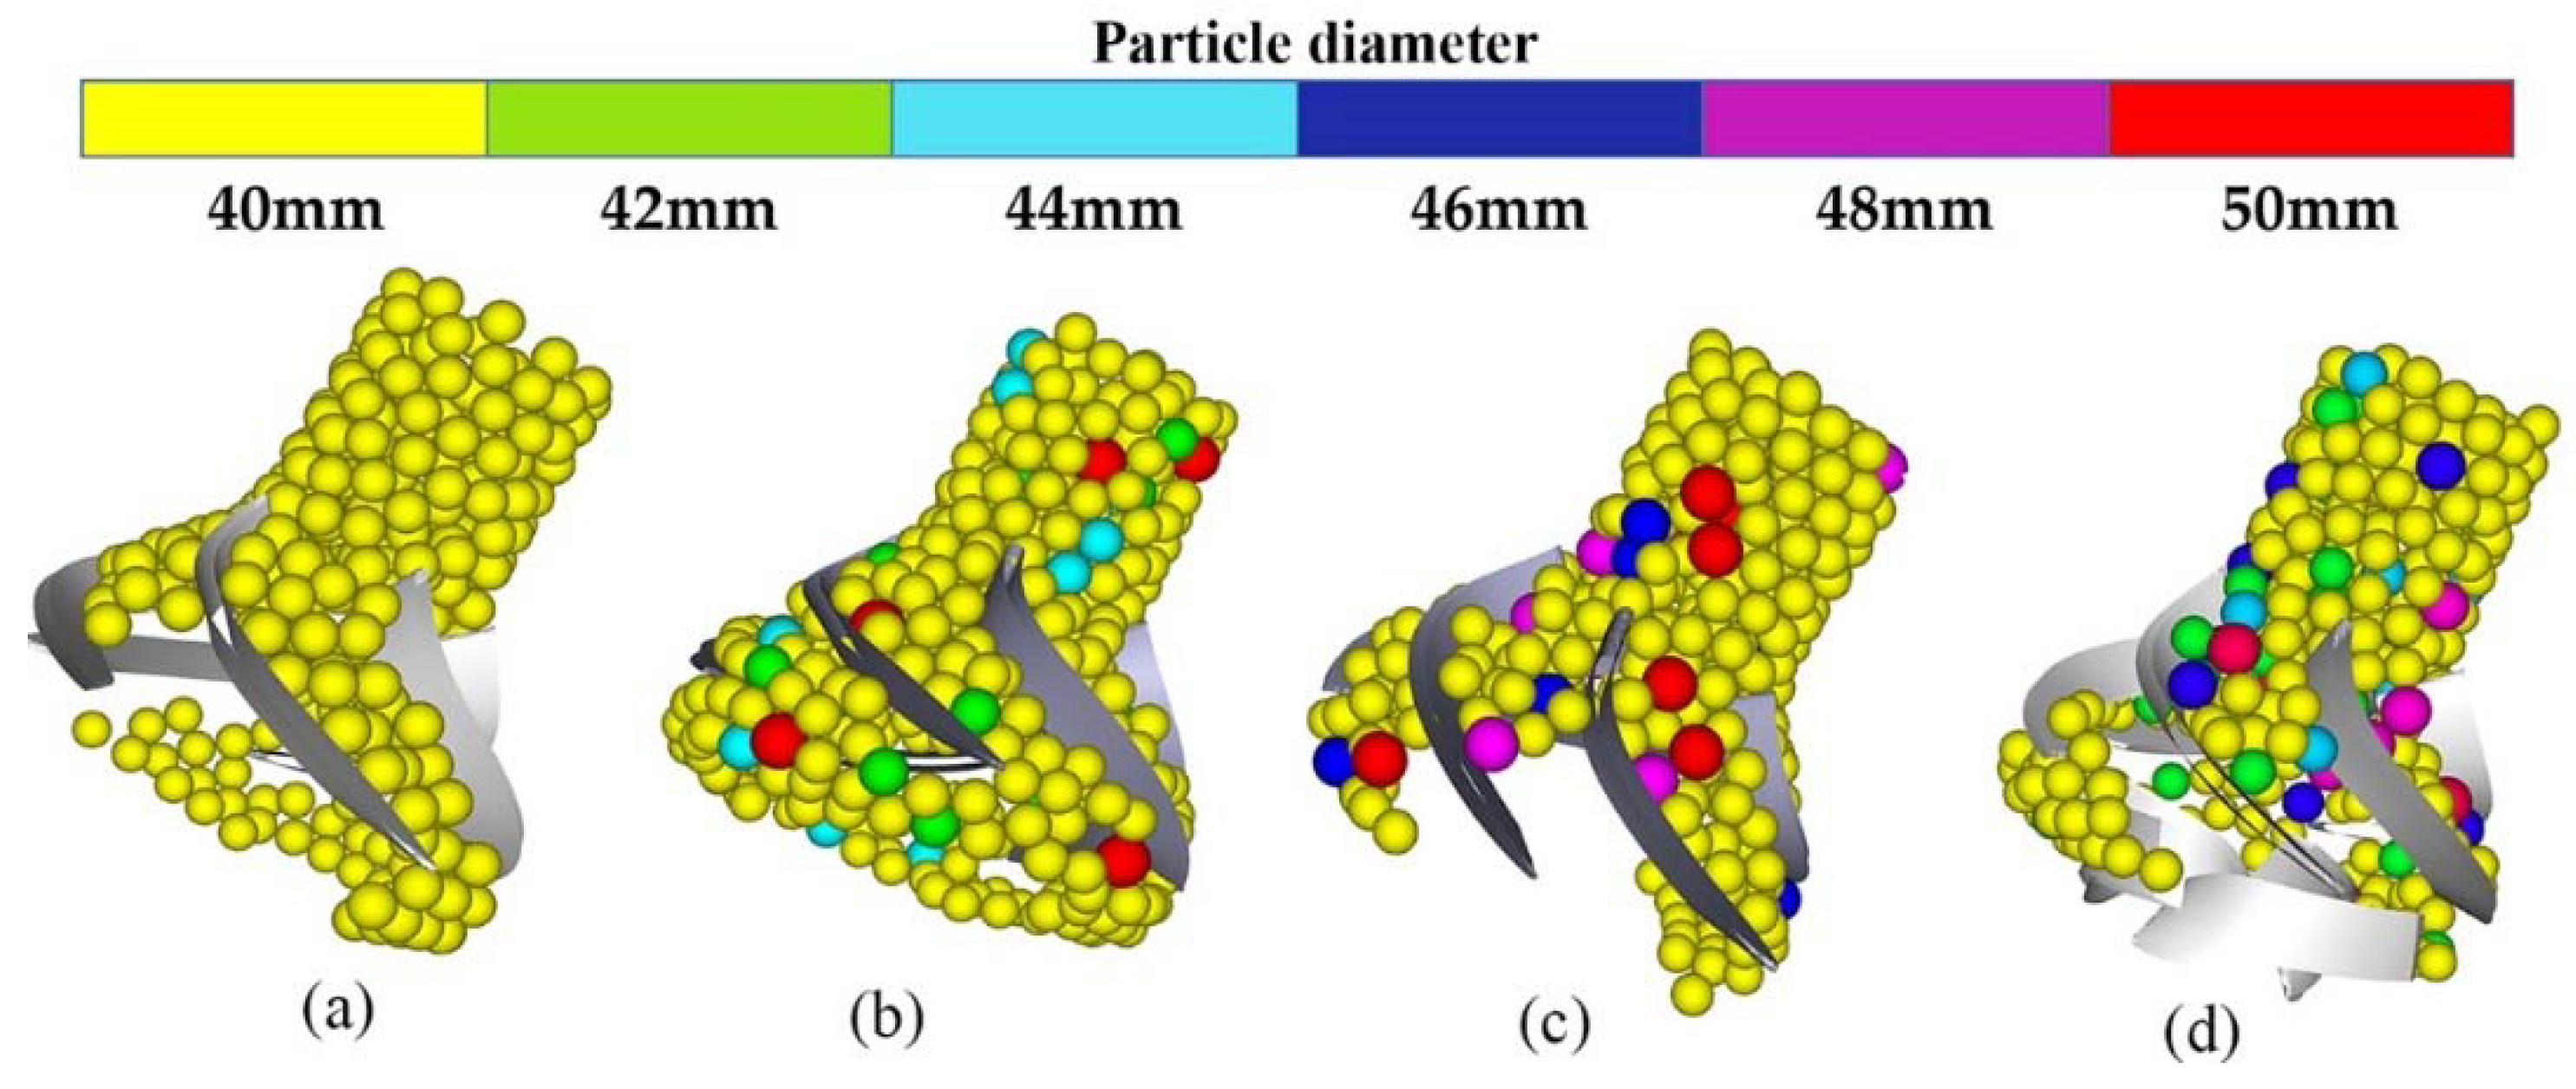
Figure 16, it is the different particle size distributions that lead to blockages with different degrees. In addition, the particle size is differentiated by colour for more accessible research on particle blockage behaviour: 40 mm—yellow, 42 mm—green, 44 mm—sky blue, 46 mm—blue, 48 mm—purple, 50 mm—red. As shown in
Figure 16a, the blockage of 40 mm particles in the guide vane flow channel is mainly caused by several particles squeezing each other in the flow channel and finally forming a triangular nodular blockage. Particles of different particle sizes can easily stack with each other at the interfaces of the guide vanes and impellers, and the phenomenon can be seen in
Figure 16b. This phenomenon leads to large particles forming nodular blockages, while smaller particles following closely behind will become stuck in the gaps between the larger particles, creating even more severe blockages. Although blockage occurs in
Figure 16c,d, it is relatively slight compared to
Figure 16b. Combined with the curves in
Figure 15 and
Figure 17 again, it can be seen that the selection of larger particles is within the permissible range of particle size distribution. This has a certain improvement in terms of the passage of particles through the pump in the reflux. Meanwhile, the principles that caused the fluctuations and intersections of the curves in
Figure 17 were the same as those in
Figure 15.
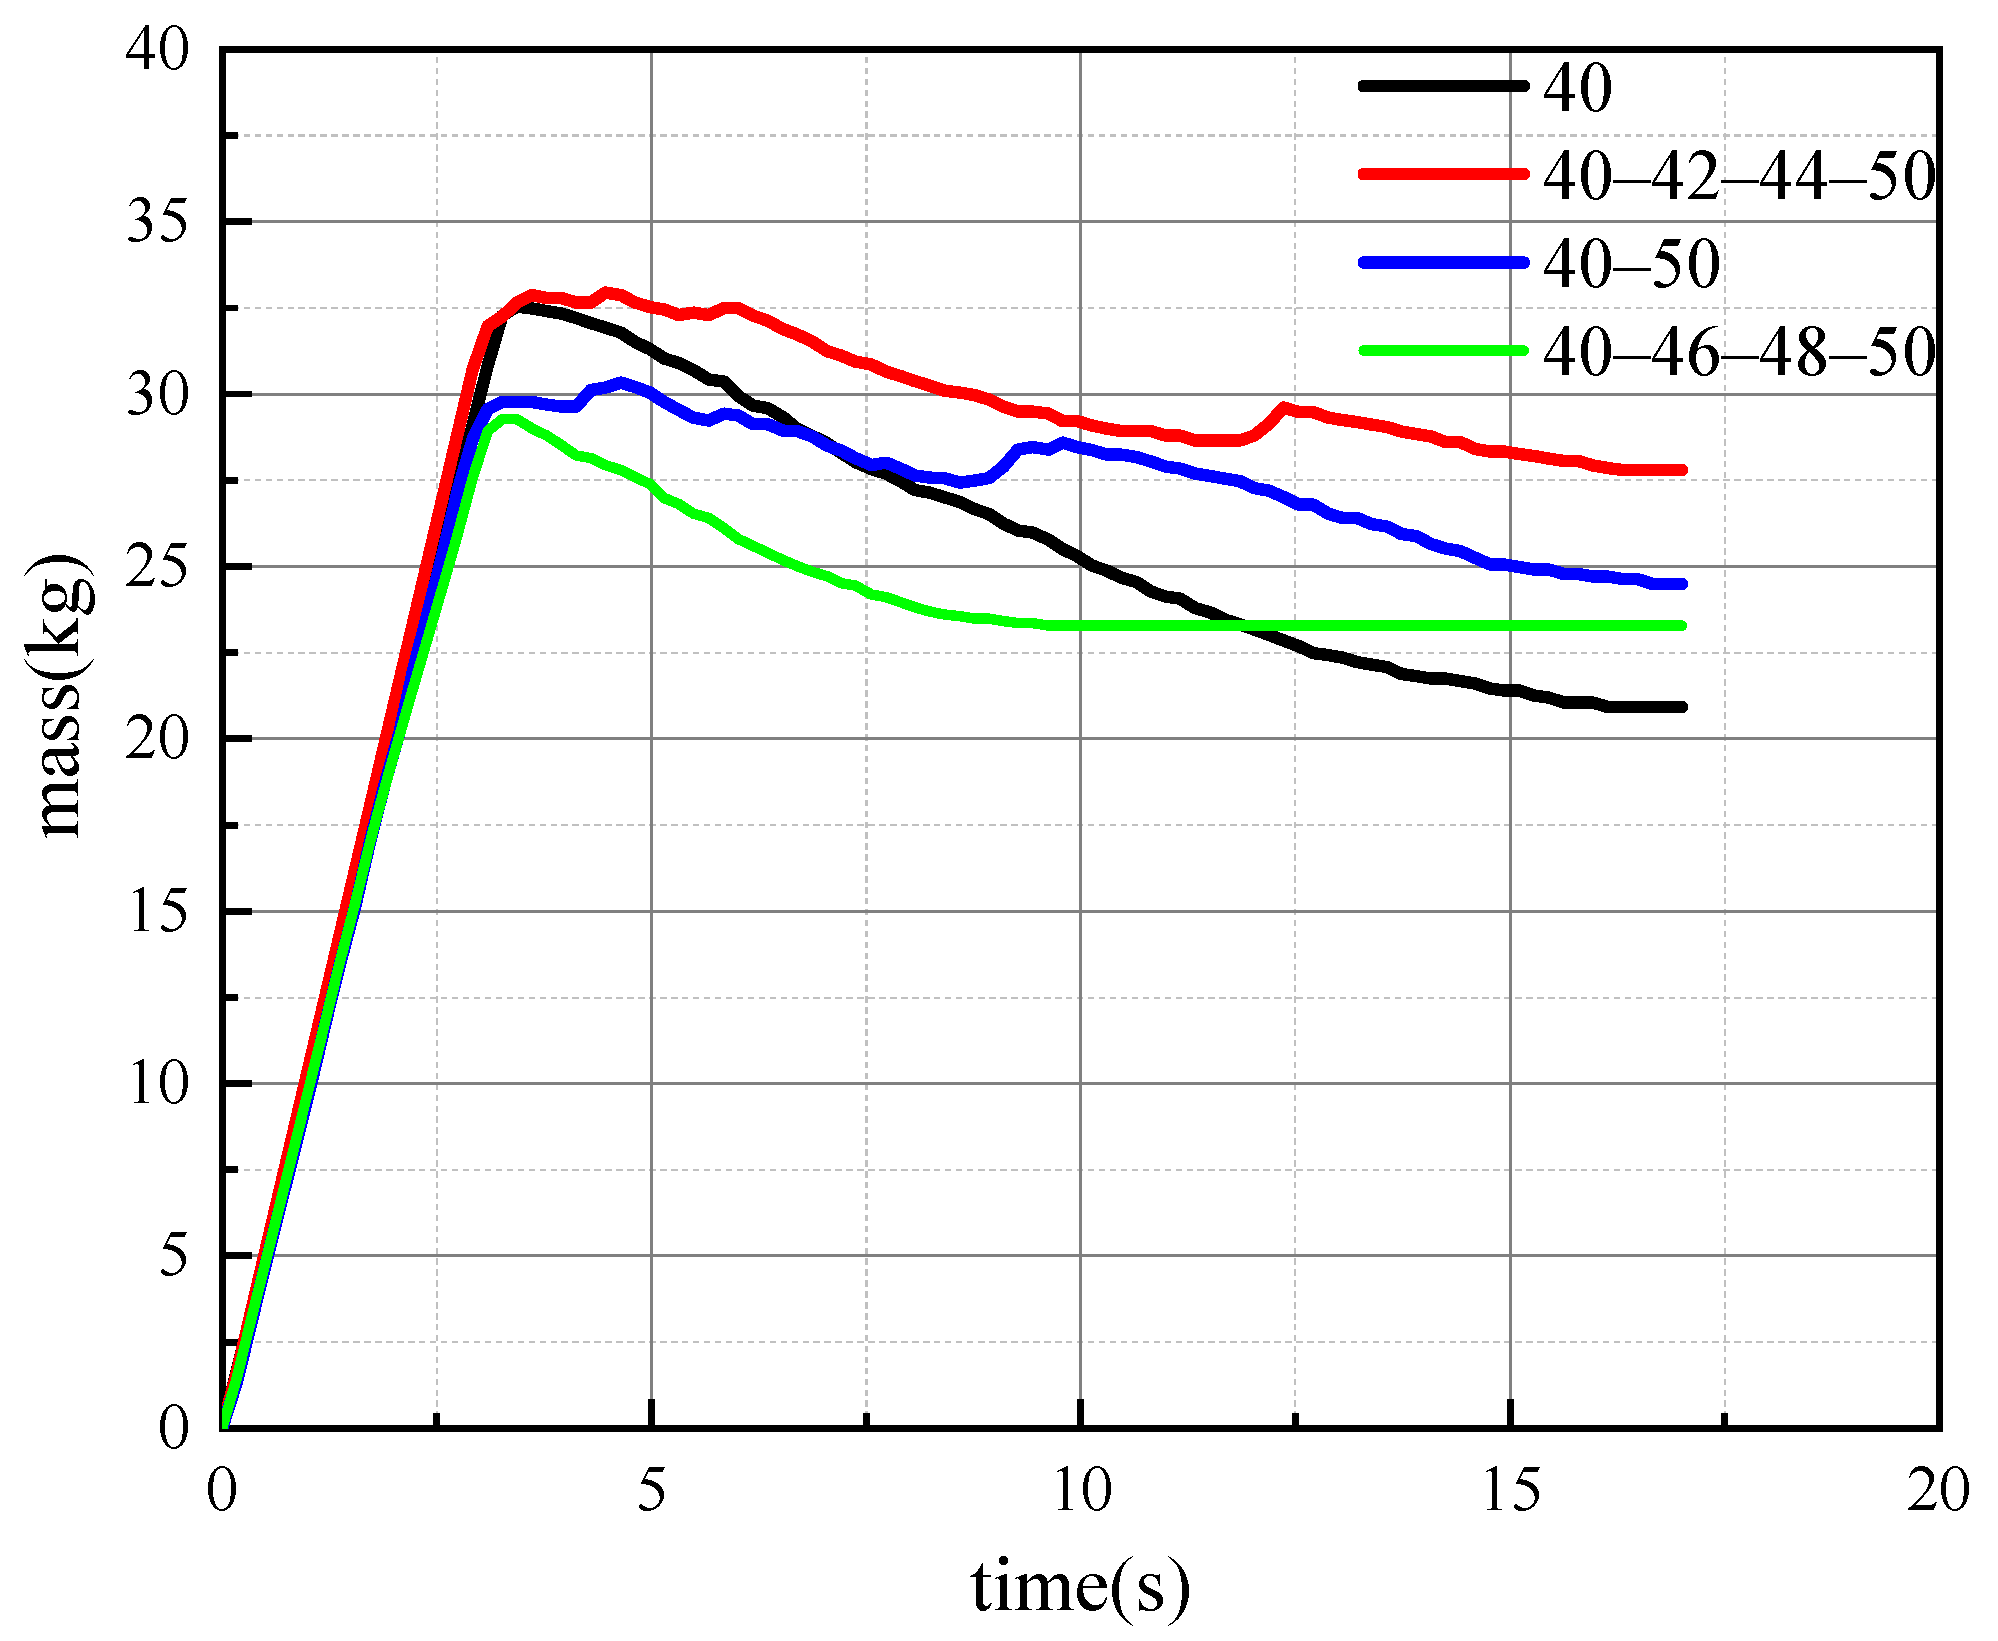
The line graphs that count the particle mass remaining in the first stage pump for the four situations of particle blockage section are shown in
Figure 17. Comparing the particle size distributions of 40–42–44–50 mm, 40–46–48–50 mm, and 40–50 mm, it is found that particles with the particle size distribution of 40–42–44–50 mm are the most serious in the pump blockage situation. The blockage of particles with size distributions of 40–46–48–50 mm is less severe than that of particles with size distributions of 40–50 mm. While the blocking of single-particle size in the pump is the lightest, it can be concluded that when the particle size exceeds the threshold for blockage, large particles can cause severe blockage in the pump. In terms of particle size distribution, larger particles in a given particle size distribution can effectively improve the reflux of particles.
5. Conclusions
A numerical simulation was carried out for the backflow problem of an emergency shutdown of a multistage centrifugal pump. The following conclusions were drawn.
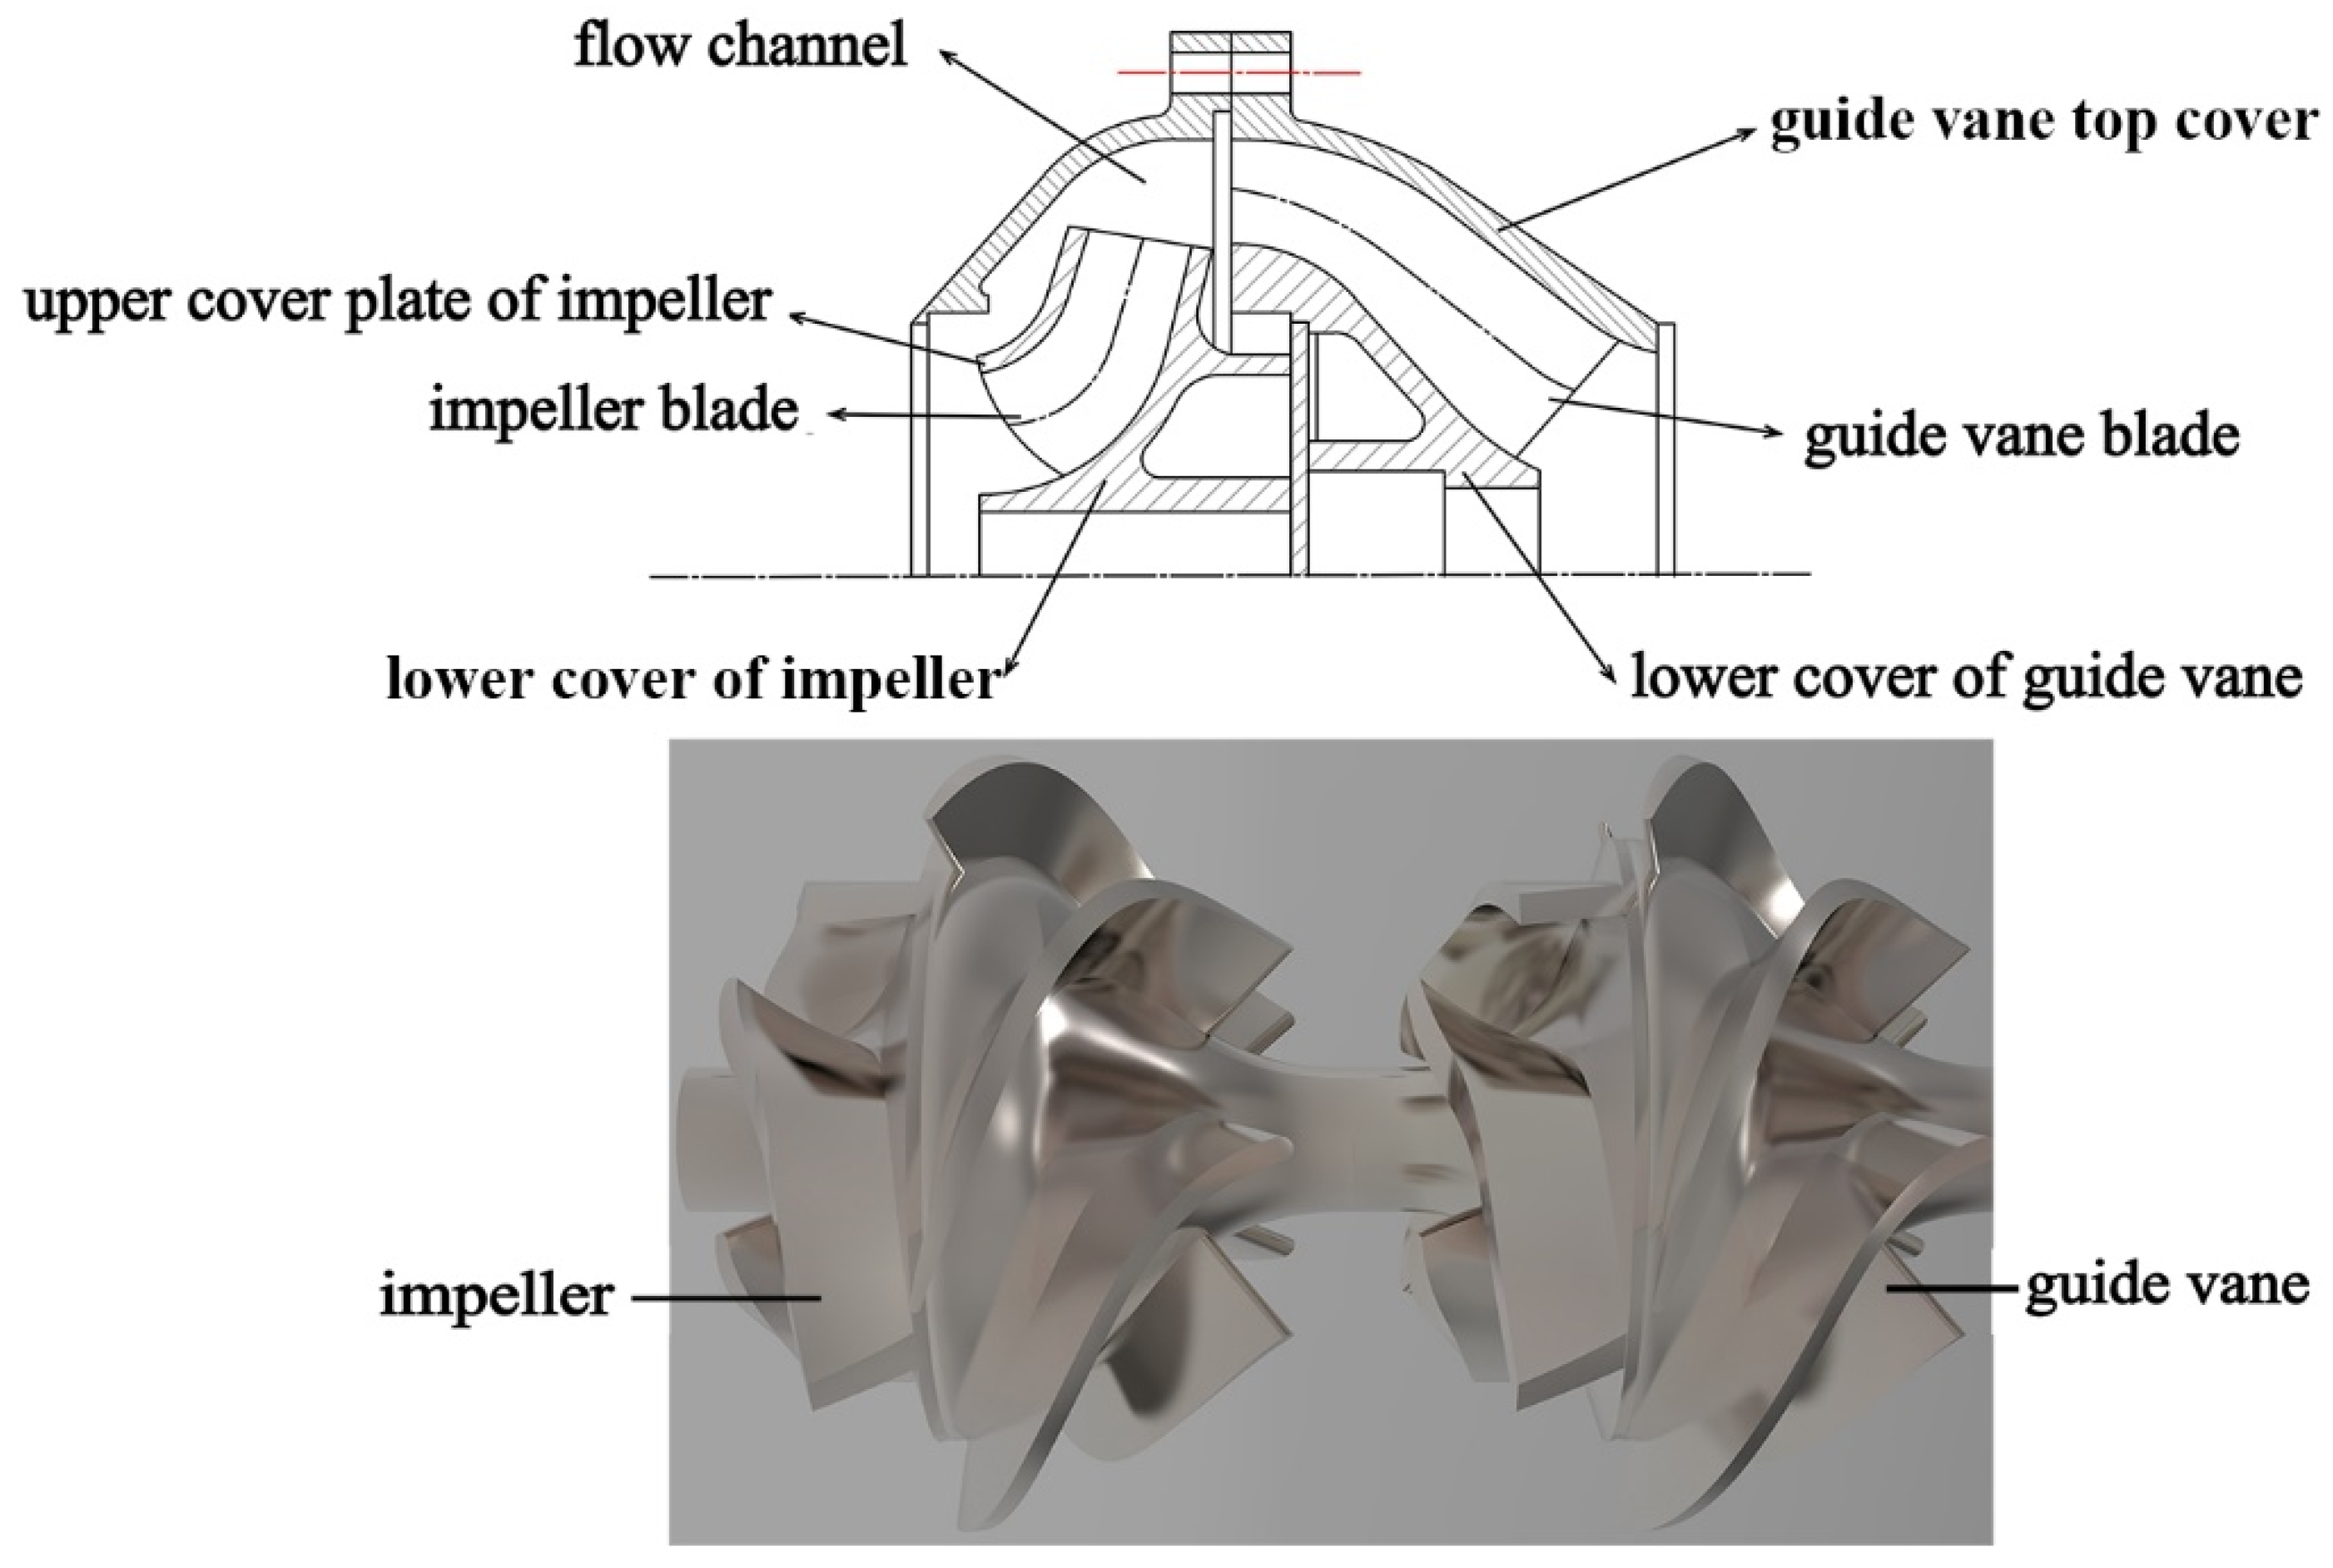
First, the concentration of particles has a specific influence on the backflow. When the falling velocity of particles is faster than the velocity of particles leaving the lower cover plate of the impeller, the concentration of the particles can reach a very high level locally. Then, the extrusion pressure of particles will make particles agglomerate, causing blockage.
Second, the backflow can be completed well in a size of 10–30 mm. At the same time, 30–40 mm particles will form part of the blocked section remaining in the pump with the primary particles of 30 mm. The analysis reveals that particles of 40–50 mm can cause severe blockages. The maximum diameter of particles should be controlled within 30 mm to ensure ore yield and equipment safety.
Third, the simulation shows that the interface between the guide vane and the impeller is more prone to forming an accumulation of particles. The squeezing motion of multiple particles against each other can easily lead to the blockage of segments.
Fourth, research into the movement behaviour of particles has revealed that particle blockage is caused by multiple large particles placed in one section of the flow channel at the same time, which restrict the movement between the particles and eventually block into the flow channel. At the same time, smaller particles at the back tend to fill in the gaps between the larger particles as they form blockage segments. This eventually leads to severe blockages occurring. Therefore, the size distribution of the particles significantly influences the reflux of the particles. It is recommended to use coarse particles with a larger particle size to ensure a safe return flow in the pump under the premise of no blockages.


