Article

Numerical Investigation of the Characteristics of Erosion in a Centrifugal Pump for Transporting Dilute Particle-Laden Flows

Research Center of Fluid Machinery Engineering and Technology, Jiangsu University, Zhenjiang 212013, China
*
Author to whom correspondence should be addressed.
J. Mar. Sci. Eng. 2021, 9(9), 961; https://doi.org/10.3390/jmse9090961
Submission received: 14 August 2021 / Revised: 31 August 2021 / Accepted: 31 August 2021 / Published: 3 September 2021
(This article belongs to the Special Issue Marine Applications of Computational Fluid Dynamics)

Abstract

:
Erosion in centrifugal pumps for transporting flows with dilute particles is a main pump failure problem in many engineering processes. A numerical model combining the computational fluid dynamics (CFD) and Discrete Element Method (DEM) is applied to simulate erosion in a centrifugal pump. Different models of the liquid-solid inter-phase forces are implemented, and the particle-turbulence interaction is also defined. The inertial particles considered in this work are monodisperse and have finite size. The numerical results are validated by comparing the results with a series of experimental data. Then, the effects of particle volume fraction, size, and shape on the pump erosion are estimated in the simulations. The results demonstrate that severe erosive areas are located near the inlet and outlet of the pressure side of the impeller blade, the middle region of the blade, the corners of the shroud and hub of the impeller adjoining to the pressure side of the blade, and the volute near the pump tongue. Among these locations, the maximum erosion occurs near the inlet of the pressure side of the blade. Erosion mitigation occurs under the situation where more particles accumulate in the near-wall region of the eroded surface, forming a buffering layer. The relationship between the particle size and the erosion is nonlinear, and the 1 mm particle causes the maximum pump erosion. The sharp particles cause more severe erosion in the pump because both the frequency of particle-wall collisions and the impact angle increase with the increasing sharpness of the particle.

1. Introduction

Transport of flows with dilute coarse particles by pumps is widely encountered in many industries, such as coal and mining, as well as metallurgical and chemical processes [1,2]. The collisions between hard solid particles and rotating hydraulic parts of the pump can cause surface damage or erosive wear, resulting in fracture, pitting, and even breakdown of the hydraulic parts. Recently, the activities of exploiting natural resources (e.g., oil and gas, geothermal energy, and minerals) from the deep earth and ocean require the development of multiphase flow pumps with high performance and abrasion resistance [3]. Large amounts of particles with different shapes, sizes, and properties will be conveyed by the liquids in the pumps. Compared with pipes and fittings, pumps are more vulnerable equipment in the conveying system because of the fierce collisions of particles and high rotating components. The pump erosion will become the primary concern for designing such systems in deep wells or undersea because repairing or changing pumps will be expensive. Poor design in the capability of resisting erosion may reduce the pump service life. Therefore, the mechanisms and characteristics of the erosion process in the pump caused by coarse particles should be well revealed in order to design new pumps for harsh environments.
Early studies of pump erosion were mainly based on erosion experiments that observed and measured material weight losses in the tested pumps [4,5,6]. However, a limitation of this method is that the results occur in real conditions with a vast number of influencing factors acting simultaneously, and the erosive mechanism of each factor is intractably studied from the experiment. Thanks to computational fluid dynamics (CFD), two methods based on the CFD technique are developed to model multiphase flows. In the Eulerian-Eulerian (E-E) framework, both the liquid and solid phases are solved as a continuum in the Navier-stokes equations. Several models were developed to model the inter-phase interactions with different assumptions and applicable scopes. Zhao et al. [7] simulated the liquid-solid two-phase flow in a double-channel centrifugal pump by using the mixture model (a special type of the E-E method) and found that the particle size and concentration have greater impacts on the erosion of the hydraulic components. Zhang et al. [8] investigated the characteristics of liquid-solid mixing flow in a centrifugal pump with different particle concentrations and diameters based on the mixture model.
However, this model is not accurate when the particles are large and distributed unevenly in the fluid domain. In such conditions, the particles should be treated as individual elements. The Eulerian-Lagrangian (E-L) formulation is introduced in the CFD simulation. The particles are solved as discrete elements, and the particle motion is governed by Newton’s Second Law. Lin et al. [9] used the discrete phase model (DPM) to simulate the slurry flow in the pipe and found good agreement with the experiment in terms of the distributions of particle concentration and velocity. Pagalthivarthi et al. [10] used the DPM method to simulate the wear on the volute of a pump transporting dilute slurry. Shen et al. [11] studied the influence of particle size on the wear rate and position in a centrifugal pump by using the DPM model. Huang et al. compared the effects of three different particle diameters on the wear position of the pump blades by using an unsteady calculation with the DPM method [12].
The existing drawbacks of the DPM method are the one-way coupling from fluid to solid and the absence of particle-particle collisions. The discrete element method (DEM) is then introduced and coupled with the CFD simulation, which is also viewed as the E-L method. Although the DEM simulation has been used in many engineering processes (e.g., fluidized bed, particle sediment) for a long time [13,14,15], the application of coupling CFD and DEM simulations in erosion prediction has been recently realized in both the pneumatic and hydraulic conveying systems [16,17]. The erosions of the bends with different diameters, curvatures, and orientations in the pneumatic system were predicted using the CFD-DEM simulations [18], and several experiments of the erosion in a 90° bend were conducted to calibrate the numerical method [18,19]. Erosion in the bends, conveying liquid-solid flow, was also simulated using the CFD-DEM method [20]; the results were normally validated with experimental data measured by Zeng et al. [21]. There are few studies on erosion predictions in more complicated machines, such as pumps.
In fact, the accuracy of erosion predictions in the fluid-particle flow systems is determined by the predictions of various characteristics of the two-phase flow, such as particle distribution, particle velocity, and fluid-particle interactions in both momentum and turbulence. It is argued that the solid volume fraction should be considered in the fluid governing equations when the solid volume fraction is larger than 10−6 [22]. Moreover, the fluid-particle interaction force should be considered in the fluid, which is known as the two-way coupling method [16]. Compared with that used in gas-solid flows, the lift force model is paid a special interest in the liquid-solid flow, and a recently developed model, i.e., the Loth model, is used in the simulation instead of the conventional Saffman and Magnus models [17]. The turbulence-particle interaction was ignored in the previous investigation but was considered using the discrete random walk (DRW) model in others [16]. However, the effect that the turbulent modification due to particles was not considered in the simulation or described in detail in the model. From the literature review, turbulence plays an important role in determining particle distribution and helping particle cluster formation [23,24,25,26]. Since turbulence in the centrifugal pump is usually very high, this effect on the particle distribution and associated erosion should be revealed.
In the present work, a delicate numerical model based on the CFD-DEM coupling is developed for modeling the dilute particle-laden flow and resulting erosion in a centrifugal pump. Since the turbulent intensity is normally high in pumps, the two-way coupling between turbulence and particles is considered in the simulation. The descriptions of the physical models of the pump and particle and the mathematic formulas of the numerical model are presented in Section 2. The authenticity of the numerical model is validated by comparing the simulated results with a series of previous experiments in Section 3. The effects of different factors, such as particle size, concentration, and shape, as well as the working flow rate on the erosion of different pump components are studied numerically. The main conclusions are summarized in the final section.

2. Numerical Model

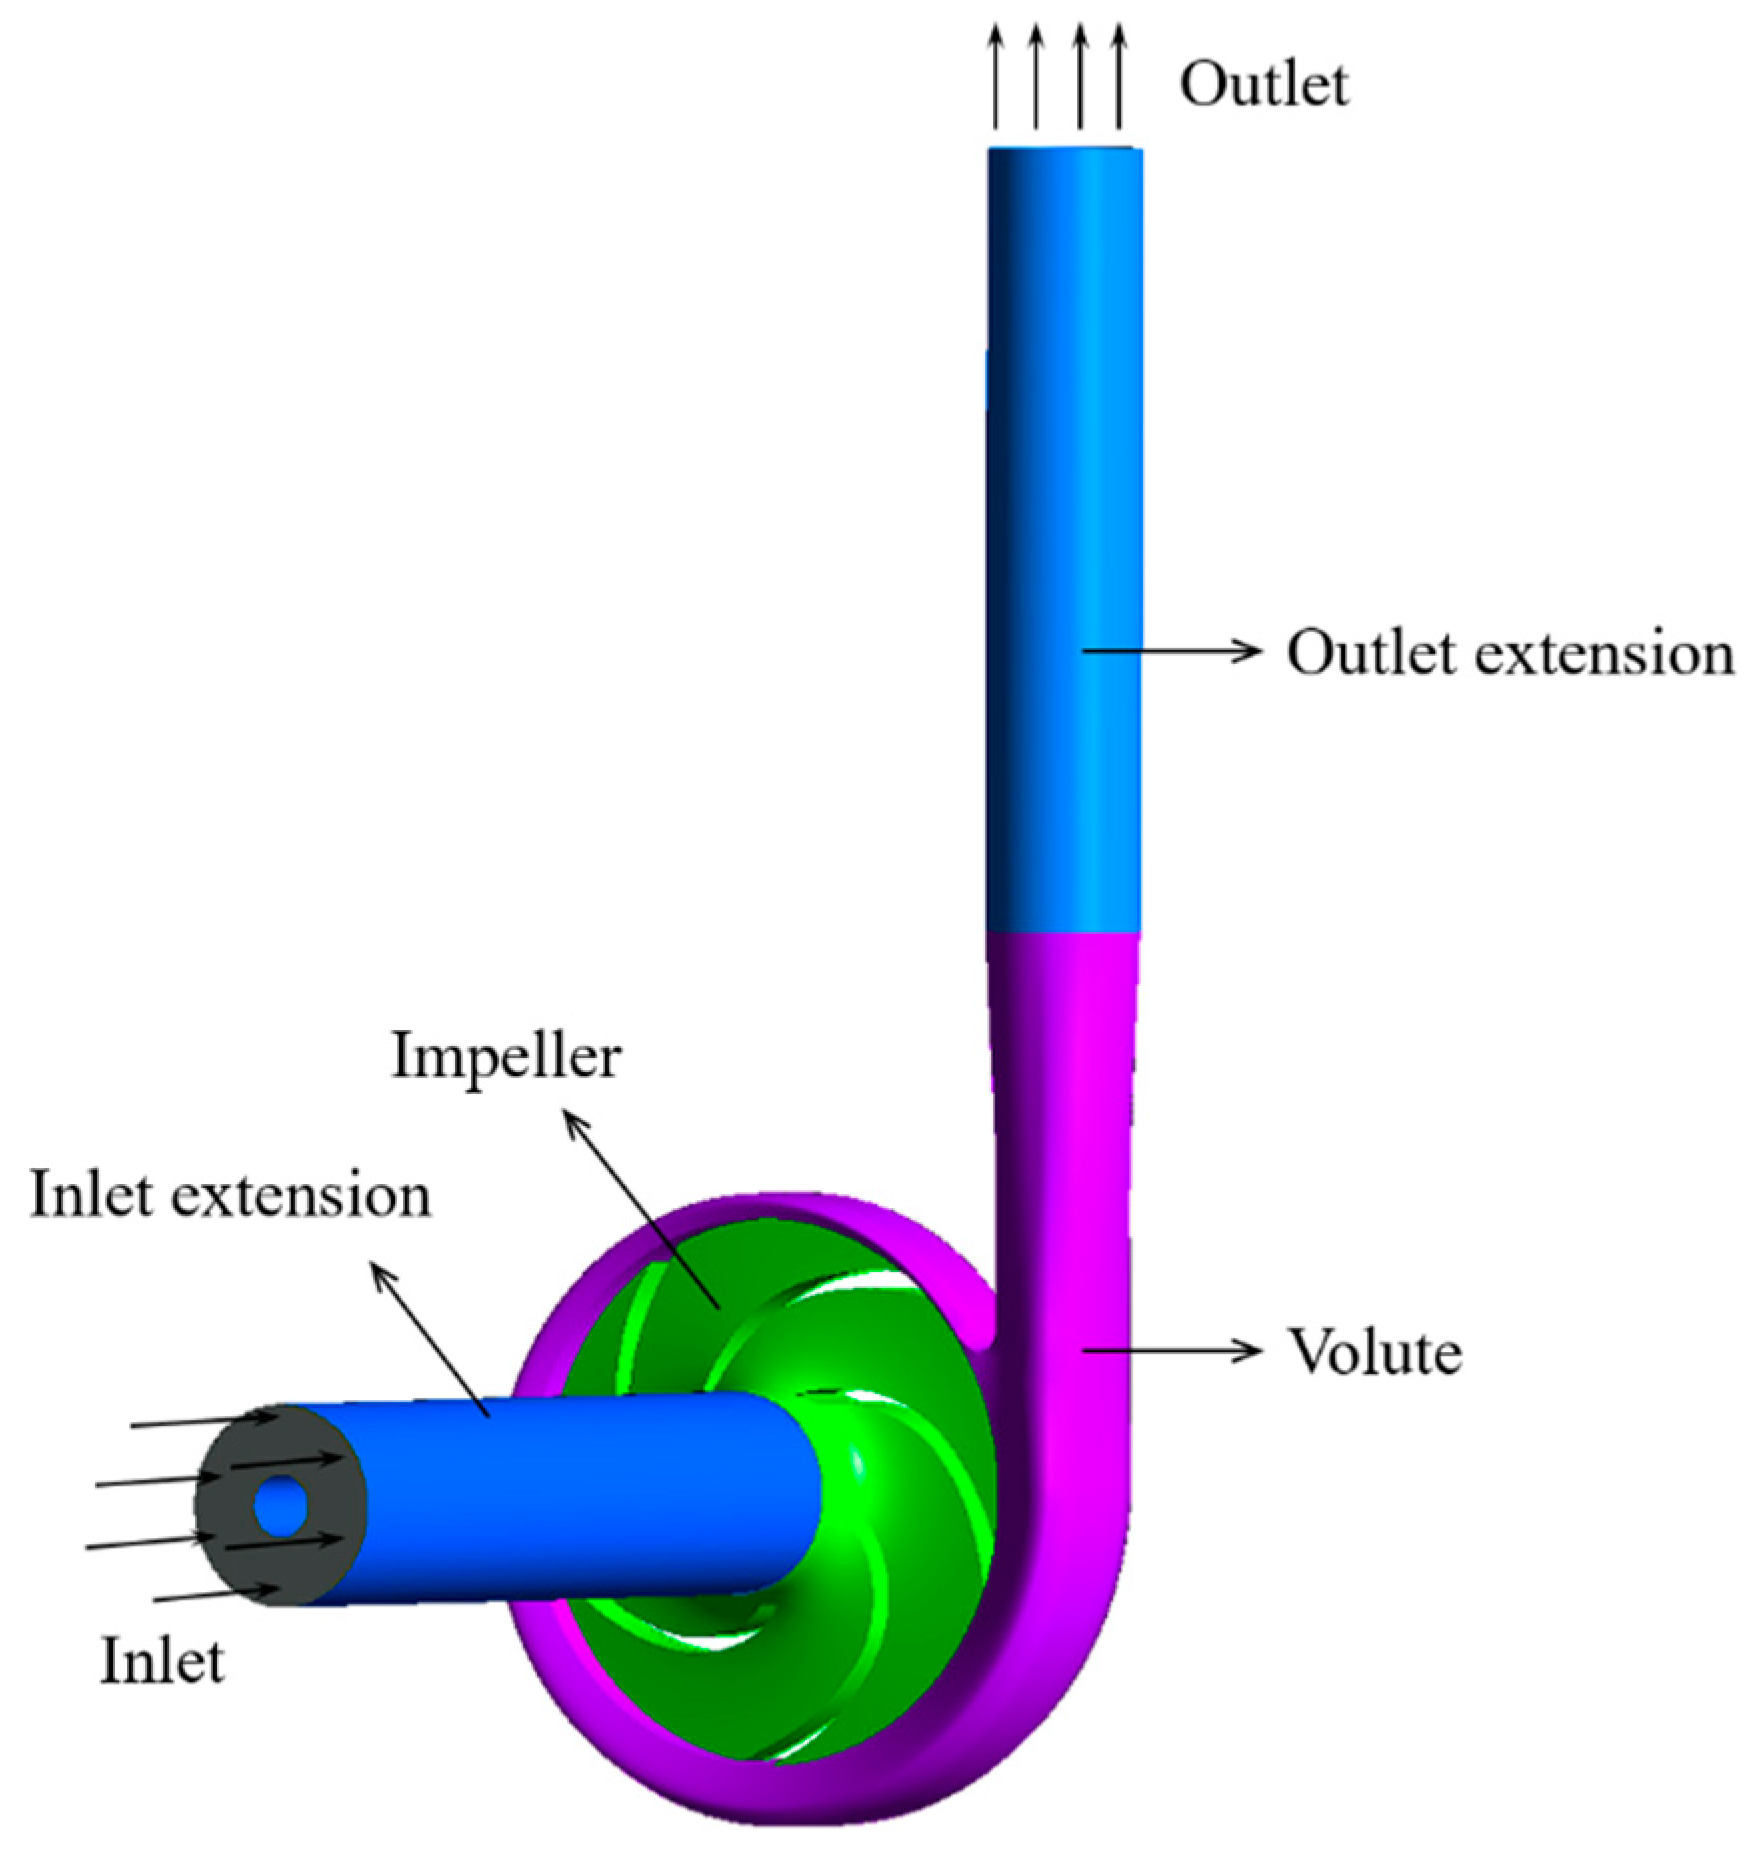
2.1. Description of Pump Model

The studied pump in this work was designed as a typical centrifugal pump, and the prototype of the pump can be referred to in [27]. The reason for reproducing their pump was to compare the predicted characteristics of the liquid-solid two-phase flows with the experimental results. The 3D geometry of the pump is presented in Figure 1, and the main parameters of the pump model are listed in Table 1. In order to simplify the geometry and save computational resources, the very small gaps between the impeller’s shroud and pump casing were not simulated. Although the erosion in these gaps (due to recirculating flow mixed with small particles) plays an important role in the pump damage, most coarse particles can barely flow into the gaps. The particle motion and erosion in the flow passages of the hydraulic parts are of primary interest to us.

2.2. Particle Modeling

Modeling of particle motion was carried out in the software EDEM, where the particle topology can be defined by assembling a number of elementary balls to approximately represent the particle configuration, as shown in Figure 2. The equivalent diameter of a non-spherical particle is determined to be equal to the diameter of a spherical particle with the same volume. Material properties of the particle can be defined in the software. According to [28], a parameter Ψ is defined to indicate the sphericity of the modeled particle. Sphericity is a measure of how close an object’s shape is to a perfect sphere. It is defined as the ratio of the surface area of a spherical particle (having the same volume as a given particle) to the surface area of the particle and is calculated as:
Ψ = π 1 3 ( 6 V p ) 2 3 A p
where Vp is the volume of the particle and Ap, the surface area of the particle. Three particle shapes are studied, and the corresponding Ψ values are 0.67, 0.84, and 1, respectively. The particle of Ψ = 0.67 is defined with relatively sharp vertices and edges, which are expected to cause the most severe surface erosion. The particle of Ψ = 0.84 has moderate vertices and edges and is more similar to the particle in the real working conditions. The particle of Ψ = 1 is a purely spherical shape and can represent an ideal situation for comparison.

2.3. Governing Equations

The CFD-DEM simulation consists of two coupled steps. The first step involves the modeling of particle motion using the DEM approach, and in the second step, the information of particle position and velocity is introduced into the CFD modeling and is coupled with the fluid simulation in the pump’s fluid zone. After that, the forces due to the fluid flow imposed on the particle are returned to the DEM modeling of particle motion. A home-made interface code was written to couple the solvers of CFD and DEM and implement the associated inter-phase interactions, such as lift force, minor forces, and turbulence-particle interactions.

2.3.1. Governing Equations of Liquid Phase

The RANS equations were used in modeling the liquid phase since they are still the most efficient model for engineering problems. The two-way coupling method is considered for the liquid-particle interaction. Therefore, the liquid volume fraction is solved in the governing equations, and the interaction between the liquid and particles were modeled as a body force in the conservation equations of momentum, which are expressed as:
t ( α f ρ f ) + x j ( α f ρ f u j ) = 0
ρ f t ( α f u i ) + ρ f x j ( α f u i u j ) = p x i + x j [ α f ( μ + μ t ) ( u i x j + u j x i ) ] + F p f + α f ρ f g
F p f = 1 V c e l l i = 1 n f p f
where ρf is the fluid density, ui is the Reynolds-averaged velocity in the i direction, p is the pressure, μ is the fluid dynamic viscosity, and μt, the turbulent viscosity. Fp–f denotes the volumetric interaction force from the particles to the fluid, which equals the opposite of the total force exerted by all the particles in the considered CFD cell divided by the cell volume Vcell. n is the number of particles in the considered CFD cell. The volume fraction αf is calculated as:
α f = 1 i = 1 n V p , i V c e l l
where Vp,i is the volume of the particle i.
The turbulence was simulated by using the RNG k-ε model. A model different from the default model in the used commercial software was defined to simulate the turbulence modulation due to the particle presence since this effect may play an important role in determining the particle motion and causing the erosion in the bend. Sk and Sε are the source terms of the turbulent kinetic energy and turbulent dissipation rate to represent the modifications in the turbulence by the particles and read [29]:
S k = 1 V k 3 π μ d p f k | v f + v f v p | ( v f + v f v p )
S ε = ρ f C ε 3 ν 2 V k f k | v f + v f v p | 2 d p
where vf and v f are the average and fluctuating fluid velocity vectors, and v p denotes the instant particle velocity vector. fk is the drag factor, or the ratio of the drag coefficient to Stokes drag, which is defined as f k = C D Re p 24 . CD is obtained from Equations (12) and (13) and ReP is calculated from Equation (26). dp is the particle diameter. C ε 3 = C ε 2 C ε p Re p 1.416 in which C ε 2 C ε 2 = 1.92 and C ε p = 0.058 [29]. The source terms are defined in the interface code between Fluent and EDEM and linked to the turbulence equations by the user-defined function in Fluent.

2.3.2. Governing Equations of Solid Phase

The equations of DEM solved in EDEM are expressed as:
m p d v p d t = F d r a g + F g + F l i f t + F p + F v m + F c + F b
I p d Ω p dt = T c + T f
where Fdrag is the drag force, Fg is the gravitational force, FLift is the lift force, Fp is the pressure gradient force, Fvm is the virtual mass force, Fc is the contact force of particle-particle/wall, and Fb is the buoyant force. Ωp is the angular velocity of a particle and I p = 0.1 m p d p 2 is the moment of inertia for a sphere. Tc is the contact torque, and Tf is the torque caused by the fluid.

2.3.3. Drag Force Model

The particle drag force was calculated using the Di Felice [30] model, where the effect of the fluid volume fraction on the drag force is considered. It is thus expressed as:
F d r a g = 1 2 ρ f C D π d p 2 4 | v f + v f v p | ( v f + v f v p ) ( α f 1 α )
α = 3.7 0.65 exp [ ( 1.5 log 10 ( Re p , α ) ) 2 2 ]
where Re p , α = ρ f d p α f | v f - v p | μ f is the particle Reynolds number considering the fluid volume fraction. The drag coefficient CD of the spherical particle was calculated as follows:
{ C D = 24 Re p , α   Re p , α 1   C D = [ 0.63 + 4.8 Re p , α 0.5 ] 2   Re p , α > 1
The drag coefficient of the non-spherical particle was calculated as follows [31]:
C D = 24 Re p , α ( 1 + b 1 Re p , α b 2 ) + b 3 Re p , α b 4 + Re p , α
b 1 = exp ( 2.3288 6.4581 Ψ + 2.4486 Ψ 2 )
b 2 = 0.0964 + 0.5565 Ψ
b 3 = exp ( 4.905 13.8944 Ψ + 18.4222 Ψ 2 10.2599 Ψ 3 )
b 4 = exp ( 1.4681 + 12.2584 Ψ 20.7322 Ψ 2 + 15.8855 Ψ 3 )
where Re p , α is the particle Reynolds number, and Ψ is the Sphericity of the particle as defined in Equation (1).

2.3.4. Lift Force Model

The most widely used model of the lift force is the Saffman and Magnus lift force, which is developed from the gas-solid two-phase flow [32,33]. However, its validation in the simulation of liquid-solid flow is argued, although it was used in some works [34]. In this work, a more recent model developed specifically for liquid-solid flow is written in the home-made interface code to model the lift force in such flow. The Loth lift force is expressed as [35]:
F l i f t = 1 8 π d p 2 ρ f C L | v f + v f v p | [ ( v f + v f v p ) × ω f | ω f | ]
The lift coefficient reads:
C L = J 12.92 π ω Re p + Ω p , e q C L , Ω
where the contained parameters are defined as follows [35]:
J = 0.3 { 1 + tanh [ 5 2 ( log 10 ω Re p + 0.191 ) ] } { 2 3 + tanh [ 6 ω Re p 1.92 ] }
C L , Ω = 1 { 0.675 + 0.15 ( 1 + tanh [ 0.28 ( Ω p 2 ) ] } tanh [ 0.18 Re p 1 / 2 ]
Ω p , e q = ω 2 ( 1 0.0075 Re ω ) ( 1 0.062 Re p 1 / 2 0.001 Re p )
ω = | ω f | d p | v f v p |
Ω p = | Ω p | d p | v f v p |
R e ω = ρ f d p 2 | ω f | μ f
Re p = ρ f d p | v f v p | μ f
where ωf is the fluid vorticity and Ωp, the particle angular velocity.

2.3.5. Models of Pressure Gradient and Virtual Mass Forces

The pressure gradient force and the virtual mass force are considered in the liquid-solid two-phase flow in that the densities of both phases are close. The virtual mass force can be calculated as:
F v m = C v m ρ f ρ p [ v p ( v f + v f ) d v p d t ]
where Cvm is the virtual mass force coefficient, which is equal to 0.5 as usual.
The pressure gradient force was also included in the model and is obtained using the following expression:
F p = V p p
The two forces were defined in the interface code in order to facilitate the on/off switch in the simulations.

2.3.6. Particle-Particle Collision Model

The particle-particle collision was modeled directly using the default model in the software EDEM. The contact force Fc includes both the normal and tangential components, which were obtained through the linear spring-dashpot model proposed by Cundall and Strack [36].
F c = F c n , i j + F c t , i j
F c n , i j = k n , i j δ n , i j n i γ n , i j ( v r n i ) n i
F c t , i j = k t , i j δ t , i j t i γ t , i j [ ( v r t i ) t i + ( ω i × r i ω j × r j ) ]
where n and t stand for the normal and tangential unit vectors, respectively; k n , i j and k t , i j are the normal and tangential elastic stiffness; δ n , i j , δ t , i j are the displacements of colliding particles, and γ n , i j , γ t , i j are the damping coefficients. v r = v i v j is the relative velocity vector of particle i and particle j; r is the vector from the mass center to the contacting point. Notice that this model can equally be applied to describe the interaction between a particle and a wall. The equations for calculating the k, δ, and γ can be found in the literature [17]. It is worth mentioning that the tangential contact force can also be calculated by the Coulomb friction model when sliding friction occurs:
F c t , i j = μ s | F c n , i j | t i
where μs is the sliding friction coefficient.

2.3.7. Turbulence-Particle Interaction Model

The influence of turbulence on the particle motion can be simulated by using the discrete random walk (DRW) model [37]. The turbulent velocity fluctuation obeys the Gaussian distribution and is obtained via the following relations:
{ u = ξ i u 2 ¯ v = ξ j v 2 ¯ w = ξ k w 2 ¯
where ξ i , ξ j , ξ k are random numbers obeying the Gaussian distribution. Due to the simplicity of the RANS model, the turbulence was assumed isotropic, and the root mean square (RMS) of the fluctuating velocity was calculated as:
u 2 ¯ = v 2 ¯ = w 2 ¯ = 2 k 3
with k being the turbulence kinetic energy, obtained using the RNG k-ε model. The randomly fluctuating velocity was then used as an input into the expression for the fluid velocity, and the turbulence effect was also considered when calculating the particle motion. The particle-turbulence interaction is two-way coupling using Equations (6), (7), and (33) and yields more accurate results.

2.4. Erosion Model

Zhang’s model [19] obtained from controlled experimental tests for solid particles carried in a liquid flow was used here. The correlation proposed by Zhang et al. is:
E R = C ( B H ) 0.59 F s V p n F ( θ )
F ( θ ) = i = 1 5 A i θ i
where ER is the erosion ratio, defined as the amount of mass lost by the wall material due to particle impacts divided by the mass of the particles impacting; BH is the Brinell hardness of the wall material; F s is the particle shape coefficient, F s = 1.0 for sharp (Ψ = 0.67), 0.53 for semi-rounded (Ψ = 0.84), or 0.2 for fully rounded (Ψ = 1) sand particles; V p is the particle impact speed in m/s; θ is the impact angle in radians; n = 2.41 and C = 2.17 × 10⁻⁷ are empirical constants. Values of A i for i = 1–5 are 5.40, −10.11, 10.93, −6.33, 1.42, respectively.

2.5. Boundary Conditions and Model Setups

The commercial CFD software ANSYS Fluent was used for liquid modeling, and the software EDEM was coupled with ANSYS Fluent. The RNG k-ε turbulence model was selected for modeling the turbulence in the bend and pump because of its correction for swirling flow in the model [38]. The mesh in the impeller region was set to rotate with the angular velocity of the pump revolution speed. The flow information was exchanged on the interface defined on the meshes of the static and rotating zones. A mass flow rate of 4.17 kg/s (Qd = 15 m3/h) was defined at the inlet of the pump model to simulate the nominal flow rate, and the outlet is set as free outflow because of the long extended pipe at the pump outlet. The turbulence parameters at the inlet can be defined as 5% for the turbulent intensity, and the hydraulic diameter is 0.065 m. A straight pipe with 8D length was created in front of the pump inlet to allow a fully developed inflow. The SIMPLEC algorithm was chosen to couple the velocity and pressure terms, and the second-order upwind scheme was employed in the discretizations of pressure, momentum, turbulent kinetic energy, and specific dissipation rate.
In EDEM, all surfaces were defined as stainless steel, of which the Poisson’s ratio is 0.3, Young’s modulus is 2 × 10¹¹ Pa, and the density is 8000 kg/m3. For the particle-particle collision, the coefficient of restitution is 0.95, the coefficient of static friction is 0.004, and the coefficient of rolling friction is 0.5 [34]. For the particle-wall collision, the coefficient of restitution is 0.74, the coefficient of static friction is 0.2, and the coefficient of rolling friction is 0.3 [34]. Since the impeller rotates at high speed, the contact model chosen in the simulation was the Hertz-Mindlin (no slip). The particles are uniformly introduced in the extended pipe from the pump inlet and removed when they leave out the CFD zone. Depending on the simulated particle diameter or particle volume (for non-spherical particles), the equivalent numbers of particles per second are defined in the zone of particle creation in order to obtain the simulated particle volume fractions. The model of erosion prediction was plugged in the EDEM through the user-defined program for specific purposes. A home-made interface code was developed to couple the calculations between the two tools. Except for the drag force, the various minor forces, i.e., Loth lift force, pressure gradient force, and virtual mass force, were all defined in the code to calculate the particle motion. The opposite force of the total force acted on each particle was summed through all of the particles present in the same CFD cell, and the summing force was added into the momentum equation of the fluid phase as the source term. In addition, the influence of the turbulence on the particle motion was also considered by decomposing the fluid velocity into the RANS-based mean velocity from the results of the CFD solver and the fluctuating velocity sampled by the DRW model. At the same time, the influence of particles on fluid turbulence was also considered by adding appropriate source terms as defined in Equations (6) and (7) in the transport equations of turbulence.
Transient simulation is performed in both Fluent and EDEM. The time step for the liquid modeling was 1 × 10⁻⁴ s. The time step in EDEM should be defined as 20–40% of the Rayleigh time calculated in EDEM. Therefore, the time step in EDEM was equal to 1 × 10⁻⁵ s. The total simulation time was 1.33 s, and the impeller accomplished 20 revolutions. The default criterion was set for the simulation convergence in each time step, i.e., 10−4 for mass, momentum, and turbulent parameters, and the maximum iteration number of each time step was 40. Each simulation takes approximately 100 h with 6 cores of 2.1 GHz.

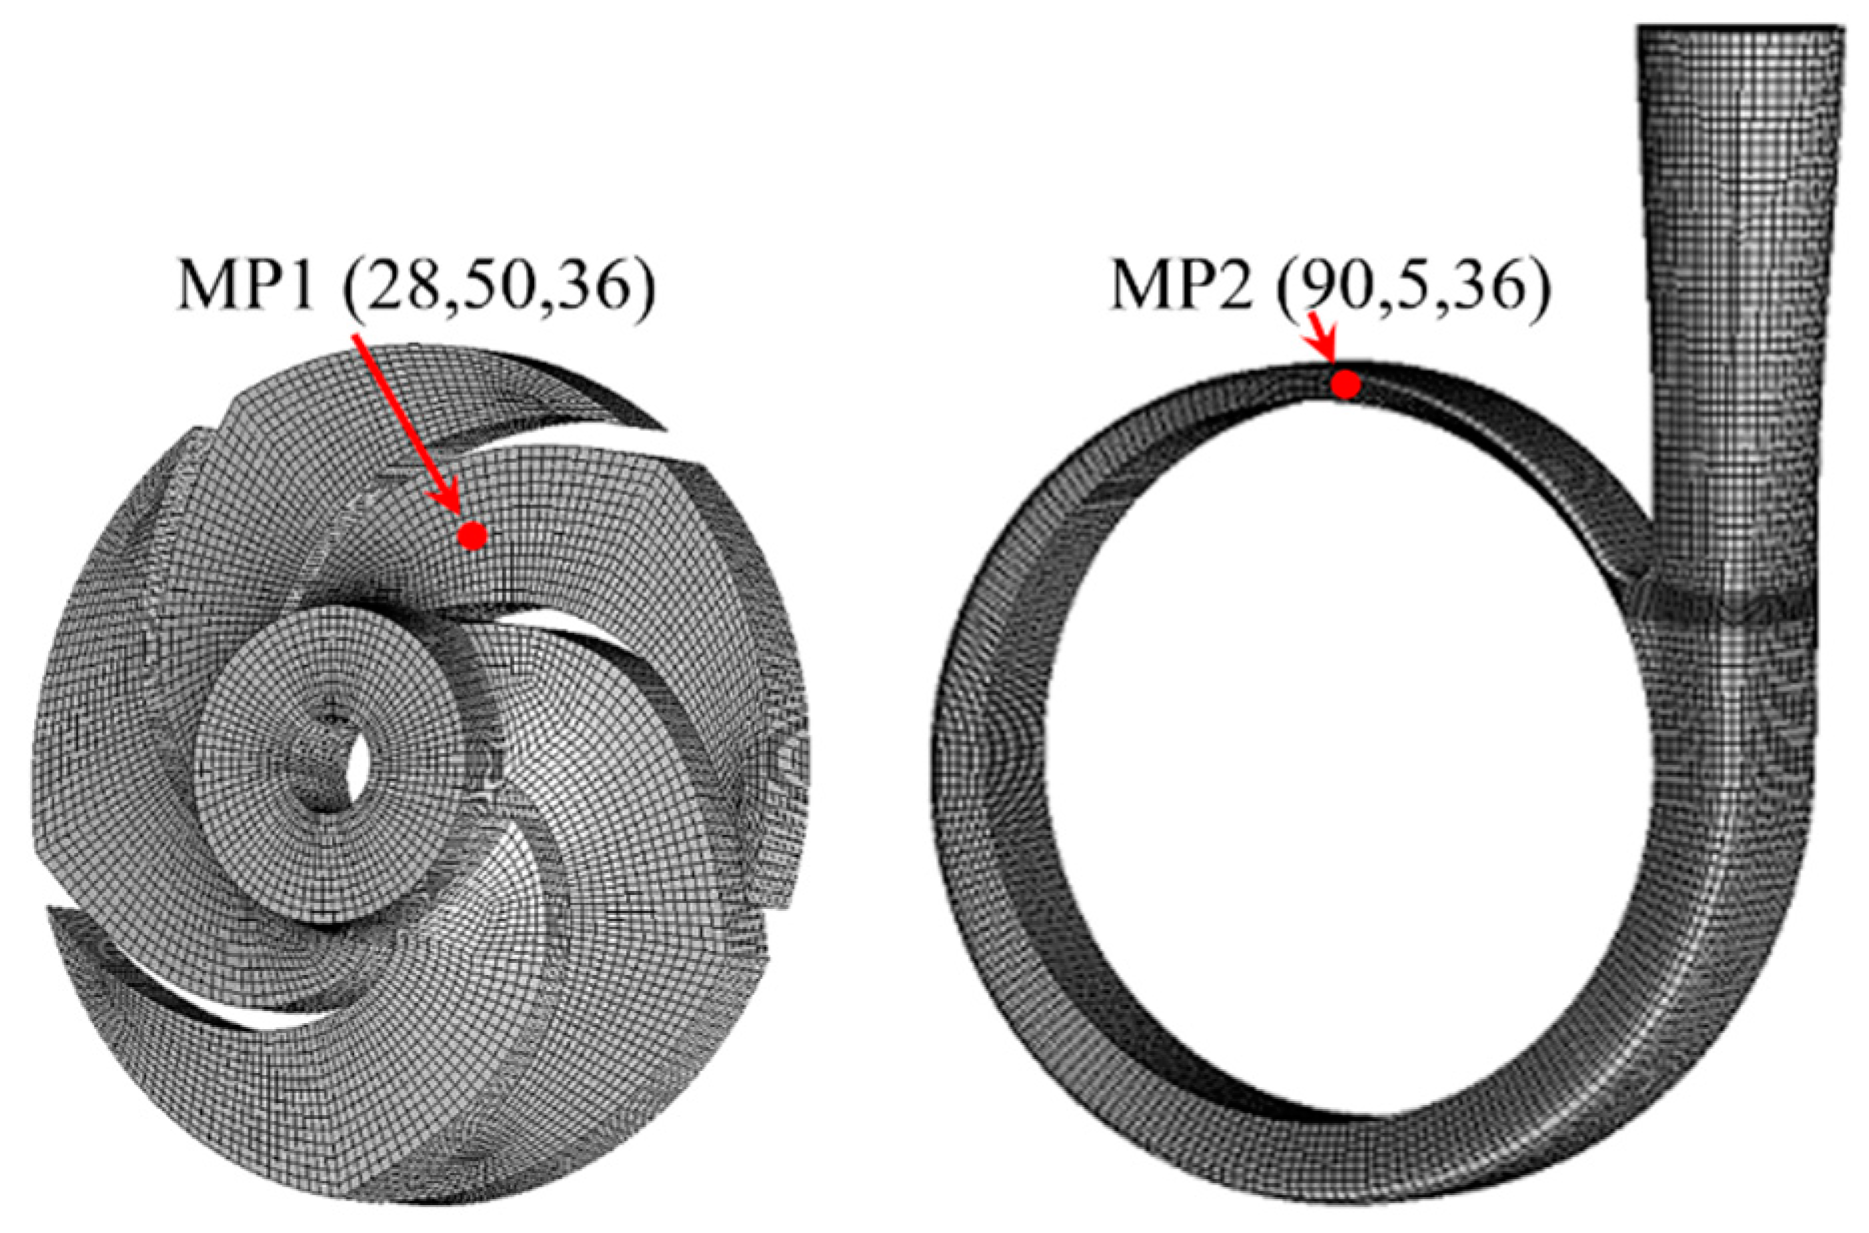
2.6. Mesh Verification

Three meshes with different element numbers were calculated, and several parameters at the monitored points (MPs) were compared. The results are all presented in Table 2. It is noticed that the discrepancy of all compared parameters is relatively large between mesh #1 and mesh #2, and this discrepancy became marginal between mesh #2 and mesh #3. Therefore, mesh #2 with 1.3 million elements was used in the following study. The chosen mesh is shown in Figure 3.

3. Model Validation

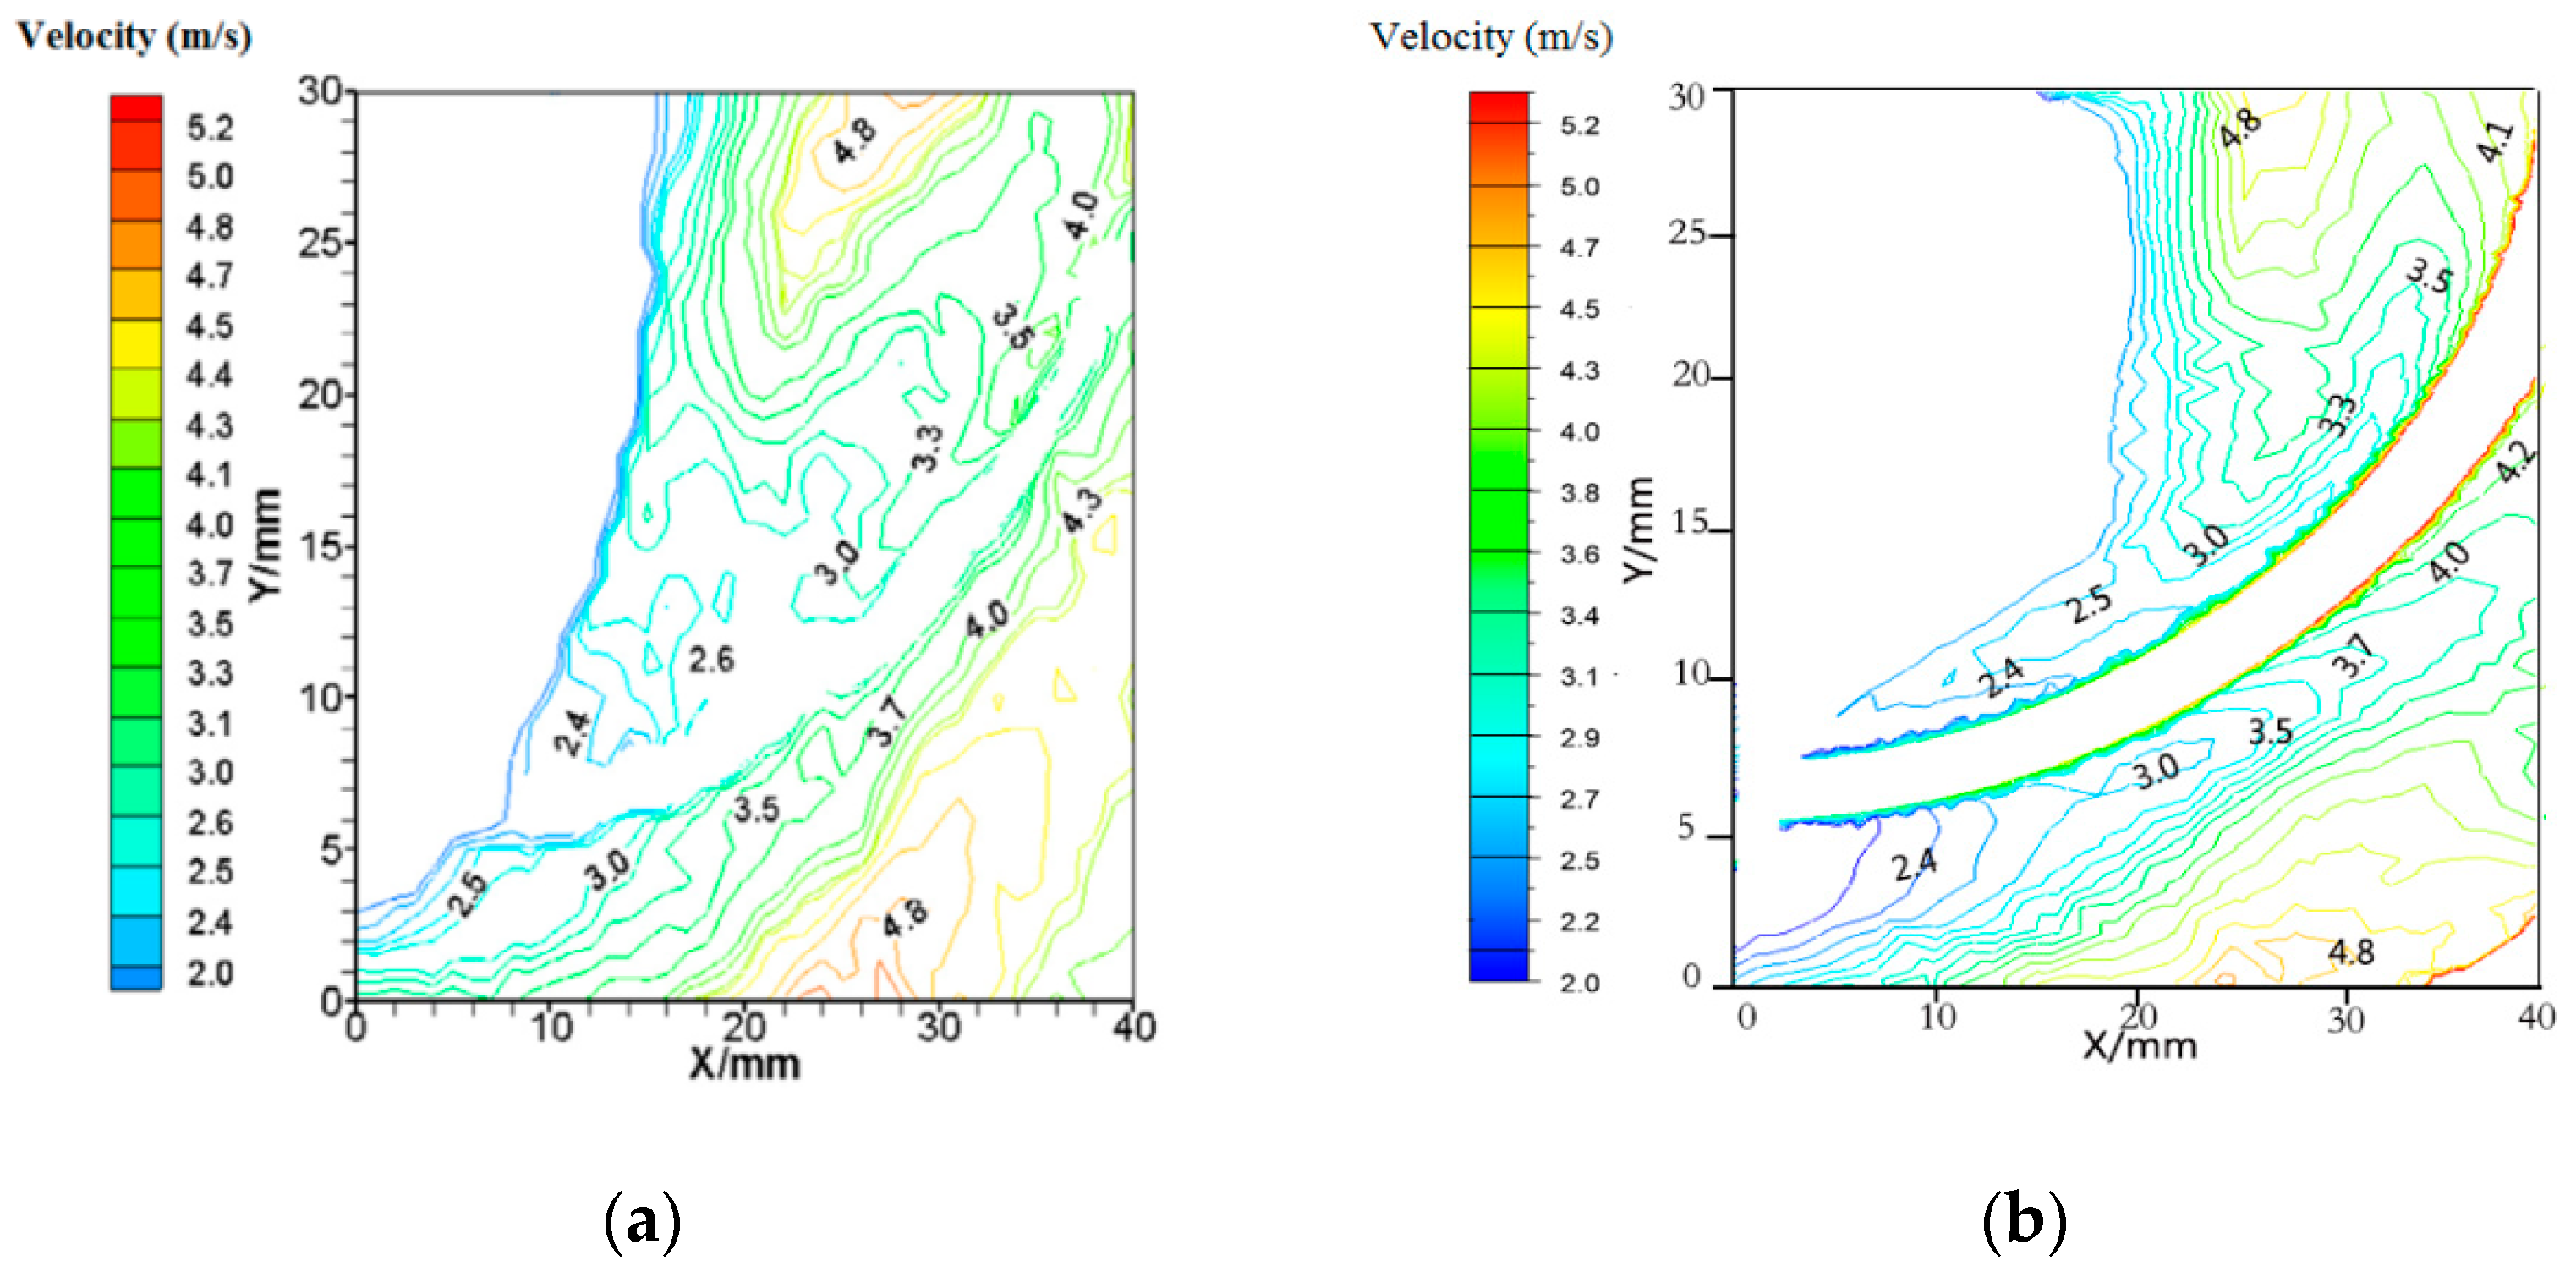
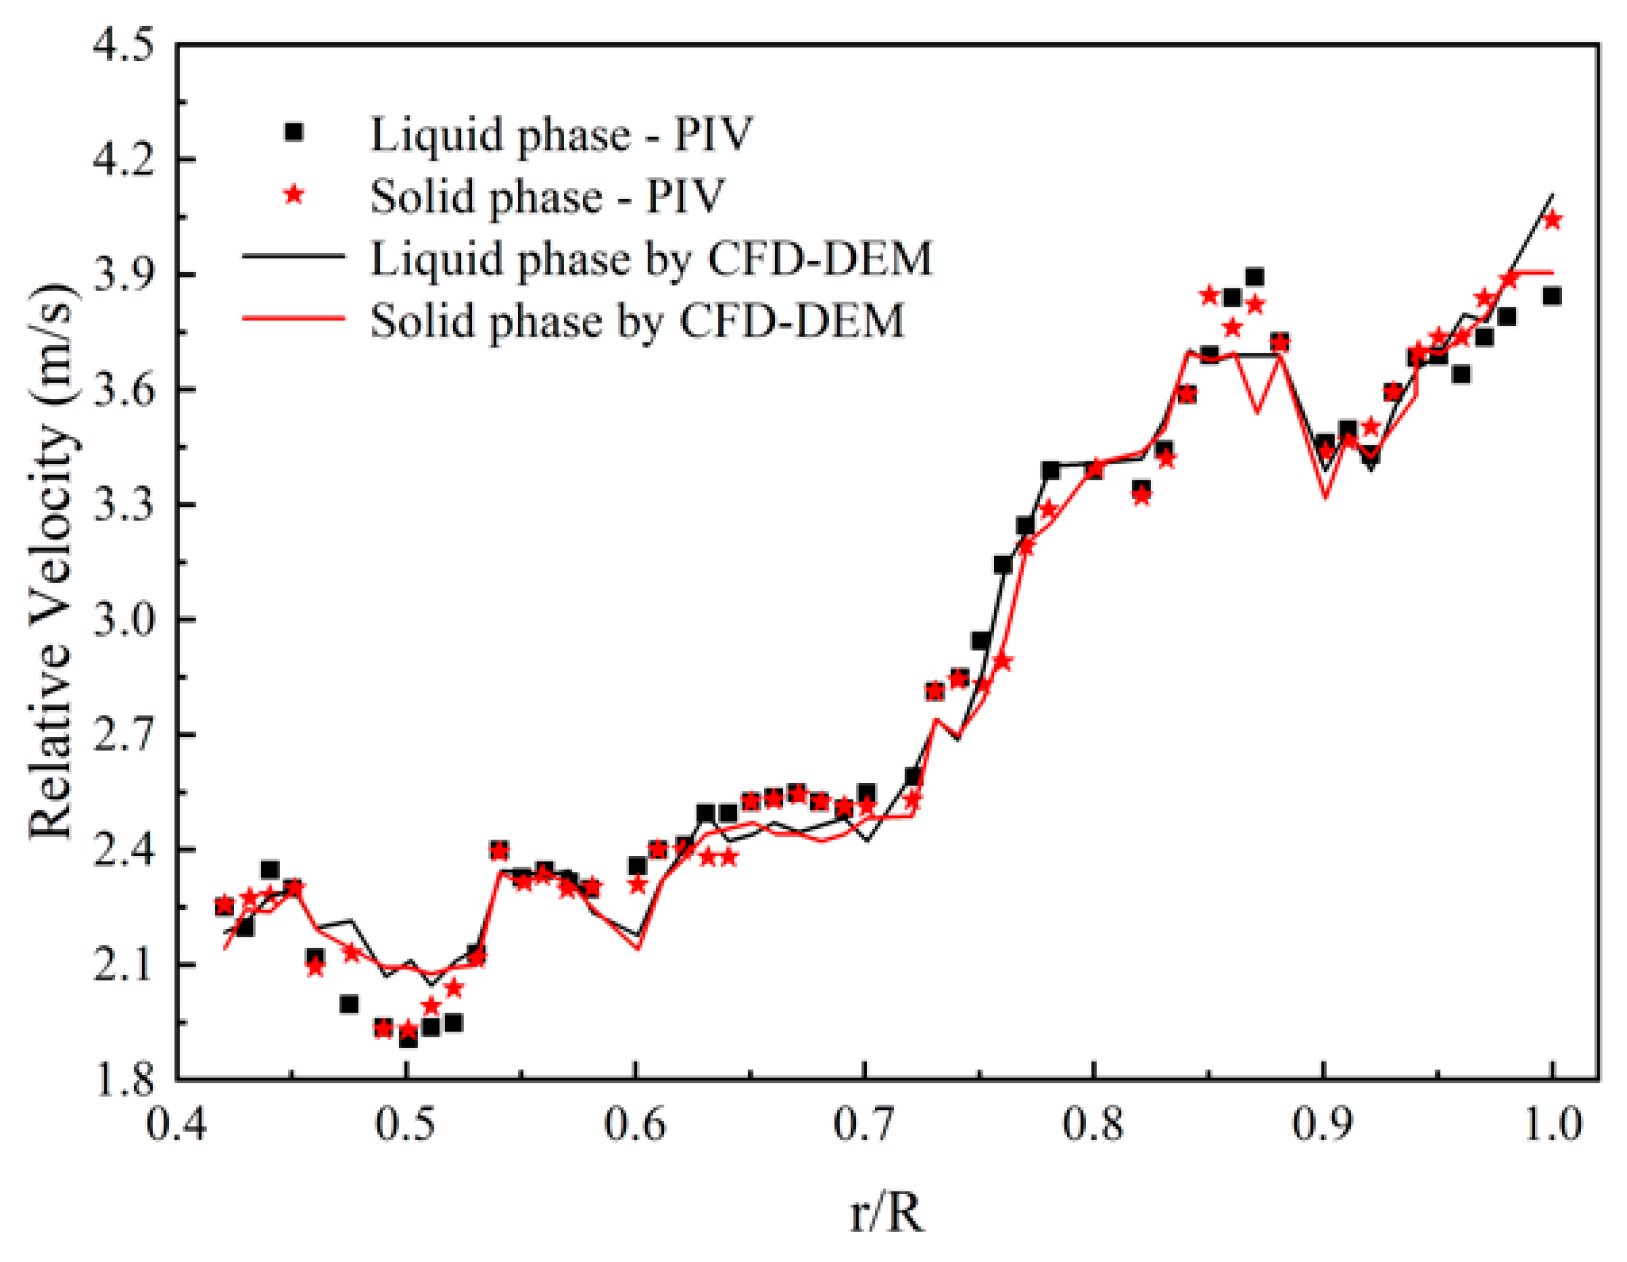
3.1. Validation of Liquid-Solid Two-Phase Flow in the Pump

The accuracy of the CFD-DEM model for predicting particle motion in the pump, especially in the rotating region of the pump, should be verified with experimentation. Shi et al. [27] proposed a measuring method based on PIV and successfully measured the two-phase velocity fields of a water-glass bead mixture and a water-rapeseed mixture in a centrifugal pump. Their results were used as a reference for the quantitative verification of the particle motion in the pump predicted by the CFD-DEM model in this work. The centrifugal pump model is reproduced in a CFD model, as shown in Figure 1. A straight pipe with 8D length was added at the inlet of the impeller for fully developing the mixture of fluid and particles. To be consistent with the experimental parameters, the mass flow rate at the inlet was 4.17 kg/s, and the input particle number was 3,184,713 per second, which corresponds to the 500 μm particles with 5% volume fraction. The impeller speed was 900 r/min, and free outflow was defined at the model outlet. The particle density was 2500 kg/m3, and the Poisson’s ratio and shear modulus of the particles were 0.4 and 1.3 × 10⁸ Pa, respectively. A Hertz-Mindlin (no-slip) model for the collisions of particle-particle and particle-wall was used, and the time step in EDEM was set as 1 × 10⁻⁵ s. The simulation was performed for 1.33 s, corresponding to 20 revolutions.
Figure 4a,b shows the contours of absolute water velocity in the zone of the PIV camera between the experimental and simulation results. The visualized plane is located in the middle of the blade span. The fluid was clean water. Figure 4b shows the velocity field on both sides of the blade when the impeller was turned at the same position as the PIV shoot. It demonstrates that the CFD result is consistent with the PIV result. Less than 0.1 m/s difference was found at the compared positions. Figure 5 shows the fluid and particle velocities in the vicinity of the pressure side of a blade. The glass beads were 500 μm in diameter and 5% in volume fraction. The scattered symbols show the PIV measured velocities of the two phases, while the simulation results are represented in solid lines. It clearly illustrates that the simulation results are in good agreement with the experimental results, and the tendency of the velocity variations of the two phases along the blade length was well captured by the CFD-DEM model.

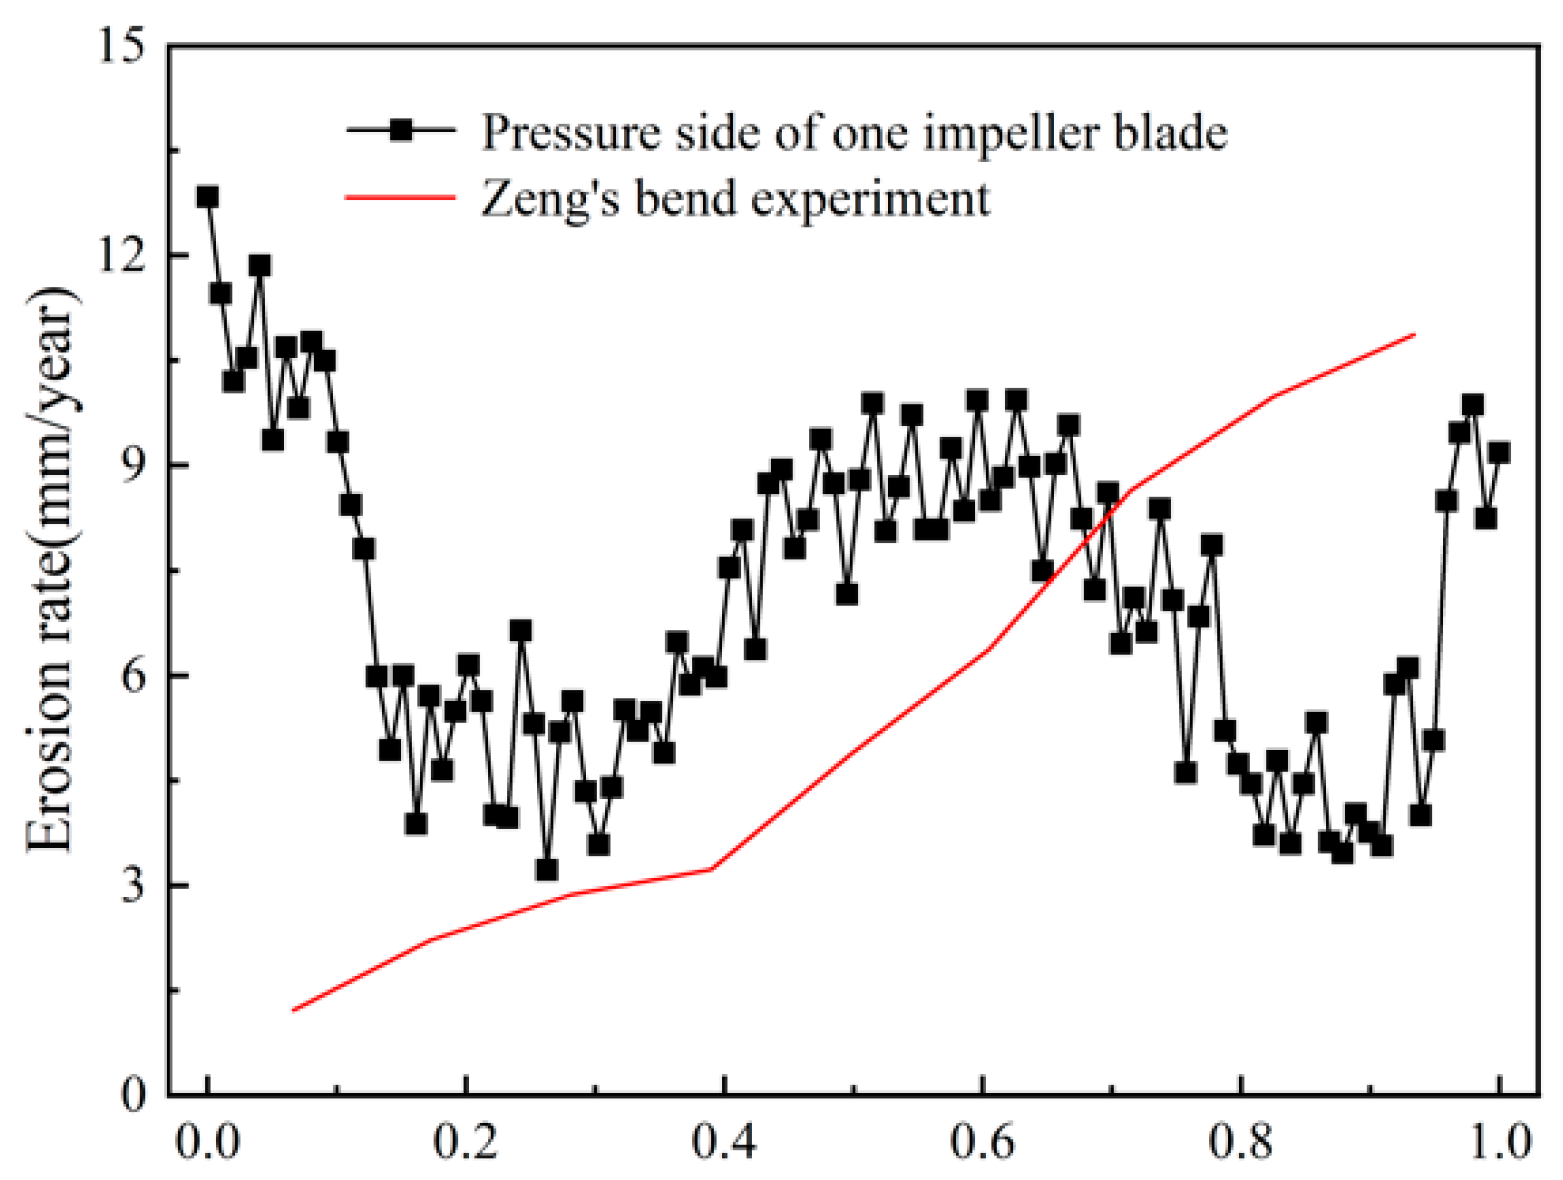
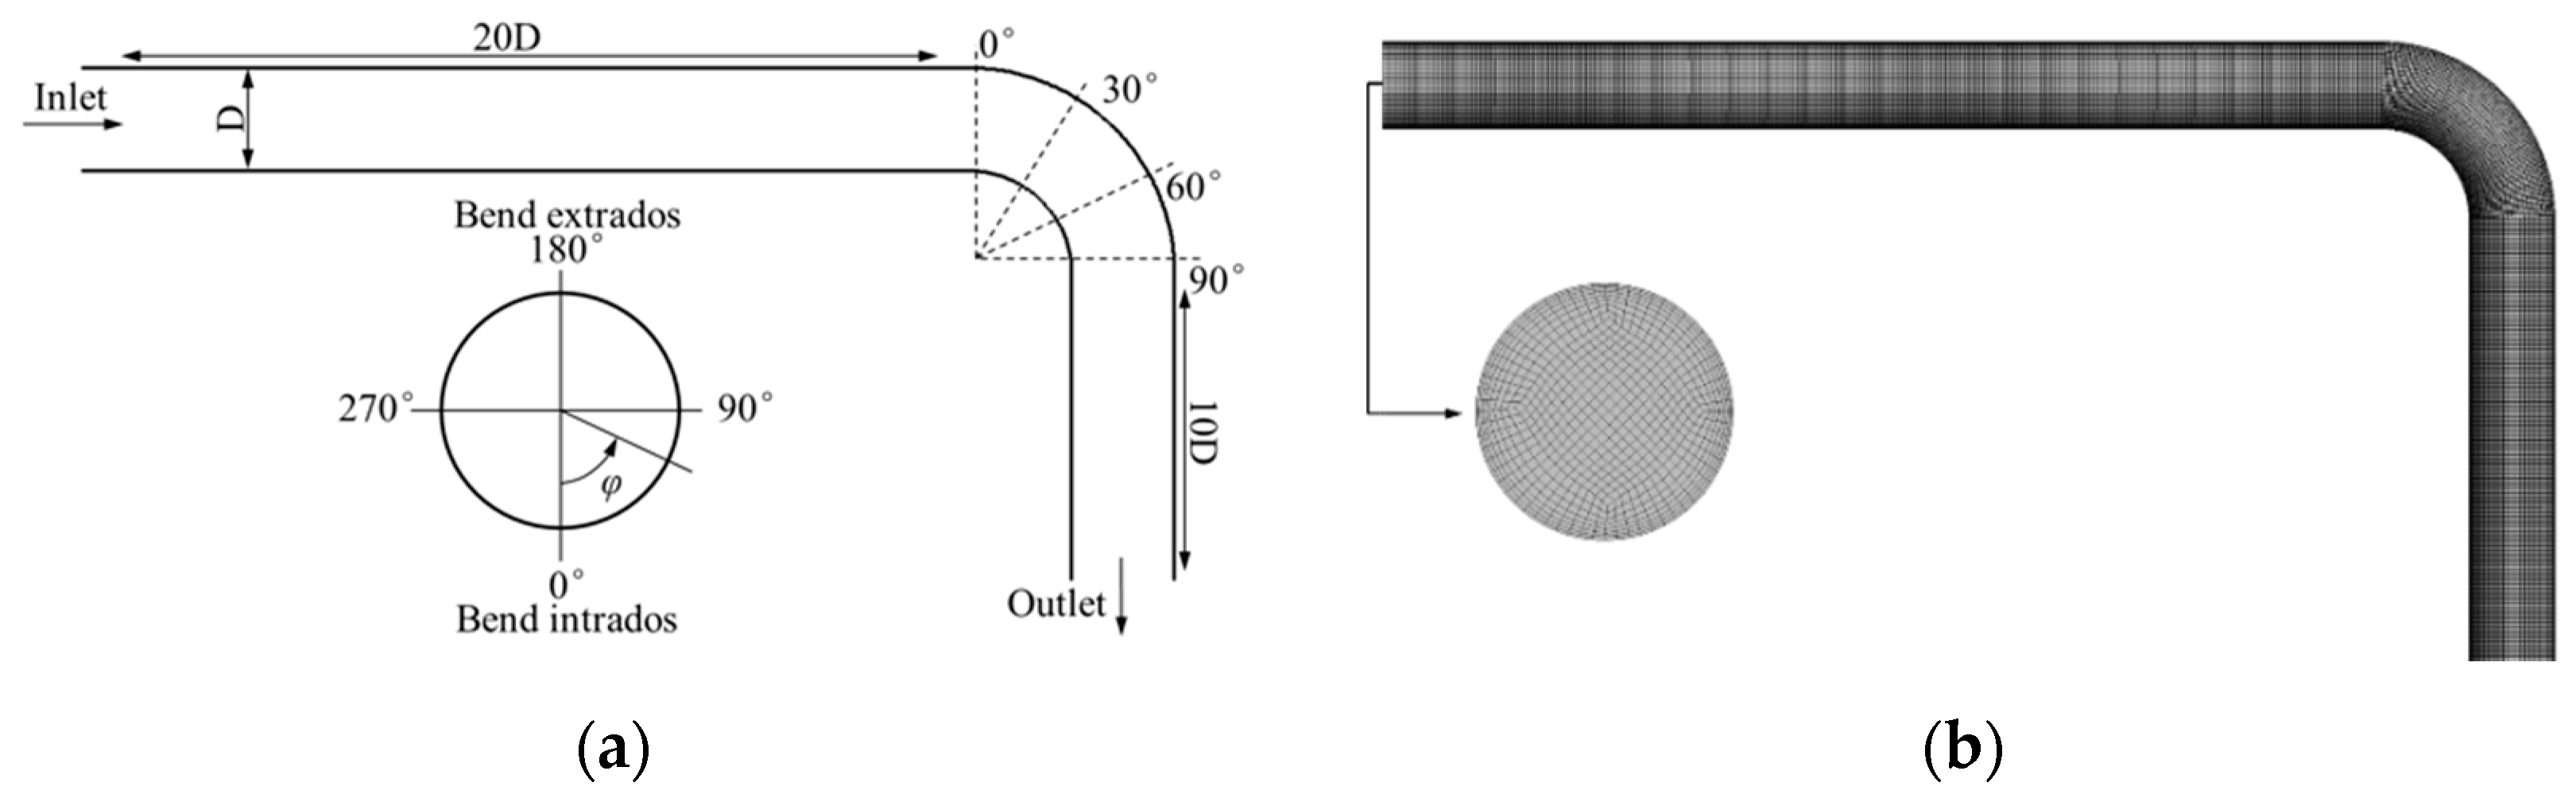
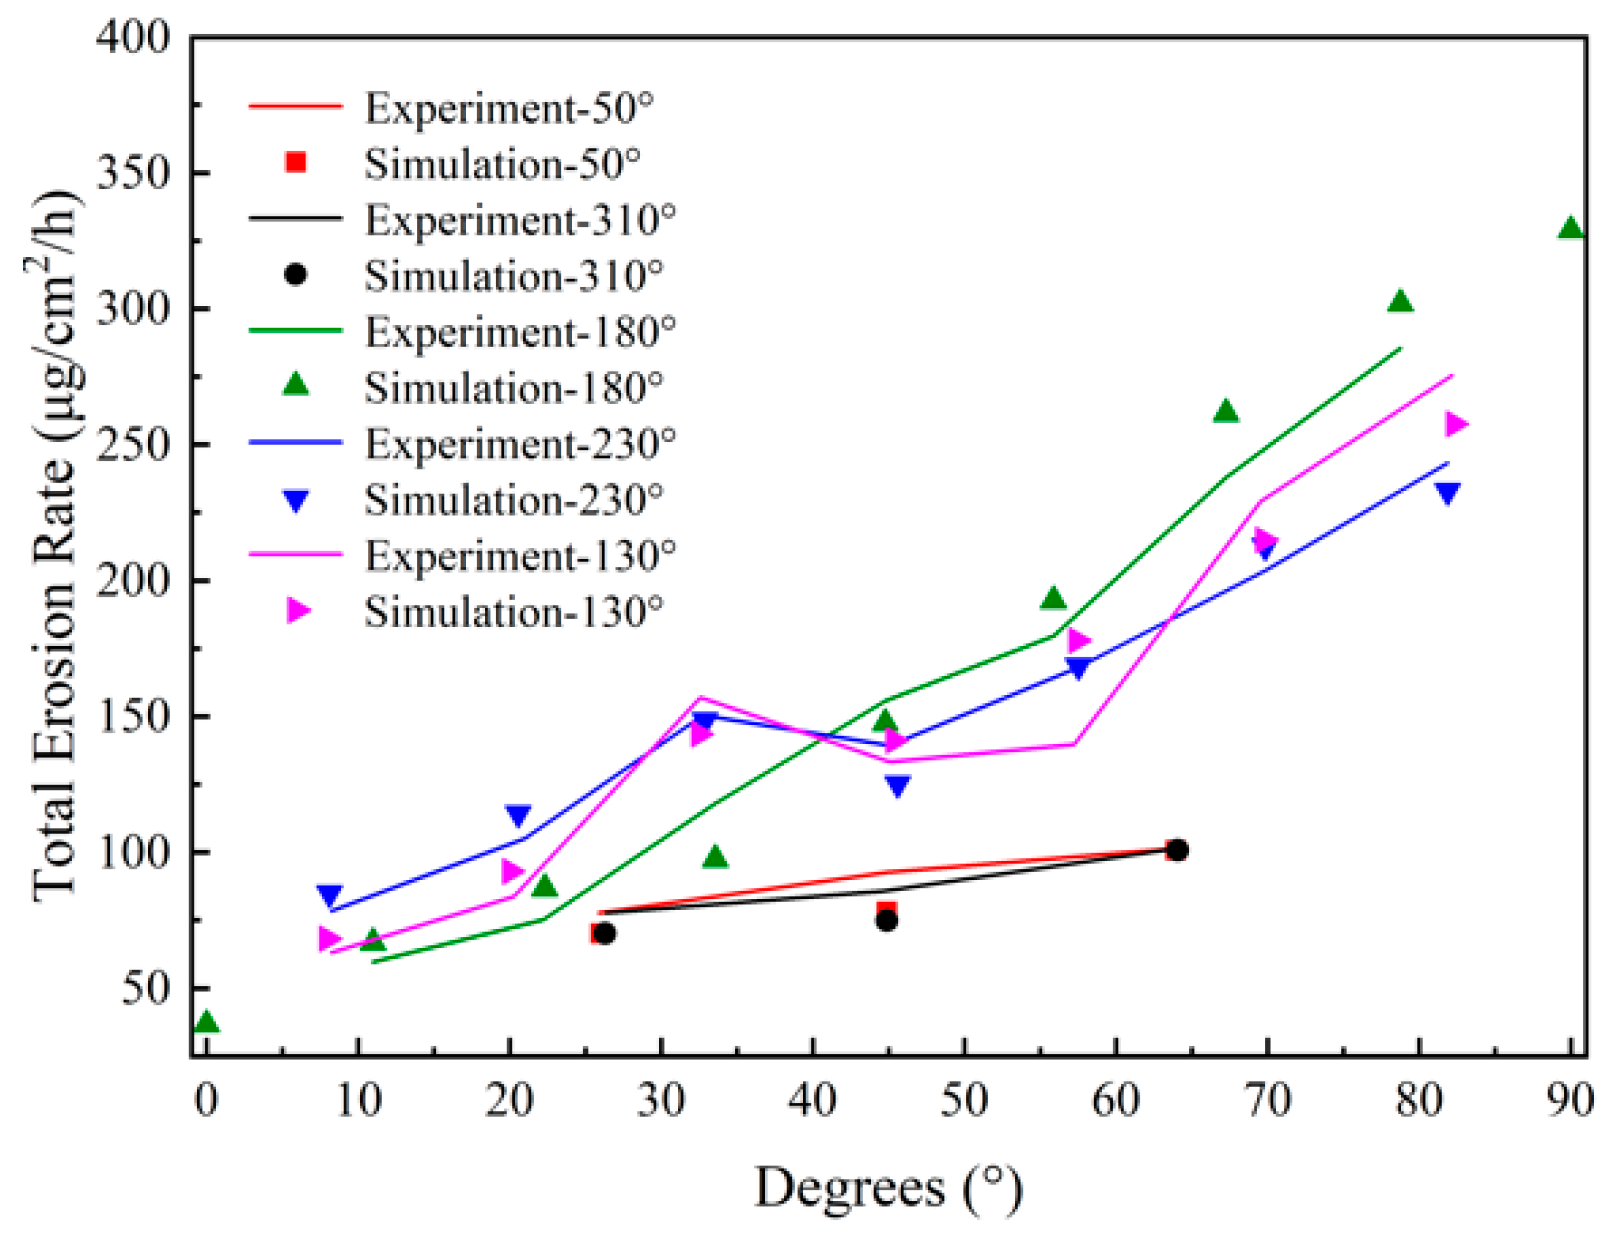
3.2. Validation of the Erosion Prediction in a 90° Bend

Erosion in a 90° bend was experimentally studied by Zeng et al. [21]. The internal diameter of the bend was D = 50 mm, and the ratio of bend radius to its diameter was 1.5. The conveying particle concentration was 1.2 wt% (and approximately 0.5% in volume fraction), and the particle size was within 400–500 μm. The simulated bend and mesh are shown in Figure 6a,b. A horizontal pipe of 20 D length was added in front of the bend. The downstream vertical pipe was 10 D in length, and constant pressure was defined as the boundary condition at the outlet. The developed numerical model was applied to simulate the erosion process in the bend by using the spherical particles with a 450 μm diameter and 0.5% in concentration. The fluid velocity was set as 4 m/s at the inlet. In this case, the RNG k-ε turbulence model is employed since a strong secondary flow occurs in the bend. The Hertz-Mindlin (no-slip) contact model was chosen in the particle solver, and the erosion model was defined in the module of the particle-wall contact model using the user-defined programs for specific purposes. The parameters employed in the simulation are summarized in Table 3.
Figure 7 shows the predicted erosion rates along the curves at different circumferential positions, as depicted in Figure 6a. The curve with the azimuthal angle of 180° corresponds to the extrados of the bend. The simulated erosion rates are compared with Zeng’s experiment. It is clearly demonstrated that the E/CRC’s model predicted the erosion rates accurately. The E/CRC erosion model is therefore employed in the following simulations.

3.3. Validation of the Erosion Prediction on the Hydraulic Components of Pump

Zhang’s erosion model was proved to predict a reasonable erosion rate in the bend. However, there is a lack of experimental data for the erosion on hydraulic parts of pumps in complex flow conditions. Fortunately, the studied pump was operated under circumstances very similar to that in Zeng’s bend experiment: the particle diameter was 500 μm, the particle volume fraction was 0.5%, and the average fluid velocity in the impeller was approximately 4 m/s. The predicted erosion rate on the hydraulic parts of the pump was compared with that in the bend. The computational domain and boundary condition settings of the pump model were the same as those described in Section 2.5. The simulated particles are of 500 μm and 0.5% volume fraction. The flow rate was 15 m3/h, at which the average fluid velocity in each channel of the pump impeller is approximately 4 m/s.
The predicted erosion rate is presented in the unit of mm/y. Figure 8 shows the annual erosion rates along the pressure side of one blade of the pump impeller and the extrados of the bend in Zeng’s experiment. The X-axis indicates the non-dimensional position on both entities. The full length of the blade and bend extrados is represented by 1.0. It was seen that the predicted erosion rate on the impeller blade is in the same order of magnitude as the experimental value under similar particle and hydrodynamic conditions. The severely erosive areas were located near the inlet and outlet of the blade, as well as the middle region. The maximum erosion rate was very close to that in the bend erosion. The results validate the numerical model in predicting the erosion on the hydraulic parts of the pump.

4. Results and Discussion

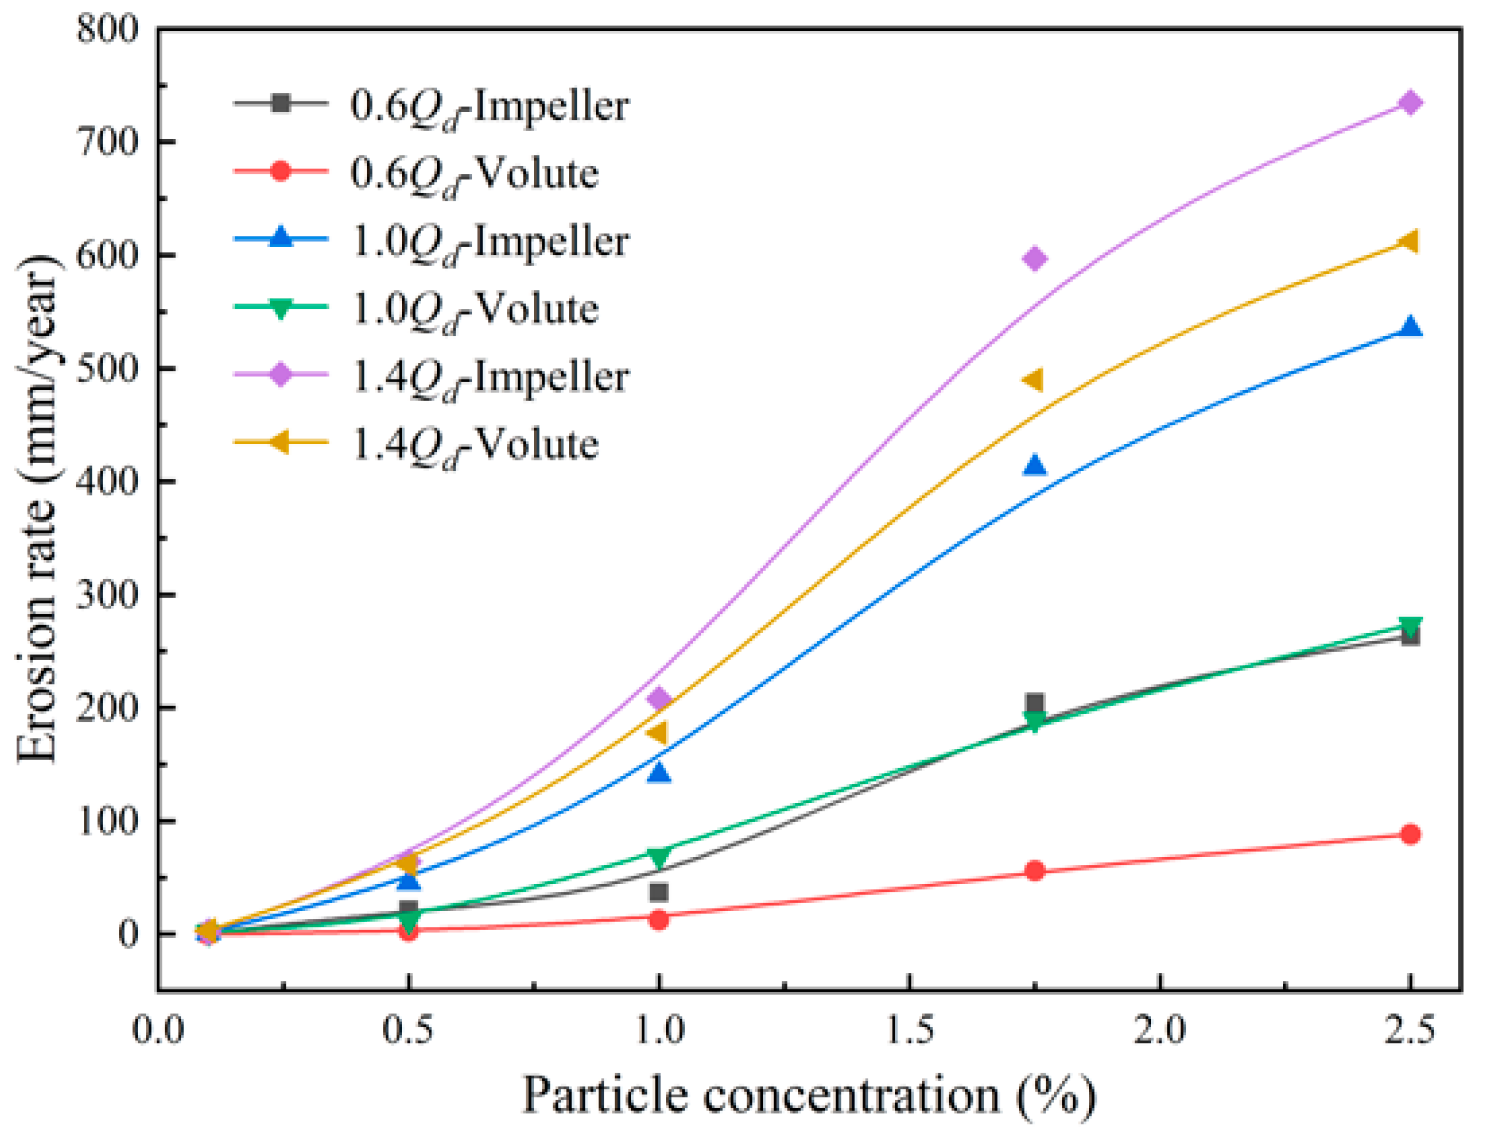
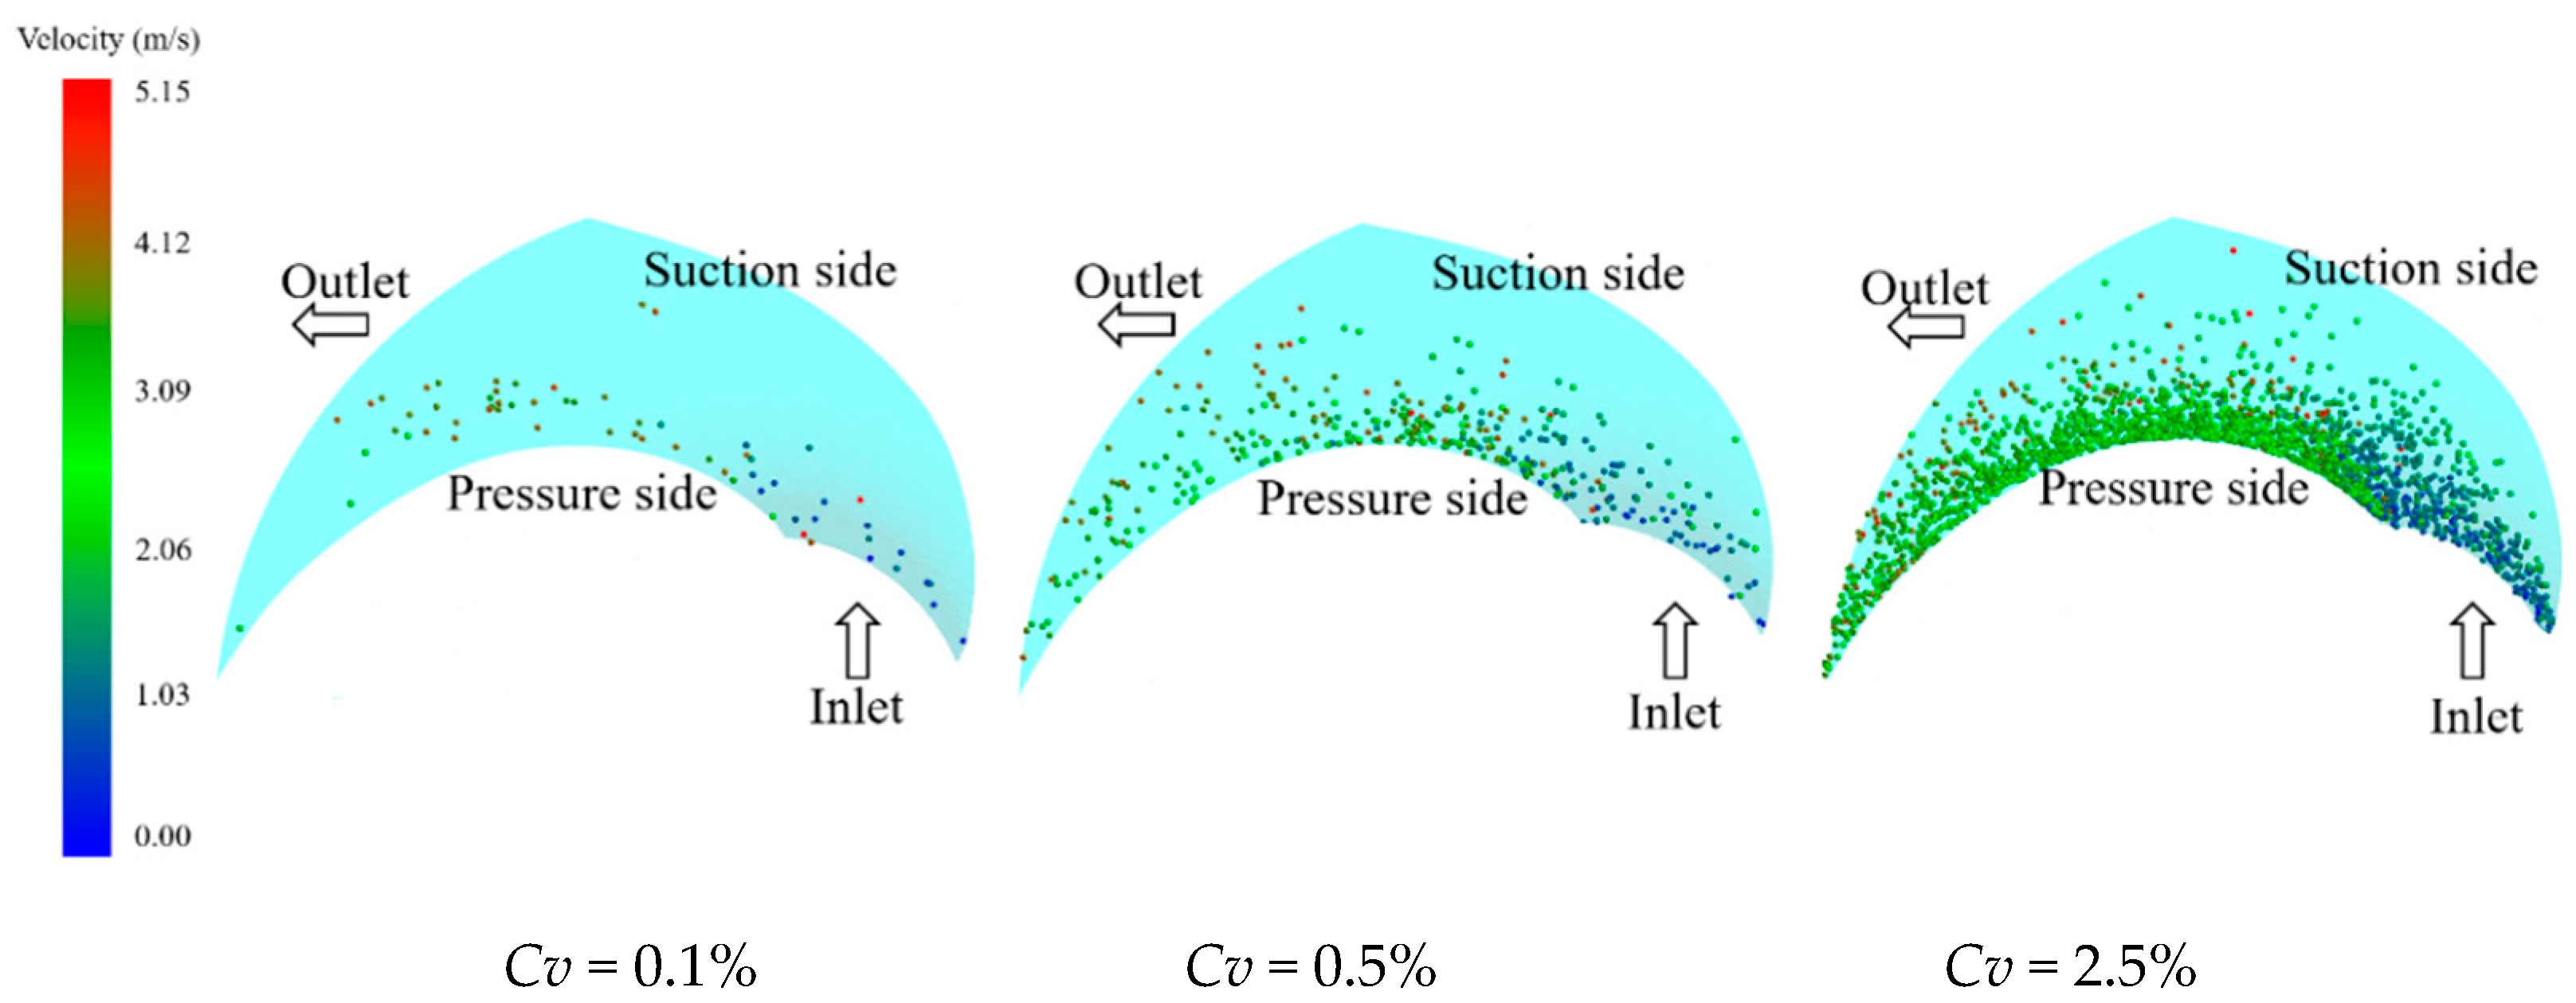
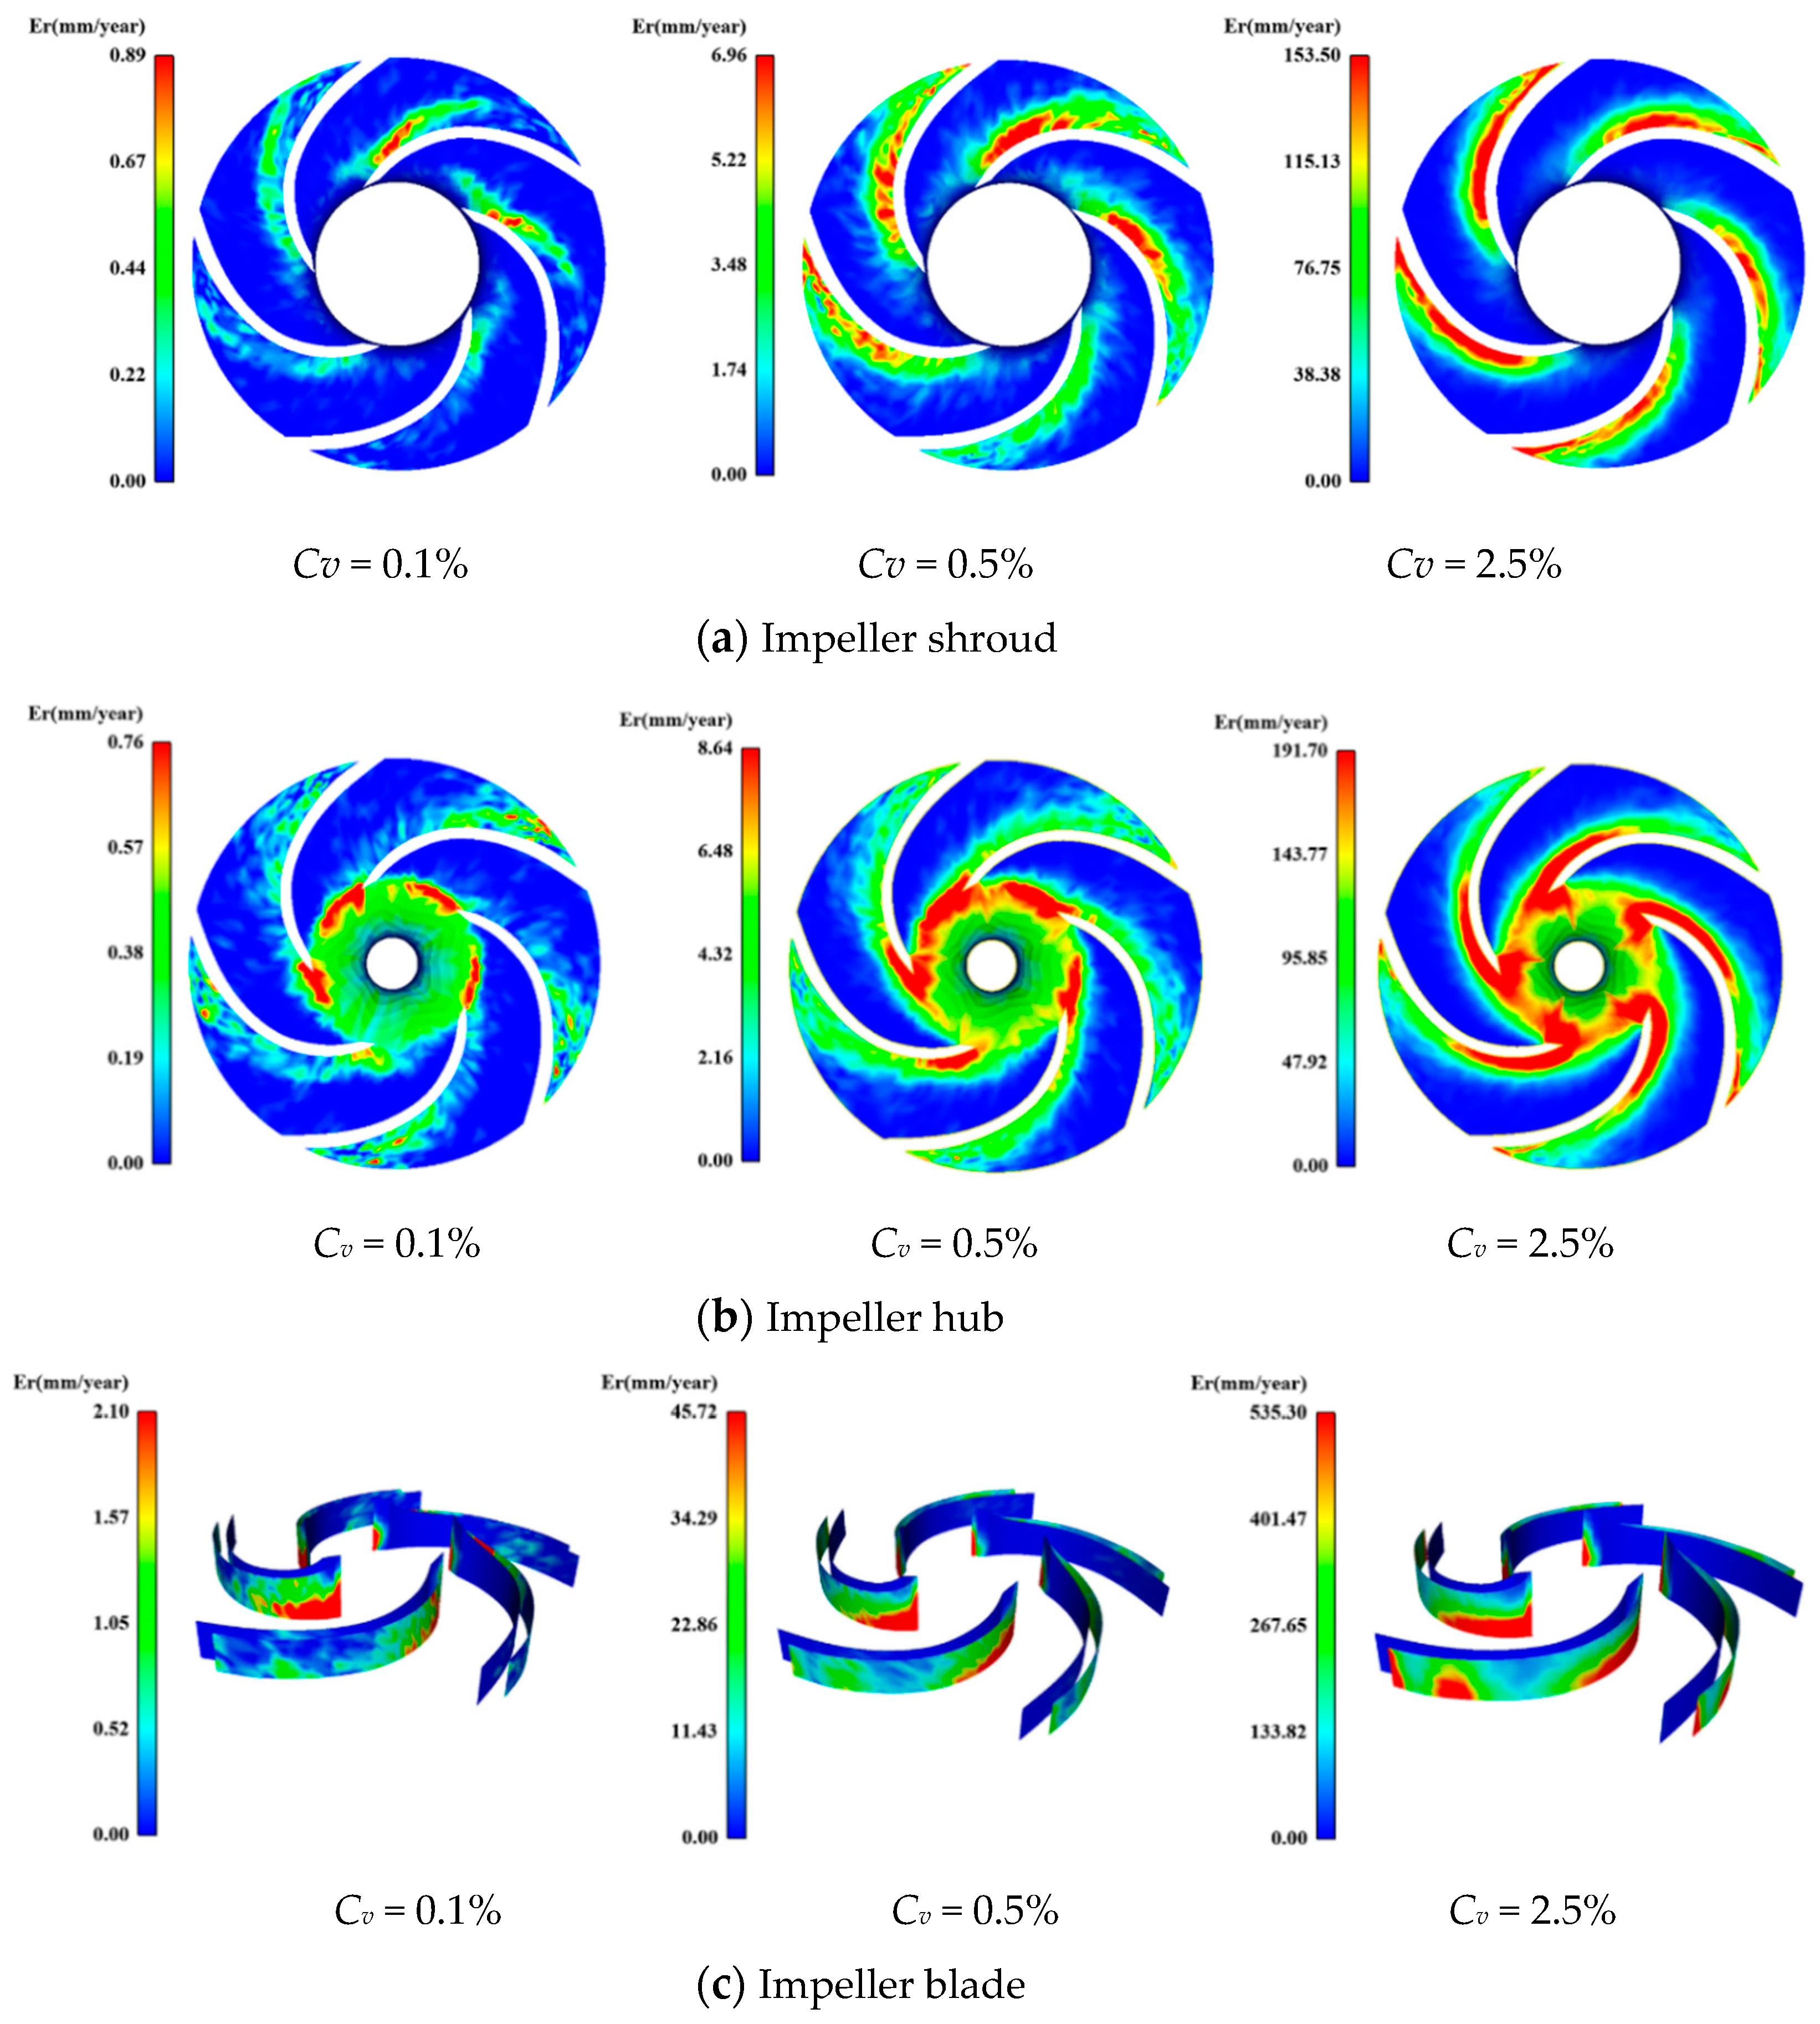
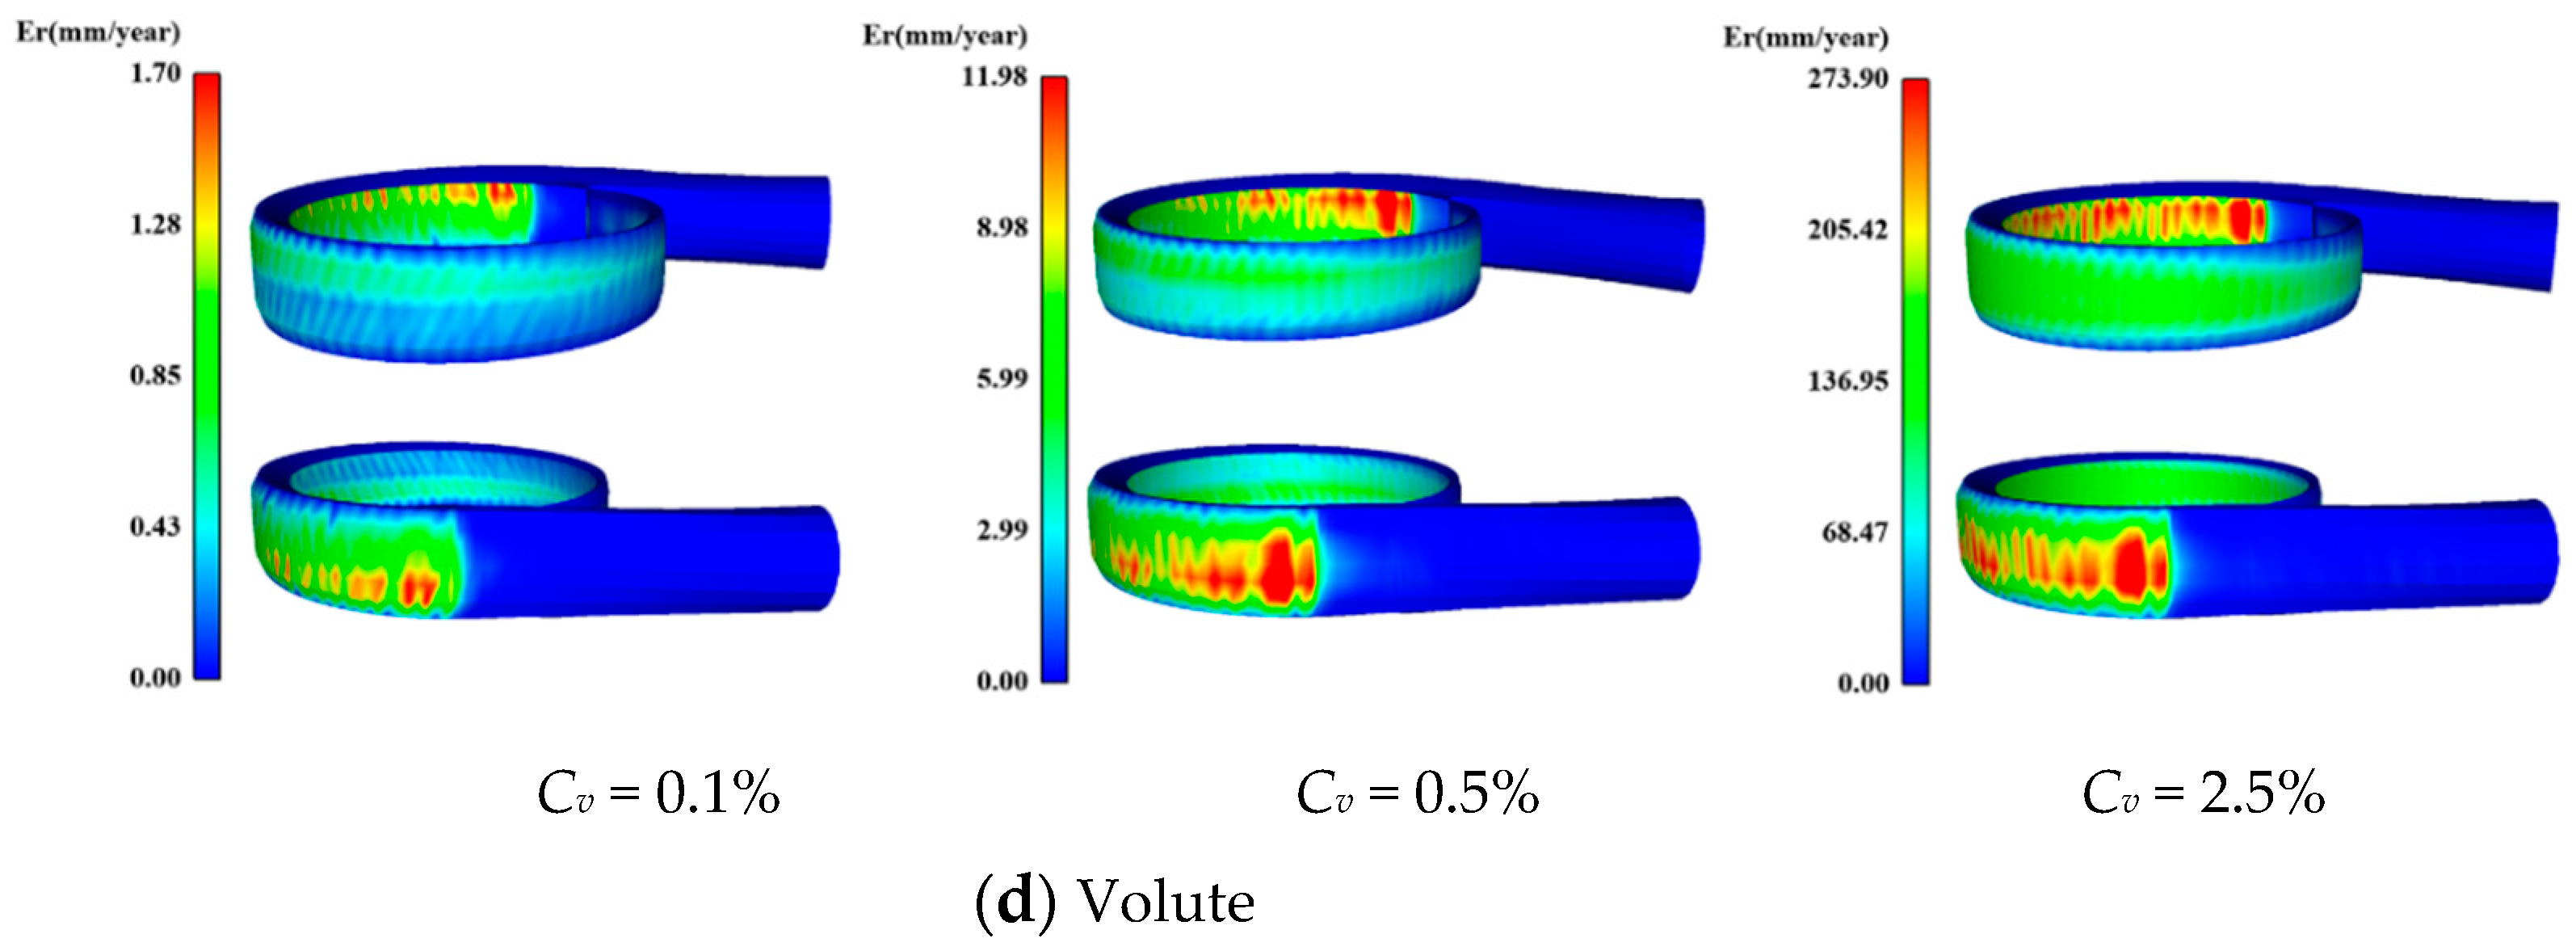
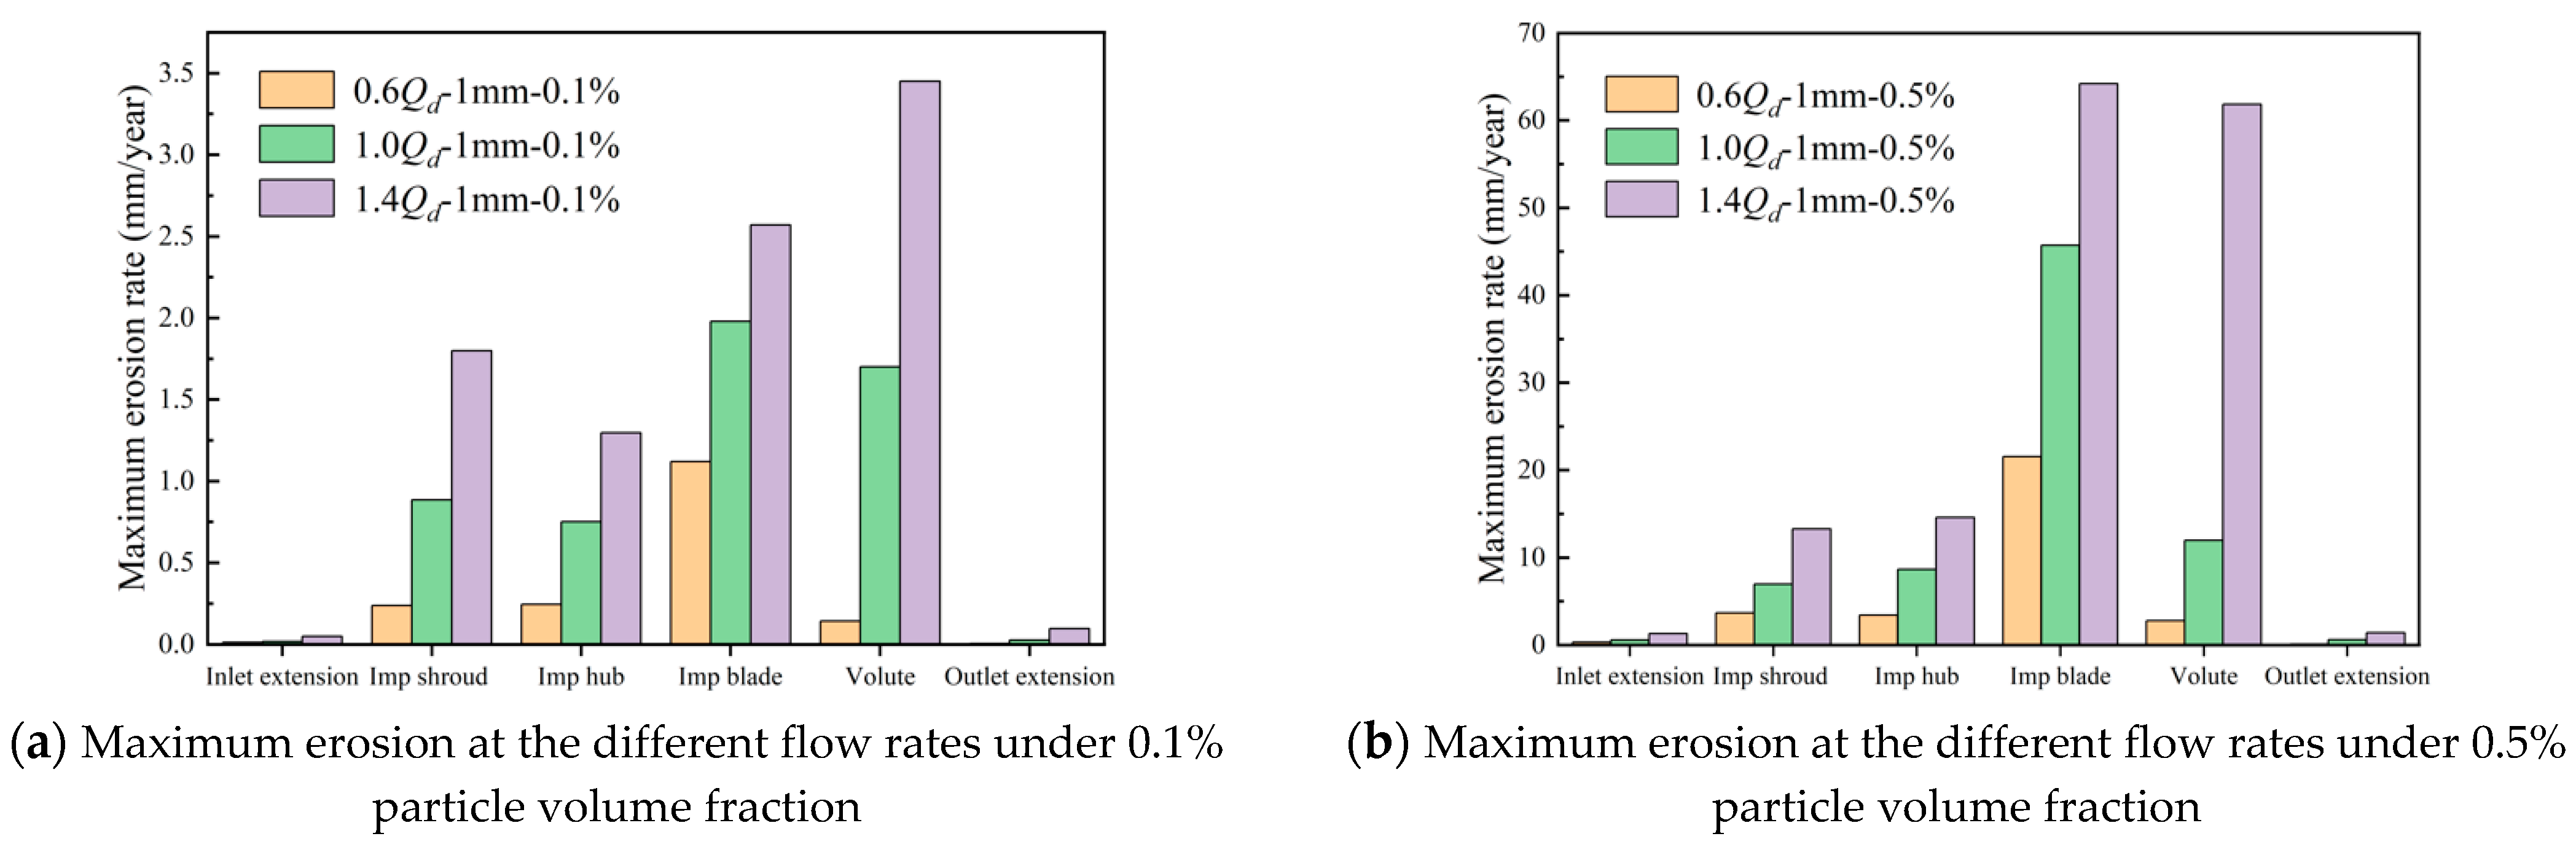
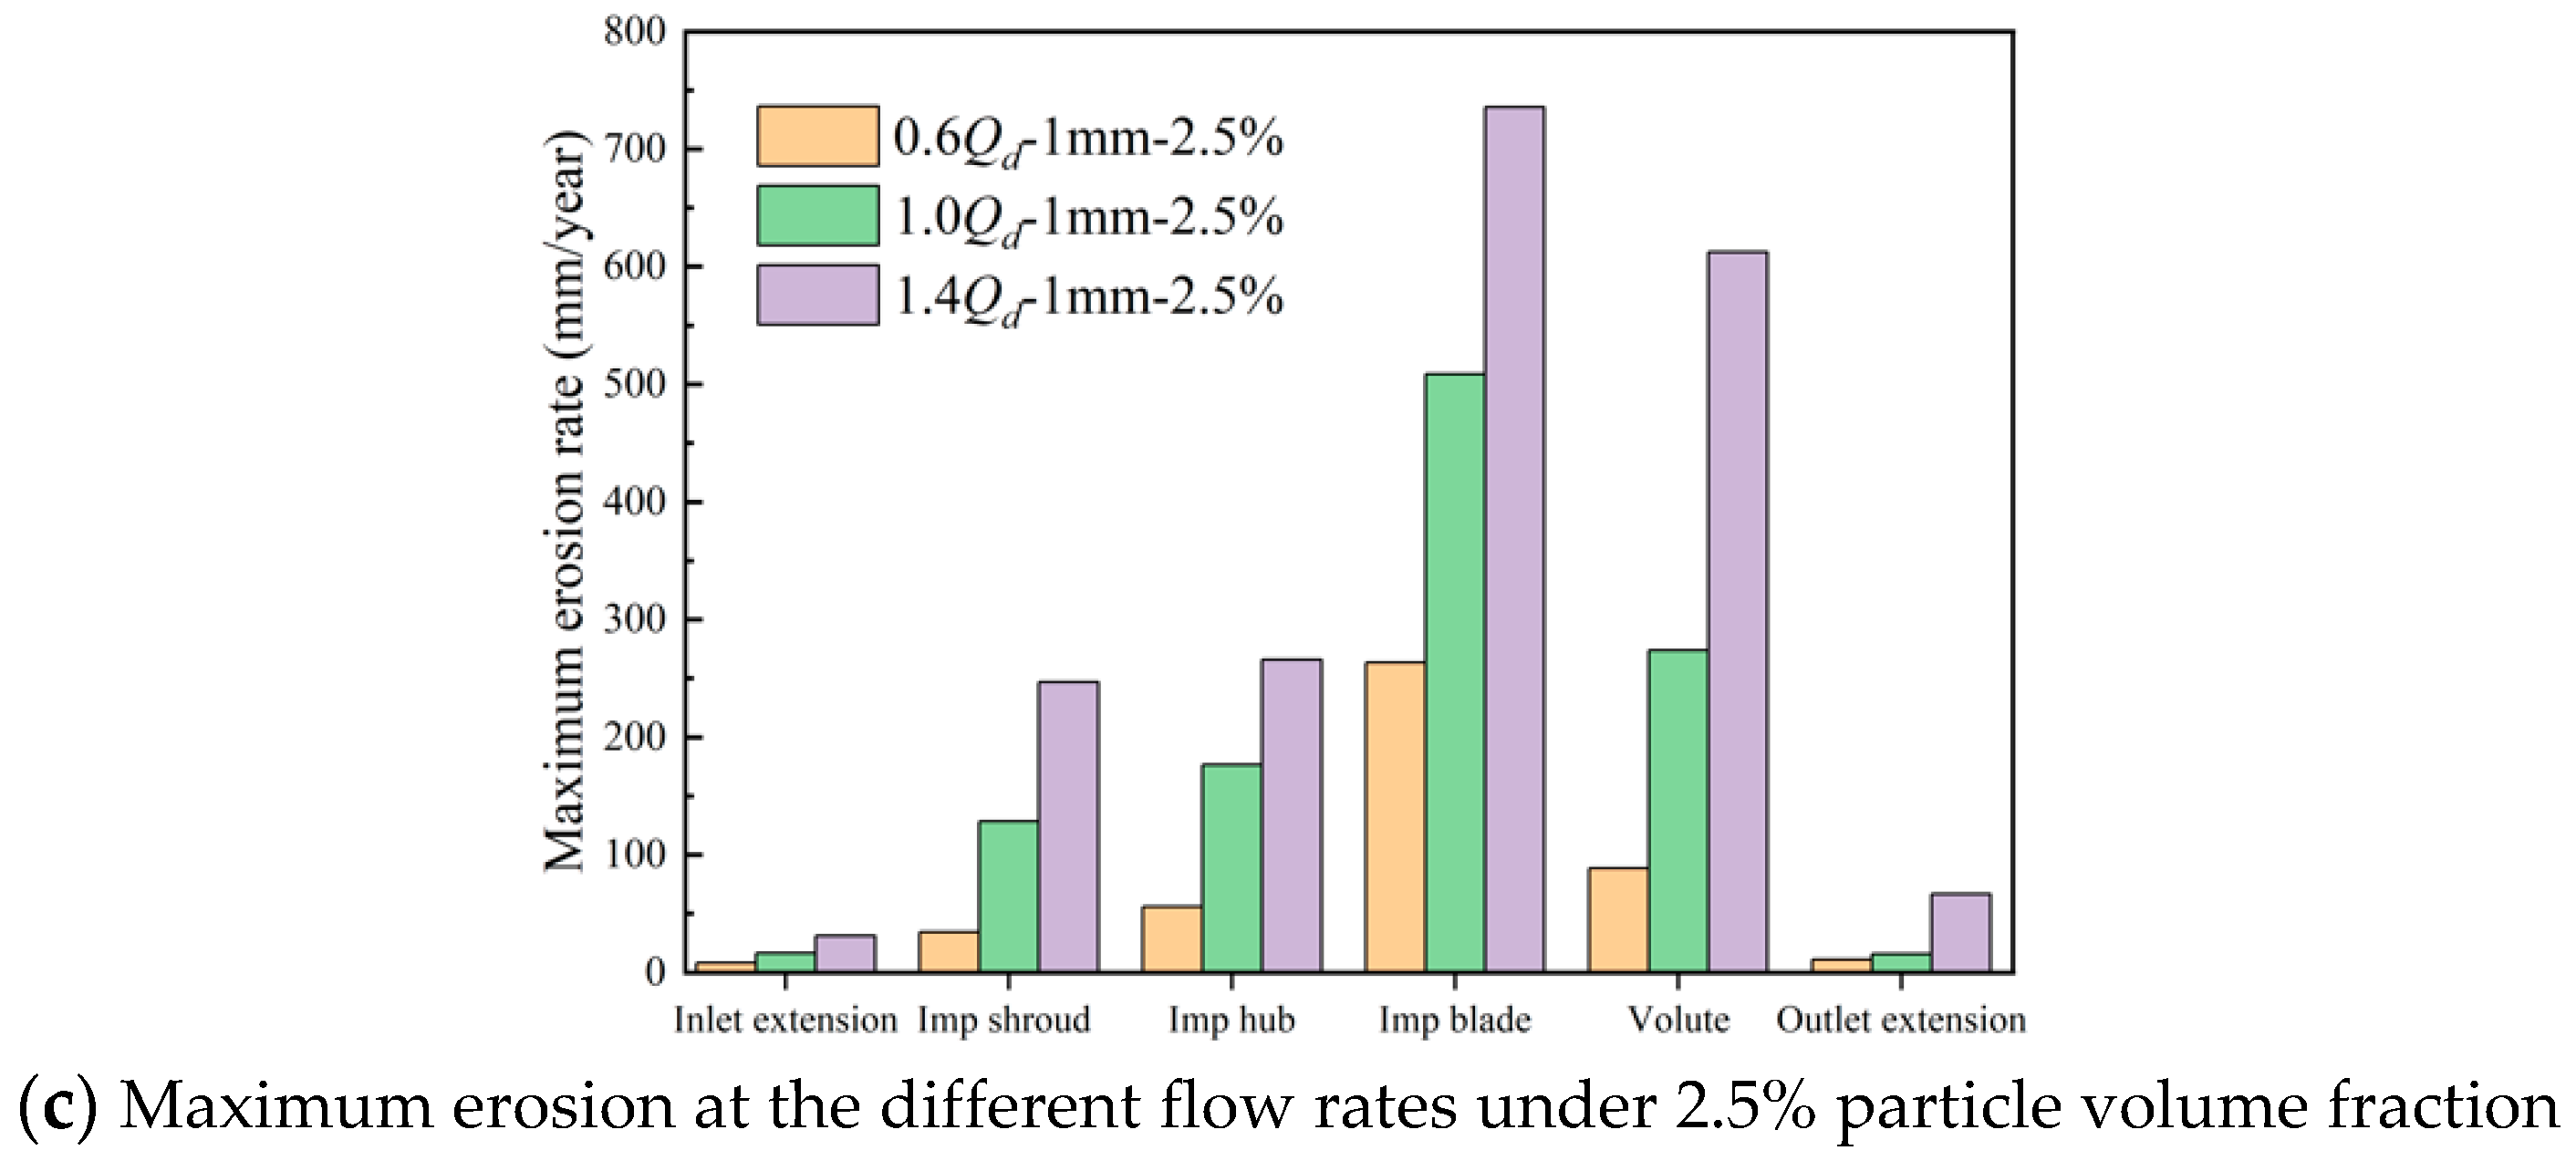
4.1. Influence of Particle Concentration on the Pump Erosion

The influence of the concentration of loading particles on pump erosion is estimated in this section. The shape of the simulated particles is spherical, and the particle diameter is 1 mm. At the inlet of the model, the number of simulated particles is appropriately defined in order to obtain the simulated volume fractions of 0.1%, 0.5%, and 2.5%, respectively. The former two values are often found in the transporting medium of coal and mining engineering and chemical engineering, and the latter one occurs in the hydraulic transporting system of liquid-solid mixed flows. Since the modeled pump possesses the typical configuration of a centrifugal pump, the simulated results of pump erosion will guide the design and optimization of anti-erosion centrifugal pumps.
The particles are tracked in a specific flow passage of the pump under the simulated particle concentrations. At the same time, the influence of the working flow rate is also estimated at 0.6Qd, 1.0Qd, and 1.4Qd. The results are shown in the figure below. Two features of particle transport can be obtained from the perspective of particle distribution. Part of the particles at the impeller inlet are decelerated, which is attributed to impacts with the different components of the impeller as well as particle-particle collisions. The blocking effect becomes significant when the particle concentration increases to 2.5%. Once the particles come into the passage, they move along the pressure side of the blade. At the small particle concentration, the particles cannot always be constrained on the pressure side; they flux into the bulk flow at the outlet of the passage. As the particle concentration increases, more particles are constrained on the pressure side and move out from the outlet of the blade. It can be expected that erosion on the surfaces of different components of the impeller near the outlet is increased with an increasing particle concentration. The particles in the flow passage are also tracked at different flow rates, and the particle distribution is very similar, except that the number of particles in the passage increases with increasing flow rate. The corresponding figures are ignored for the sake of brevity.
The erosion rates on the surfaces of different components of the pump are shown in the figures below for three particle concentrations. On the surface of the impeller shroud (as shown in Figure 9a), the erosion mainly occurs near the corner adjoining to the pressure side of the blades. The erosion rate is increased as the particle concentration increases. The maximum annual erosion rates are 0.89, 6.96, and 153.50 mm/year under the particle volume fractions of 0.1%, 0.5%, and 2.5%. It is shown the erosion is not distributed evenly in different flow passages at the low particle volume fraction. However, the distribution of the erosion becomes more uniform among the different passages with the increasing volume fraction. The erosion on the impeller hub is shown in Figure 9b. The maximum annual erosion rates are comparable to those on the impeller shroud. The regions of severe erosion mainly occur near the inlet of the impeller. This region is elongated along the streamwise direction and near the corner adjoining to the pressure side of the blade with the increasing particle volume fraction. The erosion on the impeller blades is shown in Figure 9c. It is seen that severe erosion mainly occurs on the pressure side of the blades. The region near the impeller inlet is always eroded by the incoming particles, and the region is extended over one-third of the blade length. The erosion in the region near the blade outlet is significantly increased with the increasing particle volume fraction because more particles are accumulated in the near-wall region of the pressure side, and more collisions occur between the particles and wall. It is found that the erosion rate is maximum on the blades than on the surfaces of the other components. The erosion on the volute is shown in Figure 9d. The results show that severe erosions mainly occur on the internal surface of the volute near the tongue. The tongue plays the role of blocking the conveying particles out of the volute and increasing the collisions between the rebounded particles and the internal surface of the volute, resulting in an augmented erosion.
The influence of working flow rate on the pump erosion is also estimated for the different particle concentrations, as shown in Figure 10. The contours of erosion rate on different components are replaced by the maximum annual erosion rate on each component. The simulated flow rates are 0.6Qd, 1.0Qd, and 1.4Qd, respectively. It is found from Figure 10a that the maximum erosion occurs on the pressure side of the blades at the low (0.6Qd) and nominal (1.0Qd) flow rates under 0.1% particle volume fraction. The maximum annual erosion rate is 1.12 mm/year and 1.97 mm/year, respectively. At the large (1.4Qd) flow rate, the maximum erosion occurs on the internal surface of the volute with an annual erosion rate of 3.45 mm/year. The increasing rate of erosion is largest on the volute surface with the increasing flow rate, as seen in Figure 10a. When the particle volume fraction increases to 0.5%, the maximum erosion occurs on the blades at all simulated flow rates. At the low and nominal flow rates, the maximum erosion rates on the shroud and hub of the impeller and the volute are comparable, while at the large flow rate, the erosion on the volute is significantly increased to the level comparable to that on the blades. When the particle volume fraction increases to 2.5%, the maximum erosion occurs on the blades at all simulated flow rates, and the annual erosion rate exceeds over 100 mm/year, which indicates that the hydraulic part of the pump cannot work normally in such harsh conditions. The general features of the erosion on the pump components can be concluded as follows. The maximum erosion always occurs on the pressure side of the blades at all simulated scenarios except for the case of 0.1% and 1.4Qd, in which the erosion on the volute is larger. The rate of increase in the erosion rate is largest on the internal surface of the volute with respect to the flow rate. The erosion rates on the shroud and hub of the impeller are comparable at all simulated conditions. The erosions that occurred in the extended pipes of the inlet and outlet are much smaller than the other components.
The relationships between maximum annual erosion rates on different components and the conveying particle concentration are revealed in the Figure 11 at different working flow rates. It is found that the erosion rate is increased significantly with the increasing particle concentration while the rate firstly increases and then decreases. The sharp increase in erosion rate occurs in the range of 0.5~1.5% particle volume fraction. The reason may be attributed to the formation of a buffering layer of particle aggregation on the impinging surfaces [39]. This phenomenon was also observed in the studies of erosion in bend [40]. If the particles accumulate near the eroded surface, the particles in the inner layer are rebounded by the particles in the bulk flow, and their impact velocity and angle are reduced. The surface erosion tends to be saturated, although the particle concentration in the bulk flow still increases. From Figure 12, it is seen that a large number of particles are aggregated on the pressure side of the blade at 2.5% particle volume fraction, and the buffering layer has been forming with the increasing particle concentration.

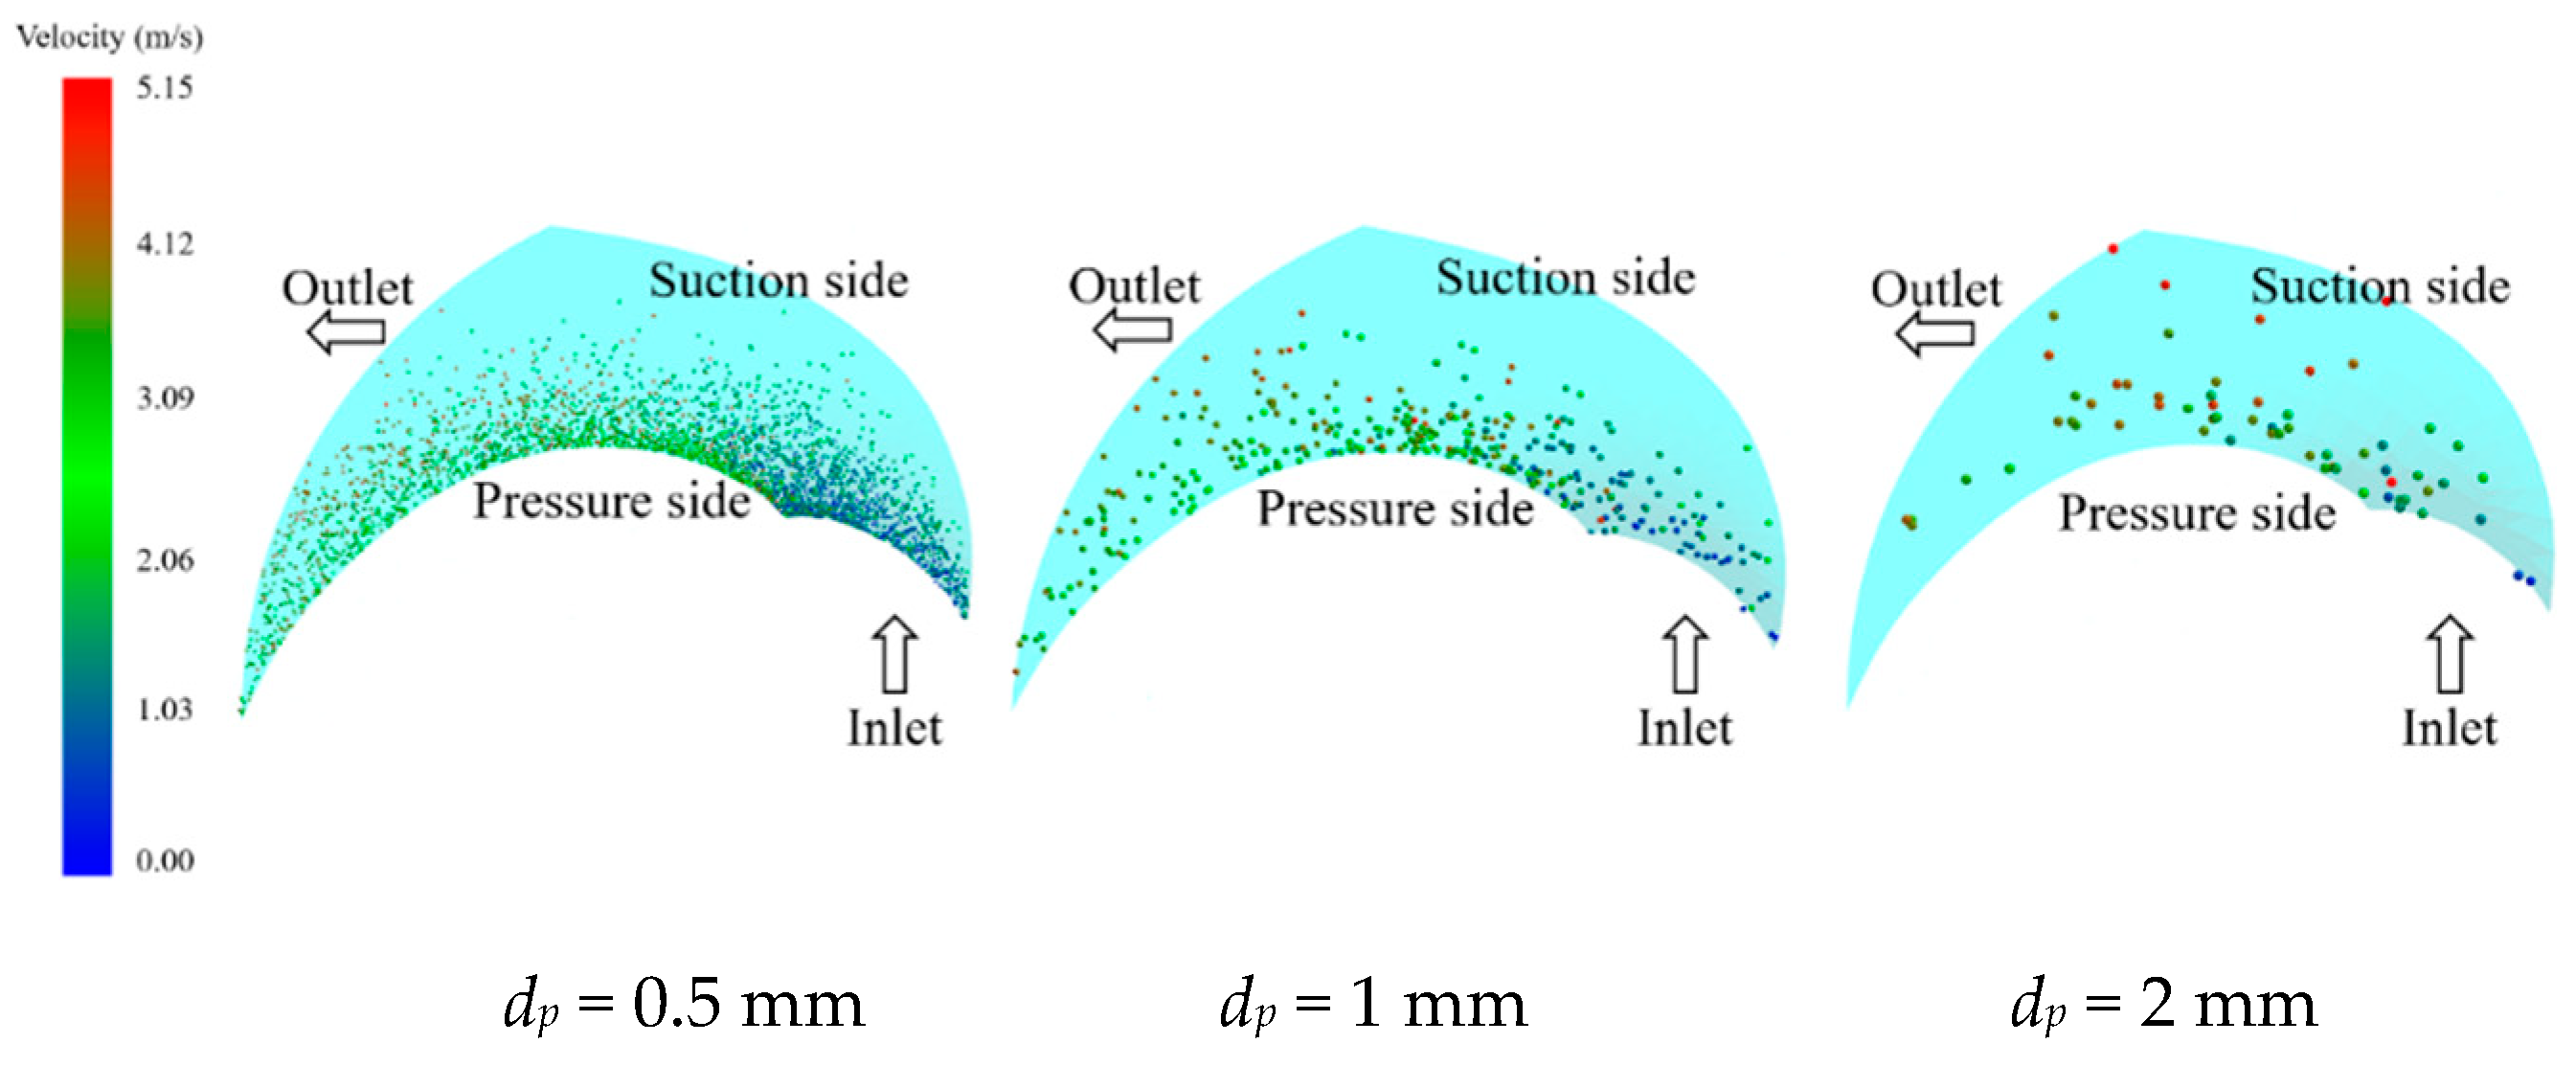
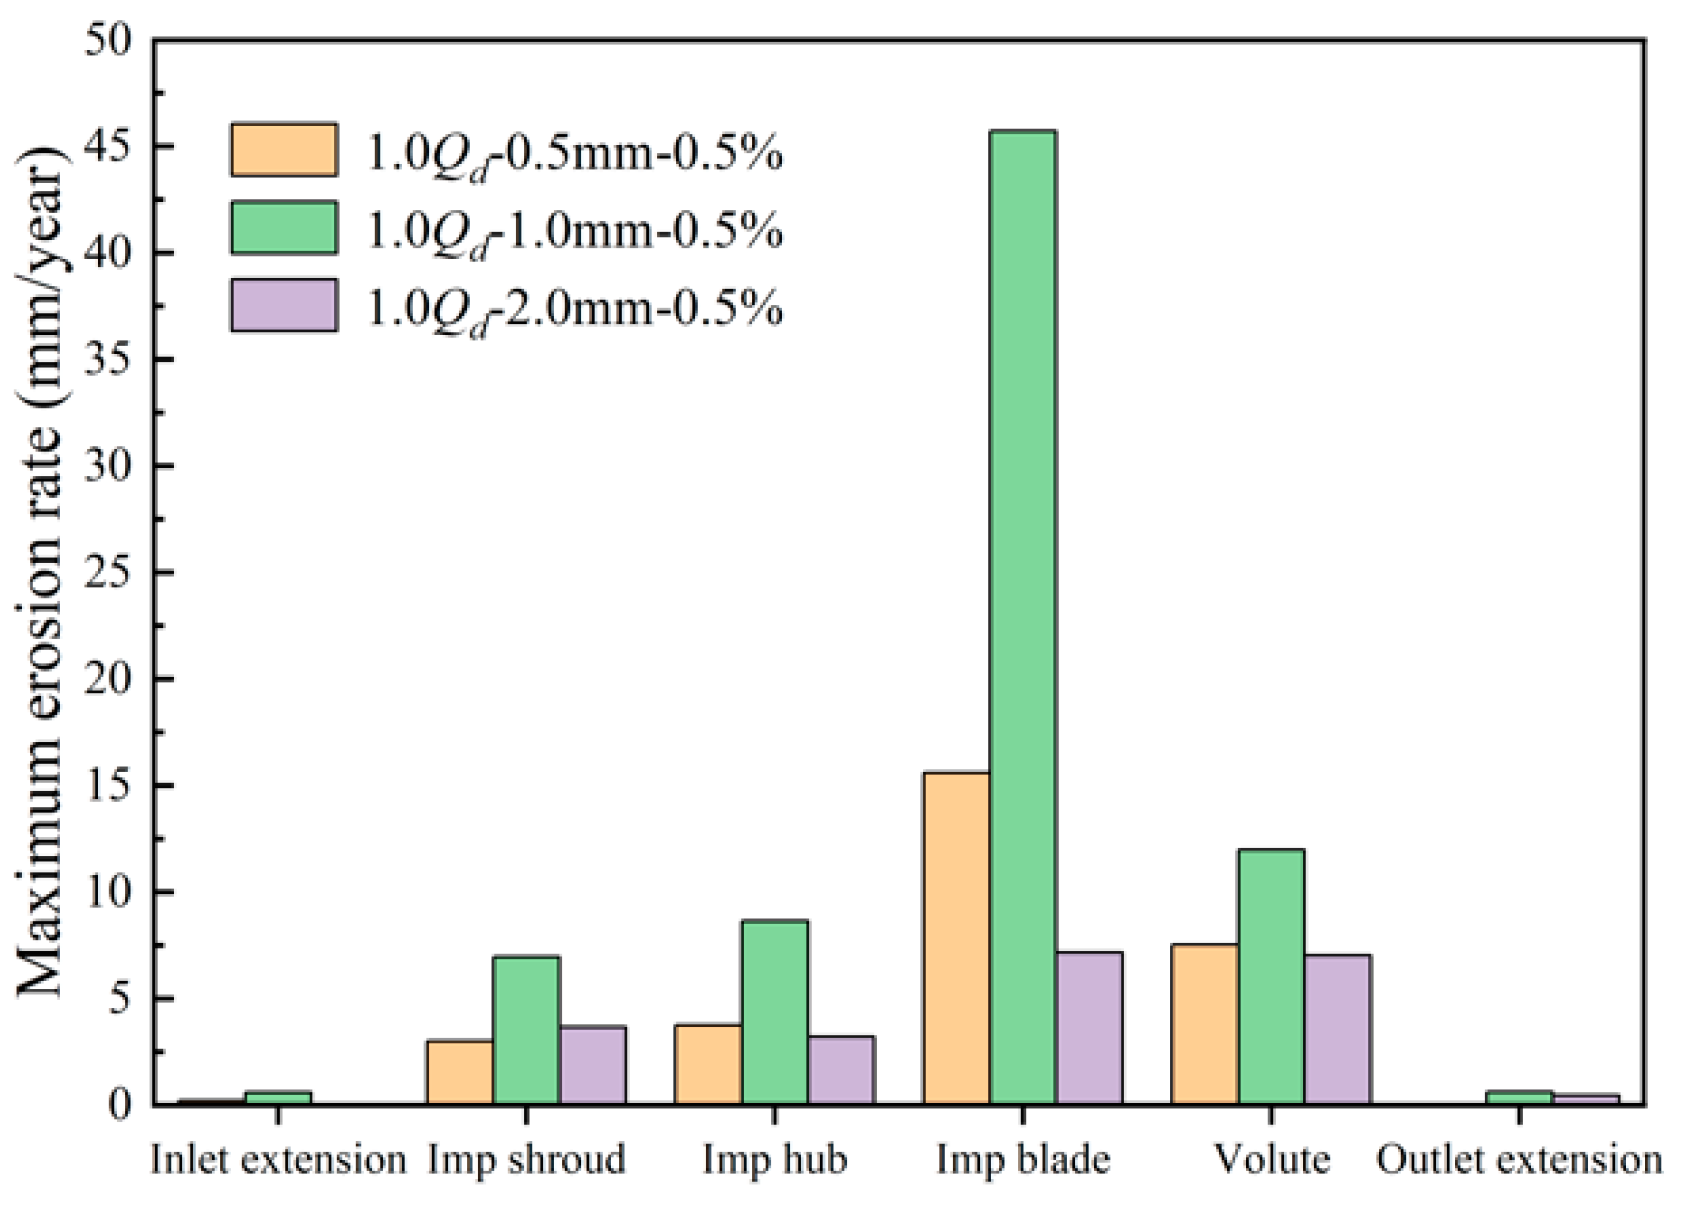
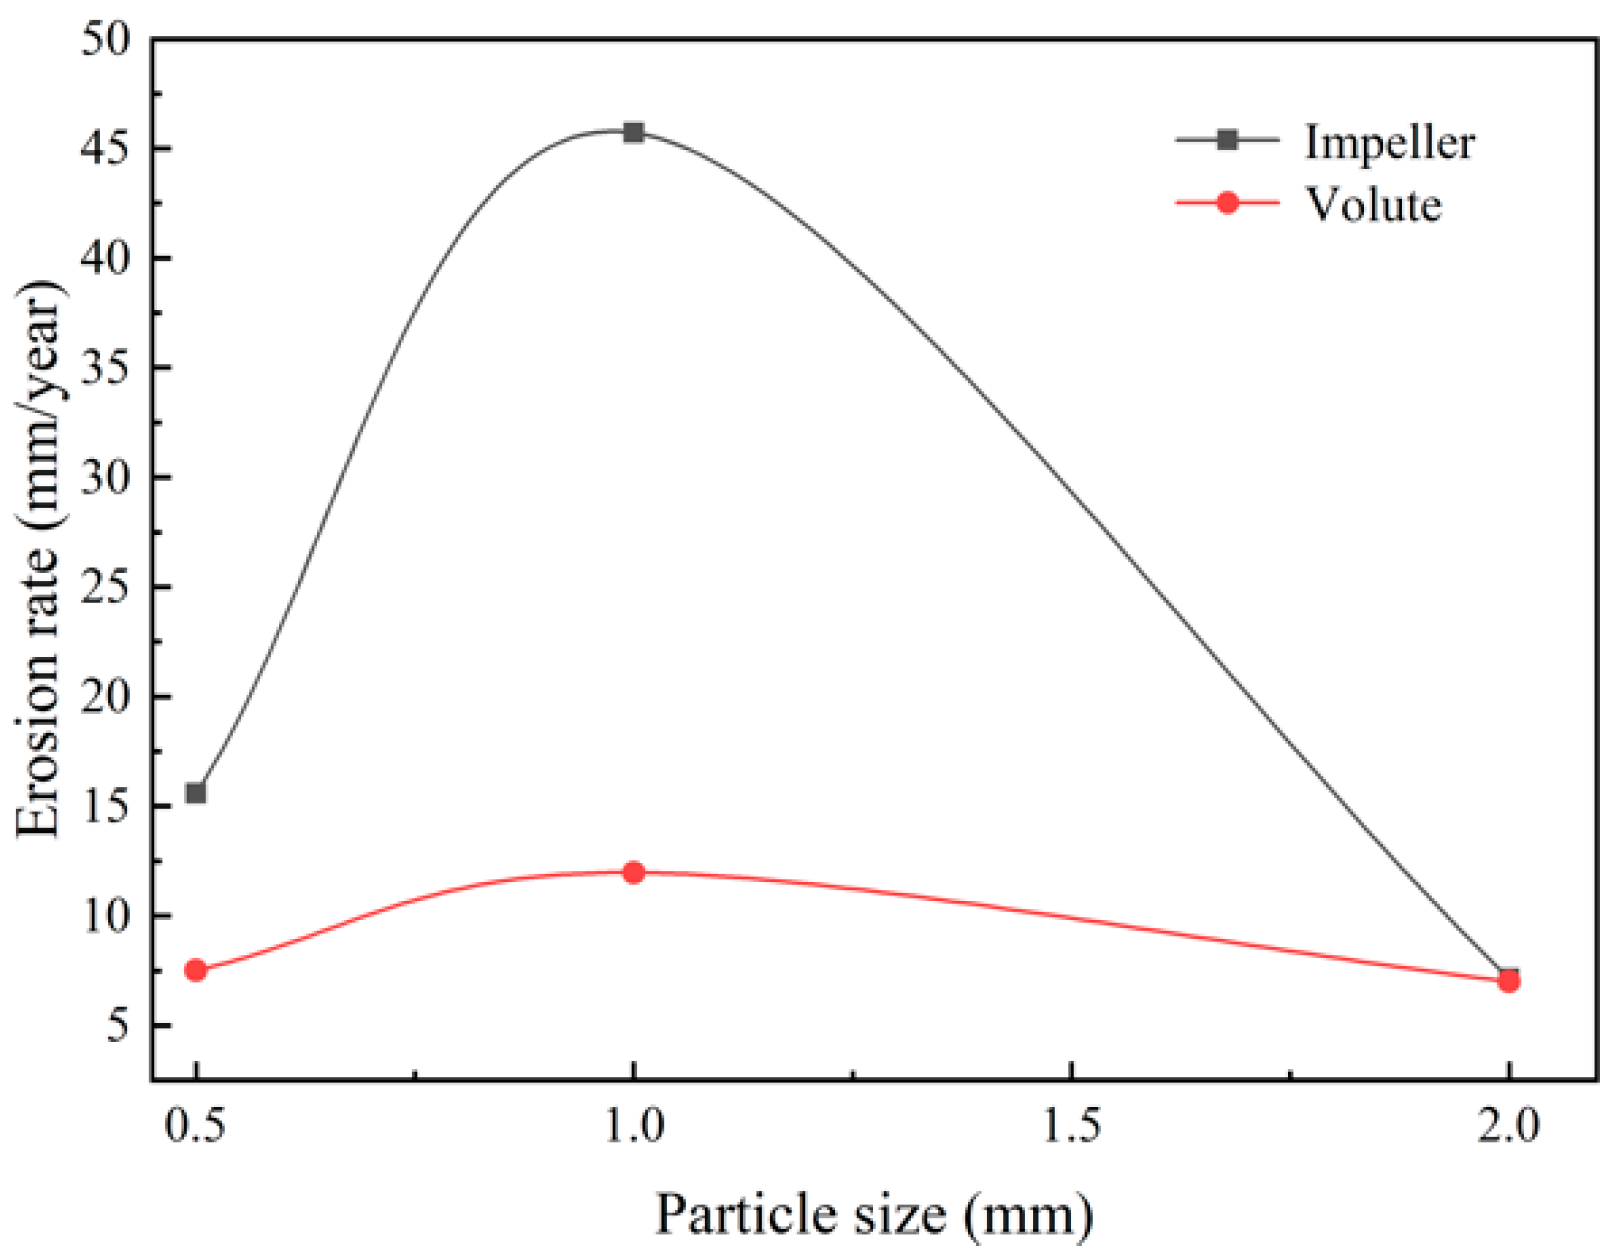
4.2. Influence of Particle Size on the Pump Erosion

The particle size is another important factor in the liquid-solid two-phase flow systems. Since coarse particles are of particular interest in this work, the particle diameters of 0.5 mm, 1 mm, and 2 mm were simulated, and the particle volume fraction was 0.5%. Two important parameters relating to the particle size are the particle Reynolds number and the particle Stokes number. The particle Reynolds numbers, in this case, were approximately 250, 300, and 600, respectively. The Stokes number is defined as the ratio of particle relaxation time and fluid characteristic time is a dimensionless number for representing the curvilinear movement of the solid particle, which is defined as S t = ρ p d p 2 u 18 μ D . Here, D is the characteristic length, which can be set as the equivalent hydraulic diameter of the flow channel in the impeller. The corresponding Stokes numbers of different particle sizes are calculated as approximately 2.3, 11.3, and 45.3. It is shown that the Stokes number is greater than 1, especially for 2 mm particles and the inertial effect plays a significant role in the particle motion. The larger the particle size is, the weaker the fluid constraint is. Figure 13 shows the particle distribution in a flow passage of the pump impeller for three particle diameters. The larger the particle diameter is, the fewer the particles in the pump. It was seen that the particles are distributed more uniformly in the passage for 2 mm particles, which indicates that the highly inertial particles do not follow the fluid trajectories very closely and do not cluster. As the particle diameter reduces, the Stokes number decreases, particle motion is more affected by the underlying fluid flow, and clustering is observed. More particles are presented in the passage, and the particles intensively move along the pressure side of the blade. The results demonstrate that the particle motion in the pump impeller is firstly dominated by the collision between the particles and the pressure side of the blade. If the number of particles increases, the collisions among particles affect the particle distribution. The major part of the particles is located near the pressure side of the blade.
The contours of erosion on different components of the pump are figured, and the features on the erosion pattern are very similar to those analyzed in the above section. The severe erosions on the shroud and hub of the impeller occur in the jointed regions with the pressure side of the blade. The severe erosion on the blade occurs in the regions next to the inlet and outlet of the blade. If the particle size is small and more particles are presented, the erosive area is extended toward the middle of the blade. The severe erosion on the volute, as observed in Figure 10, occurs near the pump tongue.
Figure 14 shows the maximum annual erosion rates on different components of the pump for different particle sizes. It is seen that the erosions on the shroud and hub of the impeller, the volute, and the extensions of the inlet and outlet are not very sensitive to the particle size, while the erosion on the pressure side of the blade is strongly affected by the particle size. Figure 15 shows the relationships between the maximum annual erosion rate and the particle diameter. On both the blade and volute, the erosion rate is a nonlinear relationship with particle size, and the maximum erosion occurs in the case of the 1 mm particle. For the 2 mm particles, each particle has a larger mass and kinetic energy. However, the presented particles are significantly fewer at the fixed volume fraction, and the collisions with the pump surfaces are scarce, causing the lowest annual erosion rate. For the 1mm particles, although the particle mass and kinetic energy are reduced, the number of particles is significantly increased, as well as the collision frequency with the pump surface. The overall effect is to cause the largest erosion rate. For the 0.5 mm particles, the particle mass and kinetic energy are further reduced while the number of particles is greatest. However, it is found that a buffering layer is formed on the surface when the presented particles are intensively accumulated in the vicinity of the surface. The inner particles are rebounded by the outer particles and move along the surface. The impact velocity and angle are significantly reduced, resulting in the mitigation of surface erosion. The results demonstrate that erosion is determined by both the particle size and concentration near the eroded surface. Moreover, if the particles near the surface accumulate, the mitigation of surface erosion may occur due to the buffering effect mentioned above.

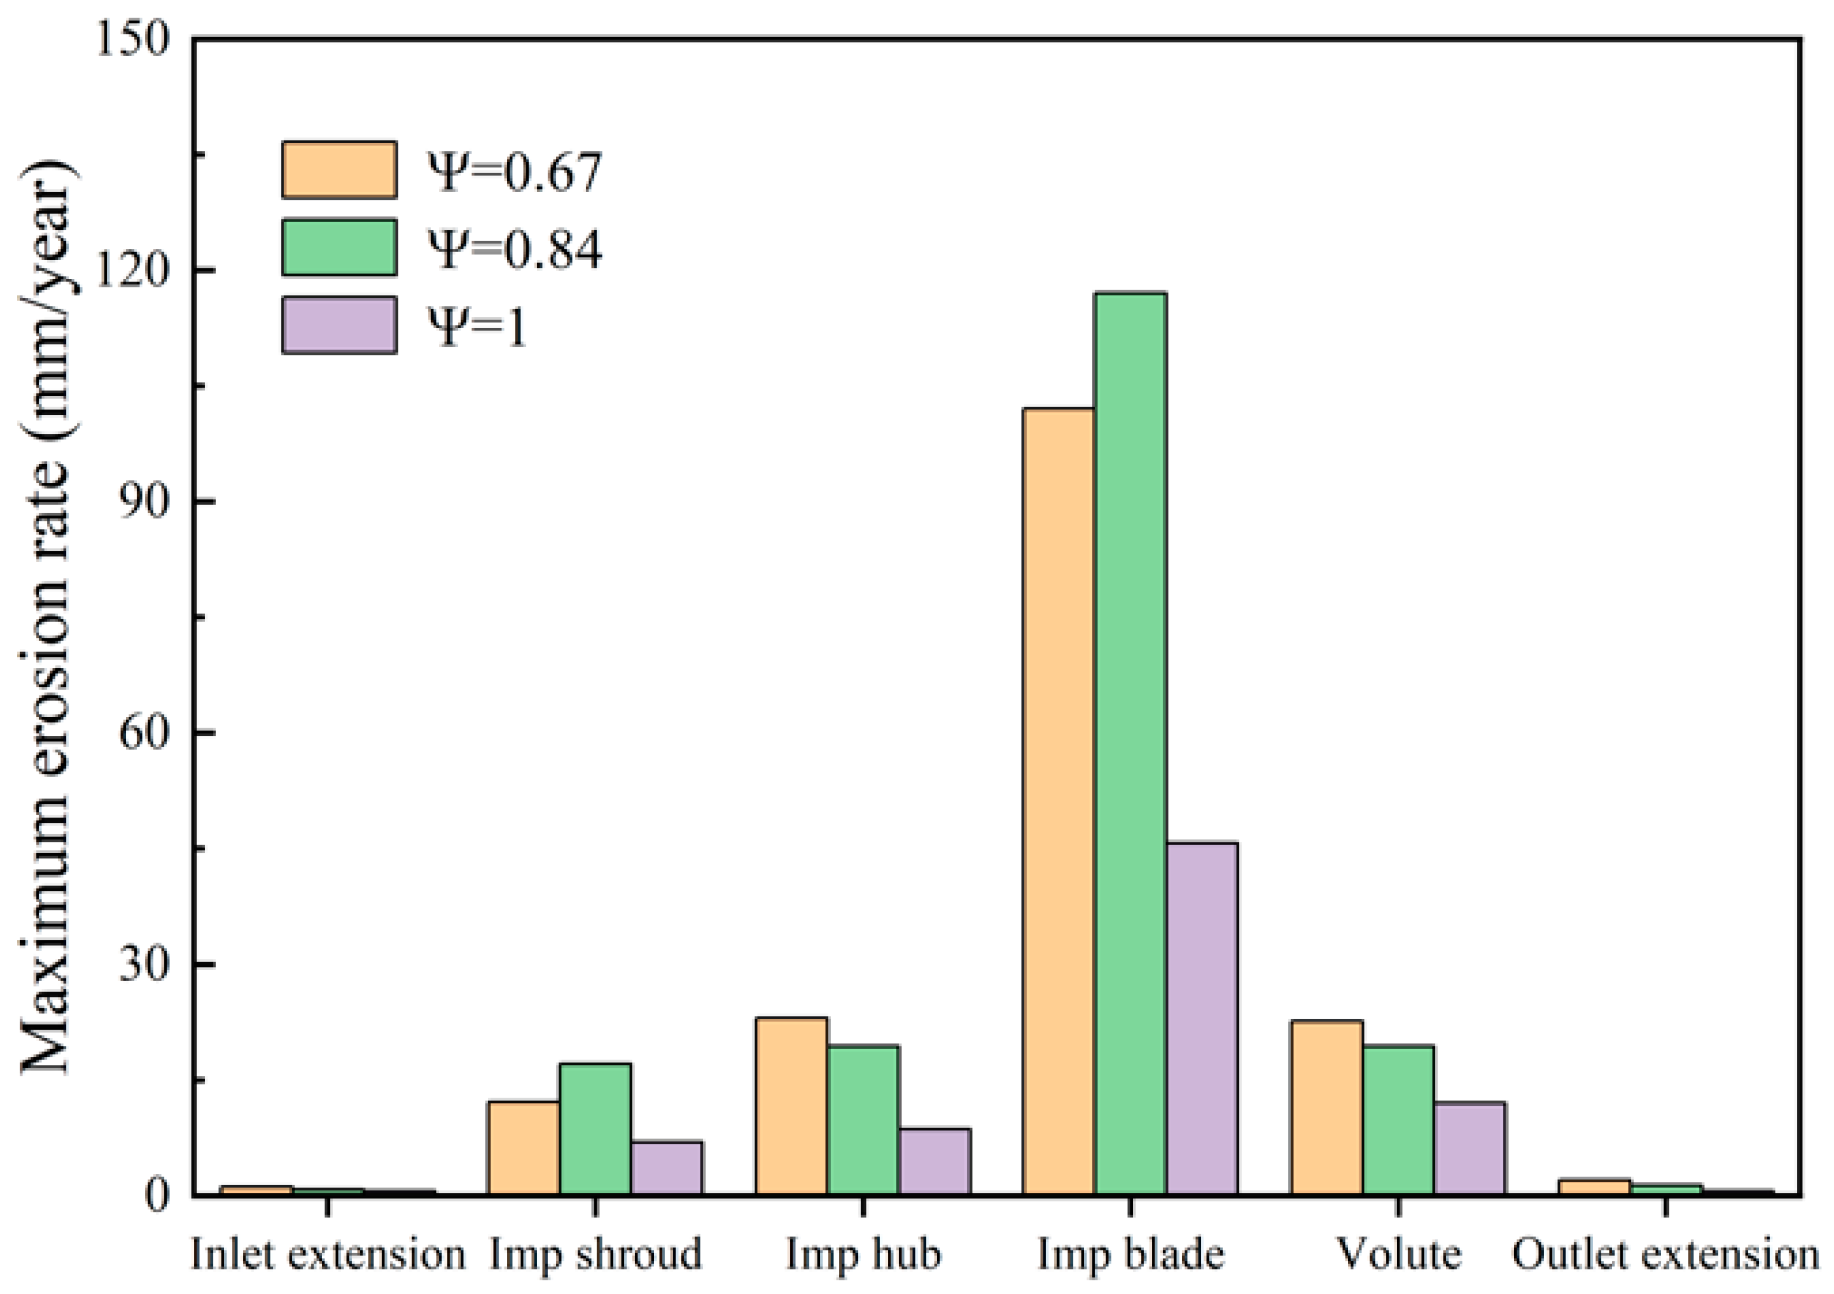
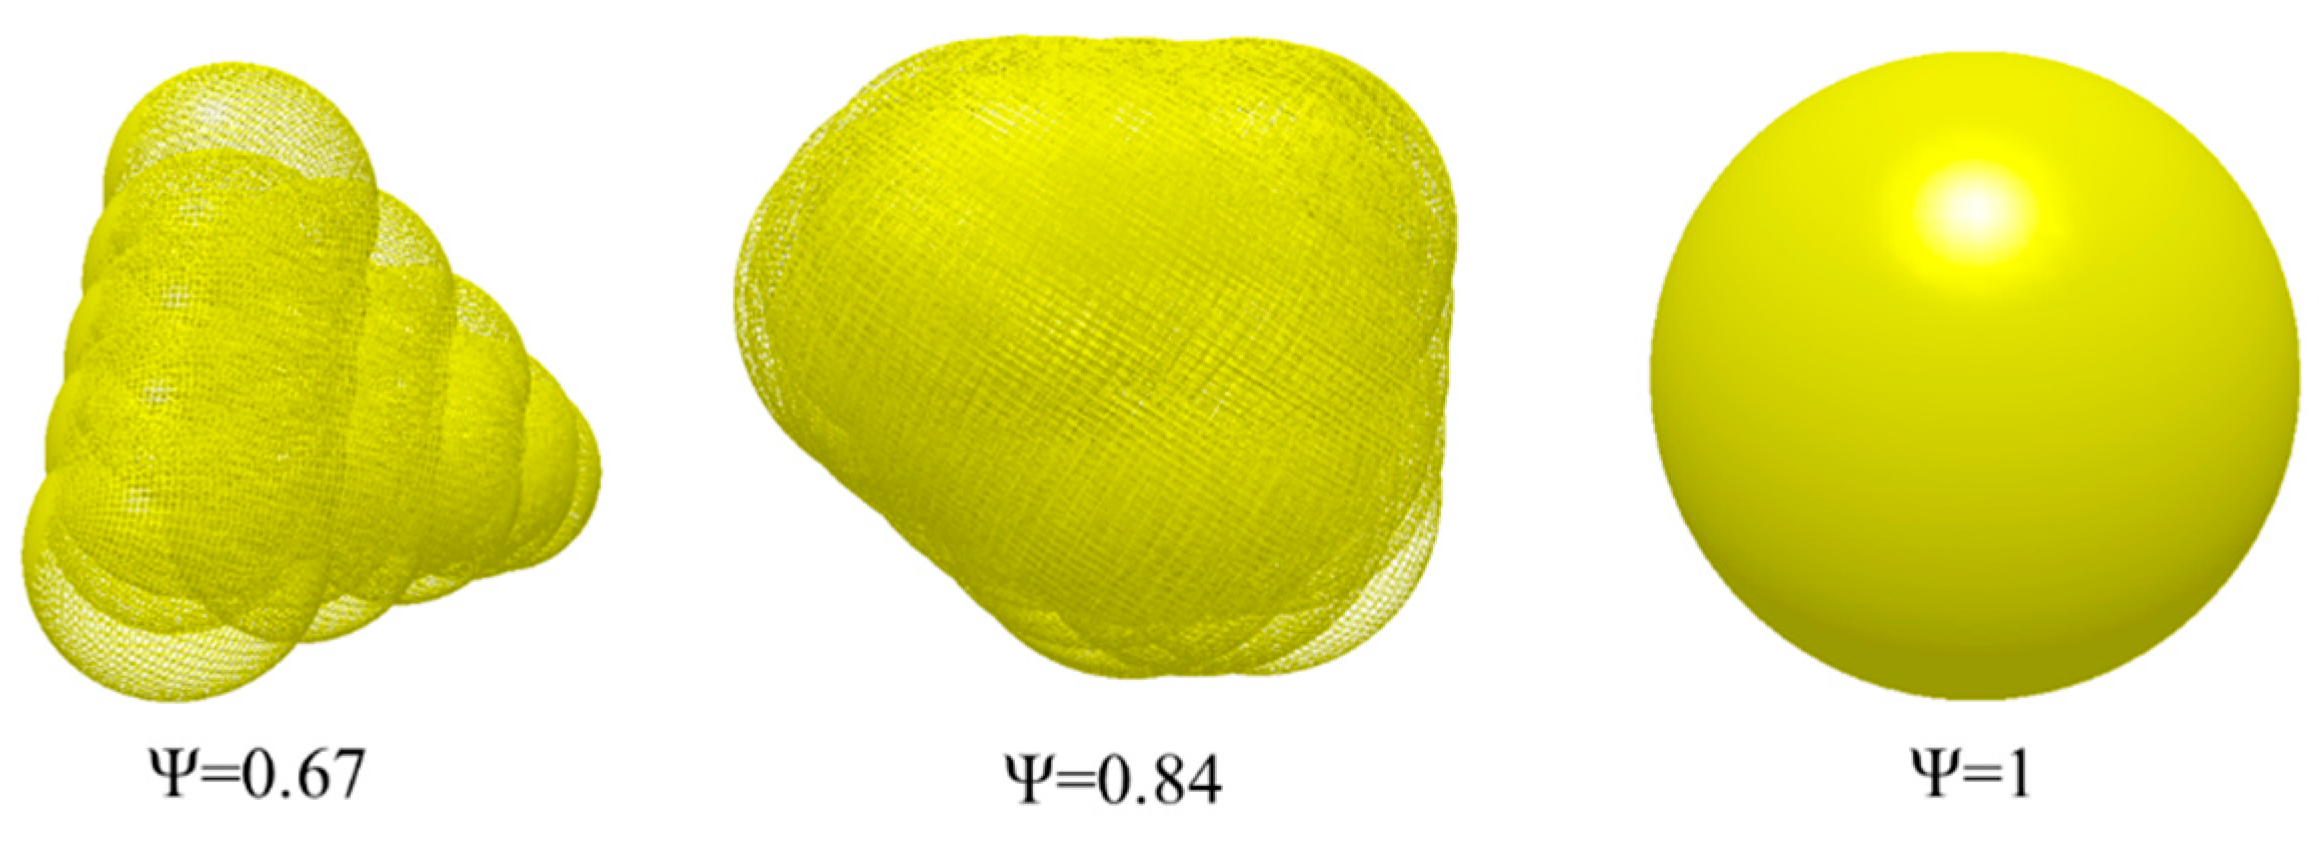
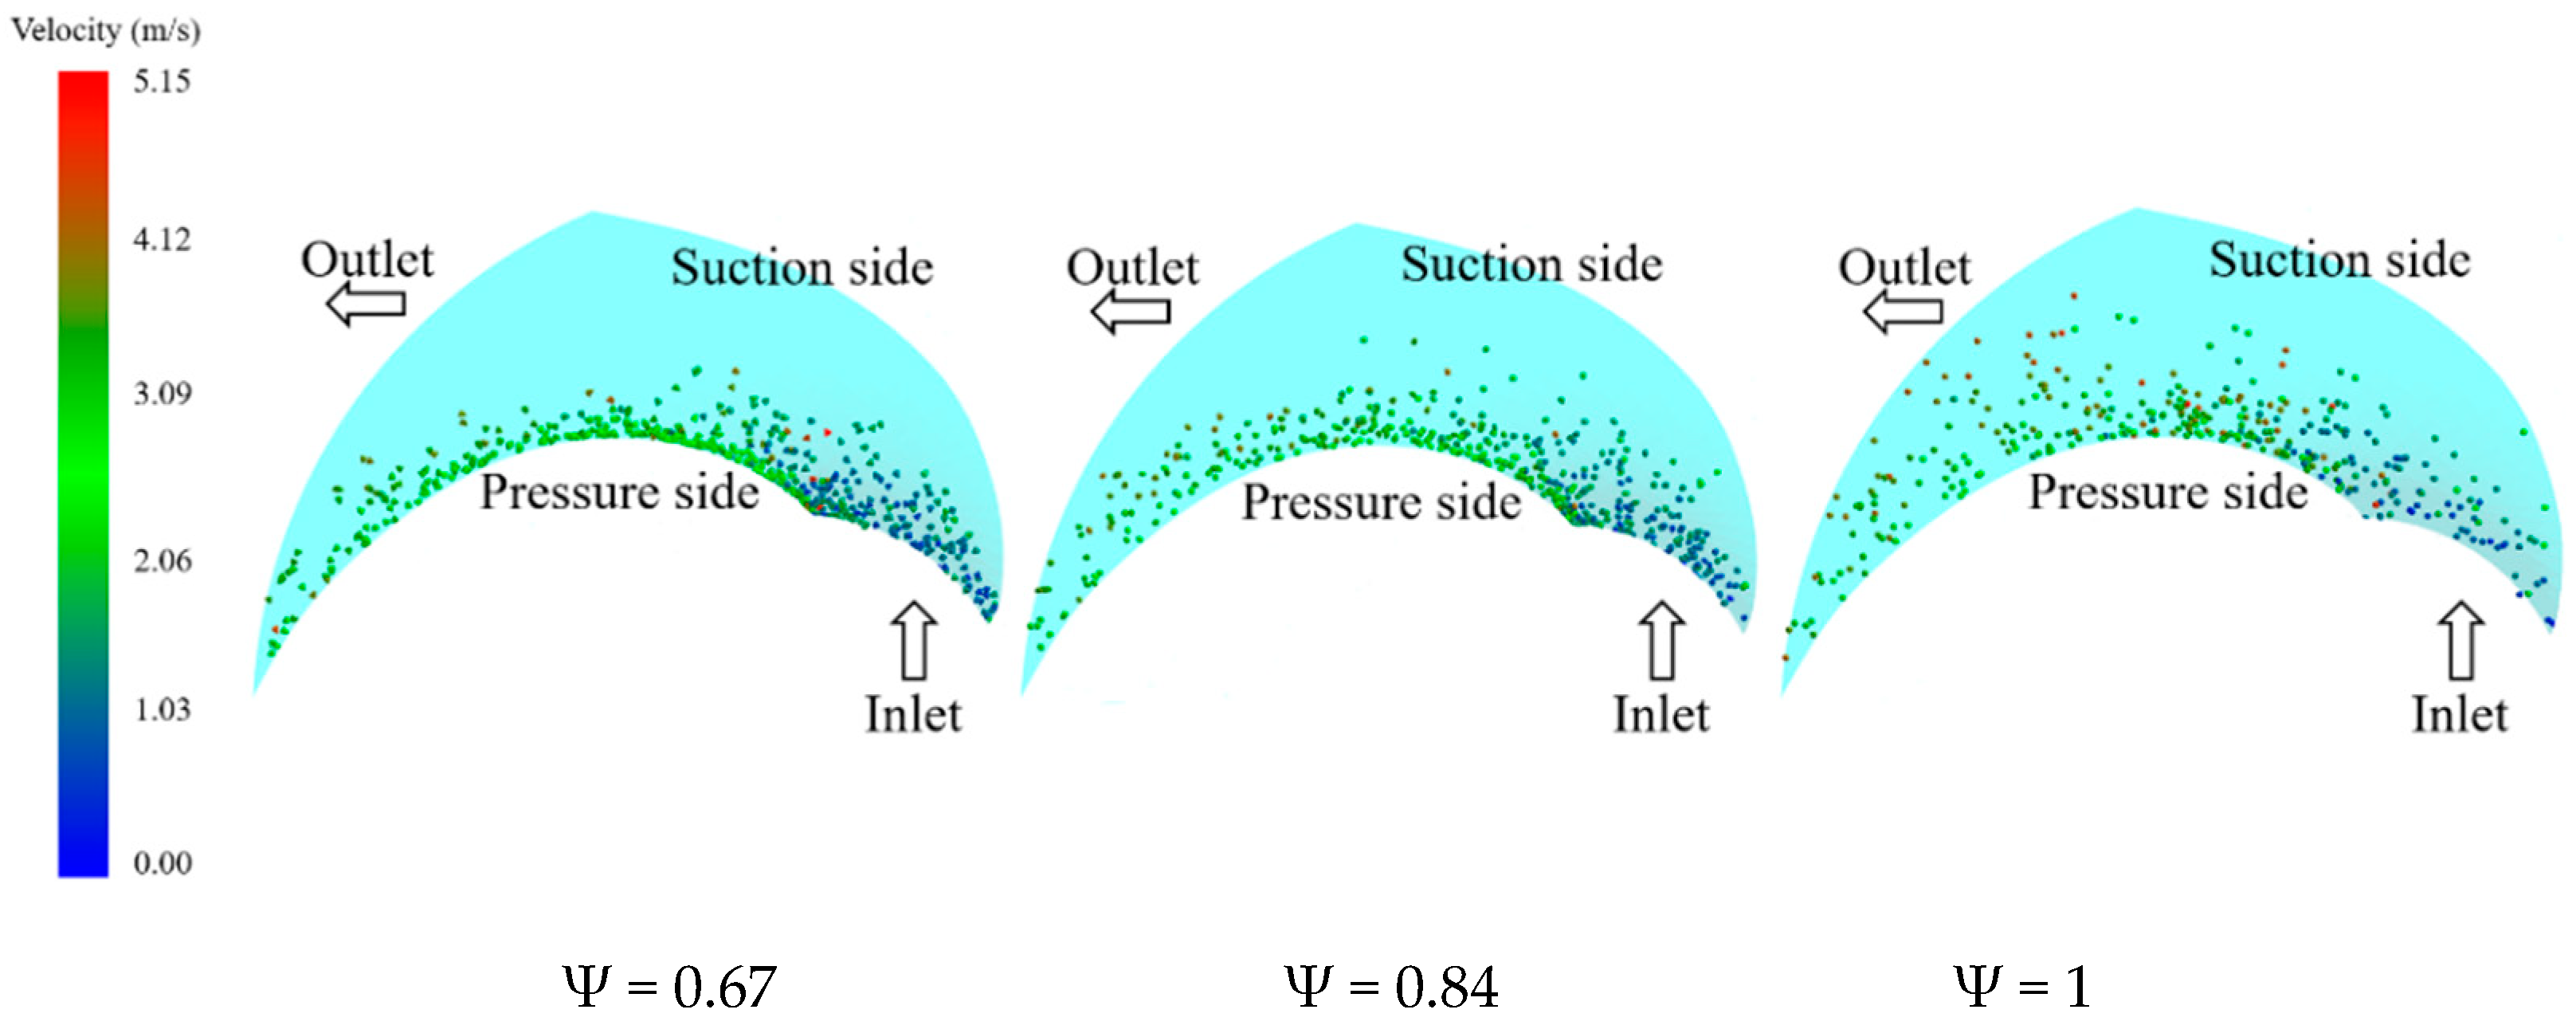
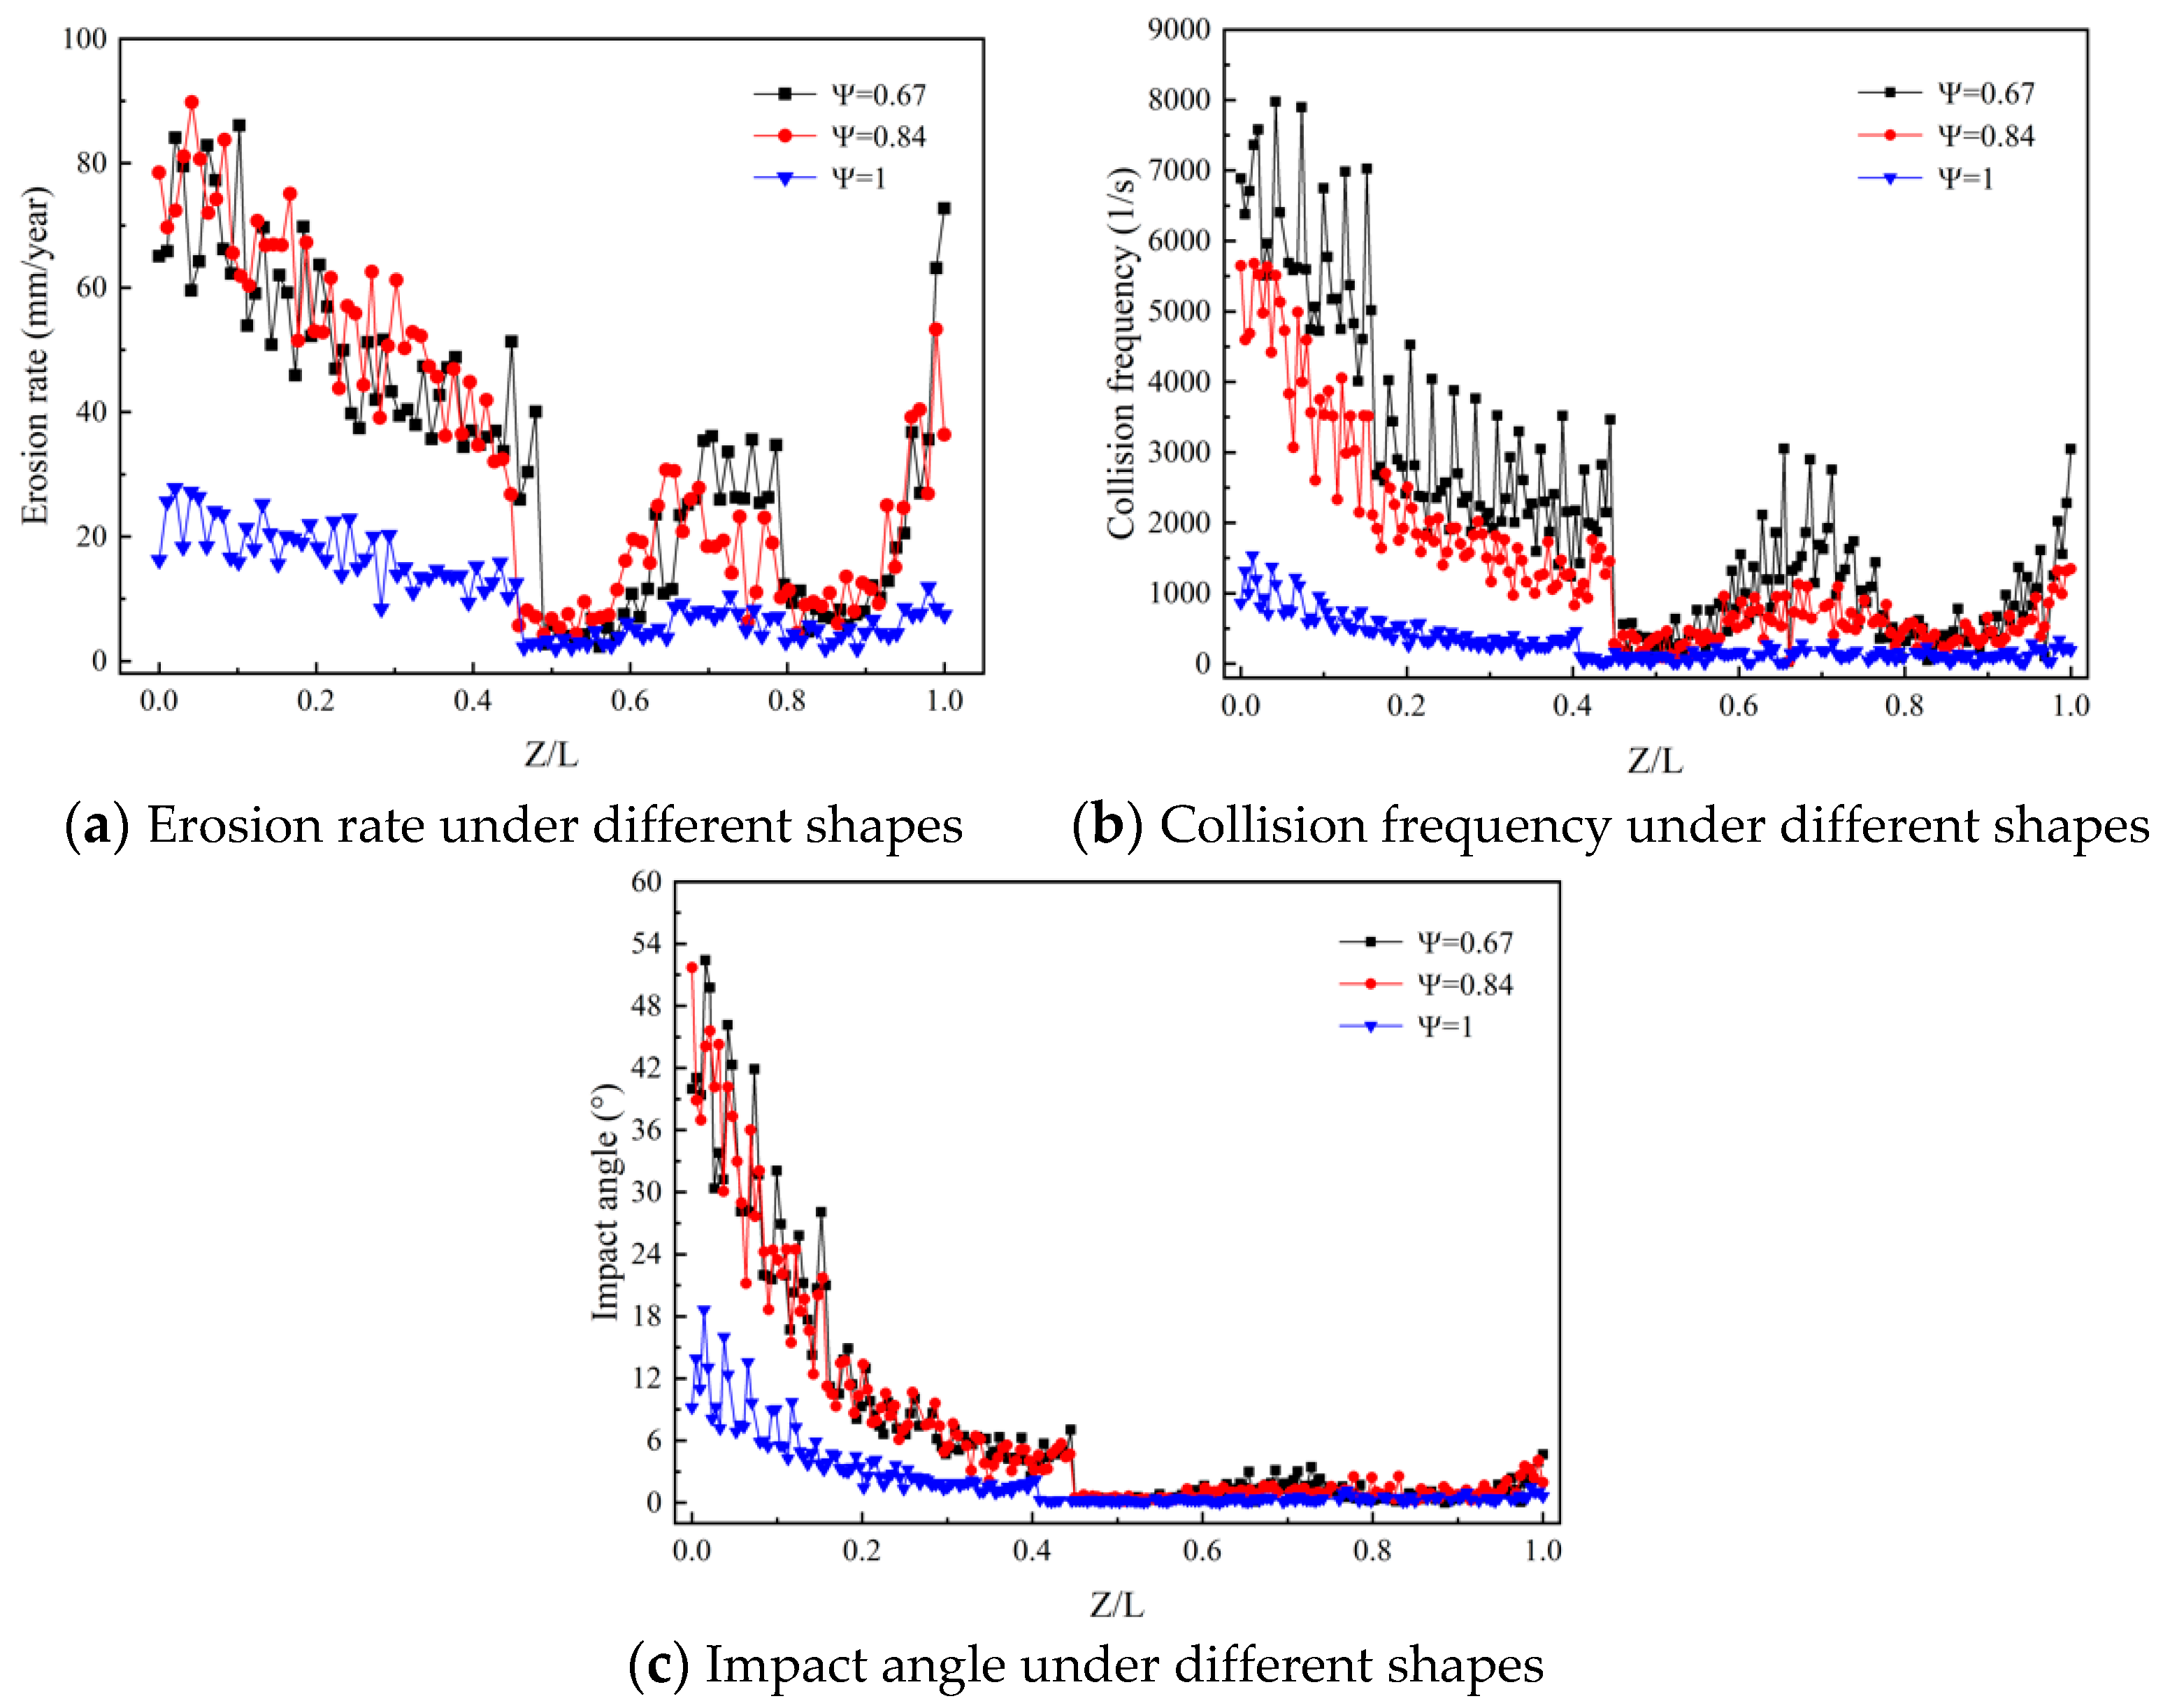
4.3. Effect of Particle Shape on the Pump Erosion

The effect of particle shape on pump erosion was studied since particles are often non-spherical in real working conditions. Three shapes, as shown in Figure 2, were modeled, and the resulting erosion on the hydraulic parts of the pump was predicted. In this section, particles of different shapes share the same particle volume so that the kinetic energy of the particles is constant at the same velocity. The simulated particle volume fraction is 0.5%. The specific model of the drag force expressed by Equation (13) is used for the non-spherical particles in the simulation.
The particle distributions in one flow passage of the pump impeller are presented in Figure 16. It is seen that the particles of Ψ = 0.67 tend to move along the pressure side of the blade, and fewer particles are distributed in the bulk flow of the passage. However, as the particle sphericity increases, the particles become more diffused in the passage. For the spherical particles, more particles are distributed in the bulk flow. It was found that the coefficient of the drag force is increased with the reducing particle sphericity. The more irregular particles bear a larger drag force and stronger interaction with the fluid. Therefore, the particles follow better with the flow streamlines.
Figure 17 shows the maximum annual erosion rates on different components of the pump suffering from particles of different shapes. It is seen that the erosion caused by non-spherical particles is larger than that by spherical ones, especially for the pressure side of the impeller blade. The erosion rate on the blade is 3~4 times larger than those on the other components. It is difficult to say the particles with the sharpest shape cause the most severe erosion since the erosion rates caused by the particles of Ψ = 0.84 on the impeller shroud and blade are the largest.
In order to estimate the effect of particle shape on the erosion of the pressure side of the blade, the erosion rate, collision frequency of the particle-wall collision, and the impact angle are statistically obtained by averaging these parameters along three streamwise curves on the pressure side of the blade. As shown in Figure 18, it is seen that the collision frequency and impact angle of the non-spherical particles are significantly larger than those of the spherical ones near the inlet and outlet of the blade. Since the erosion is increased with the increasing impact angle when the angle is below 50°, the erosion rate is larger, caused by the irregular particles. However, the differences between the two non-spherical particles are not distinct, and the difference in the resulting erosion rate is less significant.

5. Conclusions

In this work, a CFD-DEM numerical model was applied in a centrifugal pump to simulate erosion on different pump components. Different models of fluid-solid inter-phase forces were considered in the numerical model. The particle-turbulence interaction was also implemented in a home-made interface code and combined in the simulation. Different particle shapes were modeled in the particle modeling. The authenticity of the numerical model was systematically validated by comparing the liquid-solid two-phase field with the PIV measurement in the same pump. The predicted erosion rates in a 90° bend and the hydraulic part of the pump were validated with the measured erosion rate in a 90° bend under similar particle and hydrodynamic conditions.
The validated numerical model was then employed to simulate erosion in the studied pump. The effects of particle volume fraction, particle size, and particle shape on pump erosion were estimated by simulations. It was found that severe erosion occurs near the inlet and outlet of the pressure side of the impeller blade, the middle region of the blade, the joint corners of the shroud and hub of the impeller with the blade, and the volute near the pump tongue. Among these locations, the maximum erosion rate always occurs near the inlet of the pressure side of the impeller blade. The increase in the particle volume fraction brings in more particles in the impeller and pushes the particles along the pressure side of the blade. Mitigation of erosion rate is found in the case of a large particle volume fraction since more particles are accumulated in the near-wall region of the eroded surface and form a buffering layer to reduce the erosion. The particle size barely influences the particle distribution in the impeller. However, it is found that the relationship between the particle size and erosion is nonlinear, and the 1 mm particle causes the largest erosion rate compared to the 0.5 and 2 mm particles at the same volume fraction. Finally, the particle shape can influence the erosion rate. The sharper particles receive a larger drag force and tend to move along the pressure side of the blade. The resulting erosion rates on different components are larger than those caused by spherical particles. The collision frequency and impact angle of the non-spherical particles are also larger than those of the spherical ones. The difference between the two irregular particles is small, and the difference of the resulting erosion is less significant.

Author Contributions

Conceptualization, R.-J.Z. and Y.-L.Z.; methodology, R.-J.Z.; validation, Y.-L.Z., R.-J.Z. and Y.L.; formal analysis, Y.L.; investigation, L.-L.G.; resources, R.-J.Z. and D.-S.Z.; data curation, R.-J.Z.; writing—original draft preparation, R.-J.Z. and Y.-L.Z.; writing—review and editing, D.-S.Z. and L.-L.G. All authors have read and agreed to the published version of the manuscript.

Funding

This research was funded by “National Natural Science Foundation of China, grant number 51509110 and 51979125”; “China Postdoctoral Science Foundation, grant number 2020M672121”; “Aeronautical Science Fund, grant number 201728R3001”; “Primary Research & Development Plan of Shandong Province, grant number 2019TSLH0304.

Institutional Review Board Statement

Not applicable.

Informed Consent Statement

Not applicable.

Data Availability Statement

Data are contained within the article.

Acknowledgments

The authors are grateful for the financial support from the National Natural Science Foundation of China (Grant No.: 51509110 and 51979125), China Postdoctoral Science Foundation (No.: 2020M672121), the Aeronautical Science Fund (No.: 201728R3001), and the Primary Research & Development Plan of Shandong Province (No.: 2019TSLH0304).

Conflicts of Interest

The authors declare no conflict of interest.

References

  1. Wu, B.; Wang, X.L.; Liu, H.; Xu, H.L. Numerical simulation and analysis of solid-liquid two-phase three-dimensional unsteady flow in centrifugal slurry pump. J. Cent. South. Univ. 2015, 22, 3008–3016. [Google Scholar] [CrossRef]
  2. Gandhi, B.K.; Singh, S.N.; Seshadri, V. Performance Characteristics of Centrifugal Slurry Pumps. J. Fluid. Eng. 2001, 123, 271–280. [Google Scholar] [CrossRef]
  3. Glasby, G.P.; Li, J.; Sun, Z.L. Deep-Sea Nodules and Co-rich Mn Crusts. Mar. Georesour. Geotechnol. 2014, 33, 72–78. [Google Scholar] [CrossRef]
  4. Llewellyn, R.J.; Yick, S.K.; Dolman, K.F. Scouring erosion resistance of metallic materials used in slurry pump service. Wear 2004, 256, 592–599. [Google Scholar] [CrossRef]
  5. Ariely, S.; Khentov, A. Erosion corrosion of pump impeller of cyclic cooling water system. Eng. Fail. Anal. 2006, 13, 925–932. [Google Scholar] [CrossRef]
  6. Sharma, P. Premature failure of ductile iron pump impeller in cooling tower system. J. Fail. Anal. Prev. 2014, 14, 303–306. [Google Scholar] [CrossRef]
  7. Zhao, B.A.; Yuan, S.B.; Liu, H.B.; Huang, Z.C.; Tan, M.B. Simulation of solid-liquid two-phase turbulent flow in double-channel pump based on Mixture model. Trans. Chin. Soc. Agric. Eng. 2008, 24, 7–12. [Google Scholar]
  8. Zhang, Y.L.; Li, Y.; Cui, B.L.; Zhu, Z.C.; Dou, H.S. Numerical simulation and analysis of solid-liquid two-phase flow in centrifugal pump. Chin. Soc. Agric. Eng. 2013, 26, 53–60. [Google Scholar] [CrossRef]
  9. Lin, C.X.; Ebadian, M.A. A numerical study of developing slurry flow in the entrance region of a horizontal pipe. Comput. Fluids 2008, 37, 965–974. [Google Scholar] [CrossRef]
  10. Pagalthivarthi, K.V.; Gupta, P.K.; Tyagi, V.P.; Ravi, M.R. CFD Prediction of Erosion Wear in Centrifugal Slurry Pumps for Dilute Slurry Flows. J. Comput. Multiph. Flows 2011, 3, 225–246. [Google Scholar] [CrossRef] [Green Version]
  11. Shen, Z.J.; Li, R.N.; Han, W.; Zhao, W.G.; Wang, X.H. The research on particle trajectory of solid-liquid two-phase flow and erosion predicting in screw centrifugal pump. In Proceedings of the 7th International Conference on Pumps and Fans (icpf2015), Hangzhou, China, 18–21 October 2015; Volume 129, p. 012052. [Google Scholar]
  12. Huang, S.; Zhou, W.L.; Zhou, J.J.; He, D.P.; Peng, T.Y. Unsteady numerical simulation on solid-liquid flows and wear in a centrifugal pump based on DPM model. Hydromechatron. Eng. 2016, 44, 1–5. [Google Scholar]
  13. Guo, F.H.; Zhong, Z.P. CFD-DEM Numerical Simulation and Experimental Validation of Heat Transfer and Two-Component Flow in Fluidized Bed. Int. J. Chem. React. Eng. 2018, 16, 20160207. [Google Scholar] [CrossRef]
  14. Zhang, K.; Wang, S.; Li, B.W.; He, Y.R.; Zhao, Y.H. Heat transfer in a pulsed fluidized bed by using coupled CFD-DEM method. Powder Technol. 2020, 367, 497–505. [Google Scholar] [CrossRef]
  15. Ma, S.L.; Wei, Z.Y.; Chen, X.L. CFD-DEM combined the fictitious domain method with monte carlo method for studying particle sediment in fluid. Part. Sci. Technol. 2018, 36, 920–933. [Google Scholar] [CrossRef]
  16. Zhao, H.M.; Zhao, Y.Z. CFD–DEM simulation of pneumatic conveying in a horizontal channel. Int. J. Multiph. Flows 2019, 118, 64–74. [Google Scholar] [CrossRef]
  17. Zhou, M.M.; Wang, S.; Kuang, S.B.; Luo, K.; Fan, J.R.; Yu, A.B. CFD-DEM modelling of hydraulic conveying of solid particles in a vertical pipe. Powder Technol. 2019, 354, 893–905. [Google Scholar] [CrossRef]
  18. Faris, S.B.; Thiana, A.S.; Siamack, A.S. Experimental and CFD investigations of 45 and 90 degrees bends and various elbow curvature radii effects on solid particle erosion. Wear 2021, 476, 203646. [Google Scholar]
  19. Zhang, Y.; Reuterfors, E.P.; Mclaury, B.S. Comparison of computed and measured particle velocities and erosion in water and air flows. Wear 2007, 263, 330–338. [Google Scholar] [CrossRef]
  20. Peng, W.S.; Cao, X.W. Numerical simulation of solid particle erosion in pipe bends for liquid–solid flow. Powder Technol. 2016, 294, 266–279. [Google Scholar] [CrossRef]
  21. Zeng, L.; Zhang, G.A.; Guo, X.P. Erosion–corrosion at different locations of X65 carbon steel elbow. Corros. Sci. 2014, 85, 318–330. [Google Scholar] [CrossRef]
  22. Sommerfeld, M. Best Particle Guidelines for Computational Fluid Dynamics of Dispersed Multiphase Flows. Ercoftac 2008. Available online: https://www.researchgate.net/publication/313747319_Best_Practice_Guidelines_for_Computational_Fluid_Dynamics_of_Dispersed_Multi-Phase_Flows (accessed on 30 August 2021).
  23. Dhariwal, D.; Bragg, A.D. Small-scale dynamics of settling, bidisperse particles in turbulence. J. Fluid Mech. 2018, 839, 594–620. [Google Scholar] [CrossRef] [Green Version]
  24. Brian, S. Turbulent relative dispersion. Annu. Rev. Fluids Mech. 2001, 33, 289–317. [Google Scholar]
  25. Balachandar, S.; Eaton, J.K. Turbulent dispersed multiphase flow. Ann. Rev. Fluids Mech. 2001, 42, 111–133. [Google Scholar] [CrossRef]
  26. Toschi, F.; Eberhard, B. Lagrangian properties of particles in turbulence. Ann. Rev. Fluids Mech. 2009, 41, 375–404. [Google Scholar] [CrossRef]
  27. Shi, B.C.; Wei, J.J.; Zhang, Y. A novel experimental facility for measuring internal flow of Solid-liquid two-phase flow in a centrifugal pump by PIV. Int. J. Multiph. Flows 2017, 89, 266–276. [Google Scholar] [CrossRef]
  28. Liu, J.W.Y.; Liu, S.Y.C.; Du, L.; Li, J.P. Effects of particle shape and swirling intensity on elbow erosion in dilute-phase pneumatic conveying. Wear 2017, 380–381, 66–77. [Google Scholar]
  29. Crowe, C.T.; Schwarzkopf, J.; Sommerfeld, D.M.; Tsuji, Y. Multiphase Flows with Droplets and Particles, 2nd ed.; 2011; Available online: https://www.researchgate.net/publication/313747306_Multiphase_flows_with_droplets_and_particles (accessed on 30 August 2021).
  30. Felice, D.R. The voidage function for fluid-particle interaction systems. Int. J. Multiph. Flows 1994, 20, 153–159. [Google Scholar] [CrossRef]
  31. Haider, A.; Levenspiel, O. Drag coefficient and terminal velocity of spherical and non-spherical particles. Powder Technol. 1989, 58, 63–70. [Google Scholar] [CrossRef]
  32. Saffman, P.G. The lift on a small sphere in a slow shear flow. J. Fluids Mech. 1965, 22, 385–400. [Google Scholar] [CrossRef] [Green Version]
  33. Oesterle, B.; Dinh, T.B. Experiments on the lift of a spinning sphere in a range of intermediate Reynolds numbers. Exp. Fluids 1998, 25, 16–22. [Google Scholar] [CrossRef]
  34. Uzi, A.; Levy, A. Flow characteristics of coarse particles in horizontal hydraulic conveying. Powder Technol. 2018, 326, 302–321. [Google Scholar] [CrossRef]
  35. Loth, E.; Dorgan, A.J. An equation of motion for particles of finite Reynolds number and size. Environ. Fluids Mech. 2009, 9, 187–206. [Google Scholar] [CrossRef]
  36. Cundall, P.A.; Strack, D.L. A discrete numerical model for granular assemblies. Geotechnique 1980, 30, 331–336. [Google Scholar] [CrossRef] [Green Version]
  37. Gosman, A.D.; Loannides, E. Aspects of Computer Simulation of Liquid-Fueled Combustors. Energy J. 1983, 7, 482–490. [Google Scholar] [CrossRef]
  38. Gao, X.F.; Zhao, W.D.R.J.; Zhao, T.L.; Wang, H.F. Optimization Design and Internal Flow Field Study of Open-Design Vortex Pump. Shock. Vib. 2021, 2021, 1–11. [Google Scholar]
  39. Uuemois, H.; Kleis, I. A critical analysis of erosion problems which have been little studied. Wear 1975, 31, 59–371. [Google Scholar] [CrossRef]
  40. Duarte, C.A.R.; Souza, F.J.D.; Salvo, R.D.V.; Santos, V.F.D. The role of inter-particle collisions on elbow erosion. Int. J. Multiph. Flows 2017, 89, 1–22. [Google Scholar] [CrossRef]
Figure 1. 3D geometry of the pump model.
Jmse 09 00961 g001
Figure 2. Modeled particles with different sphericity.
Jmse 09 00961 g002
Figure 3. Meshes in the fluid domains of the impeller and volute.
Jmse 09 00961 g003
Figure 4. Comparison of the velocity fields in the case of clean water between the PIV and CFD results. (a) PIV result obtained from; (b) CFD result.
Jmse 09 00961 g004
Figure 5. Comparison of the velocities of liquid and solid phases near the pressure side of the blade between the PIV and CFD-DEM results.
Jmse 09 00961 g005
Figure 6. Schematics of the simulated 90° bend (a) and the mesh (b) employed in the simulation.
Jmse 09 00961 g006
Figure 7. Comparison of the erosion rates in the 90° bend between the simulation and experimental results.
Jmse 09 00961 g007
Figure 8. Comparison of the predicted erosion rate on the pressure side of the blade and along the extrados of the bend measured in Zeng’s experiment.
Jmse 09 00961 g008
Figure 9. Contours of the predicted annual erosion rate on different components of the pump under different particle volume fractions. (a) Impeller shroud; (b) Impeller hub; (c) Impeller blade; (d) Volute.
Jmse 09 00961 g009aJmse 09 00961 g009b
Figure 10. Maximum erosion rates on different components of the pump under different working flow rates and particle volume fractions. (a) Maximum erosion at the different flow rates under 0.1% particle volume fraction; (b) Maximum erosion at the different flow rates under 0.5% particle volume fraction; (c) Maximum erosion at the different flow rates under 2.5% particle volume fraction.
Jmse 09 00961 g010aJmse 09 00961 g010b
Figure 11. Curves of the erosion rates on the impeller blade and volute with the varying particle concentration under different working flow rates.
Jmse 09 00961 g011
Figure 12. Particle distribution in one flow passage of the pump impeller under different particle volume fractions.
Jmse 09 00961 g012
Figure 13. Distributions of particles of different sizes in one flow passage of the pump impeller.
Jmse 09 00961 g013
Figure 14. Maximum erosion rates on different components of the pump with particles of different sizes.
Jmse 09 00961 g014
Figure 15. Curves of erosion rates on the impeller blade and volute with varying particle sizes.
Jmse 09 00961 g015
Figure 16. Distributions of the particles of different shapes in one flow passage of the pump impeller.
Jmse 09 00961 g016
Figure 17. Maximum erosion rates on different components of the pump with particles of different shapes.
Jmse 09 00961 g017
Figure 18. Distributions of erosion rate, collision frequency, and impact angle along the pressure side of the blade with particles of different shapes. (a) Erosion rate under different shapes; (b) Collision frequency under different shapes; (c) Impact angle under different shapes.
Jmse 09 00961 g018
Table 1. Parameters of the pump model.
Pump Parameters, UnitValue
Pump head, m4
Rated flow rate, m3/h15
Rotation speed, rpm900
Number of impeller blades5
Diameter of the pump inlet, mm65
Axis diameter, mm25
Outlet width of impeller, mm18
Shaft diameter, mm25
Impeller diameter, mm180
Table 2. Comparison of the simulated results from different grids.
Mesh Number#1#2#3
Element number383,0541,303,6504,633,082
Pump head, m4.544.464.47
Pressure at MP1 in impeller, Pa1.58 × 1041.42 × 1041.41 × 104
Velocity at MP1 in impeller, m/s3.323.263.28
Pressure at MP2 in volute, Pa3.26 × 1043.12 × 1043.14 × 104
Velocity at MP2 in volute, m/s5.585.435.41
Table 3. Parameters used in the simulation of erosion model validation.
Physical QuantitiesValue
ParticlesDensity2650 kg/m3
Diameter0.5 mm
Poisson’s ratio0.23
Young’s modulus5.9 × 1010 Pa
Conveying velocity4 m/s
Mass flow rate0.235 kg/s
WallDensity8200 kg/m3
Hardness3.43 GP
Poisson’s ratio0.3
Young’s modulus200 GPa
Publisher’s Note: MDPI stays neutral with regard to jurisdictional claims in published maps and institutional affiliations.

