Article

The Quasi-Static Response of Moored Floating Structures Based on Minimization of Mechanical Energy

1
Key Laboratory of High Performance Ship Technology (Wuhan University of Technology), Ministry of Education, Wuhan 430063, China
2
School of Naval Architecture, Ocean and Energy Power Engineering, Wuhan University of Technology, Wuhan 430063, China
3
Department of Naval Architecture and Ocean Engineering, Inha University, Incheon 22212, Korea
*
Author to whom correspondence should be addressed.
J. Mar. Sci. Eng. 2021, 9(9), 960; https://doi.org/10.3390/jmse9090960
Submission received: 1 August 2021 / Revised: 28 August 2021 / Accepted: 31 August 2021 / Published: 3 September 2021
(This article belongs to the Special Issue Design and Analysis of Offshore Structures)

Abstract

:
It is essential to design a reasonable mooring line length that ensures quasi-static responses of moored floating structures are within an acceptable level, and that reduces the cost of mooring lines in the overall project. Quasi-static responses include the equilibrium position and the line tension of a moored floating structure (also called the mean value in a dynamic response), etc. The quasi-static responses derived by the classic catenary equation cannot present mooring–seabed interaction and hydrodynamic effects on a mooring line. While a commercial program can predict reasonable quasi-static responses, costly modeling is required. This motivated us to propose a new method for predicting quasi-static responses that minimizes the mechanical energy of the whole system based on basic geometric parameters, and that is easy to implement. In this study, the mechanical energy of moored floating structures is assumed to be the sum of gravitational–buoyancy potential energy, kinetic energy induced by drag forces, and spring potential energy derived by line tension. We introduce fundamental theoretical background for the development of the proposed method. We investigate the effect of quasi-static actions on mooring response, comparing the proposed method’s results with those from the catenary equation and ABAQUS software. The study reveals the shortcomings of the catenary equation in offshore applications. We also compare quasi-static responses derived by the AQWA numerical package with the results calculated from the proposed method for an 8 MW WindFloat 2 type of platform. Good agreement was drawn between the proposed method and AQWA. The proposed method proves more timesaving than AQWA in terms of modeling of mooring lines and floaters, and more accurate than the catenary equation, and can be used effectively in the early design phase of dimension mooring lengths for moored floating structures.

1. Introduction

Fossil fuels on land can no longer meet the demands from industrial activities, so the focus has shifted to oil/gas reserves from the deep and ultra-deep sea. This has prompted researchers to innovate various floating platforms suitable for deep water. A floating platform without any restraint devices presents large horizontal offsets along the environment actions. Therefore, mooring systems are widely used to constrain the movements and rotations of floating platforms to within an allowable range for production operations. Cost-effectiveness is the primary design parameter for deep-sea mooring systems [1]. The cost of a mooring system constitutes around 18–30% of the overall project cost [2]. It is well known that minimization of mooring line length is the most direct way to reduce the cost of a mooring system. Therefore, it is essential to calculate a reasonable mooring line length that ensures that quasi-static responses of moored floating structures are within an acceptable level in order to reduce the project cost without affecting performance.
The quasi-static approach was proven to be a proper tool for mooring line length calculations in preliminary stages [3,4,5]. Jain [6] proposed a classic catenary equation to calculate the quasi-static profile of the mooring line in terms of basic parameters. Agarwal and Jain [7] modified the classic catenary equation to evaluate the quasi-static response of a slacked mooring line that hangs freely under its own weight of unit length. Additionally, frictionless support for a mooring line lying on the seabed was presented. Vicente et al. [8] applied the classic catenary equation to investigate geometric parameters on the quasi-static response of a mooring line that was installed in a wave energy converter. The geometric parameters included mooring line length and mooring line projection from the fairlead to the anchor. They also optimized the geometric parameters that can produce better power absorption. Montasir et al. [9] investigated the effect of symmetric and asymmetric mooring configurations on the quasi-static response of truss spar platforms based on the approach suggested by Agarwal and Jain [7]. The Mooring Analysis Program (MAP) was developed by the National Renewable Energy Laboratory (NREL) based on solving the Catenary equation iteratively [10]. The MAP analyzes the effect of seabed contact, seabed friction, and externally applied forces on quasi-static response. However, it cannot investigate the mooring response under drag forces [11,12]. However, the Catenary equation presents some limitations: (a) buoyancy is considered by reducing the self-weight; (b) drag forces on the mooring line are negligible; (c) contact forces between mooring line and seabed are not considered; (d) only the horizontal displacement of a mooring line is considered [7,9].
There are several software packages that can be used to implement quasi-static analysis for moored floating structures. The AQWA numerical package [13] is usually used, which is a suite of engineering analysis tools for investigating the effects of waves, wind, and current on floating, fixed, and moored floating structures [14]. AQWA consists of several modules, such as LINE, LIBRIUM, FER, DRIFT, and NAUT. The quasi-static response of moored floating structures is calculated by the LIBRIUM module, which first receives hydrodynamic coefficients derived by the LINE module, and then calculates equilibrium position based on those. Therefore, modeling and analysis of a mooring system based on the Aqwa need a longer procedure. Bhinder et al. [15] investigated the effect of the mooring configuration on the response of a wave energy converter using different numerical packages, including AQWA. Angelelli et al. [16] performed an experimental and numerical study on fairlead reaction forces and displacements of a body energy converter. The numerical simulations were done with AQWA code. Murphy et al. [17] examined the quasi-static performance from mooring systems of wave energy converters in varying tidal ranges using AQWA suites. These studies confirmed that AQWA is able to accurately predict the quasi-static response of a mooring line.
The primary objective of this study is to propose a new and easy-to-use method that can predict reasonable quasi-static responses of moored floating structures. The proposed method utilizes a genetic algorithm to minimize the mechanical energy of moored floating structures through basic geometric parameter definitions. Mechanical energy is considered the sum of gravitational–buoyancy potential energy, drag force–induced kinetic energy, and line tension–induced spring potential energy. The principal of minimum potential energy suggests that stable equilibrium minimizes potential energy. The proposed method was validated with two cases (a suspended mooring line and the WindFloat 2 type of floating platform), comparing the Catenary equation, ABAQUS software, and AQWA suites.

2. Theoretical Backgrounds of the Proposed Method

The movements of a moored floating structure are accompanied by conversion of potential energy and kinetic energy. The sum of the potential energy and kinetic energy is called mechanical energy. In physics, potential energy is divided into gravitational potential energy and spring potential energy. As is well known, mechanical energy is at a minimum if the moored floating structure is in stable equilibrium. This motivated us to minimize the mechanical energy to determine reasonable quasi-static displacements of moored floating structures.

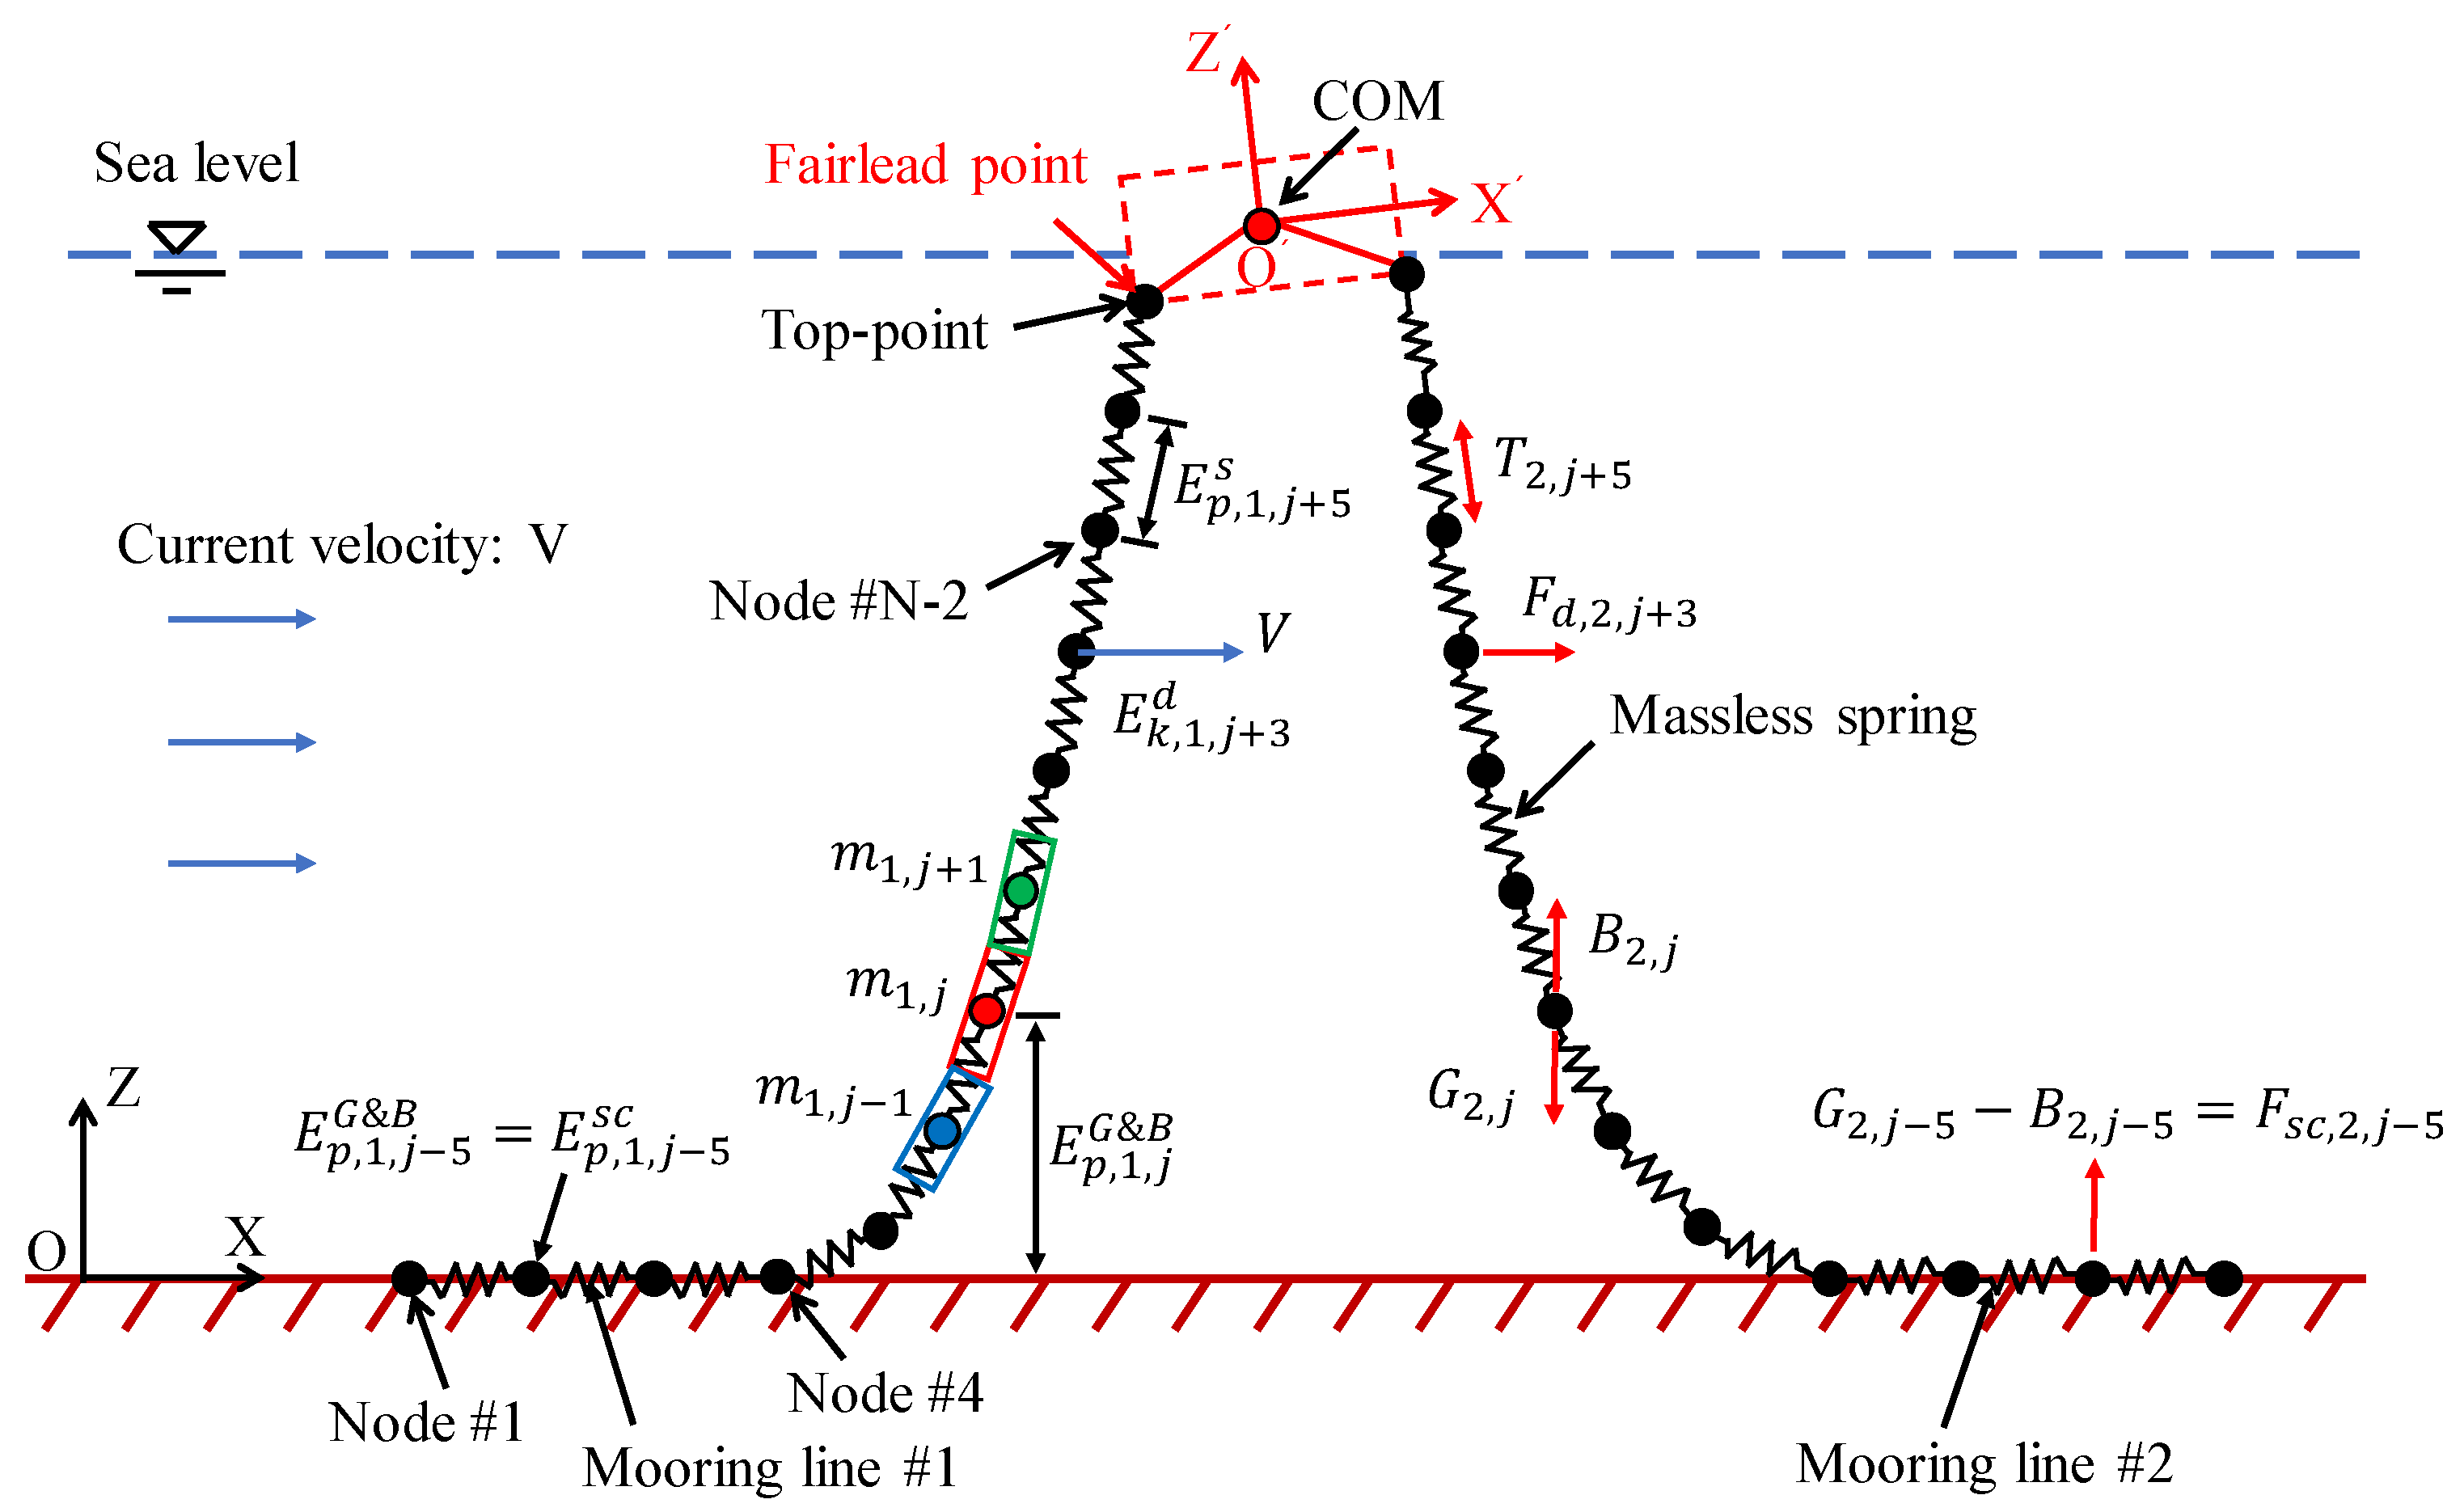
2.1. Moored Floating Structure Architecture

Moored floating structures can be simplified into a multi-point architecture, as shown in Figure 1. Each mooring line is equally discrete to N nodes, which are connected with massless springs [18]. The response of a floating structure is represented by that of a node at center of mass ( C O M ). This study selected two coordinate systems to track all nodes. An inertial coordinate system ( Z O X ) was fixed on the seabed with the z-axis being positive (up from the seabed). Additionally, a body-fixed coordinate system ( Z O X ) was defined at the C O M , which translates and rotates with the floating structure. In order to simulate coupling between mooring line and floating structure, the fairlead points based on the body-fixed coordinate system were constrained by the top-points of the mooring lines in the inertial coordinate system using the Euler transform matrix. The combination of the two coordinate systems provides a reasonable way to track C O M and mooring nodes in the inertial coordinate system, despite complicated movements of a moored floating structure.

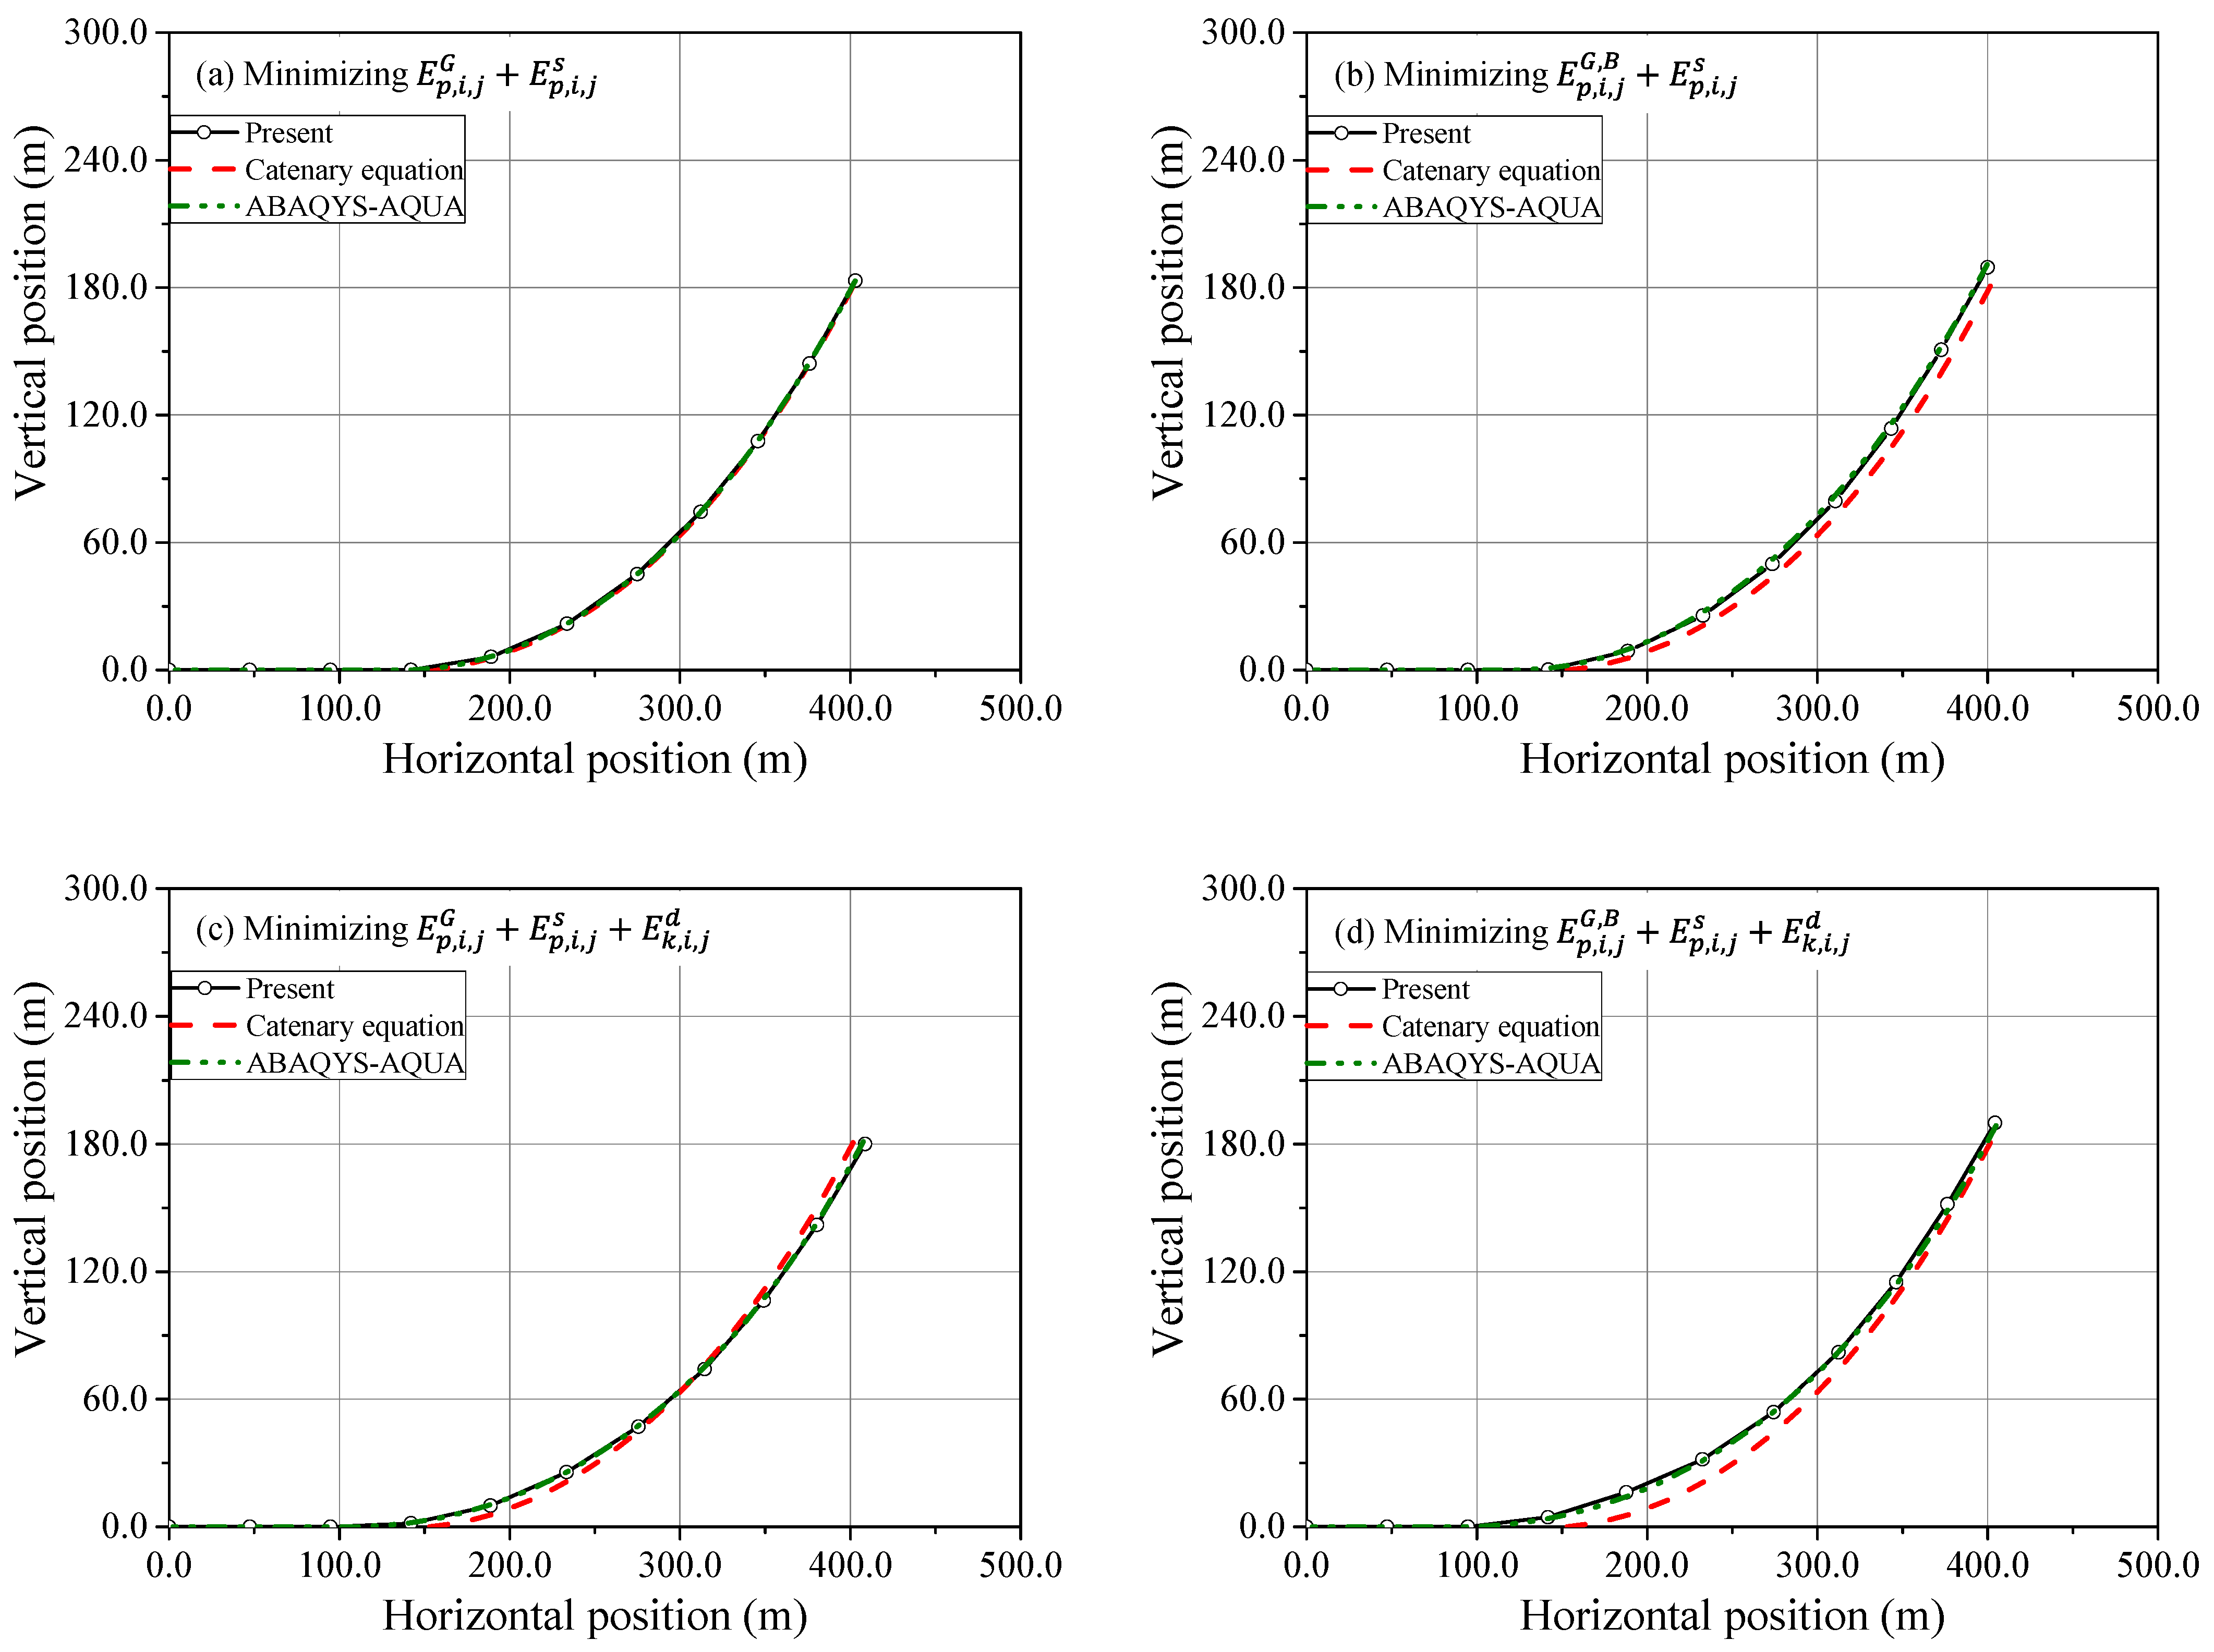
2.2. Mechanical Energy Induced by Quasi-Static Forces

The proposed method assumes that quasi-static forces are divided into gravitational ( G ) and buoyancy ( B ) forces, drag force ( F d ), line tension ( T ), and seabed contact ( F s c ), which are lumped at each node, including the COM. The lumped masses ( m i , j ) on the mooring node were determined by equally averaging those of the adjacent segments, where subscripts i and j indicate the ith mooring line and the jth mooring node, respectively. Figure 1 illustrates the mechanical energy produced by each quasi-static force. The gravitational–buoyancy potential energy ( E p , i , j G & B ) induced by the sum force of lumped gravitational ( G i , j ) and buoyancy ( B i , j ) potential energy is given in Equation (1), where ρ w is fluid density, ρ is density of the mooring line, g is gravity acceleration, A is the equivalent cross-sectional area of a segment, l is the unstretched length of the segment, and r i , j is a nodal position vector that consists of the x , y , and z coordinates ( r i , j , x , r i , j , y , and r i , j , z ) in the inertial coordinate system. The potential energy ( E p , i , j s c ) determined by seabed contact is derived using Equation (1) with r i , j , z equal to zero. In this way, the potential energy ( E p , C O M G & B ) produced by the gravitational ( G C O M ) and buoyancy ( B C O M ) potential energy of the floating structure is summarized in Equation (2). It well known that drag force contributes energy loss in motion [19]. Additionally, the Morison’s equation also presents that the drag force can affect the mechanical energy of mooring line only. The kinetic energy ( E k , i , j d ) induced by drag force is calculated based on Morison’s equation, as shown in Equation (3) where C d is the drag coefficient, vector V is current flow velocity, and r ˙ i , j is a nodal velocity vector. Here, we assume that r ˙ i , j is zero because the mooring line is static in stable equilibrium. Each mooring node is connected by a massless spring with a spring constant ( k ). The spring potential energy ( E p , i , j s ) is stored as the result of deformation of the massless spring. It describes the work done to stretch the spring and depends on the spring constant and deformation ( Δ l i , j ) stretched, as given in Equation (4) where E is the Young’s modulus of the mooring line.
E p , i , j G & B = [ 0 0 B i , j G i , j ] · r i , j = [ 0 0 ( ρ w ρ ) g A l ] · [ r i , j , x r i , j , y r i , j , z ]
E p , C O M G & B = [ 0 0 B C O M G C O M ] · r C O M
E k , i , j d = 1 2 C d ρ w A l | V r ˙ i , j | ( V r ˙ i , j ) = 1 2 C d ρ w A l V 2
E p , i , j s = 1 2 · k · Δ l i , j 2 = 1 2 · A E l · ( | r i , j r i , j 1 | l ) 2

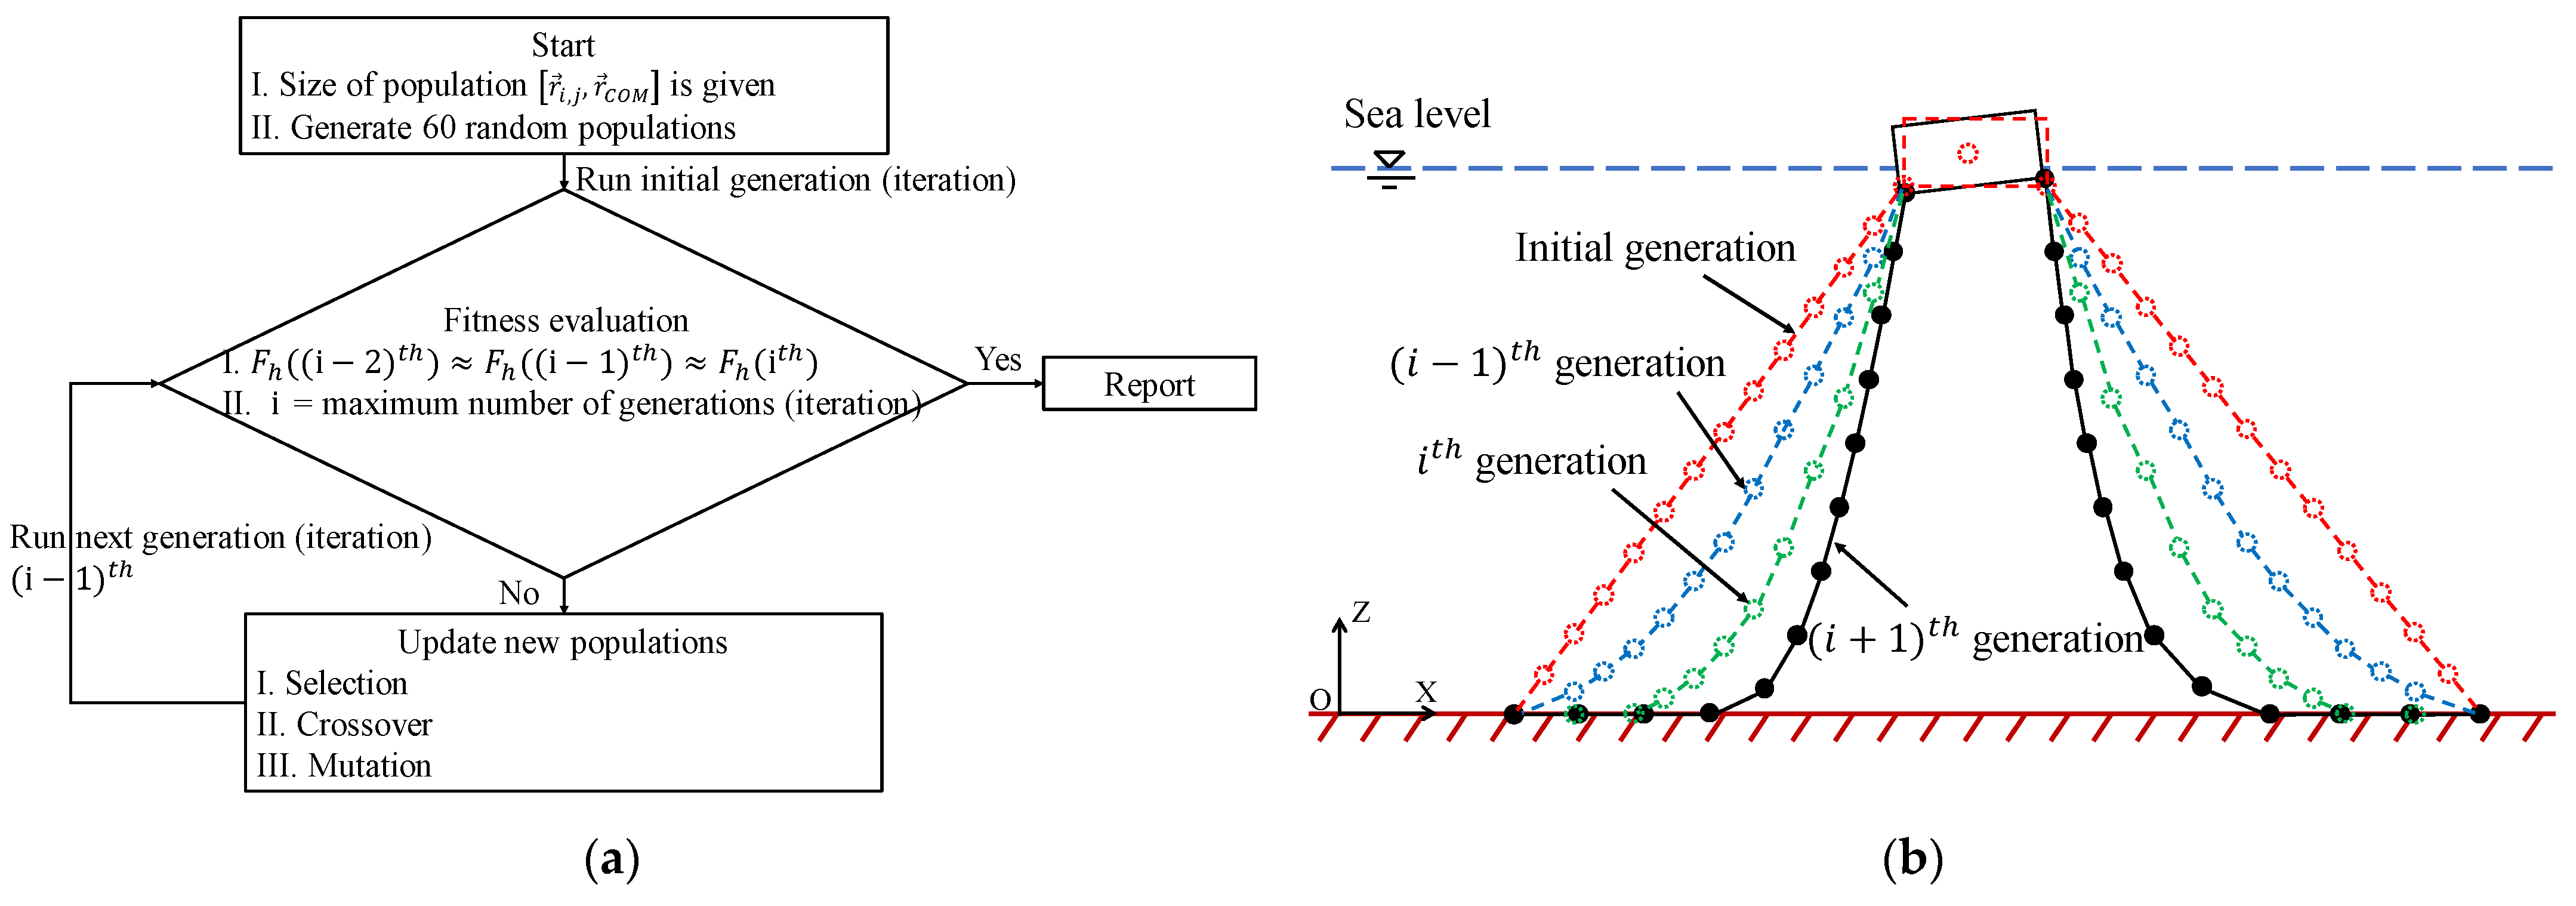
2.3. Minimization of Mechanical Energy

The prediction of quasi-static response was carried out in Matlab v2020a [20], utilizing a genetic algorithm (GA) to minimize the mechanical energy of the moored floating structure. The GA is a local search method that finds optimized solutions to problems using the principles of natural selection and evolution. The process of GA optimization requires an objective function ( E ), a fitness function ( F ), a penalty function ( P ), and several constraints. The objective function is defined as the mechanical energy of the moored floating structure, as shown in Equation (5) where M is the number of mooring lines. The stable equilibrium position of r i , j and r C O M are subjected to several constraints where their z coordinate ( r i , j , z and r c o m , z ) is larger than zero, as presented in Equation (6), and each segment deformation has to be greater than, or equal to, its unstretched length, as expressed in Equation (7). The GA calculation process shows that each iteration (generation) selects solutions of r i , j and r C O M with a higher fitness value for recalculation in the next iteration (generation) until convergence is achieved. A fitness function is defined for transforming the objective value minimization problem into a fitness value maximization problem, as shown in Equation (8), where P is the penalty value. The penalty function denotes no penalty value if each segment deformation is greater than, or equal to, its unstretched length; otherwise, a penalty value exists, as defined in Equation (9). The fitness function combined with the penalty function indicates that more segments will lower the fitness value if they do not satisfy Equation (7). Therefore, the solutions with the lowest fitness values can be gradually eliminated.
E ( r i , j , r C O M ) = E p , C O M G & B + j = 1 M i = 1 N ( E p , i , j G & B + E k , i , j d + E p , i , j s )
r i , j , z > 0 ;   r c o m , z > 0
| r i , j r i , j 1 | l
F = 1 E ( r i , j , r C O M ) · P
P = 1 + 4 j = 1 M i = 1 N 0 1 = | r i , j r i , j 1 | l | r i , j r i , j 1 | < l  
The flowchart of the GA process is depicted in Figure 2a. An initial population (solution) is defined by the positions of the C O M ( r C O M ) and of multi-nodes ( r i , j ), which are uniformly distributed on a straight line from the fairlead point to the anchor point. With the size of the initial population, 60 populations were generated randomly. The populations were ranked based on their fitness value. A portion of the population with higher fitness values was selected for parents, and another portion of the population with higher fitness values was selected for migration. With the GA parameters presented in Table 1, the new populations were updated by repeating the selection, crossover, and mutation processes. New populations were again evaluated based on their fitness. The procedure was repeated until the highest fitness ( F h ) of the previous three generations was similar, or the maximum number of generations was achieved.

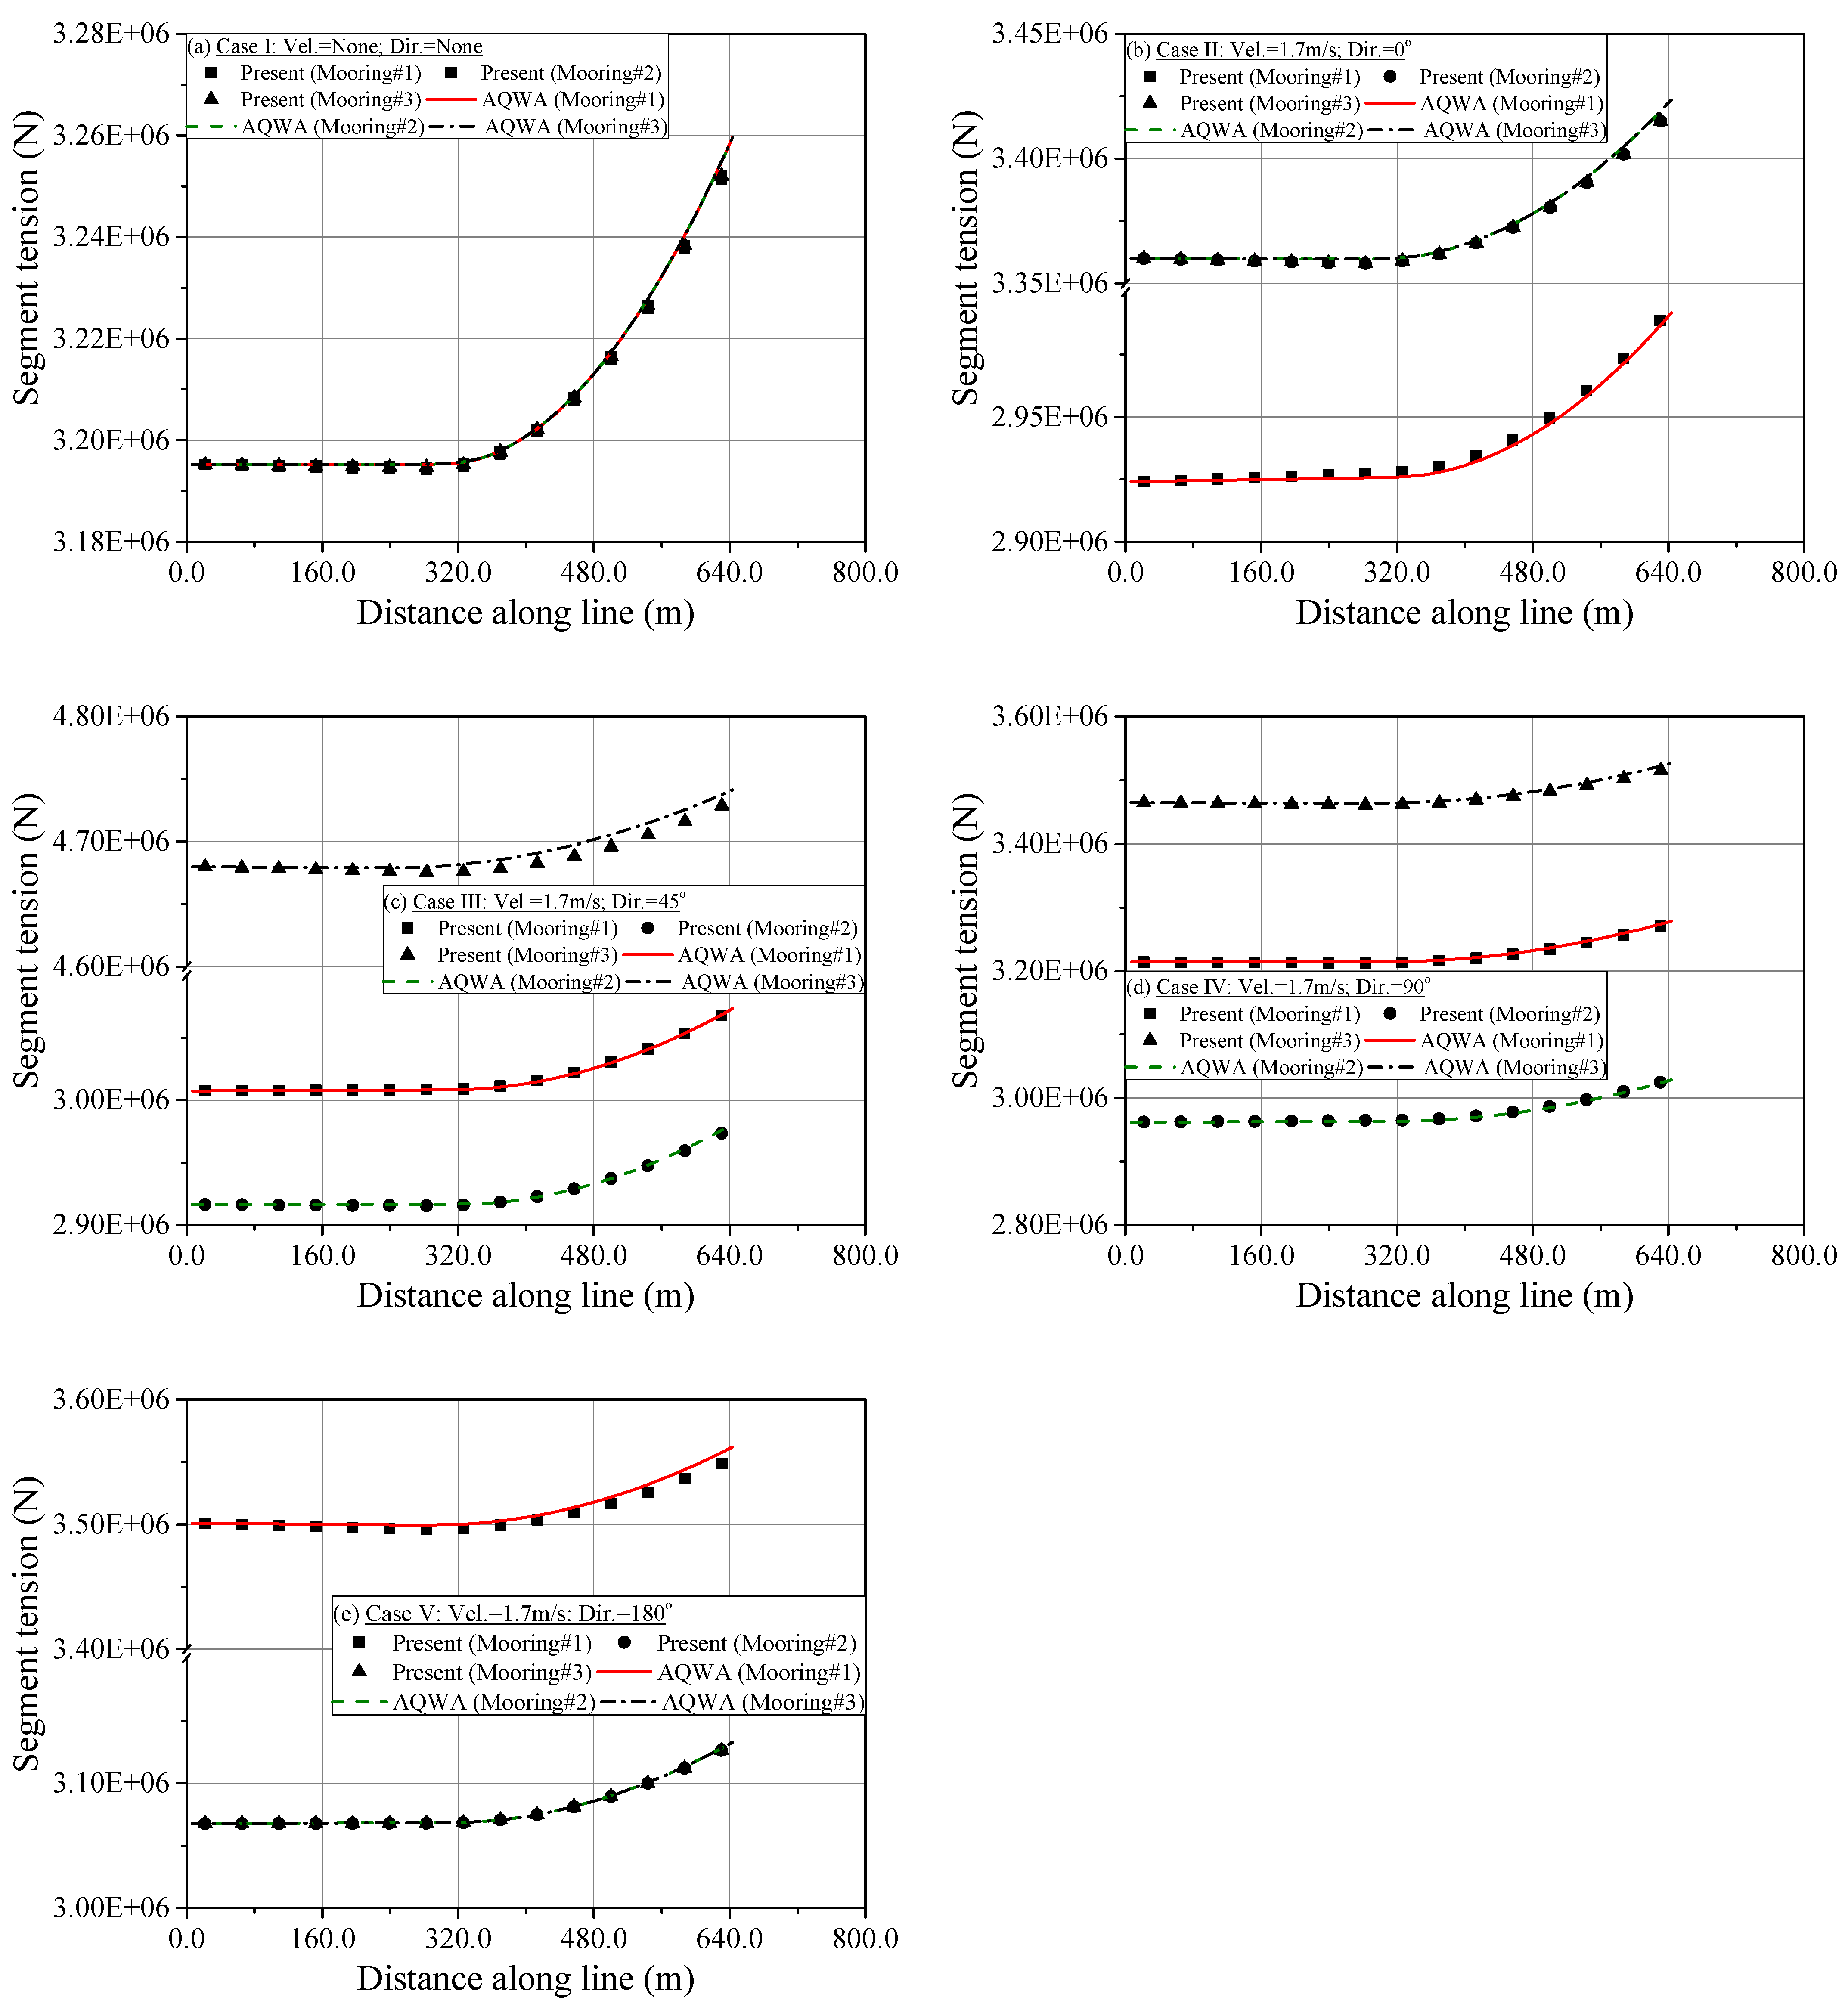
3. Validation and Case Studies

Two verification cases checked the rationality of the proposed method. First, the proposed method predicted the quasi-static response of a suspended mooring line. The Catenary equation and ABAQUS software were used to validate the proposed method, which minimized the sum of gravitational and spring potential energy. The effects of drag kinetic energy and buoyancy potential energy on the quasi-static response of the suspended mooring line were also investigated. Second, the quasi-static responses for the WindFloat 2 type of 8 MW platform were investigated by using the proposed method, which minimized all assumed mechanical energy. The stable equilibrium predicted by the proposed method agreed well with that calculated by the AQWA commercial program.

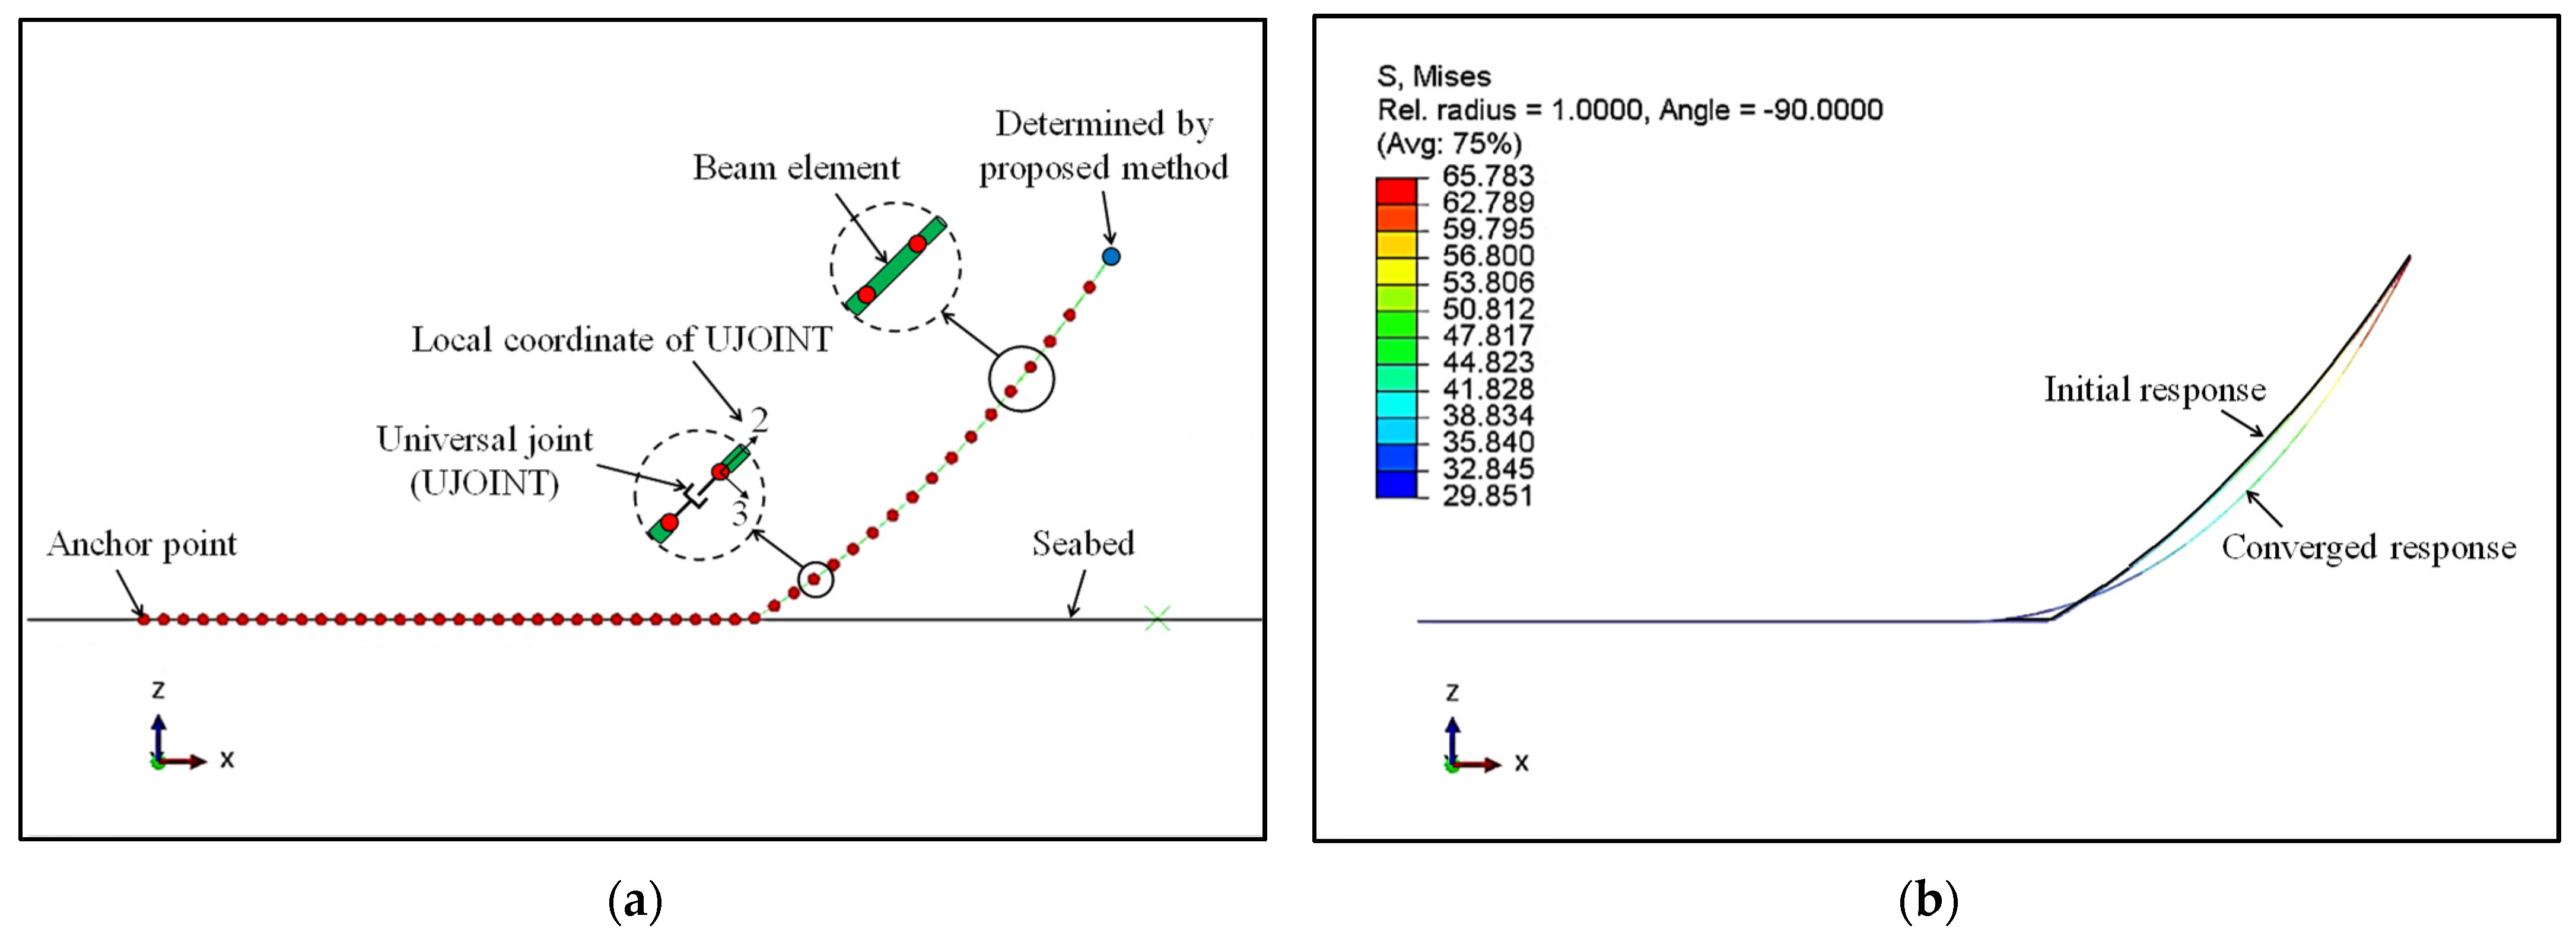
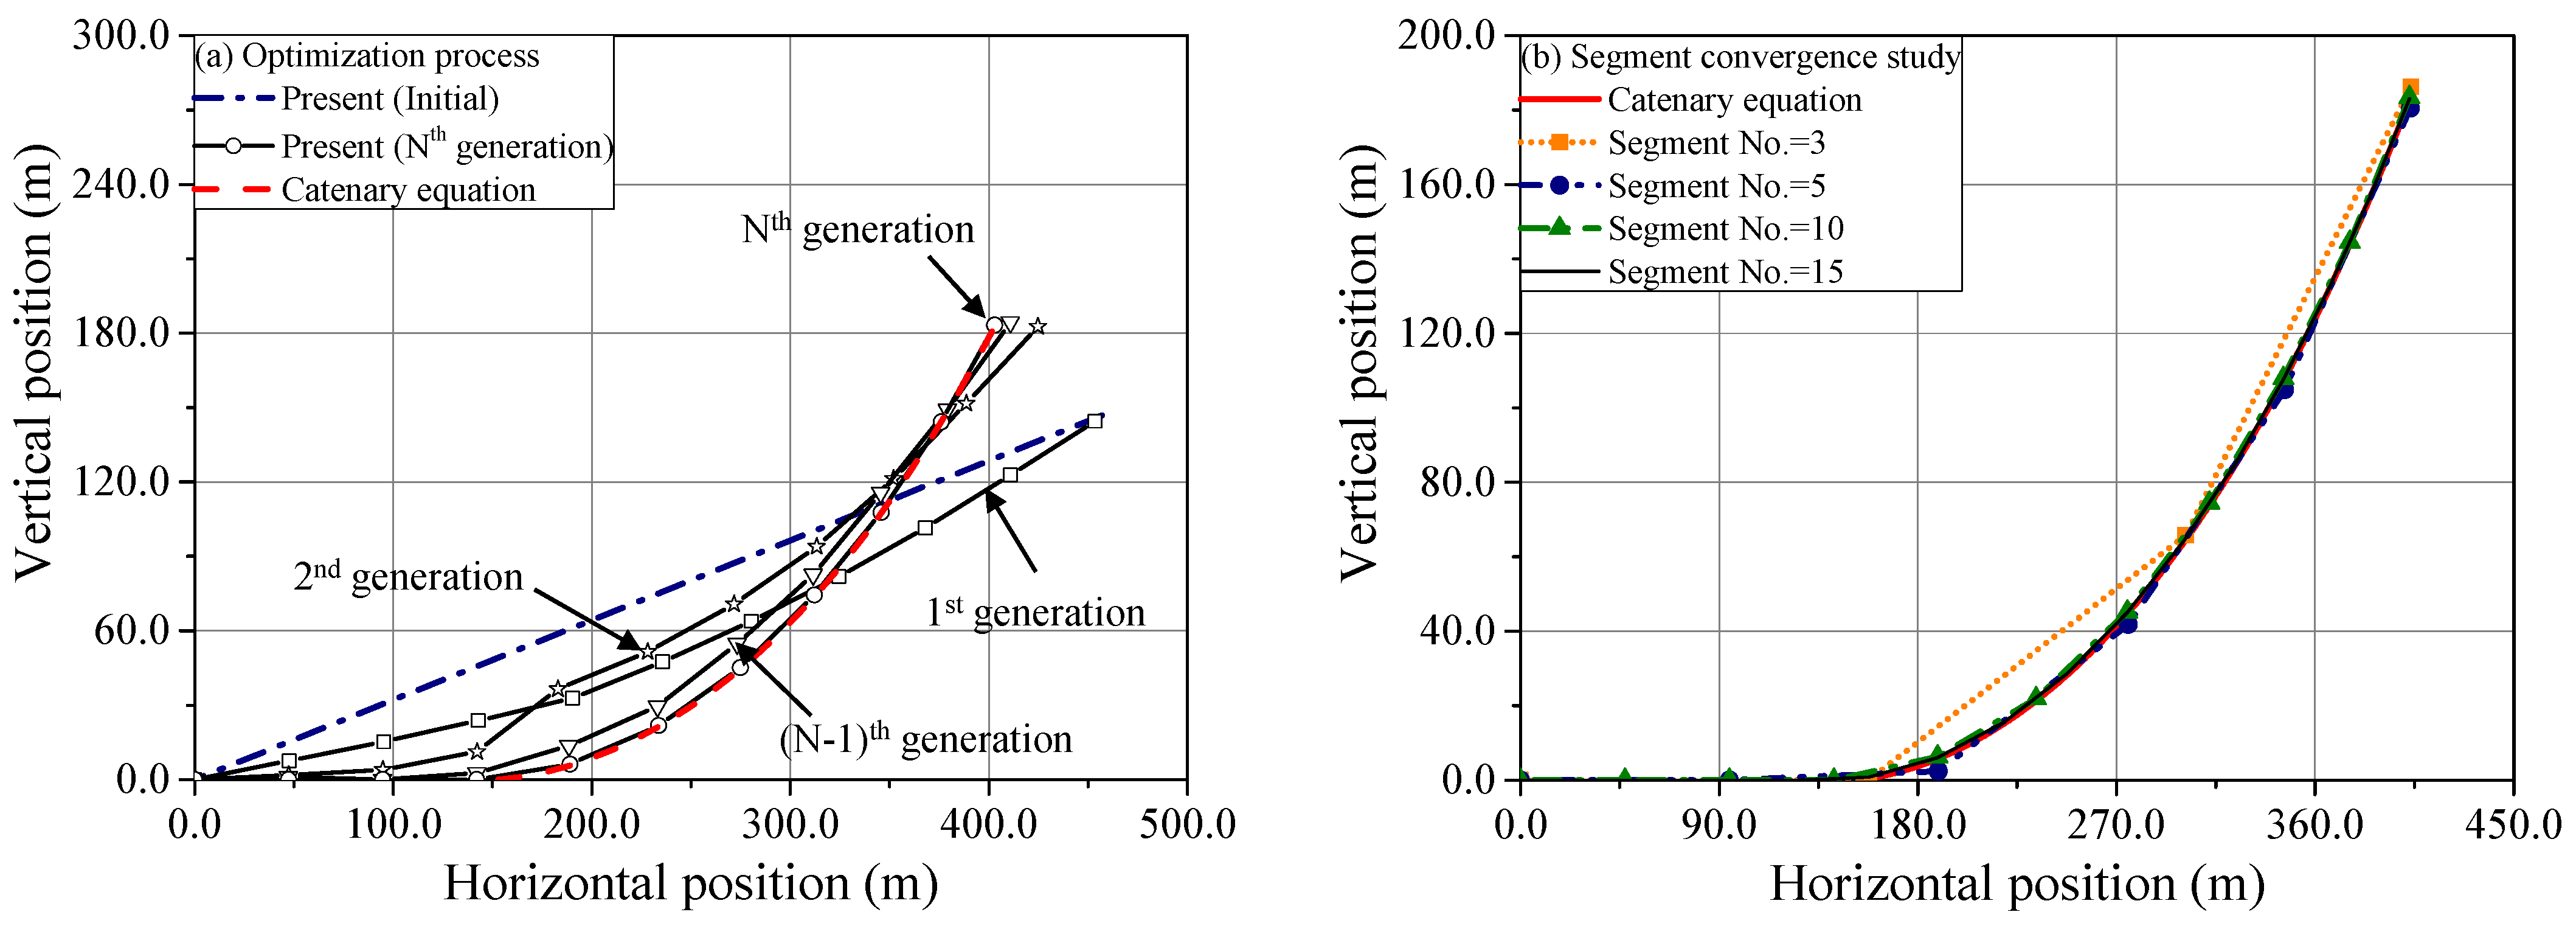
3.1. The Suspended Mooring Line

A suspended mooring line was selected from an ITI energy barge platform designed by the University of Strathclyde, Glasgow, with the Information Technology Industry Council. One end of the mooring line was fixed at the origin, and the other end (the fairlead) was free. The properties of the suspended mooring line are summarized in Table 2.
Figure 3a presents the optimization process from the initial mooring response to the solution converged after the proposed method minimized the sum of gravitational ( E p , i , j G ) and spring potential energy ( E p , i , j s ). The calculation mechanism of the proposed method indicates that the minimized fairlead position should eventually converge to the correct position, regardless of the initial fairlead position. The initial mooring response was defined by creating a straight line with 10 segments from the origin to a random coordinate (457.0 m , 146.9 m ), which ensures the initial mooring length is the same as the unstretched length. The proposed method was validated by solving a benchmark study through selection, crossover, and mutation of the generations, as illustrated in Figure 3a. The converged fairlead force (2.79 × 10⁵  N , 4.31 × 10⁵  N ) was derived in the last generation and applied to the catenary equation for predicting the quasi-static response. There was good agreement between the suspended portion predicted by the Catenary equation [6] and that derived by the proposed method. A mooring line resting on the seabed cannot be simulated by the catenary equation but was well predicted by the proposed method. The benchmark study once again proved that the Catenary equation can only be used to evaluate the quasi-static response of the mooring line hanging freely under its own weight.
A segment convergence study was conducted in terms of the quasi-static response derived by the proposed method, which was compared with that calculated by the Catenary equation, as shown in Figure 3b. It demonstrates the results of the segment convergence study for four different numbers of segments (3, 5, 10, and 15). Having more than 10 segments induced no visible difference in the prediction by the Catenary equation. Therefore, 10 segments were selected as the best number for this benchmark study.
The effect of different quasi-static forces on the response of a suspended mooring line was investigated by the proposed method. Four cases were prepared, as seen in Table 3. The stable equilibrium predicted by the Catenary equation was used as a reference to investigate the effect of quasi-static forces other than gravity and line tension on suspended mooring line response. ABAQUS/AQUA [21] was utilized to validate the proposed method under different quasi-static forces. AQUA as a submodule of ABAQUS simulates a hydro-elastic response in submerged or partially submerged flexible structures for problems such as analysis of pipelines, risers, and mooring lines. The finite element model described in Figure 4a was used to perform the quasi-static analysis with ABAQUS/AQUA [21]. In the case that finite element analysis is used to calculate structural response, its mesh convergence study needs to be demonstrated [22,23,24,25,26]. The total number of beam elements for the mooring line was determined as 50, which meets the specification requirements from BV [27]. Three-dimensional beam elements (B31) were used to represent the mooring segment with round sections. A universal joint (UJOINT) was placed between the two joining nodes of connected segments. The local 2-axis of universal joint was defined along the segment, and its local 1-axis was aligned with the global y-direction. The converged fairlead position calculated by the proposed method was applied to the free end of the finite element mooring line. In addition, the contact of the mooring line with the seabed was also included. Figure 4b demonstrates the initial response of the finite element mooring line and its converged response under its own weight.
Figure 5 presents good agreement between the quasi-static response derived by the proposed method and that simulated by ABAQUS/AQUA. However, there were significant differences between the proposed method and the catenary equation, except in Case I. Figure 5b shows the stable equilibrium evaluated by the proposed method, which presents the influence of buoyancy potential energy ( E p , i , j B ) on the basis of the research into Case I. Compared with the results derived by the Catenary equation, the effect of buoyancy is drawn correctly from the results calculated by the proposed method. The quasi-static response was predicted by the proposed method with a current velocity of 1.7 m / s , as shown in Figure 5c. The proposed method minimized the sum of the drag kinetic energy ( E k , i , j d ) and mechanical energy mentioned in Case II. The difference between the static equilibrium derived by the proposed method and that predicted by the catenary equation is given in Figure 5c. Figure 5d shows the quasi-static response of the suspended mooring line, which is achieved by minimizing all assumed mechanical energy. The quasi-static response was observed as the sum of the static equilibrium of Case II and Case III.

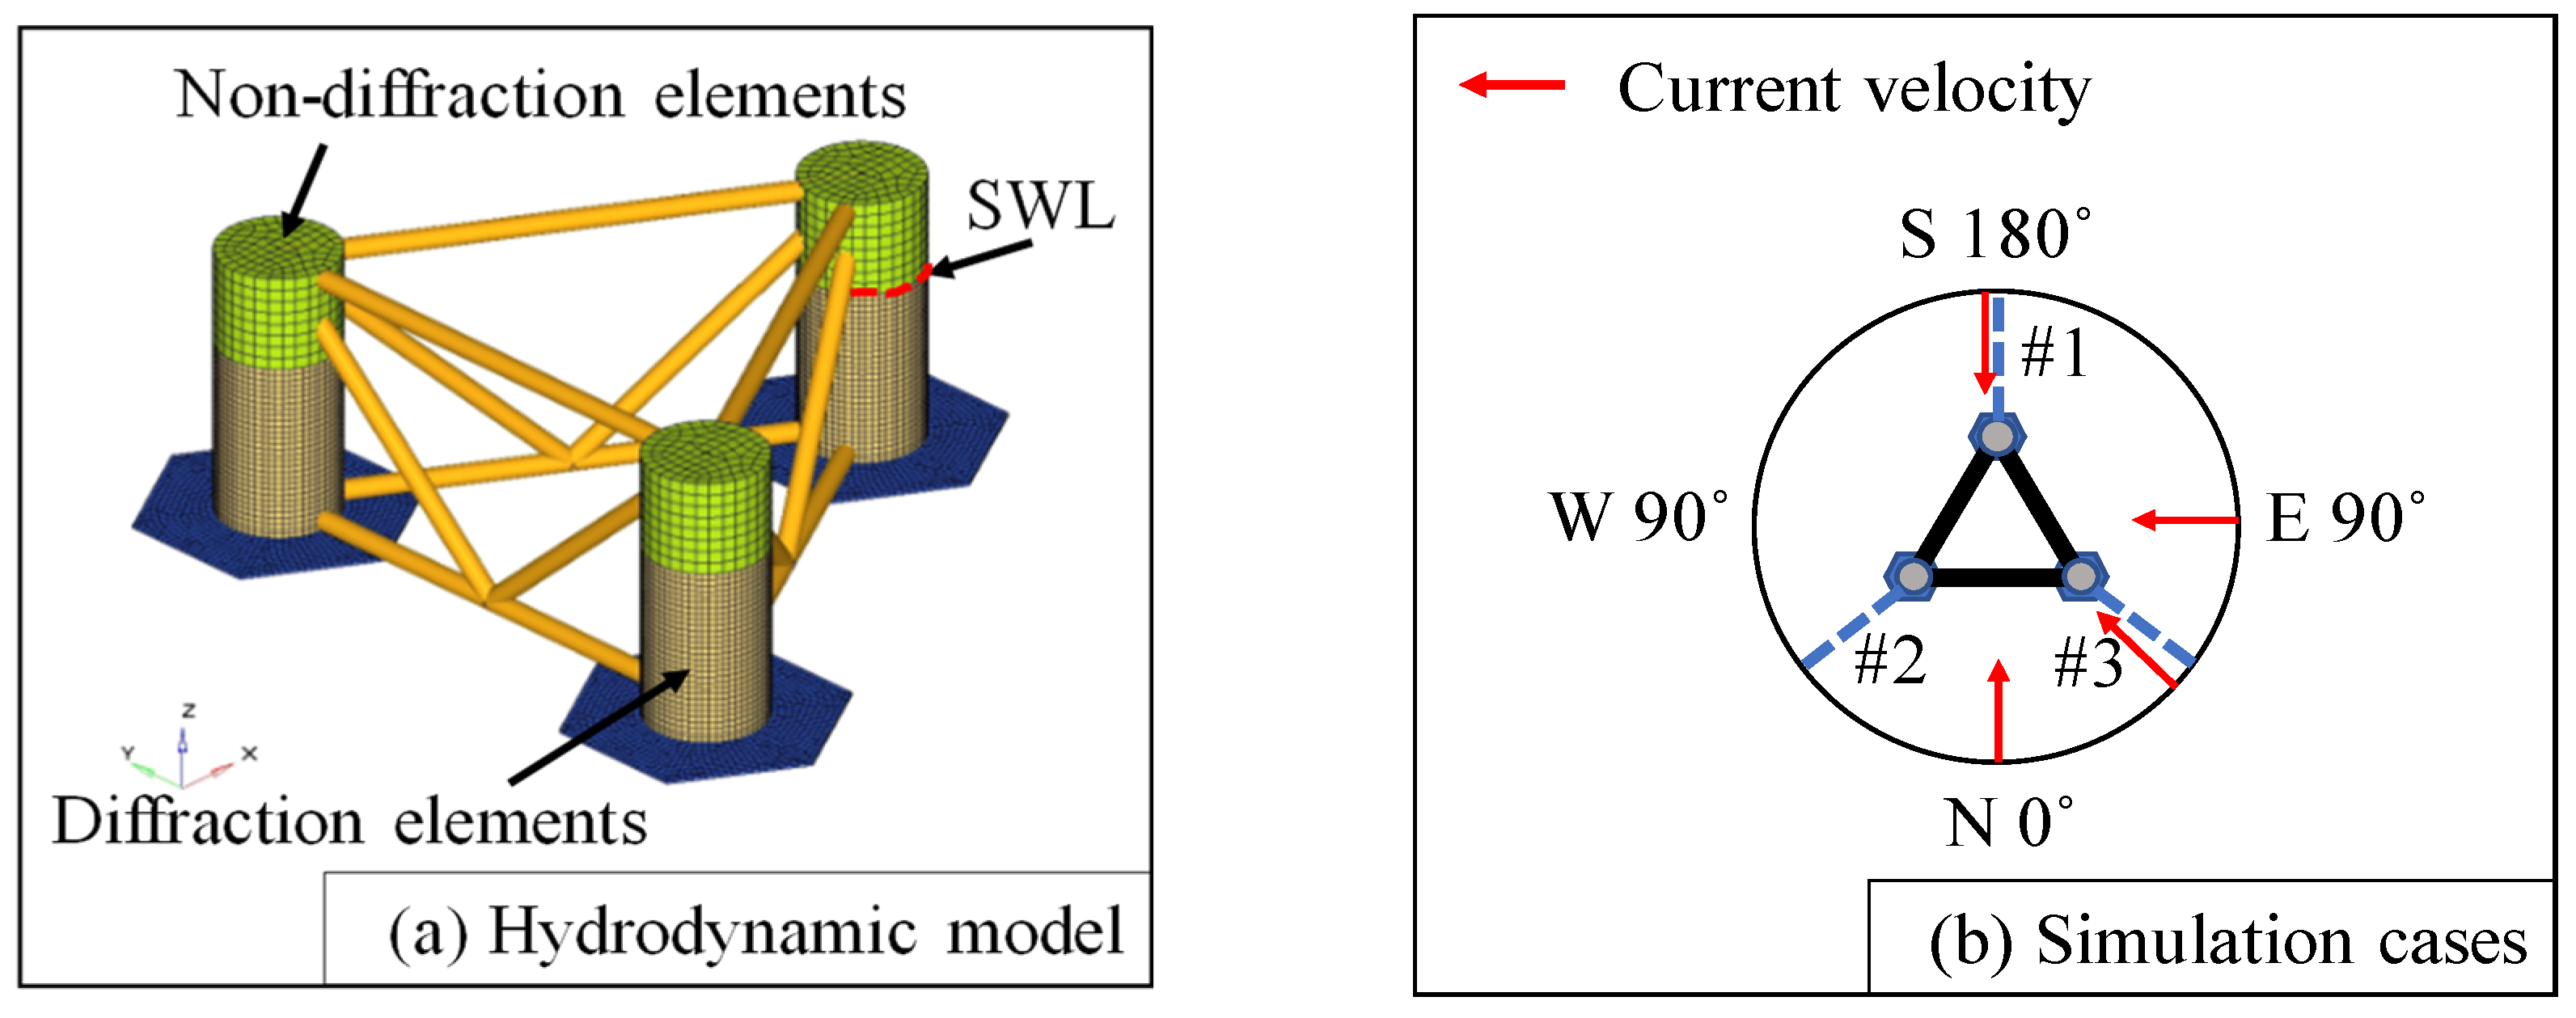
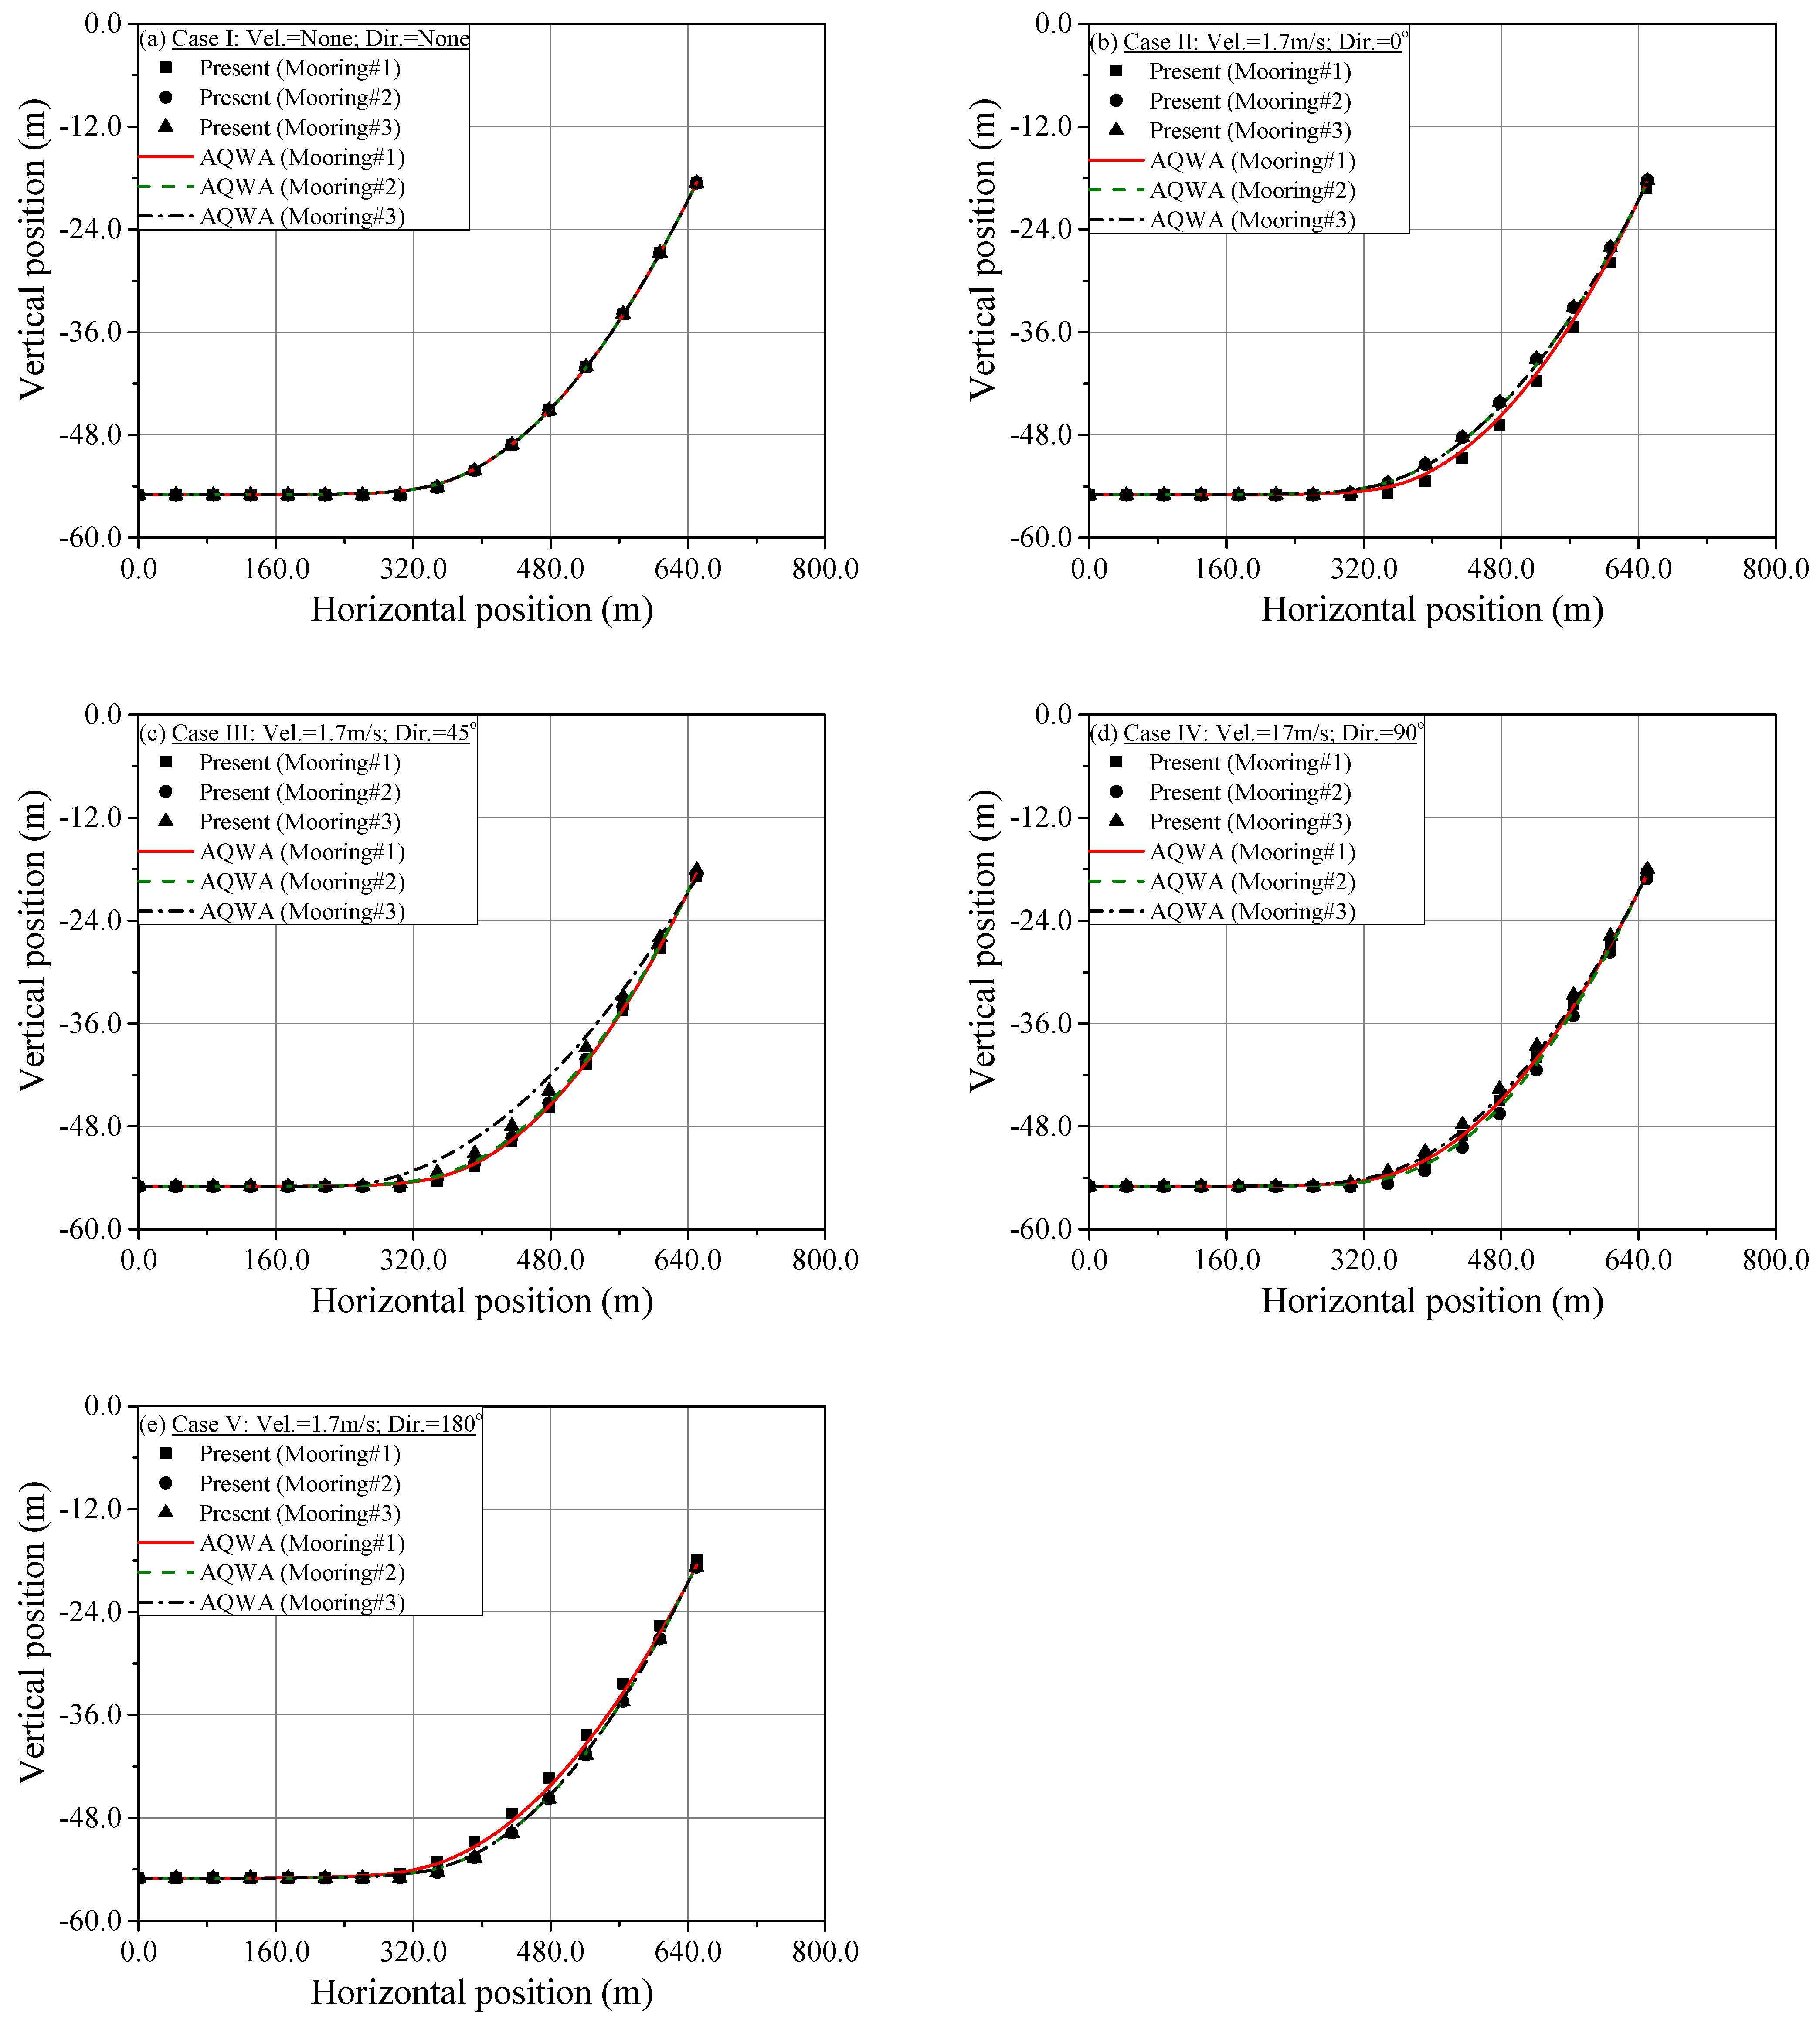
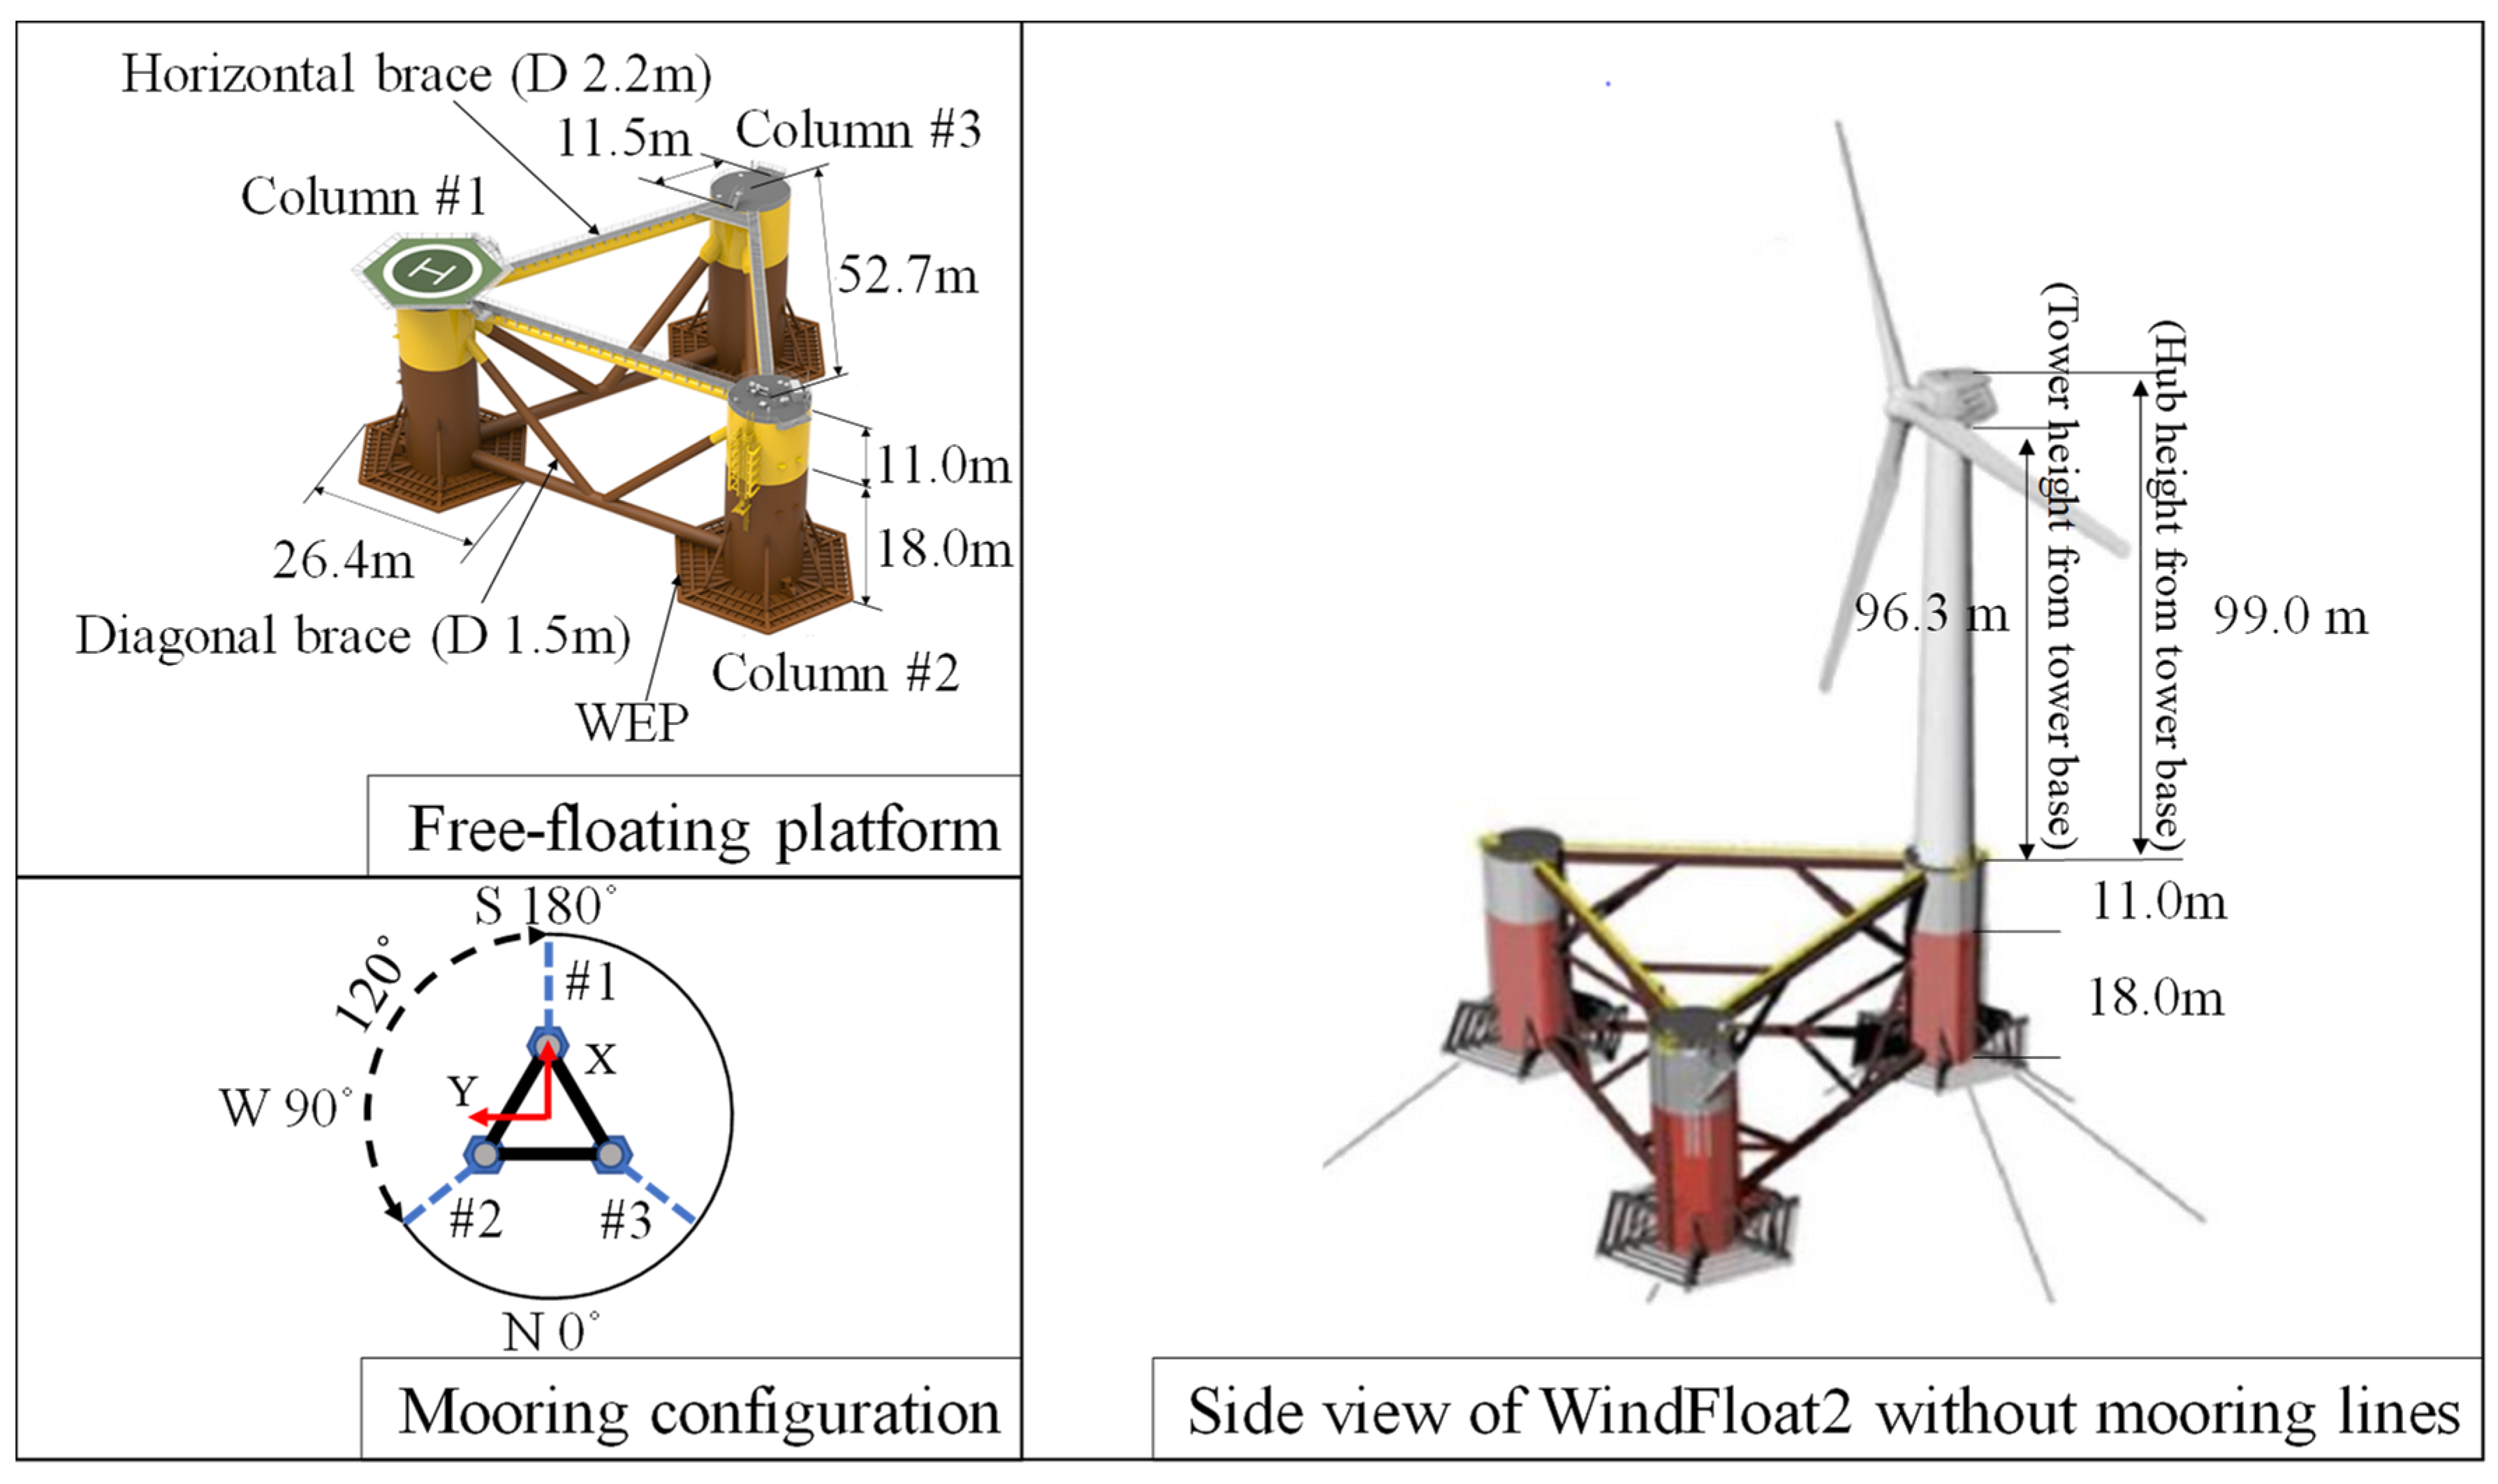
3.2. The WindFloat 2 Floating Platform

The WindFloat 2 type of floating platform (WindFloat 2) was developed by Energias de Portugal (EDP). The geometric details for the WindFloat 2 are illustrated in Figure 6. It adapts to any type of offshore wind turbine and consists of three circular stabilizing pillars that are connected by horizontal and diagonal tubular bracings. The use of the water entrapment plates (WEP) on the bottom of the three pillars increases the stability of the free-floating platform. The turbine tower is placed on one of the three pillars, and the three catenary mooring lines connect the three pillars at 120° intervals. The detailed properties of the WindFloat 2 are summarized in Table 4, where the inertial coordinate system is fixed at the static water line (SWL) above its COM.
In order to validate that derived by the proposed method, the stable equilibrium of the WindFloat 2 evaluated by AQWA was prepared [28,29]. The hydrodynamic model is composed of diffraction and non-diffraction panels for the wet part below the SWL and the dry part above the SWL, as illustrated in Figure 7a. ANSYS/AQWA [13] recommends that the maximum diffraction panel size should be less than 1/7 of the wavelength. The maximum diffraction panel size was defined as 0.67 m . The hydrodynamic coefficients were calculated from the AQWA-LINE module based on the hydrodynamic model and mass distribution data. Then, the hydrodynamic coefficients and other environmental parameters were input into the AQWA-LIBRIUM module to find the equilibrium position including the quasi-static line profile, line tension, and position of the COM. This study assumed that the seabed was ideally horizontal, the water depth of the installation field was 55 m , and the water density was 1025 kg / m 3 .
Five simulation cases were prepared with different currents, which are depicted in Figure 7b and summarized in Table 5. A segment convergence study was performed to investigate the reasonable number of segments per mooring line in the proposed method in terms of segment tension near the fairlead point for Case I. As a result, 15 was determined as the number of segments for this benchmark study. The proposed method defined the initial generation of the WindFloat 2 as the position for COM, and evenly distributed 16 nodes on each straight line between the fairlead points and anchor points.
Stable equilibrium of the C O M for the five simulations was derived by the proposed method and compared with the prediction by AQWA, as summarized in Table 6. A positive error was labeled if the equilibrium position predicted by the proposed method was larger than that derived by AQWA. Otherwise, the error was set to negative. The largest error was derived for Case III, which represents an incident current direction of 45°, while the closest solution to AQWA was calculated by the proposed method in Case I, which did not include the current effect. Different calculation algorithms in the proposed method and AQWA might lead to differences in the equilibrium positions of the   C O M for the different simulations.
Figure 8 shows the equilibrium positions of the mooring lines, comparing those predicted by the proposed method with those derived by AQWA. The three mooring lines presented the same stable equilibrium for Case I, and the quasi-static responses of each mooring line were led by the incident current direction in the other cases. Combined with the corresponding equilibrium mooring tension in Figure 9, we can see that a taut or slack mooring line was related to its equilibrium line tension.
Each mooring line presented the same behavioral trends between the proposed method and AQWA. Additionally, the equilibrium positions between the proposed method and AQWA were almost the same at several random points of interest for Case I. For the other cases, the most taut mooring line predicted by the proposed method was slightly tighter than that calculated by AQWA, except for Case III, in which the most taut mooring line derived by the proposed method was much slacker than that predicted by AQWA.
The equilibrium line tension along each mooring line predicted by the proposed method was compared with that derived by AQWA, as shown in Figure 9. The equilibrium line tension lying on the seabed was constant, while it started to increase as the line is lifted up to be suspended. The three mooring lines had the same distribution for equilibrium line tension in Case I. For the other cases, the incident current direction imposed the same impact on equilibrium line tension as the equilibrium position. The higher the equilibrium line tension, the more taut the mooring response. A slight difference between the proposed method and AQWA was observed, especially near the fairlead point. Among them, mooring line #3 in Case III presented the greatest difference between equilibrium line tension predicted by the proposed method and that calculated by AQWA.

4. Conclusions

The fact is that the Catenary equation provides a computationally efficient formulation to predict the quasi-static response of a mooring line. However, the quasi-static response is the catenary curve hanging freely under its own weight only. The commercial program can predict reasonable quasi-static responses subjected to various external forces, but costly modeling is required. This motivated us to propose a new method for predicting quasi-static responses, which minimizes the mechanical energy of the whole system based on the basic geometric parameters and is easy to implement. Mechanical energy was assumed to be the sum of gravitational–buoyancy potential energy, kinetic energy induced by drag forces, and spring potential energy derived by line tension.
Two benchmark studies with a suspended mooring line and a WindFloat 2 floating platform were prepared in order to compare the quasi-static responses predicted by the proposed method with those calculated by the Catenary equation, ABAQUS software, and the AQWA suites. The reliability of the quasi-static response from the proposed method was verified in terms of equilibrium position and line tension. For a case study of a suspended mooring line, the quasi-static response was investigated under various external forces. The limitations of the catenary equation when it comes to stable mooring equilibrium were presented, and its results were compared with the proposed method and the ABAQUS software. The proposed method was validated by ABAQUS. Good agreement between the proposed method and ABAQUS shows that the proposed method can predict a reasonable mooring line response calculated by a finite element method. With the WindFloat 2 floating platform, the quasi-static response of the whole moored floating structure was predicted by the proposed method, and its results were compared with those calculated by AQWA. The AQWA models the mooring line with tube elements and predicts hydrodynamic forces by means of the Morison force separately, disregarding the influence on each other [30]. The proposed method calculates the hydrodynamic forces based on connecting segment response. Due to different calculation algorithms, the stable equilibrium predicted by the proposed method was slightly different from that calculated by AQWA under some environmental conditions. However, the difference did not affect application of the proposed method to predicting the quasi-static response of moored floating structures.
The following conclusions can be drawn from the two benchmark studies. The proposed method can predict a reasonable quasi-static response in a moored floating structure with easy-to-use procedures. While the proposed method was proven to be a suitable tool for designing mooring line length in the preliminary stages, no studies have been conducted on the seabed friction effects on quasi-static responses of mooring lines in the proposed method. Further research on seabed friction effects is needed.

Author Contributions

Conceptualization, C.B.L.; methodology, C.B.L.; software, C.B.L.; validation, C.B.L. and M.C; formal analysis, C.B.L. and M.C; investigation, C.B.L. and J.C; resources, C.B.L. and J.C; writing—original draft preparation, C.B.L.; writing—review and editing, C.B.L. and M.C; visualization, C.B.L.; supervision, J.C.; project administration, J.C. and M.C.; funding acquisition, J.C. All authors have read and agreed to the published version of the manuscript.

Funding

This work was funded by an Inha University Research Grant.

Institutional Review Board Statement

Not applicable.

Informed Consent Statement

Not applicable.

Data Availability Statement

Not applicable.

Acknowledgments

This work was supported by an Inha University Research Grant, National Natural Science Foundation of China (Grant No.: 51809205 and 52171275), and Sanya Science and Education Innovation Park of Wuhan University of Technology (Grant No.: 2020KF0038).

Conflicts of Interest

The authors declare no conflict of interest.

References

  1. Maffra, S.A.R.D.S.; Pacheco, M.A.C.; de Menezes, I.F.M. Genetic Algorithm Optimization for Mooring Systems; Tecgraf PUC-Rio Publications: Rio, Brazil, 2001. [Google Scholar]
  2. Fitzgerald, J. Position Mooring of Wave Energy Converters. Ph.D. Thesis, Chalmers University of Technology, Goteborg, Sweden, November 2009. [Google Scholar]
  3. Mavrakos, S.A.; Papazoglou, V.J.; Trintafyllou, M.S.; Hatjigeorgiou, J. Deep water mooring dynamics. J. Mar. Struct. 1996, 9, 181–209. [Google Scholar] [CrossRef]
  4. Pascoal, R.; Huang, S.; Barltrop, N.; Guedes Soares, C. Equivalent force model for the effect of mooring systems on the horizontal motions. J. Appl. Ocean Res. 2005, 27, 165–172. [Google Scholar] [CrossRef]
  5. Pascoal, R.; Huang, S.; Barltrop, N.; Guedes Soares, C. Assessment of the effect of mooring systems on the horizontal motions with an equivalent force to model. Ocean Eng. 2006, 33, 1644–1668. [Google Scholar] [CrossRef]
  6. Jain, R. A simple method of calculating the equivalent stiffnesses in mooring cables. J. Appl. Ocean Res. 1980, 2, 139–142. [Google Scholar] [CrossRef]
  7. Agarwal, A.K.; Jain, A.K. Dynamic behaviour of offshore spar platforms under regular sea waves. Ocean Eng. 2003, 30, 487–516. [Google Scholar] [CrossRef]
  8. Vicente, P.C.; Falcão, A.F.O.; Justino, P.A.P. Optimization of mooring configuration parameters of floating wave energy converters. In Proceedings of the 30th International Conference on Ocean, Offshore and Arctic Engineering, Rotterdam, The Netherlands, 19–24 June 2011. [Google Scholar]
  9. Montasir, O.A.; Yenduri, A.; Kurian, V.J. Effect of mooring line configurations on the dynamic responses of truss spar platforms. Ocean Eng. 2015, 96, 161–172. [Google Scholar] [CrossRef]
  10. Masciola, M. Instructional and Theory Guide to the Mooring Analysis Program. NREL. Available online: https://nwtc.nrel.gov/system/files/MAP_v0.87.06a-mdm.pdf (accessed on 2 January 2021).
  11. Jonkman, J.M.; Buhl, M.L., Jr. Development and verification of a fully coupled simulator for offshore wind turbines. Renewable Energy Laboratory. In Proceedings of the 5th AIAA Aerospace Sciences Meeting and Exhibit, Wind Energy Symposium, Reno, NV, USA, 8–11 January 2007. NREL/TP-500-40979. [Google Scholar]
  12. Masciola, M.; Jonkman, J.; Robertson, A. Implementation of a multisegmented, quasi-static cable model. In Proceeding of the 23rd International Offshore and Polar Engineering Conference, Anchorage, AK, USA, 30 June–5 July 2013. [Google Scholar]
  13. ANSYS/AQWA. AQWA-Theory Manual; Inc. Southpointe 275 Technology Drive Canonsburg: Canonsburg, PA, USA, 2013. [Google Scholar]
  14. Li, C.B.; Choung, J.; Kim, B.I. Prediction of stress spectra under low period sea states. Ships Offshore Struct. 2018, 13, 56–67. [Google Scholar] [CrossRef]
  15. Bhinder, M.A.; Karimirad, M.; Weller, S.; Debruyne, Y.; Guérinel, M.; Sheng, W. Modelling mooring line non-linearities (material and geometric effects) for a wave energy converter using AQWA, SIMA and Orcaflex. In Proceedings of the 11th European Wave and Tidal Energy Conference, Nantes, France, 6–11 September 2015. [Google Scholar]
  16. Angelelli, E.; Zanuttigh, B.; Martinelli, L.; Ferri, F. Physical and numerical modelling of mooring forces and displacements of a wave activated body energy converter. In Proceeding of the ASME 33rd International Conference on Ocean, Offshore and Arctic Engineering, San Francisco, CA, USA, 8–13 June 2014. [Google Scholar]
  17. Murphy, S.; Bhinder, M.A.; Casaubieilh, P.; Sheng, W. Effects of tidal range on mooring systems of wave energy converters. In Proceedings of the 11th European Wave and Tidal Energy Conference, Nantes, France, 6–11 September 2015. [Google Scholar]
  18. Chen, D.; Wang, C.M.; Zhang, H. Examination of net volume reduction of gravity-type open-net fish cages under sea currents. Aquac. Eng. 2021, 92, 102–128. [Google Scholar] [CrossRef]
  19. Knight, R.D. Physics for Scientists and Engineers, 3rd ed.; Pearson: San Francisco, CA, USA, 2016. [Google Scholar]
  20. Mathworks. Matlab User Manual; Mathworks: Natick, MA, USA, 2020. [Google Scholar]
  21. ABAQUS/AQUA. ABAQUS-Theory Manual; Dassault Systèmes: Vélizy-Villacoublay, France, 2016. [Google Scholar]
  22. Li, C.B.; Seo, J.K.; Paik, J.K. Proposed formulas for evaluation of the equivalent material properties of a multiholed structures. Ocean. Eng. 2016, 121, 312–322. [Google Scholar] [CrossRef]
  23. Li, C.B.; Kim, S.J.; Lee, J.C.; Paik, J.K.; Sohn, J.M. Dynamic structural response characteristics of perforated blast walls under hydrocarbon explosion. In Proceeding of the 7th International Conference on Thin-Walled Structures, Busan, Korea, 28 September–2 October 2014. [Google Scholar]
  24. Li, C.B.; Choung, J. A new method of predicting hotspot stresses for longitudinal attachments with reduced element sensitivities. Int. J. Nav. Archit. Ocean. Eng. 2021, 13, 379–395. [Google Scholar] [CrossRef]
  25. Kim, C.S.; Li, C.B.; Choung, J.; Kim, Y.H. Prediction of crack growth of an aged coast guard patrol ship based on various approaches. In Proceeding of the 6th International Conference on Marine Structures, Lisbon, Portugal, 8–10 May 2017. [Google Scholar]
  26. Kim, C.S.; Li, C.B.; Kim, Y.H.; Choung, J. Prediction of crack growth lives of an aged Korean coast guard patrol ship based on extended finite element method (XFEM) J-Integral. J. Soc. Nav. Archit. 2017, 54, 335–343. [Google Scholar]
  27. Bureau Veritas. Fatigue of Top Chain of Mooring Lines Due to In-Plane and Out-Of-Plane Bendings; Guidance Note NI 604; Bureau Veritas: Neuilly-sur-Seine, France, 2014. [Google Scholar]
  28. Li, C.B.; Choung, J. Fatigue damage analysis for a floating offshore wind turbine mooring line using the artificial neural network approach. Ships Offshore Struct. 2016, 12, 288–295. [Google Scholar] [CrossRef]
  29. Li, C.B.; Choung, J.; Noh, M.H. Wide-banded fatigue damage evaluation of Catenary mooring lines using artificial neural networks models. Mar. Struct. 2018, 60, 186–200. [Google Scholar] [CrossRef]
  30. Marbus, G.D. Verification of the Water Forces on Stringer of Allseas’ Solitaire. Master’s Thesis, Delft University of Technology, Delft, The Netherlands, 2007. [Google Scholar]
Figure 1. The architecture of a moored floating structure.
Jmse 09 00960 g001
Figure 2. The process for minimizing mechanical energy: (a) the flowchart of the GA process; (b) quasi-static solutions with highest fitness value.
Jmse 09 00960 g002
Figure 3. The optimization process and segment convergence study for a suspended mooring line: (a) optimization process of the suspended mooring line; (b) segment size convergence study.
Jmse 09 00960 g003
Figure 4. The quasi-static response predicted by ABAQUS/AQUA: (a) the finite element model; (b) description of initial response and converged response.
Jmse 09 00960 g004
Figure 5. The quasi-static response for a suspended mooring line: (a) for Case I; (b) for Case II; (c) for Case III; (d) for Case IV.
Jmse 09 00960 g005
Figure 6. The dimensions of the WindFloat 2 floating platform.
Jmse 09 00960 g006
Figure 7. The AQWA panel model and simulation cases: (a) hydrodynamic model; (b) simulation cases.
Jmse 09 00960 g007
Figure 8. The equilibrium positions of the mooring lines: (a) for Case I; (b) for Case II; (c) for Case III; (d) for Case IV; (e) for Case V.
Jmse 09 00960 g008
Figure 9. The equilibrium tension of the mooring lines: (a) for Case I; (b) for Case II; (c) for Case III; (d) for Case IV; (e) for Case V.
Jmse 09 00960 g009
Table 1. The genetic algorithm parameters.
ParametersValue
Size of the population60
Number of generations200
Crossover typeMulti-point
Crossover probability0.5
Mutation probability0.5
Elite count2
Tolerance1 × 10−6
Table 2. Properties of the mooring lines for the ITI energy barge.
ItemsUnitValue
Unstretched lengthm473.30
Line diameterm0.0809
Line densitykg/m130.40
Cross-sectional area (A)m20.0051
Young’s modulus (E)Pa1.15 × 1011
Line stiffness (EA)N/m1.25 × 106
Drag tangent coefficient-/-1.00
Drag normal coefficient-/-0.03
Table 3. Four cases investigating the effect of quasi-static force on mooring line response.
ItemsQuasi-Static ForcesMechanical Energy
Case I   G and T E p , i , j G + E p , i , j s
Case II   G , T and B E p , i , j G , B + E p , i , j s
Case III G , T and F d (1.7 m/s) E p , i , j G + E p , i , j s + E k , i , j d
Case IV G , T , B and F d (1.7 m/s) E p , i , j G , B + E p , i , j s + E k , i , j d
Table 4. Properties of the WindFloat 2 floating platform.
ItemsUnitValueItemsUnitValue
Masskg6.927 × 106Drag tangent coefficient-/-1.000
Displacementm36951.8Drag normal coefficient-/-0.025
Coord. for COMm(0.0, 0.0, −9.0)Coord. for fairlead point #1m(30.43, 0.0, −18.0)
Roll inertia for COMkg-m24.747 × 109Coord. for fairlead point #2m(−15.21, 26.35, −18.0)
Pitch inertia for COMkg-m24.747 × 109Coord. for fairlead point #3m(−15.21, −26.35, −18.0)
Yaw inertia for COMkg-m26.722 × 109Coord. for anchor point #1m(680.43, 0.0, 0.0)
Unstretched lengthm650.0Coord. for anchor point #2m(−340.21, 589.27, 0.0)
Line diameterm0.14142Coord. for anchor point #3m(−340.21, −589.27, 0.0)
Line densitykg/m199.0
Axial stiffnessN8.54 × 108
Table 5. Environmental parameters for the different simulations.
Items Water   Depth   ( m ) Water   Density   ( kg / m 3 ) Current   Velocity   ( m / s ) Current Direction (°)
Case I551025NoneNone
Case II1.70.0
Case III45.0
Case IV90.0
Case V180.0
Table 6. Equilibrium positions of the C O M for the different simulations.
Translation along x Axial ( m )Translation along y Axial ( m )Translation along z Axial ( m )
AQWAProposedError (%)AQWAProposedError (%)AQWAProposedError (%)
Case I0.0000.0000.000.0000.0000.00−9.580−9.6010.22
Case II0.3200.3426.880.0000.0000.00−9.590−9.5940.04
Case III0.2300.211−8.260.2500.232−7.20−9.590−9.5840.10
Case IV0.0300.0346.670.3300.3454.55−9.590−9.600−0.06
Case V−0.340−0.3523.530.0000.0000.00−9.590−9.599−0.01
Rotation about x Axial (o)Rotation about y Axial (o)Rotation about z Axial (o)
AQWAProposedError (%)AQWAProposedError (%)AQWAProposedError (%)
Case I0.0000.0000.000.0000.0000.000.0000.0000.00
Case II0.0000.0000.000.0500.0536.000.0000.0000.00
Case III−0.030−0.021−30.000.0300.026−13.33−0.150−0.132−12.00
Case IV−0.050−0.05816.000.0000.0000.000.2100.25411.43
Case V0.0000.0000.00−0.050−0.0548.000.0000.0000.00
Publisher’s Note: MDPI stays neutral with regard to jurisdictional claims in published maps and institutional affiliations.

