Article

Broadband Characteristics of Zooplankton Sound Scattering Layer in the Kuroshio–Oyashio Confluence Region of the Northwest Pacific Ocean in Summer of 2019

1
College of Marine Sciences, Shanghai Ocean University, Shanghai 201306, China
2
National Engineering Research Center for Oceanic Fisheries, Shanghai 201306, China
3
Key Laboratory of Sustainable Exploitation of Oceanic Fisheries Resources, Ministry of Education, Shanghai 201306, China
4
Key Laboratory of Oceanic Fisheries Exploration, Ministry of Agriculture and Rural Affairs, Shanghai 201306, China
*
Author to whom correspondence should be addressed.
J. Mar. Sci. Eng. 2021, 9(9), 938; https://doi.org/10.3390/jmse9090938
Submission received: 18 June 2021 / Revised: 14 August 2021 / Accepted: 25 August 2021 / Published: 29 August 2021
(This article belongs to the Special Issue Marine Environment Monitoring)

Abstract

:
Acoustic technology, as an important investigation method for fishery resources, has been widely used in zooplankton surveys. Since the Kuroshio–Oyashio confluence region has an extensive distribution of zooplankton, describing and analyzing the characteristic of the zooplankton sound scattering layer (SSL) in this area is essential for marine ecology research. To understand its spatial–temporal distribution, acoustic data of the Kuroshio–Oyashio confluence region at the Northwest Pacific Ocean, obtained by a Simrad EK80 broadband scientific echosounder in 2019, were used on board the research vessel (RV) Songhang. After noise removal, the volume backscattering strength (SV) was measured to plot the broadband scattering spectrogram of each water layer and to exhibit zooplankton distribution. The results show that the main sound scattering within 0–200 m originate from the zooplankton, and the S V of each layer increases with the rise of the transducer frequency. The magnitude of S V was closely synchronized with the solar altitude angle, which gets smaller when the angle is positive, then larger when the angle is negative. It means that the SSL has a diel vertical migration (DVM) behavior with the variation of solar height. Meanwhile, scattering strength was positively correlated with temperature in the vertical direction and showed a maximum of −54.31 dB at 20–40 m under the influence of the thermocline. The Kuroshio and Oyashio currents had an obvious influence on the scattering strengths in this study, indicating a low value when next to the Oyashio side and a high value on the Kuroshio side. The scattering strength near the warm vortex center was higher than that at the vortex edge. The results of this study could provide references for a long-term study on ecological environment variation and its impacts on zooplankton distribution.

1. Introduction

The Northwest Pacific Ocean has intricate circulation systems [1], including the Kuroshio current and the Oyashio current. In the Kuroshio–Oyashio confluence region (KOCR; 142° E–152° E, 35° N–40° N [2,3,4]), there are complex vortices and fronts [5]. Large numbers of zooplankton, mainly composed of copepods, ctenophores, euphausiids, pelagic molluscs, and tunicates [6], aggregate in the KOCR because of the unique marine environment and geographical conditions [7,8]. As important secondary producers and feeding objects of economic fishes, zooplankton connect primary producers with tertiary or ultimate producers, and play a key role in the pelagic food web and marine productivity. The species composition and abundance of zooplankton could affect fishery resources through the food chain [9,10]. In addition, zooplankton distribution characteristics are indicators of the mutual transportation and passage of different water systems, and the basis to distinguish the boundaries of different water masses. To promote the conservation, management, and sustainable development of fisheries in the Northwest Pacific Ocean, one of the most important pelagic fishing areas of China, conducting research studies about zooplankton would be significant.
The distribution and diversity of zooplankton in the Northwest Pacific Ocean have been studied [6,11,12], but few performed in the KOCR. Traditional methods are time-consuming, laborious, and difficult to obtain large-scale information. Fishery acoustic with the advantages of fast speed, high resolution, wide spatial–temporal range, and resource friendliness is suitable for marine biological investigation [13,14]. Since acoustic methods were introduced into zooplankton research at the end of last century [15,16,17], both narrowband [18] and broadband [19,20] technologies have been used in zooplankton scattering characteristic research studies.
Sound scattering layer (SSL) refers to a water layer with high scattering strength, which is produced by the aggregation of marine organisms [21,22]. Because the SSL is mostly constituted by zooplankton and fish [23,24], its spatial–temporal distribution and variation reflects the movement characteristic of organisms in the layer.
In this paper, broadband data collected in the KOCR were used to analyze the backscattering characteristics and distribution of the zooplankton scattering layer. The broadband scattering spectrogram was plotted. The relationships of backscattering strength with latitude, longitude, temperature, depth, solar height, and two currents were described. Our works could provide supplements to previous studies and references for biomass estimation and fishery management. They also provide references for a long-term study on ecological environment variation and its impacts on zooplankton distribution.

2. Materials and Methods

2.1. Survey Information

A survey was conducted in the KOCR (146° E–150° E, 31° N–40° N) at the Northwest Pacific Ocean from 23 August to 12 September 2019. Hydrographic and acoustic data were collected on board the research vessel (RV) Songhang (Shanghai Ocean University). A total of 30 acoustic survey stations were defined as shown in Figure 1.

2.2. Data Collection

Vertical profiles of temperature were collected using a Sea-Bird SBE 911/917 plus CTD. Acoustic data were collected and recorded using a Simrad EK80 scientific echosounder system with hull-mounted transducers operating at 38, 70, 120, and 200 kHz. The echosounders were calibrated in situ by standard techniques [25]. The main parameters of EK80 were set as in Table 1. These four transducers collected broadband data at 30 stations covering frequencies from 34 to 260 kHz. The everyday distribution of currents was viewed online [26].

2.3. Noise Removal

Acoustic data postprocessing software ESP3 V1.4.1 [27] and Matlab R2020a software were used for data processing. The noise correction and signal-to-noise-based threshold methods proposed by Robertis and Higginbottom [28] were used to remove background noise. The time-varying gain (TVG) was first removed from the original acoustical data. Second, TVG removal data were grouped horizontally by pings and then resampled vertically to calculate the mean echo intensity for each group. Third, the minimum value of the mean intensity was taken as the noise estimation of the group’s median pings. Fourth, TVG and noise estimation were subtracted from the original data. Finally, a minimum threshold signal-to-noise ratio (SNR) set to 12 dB was applied to exclude the noise.
Spikes were removed using the method proposed by Ryan et al. [29] based on the two-sided comparison method [30]. In this method, samples within each ping were linearly averaged to a vertical resolution of 5 m. Then the vertical averaged ping was removed if a threshold of 10 dB was exceeded when compared with pings on both sides.

2.4. Analysis of Volume Backscattering Strength

The volume backscattering strength ( S V ) is the ratio of the acoustic wave’s scattering intensity in the source direction to the incident wave’s intensity within per unit volume. It is equal to the summation of the backscattering cross sections of scatterers involved per unit volume [31]. Therefore, S V is proportional to the quantity and weight of scatterers [31], and can reflect the distribution of detected targets. In this paper, 0–200 m was selected as the analytical water layer at each station, which is divided into 10 layers at intervals of 20 m. Due to the draft of transducers and to prevent near-field effects, acoustic data for the first 8 m depth were not available [32]. For different stations, every layer’s S V with all frequencies was measured. We used linear interpolation to replace the outliers apparent in the S V data. Additionally, the moving average method was used to smoothen the data, but not so long as to significantly blur the variation trend. Finally, the broadband scattering spectrogram was produced, then its characteristics analyzed to identify the scattering source.

2.5. Analysis of Echo-Integration

The scattering characteristic of zooplankton can be better exhibited at 120 kHz [33]. Therefore, the echo-integration at 120 kHz was carried out, with the integral range 20–200 m and at a height of 20 m, to understand the distribution of zooplankton. Afterwards, Pearson correlation analysis and linear regression were used to analyze the relationship between S V and longitude (Lon), latitude (Lat), depth (Dep), and temperature.

2.6. Analysis of Scattering Diel Variation

Because of the different survey times of each station, the illumination intensity at the sea surface is also different, producing the distinction of day and night. To describe the diel variation on scattering strength, the relationship between S V and the solar altitude angle during the survey period was analyzed. The solar height was obtained through the solar altitude angle calculator provided by the Open Source Geospatial Foundation of China (OSGeo) based on the latitude, longitude, and GMT (Greenwich Mean Time) of each station.

3. Results

3.1. Average Volume Backscattering Strength

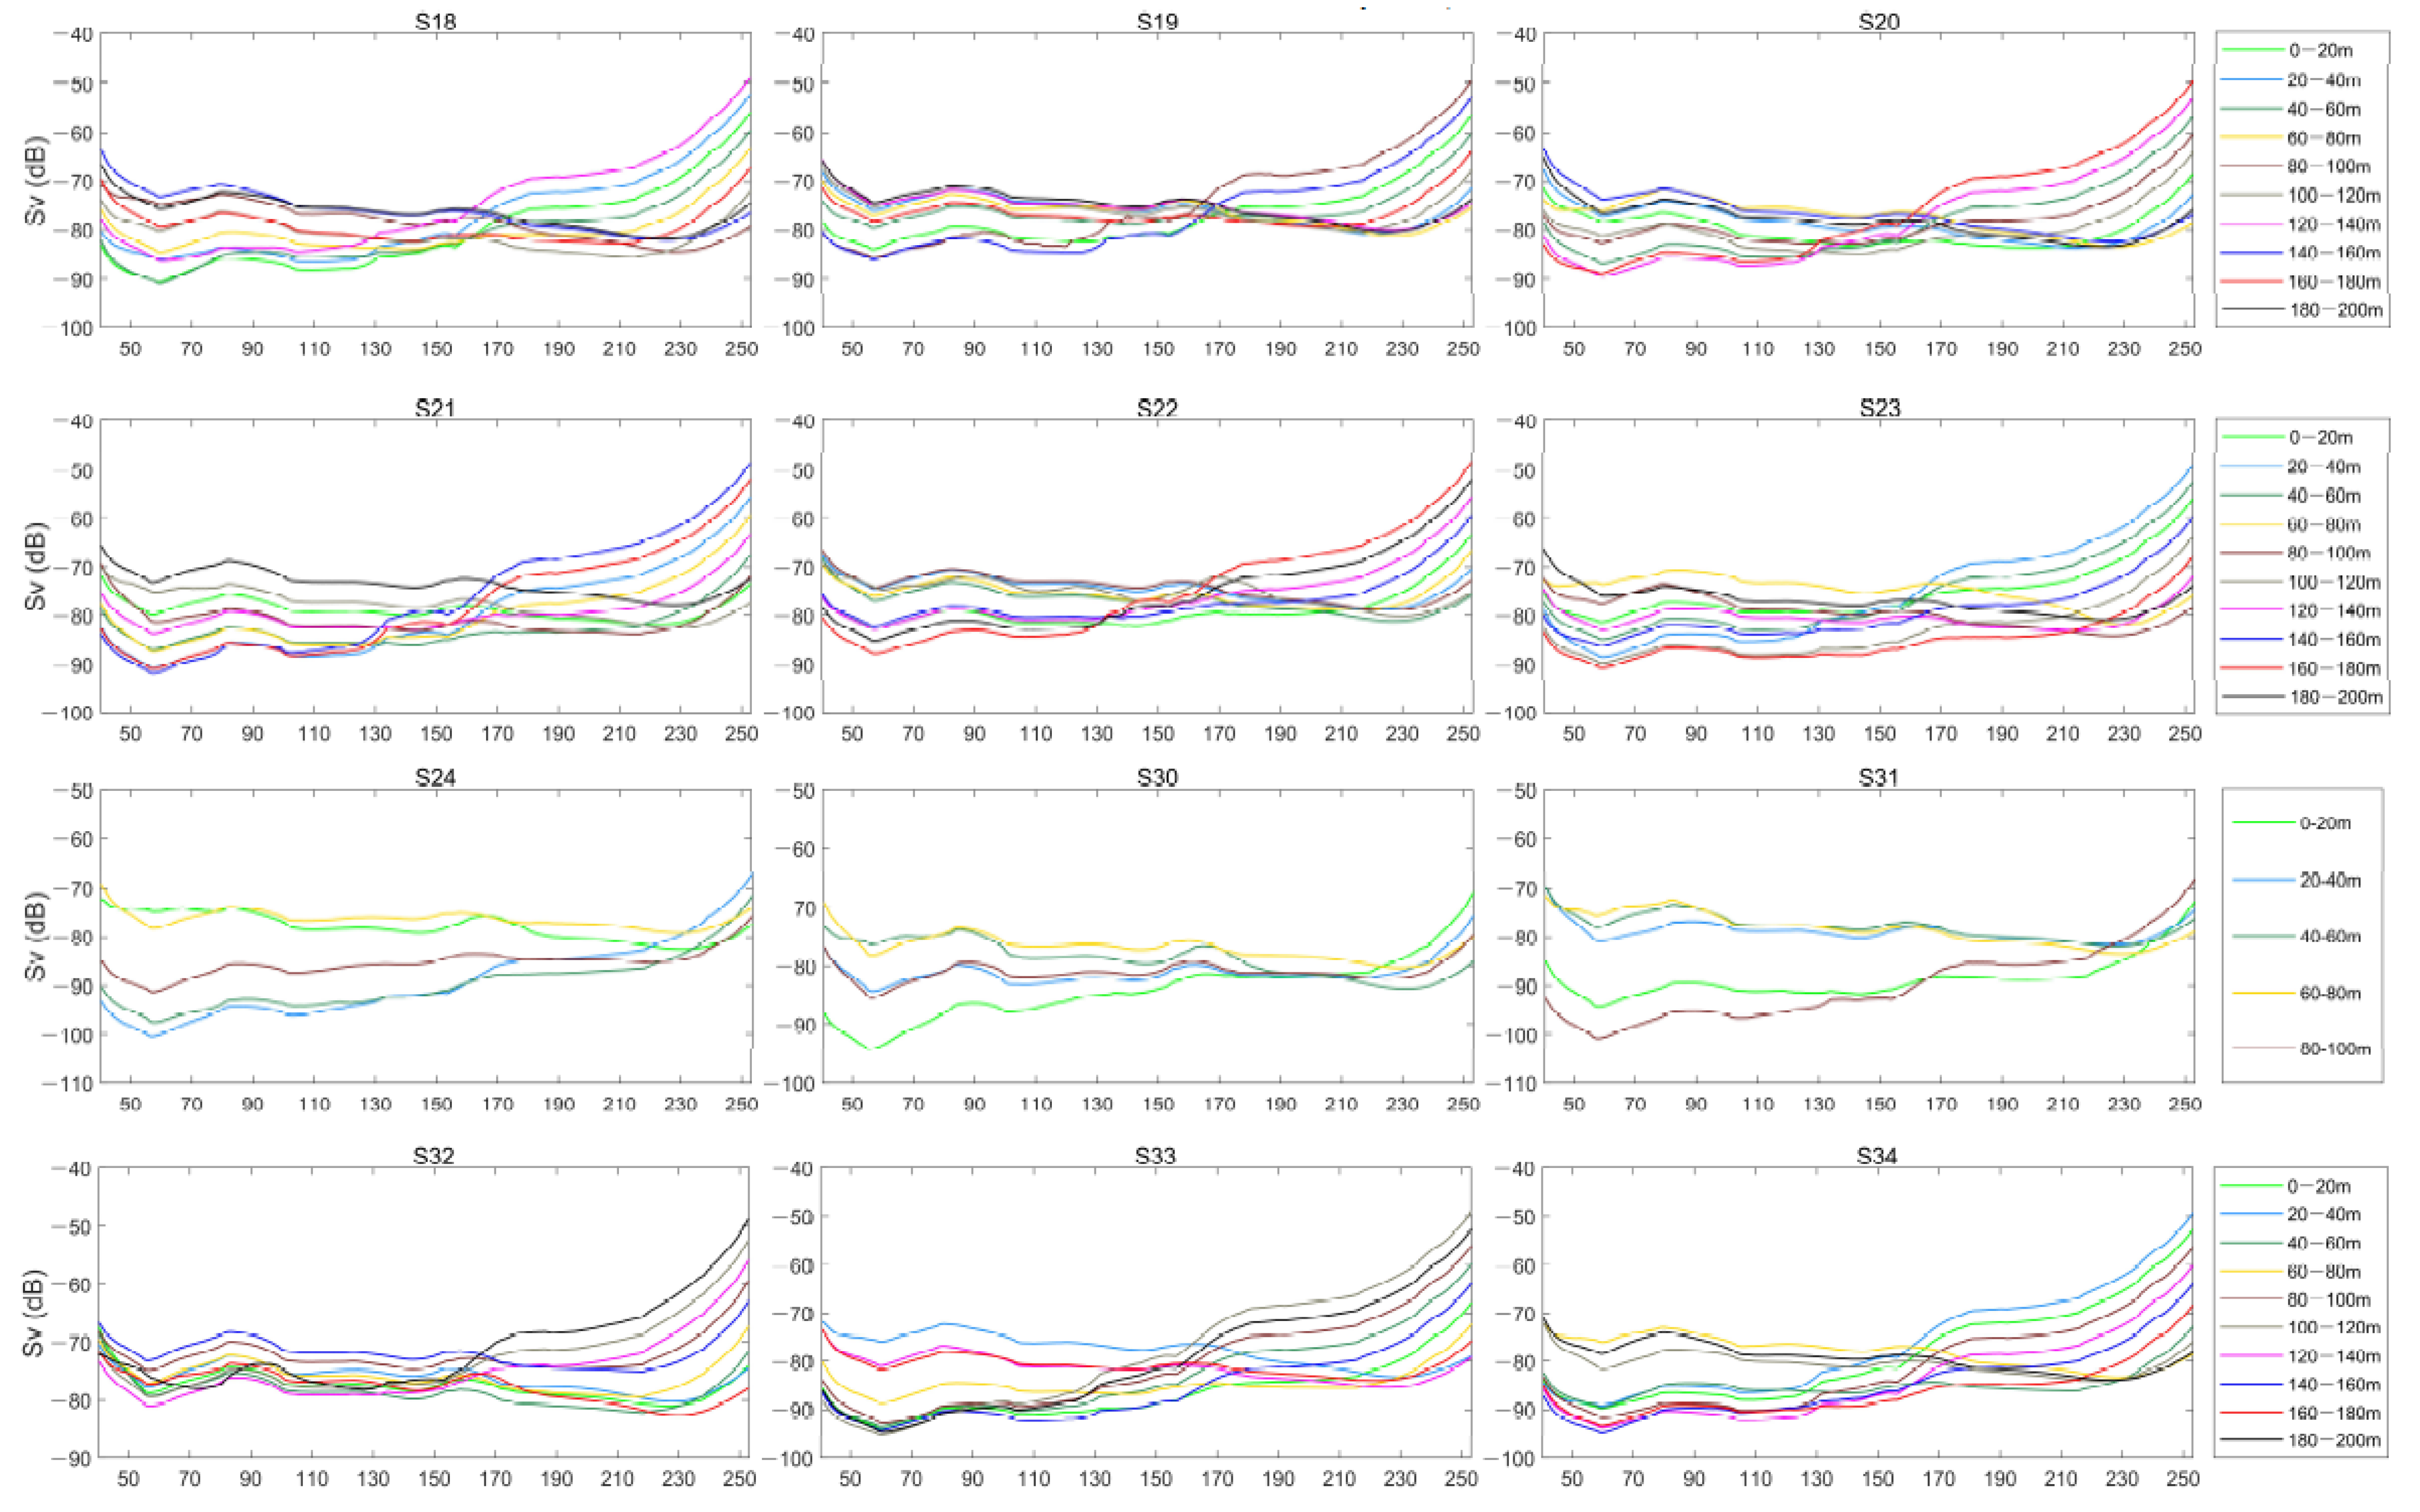
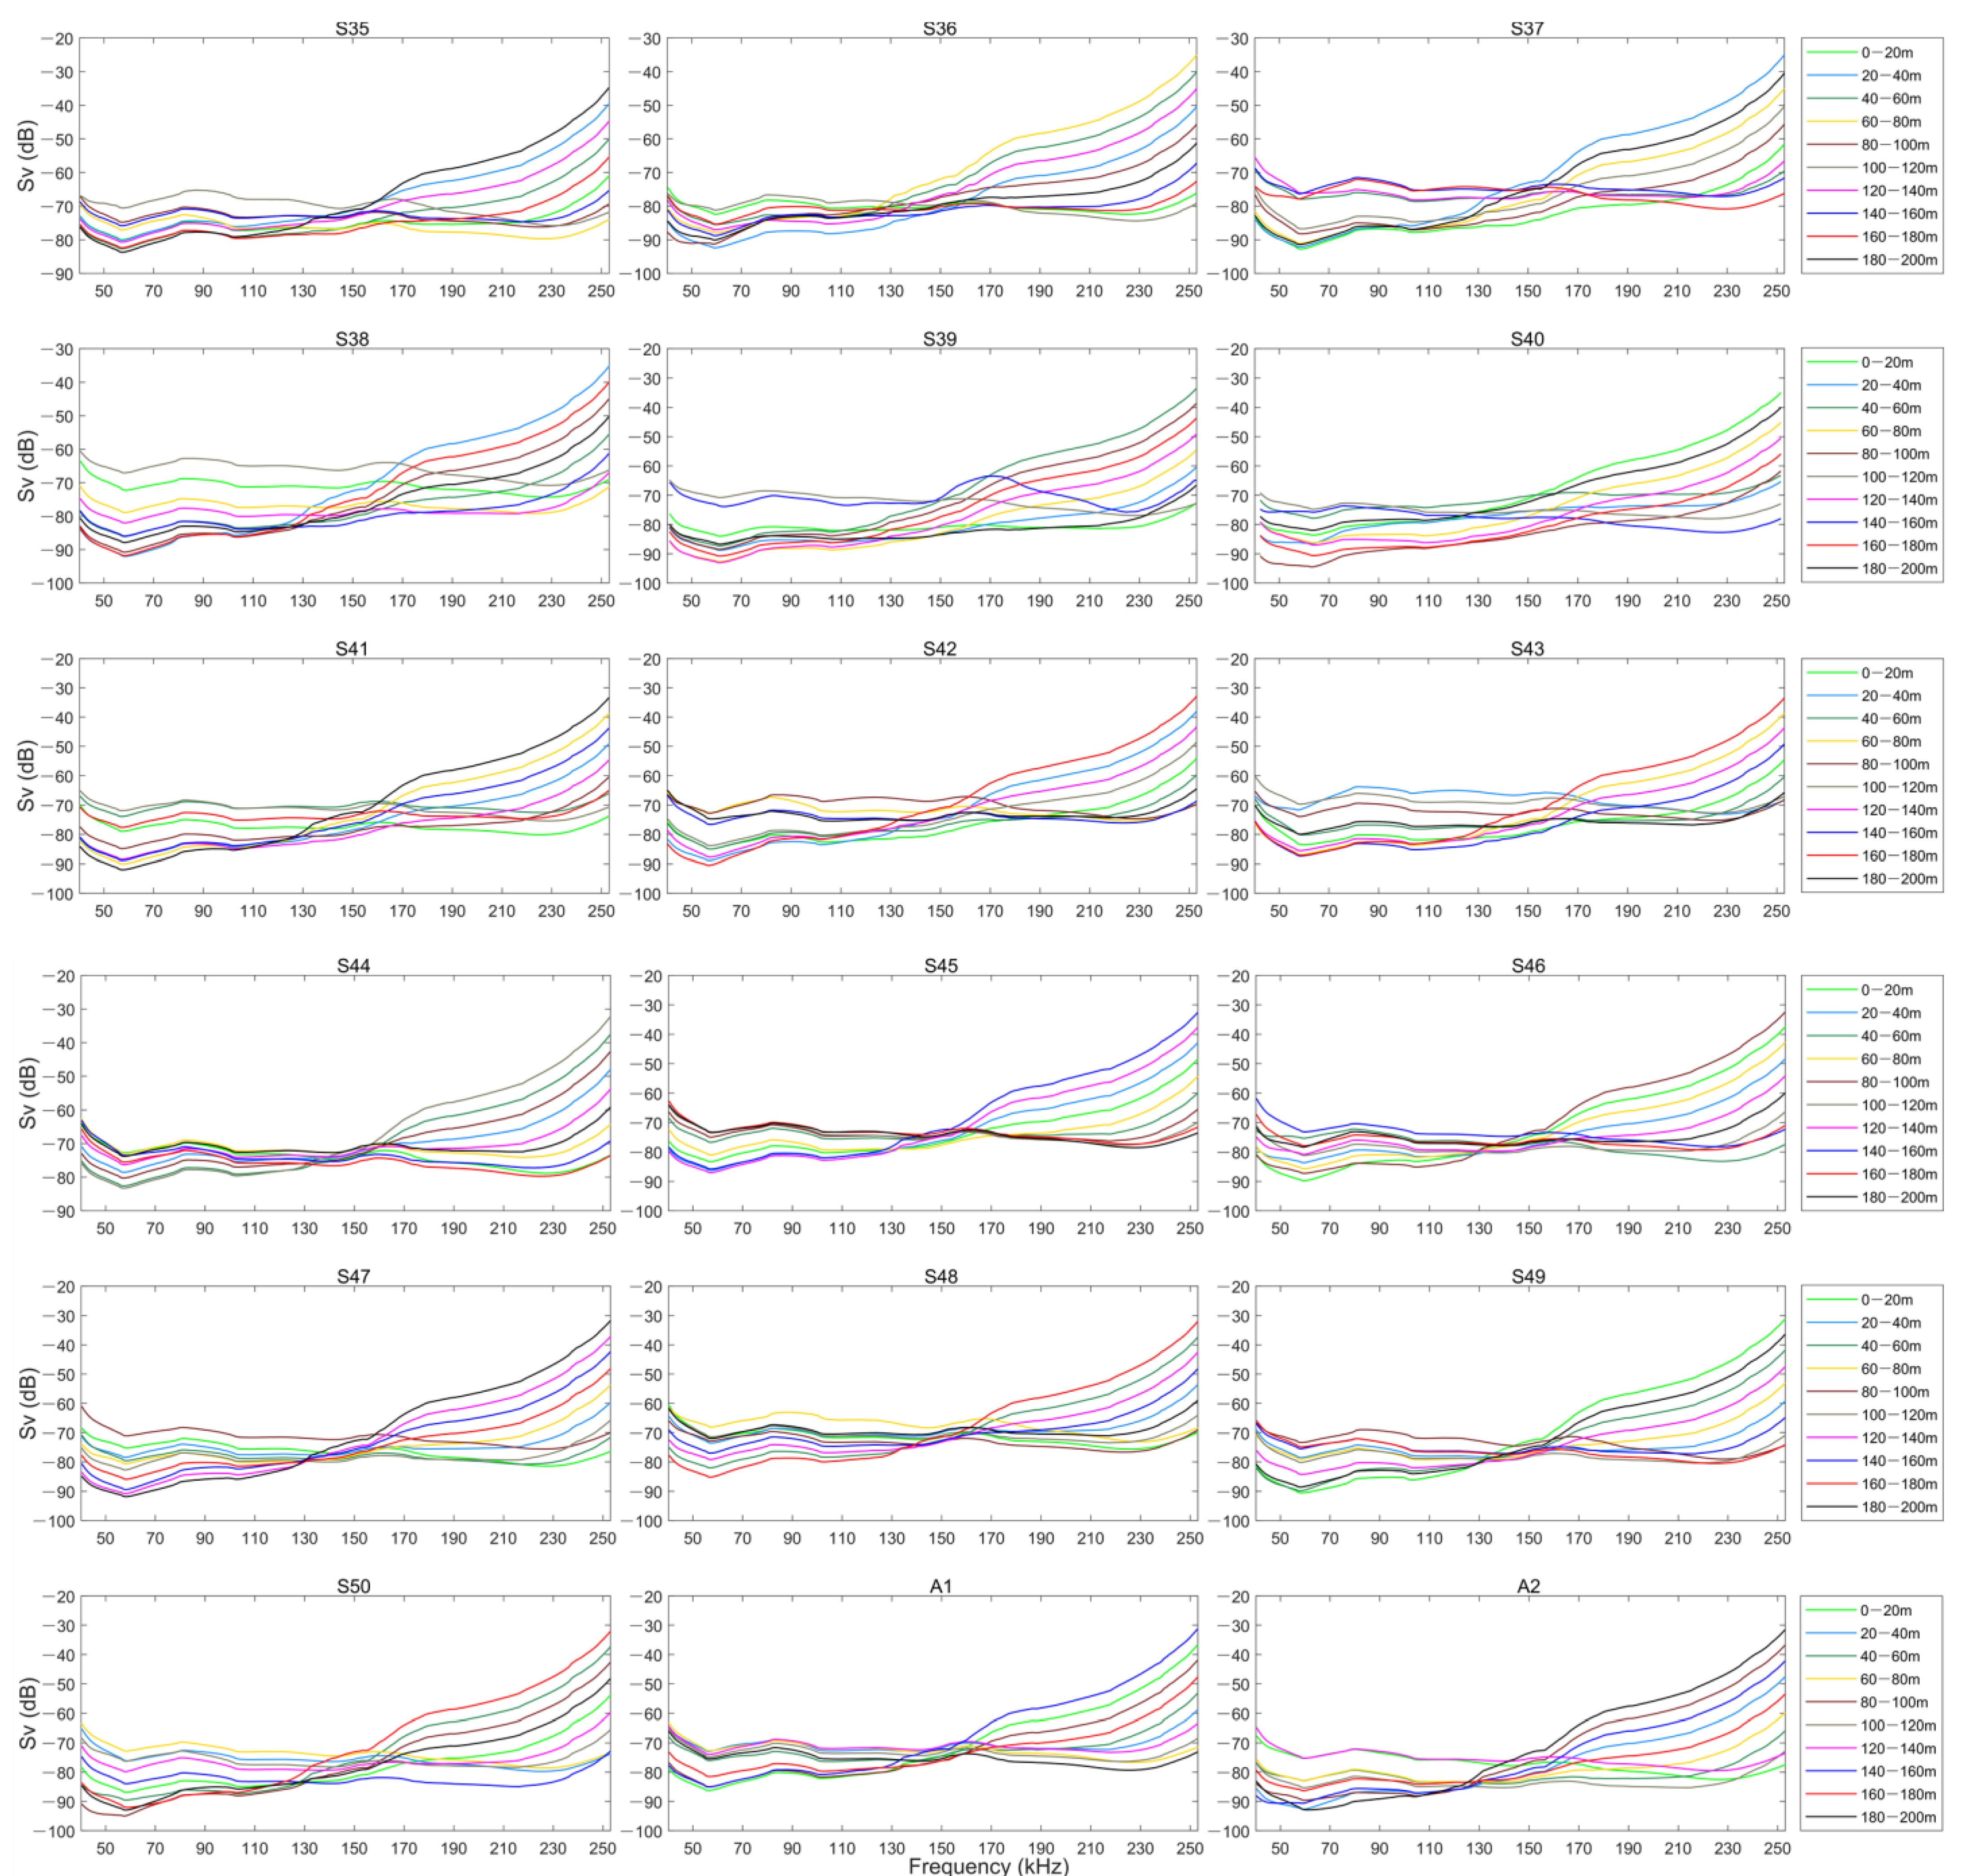
Figure 2 shows the variation of S V with the frequency of each layer at the 30 stations. Although the same layer’s S V values at different stations are quite different, the overall variation trends have little difference. With frequencies increasing, the S V value either rose directly or started to rise after a short decline. Besides, a large S V change, at most stations, appeared at about 170 kHz. The scattering strength changed little before 170 kHz, but after 170 kHz, the scattering of layers with high S V began to slightly decrease, while the scattering of layers with poor S V started rising. Similarly, the scattering strength in the water column at all levels rose rapidly after 230 kHz.

3.2. Echo-Integration

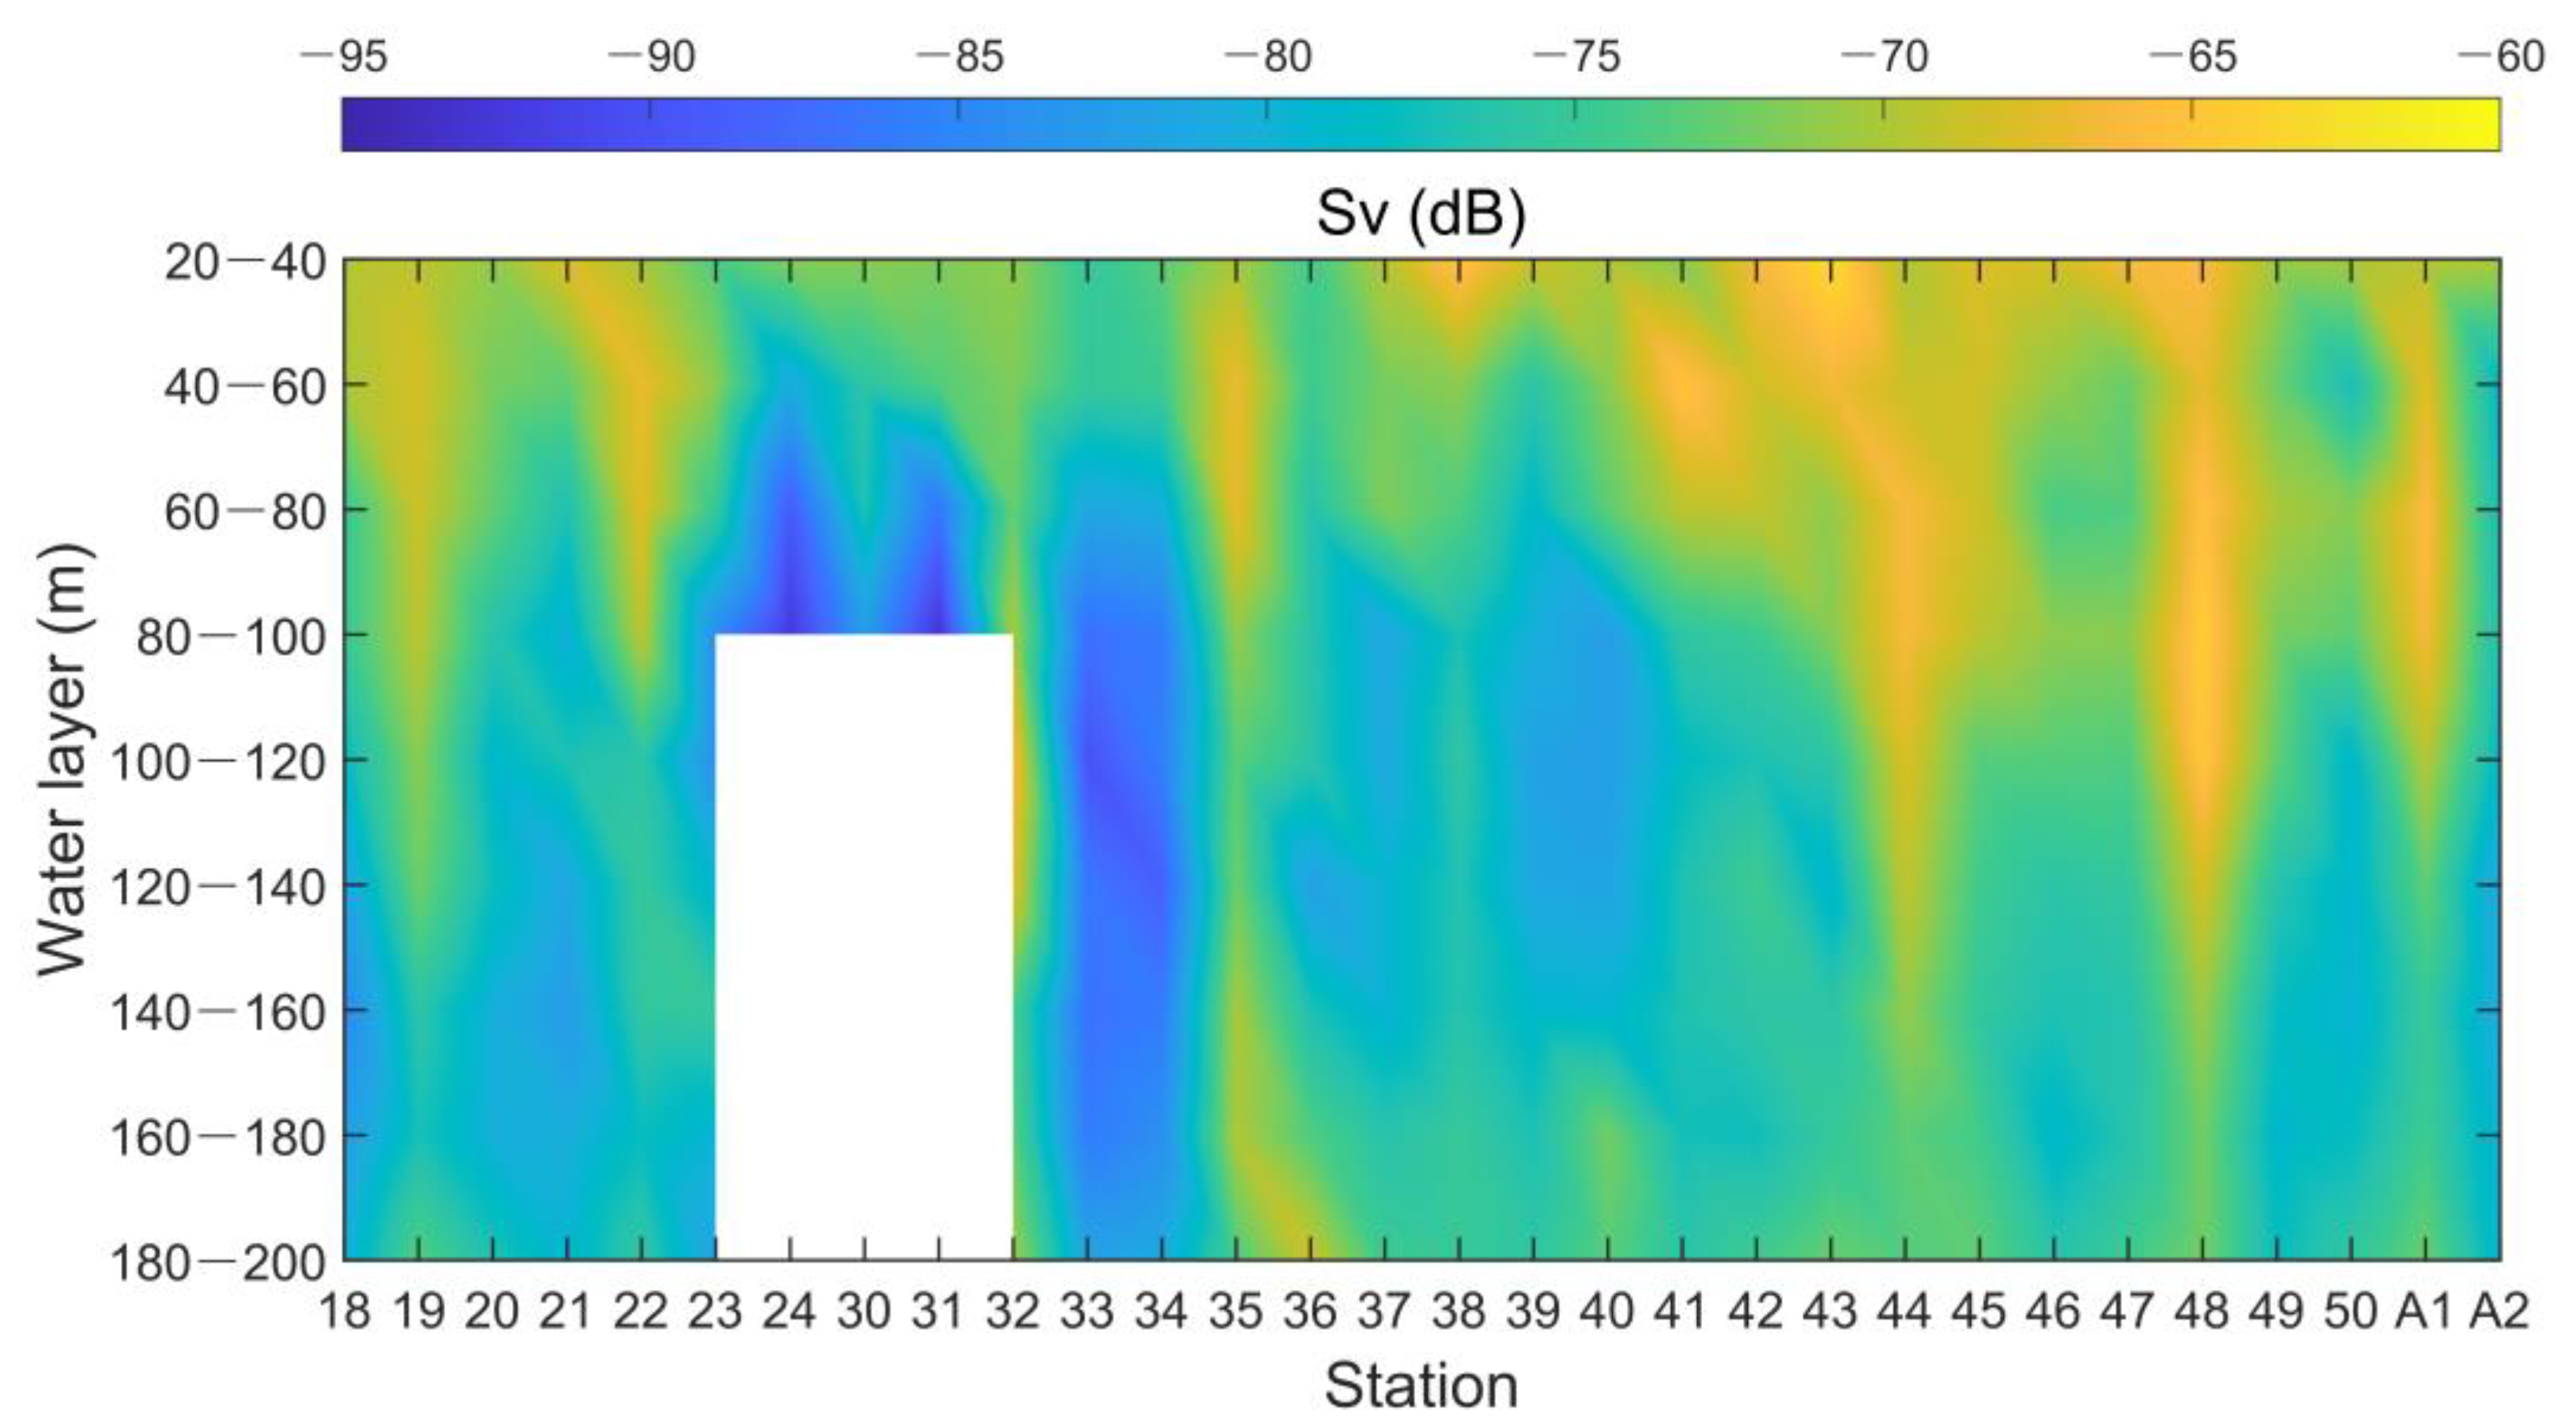
Figure 3 shows the distribution of the scattering strength at each station. The blank areas at Stations 24, 30, and 31 indicate that there were no valid data because data below 100 m were not collected at these stations. Overall, the observed S V value of each layer at different stations was −95–−60 dB, and this value was different in each layer. The S V values of 20–40 m layers were all above −70 dB, and stronger than those of other layers, then later dropped below −75 dB with the increase in depth. Besides, there were large differences of S V values between the 30 stations, which were mainly reflected along with the vertical extension with high scattering values. For example, the high scattering values at Stations 19, 22, 44, 48, and A1 extended to a deeper depth, and the maximum S V at Station 48 did not appear until about 100 m.
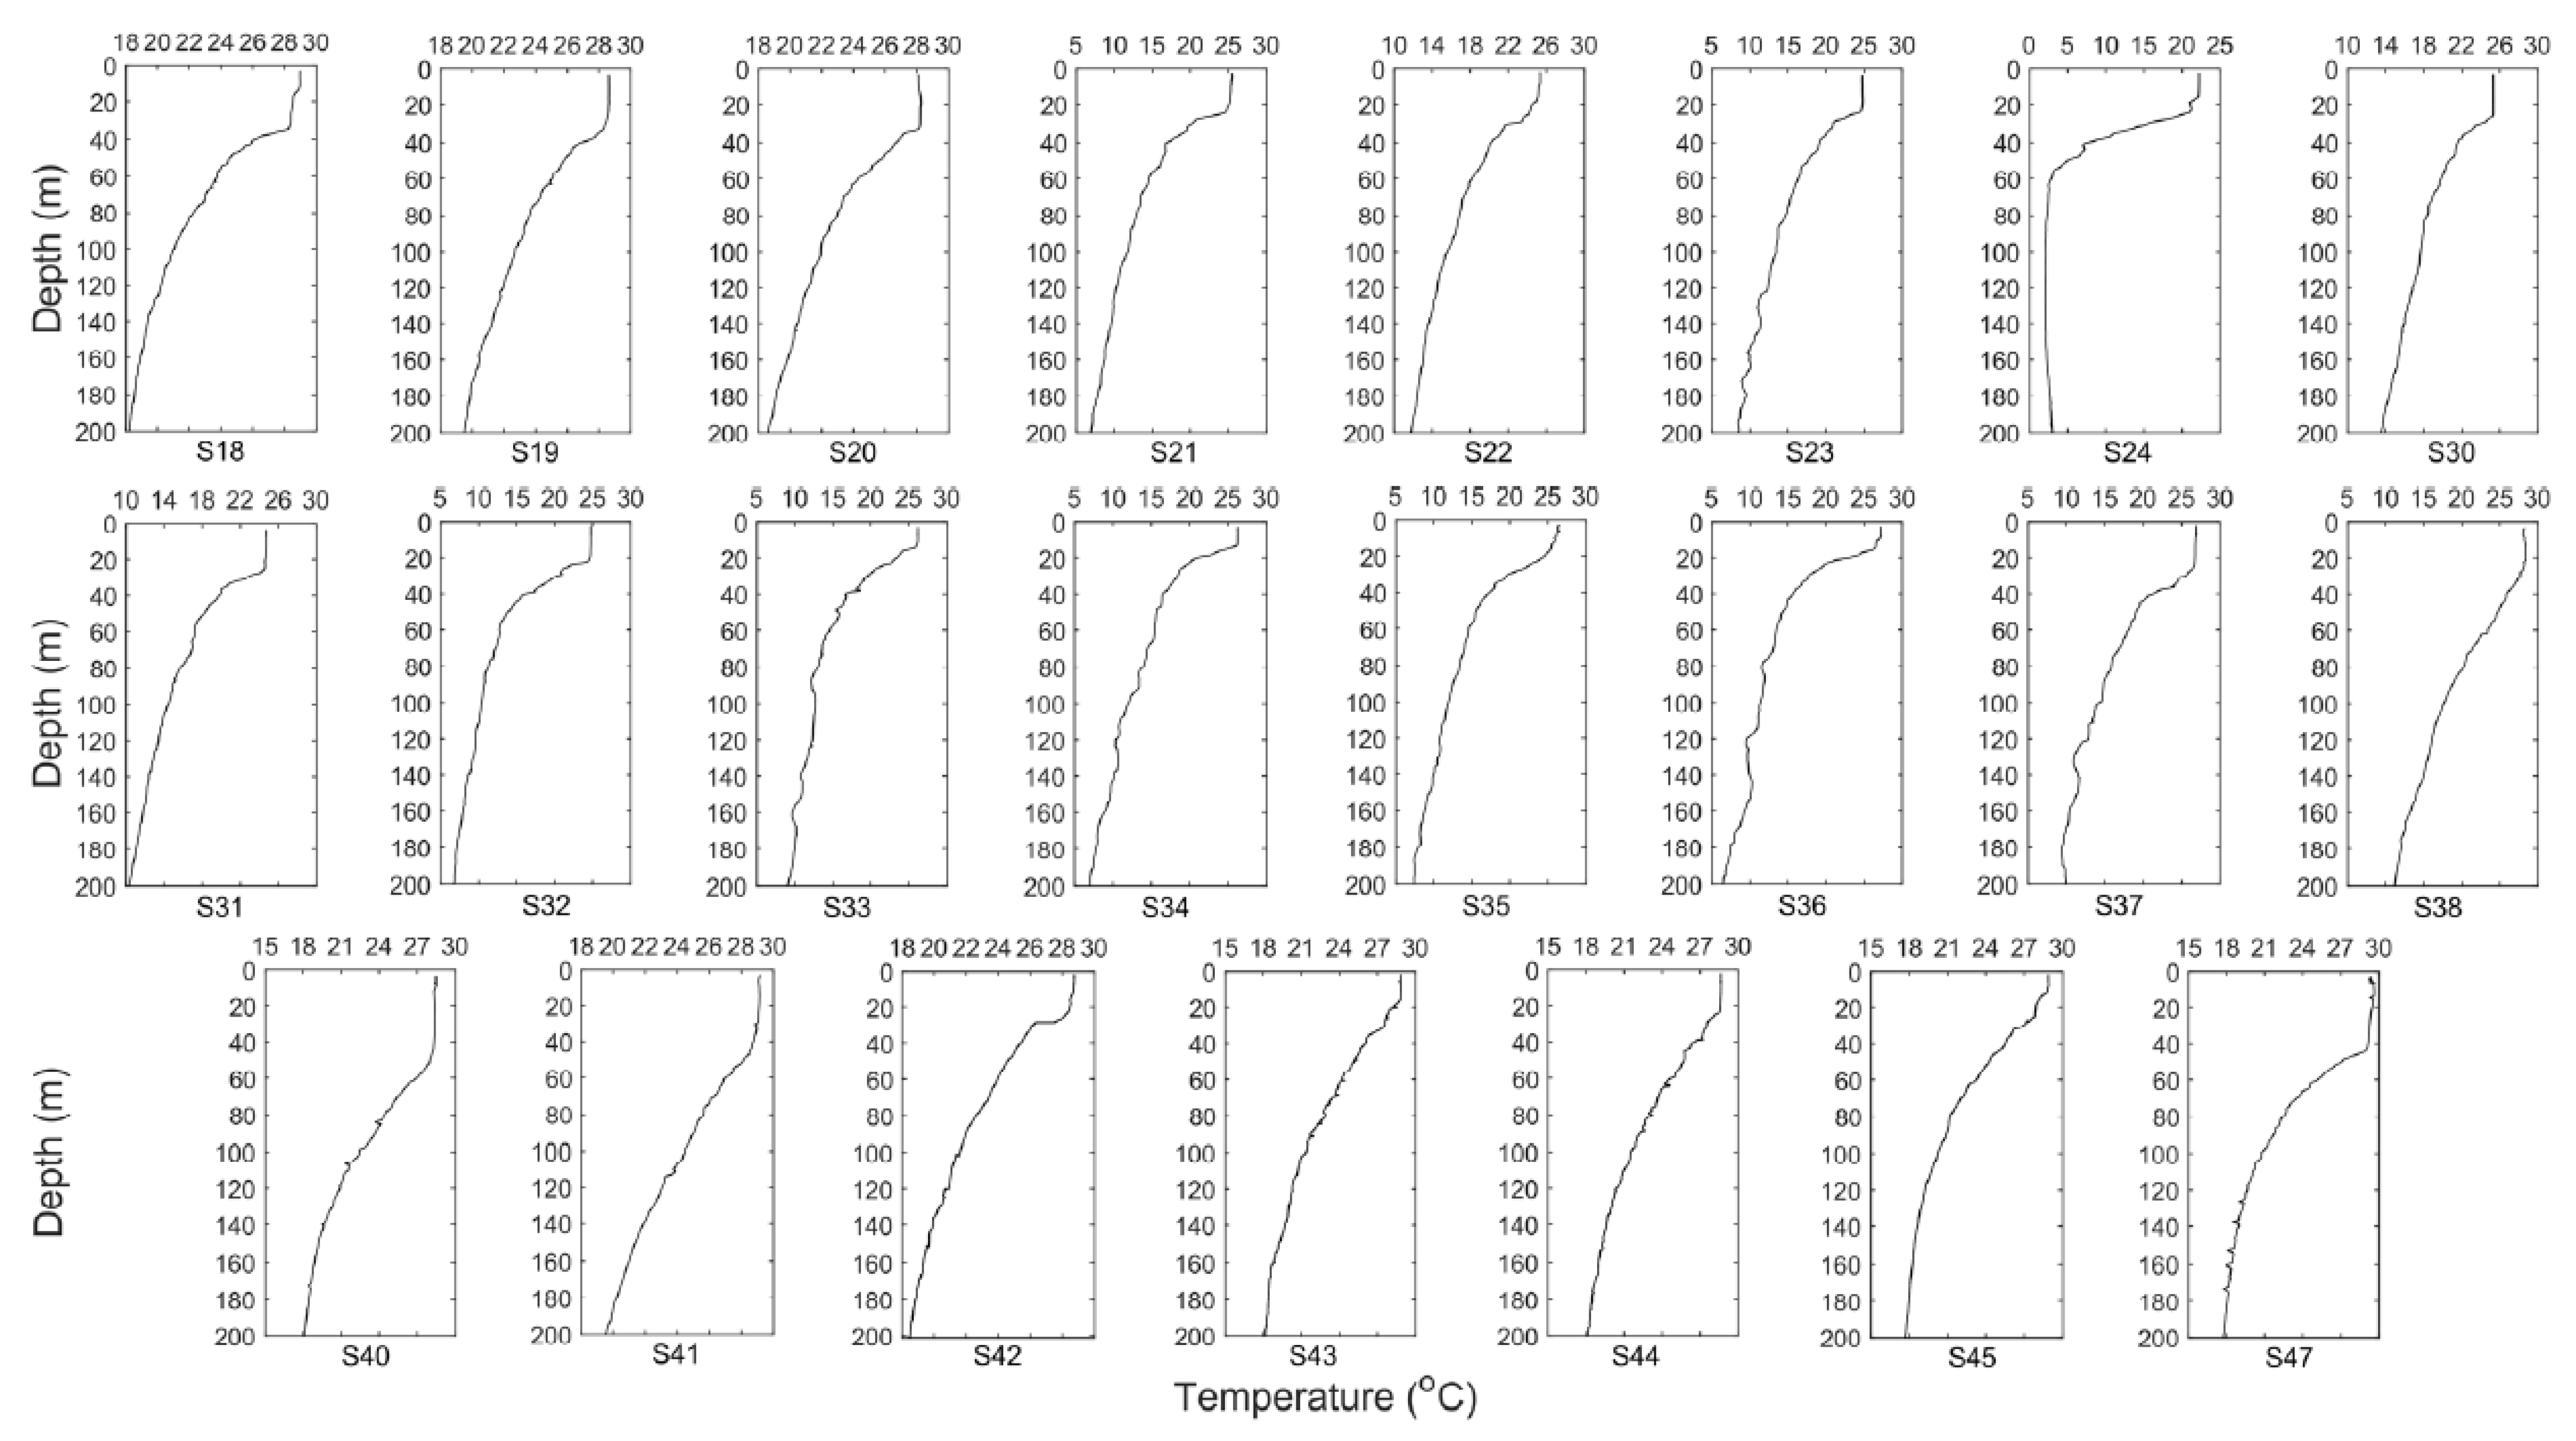
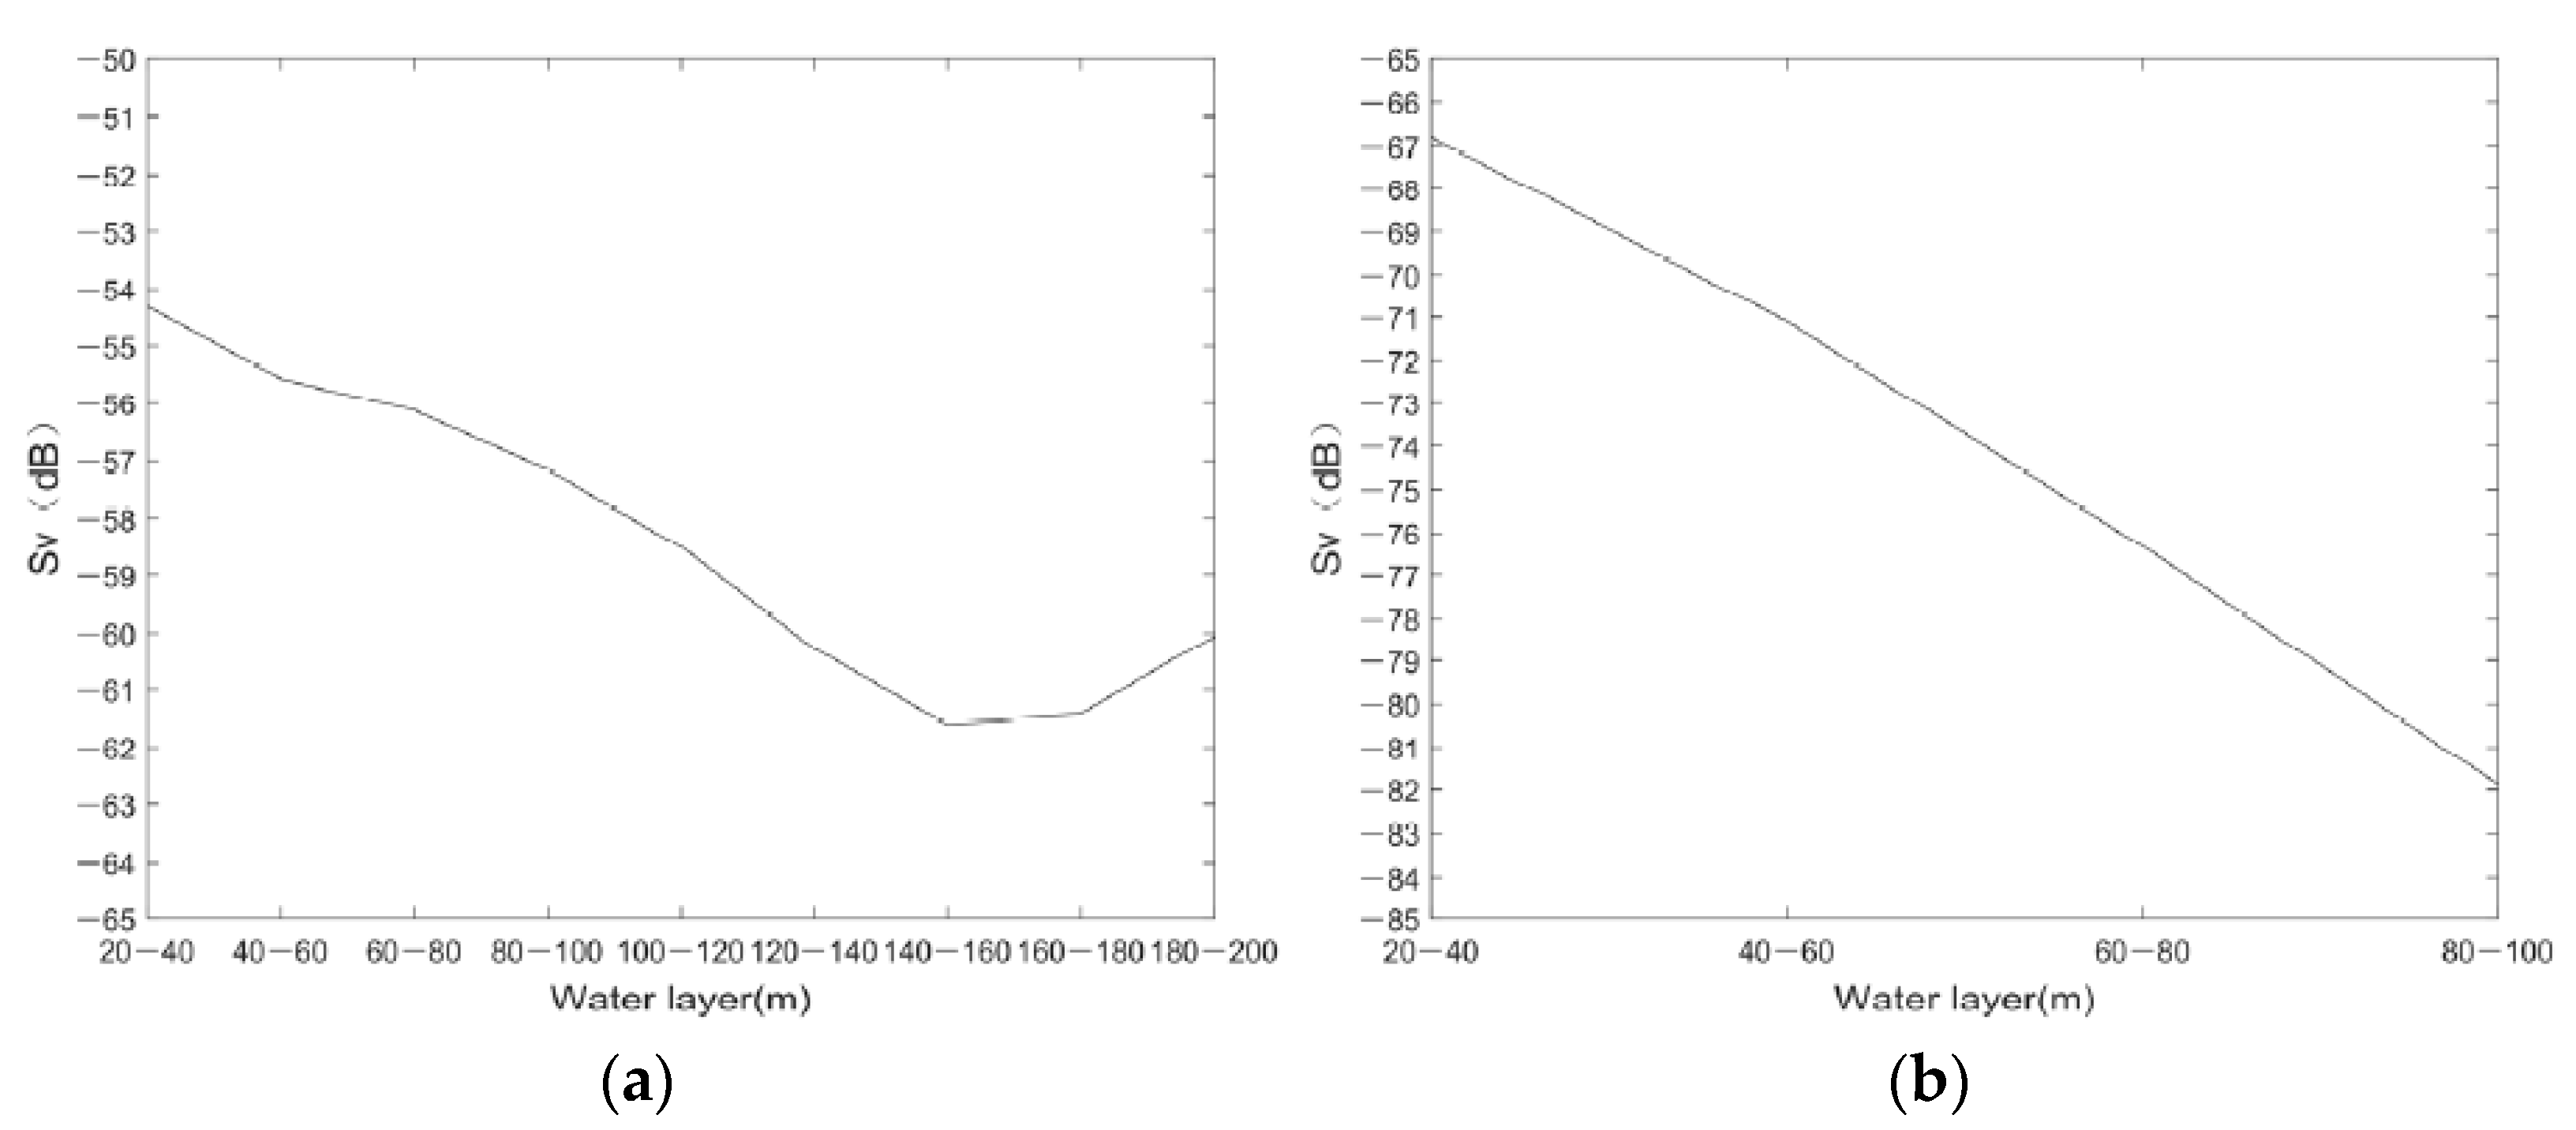
The temperature profiles of some stations collected by CTD are shown in Figure 4. The mean S V of each layer at the survey area analyzing the vertical distribution of the scattering strength is shown in Figure 5. The highest S V   value was −54.31 dB at the 20–40 m water layer (Figure 5a). S V continuously decreased right down to −61.61 dB with increase in water depth, and slightly increased to −61.41 and −60.06 dB below the 160–180 m water layer. Meanwhile, the scattering strength at Stations 24, 30, and 31 in Figure 5b was generally lower than the values in Figure 5a. It also showed a decreasing trend with depth.
On the horizontal level, the Pearson correlation analysis and linear regression results (without Stations 24, 30, and 31) shown in Figure 6 indicated that S V was not significantly correlated with longitude (R = 0.147, p = 0.466, p > 0.05), latitude (R = −0.239, p = 0.230, p > 0.05), and water temperature (R = 0.353, p = 0.116, p > 0.05).
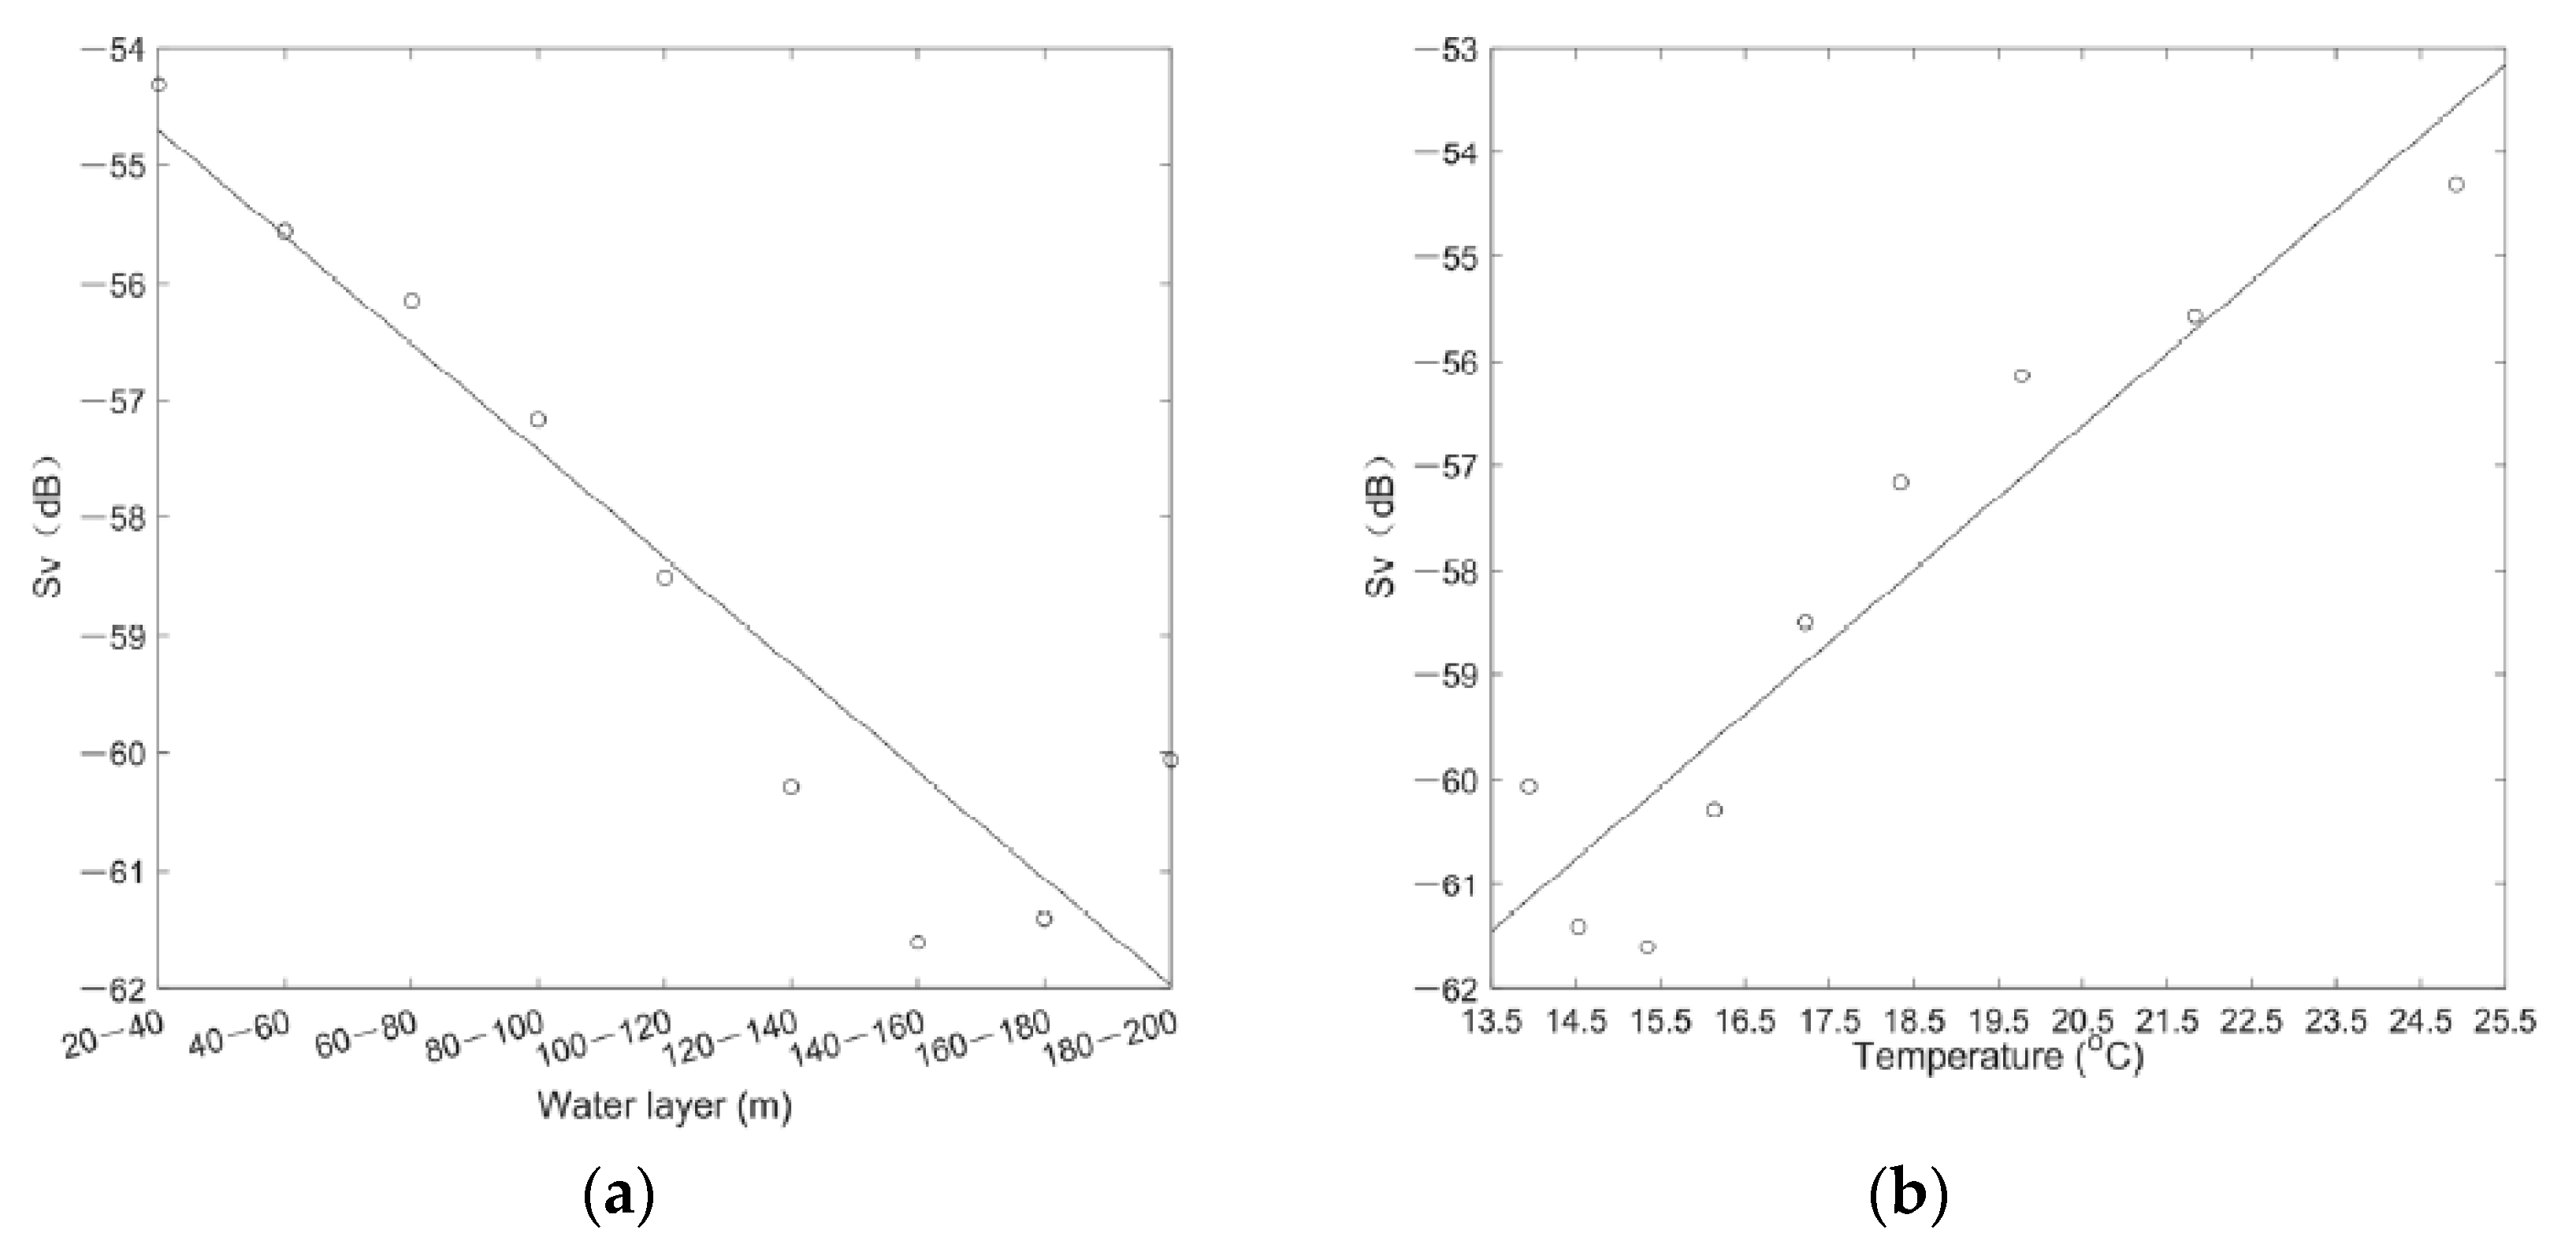
On the vertical level, the Pearson correlation analysis and linear regression results (without Stations 24, 30, and 31) show that S V was negatively correlated with depth (R = −0.933, p = 0.0002, p < 0.01) and positively correlated with water temperature (R = 0.939, p = 0.0002, p < 0.01) (Figure 7).

3.3. Diel Variation of Scattering Strength

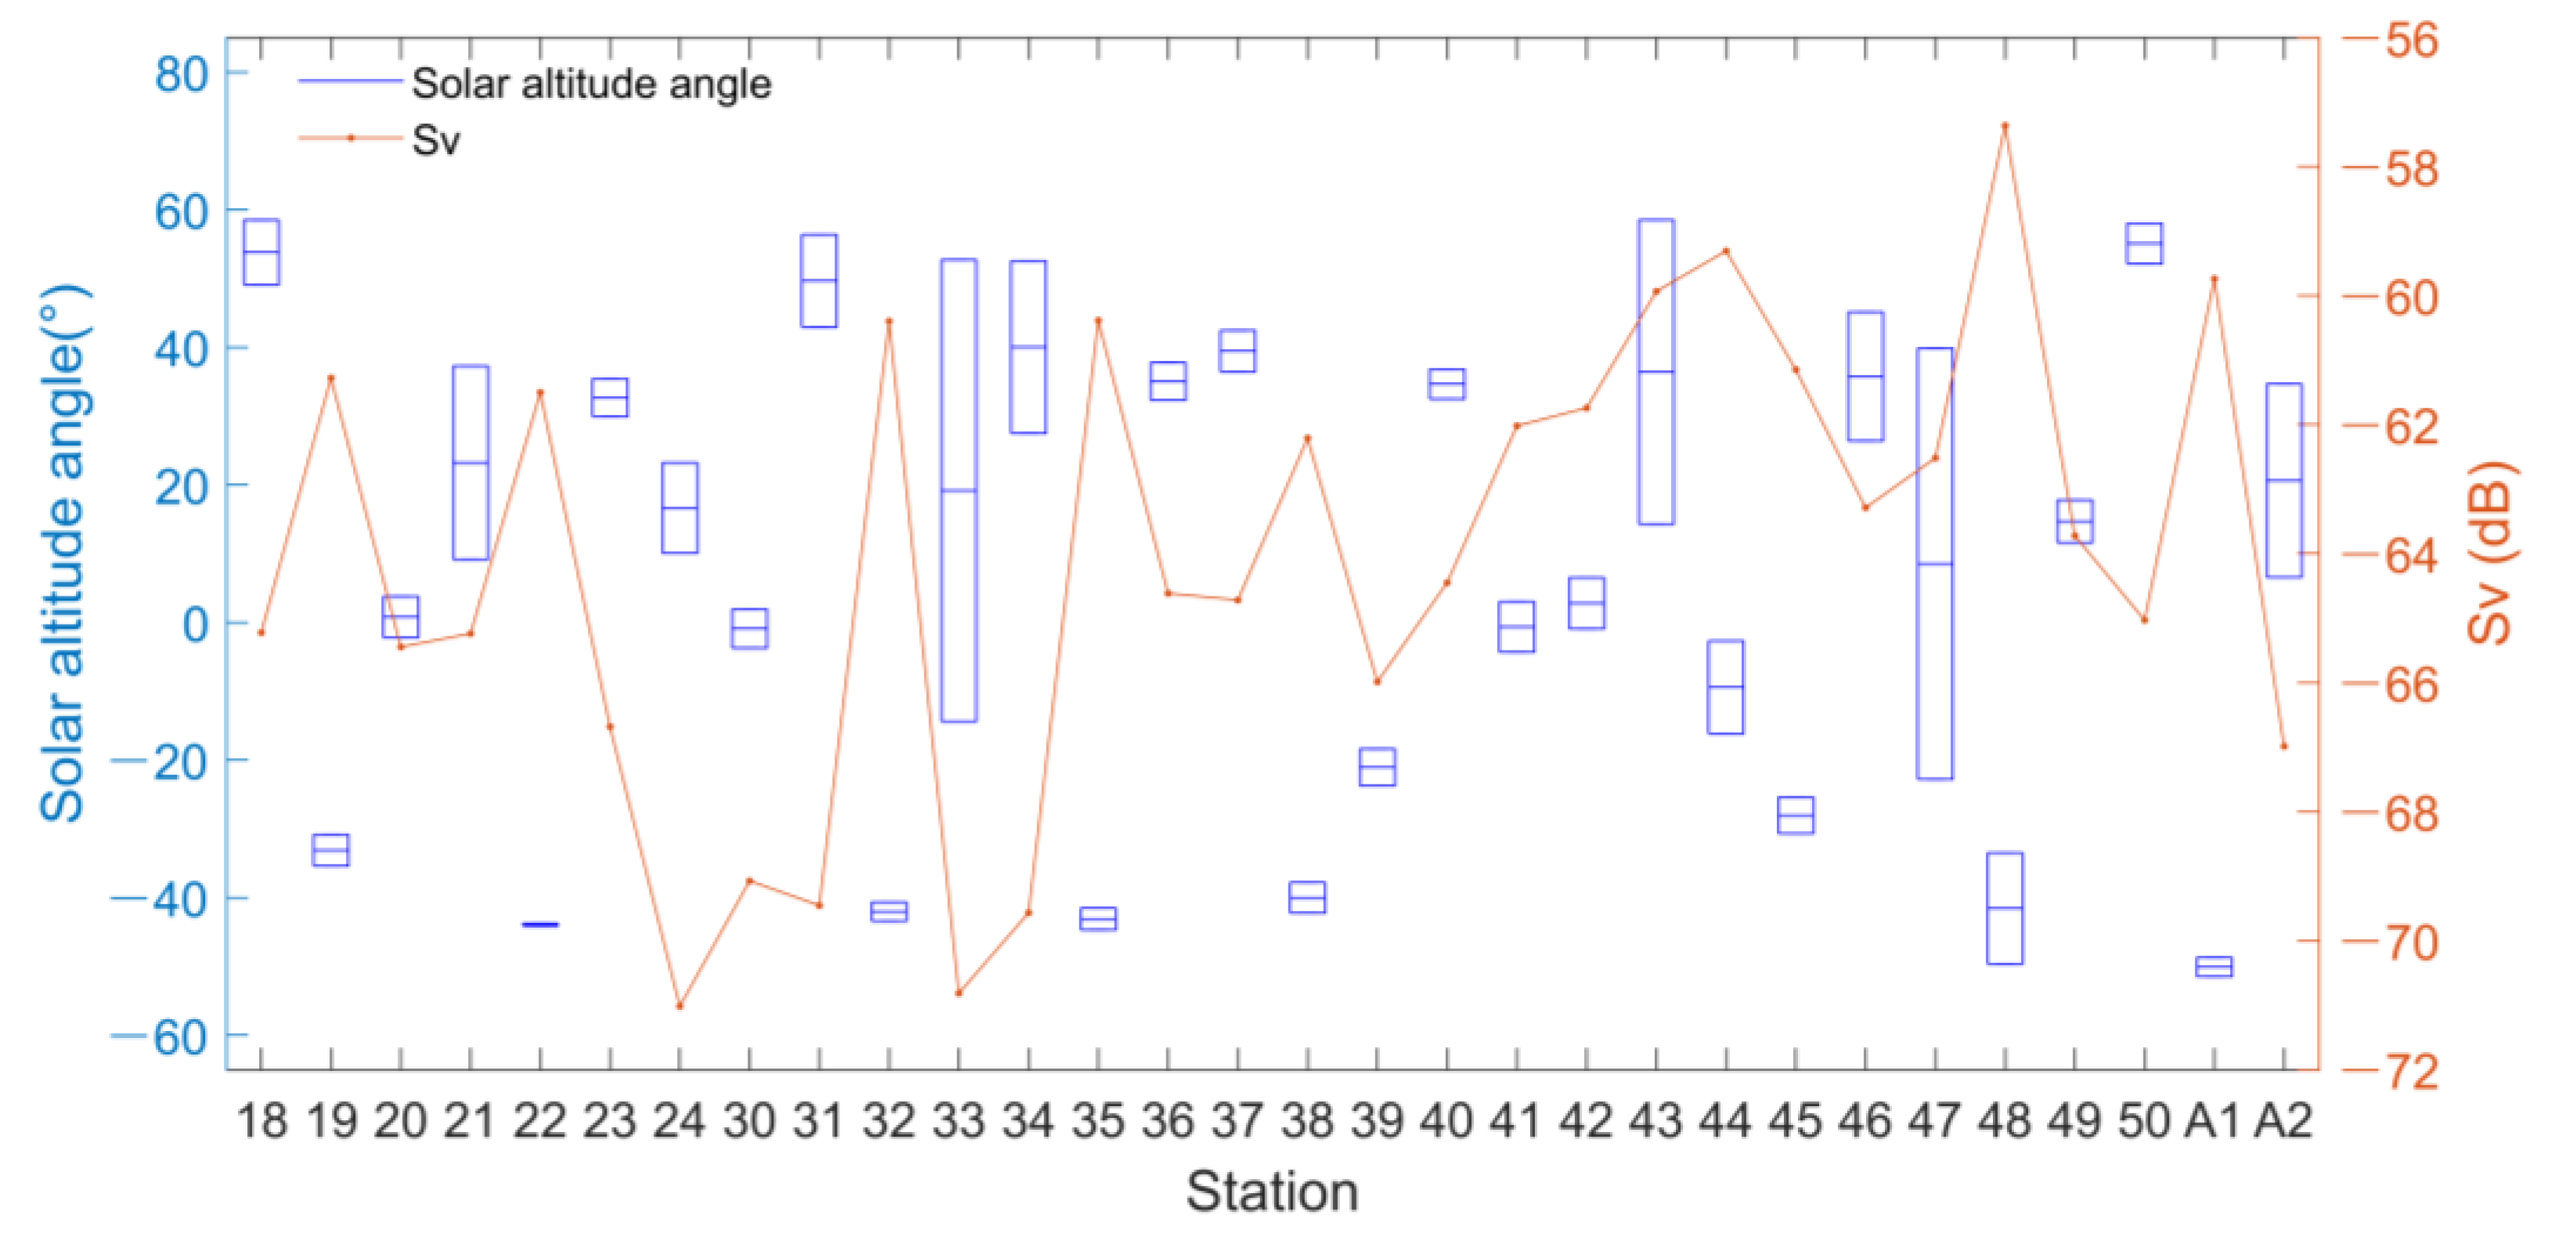
Figure 8 shows the solar altitude angle, positive during the day and negative at night, which corresponds with the survey time at each station. In order to understand the horizontal distribution of zooplankton and their relationship with solar height, the mean S V of each station was also exhibited. Station 48 had the largest S V value of −57.36 dB, while Station 24 had the lowest value of −71.02 dB. The magnitude of S V was closely synchronized with the solar altitude angle, which will get smaller when the angle tends to be positive and vice versa. The scattering strength peaks observed at Stations 19, 22, 32, 35, 38, 44, 48, and A1 all correspond to the negative solar altitude angles.

4. Discussion

4.1. Broadband Scattering Spectrogram

Because the backscattering of nonliving things in the ocean usually has little effects on sound scattering strength, sound scattering mainly originates from marine organisms [34]. Lavery et al. [33] simulated the variation of backscattering strength with frequencies of the main ocean biological scatters. Combining their results and our echograms, it could be concluded that zooplankton is the main origin of sound scattering in this paper. Therefore, the scattering strength of different layers and stations can reflect the zooplankton distribution. With the increase in frequency as seen in Figure 2, the S V value either rises directly or starts to rise after a short decline. This variation trend in our study is consistent and corroborates with the simulated study performed by Lavery et al. [33], who also reported the same tendency of the scattering strength increasing with frequency increase at certain ranges.

4.2. Echo-Integration

The mean scattering strength of each station in Figure 8 reflects the horizontal distribution of zooplankton. The S V of 30 stations in our study fell between −71.02 and −57.36 dB, which is consistent with the scattering characteristics of zooplankton layers reported by Batzler et al. [35]. They found that the S V of zooplankton layers in the Northwest Pacific Ocean was in the range −95–−50 dB. Figure 5 reflects the vertical distribution of zooplankton. With the highest latitudes of Stations 24, 30, and 31 close to the Oyashio current, their scattering strengths are generally lower than those of other stations. This indicates that the Kuroshio and Oyashio currents have a significant influence on scattering strength.
The correlations of scattering strength with depth and temperature on the vertical distribution both directly or indirectly indicate that temperature is an important factor affecting zooplankton distribution, and zooplankton tends to live in warmer places. However, no significant correlations were found between the scattering strength, latitude, and temperature on the horizontal distribution, and it is believed to be due to the diel scattering difference. The temperature profiles of some stations shown in Figure 4 exhibit higher temperature values above 40 m. We believe that the suitable temperature and abundant dissolved oxygen brought by sufficient illumination are beneficial to the survival of zooplankton. Besides, the thermocline could be observed at a water layer of 20–40 m in several stations. Due to the blocking effect of the thermocline, the higher temperatures at upper waters could not easily drop. Moreover, zooplankton prefers living around the thermocline because of the aggregation of chlorophyll and dissolved oxygen. The study about the relationship between backscattering strength and thermocline at the Taiwan Strait conducted by Lyu et al. [36] also showed a consistency of the position between temperature gradient peaks and scattering strength peaks. Therefore, it is viable to search for zooplankton swarm areas at positions around the thermocline.
Many studies have shown that the diel vertical migration (DVM) of zooplankton is mainly related to the illumination intensity [37,38,39]. In this paper, the scattering strength significantly changes with solar height, consistent with conclusions from these past studies. The scattering strength decreasing at sunrise indicates that zooplankton descends to deeper waters, while increases in the scattering strength after sunset indicates that zooplankton ascends to the surface. The continuous tracking of light could reduce its predation risk and avoid being detected by visual predators [39]. Therefore, zooplankton takes the disappearance of light in the nighttime as the signal to forage and moves to the surface. As their plumpness increases in the daytime, they descend to the deeper waters. As shown in Figure 6, no significant correlation between S V and latitude was observed. However, this could be caused by the difference in the times when data were collected. In this paper, data at each station were collected at different times when DVM had a significant influence on the result of the correlation analysis.
The confluence of the Kuroshio and the Oyashio is one of the factors affecting the zooplankton distribution. For example, the scattering strengths at Stations 23, 32, 33, 34, 35, 36, 37, and 39 at the cold area above the Kuroshio were lower than those obtained at Stations 44, 45, 46, 47, 48, 49, 50, A1, and A2 at the warm area below the Kuroshio. Moreover, the scattering differences among stations could be caused by the cold and warm vortices at the KOCR. The scattering strengths at Stations 34 and 36 near the warm vortex’s center were higher than that at Station 33 at that vortex’s edge. This difference is believed to be largely due to the higher temperature at the center of the warm vortex [40].
The distribution and migration of the sound scattering layer are influenced by various factors, such as dissolved oxygen, chlorophyll, and turbidity [36,41,42]. However, the factors affecting the scattering layer may be different in different regions, such as cloud shadows, moonlight conditions, and tidal dynamics, which may also affect the DVM. Omand et al. [43] revealed that cloud shadows in subpolar seas drive variability in surface photosynthetically available radiation, leading to vertical migration of zooplankton above 300 m. Last et al. [44] showed that changes in moonlight can drive the DVM during the Arctic winter, presumably because moonlight affects the predator–prey interactions. However, Petrusevich et al. [45] found tidal dynamics, not moonlight, to play an important role in the DVM of the scattering layer in Hudson Bay, which is unlike polar and subpolar oceans. The vertical migration of zooplankton will be obviously weakened during spring tide (occurring during the full moon and new moon phases) in order to avoid expending additional energy. Therefore, whether the sound scattering layer in our research area is closely related to other factors needs to be further studied.
In addition, research about broadband sound scattering is developing [46], and biological sampling is still essential for accurate species identification, classification, and abundance assessment from an echogram [47,48,49]. Therefore, future studies should combine broadband acoustic data with biological sampling to acquire more information about the species, abundance, and distribution of zooplankton at the Kuroshio–Oyashio confluence region.

Author Contributions

Methodology, S.T. and J.T.; formal analysis, M.X. and X.W.; writing—original draft preparation, M.X.; writing—review and editing, J.T. All authors have read and agreed to the published version of the manuscript.

Funding

This research was funded by the National Key R&D Program of China (2019YFD0901401, 2019YFD0901405), Shanghai Pujiang Program (16PJ1403900), and National Natural Science Foundation of China (41606210).

Institutional Review Board Statement

Not applicable.

Informed Consent Statement

Not applicable.

Data Availability Statement

Data are contained within the article.

Acknowledgments

The authors of this research would like to thank all the researchers and sailors on RVSonghang, especially Xiaoxue Du and Rude Pei, who contributed to the data collection during the marine survey.

Conflicts of Interest

The authors declare no conflict of interest.

References

  1. Howell, E.A.; Bograd, S.J.; Morishige, C.; Seki, M.P.; Polovina, J.J. On North Pacific circulation and associated marine debris concentration. Mar. Pollut. Bull. 2012, 65, 16–22. [Google Scholar] [CrossRef]
  2. Sugimoto, S.; Hanawa, K. Roles of SST anomalies on the wintertime turbulent heat fluxes in the Kuroshio-Oyashio confluence region: Influences of warm eddies detached from the Kuroshio extension. J. Clim. 2011, 24, 6551–6561. [Google Scholar] [CrossRef]
  3. Mitsudera, H.; Taguchi, B.; Yoshikawa, Y.; Nakamura, H.; Waseda, T.; Qu, T.D. Numerical study on the Oyashio water pathways in the Kuroshio–Oyashio confluence. J. Phys. Oceanogr. 2004, 34, 1174–1196. [Google Scholar] [CrossRef]
  4. Sugimoto, S.; Kobayashi, N.; Hanawa, K. Quasi-decadal variation in intensity of the western part of the winter subarctic SST front in the western north Pacific: The influence of Kuroshio extension path state. J. Phys. Oceanogr. 2014, 44, 2753–2762. [Google Scholar] [CrossRef]
  5. Tian, S.Q.; Xue, M.H.; Tong, J.F.; Wang, X.F. A review of the acoustic target strength of fishery resources in the North Pacific Ocean. J. Fish. Sci. China 2021, 28, 371–379. [Google Scholar]
  6. Lin, M.; Wang, C.G.; Wang, Y.G.; Xiang, P.; Wang, Y.; Lian, G.S.; Chen, R.X.; Chen, X.Y.; Ye, Y.Y.; Dai, Y.Y.; et al. Zooplanktonic diversity in the Western Pacific. Biodiv. Sci. 2011, 19, 646–654. [Google Scholar]
  7. Huang, R.H.; Huangfu, J.L.; Wu, L.; Feng, T.; Chen, G.H. Research on the interannual and interdecadal variabilities of the monsoon trough and their impacts on tropical cyclone genesis over the Western North Pacific Ocean. J. Trop. Meteorol. 2018, 24, 395–420. [Google Scholar]
  8. Freeshah, M.; Zhang, X.H.; Şentürk, E.; Adil, M.A.; Mousa, B.G.; Tariq, A.; Ren, X.D.; Refaat, M. Analysis of atmospheric and ionospheric variations due to impacts of super typhoon Mangkhut (1822) in the Northwest Pacific Ocean. Remote Sens. 2021, 13, 661. [Google Scholar] [CrossRef]
  9. Miyamoto, H.; Vijai, D.; Kidokoro, H.; Tadokoro, K.; Watanabe, T.; Fuji, T.; Suyama, S. Geographic variation in feeding of Pacific saury Cololabis saira in June and July in the North Pacific Ocean. Fish. Oceanogr. 2020, 29, 558–571. [Google Scholar] [CrossRef]
  10. Chiba, S.; Sugisaki, H.; Nonaka, M.; Saino, T. Geographical shift of zooplankton communities and decadal dynamics of the Kuroshio-Oyashio currents in the western North Pacific. Global Change Biol. 2009, 15, 1846–1858. [Google Scholar] [CrossRef]
  11. Sun, D.; Wang, C.H. Latitudinal distribution of zooplankton communities in the Western Pacific along 160° E during summer 2014. J. Marine Syst. 2017, 169, 52–60. [Google Scholar] [CrossRef]
  12. Sun, D.; Zhang, D.S.; Zhang, R.Y.; Wang, C.S. Different vertical distribution of zooplankton community between North Pacific Subtropical Gyre and Western Pacific Warm Pool: Its implication to carbon flux. Acta Oceanol. Sin. 2019, 38, 32–45. [Google Scholar] [CrossRef]
  13. Sigler, M.F.; Csepp, D.J. Seasonal abundance of two important forage species in the North Pacific Ocean, Pacific herring and walleye pollock. Fish. Res. 2007, 83, 319–331. [Google Scholar] [CrossRef]
  14. Hewitt, R.P.; Demer, D.A. The use of acoustic sampling to estimate the dispersion and abundance of euphausiids, with an emphasis on Antarctic krill, Euphausia superba. Fish. Res. 2000, 47, 215–229. [Google Scholar] [CrossRef]
  15. Cooney, R.T. Acoustic evidence for the vertical partitioning of biomass in the epipelagic zone of the Gulf of Alaska. Deep-Sea Res. Part A 1989, 36, 1177–1189. [Google Scholar] [CrossRef]
  16. Nash, R.D.M.; Magnuson, J.J.; Stanton, T.K.; Clay, C.S. Distribution of peaks of 70 kHz acoustic scattering in relation to depth and temperature during day and night at the edge of the Gulf Stream-Echo Front 83. Deep-Sea Res. Part A 1989, 36, 587–596. [Google Scholar] [CrossRef]
  17. Nero, R.W.; Magnuson, J.J.; Brandt, S.B.; Stanton, T.K.; Jech, J.M. Finescale biological patchiness of 70kHz acoustic scattering at the edge of the Gulf Stream-Echo Front 85. Deep-Sea Res. Part A 1990, 37, 999–1016. [Google Scholar] [CrossRef]
  18. Chiba, S.; Lorenzo, E.D.; Davis, A.; Keister, J.E.; Taguchi, B.; Sasai, Y.; Sugisaki, H. Large-scale climate control of zooplankton transport and biogeography in the Kuroshio-Oyashio Extension region. Geophys. Res. Lett. 2013, 40, 5182–5187. [Google Scholar] [CrossRef]
  19. Roberts, P.L.D.; Jaffe, J.S. Classification of live, untethered zooplankton from observations of multiple-angle acoustic scatter. J. Acoust. Soc. Am. 2008, 124, 796–802. [Google Scholar] [CrossRef]
  20. Ross, T.; Keister, J.E.; Lara-Lopez, A. On the use of high-frequency broadband sonar to classify biological scattering layers from a cabled observatory in Saanich Inlet, British Columbia. Methods Oceanogr. 2013, 5, 19–38. [Google Scholar] [CrossRef]
  21. Blanluet, A.; Doray, M.; Berger, L.; Romagnan, J.B.; Bouffant, N.L.; Lehuta, L.; Petitgas, P. Characterization of sound scattering layers in the Bay of Biscay using broadband acoustics, nets and video. PLoS ONE 2019, 14, e0223618. [Google Scholar] [CrossRef] [PubMed]
  22. Proud, R.; Cox, M.J.; Wotherspoon, S.; Brierley, A.S. A method for identifying sound scattering layers and extracting key characteristics. Meth. Ecol. Evol. 2015, 6, 1190–1198. [Google Scholar] [CrossRef] [Green Version]
  23. Irigoien, X.; Klevjer, T.A.; Røstad, A.; Martinez, U.; Boyra, G.; Acuña, J.L.; Bode, A.; Echevarria, F.; Gonzalez-Gordillo, J.I.; Hernandez-Leon, S.; et al. Large mesopelagic fishes biomass and trophic efficiency in the open ocean. Nat. Commun. 2014, 5, 3271. [Google Scholar] [CrossRef] [PubMed] [Green Version]
  24. Proud, R.; Cox, M.J.; Le Guen, C.; Brierley, A.S. Fine-scale depth structure of pelagic communities throughout the global ocean based on acoustic sound scattering layers. Mar. Ecol. Prog. Ser. 2018, 598, 35–48. [Google Scholar] [CrossRef] [Green Version]
  25. Demer, D.A.; Berger, L.; Bernasconi, M.; Bethke, E.; Boswell, K.; Chu, D.; Domokos, R.; Dunford, A.; Fassler, S.; Gauthier, S. Calibration of Acoustic Instruments, 1st ed.; International Council for the Exploration of the Sea: Copenhagen, Denmark, 2015; pp. 34–39. [Google Scholar]
  26. Earth: A Global Map of Wind, Weather, and Ocean Conditions. Available online: https://earth.nullschool.net/ (accessed on 7 May 2021).
  27. Ladroit, Y.; Escobar-Flores, P.C.; Schimel, A.C.G.; O’Driscoll, R.L. ESP3: An open-source software for the quantitative processing of hydro-acoustic data. SoftwareX 2020, 12, 100581. [Google Scholar] [CrossRef]
  28. Robertis, A.D.; Higginbottom, I. A post-processing technique to estimate the signal-to-noise ratio and remove echosounder background noise. ICES J. Mar. Sci. 2007, 64, 1282–1291. [Google Scholar] [CrossRef] [Green Version]
  29. Ryan, T.E.; Downie, R.A.; Kloser, R.J.; Keith, G. Reducing bias due to noise and attenuation in open-ocean echo integration data. ICES J. Mar. Sci. 2015, 72, 2482–2493. [Google Scholar] [CrossRef] [Green Version]
  30. Anderson, C.I.H.; Brierley, A.S.; Armstrong, F. Spatio-temporal variability in the distribution of epi- and meso-pelagic acoustic backscatter in the Irminger Sea, North Atlantic, with implications for predation on Calanus finmarchicus. Mar. Biol. 2004, 146, 1177–1188. [Google Scholar] [CrossRef]
  31. Iida, K.; Mukai, T.; Hwang, D. Relationship between acoustic backscattering strength and density of zooplankton in the sound-scattering layer. ICES J. Mar. Sci. 1996, 53, 507–512. [Google Scholar] [CrossRef]
  32. Simmonds, J.; MacLennan, D.N. Fisheries Acoustics: Theory and Practice, 2nd ed.; Blackwell Publishing: Hoboken, NJ, USA, 2005. [Google Scholar]
  33. Lavery, A.C.; Wiebe, P.H.; Stanton, T.K.; Lawson, G.L.; Benfield, M.C.; Copley, N. Determining dominant scatterers of sound in mixed zooplankton populations. J. Acoust. Soc. Am. 2007, 122, 3304–3326. [Google Scholar] [CrossRef] [Green Version]
  34. Urick, R.J. Principles of Underwater Sound, 3rd ed.; Peninsula Publishing: Westport, CT, USA, 2013. [Google Scholar]
  35. Batzler, W.E.; Vent, R.J. Volume-scattering measurements at 12 kc/sec in the Western Pacific. J. Acoust. Soc. Am. 1967, 41, 154–157. [Google Scholar] [CrossRef]
  36. Lyu, L.G.; Qiao, F.L.; Ge, R.F.; Lu, Y.; Liu, J.J. Study on the relationship between backscatter strength and thermocline. Adv. Mar. Sci. 2003, 21, 465–470. [Google Scholar]
  37. Kaartvedt, S.; Røstad, A.; Aksnes, D.L. Changing weather causes behavioral responses in the lower mesopelagic. Mar. Ecol. Prog. Ser. 2017, 574, 259–263. [Google Scholar] [CrossRef]
  38. Klevjer, T.A.; Irigoien, X.; Røstad, A.; Fraile-Nuez, E.; Benítez-Barrios, V.M.; Kaartvedt, S. Large scale patterns in vertical distribution and behaviour of mesopelagic scattering layers. Sci. Rep. 2016, 6, 19873. [Google Scholar] [CrossRef] [PubMed] [Green Version]
  39. Aksnes, D.L.; Røstad, A.; Kaartvedt, S.; Martinez, U.; Duarte, C.M.; Irigoien, X. Light penetration structures the deep acoustic scattering layers in the global ocean. Sci. Adv. 2017, 3, e1602468. [Google Scholar] [CrossRef] [PubMed] [Green Version]
  40. Aoki, I.; Inagaki, T. Acoustic observations of fish schools and scattering layers in a Kuroshio warm-core ring and its environs. Fish. Oceanogr. 1992, 1, 137–142. [Google Scholar] [CrossRef]
  41. Teo, S.L.H.; Kudela, R.M.; Rais, A.; Perle, C.; Costa, D.P.; Block, B.A. Estimating chlorophyll profiles from electronic tags deployed on pelagic animals. Aquat. Biol. 2009, 5, 195–207. [Google Scholar] [CrossRef]
  42. Proud, R.; Cox, M.J.; Brierley, A.S. Biogeography of the global ocean’s mesopelagic zone. Curr. Biol. 2017, 27, 113–119. [Google Scholar] [CrossRef] [Green Version]
  43. Omand, M.M.; Steinberg, D.K.; Stamieszkin, K. Cloud shadows drive vertical migrations of deep-dwelling marine life. Proc. Natl. Acad. Sci. USA 2021, 118, e2022977118. [Google Scholar] [CrossRef]
  44. Last, K.S.; Hobbs, L.; Berge, J.; Brierley, A.S.; Cottier, F. Moonlight drives ocean-scale mass vertical migration of zooplankton during the Arctic winter. Curr. Biol. 2016, 26, 244–251. [Google Scholar] [CrossRef] [Green Version]
  45. Petrusevich, V.Y.; Dmitrenko, I.A.; Niemi, A.; Kirillov, S.A.; Kamula, C.M.; Kuzyk, Z.Z.A.; Barber, D.G.; Ehn, J.K. Impact of tidal dynamics on diel vertical migration of zooplankton in Hudson Bay. Ocean Sci. 2020, 16, 337–353. [Google Scholar] [CrossRef] [Green Version]
  46. Stanton, T.K.; Chu, D.; Jech, J.M.; Irish, J.D. New broadband methods for resonance classification and high-resolution imagery of fish with swimbladders using a modified commercial broadband echosounder. ICES J. Mar. Sci. 2010, 67, 365–378. [Google Scholar] [CrossRef] [Green Version]
  47. Holliday, D.V. Extracting bio-physical information from the acoustic signatures of marine organisms. In: Oceanic sound scattering prediction. Ocean. Sound Scatt. Predict. 1977, 5, 619–624. [Google Scholar]
  48. Greenlaw, C.F. Acoustical estimation of zooplankton populations. Limnol. Oceanogr. 1979, 24, 226–242. [Google Scholar] [CrossRef]
  49. Lawson, G.L.; Wiebe, P.H.; Stanton, T.K.; Ashjian, C.J. Euphausiid distribution along the Western Antarctic Peninsula-Part A: Development of robust multi-frequency acoustic techniques to identify euphausiid aggregations and quantify euphausiid size, abundance, and biomass. Deep-Sea Res. Part II 2008, 55, 412–431. [Google Scholar] [CrossRef]
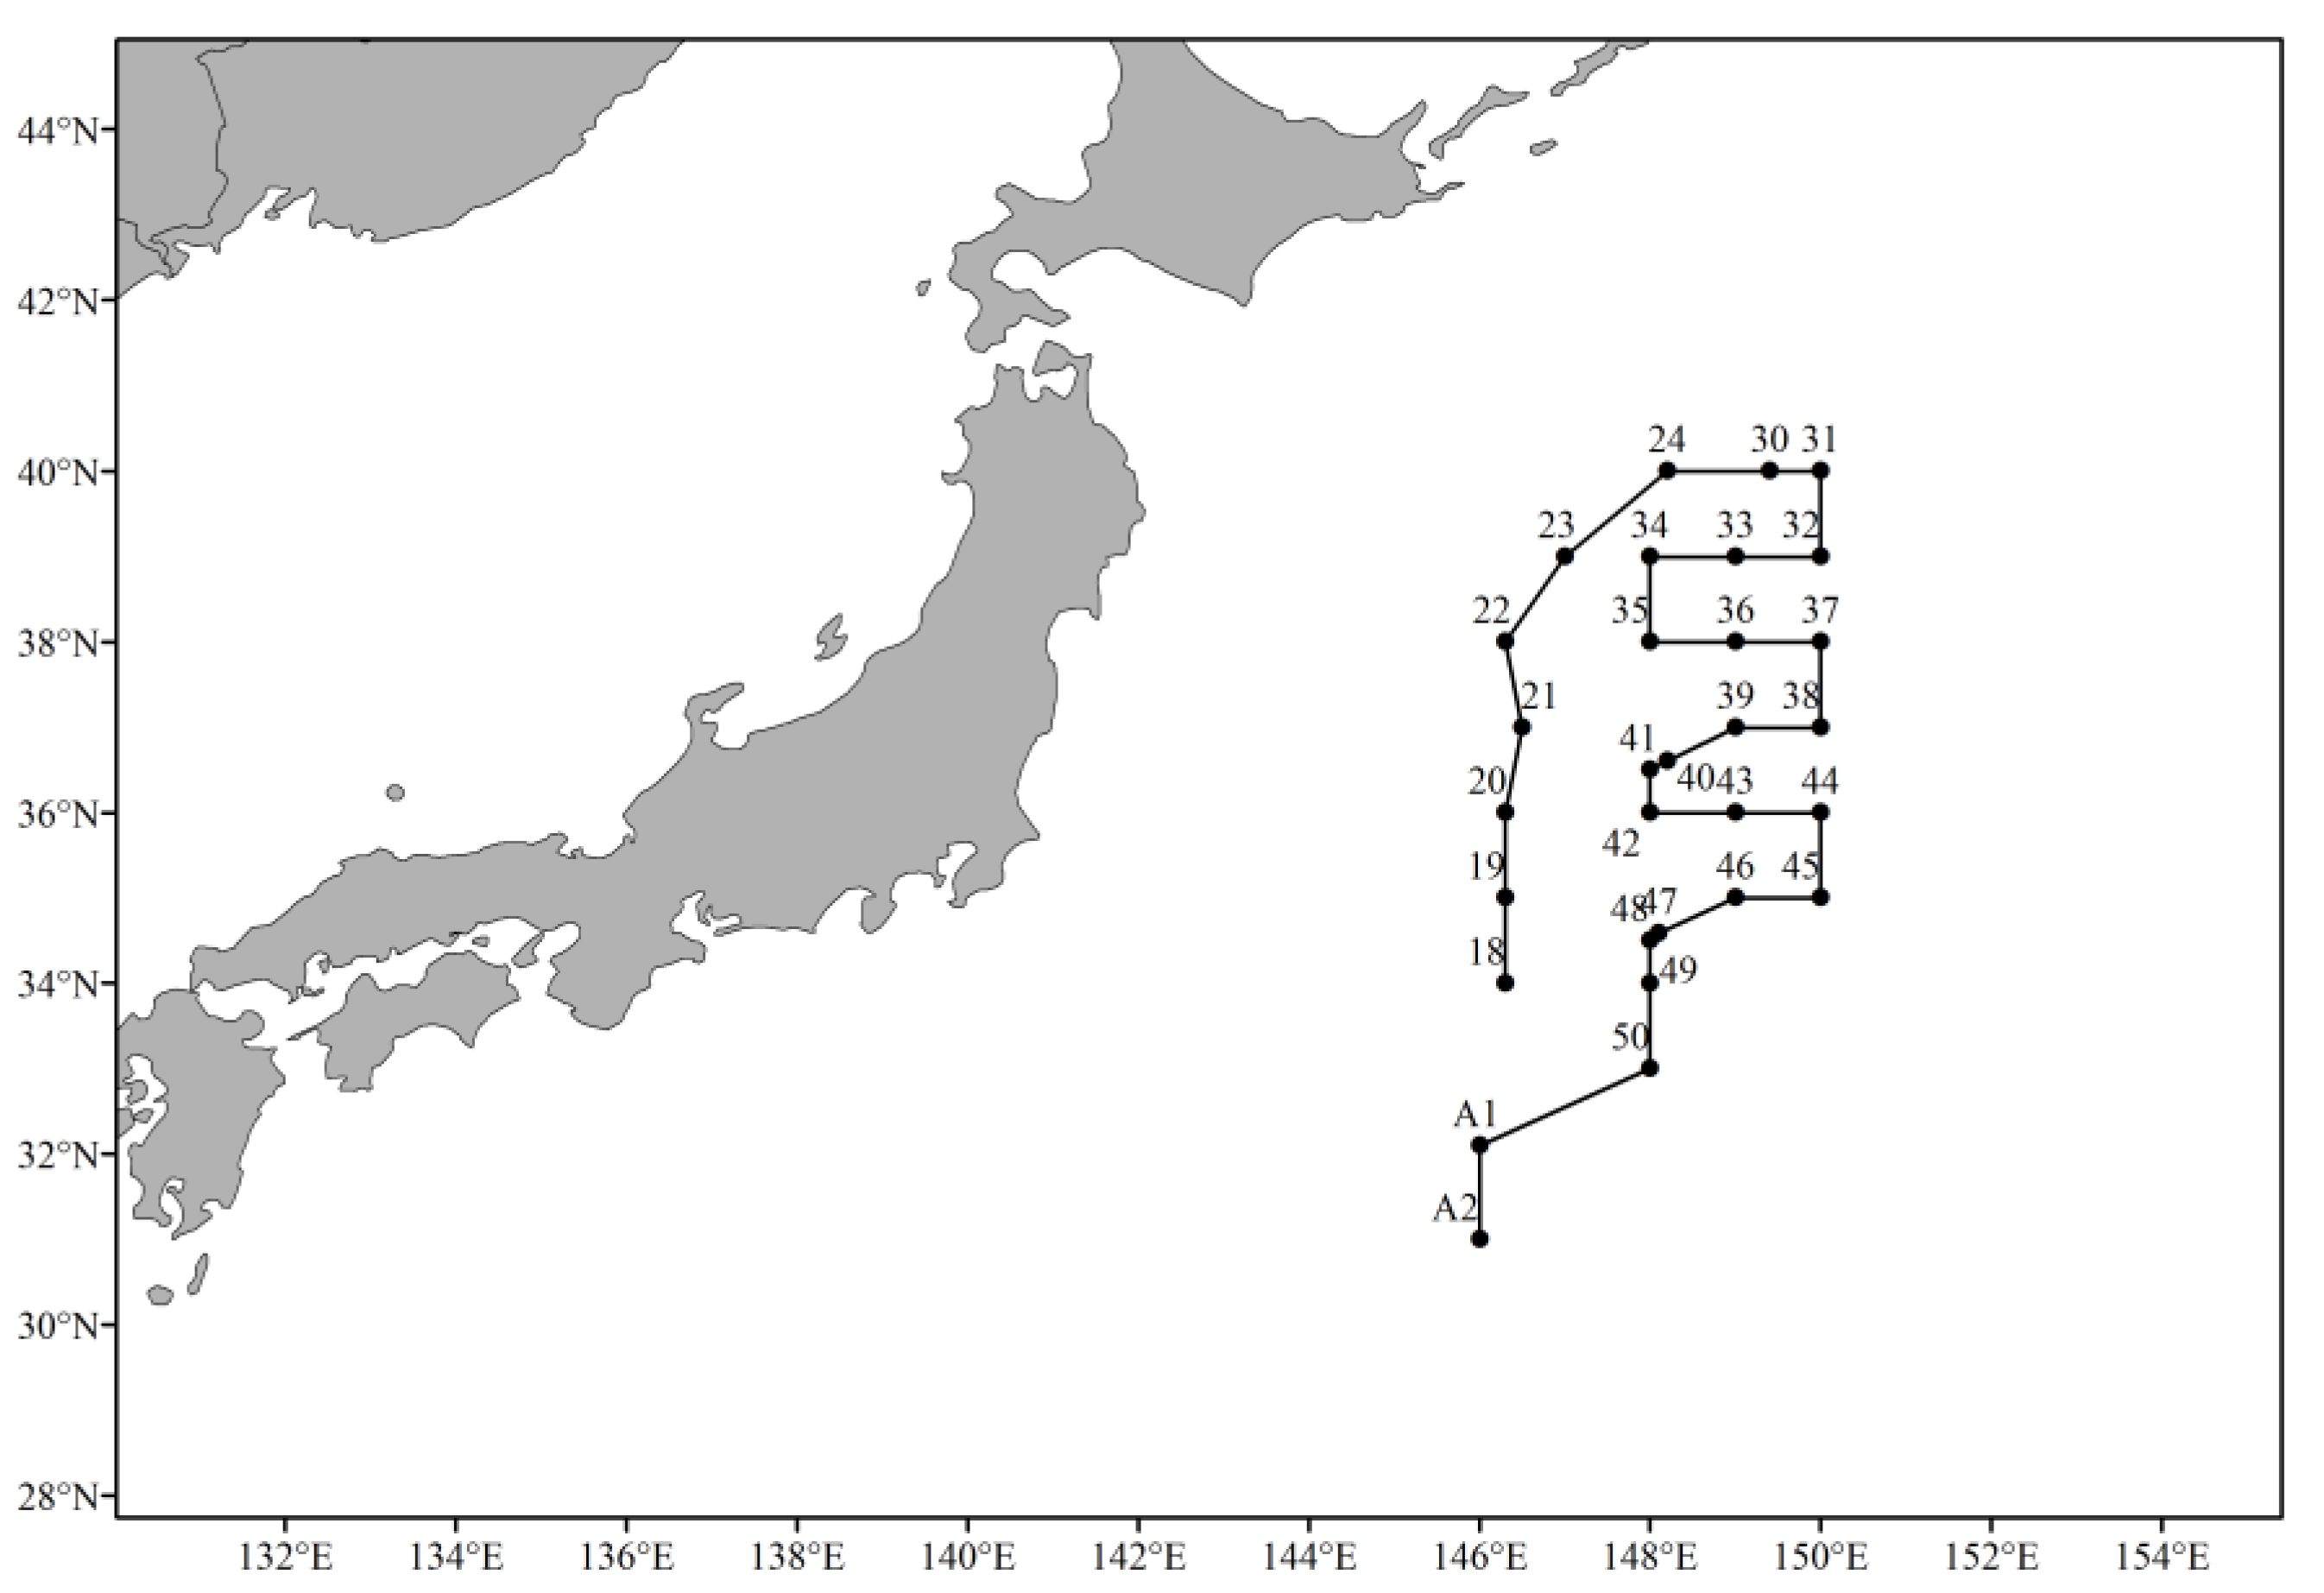
Figure 1. The distribution of 30 acoustic stations during the 2019 Songhangsurvey at the Northwest Pacific Ocean.
Jmse 09 00938 g001
Figure 2. Scattering strength variation with frequencies at all layers in the water column for 30 stations (m: meter, the unit of depth).
Jmse 09 00938 g002aJmse 09 00938 g002b
Figure 3. Distribution of scattering strength at different stations. The blank areas at Stations 24, 30, and 31 indicate that there were no valid data because data below 100 m were not collected at these stations.
Jmse 09 00938 g003
Figure 4. The water temperature profiles collected by CTD.
Jmse 09 00938 g004
Figure 5. The mean S V values of each layer at the survey area: (a) mean S V values without Stations 24, 30, and 31; (b) mean S V values at Stations 24, 30, and 31.
Jmse 09 00938 g005
Figure 6. The Pearson correlation and linear regression analysis on the horizontal level indicate the scattering strength: (a) not significantly correlated with longitude (R = −0.012, p = 0.948, p > 0.05), (b) not significantly correlated with latitude (R = −0.239, p = 0.230, p > 0.05), (c) not significantly correlated with water temperature (R = 0.353, p = 0.116, p > 0.05).
Jmse 09 00938 g006
Figure 7. The Pearson correlation and linear regression analysis on the vertical level indicate the scattering strength (without Stations 24, 30, and 31): (a) negatively correlated with depth (R = −0.933, p = 0.0002, p < 0.01); (b) positively correlated with water temperature (R = 0.939, p = 0.0002, p < 0.01).
Jmse 09 00938 g007
Figure 8. The scattering strength and solar altitude angle corresponding with the survey time of each station. The upper and lower boundaries of the box represent the maximum and minimum solar altitude angles, and the median line represents the median value.
Jmse 09 00938 g008
Table 1. Main parameter settings of Simrad EK80 echosounder system.
Technical ParametersParameter Settings
38 kHz70 kHz120 kHz200 kHz
Transducer typeES38-7ES70-7CES120-7CES200-7C
Broadband range (kHz)34–4545–9090–170160–260
Transmit power (W)2000750250150
Pulse duration (ms)4.0964.0964.0964.096
Ping interval (ms)1999199919991999
Beam angle
Publisher’s Note: MDPI stays neutral with regard to jurisdictional claims in published maps and institutional affiliations.