Article

Hydraulic and Structural Assessment of a Rubble-Mound Breakwater with a Hybrid Wave Energy Converter

by
Daniel Clemente
1,2,*,
Tomás Calheiros-Cabral
1,2,
Paulo Rosa-Santos
1,2 and
Francisco Taveira-Pinto
1,2
1
Interdisciplinary Centre of Marine and Environmental Research, University of Porto, Terminal de Cruzeiros do Porto de Leixões, Avenida General Norton de Matos, s/n, 4450-208 Matosinhos, Portugal
2
Department of Civil Engineering, Faculty of Engineering, University of Porto, Rua Dr. Roberto Frias, s/n, 4200-465 Porto, Portugal
*
Author to whom correspondence should be addressed.
J. Mar. Sci. Eng. 2021, 9(9), 922; https://doi.org/10.3390/jmse9090922
Submission received: 23 July 2021 / Revised: 14 August 2021 / Accepted: 22 August 2021 / Published: 25 August 2021
(This article belongs to the Special Issue Hybrid Systems for Marine Energy Harvesting)

Abstract

:
Seaports’ breakwaters serve as important infrastructures capable of sheltering ships, facilities, and harbour personnel from severe wave climate. Given their exposure to ocean waves and port authorities’ increasing awareness towards sustainability, it is important to develop and assess wave energy conversion technologies suitable of being integrated into seaport breakwaters. To fulfil this goal whilst ensuring adequate sheltering conditions, this paper describes the performance and stability analysis of the armour layer and toe berm of a 1/50 geometric scale model of the north breakwater extension project, intended for the Port of Leixões, with an integrated hybrid wave energy converter. This novel hybrid concept combines an oscillating water column and an overtopping device. The breakwater was also studied without the hybrid wave energy device as to enable a thorough comparison between both solutions regarding structural stability, safety, and overtopping performance. The results point towards a considerable reduction in the overtopping volumes through the integration of the hybrid technology by an average value of 50%, while the stability analysis suggests that the toe berm of the breakwater is not significantly affected by the hybrid device, leading to acceptable safety levels. Even so, some block displacements were observed, and the attained stability numbers were slightly above the recommended thresholds from the literature. It is also shown that traditional damage assessment parameters should be applied with care when non-conventional structures are analysed, such as rubble-mound breakwaters with integrated wave energy converters.

1. Introduction

Seaports are important maritime infrastructures responsible for the development of regional economies and the global transport trade. Yet, this has some consequences, as pollution is a source of great concern [1] in terms of noise [2,3], greenhouse gas (GHG) emissions [4], and public health [5]. They can also suffer from inherent environmental consequences, given their coastal exposure and vulnerability to sea-level rise, storms, and in some cases, flooding [6,7]. This has drawn the attention and concern of port authorities and stakeholders, who have started to identify and implement new and more sustainable policies within seaports [8,9,10] in order to mitigate the negative impacts of seaport activities.
One of the most promising options being considered by port authorities relies upon the integration of wave energy converters (WECs) into breakwaters [11,12,13], which represent the main port structures responsible for sheltering the inner areas of seaports and berthing ships from overtopping and severe wave climate [14,15]. This approach presents an opportunity to supply seaports with clean and environmentally sustainable energy by harnessing a directly available resource, given ports’ exposure to ocean waves, with a high global potential [16,17]. However, it is crucial that the main functions of breakwaters are assured, as well as their structural stability. The functionality of rubble-mound breakwaters, for instance, can be compromised due to several occurrences. These include the displacement of blocks by plunging waves, liftouts by uprush and downrush, slides of the armour layers, and/or failure due to special wave trains and toe berm erosion, among others [14]. Several formulae and methods have been developed for the design and stability analysis (e.g., based on the stability number, Ns) [18,19,20,21]. Numerous studies have also been carried out on the damage assessment (e.g., based on the damage number, Nod), namely, of the toe berm for rubble-mound breakwaters [22,23]. Studies on the armour layer are more focused on the stability number, NS, which is related to the determination of the armour block’s weight [24] through empirical formulae [25,26]. Most studies are mainly aimed at assessing damage on the structure during storms, as this is the main source of damage during a breakwater’s usable life [27]. Lastly, though this damage assessment methodology can be used for breakwater integrated WECs, such as overtopping devices (OWEC) [28] and oscillating water columns (OWC) [29], it is crucial to ensure that breakwaters are also able to cope with wave run-up and overtopping, in order to protect innermost infrastructures of the harbour and berthing ships. Several projects have been carried out to attain information and create databases to serve as design references, such as the CLASH [30,31,32] and the VOWS [33] projects. To these we add several experimental [30,34] and numerical studies [35,36], as well as field measurements [37,38] and recommendations from various sources on overtopping limits, such as the EurOtop Manual [39,40]. In summary, not only is it pertinent to select and study an adequate WEC technology from a wide range of solutions, but it is equally relevant to ensure that its integration into a port structure, such as a breakwater, does not compromise its structural stability or functionality.
This paper discusses the integration of a combined OWEC–OWC wave energy converter concept into a rubble-mound breakwater, with particular focus on the consequential influence in terms of structural stability and functionality of the sheltering structure. Section 2 of this paper describes the experimental study carried out with a reduced scale physical model of the breakwater and WEC, the equipment that was utilized, the characteristics of the experimental facility, and the case study used as reference. Section 3 presents and discusses the most relevant results under the scope of this paper. The overtopping volumes, stability numbers, and damage numbers for a series of severe sea-state tests are compared with and without the integration of the hybrid WEC. Finally, Section 4 summarizes the main conclusions of the experimental study and discusses the main consequences of the proposed WEC solution from a structural perspective.

2. Experimental Study of the Hybrid OWEC–OWC Device

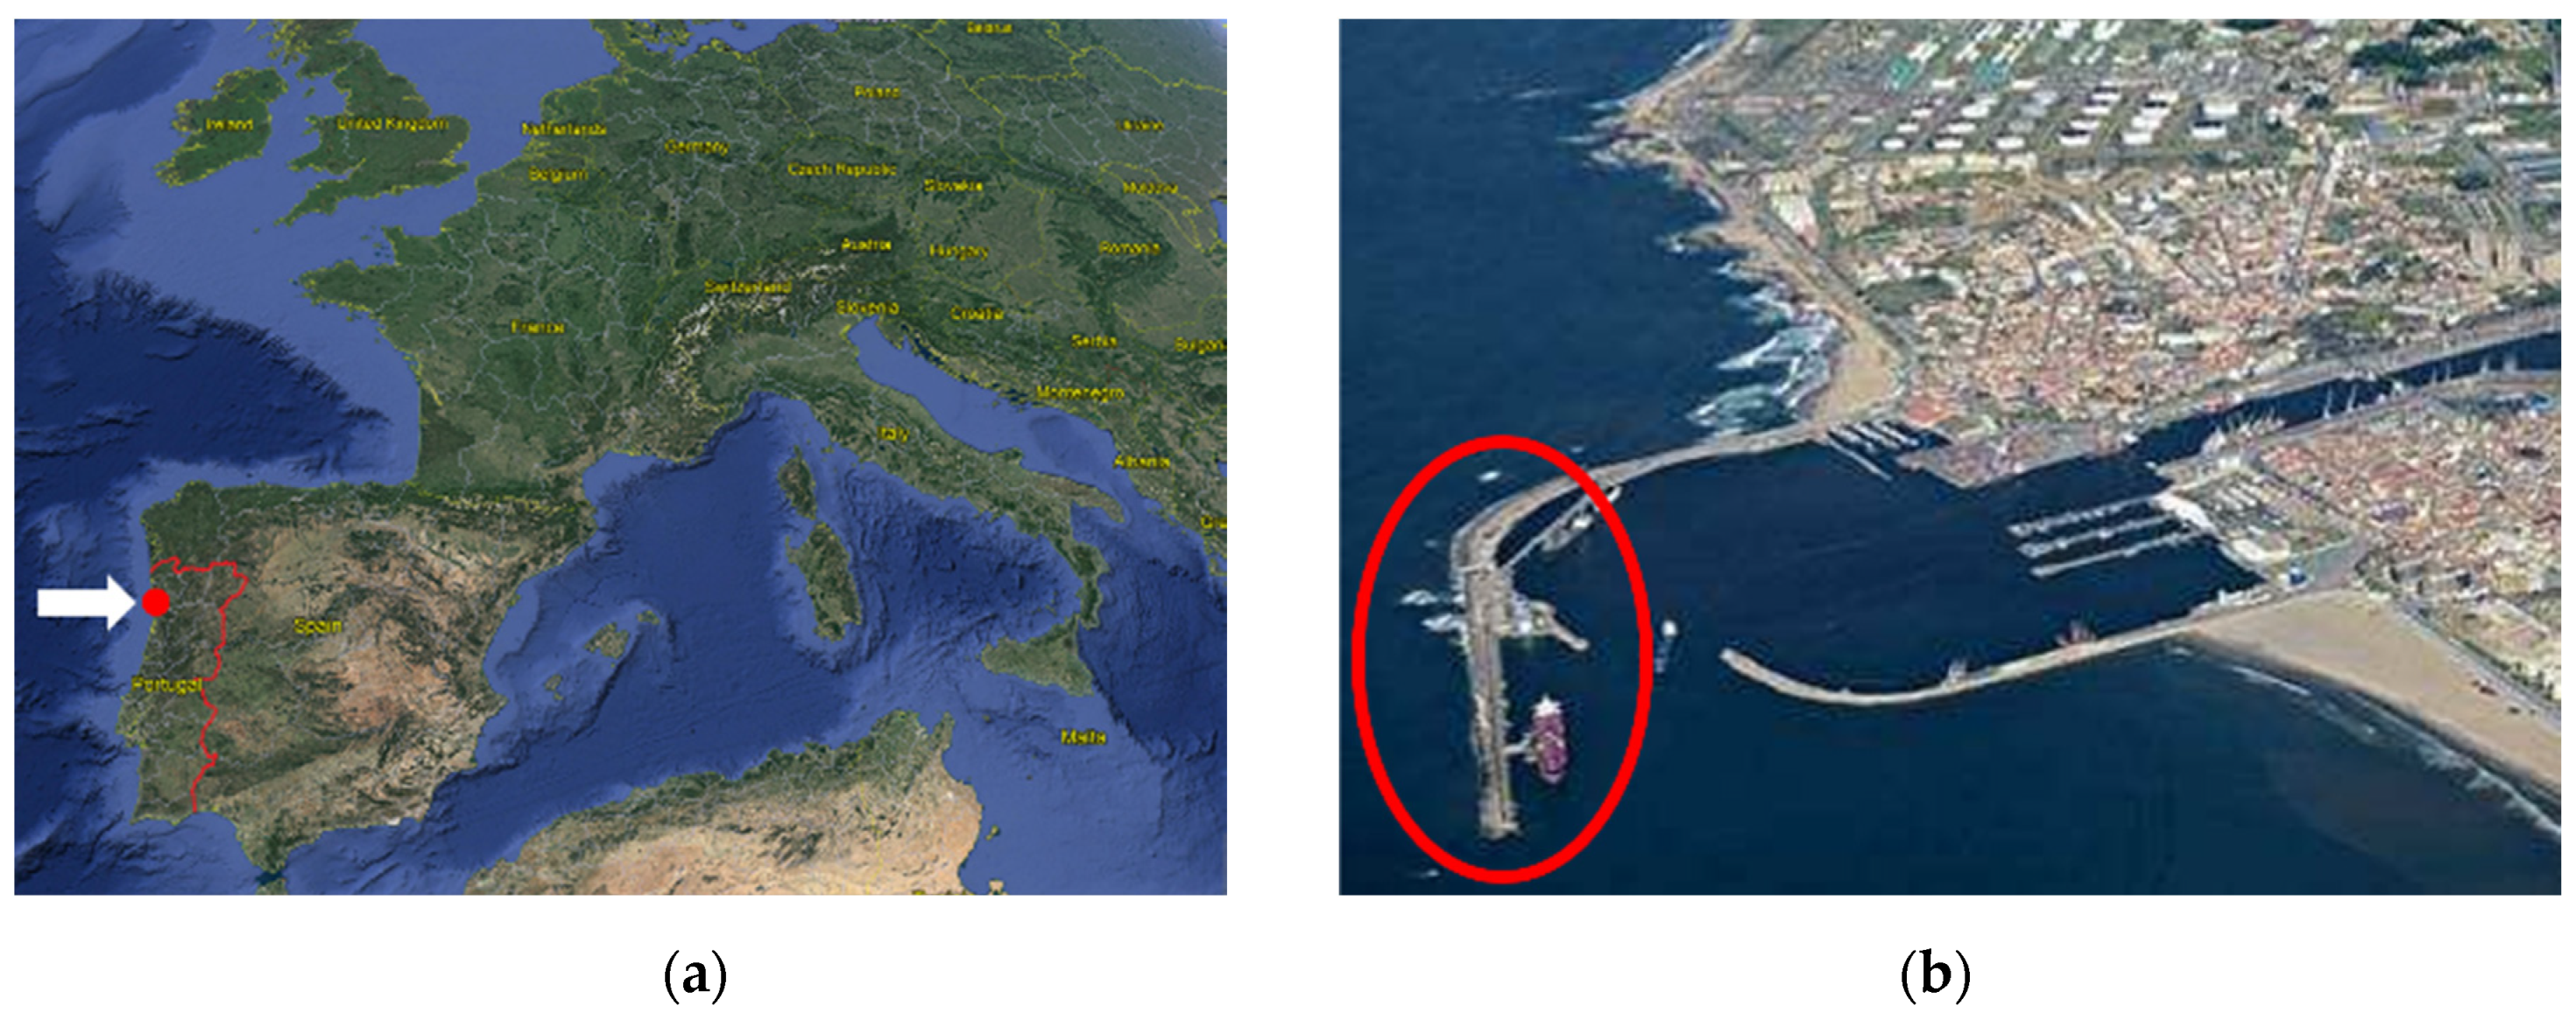
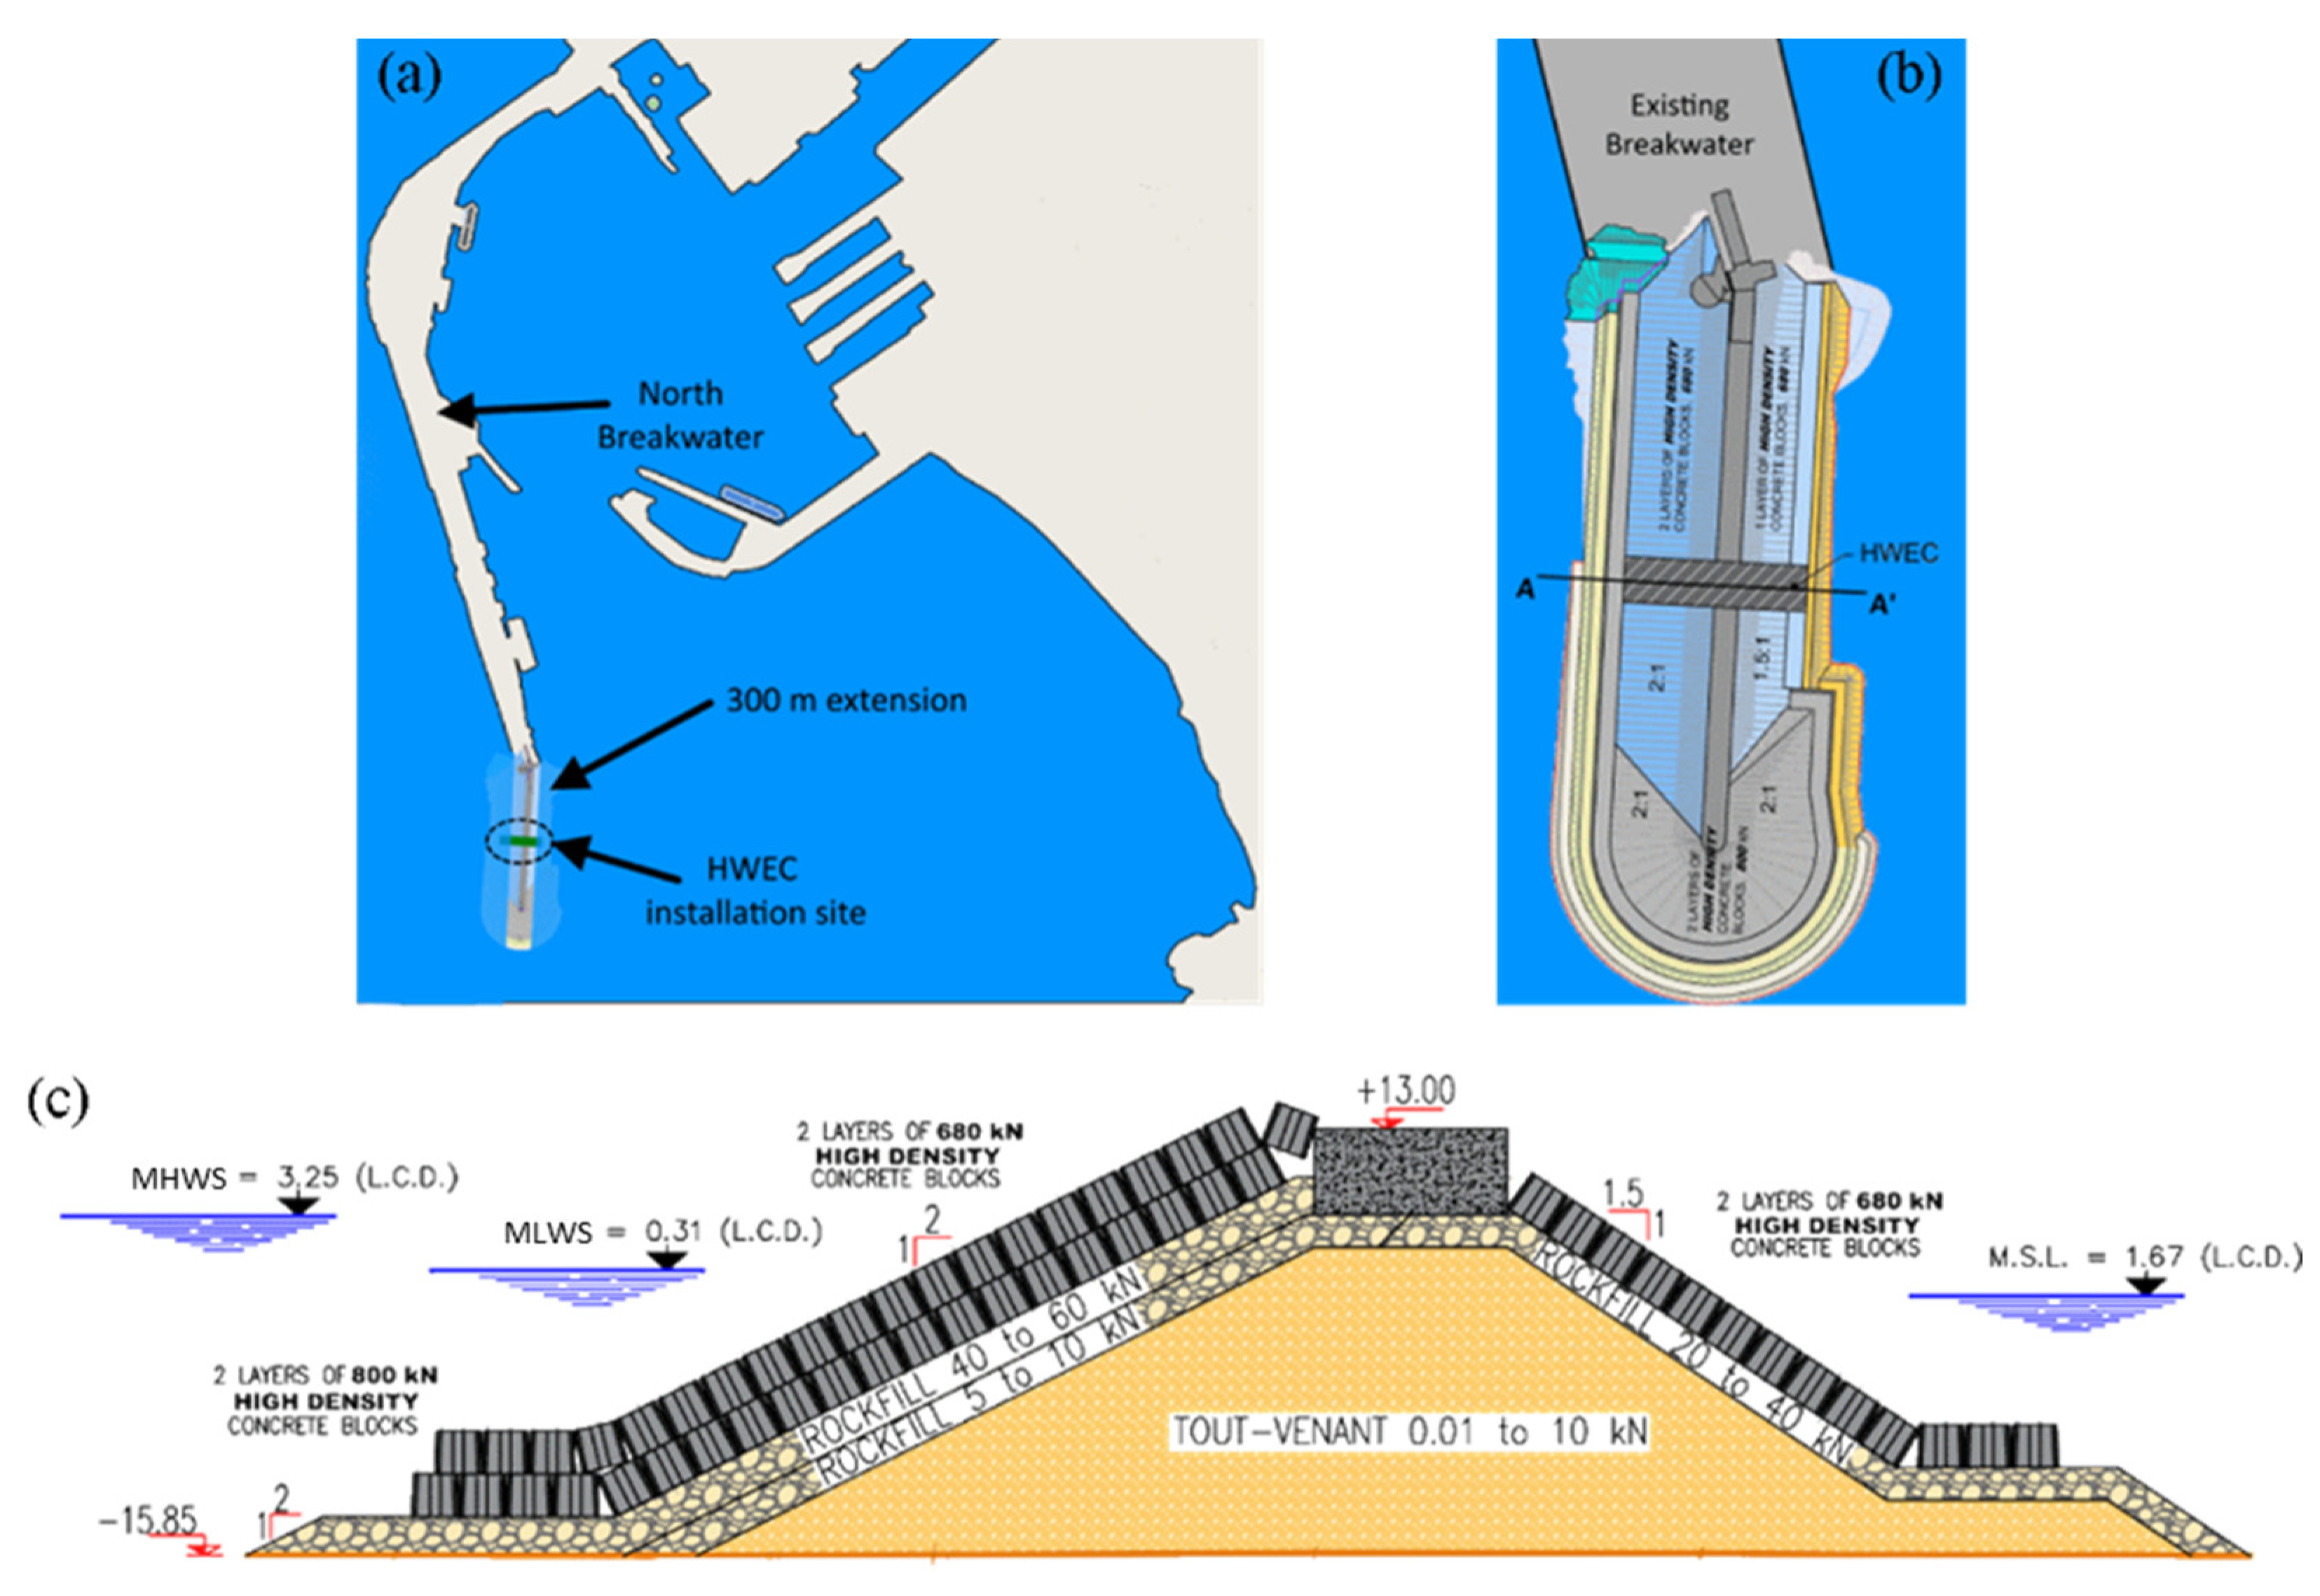
2.1. Case Study and Test Plan

The integration of the hybrid WEC concept has been considered for the case study of the Port of Leixões, in the north-western coast of Portugal (41°11′ N and 8°42′ W), 4 km north of the river Douro’s mouth. This seaport was selected due to its economic importance at a regional and national level, the highly energetic wave climate to which it is subjected, and the development strategy being followed by the Port Authority of Douro, Leixões, and Viana do Castelo (APDL). Amongst other expansion and infrastructural improvement plans, the port authority is currently considering an extension of the north breakwater by 300 m [41]. The main goal is to allow for ships of greater length/draught to safely enter the port during rough wave conditions and to provide better tranquillity conditions within the harbour basin.
In fact, facing the Atlantic Ocean, the Port of Leixões (Figure 1) is very susceptible to highly energetic sea states. During storms, significant wave heights have been commonly recorded at 8 m or more, with a maximum registered value slightly above 10 m, in 2014 [41]. These data were obtained from offshore wave buoy measurements (deep water conditions). Hence, the north breakwater serves as one of the key protection structures of the innermost areas of the port, alongside the south breakwater.
Current plans for the improvement of the port accessibility mention an extension of the north breakwater by about 300 m, at an angle of 20° towards the west regarding the existing structure’s alignment (Figure 2a). This presents a unique opportunity to assess the potential of an integrated hybrid WEC (HWEC) into the extended breakwater. The proposed solution entails a rubble-mound breakwater with an armour layer composed of a double layer of Antifer blocks on the seaward side and a single layer on the inwards side (Figure 2c). A 20-metre-long section was considered for this study, with the HWEC being integrated at the centre of the breakwater (Figure 2b) at a water depth of circa 17.5 m (reference to the mean sea level or M.S.L.).
The experimental study with the physical model, which is later described, encompassed a wide range of wave conditions based on data from the case study area, as to study the HWEC’s energy conversion performance under operational conditions [42,43]. Nevertheless, in order to reproduce extreme events and assess the impact that they can have on a future breakwater extension, an additional set of extreme wave conditions were chosen. This took into consideration the water depth and the wavemaker’s physical limitations. Table 1 characterizes the extreme sea states tested for the mean low water springs (MLWS) and mean high water springs (MHWS).
Standard procedures for reproduction of irregular sea states originated from the North Atlantic Ocean involve the definition of a JONSWAP spectrum, with a peak enhancement factor of 3.3. To ensure an adequate reproduction of the sea states and enable a deterministic result comparison, a temporal sequence of circa 1200 waves was used for each test [44]. However, it should be noted that the most severe wave conditions (highest significant wave height, Hs, and peak wave period, Tp) were defined based on the physical limitations imposed by the wavemaker system, which operated with an active absorption module to mitigate wave reflection. Wave breaking phenomena in the foreshore, at the front of the rubble-mound breakwater, was also taken into account.

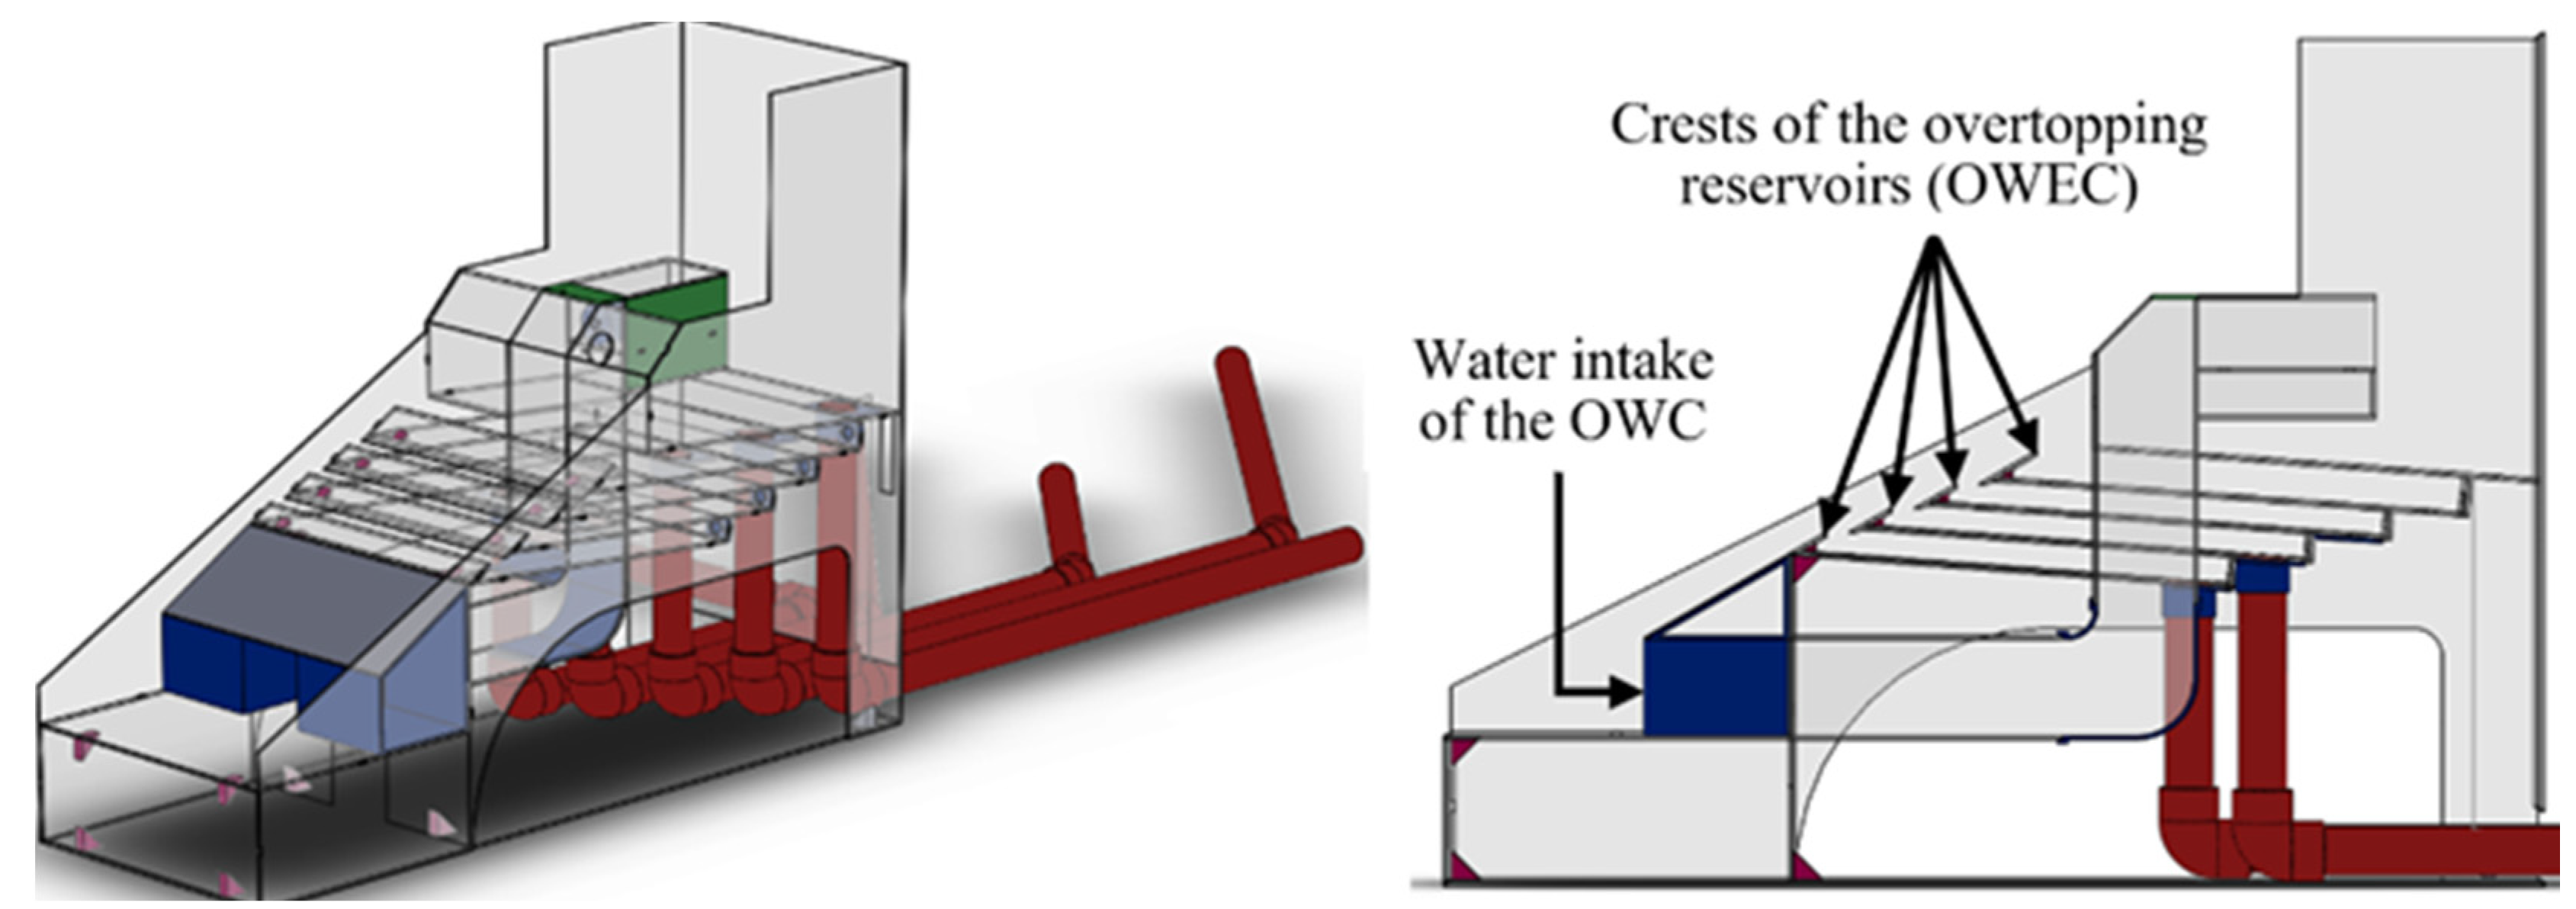
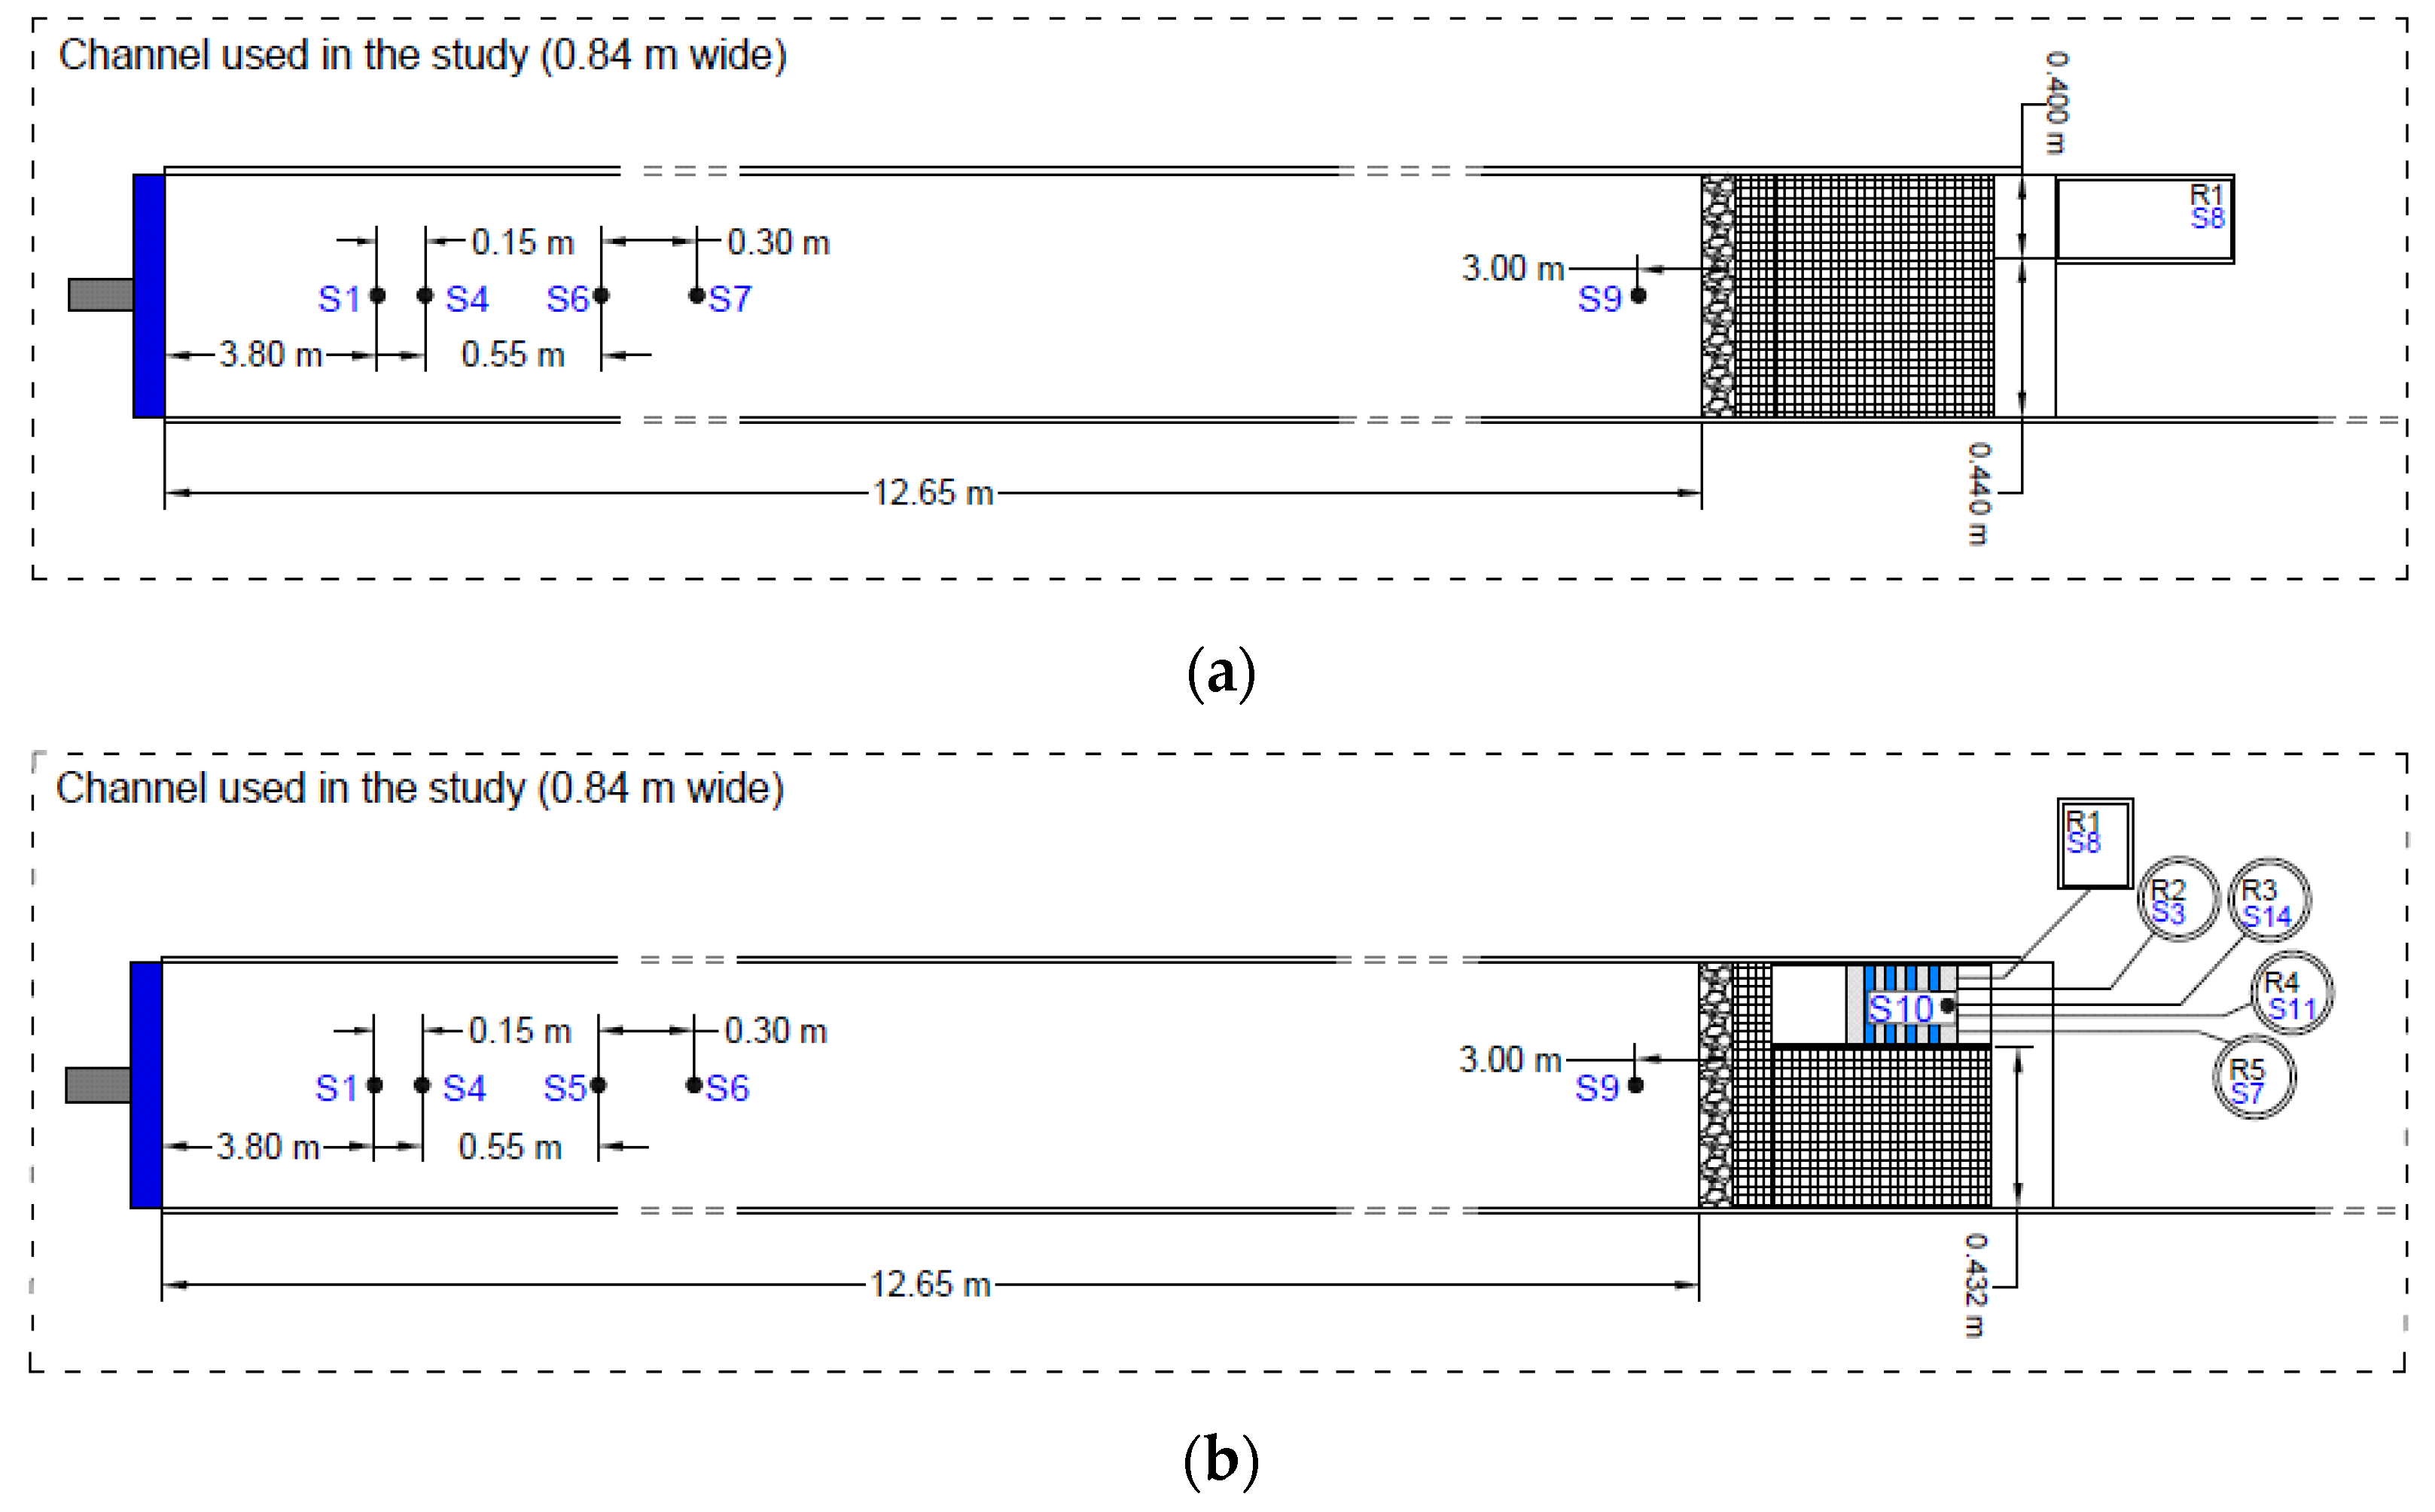
2.2. OWEC–OWC Concept and Physical Model

The hybrid WEC concept resulted from the combination of an overtopping device (OWEC) [45,46,47] with an oscillating water column (OWC) [29,48,49] system [50]. For a single module, it is expected that wave energy conversion be achieved through a dual-mode operation, which should yield a greater performance than that of standalone variants of the two original concepts, as it was shown in [42,43,51]. To accommodate the different types of WEC whilst mitigating modifications of the preliminary design of the breakwater structure, several adaptations were introduced.
The hybrid WEC’s dimensions and cross-section are compatible with the original structural design of the rubble-mound breakwater, from the toe berm to the crest. The OWC chamber was integrated amidst the reservoirs, intercepting them at a central position and connecting to an upper section where the power take-off (PTO) would be located. However, the OWC is isolated from the OWEC component. In the interior of the chamber, there is an air volume trapped between the PTO (likely a turbine) and the seawater that comes from the intake of the OWC. The passing of waves induces fluctuations on the free surface of the water inside the chamber, which, in turn, generates air pressure differentials that drive the PTO’s energy conversion process. As for the OWEC, several reservoirs allow for the intake and accumulation of overtopping volumes. The different levels allow for various combinations of sea level and wave height to be harnessed. The ramp slope is similar to that of the original breakwater structure design, while the reservoirs denote a small inclination towards the interior of the WEC, in order to promote the flow of seawater into the penstocks associated to the hydraulic turbines (in the case of the physical model, pipes), as seen in Figure 3. Low-head turbines convert the available potential energy (head and stored water) into electric energy, similar to the process observed in hydroelectric plants. Lastly, the shape of the device’s crest was selected as to serve as a barrier, which not only mitigates overtopping of the structure, but also promotes the accumulation of water inside the OWEC’s reservoirs. Even so, as described above, it was important to measure the overtopping volumes, especially those related to the hybrid WEC’s crest. The resulting setup is presented in Figure 3, which depicts the connections between the physical model’s OWEC reservoirs and the corresponding auxiliary reservoirs (ARs).

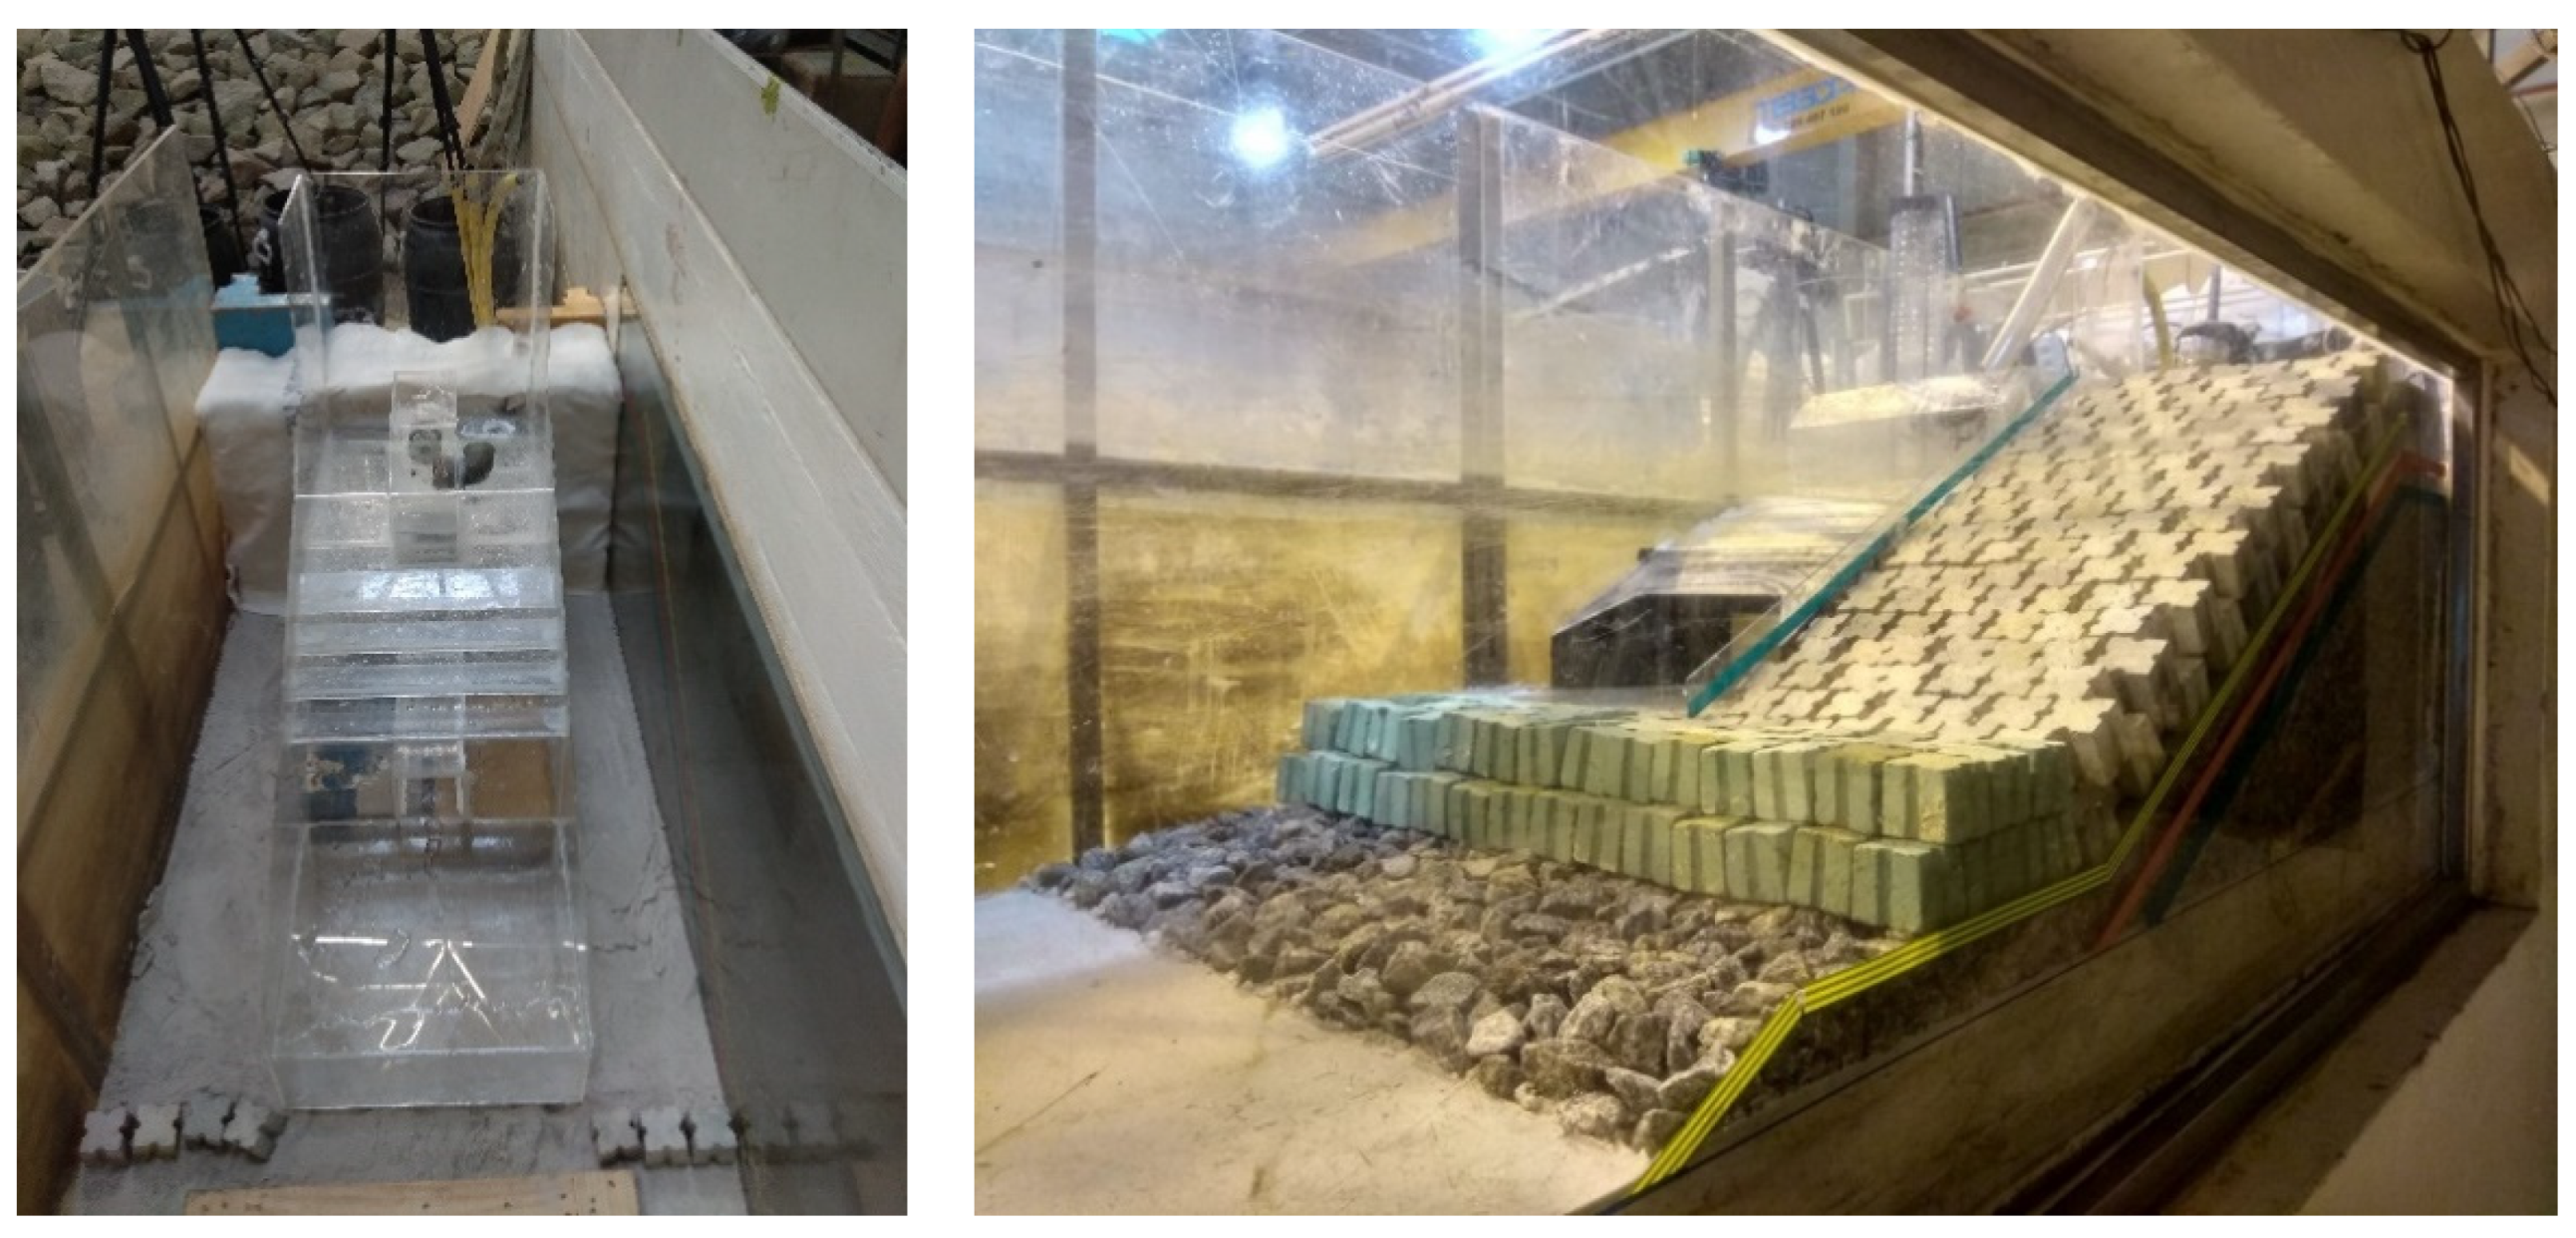
2.3. Facilities, Materials, and Equipment

For the purpose of the physical modelling stage, a 3D reproduction of the hybrid OWEC–OWC device at a geometric scale of 1:50, following on the Froude similitude criteria, was considered (Figure 4). The selected domain was a channel that extended 14.30 m in length and 0.84 m in width, within the wave basin at the Hydraulics Laboratory of the Hydraulics, Water Resources and Environment Division of the Faculty of Engineering of the University of Porto (FEUP), Portugal. The wave basin itself spans 28 m in length, 12 m in width, and 1.2 m in height and has a multi-element piston-type wave generation system (manufactured by HR Wallingford, UK) that is used for reproducing a wide variety of wave conditions, including regular waves and irregular long-crested waves. The system also includes a dynamic wave absorption system to compensate for wave re-reflections.
Special care was taken during the setup of the physical model in order to mitigate laboratorial and scale effects, such as the wall effects, given the limited dimensions of the domain, the need to mitigate potential gaps in the setup of the blocks, and the interest in reproducing an armour layer section as wide as feasible wide a section as feasible of the armour layer. This would enable a more thorough and direct comparison with the adjacent HWEC section. The width of the domain also implied that a single piston of the wavemaker system would be used to reproduce the selected regular and irregular long-crested wave conditions.
The bathymetry in front of the structure was simplified and reproduced to represent the relevant wave transformation processes during the propagation from the wavemaker paddle to the model, analogously to wave propagation from the location where the wave climate was established to the device’s location in the breakwater. For this purpose, a sandy slope with an angle of 0.63° to the horizontal, on an overall length of 12.65 m, was created. As the evolution of the bathymetric profile over time to track any possible scouring phenomena occurring near the toe berm had already been monitored during a previous phase of the project [52], and no relevant scouring was detected, only visual observation of the sea bed in front of the structure was undertaken in this study.
In terms of overtopping measurements, the volume of water that overtops the breakwater crest, with or without the hybrid WEC integrated, was collected in an AR positioned behind the physical model. The width of the collecting channel was the same in both configurations (0.40 m at model scale). In more detail, the overtopping volumes were collected by the upmost reservoir of the physical model and drained into the AR, at a lower position, through a connecting pipe. Due to the confined space, the overtopping volumes would accumulate, over time, within the AR, where a resistive wave gauge is installed to measure the variation of the free surface of water (FSW). To avoid overflow of the AR, a hydraulic pump was placed inside it, alongside the wave gauge. Hence, once an upper threshold is reached, the pump begins to operate and stops only when a very low elevation limit is achieved, close to 0 m. Since the inner area of the reservoir, Ar, is known, the overtopping volume, ∆V, can be calculated, for an interval of time, ∆t, by taking the water elevation variation, ∆h, and multiplying it by Ar. The summation of the overtopping volumes, ∆V, gives the total overtopping volume over the duration of the test. As a complement, during testing, it was possible to account for the pumped-out volumes of water, since the pump’s flow curve and working time are also known.
Five additional gauges were deployed in this study and separated into two groups: a single gauge next to the physical model and the remaining four at a distance of, at least, one wavelength from the wavemaker’s piston paddle. These were used to measure the FSW directly in front of the physical model and to perform a reflection analysis of the generated waves, respectively. The reflection analysis, and hence, the determination of the incident wave conditions, was done using a script based on a development of the least square method proposed by [53].
The experimental setup is summarized in Figure 5, which also presents the ARs that were used to collect the water gathered by the hybrid WEC’s reservoirs, namely, the overtopping component, which is related to wave energy conversion under operational conditions (for additional information, see [42,43]).

3. Results

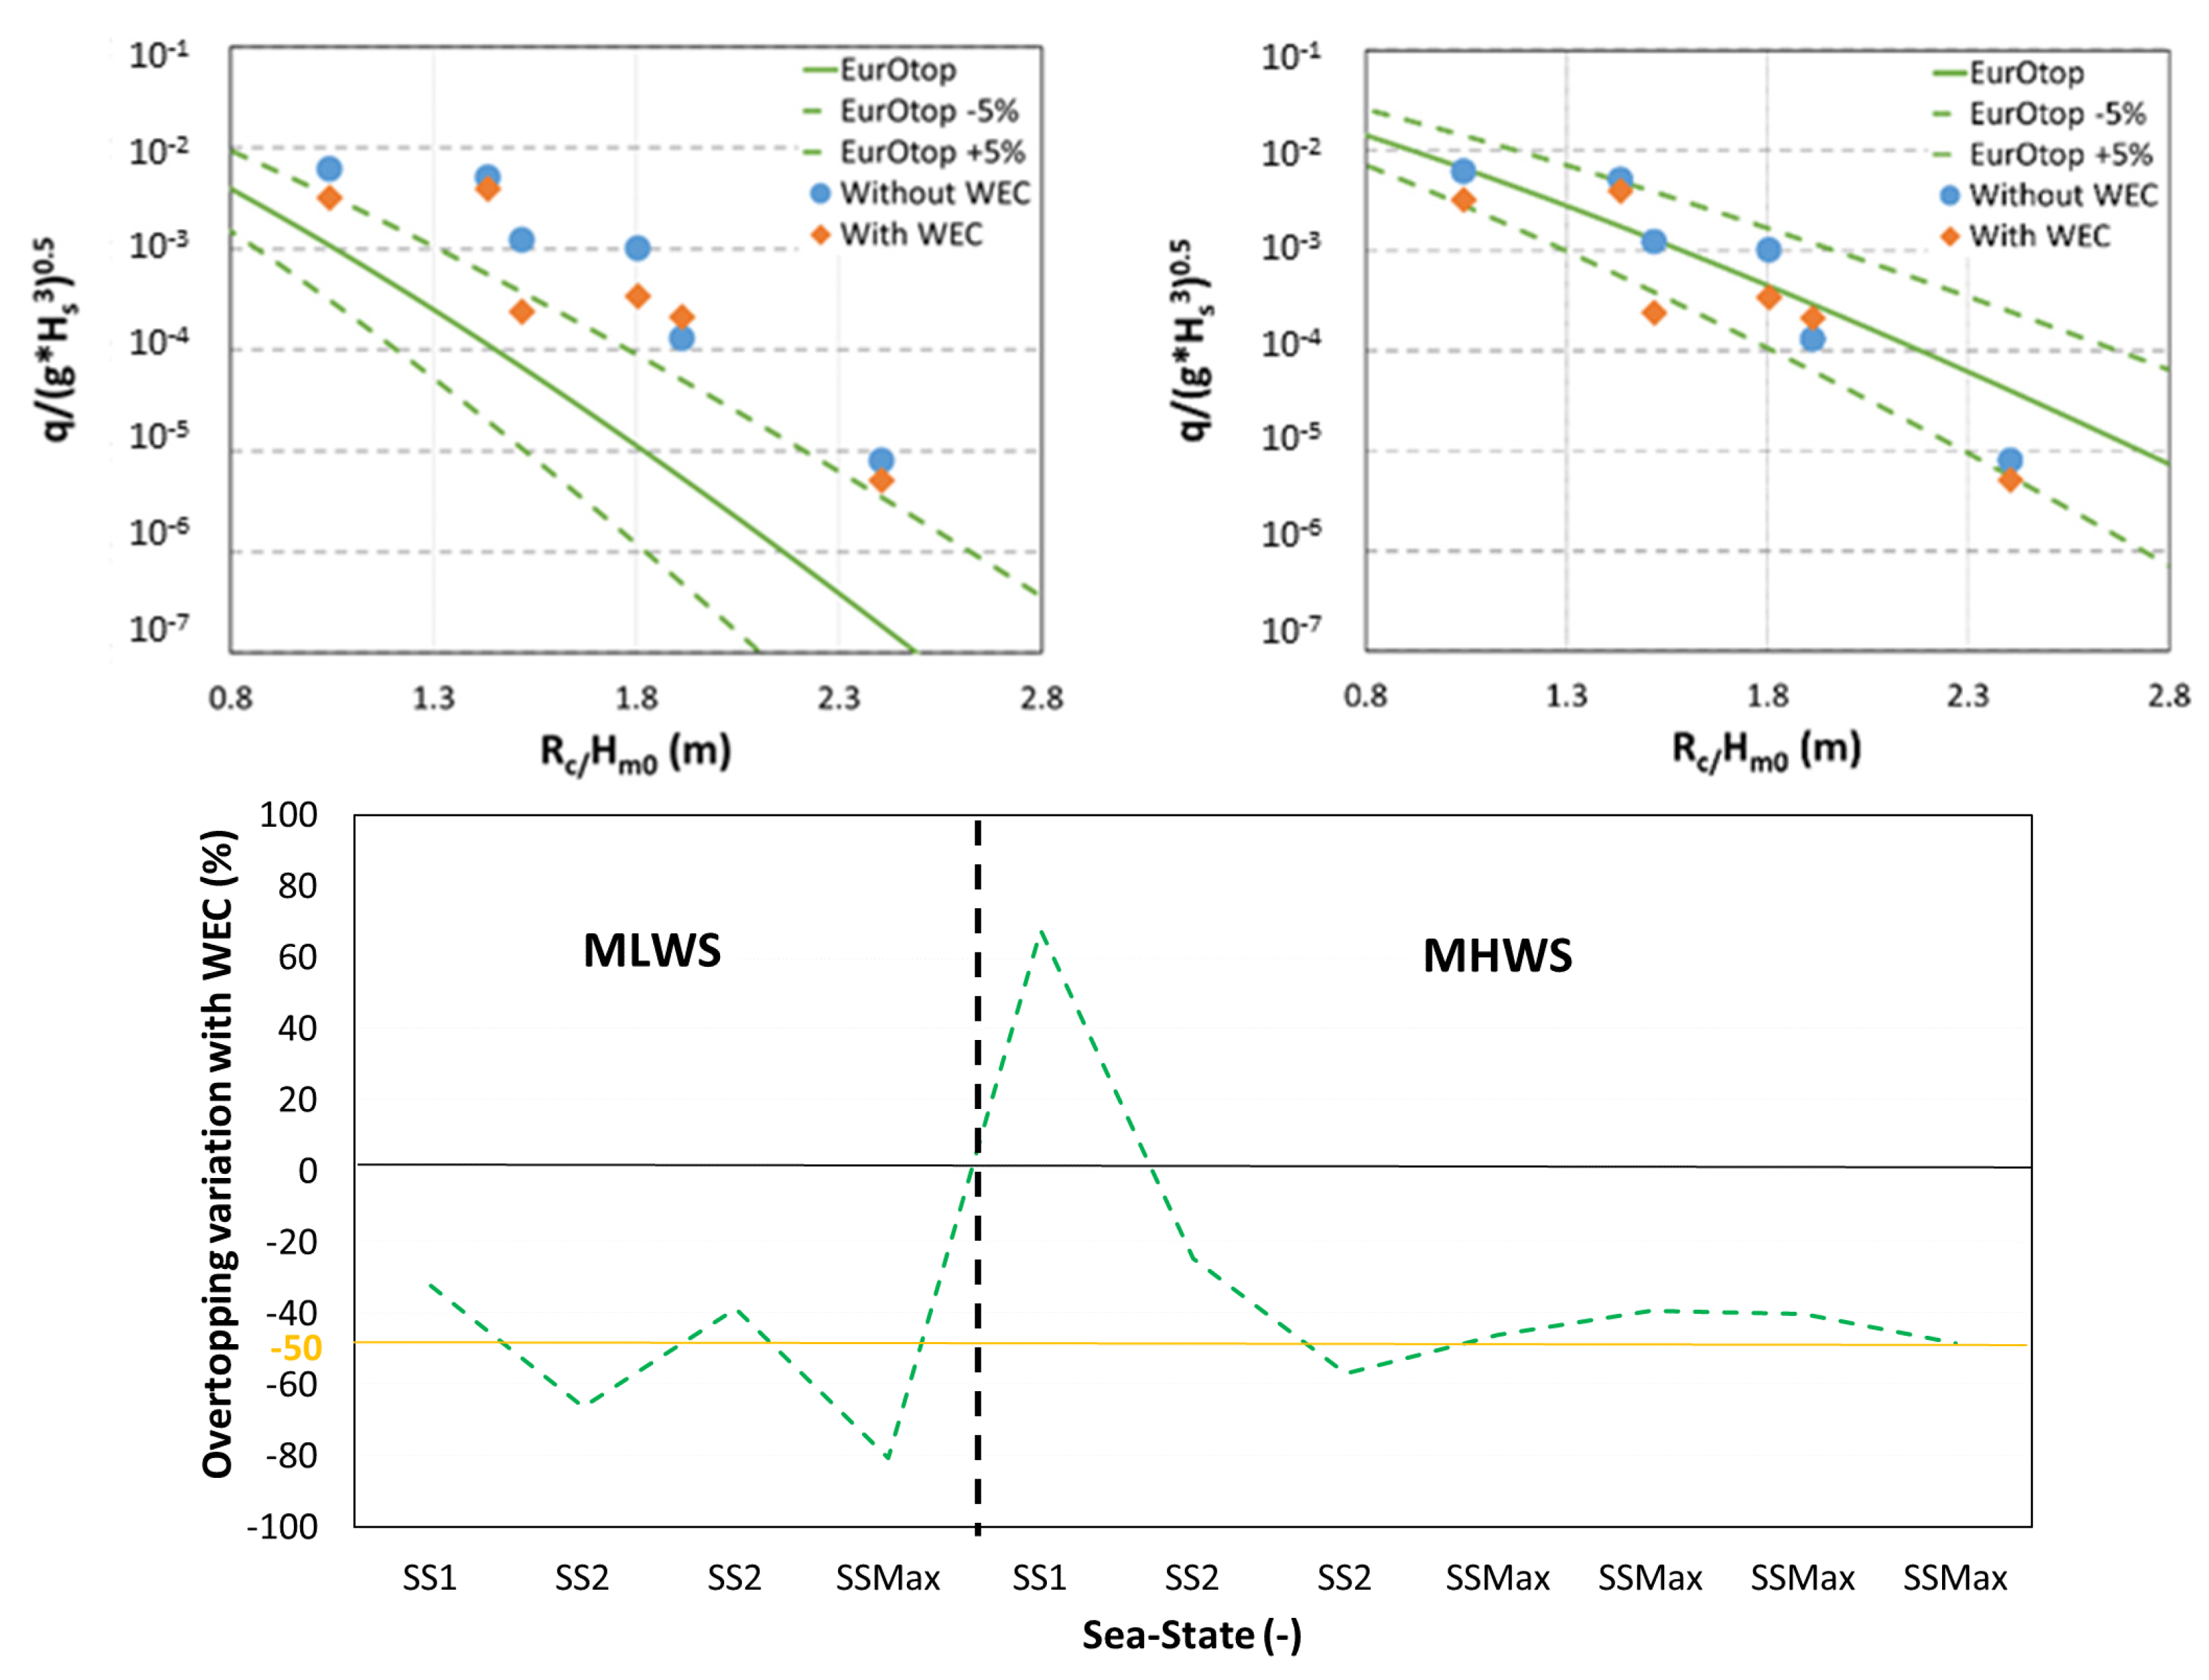
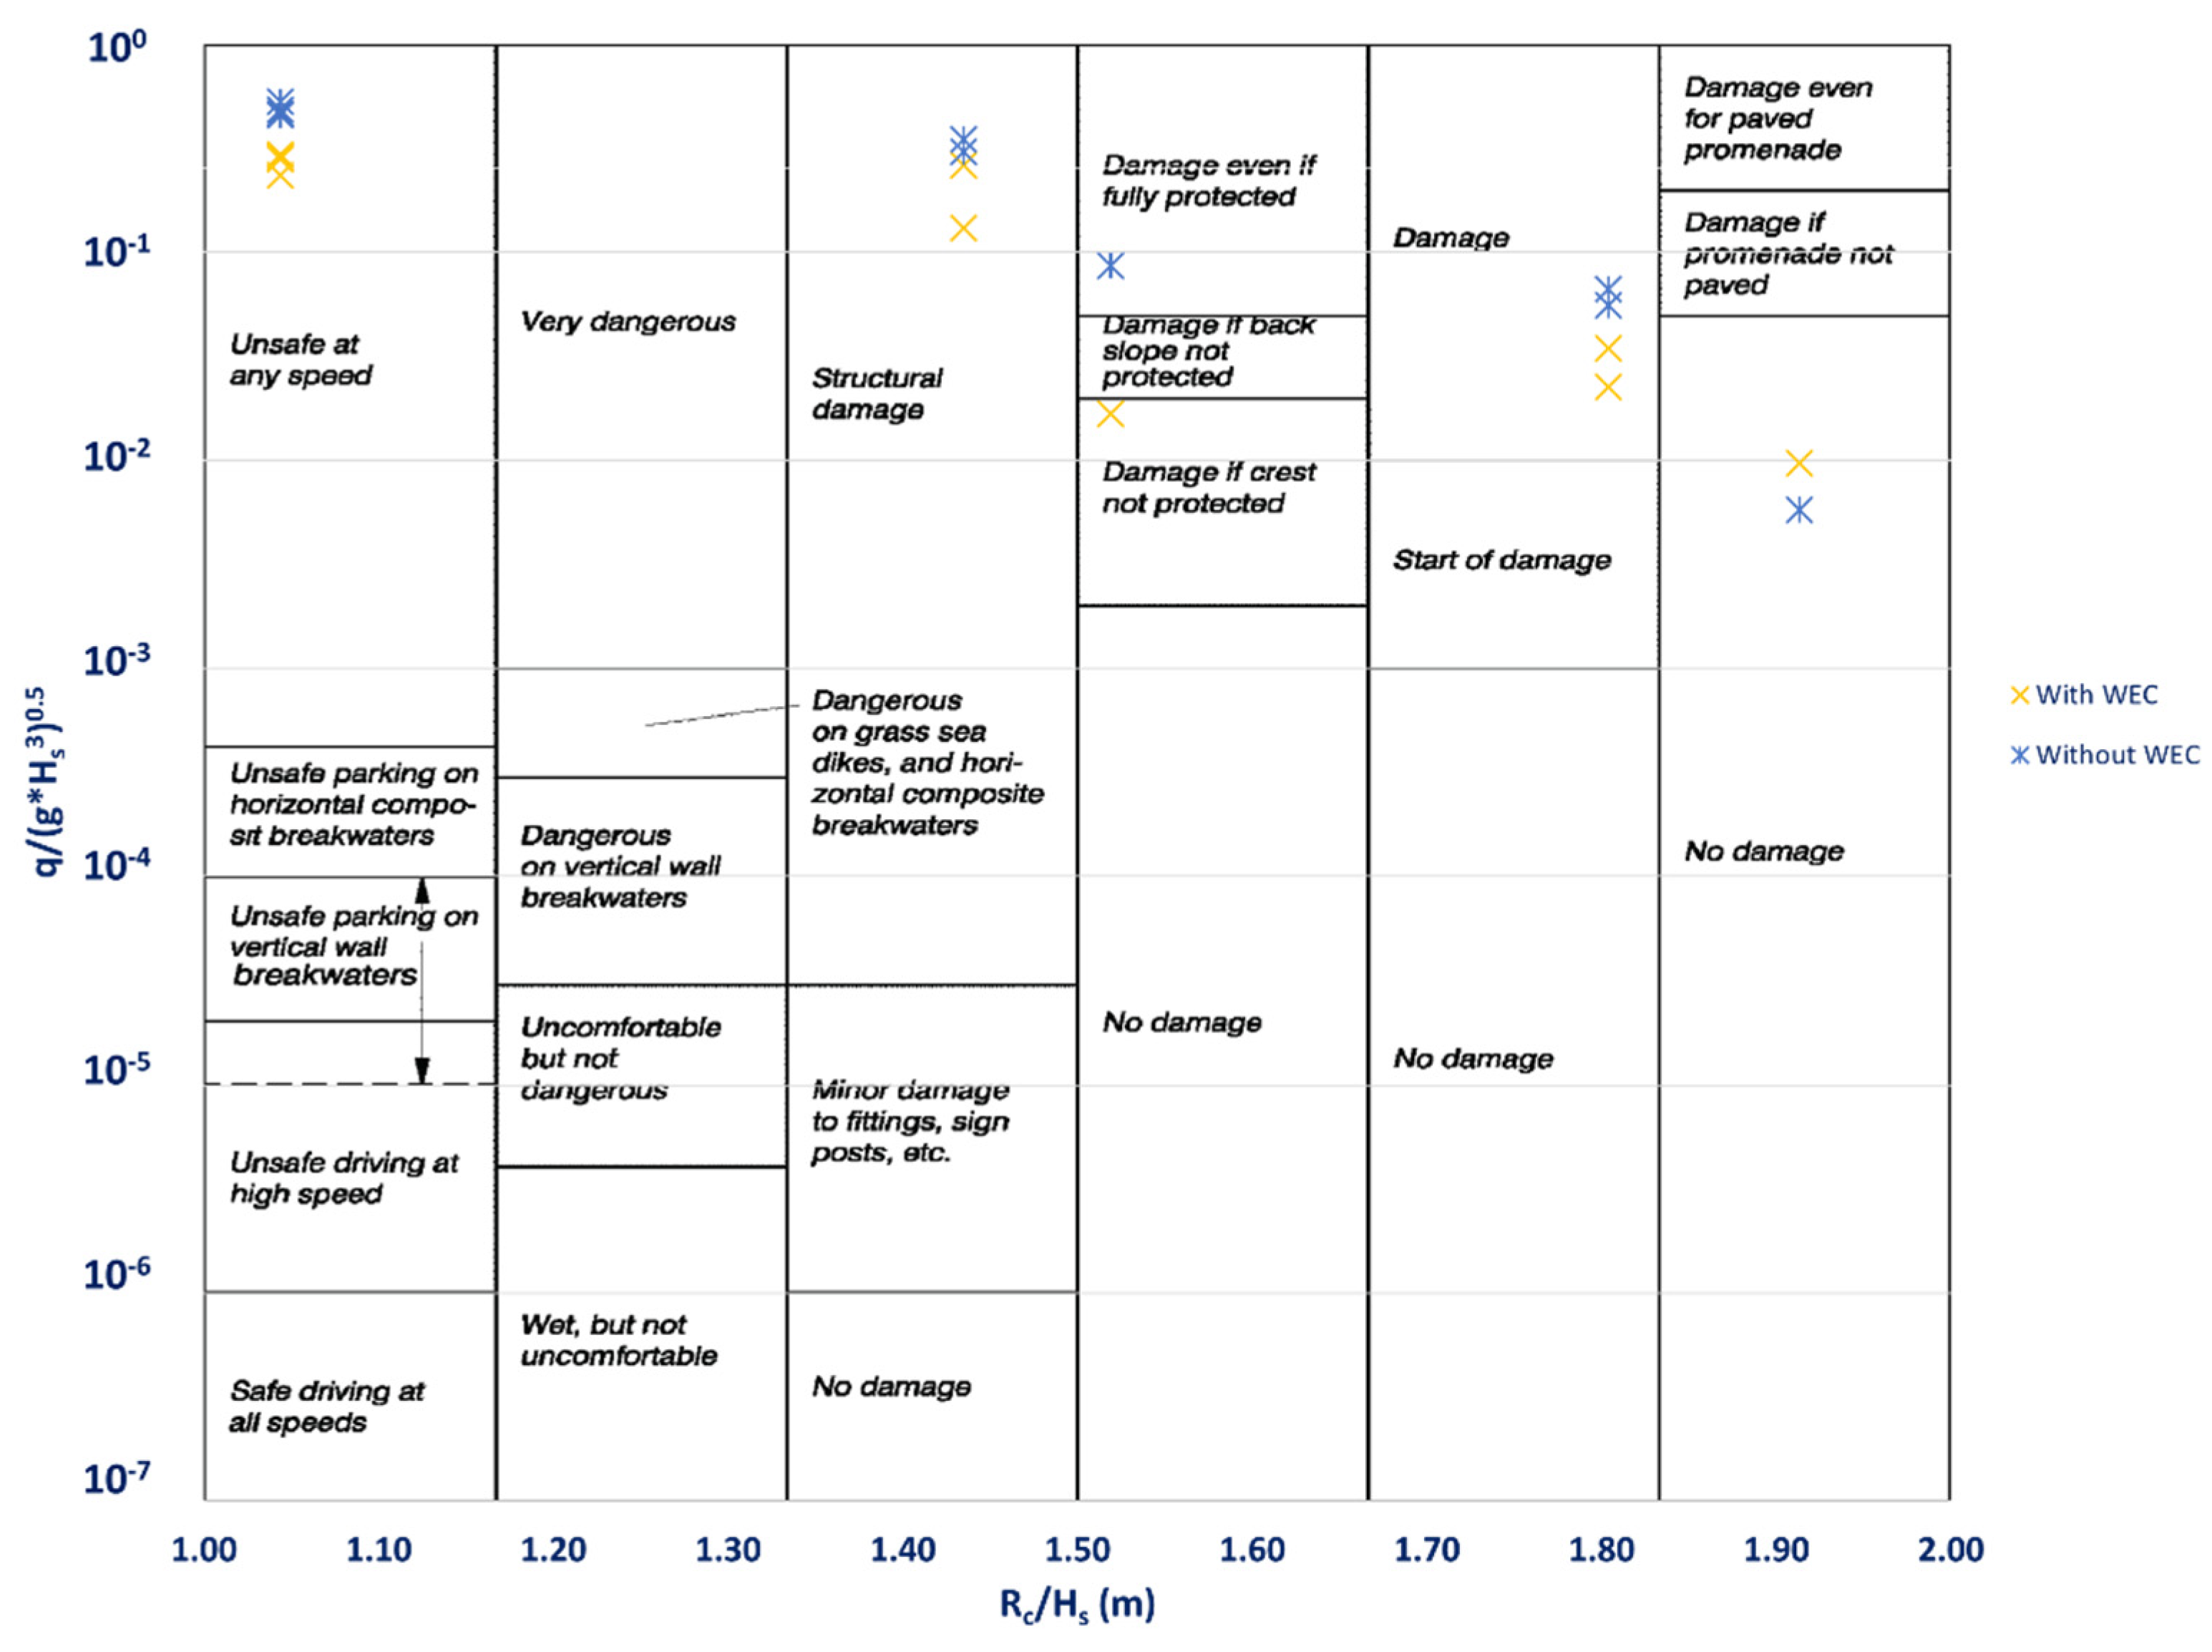
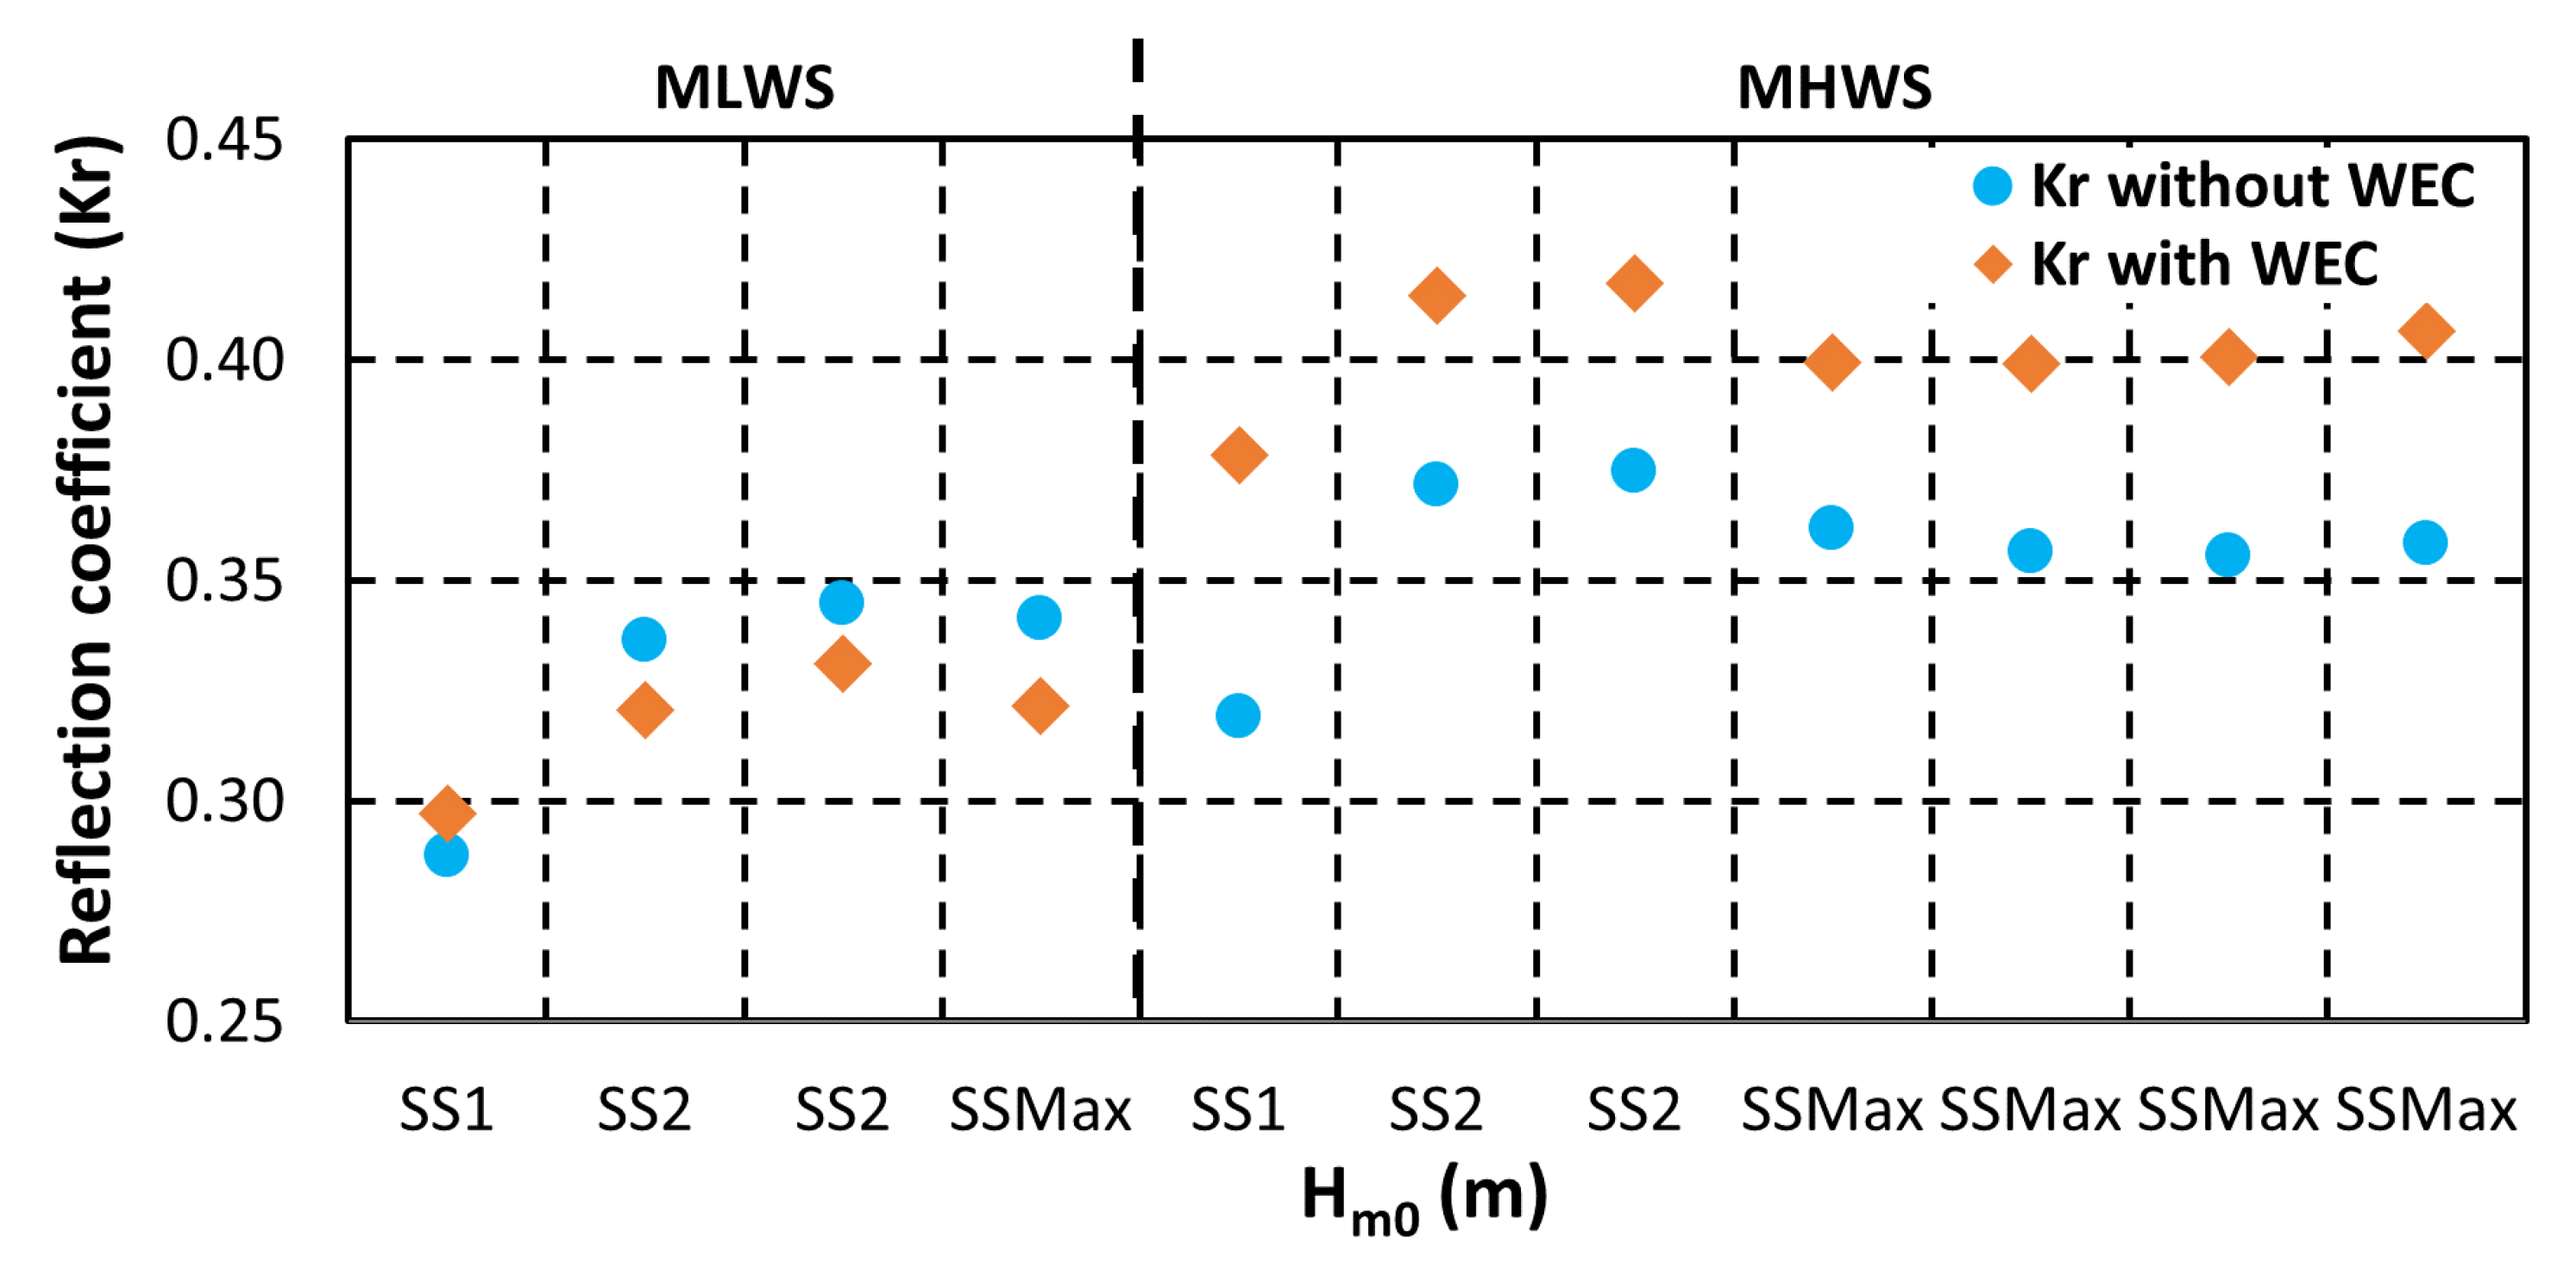
3.1. Structure’s Functionality

Breakwaters’ crest levels are a critical factor that should be carefully considered upon design. On one hand, crest heights may be required to be kept under a specific threshold, in order to minimize their visual impact. This is the case of the Port Leixões, as the extension of the north breakwater would introduce a new visual obstacle from the perspective of nearby residents and beach users. On the other hand, lower crest levels lead to more frequent overtopping occurrences, which can result in structural damage and longer periods of port terminal inoperativeness, should these exist. Therefore, the mean overtopping discharge should be studied for the most severe wave conditions that a breakwater is subjected to, as well as other more frequent conditions when overtopping might occur.
As explained previously, the overtopping flow over the crest of the structure is captured by a reservoir, on top of the device, connected to an AR on the back of the physical model. An example of a recorded time series is presented in Figure 6, where one can see the incrementing water level within the reservoir over time as well as the pump operation times.
The analysis of the overtopping discharges was carried out having as reference the EurOtop manual [39], which presents two methods: one based on the mean value approach and another on the design and assessment approach, being the difference in the definition of two coefficients a and b. Because the former is recommended for predictions and comparisons with measurements, the mean value approach was employed. As such, the curve equation is defined as:
q g H s 3 = 0.09 e x p [ ( 1.5 R c H s γ f γ β ) 1.3 ]
where q is the mean overtopping discharge, g the acceleration of gravity, Rc the crest height relative to the mean sea level, Hs the spectral significant wave height, and γ f and γ β the roughness and oblique wave attack factors, respectively.
It is worth noting that, in Equation (1), γ β and γ f are given based on the results from the EU research program CLASH. A priori, γ β is equal to 1, as in the study carried out, the waves do not act upon the breakwater structure at an oblique angle. However, the value of γ f is worthy of discussion. From the CLASH results, it is recommended that, for Antifer blocks, a value of 0.50 should be used for this coefficient. Nevertheless, this value was attained for an Antifer block configuration that is far more disordered than that used in this study, where the blocks were aligned carefully both in the longitudinal and transversal directions (regular placement). This will become more perceivable in the following sub-section. There is also some data dispersion inherent to the CLASH study and other limitations in terms of transposition to the study that is the scope of this paper. As such, an adjustment of the γ f coefficient was performed, aimed at approximating the relative overtopping rate curve (left-hand side of Equation (1)) to the experimental values, first for the case without the WEC, and aimed at minimizing the root mean square error (RMSE). Afterwards, the data for the case with the WEC integrated were considered (Figure 7).
It was found that, for the case study of the Port of Leixões, a value of about 0.66 and 0.77 for the roughness coefficient would yield the best curve approximation for the experimental data, with and without the HWEC, respectively (see Figure 7, which includes 5% variability curves, in accordance to the EurOtop manual). These values were computed with the assistance of the non-linear generalized reduced gradient solver engine, which minimized the RMSE (1.07 × 10⁻⁵ and 1.11 × 10⁻⁵, respectively). These γ f values are larger than the recommended value of 0.50. This result is justified by the more regular arrangement of the blocks in the armour layer in comparison to the CLASH experiments. The Antifer arrangement in the Leixões case study creates a smoother surface, somewhat comparable to a ramp, thus leading to higher values of the relative overtopping rate.
The results from Figure 7 also demonstrate a small, yet important overall reduction in the relative overtopping rate with the introduction of the WEC. In fact, it was estimated that the HWEC enabled an average reduction of about 50% in the mean overtopping discharge for the considered test conditions (Figure 7), if SS1 for the MHWS is not considered. Even so, for this particular case, the attained variation was attributed to the usual uncertainty in the prediction of overtopping discharges [34], especially high for very low discharge data, which typically show a wider variability.
From a practical perspective, it is also pertinent to address the hypothetical use of the breakwater’s inner side for different port related activities as well as the potential risks that are inherent to the occurrence of extreme sea states. Currently, the north breakwater of the Port of Leixões shelters from wave action an oil terminal, yet the extension project foresees, in essence, the improvement of the accessibility and navigation conditions within the harbour area. Hence, presently, no specific use of the extension is expected regarding road traffic, pedestrians, and alike activities, excepting those required for the construction and maintenance of the new structure. However, the situation may change in the future, as in the past, with the construction of the oil terminal of Leixões in the lee side of the existing north breakwater (Figure 1b). In that scenario, given the measured overtopping volumes and average discharges, the usage of interior areas of the north breakwater’s extension would need to be severely restricted during rough environmental conditions. This is perceivable from Figure 8, which is based upon the limits recommended in the Coastal Engineering Manual [21].
Even by considering the thresholds provided by the Rock Manual [20] or the EurOtop Manual [39], access to pedestrians and vehicles would be deemed unsafe during the occurrence of extreme wave conditions (overtopping discharges exceed limits by, at least, two orders of magnitude). The berthing of small ships is also ill-advised for those conditions. The introduction of the HWEC into breakwater, albeit reducing the overall overtopping discharges, is insufficient to eliminate the need for additional measures to reduce the risks linked to overtopping. In addition, it will be important to adequately plan the construction process of the breakwater.
The aforementioned reflection analysis routine was employed for the estimation of the reflection coefficients, K r (Figure 9). From the results, it is perceivable that the introduction of the HWEC leads to an overall reduction in the reflection coefficient for MLWS, while an increment is observed for MHWS. This could be justified by the structural design of the hybrid solution:
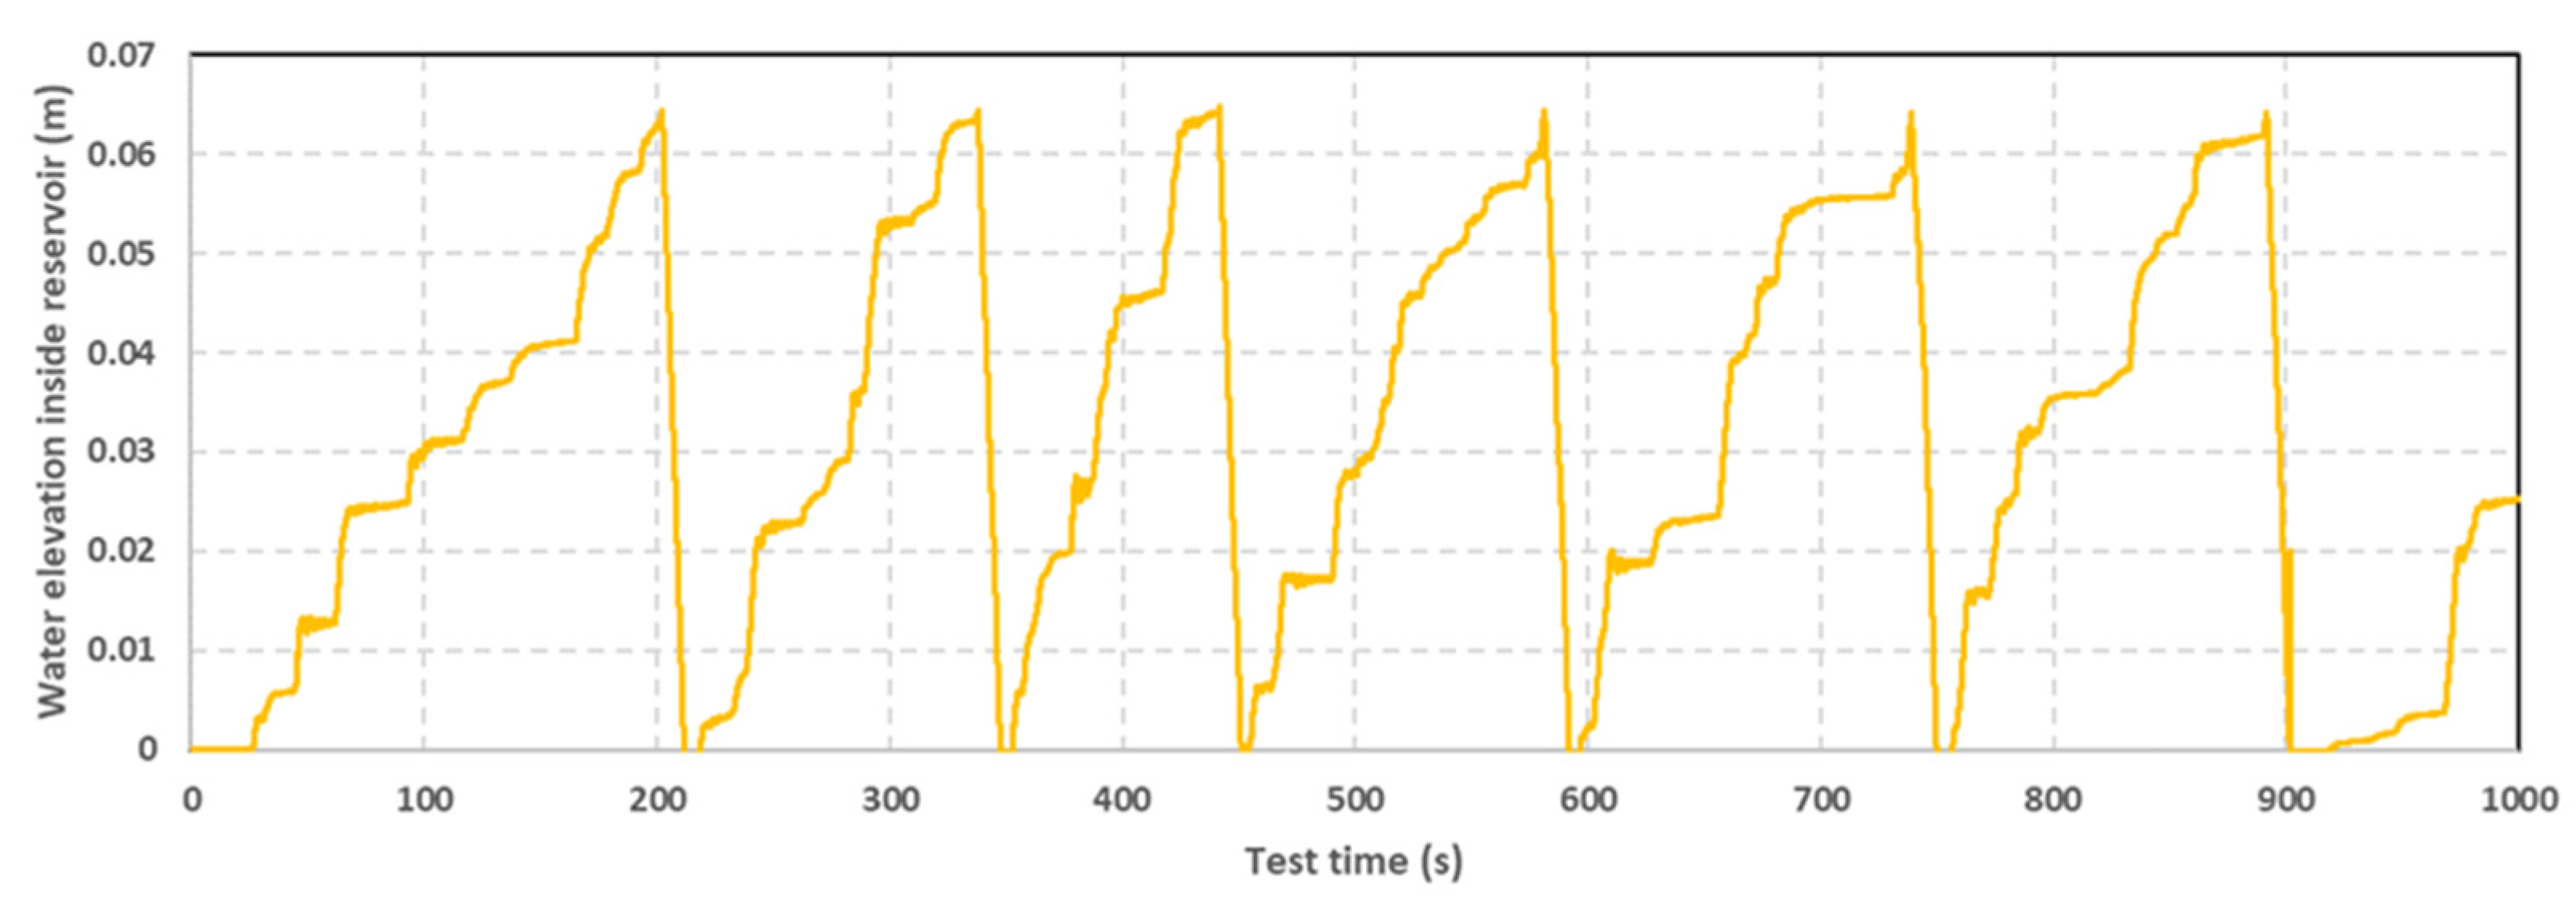
  • For MLWS, the overtopping discharges are partially received by the HWEC’s reservoirs. This exhibits a greater effect than that associated with reflections or energy dissipations by the original breakwater armour layer;
  • For MHWS, significant volumes of overtopping discharges are still received by the reservoirs. However, given the higher waterline level, the overtopping flow easily reaches the upper section of the HWEC. The reflections upon the crest’s vertical sections are responsible for the increment of K r .
The order of magnitude does not vary considerably (0.28 to 0.42, approximately) and tends to stabilize beyond SS1. Additionally, although the significant wave height continues to increase, the peak wave period is conserved (16 s), which is in agreement with the evolution pattern of K r .

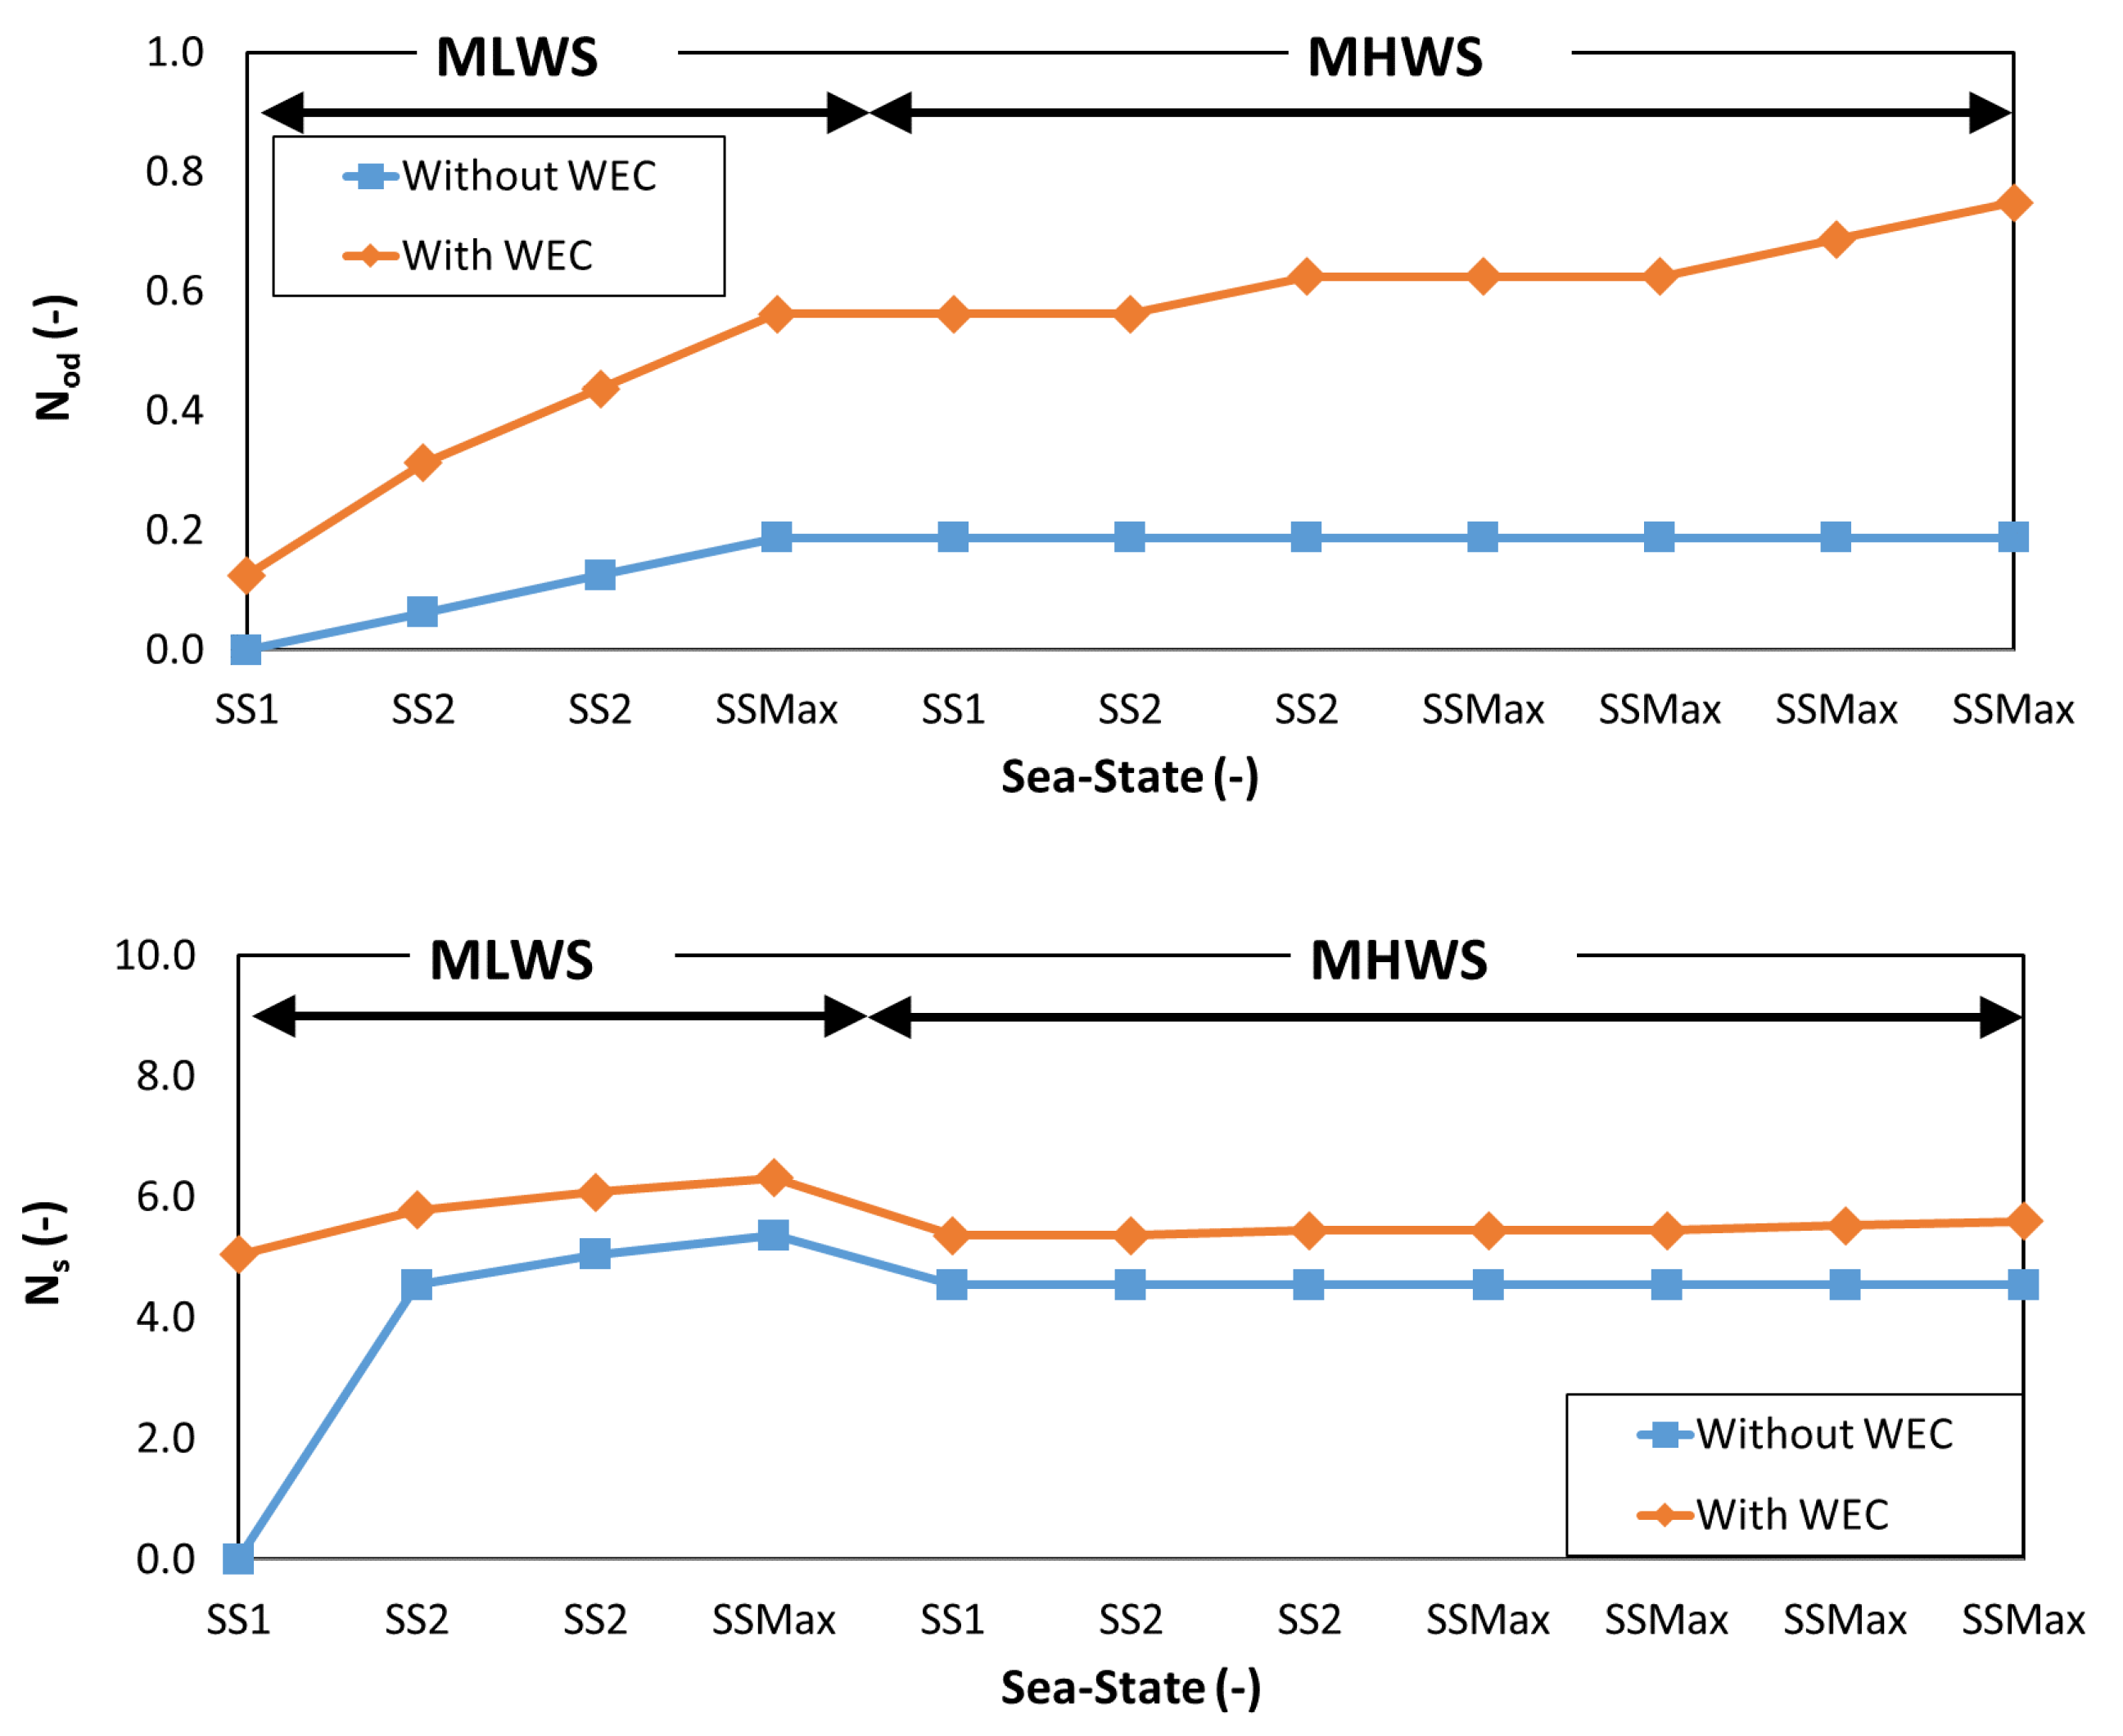
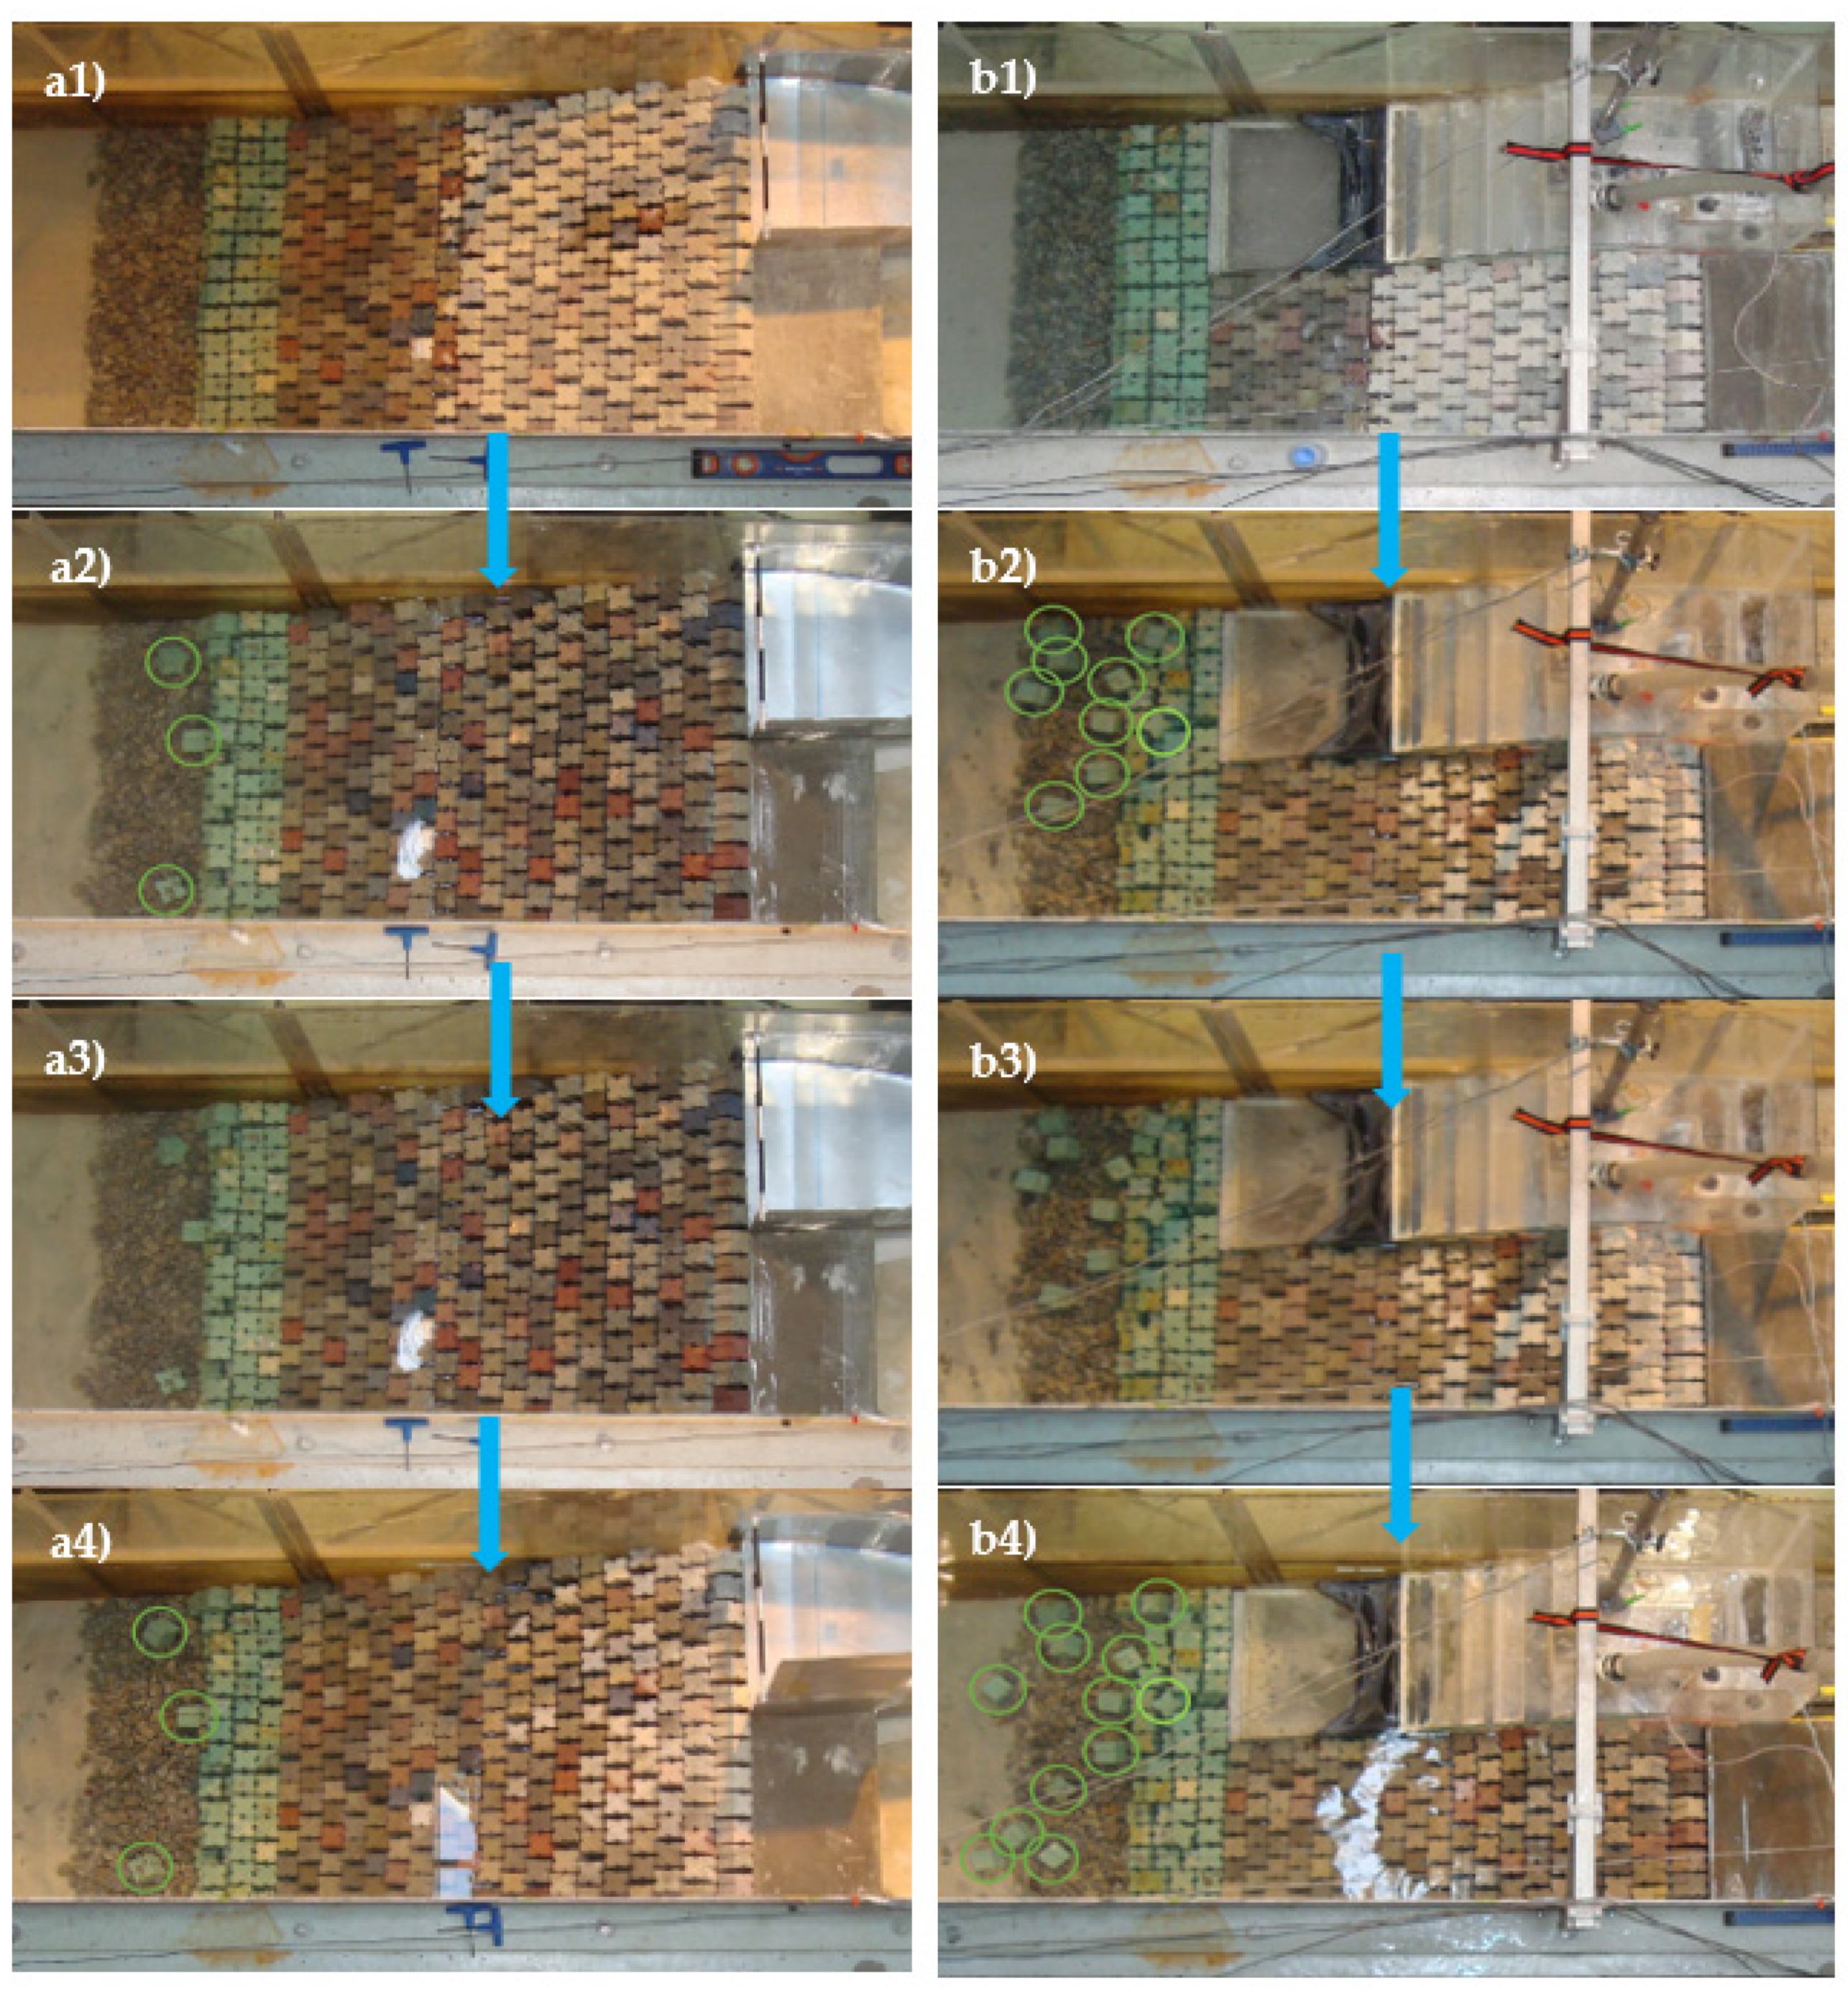
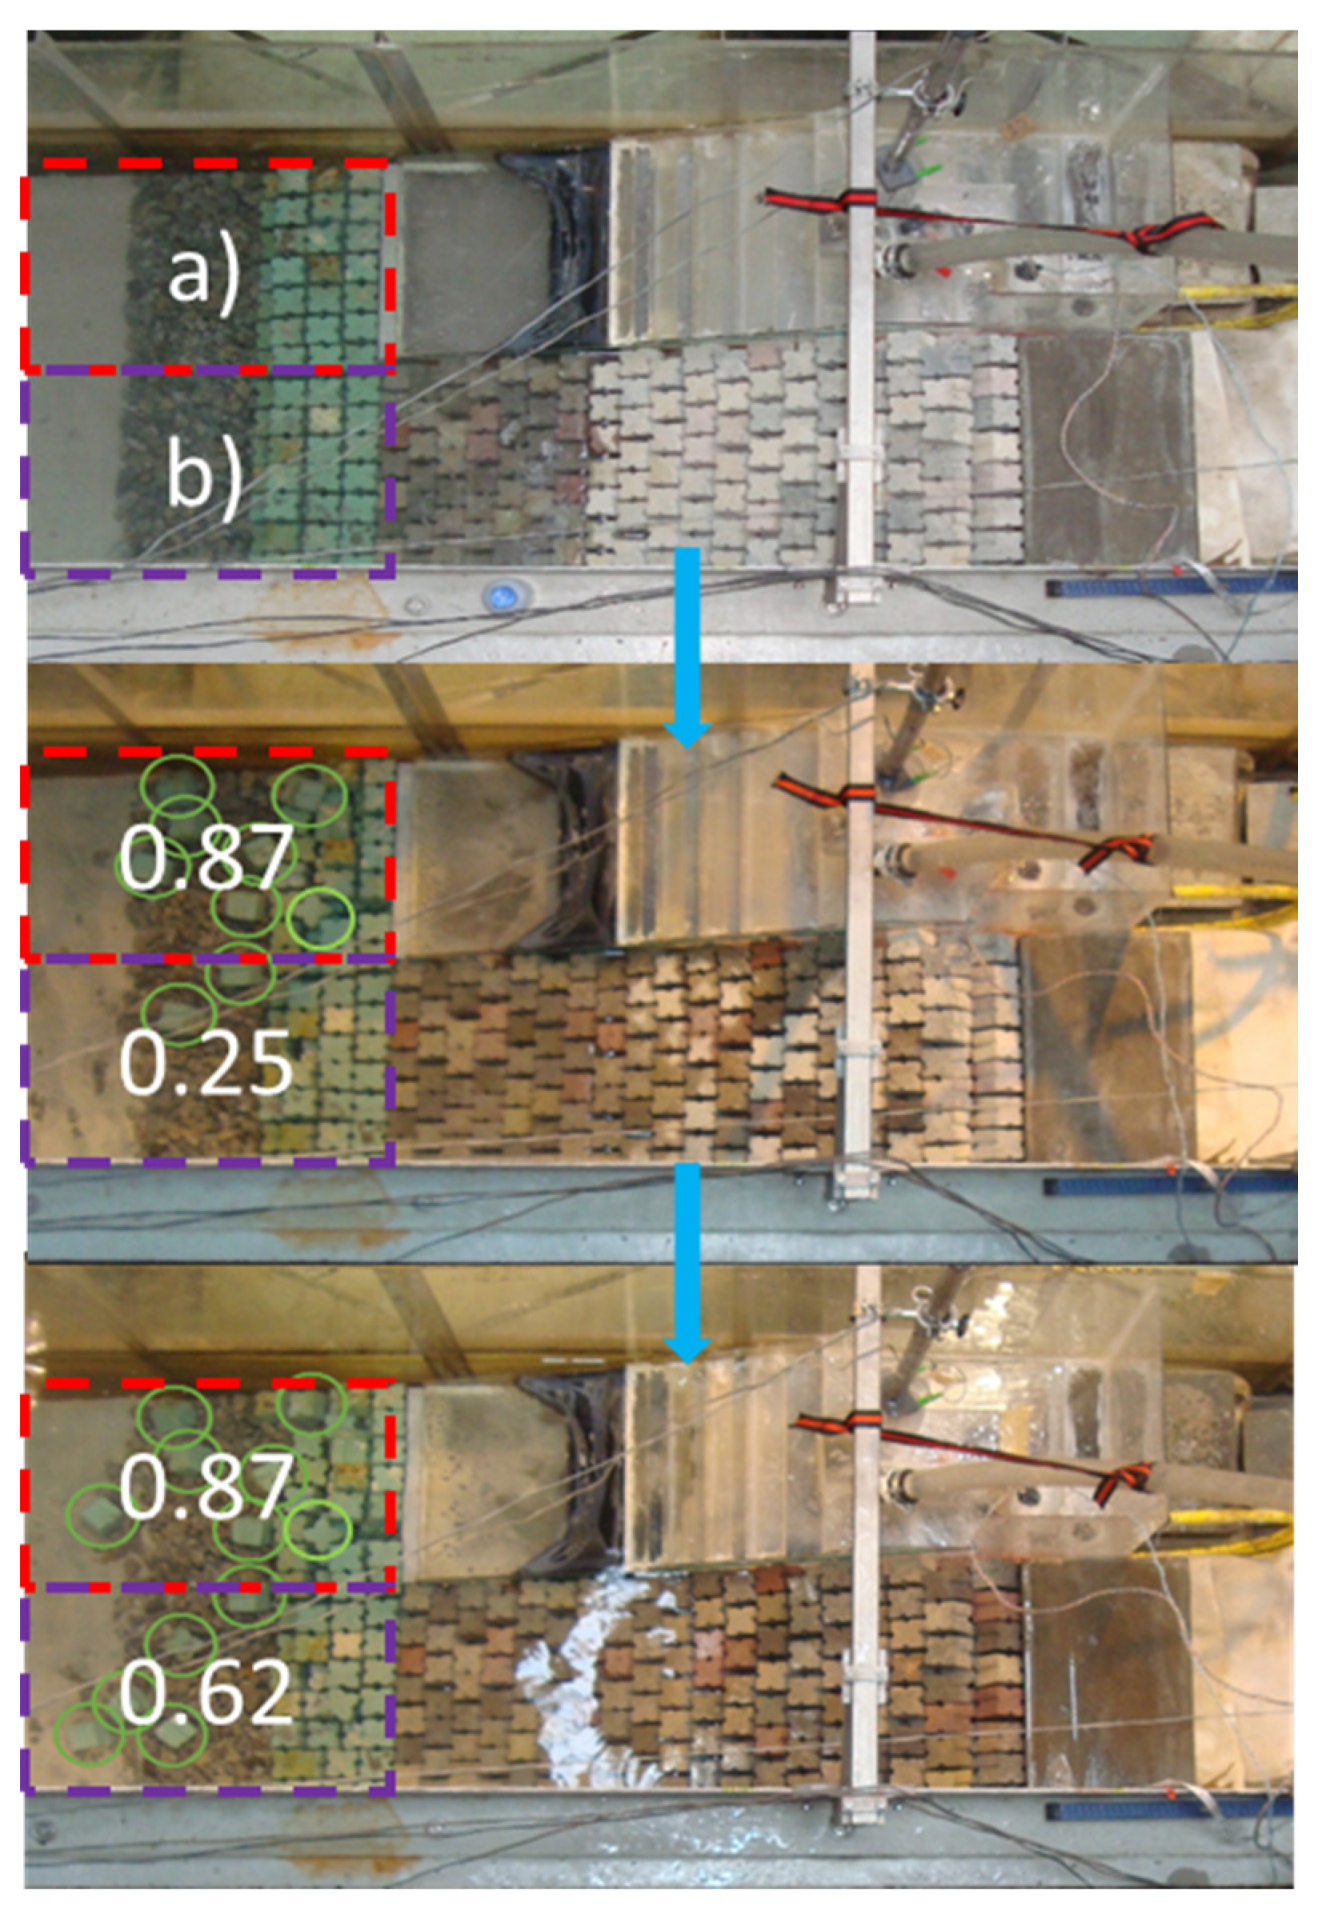
3.2. Structure’s Stability

The analysis of the structural stability of the breakwater requires a comparison between the design solutions for the north breakwater extension with and without the integration of the hybrid OWEC–OWC device. It is crucial that the introduction of the WEC does not significantly weaken, considering a worst-case scenario, the structural stability of the rubble-mound breakwater, given its key importance as a sheltering structure of the innermost areas of the seaport. For the Port of Leixões case study, the armour layer and toe berm of the outer sections of the structure, composed of Antifer concrete blocks, are of particular interest. Any movements, rotations, or excessive damage require repositioning and/or replacement of those blocks. Therefore, it is crucial to identify sections susceptible to these occurrences, particularly for severe wave climate, and quantify the motions and number of blocks that have moved over the various tests.
A preliminary analysis of the evolution of the toe berm (light green blocks) and the outer amour layer (remaining blocks) of the breakwater is perceptible in Figure 10, for both the tests associated with MLWS and MHWS. It is noticeable that the outer armour layer has very small changes, both with and without the WEC; however, there are important changes that can be observed on the toe berm blocks. In the absence of the WEC, only three of these blocks were considerably displaced, and the number did not increase going from MLWS to MHWS tests. In contrast, when the WEC is integrated into the breakwater, the number of displaced blocks increases significantly. Moreover, unlike the previous case, there is an increment of the number of displaced blocks from the toe berm when comparing the final tests of MLWS and MHWS levels. The blocks are also shifted further away from the physical model.
The stability of the outer armour layer and toe berm of the breakwater was analysed through the application of methods recommended in the literature [21]. An initial assessment involved the quantification of the damage number, N o d , defined as the number of displaced units within a breakwater strip with a width of D n , and the stability number, N s , a commonly used parameter to assess structural stability under wave attack [25]:
N o d = N d i s   W / D n
N s =   H s ( ρ s ρ w 1 ) D n = ( 1.6 + 0.24 h b D n ) N o d 0.15
where Ndis represents the number of units displaced out of the armour layer or toe berm, W the width of the reference section, Dn the nominal diameter of the blocks, hb the water depth at the top of the toe berm, and ρ s and ρ w the mass density of the blocks and water, respectively. Considering that Antifer blocks were used in this study, Dn was calculated as the equivalent cube length. Equation (3) refers to the stability of a toe berm formed by two layers of stone with density of 2.68 t/m3, which was deemed the most suitable empirical formula for the present study.
The analysis was supported by video recordings and photographs such as those presented in Figure 10, covering the sections of interest. These were taken during the same tests discussed in the previous sub-section. The comparison was made by matching the results, for equivalent wave conditions, of the physical model with and without the WEC, as seen in Figure 11.
Regarding the analysis of the toe berm blocks, the values are cumulative and for the whole toe berm, following the order of the tests from MLWS to MHWS (Table 1). Even so, it is noticeable that, without the WEC, there is a gradual increment of the N o d for MLWS level as the significant wave height increases, yet it remains unchanged for MHWS (0.19), as it reaches an equilibrium state, as discussed previously. In contrast, the N o d values with the WEC are much higher for both sea levels, with a maximum of 0.56 and 0.75 for MLWS and MHWS, respectively. Furthermore, the increment curve is less steep for MLWS, and block motion is recorded during MHWS tests with the WEC. Lastly, the stability number is slightly higher, overall, with the introduction of the WEC. The values range between 1.97 and 2.47/2.83 (MLWS/MHWS) and 0.00 and 2.09/2.30 (MLWS/MHWS) in the presence and absence of the WEC, respectively. Both limits are within the recommended threshold of 1 to 4 for statically stable breakwaters, a category into which rubble-mound breakwaters are included [20,21]. However, the toe berm may safely allow values above that range. Concerning the armour layer, no significant displacement of units was observed, leading to N o d values always equal to zero. As such, little to no damage is expected to occur at the armour layer under current design conditions, either with or without the WEC. Even so, the toe berm has not reached a complete stability state, and additional damage could occur if more tests were to be carried out. Consequently, this does not remove the possibility of structural failure, although no block motion was recorded for the armour layer blocks, with and without the WEC. The increment in the reflection coefficients also hints towards the potential generation of a stronger seaward current responsible for the additional damage at the toe berm, with the HWEC. This should be further assessed in follow-up studies.
For Antifer cubes on the toe berm, the reference value of damage start is 0.5, for N o d , and 2.42 to 2.67, for a corresponding N s , considering the MLWS and the MHWS, respectively [21]. While the scenario without the WEC remains below these thresholds, even after the last test with MHWS, the integration of the WEC leads to an increase in N o d and N S slightly beyond the upper limits, even when the whole cross section is considered. The damage number further increases and reaches a maximum of 0.75, an intermediate value between the damage start level and the acceptable damage level, which has a threshold of 2. The corresponding N s is 2.83, for the obtained damage number, and 3.28, for the MHWS threshold (2.98 for MLWS). Even so, for the whole cross section, neither case leads to a situation where the N o d reaches or exceeds the “severe damage level”, since the values are all far below 4 (3.31 to 3.64, for a corresponding N s ). In summary, the N o d and N s in the absence of the WEC are, in accordance to Table VI-5-46 of the CEM [21], in the “no damage” case. With the WEC, “no damage” is mostly associated with the MLWS, while the MHWS yields only the “acceptable damage” case.
Nevertheless, it is important to take into account that the breakwater with the WEC integrated has a non-uniform cross-section, and the toe berm presents a distinct behaviour in front of the hybrid WEC (Figure 10). Figure 12 presents the evolution of the N o d parameter for the two stretches: in front of the WEC and remaining stretch, with maximum values of 0.87 and 0.62, respectively. It can be seen that while for the conventional cross-section N o d is safely below the start of damage threshold, at first, in front of the hybrid WEC, the toe berm is very close to the moderate damage condition. For the final layout, however, the damage number in front of the WEC stabilizes, but it increases to 0.62 for the adjacent cross-section, thus overcoming the moderate damage condition. These preliminary results reveal that methodologies that were developed for the analysis of conventional breakwater structures should be applied with care when WECs are integrated, forming non-uniform structures with completely different behaviours that should be analysed independently, to ensure the overall stability of the structure. The evaluation should also account for a significant duration and range of extreme wave conditions, given the evolution of N o d attributed to each reference stretch of the toe berm.

4. Conclusions

In this paper, the integration of a hybrid OWEC–OWC wave energy converter device into the north breakwater at the Port of Leixões was analysed. The influence of such a combination in terms of structural stability and functionality of the rubble-mound breakwater was addressed and discussed, following the recommendations from the literature on the subject.
From a functional perspective, the integration of the hybrid concept denotes a beneficial contribution to overtopping volume mitigation, with an average reduction of about 50% for the tested conditions. Furthermore, the dimensionless discharge was compared to the overtopping prediction formula from EurOtop II. The results with and without the WEC both yielded roughness factors above the recommended value for Antifer blocks, given the regular placement of the armour layer blocks and the smooth surface of the WEC structure. In contrast, the overtopping results exceed the recommendations of the Rock Manual, the EurOtop II Manual, and the Coastal Engineering Manual regarding safety towards pedestrians (including trained staff), vehicles, equipment, and vessel access, being at least two orders of magnitude above the thresholds. Hence, if the function or use of the structure (i.e., the north breakwater extension) is changed in the future, it may be necessary to introduce particular modifications in the structural solution, namely, in terms of the crest’s shape (assuming the implantation of the WEC) and armour layer block layout. This is dependent upon the intended usage of the inner area of the breakwater extension and the crest, which is currently foreseen to be very limited. Concerning wave reflections, the introduction of the HWEC led to an increase/decrease in K r for MLWS/MHWS, respectively. These were a consequence of the HWEC’s design, namely, the sloped reservoirs (MLWS) and the upper part of the HWEC module, which exhibit an essentially vertical configuration (MHWS). This should be carefully analysed in an eventual deployment stage, as it could affect the local navigation conditions and wave regime.
The structural stability analysis indicates that the introduction of the WEC has a negative impact on the stability of the toe berm of the breakwater, although the armour layer was not affected in a significant way (no relevant movements in the armour layer blocks). The level of damage is greater for the case with the WEC device integrated into the breakwater, yet the damage number and stability number values are lower than the failure level threshold when the whole toe berm is considered. At worst, an “acceptable damage” is obtained, and mostly for the MHWS with the WEC. A more specific analysis, dividing the toe berm in two parts, reveals higher damage numbers in front of the WEC, particularly for the MLWS, highlighting the fact that traditional damage assessment methods should be applied with care when non-conventional structures are analysed, such as breakwaters with integrated WEC. The original toe berm solution should also be redesigned, in order to ensure that the risk of failure is mitigated, as well as that of scouring. This should be a feasible option, as the inherent costs are expected to be low in comparison with the costs of the armour layer.

Author Contributions

Conceptualization, methodology, validation, formal analysis, investigation: D.C., T.C.-C., P.R.-S. and F.T.-P.; software: D.C., T.C.-C. and P.R.-S.; visualization, data curation: D.C. and T.C.-C.; writing—original draft preparation/review and editing: D.C.; writing—review and editing: T.C.-C., P.R.-S. and F.T.-P.; supervision, resources, project administration: P.R.-S. and F.T.-P. All authors have read and agreed to the published version of the manuscript.

Funding

This research was funded by the OCEANERA-NET project SE@PORTS—Sustainable Energy at SeaportS—with the references OCEANERA/0004/2016 and OCEANERA/0003/2016, under the frame of FCT, the Portuguese Foundation for Science and Technology, by the project PORTOS—Ports Towards Energy Self-Sufficiency—with the reference EAPA_784/2018 and co-financed by the Interreg Atlantic Area Program through the European Regional Development Fund and by the OCEANERA-NET COFUND project WEC4Ports—A Hybrid Wave Energy Converter for Ports—with the reference OCEANERA/0004/2019, under the frame of FCT.

Institutional Review Board Statement

Not applicable.

Informed Consent Statement

Not applicable.

Acknowledgments

The authors are in debt to LNEC, which lent the Antifer units used to materialize the armour layer of the reference breakwater model, to ELEVO for providing the rubble mound for the core and internal layers of that breakwater, and to the Port Authority of Douro, Leixões, and Viana do Castelo, for the information provided to characterize the case study. João Henriques (from Instituto Superior Técnico) provided important contributions to the testing and control of the PTO system used in the OWC module. The authors wish also to acknowledge the remaining partners of the SE@Ports and PORTOS consortium, namely, INEGI, who fabricated the physical model, and to the Port Authority of Douro, Leixões, and Viana do Castelo, for all the information provided to characterize the case study.

Conflicts of Interest

The authors declare no conflict of interest. The funders had no role in the design of the study, in the collection, analyses, or interpretation of data; in the writing of the manuscript, or in the decision to publish the results.

References

  1. Hiranandani, V. Sustainable development in seaports: A multi-case study. WMU J. Marit. Aff. 2014, 13, 127–172. [Google Scholar] [CrossRef]
  2. Murphy, E.; King, E.A. An assessment of residential exposure to environmental noise at a shipping port. Environ. Int. 2014, 63, 207–215. [Google Scholar] [CrossRef] [Green Version]
  3. Pittaluga, I.; Borelli, D.; Repetto, S. Noise Pollution Management in Ports: A brief Review and the EU MESP Project Experience. In Proceedings of the 21st International Congress on Sound and Vibration, Beijing, China, 13–17 July 2014; p. 8. [Google Scholar]
  4. Winnes, H.; Styhre, L.; Fridell, E. Reducing GHG emissions from ships in port areas. Res. Transp. Bus. Manag. 2015, 17, 73–82. [Google Scholar] [CrossRef] [Green Version]
  5. Schipper, C.A.; Vreugdenhil, H.; de Jong, M.P.C. A sustainability assessment of ports and port-city plans: Comparing ambitions with achievements. Transp. Res. Part D Transp. Environ. 2017, 57, 84–111. [Google Scholar] [CrossRef]
  6. Becker, A.; Inoue, S.; Fischer, M.; Schwegler, B. Climate change impacts on international seaports: Knowledge, perceptions, and planning efforts among port administrators. Clim. Chang. 2012, 110, 5–29. [Google Scholar] [CrossRef]
  7. Becker, A.H.; Acciaro, M.; Asariotis, R.; Cabrera, E.; Cretegny, L.; Crist, P.; Esteban, M.; Mather, A.; Messner, S.; Naruse, S.; et al. A note on climate change adaptation for seaports: A challenge for global ports, a challenge for global society. Clim. Chang. 2013, 120, 683–695. [Google Scholar] [CrossRef] [Green Version]
  8. Acciaro, M.; Vanelslander, T.; Sys, C.; Ferrari, C.; Roumboutsos, A.; Giuliano, G.; Lam, J.S.L.; Kapros, S. Environmental sustainability in seaports: A framework for successful innovation. Marit. Policy Manag. 2014, 41, 480–500. [Google Scholar] [CrossRef]
  9. Lam, J.S.L.; Notteboom, T. The Greening of Ports: A Comparison of Port Management Tools Used by Leading Ports in Asia and Europe. Transp. Rev. 2014, 34, 169–189. [Google Scholar] [CrossRef]
  10. Puig, M.; Wooldridge, C.; Darbra, R.M. Identification and selection of Environmental Performance Indicators for sustainable port development. Mar. Pollut. Bull. 2014, 81, 124–130. [Google Scholar] [CrossRef]
  11. Vicinanza, D.; Contestabile, P.; Quvang Harck Nørgaard, J.; Lykke Andersen, T. Innovative rubble mound breakwaters for overtopping wave energy conversion. Coast. Eng. 2014, 88, 154–170. [Google Scholar] [CrossRef]
  12. Vicinanza, D.; Lauro, E.D.; Contestabile, P.; Gisonni, C.; Lara, J.L.; Losada, I.J. Review of Innovative Harbor Breakwaters for Wave-Energy Conversion. J. Waterw. Port Coast. Ocean Eng. 2019, 145, 03119001. [Google Scholar] [CrossRef]
  13. Di Lauro, E.; Lara, J.L.; Maza, M.; Losada, I.J.; Contestabile, P.; Vicinanza, D. Stability analysis of a non-conventional breakwater for wave energy conversion. Coast. Eng. 2019, 145, 36–52. [Google Scholar] [CrossRef]
  14. Bruun, P. Design and Construction of Mounds for Breakwaters and Coastal Protection; Elsevier: Amsterdam, The Netherlands, 2013. [Google Scholar]
  15. Naty, S.; Viviano, A.; Foti, E. Wave Energy Exploitation System Integrated in the Coastal Structure of a Mediterranean Port. Sustainability 2016, 8, 1342. [Google Scholar] [CrossRef] [Green Version]
  16. Arinaga, R.A.; Cheung, K.F. Atlas of global wave energy from 10 years of reanalysis and hindcast data. Renew. Energy 2012, 39, 49–64. [Google Scholar] [CrossRef]
  17. Gunn, K.; Stock-Williams, C. Quantifying the global wave power resource. Renew. Energy 2012, 44, 296–304. [Google Scholar] [CrossRef]
  18. Van der Meer, J.W. Geometrical design of coastal structures. In Seawalls Dikes Revetments; Pilarczyk, K.W., Ed.; Balkema: Rotterdam, The Netherlands, 1998; p. 15. [Google Scholar]
  19. Gerding, E. Toe structure stability of rubble mound breakwaters. In Delft and Delft Hydraulics Report H1874; Delft University of Technology: Delft, The Netherlands, 1993. [Google Scholar]
  20. CIRIA; Engineering CCFC; CETMEF. The Rock Manual: The Use of Rock in Hydraulic Engineering; Construction Industry Research & Information Association: London, UK, 2007. [Google Scholar]
  21. USACE. Coastal Engineering Manual Part VI: Design of Coastal Project Elements. In Place of Publication Not Identified; Books Express Publishing: Berkshire, UK, 2012. [Google Scholar]
  22. Van Gent, M.R.A. Rock stability of rubble mound breakwaters with a berm. Coast. Eng. 2013, 78, 35–45. [Google Scholar] [CrossRef]
  23. Van Gent, M.R.A.; van der Werf, I.M. Rock toe stability of rubble mound breakwaters. Coast. Eng. 2014, 83, 166–176. [Google Scholar] [CrossRef]
  24. Etemad-Shahidi, A.; Bali, M. Stability of rubble-mound breakwater using H50 wave height parameter. Coast. Eng. 2012, 59, 38–45. [Google Scholar] [CrossRef] [Green Version]
  25. Van der Meer, J.W. Stability of breakwater armour layers—design formulae. Coast. Eng. 1987, 11, 219–239. [Google Scholar] [CrossRef]
  26. Hudson, R.Y. Design of Quarry Stone Cover Layer for Rubble Mound Breakwaters; Waterways Experiment Station, Coastal Engineering Research Centre: Vicksburg, MS, USA, 1958. [Google Scholar]
  27. Vidal, C.; Medina, R.; Lomónaco, P. Wave height parameter for damage description of rubble-mound breakwaters. Coast. Eng. 2006, 53, 711–722. [Google Scholar] [CrossRef]
  28. Kralli, V.-E.; Theodossiou, N.; Karambas, T. Optimal Design of Overtopping Breakwater for Energy Conversion (OBREC) Systems Using the Harmony Search Algorithm. Front Energy Res. 2019, 7, 11. [Google Scholar] [CrossRef] [Green Version]
  29. Bingham, H.B.; Ducasse, D.; Nielsen, K.; Read, R. Hydrodynamic analysis of oscillating water column wave energy devices. J. Ocean. Eng. Mar. Energy 2015, 1, 405–419. [Google Scholar] [CrossRef] [Green Version]
  30. Bruce, T.; van der Meer, J.W.; Franco, L.; Pearson, J.M. Overtopping performance of different armour units for rubble mound breakwaters. Coast. Eng. 2009, 56, 166–179. [Google Scholar] [CrossRef]
  31. Van der Meer, J.W.; Verhaeghe, H.; Steendam, G.J. The new wave overtopping database for coastal structures. Coast. Eng. 2009, 56, 108–120. [Google Scholar] [CrossRef]
  32. De Rouck, J.; Verhaeghe, H.; Geeraerts, J. Crest level assessment of coastal structures—General overview. Coast. Eng. 2009, 56, 99–107. [Google Scholar] [CrossRef]
  33. Allsop, W.; Bruce, T.; Pearson, J.; Besley, P. Wave overtopping at vertical and steep seawalls. Proc. Inst. Civ. Eng.-Marit. Eng. 2005, 158, 103–114. [Google Scholar] [CrossRef] [Green Version]
  34. Romano, A.; Bellotti, G.; Briganti, R.; Franco, L. Uncertainties in the physical modelling of the wave overtopping over a rubble mound breakwater: The role of the seeding number and of the test duration. Coast. Eng. 2015, 103, 15–21. [Google Scholar] [CrossRef]
  35. Losada, I.J.; Lara, J.L.; Guanche, R.; Gonzalez-Ondina, J.M. Numerical analysis of wave overtopping of rubble mound breakwaters. Coast. Eng. 2008, 55, 47–62. [Google Scholar] [CrossRef]
  36. Cavallaro, L.; Dentale, F.; Donnarumma, G.; Foti, E.; Musumeci, R.E.; Carratelli, E.P. Rubble Mound Breakwater Overtopping: Estimation of the Reliability of a Numerical 3D Simulation. Coast. Eng. Proc. 2012, 1, 8. [Google Scholar] [CrossRef] [Green Version]
  37. Briganti, R.; Bellotti, G.; Franco, L.; De Rouck, J.; Geeraerts, J. Field measurements of wave overtopping at the rubble mound breakwater of Rome–Ostia yacht harbour. Coast. Eng. 2005, 52, 1155–1174. [Google Scholar] [CrossRef]
  38. Troch, P.; Geeraerts, J.; Van de Walle, B.; De Rouck, J.; van Damme, L.; Allsop, W.; Franco, L. Full-scale wave-overtopping measurements on the Zeebrugge rubble mound breakwater. Coast. Eng. 2004, 51, 609–628. [Google Scholar] [CrossRef]
  39. Van der Meer, J.W.; Allsop, N.W.H.; Bruce, T.; De Rouck, J.; Kortenhaus, A.; Pullen, T.; Schüttrumpf, H.; Troch, P.; Zanuttigh, B. EurOtop: Manual on wave overtopping of sea defences and related structures. EurOtop 2018. Available online: http://www.overtopping-manual.com/ (accessed on 1 August 2021).
  40. Sigurdarson, S.; van der Meer, J.W. Wave Overtopping at Berm Breakwaters in Line with EurOtop. Coast. Eng. Proc. 2012, 33, 12. [Google Scholar] [CrossRef]
  41. LNEC. Estudos em Modelo Físico e Numérico do Prolongamento do Quebra-mar Exterior e das Acessibilidades Marítimas do Porto de Leixões; Laboratório Nacional de Engenharia Civil (LNEC): Lisboa, Portugal, 2017. [Google Scholar]
  42. Calheiros-Cabral, T.; Clemente, D.; Rosa-Santos, P.; Taveira-Pinto, F.; Ramos, V.; Morais, T.; Cestaro, H. Evaluation of the annual electricity production of a hybrid breakwater-integrated wave energy converter. Energy 2020, 213, 17. [Google Scholar] [CrossRef]
  43. Cabral, T.; Clemente, D.; Rosa-Santos, P.; Taveira-Pinto, F.; Morais, T.; Belga, F.; Cestaro, H. Performance Assessment of a Hybrid Wave Energy Converter Integrated into a Harbor Breakwater. Energies 2020, 13, 236. [Google Scholar] [CrossRef] [Green Version]
  44. Pecher, A.; Kofoed, J.P. (Eds.) Handbook of Ocean Wave Energy; Springer International Publishing: Cham, Switzerland, 2017; Volume 7. [Google Scholar] [CrossRef] [Green Version]
  45. Iuppa, C.; Cavallaro, L.; Musumeci, R.E.; Vicinanza, D.; Foti, E. Empirical overtopping volume statistics at an OBREC. Coast. Eng. 2019, 152, 103524. [Google Scholar] [CrossRef]
  46. Margheritini, L.; Vicinanza, D.; Kofoed, J.P. Overtopping Performance of Sea Wave Slot Cone Generator. Coasts, Marine Structures and Breakwaters: Adapting to Change; Thomas Telford Ltd.: London, UK, 2010; pp. 750–761. [Google Scholar] [CrossRef] [Green Version]
  47. Contestabile, P.; Ferrante, V.; Di Lauro, E.; Vicinanza, D. Prototype Overtopping Breakwater for Wave Energy Conversion at Port of Naples. In Proceedings of the 26th International Ocean and Polar Engineering Conference, Rhodes, Greece, 26 June– 2 July 2016; International Society of Offshore and Polar Engineers: Rhodes, Greece; p. 6. [Google Scholar]
  48. Torre-Enciso, Y.; Ortubia, I.; de Aguileta, L.I.L.; Marqués, J. Mutriku Wave Power Plant: From the Thinking out to the Reality. In Proceedings of the 8th European Wave and Tidal Energy Conference, Uppsala, Sweden, 7–10 September 2009; p. 11. [Google Scholar]
  49. Arena, F.; Romolo, A.; Malara, G.; Fiamma, V.; Laface, V. The First Full Operative U-OWC Plants in the Port of Civitavecchia; Ocean Renew. Energy; ASME: Trondheim, Norway, 2017; p. V010T09A022. Volume 10. [Google Scholar] [CrossRef]
  50. Koutrouveli, T.I.; Di Lauro, E.; das Neves, L.; Calheiros-Cabral, T.; Rosa-Santos, P.; Taveira-Pinto, F. Proof of Concept of a Breakwater-Integrated Hybrid Wave Energy Converter Using a Composite Modelling Approach. J. Mar. Sci. Eng. 2021, 9, 226. [Google Scholar] [CrossRef]
  51. Cabral, T.; Clemente, D.; Rosa-Santos, P.; Taveira-Pinto, F.; Belga, F.; Morais, T. Preliminary Assessment of the Impact of a Hybrid Wave Energy Converter in the Stability and Functionality of a Rubble-Mound Breakwater. In Proceedings of the Coastal Structures Conference, Hannover, Germany, 29 September – 2 October 2019; pp. 1141–1151. [Google Scholar] [CrossRef]
  52. Rosa-Santos, P.; Taveira-Pinto, F.; Clemente, D.; Cabral, T.; Fiorentin, F.; Belga, F.; Morais, T. Experimental Study of a Hybrid Wave Energy Converter Integrated in a Harbor Breakwater. J. Mar. Sci. Eng. 2019, 7, 33. [Google Scholar] [CrossRef] [Green Version]
  53. Mansard, E.P.D.; Funke, E.R. The Measurement of Incident and Reflected Spectra Using a Least Squares Method. In Proceedings of the 17th International Conference on Coastal Engineering, Sydney, Australia, 23–28 March 1980. [Google Scholar] [CrossRef] [Green Version]
Figure 1. Port of Leixões: (a) location in the Iberian Peninsula and (b) aerial view of the port and its breakwaters (north breakwater highlighted).
Jmse 09 00922 g001
Figure 2. (a) General layout of Port of Leixões with the breakwater extension and the HWEC; (b) provisional layout of the extension of the breakwater; (c) cross-section AA’ with the three water levels represented, reproduced with permission from [42]. Copyright 2020, Elsevier (cf. Table 1).
Jmse 09 00922 g002
Figure 3. Hybrid WEC model scheme for construction in SolidWorks®. Reproduced with permission from [42]. Copyright 2020, Elsevier.
Jmse 09 00922 g003
Figure 4. Frontal view of the OWEC–OWC model (left) and perspective of the physical model setup for the extreme wave tests (right).
Jmse 09 00922 g004
Figure 5. Experimental setup: (a) initial case, without WEC; (b) case with integrated WEC. For the extreme wave tests, which are the scope of this paper, only reservoir R1 was active.
Jmse 09 00922 g005
Figure 6. Time series of water level measurements inside an auxiliary reservoir (model values).
Jmse 09 00922 g006
Figure 7. Relative overtopping rate curves following the mean value approach using a roughness coefficient of 0.50 (left-hand side, reference from EurOtop manual) and 0.77 (right-hand side). Overtopping discharge variation for each sea state (bottom) with the integration of the HWEC.
Jmse 09 00922 g007
Figure 8. Critical values of average overtopping discharges versus experimental data results from the Leixões case study, adapted from [21].
Jmse 09 00922 g008
Figure 9. Reflection coefficients with and without the HWEC.
Jmse 09 00922 g009
Figure 10. Evolution of the toe berm blocks and outer armour layer blocks, with (a1a4) and without (b1b4) the WEC: for MLWS, from initial disposition, (1), to final test, (2); for MHWS, from final test of MLWS, (3), to final test of the series, (4).
Jmse 09 00922 g010
Figure 11. N o d and N S values for the extreme sea-state tests, with and without the WEC, for the toe berm blocks.
Jmse 09 00922 g011
Figure 12. N o d values for the extreme sea-state tests with the WEC integrated in the breakwater, for the area: (a) in front of the WEC and (b) adjacent to the WEC, going from the initial MLWS to the final MHWS test.
Jmse 09 00922 g012
Table 1. Sea states tested for the assessment of overtopping flow and structural stability (prototype values).
Sea StateHS (m)TP (s)Water Level
SS16.013MLWS
(+0.31 m L.C.D)
SS27.716
SSMax8.016
SS16.013MHWS
(+3.25 m L.C.D)
SS27.716
SSMax9.116
Publisher’s Note: MDPI stays neutral with regard to jurisdictional claims in published maps and institutional affiliations.

