Abstract
The combined exploitation of wave and offshore wind energy resources is expected to improve the cost competitiveness of the wave energy industry as a result of shared capital and operational costs. In this context, the objective of this work is to explore the potential benefits of co-locating CECO, an innovative wave energy converter, with the commercial WindFloat Atlantic wind farm, located on the northern coast of Portugal. For this purpose, the performance of the combined farm was assessed in terms of energy production, power smoothing and levelised cost of energy (LCoE). Overall, the co-located farm would increase the annual energy production by approximately 19% in comparison with the stand-alone wind farm. However, the benefits in terms of power output smoothing would be negligible due to the strong seasonal behaviour of the wave resource in the area of study. Finally, the LCoE of the co-located farm would be drastically reduced in comparison with the stand-alone wave farm, presenting a value of 0.115 per USD/kWh, which is similar to the levels of the offshore wind industry as of five years ago. Consequently, it becomes apparent that CECO could progress more rapidly towards commercialisation when combined with offshore wind farms.
1. Introduction
In recent years, concerns related to climate change and energetic sustainability have prompted different policies (e.g., Paris Agreement [1], 2030 Agenda for Sustainable Development [2] and EU’s Green Deal [3]) to foment a transition towards a sustainable and carbon-neutral economy. Within the emerging renewable energy sources, marine renewable energy (MRE), which presents a vast, geographically diverse and virtually untapped resource (up to 32 TW [4]), is expected to play a crucial part in achieving the above-mentioned goals. Previous studies have analysed the potential benefits of developing a fully fledged MRE industry [5]. First of all, MRE could contribute to increasing and diversifying the current low-carbon generation portfolio (in the order of 330 and 550 GW by 2050 [5]). Second, MRE could supply a significant share of future energy demands (e.g., up to 10% of EU’s energy needs by 2050 [5]). Finally, MRE appears as a fantastic opportunity to develop a new industrial sector and boost the economy of coastal regions, contributing to their long-term sustainability [5].
Among the large variety of MRE sources, offshore wind and wave energy have attracted greater interest from the academic and industrial communities [6]. On the one hand, offshore wind energy, with an estimated global resource of 71,000 GW, has experienced substantial growth over the last decade. In 2020, offshore wind capacity has exceeded 35 GW, representing 4.8% of the global wind capacity [7]. In this context, the EU appears as a global front-runner, presenting an installed capacity of 24.92 GW [8] and future goals to reach between 230 and 450 GW by 2050 [9]. Several factors, including developer experience, standardisation of turbine foundations, improvements in wind turbine technology, better practices during installation and maintenance operations, and economies of scale have all contributed to this rapid development [10]. As result, in the period between 2010 and 2020, the levelised cost of energy (LCoE) has dropped by 48%, from 0.162 to 0.084 USD/kWh [10]. However, significant progress is still required to make offshore wind energy cost-competitive with other renewable sources, such as onshore wind or solar PV, which present LCoE values of 0.039 and 0.059 USD/kWh, respectively [10]. For this purpose, the offshore wind industry is trending towards deeper water locations, which present stronger wind conditions [7], and floating turbines with higher hub heights and longer blades, which present larger power capacity [11].
On the other hand, wave energy, despite presenting a large and globally diverse resource [12], is still far from reaching the commercialisation stage [13]. This fact is intimately connected to the lack of progress of wave energy converter (WEC) technology. Over the last two decades, a multitude of WEC concepts, based on different working principles, has been put forward. Among them, point absorbers (e.g., CorPower [14,15]), overtopping devices (e.g., Wavedragon [16] and Wavecat [17]), oscillating water columns [18,19], attenuators (e.g., Pelamis [20]), as well as oscillating wave surge (e.g., Oyster [21]) and submerged differential pressure (e.g., CETO [22]) devices, stand out. However, the great majority of them are still present at low technology readiness levels, far from commercial viability [23]. As a result, LCoE values for wave energy are approximately ten times higher than other renewable sources such as onshore wind and solar PV [24]. In consequence, significant effort is still required to increase the cost competitiveness of wave energy. In this context, improving WEC performance and reliability becomes essential to decrease the associated LCoE. In addition, the negligible development of WEC technology has inevitably led to a lack of industrial expertise in terms of supply chain, logistics and operational tasks (including WEC deployment, maintenance, grid integration and decommissioning) [25].
On these grounds, it becomes apparent that offshore wind and wave energies present certain similarities in terms of exploitation locations, conversion technologies, operation and maintenance tasks, grid integration and logistics [26]. Consequently, potential synergies between the two energy forms could contribute to improving significantly their cost competitiveness [27]. Among the different methodologies available to exploit simultaneously offshore wind and wave energy resources, co-located wind–wave arrays have emerged as the most feasible option [6]. This approach offers valuable mutual benefits for wind and wave operations [28]. First, a huge opportunity for shared costs arises [29]. Concerning capital costs, wind and wave operations could share expenses in terms of sea space leasing, consenting procedures, electrical infrastructure (export cable, offshore and onshore substations) and onshore facilities [30]. In addition, operational costs can also be reduced by sharing logistics and integrating operation and maintenance tasks [31]. In this context, Astariz et al. observed that, for the German and Danish coasts, co-located wave energy farms presented LCoE reductions ranging between 55 and 70%, with respect to stand-alone wave farms [32,33]. Another benefit of combining wind and wave exploitation is the reduction in power output variability (i.e., power smoothing) of offshore wind farms [34]. This fact is supported by the higher predictability of wave conditions and the lag between peak wind speeds and peak wave heights (especially in regions dominated by swell waves) [35,36]. In this sense, Astariz et al. found reductions in downtime and power variability for the North Sea Alpha Ventus and Horns Rev offshore wind farms of approximately 87 and 6%, respectively, due to the presence of co-located wave farms [37]. Similarly, Gaughan and Fitzgerald found that, in the Irish West coast, the power variability of offshore wind farms could be significantly reduced by the co-location of wave energy farms [38]. On the other hand, the operation of a co-located WEC array may result in significant wave height reductions in its lee (known as the shadow effect [33,39]), facilitating accessibility and maintenance operations of wind farms [40]. For instance, Astariz et al. found that the sheltering effect of co-located wave farms could increase up to 20% the annual accessibility to offshore wind farms located in the North Sea [33,41]. Last but not least, a transfer of knowledge, including industrial best practices and operational standards, could flow from the wind to the wave energy sectors.
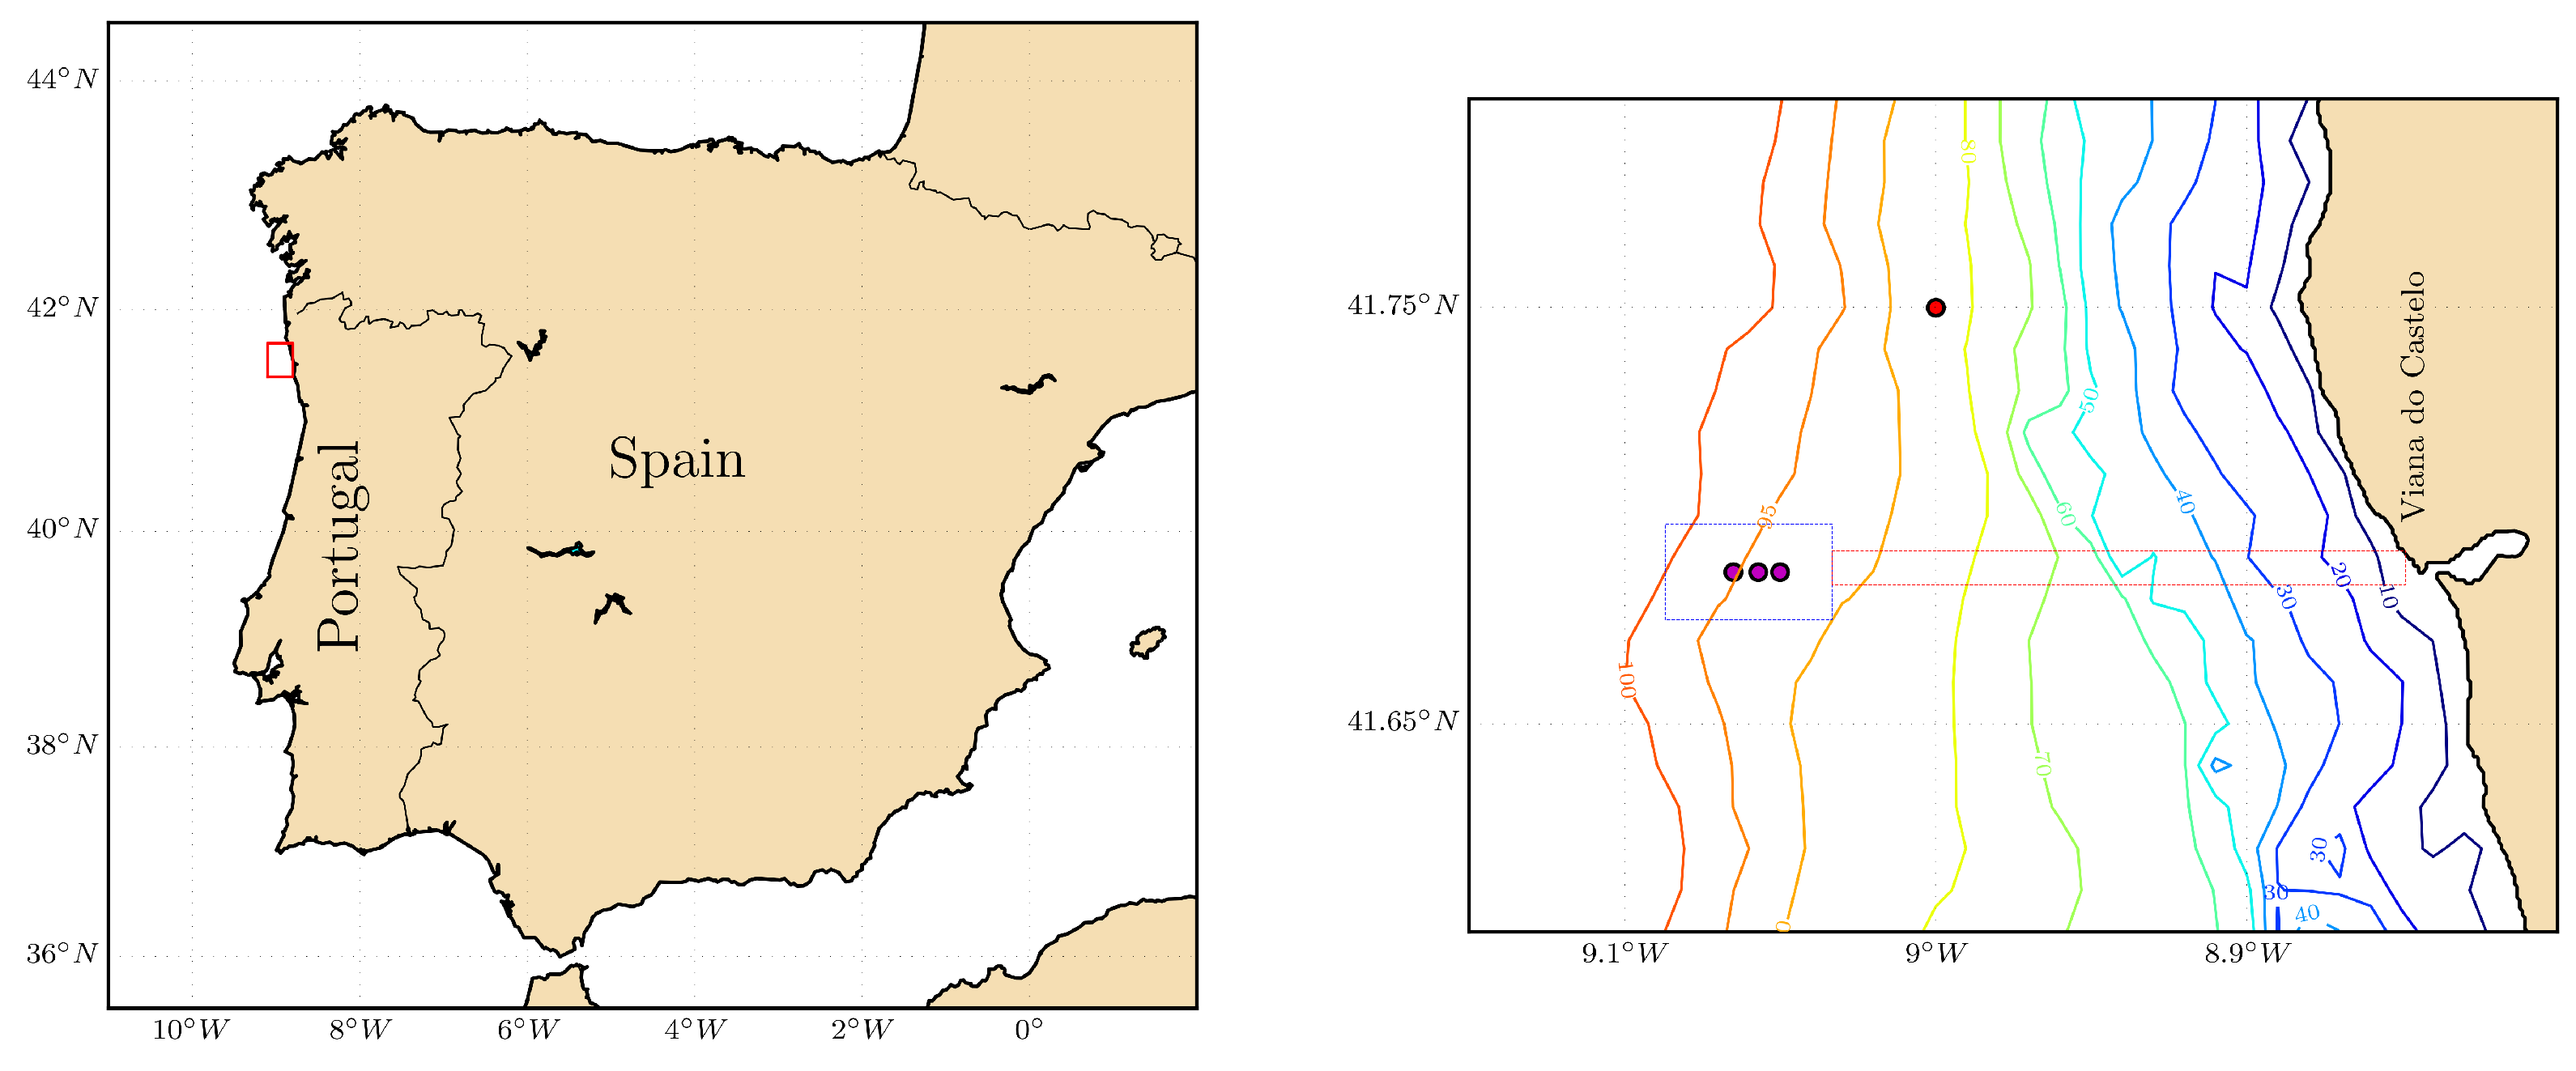
In consequence, certain WEC technologies (mainly offshore floating devices) could progress more rapidly towards commercialisation if they were used as a co-located solution for offshore wind farms, benefiting from the offshore wind industry as result of cost sharing and transfer of knowledge. Among the different WEC technologies that could benefit from the synergies with the offshore wind industry is the CECO device [42]. CECO is a novel WEC concept that simultaneously harnesses the kinetic and the potential energy of the waves by means of oblique motion (Section 2.2.1). As a result of this innovative configuration, CECO has shown a promising potential for harnessing wave energy [43]. Furthermore, CECO presents a broad range of operating water depths, making it suitable for co-location with offshore wind farms. Against the foregoing backdrop, the objective of this paper is to assess the effectiveness and potential benefits of co-locating the CECO device with a commercial floating offshore wind farm. In this context, the performance of CECO as a co-located solution was assessed in terms of energy output, power smoothing and LCoE reductions. To date and to the best knowledge of the authors, no previous research has addressed these issues in detail. For this purpose, the northern coast of Portugal, where the WindFloat Atlantic offshore wind farm is located [44], was used as case study (Figure 1). This region, facing the North Atlantic, presents one of the most energetic wind and wave regimes in continental Europe [45,46]; therefore, it appears as a promising location for exploiting both the offshore wind and wave energy resources.

Figure 1.
Location of the area of study. (Colour lines represent the bathymetric isolines. Red and magenta dots highlight the position of the SIMAR dataset and wind turbines, respectively. Blue dashed line represents the allocated sea space for the WindFloat Atlantic farm. Red dashed line represents submarine cables area).
The remainder of this paper is structured as follows: Section 2 describes the area of study and the characteristics of wave (CECO) and wind conversion technologies and presents the methodology used to evaluate the effectiveness of the proposed co-located wind–wave array. Section 3 presents the results obtained. Section 4 discusses the main advantages and disadvantages of the proposed co-located wind–wave array. Finally, conclusions are drawn in Section 5.
2. Materials and Methods
2.1. Area of Study
For the present work, the WindFloat Atlantic offshore wind farm was used as a case study [44]. Located off the northern coast of Portugal (Figure 1), the water depth and distance to shore are in the order of 100 m and 15 km, respectively. WindFloat Atlantic is composed of three turbines (of 8.4 MW each) mounted on semi-submersible floating platforms anchored to the seabed. The turbines are aligned in a west–east direction, separated by approximately 600 m. It is worth pointing out that the allocated sea surface for the wind farm spans an area of 11.25 km (Figure 1), opening the possibility for future wind farm expansions or co-location of WEC arrays. Finally, WindFloat Atlantic has available excellent port infrastructures. For the day-to-day operation and maintenance tasks, a base was set up in the the Port of Viana do Castelo, which is located at a 20 km distance. For manufacturing and assembly purposes, the outer Port of Ferrol (Spain), located approximately at 270 km distance, appears as an excellent alternative [47].
Besides its outstanding wind energy resource [45], the northern coast of Portugal also presents a very energetic wave climate, with mean annual values of wave power (per meter of wave front) in the order of 25 kWm [48]. Nonetheless, the wave regime of the region also presents a strong inter- and intra-annual variability [46,48]. This behaviour is governed by the North Atlantic Oscillation (NAO), which corresponds to a large scale meridional oscillation of atmospheric mass between the Azores High and the Iceland Low. Its behaviour is defined by the so-called NAO index that can be positive or negative, corresponding to a high or low pressure difference between the Azores High and the Iceland Low, respectively. Therefore, periods with positive NAO values result in strong wave regimes with a predominant north–west direction. Conversely, periods with negative NAO values derive into weaker wave regimes shifted towards a more westerly direction. As a result, the mean seasonal values of wave power range from summer to winter conditions from 10 kWm to 45 kWm, respectively [46,48]. In consequence, this area appears as a perfect location for the installation of co-located wave-wind arrays, therefore, for evaluating their potential benefits and synergies under a wide range of wave conditions.
2.2. Co-Located Wave–Wind Farm
2.2.1. Energy Conversion Technologies
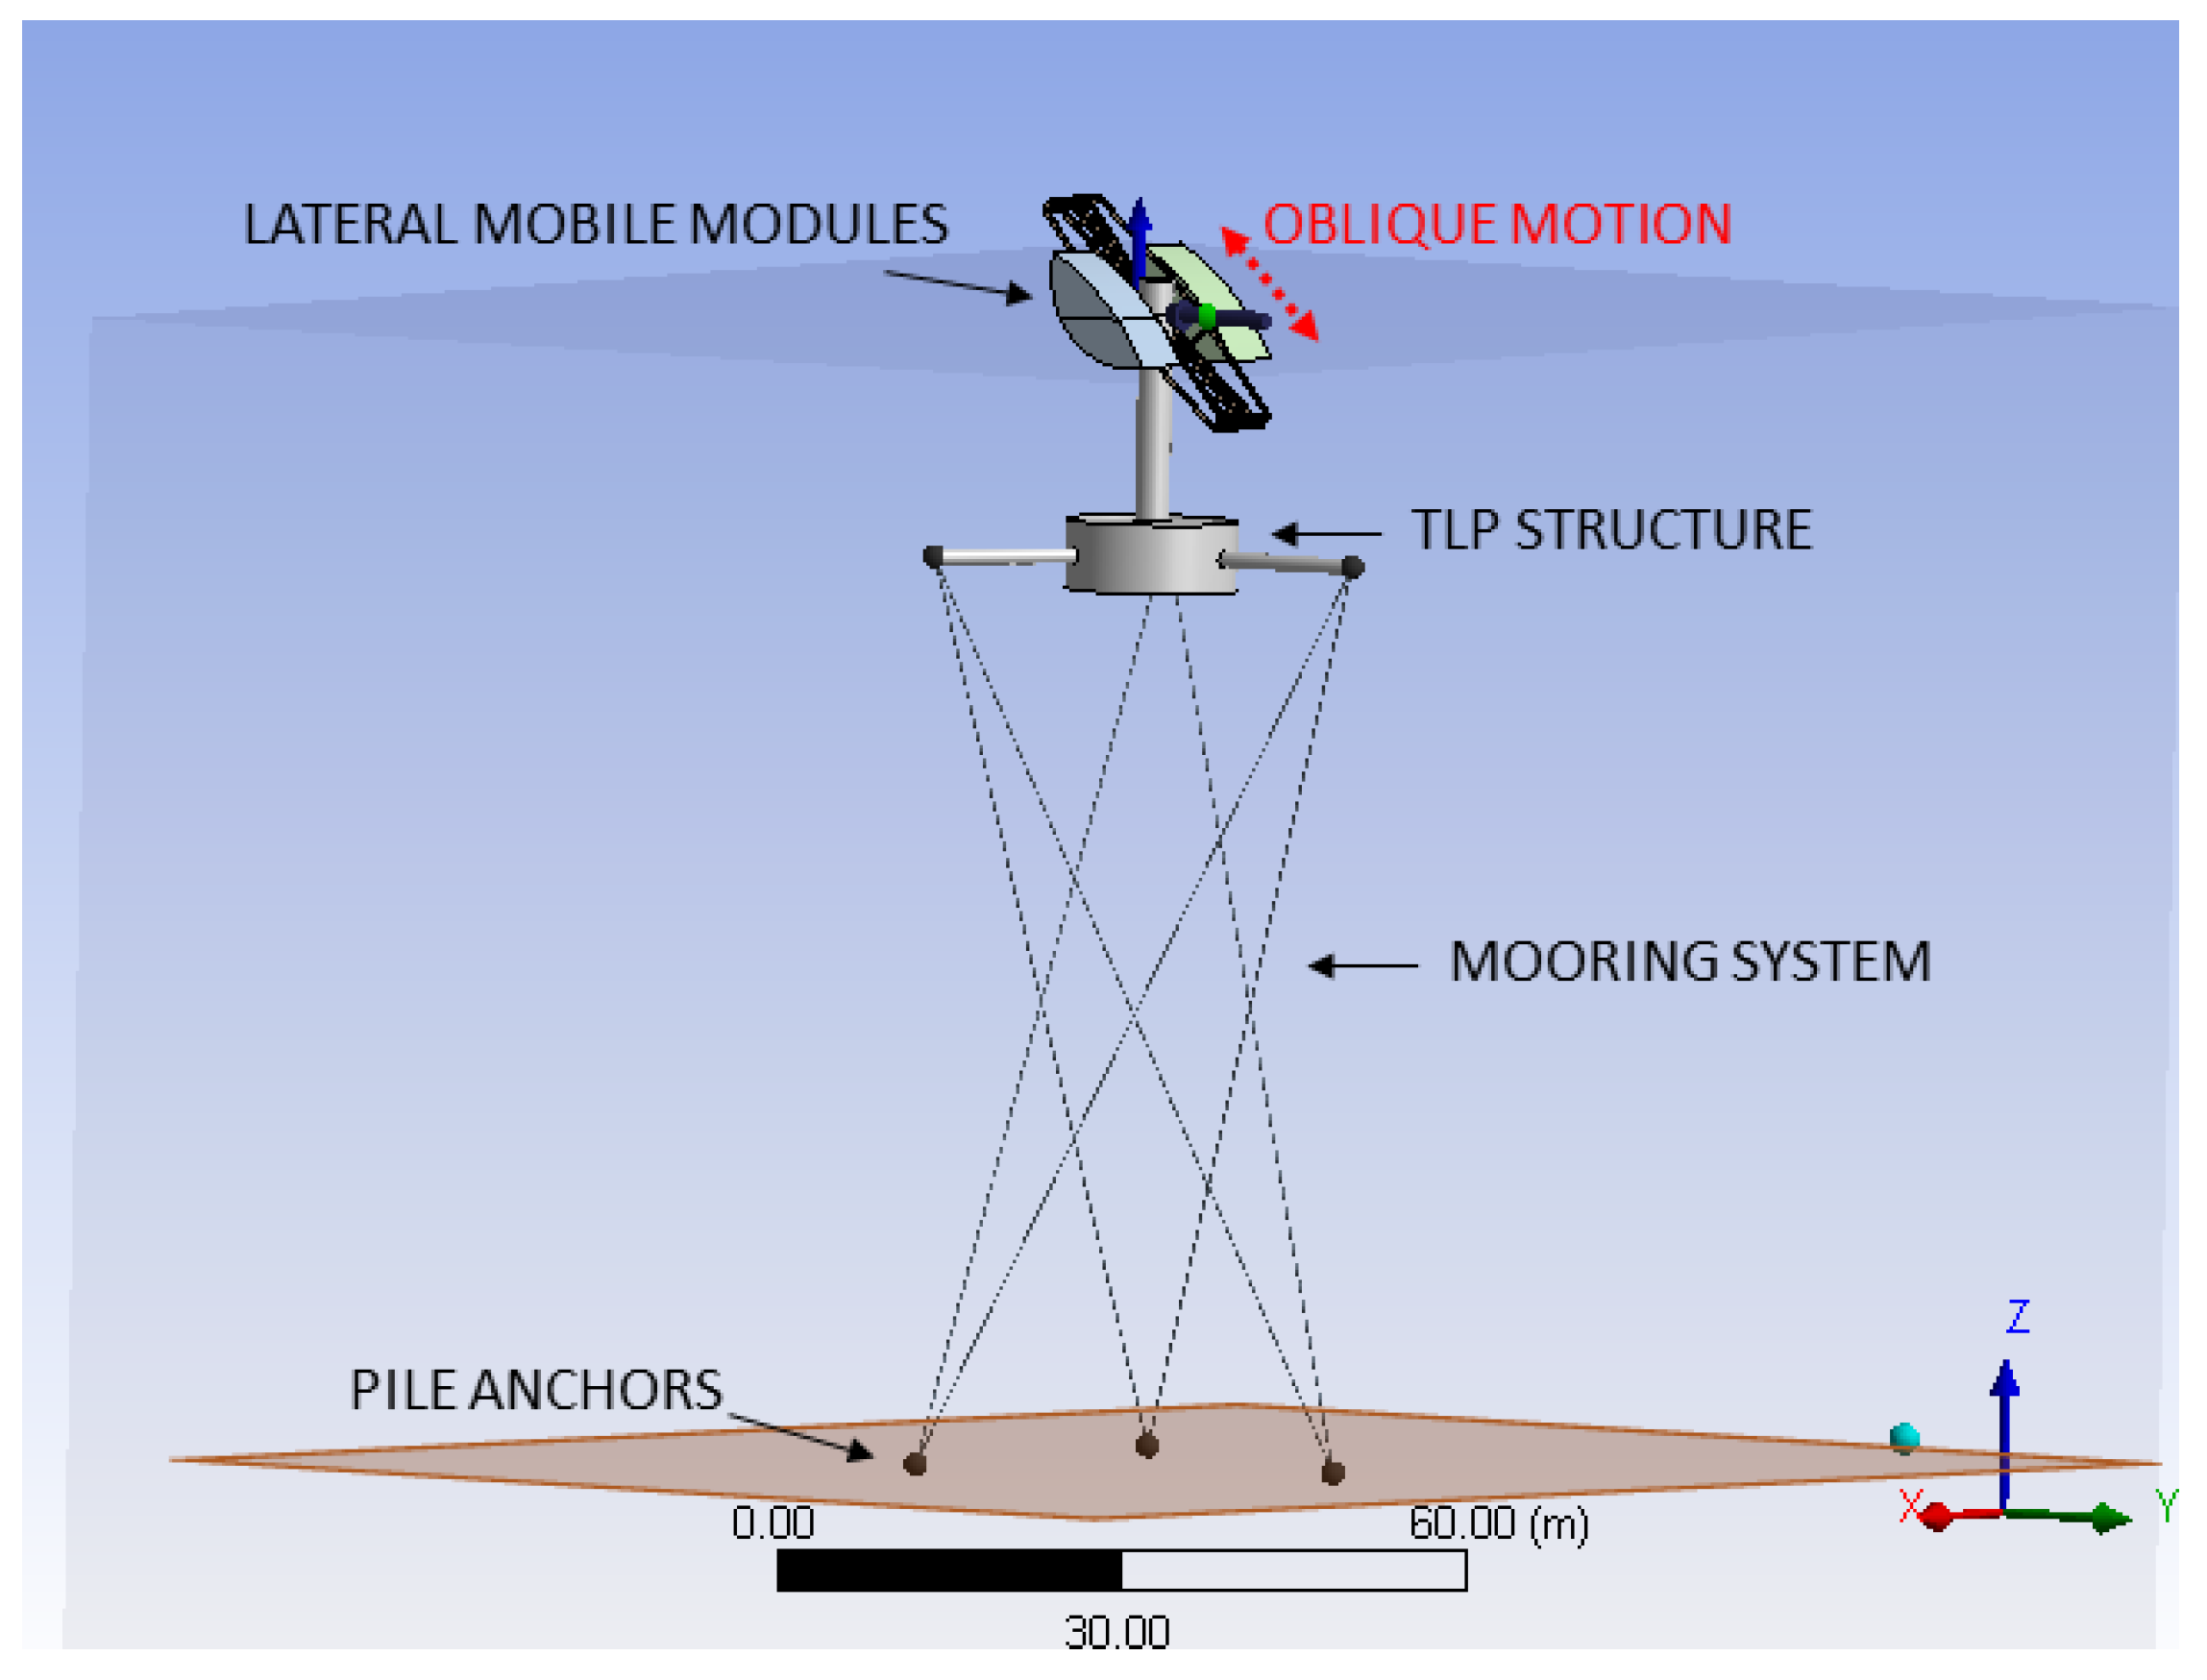
This section presents the wave and wind conversion technologies considered for the present work. With the aim of capturing wave energy, the CECO device was used as case study. CECO is a (oscillating body) point absorber WEC, whose main novelty resides in presenting a sloped power take-off (PTO) system [49]. This PTO configuration allows it to capture both the vertical and horizontal force components of ocean waves [50,51]. In consequence, wave energy is absorbed by a floating body with its motions restrained to an inclined direction. The main elements of the floating body are two lateral mobile modules (LMMs) joined by a frame of tubular elements. In its current version, CECO uses a rack pinion system to transform the absorbed energy into electricity (Figure 2). Therefore, the pinion is housed in the interior of the supporting element, while the rack is mounted on the floating frame and oscillates with it, driving a rotatory electric generator. Nonetheless, for future designs, a gearbox linked to the pinion or a linear electric generator may be adopted to reduce the energy losses in the transmission and generation stages of CECO [43].
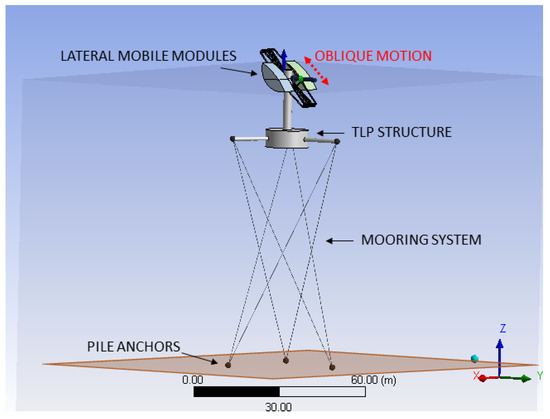
Figure 2.
Main parts of the CECO device for offshore installations.
Over the last five years, extensive research has been conducted to refine the original CECO design. First, the shape and mass of the LMMs have been optimised to improve the hydrodynamic response of CECO [52,53] and, consequently, increase the power absorption for a wider range of wave conditions [42]. Furthermore, it was found that both the PTO damping [54] and inclination [55] also play a predominant role in CECO’s response. In consequence, relevant variables related to the LMMs (mass and submergence levels) and PTO system (damping and inclination) could be adjusted (by a control system) to match the resonance condition of the most frequent sea states, thus improving CECO’s power absorption.
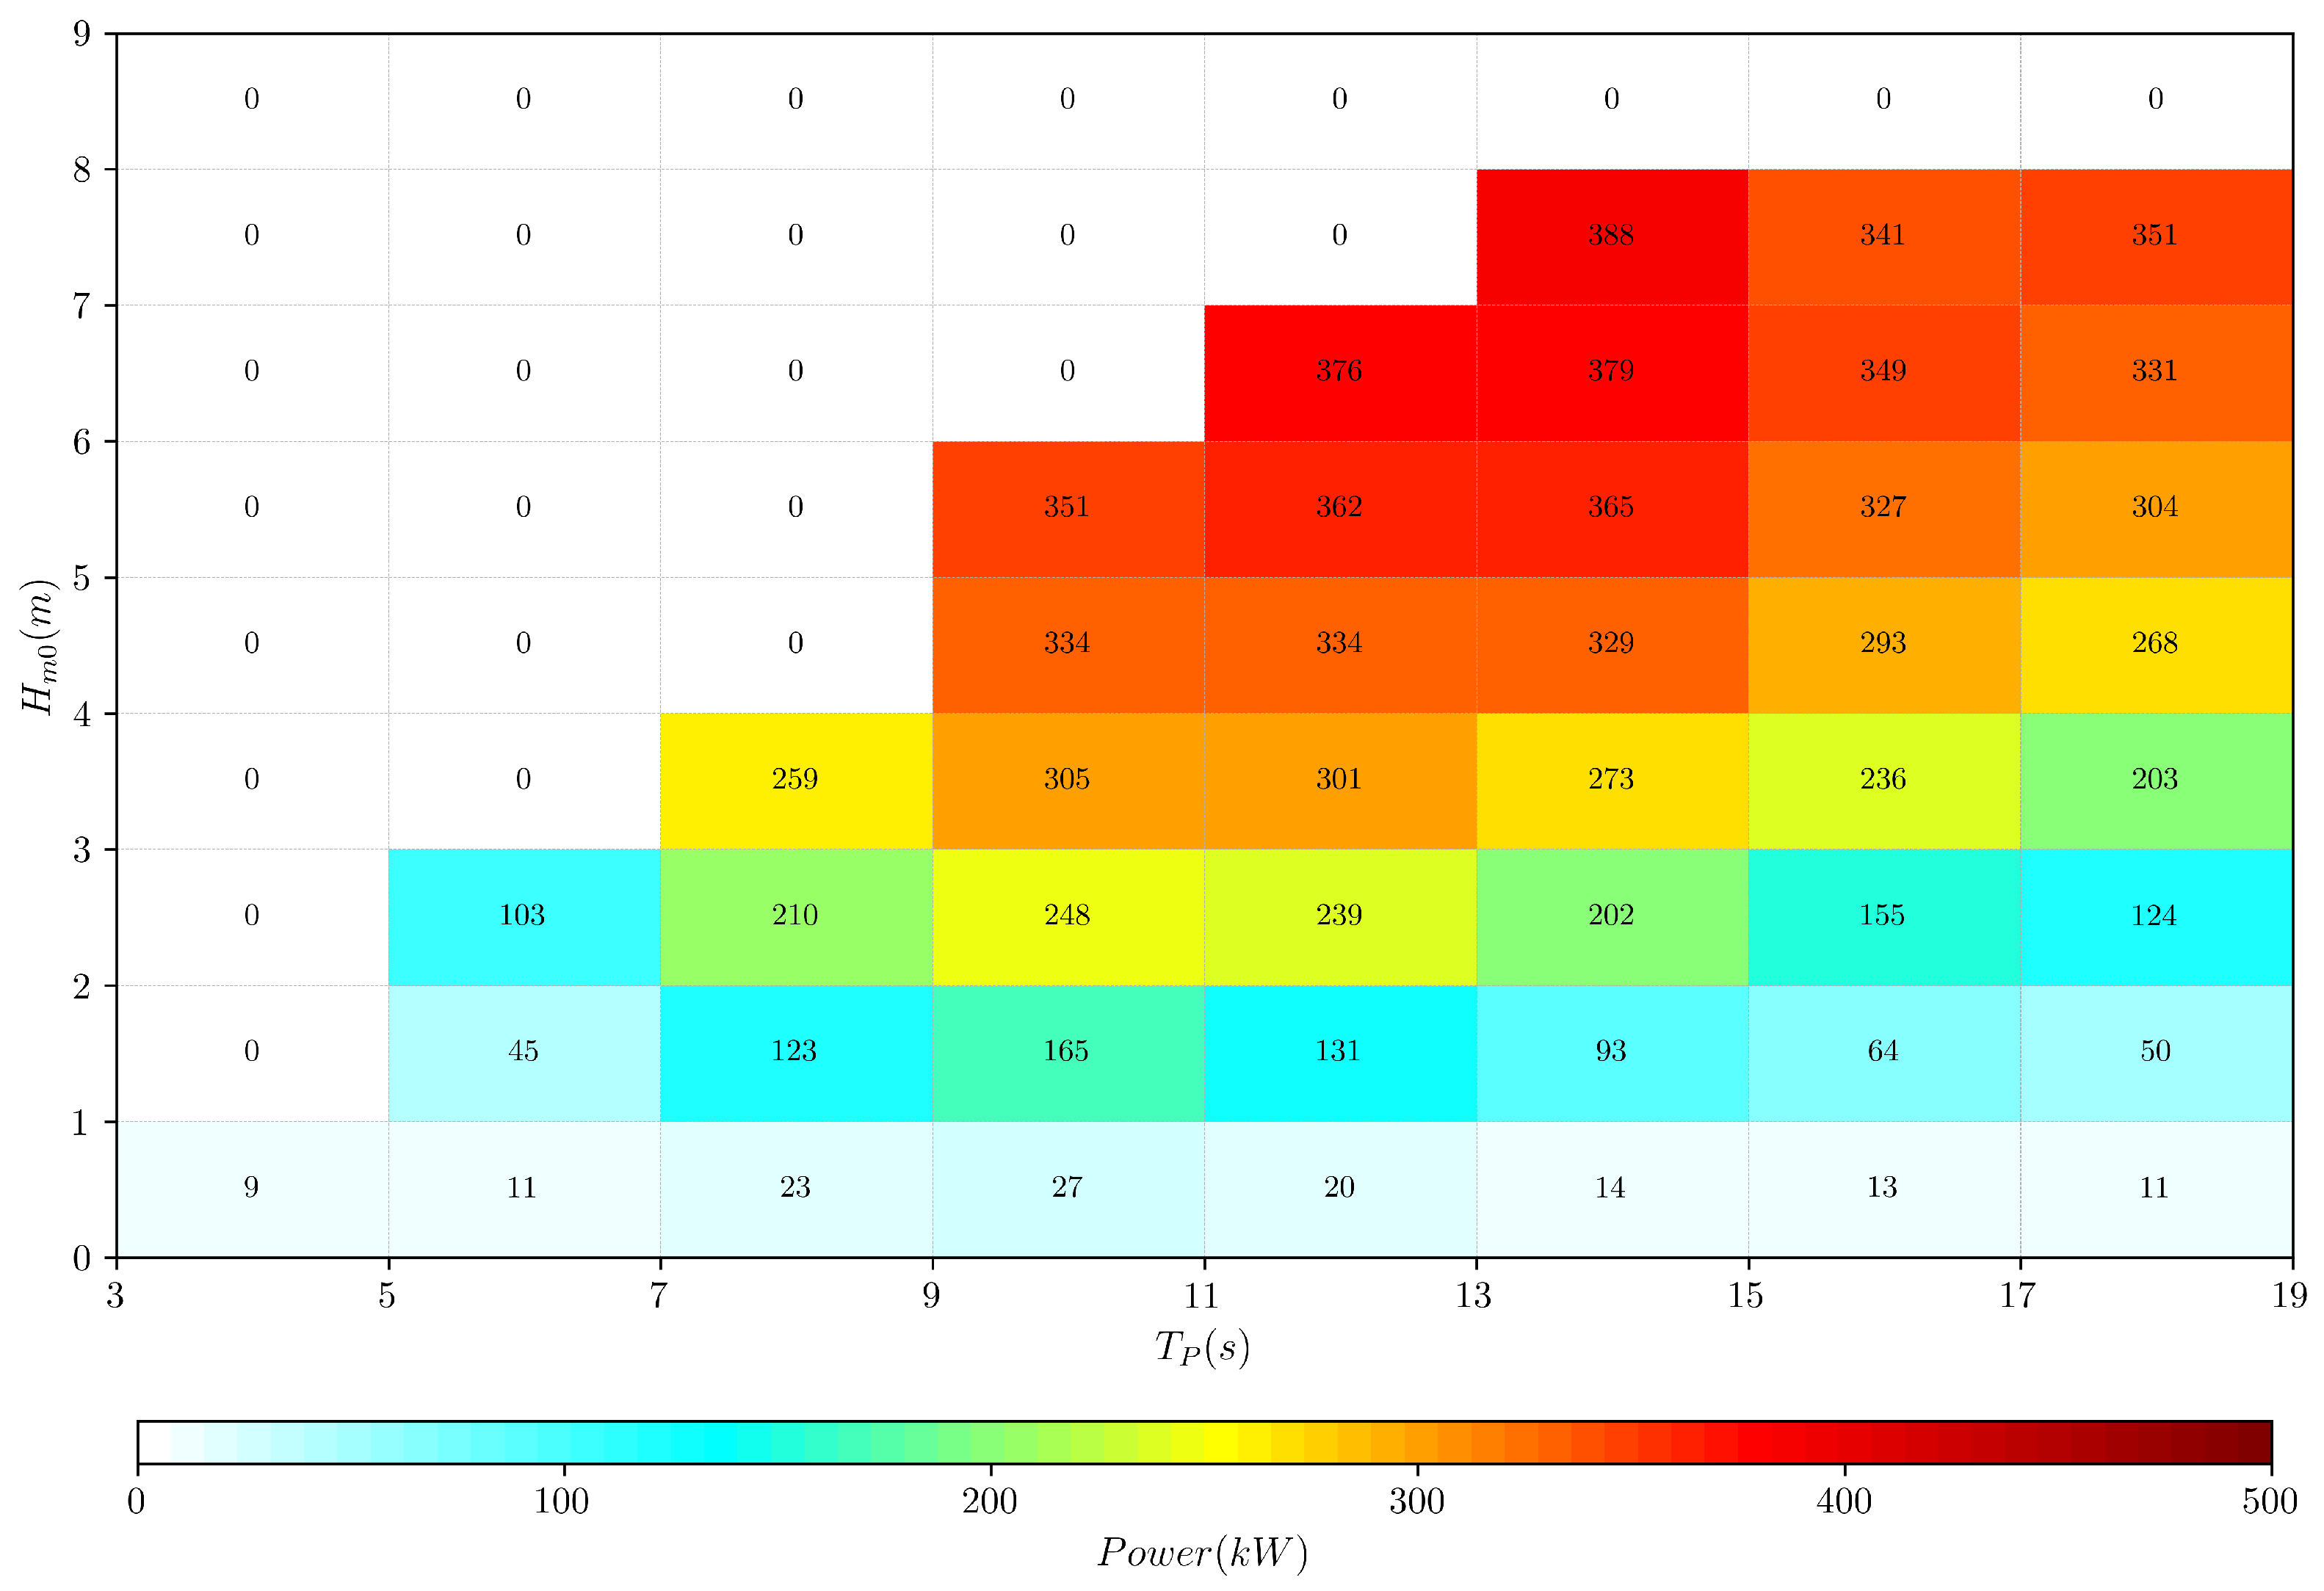
In addition, CECO offers high flexibility in terms of installation. For nearshore locations (<30 m of water depth), the original CECO design was based on a fixed-bottom support structure (monopile, tripod or jacket foundations). However, for deeper locations, the use of a fixed support structure becomes economically unfeasible; therefore, a floating support structure is required. In this context, the floating version of CECO was designed and optimised for the wave conditions of the Portuguese coast, using an operational-limit sea state of 7.5 m and 16 s, with a configuration based on a tension leg platform with a star-shape mooring system offering the best results in terms of energy production and mooring loads (Figure 2) [56]. For the present work, the floating version of CECO defined by Giannini et al. [56] was used as case study. The main design characteristics of the device are summarised in Table 1, while its (absorption) power matrix is shown in Figure 3.

Table 1.
Main design characteristics of CECO wave energy converter.
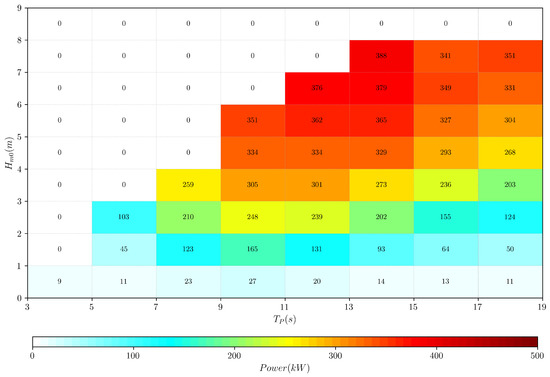
Figure 3.
Power matrix of CECO device. (Numbers represent the mean power production for each sea-state bin. Colourmap represents the power produced for the different sea states).
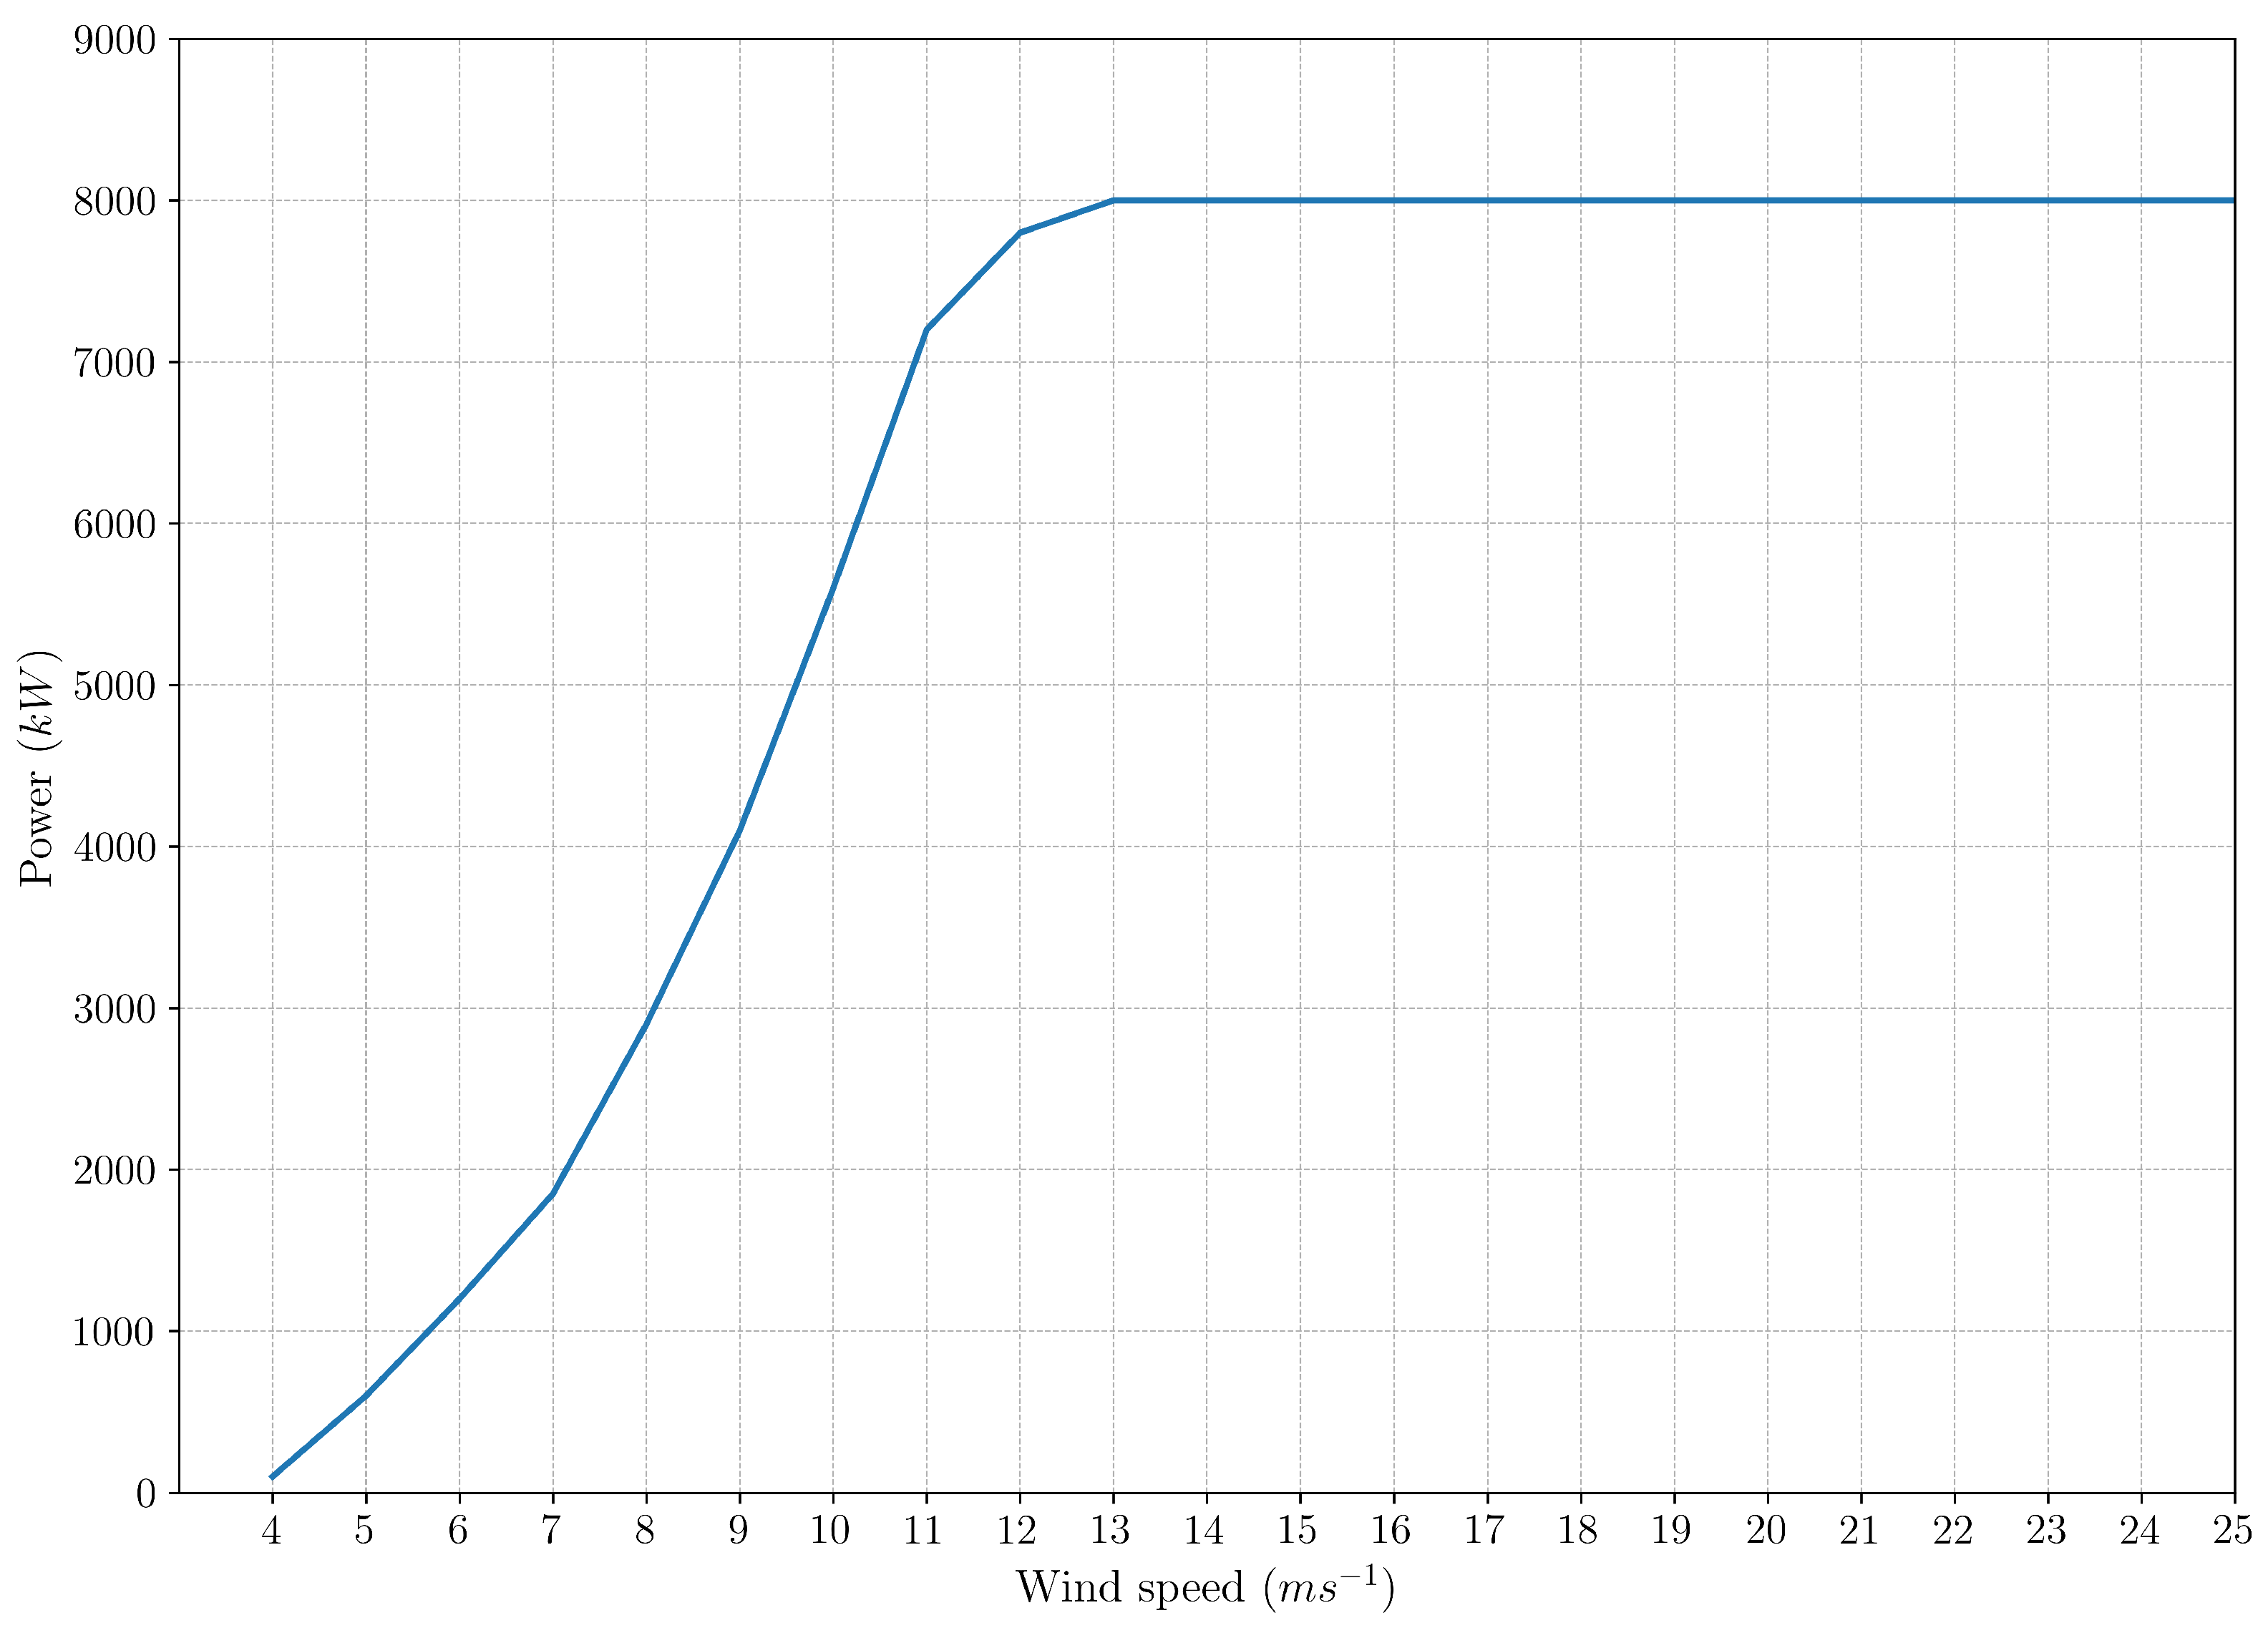
Regarding wind conversion technology, WindFloat Atlantic uses the MHI-Vestas V164-8.3 MW offshore wind turbine, which, to date, appears as the most powerful turbine used for a floating wind farm [57]. As indicated in Section 2.1, the turbines are mounted on an innovative three-column semi-submersible floating structure (WindFloat® [58]), which is anchored to the seabed. The floating structure achieves stability by combining the use of damping plates with a static and dynamic ballast system. As a result, the mounting structure is able to withstand wave heights and wind speeds exceeding 17 m and 100 kmh, respectively [58,59]. Due to the lack of detailed technical information, for the present work, the Vestas V164-8.0 MW wind turbine was used as case study, since its characteristics are very similar to the MHI-Vestas V164-8.3 MW. The main technical specifications and power curve of the wind turbine are shown in Table 2 and Figure 4, respectively [60].
Table 2.
Main technical specification of the Vestas V164-8.0 MW wind turbine.
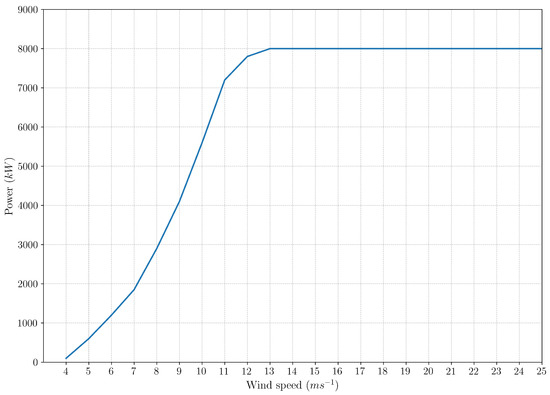
Figure 4.
Power curve of Vestas V164-8.0 MW wind turbine.
Based on Figure 4, the power curve of the Vestas V164-8.0 MW turbine can be expressed analytically as follows:
where are the polynomial coefficients of the power curve, while and are, respectively, the rated velocity and rated power of the wind turbine (Table 2). In this case, the values of the polynomial coefficients, obtained from a sixth order polynomial regression fit, are summarised in Table 3.
Table 3.
Polynomial coefficients of the Vestas V164-8.0 MW power curve.
2.2.2. Layout Design
In this section, a preliminary design for the co-located CECO array is proposed. The array, with a total capacity of 5 MW, is formed by a single row of devices, which follows a curvilinear trajectory oriented to the prevailing NW wave direction (Figure 5). Due to the lack of previous research dealing with the CECO park effects, a conservative separation of 330 m (approximately 15 times the overall width of CECO) between devices was chosen. The distance between the wave and wind arrays was set to be higher than 800 m, with the aim of avoiding potential disruptions during operational and maintenance tasks. As a result, it was assumed that wave and wind arrays do not share mooring or structural elements. In addition, the proposed design ensures that all CECO devices lie inside the allocated sea space for the WindFloat Atlantic wind farm, saving extra cost in terms of sea-space consenting and leasing. It is worth mentioning that the optimal design of the array, in terms of energy output and shadow effect [61], is beyond the scope of this work; therefore, the array was designed to assess the feasibility of CECO as a co-located solution. Finally, the main characteristics of the co-located wave–wind farm are summarised in Table 4.
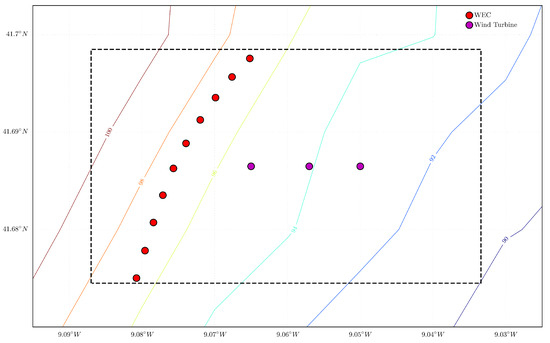
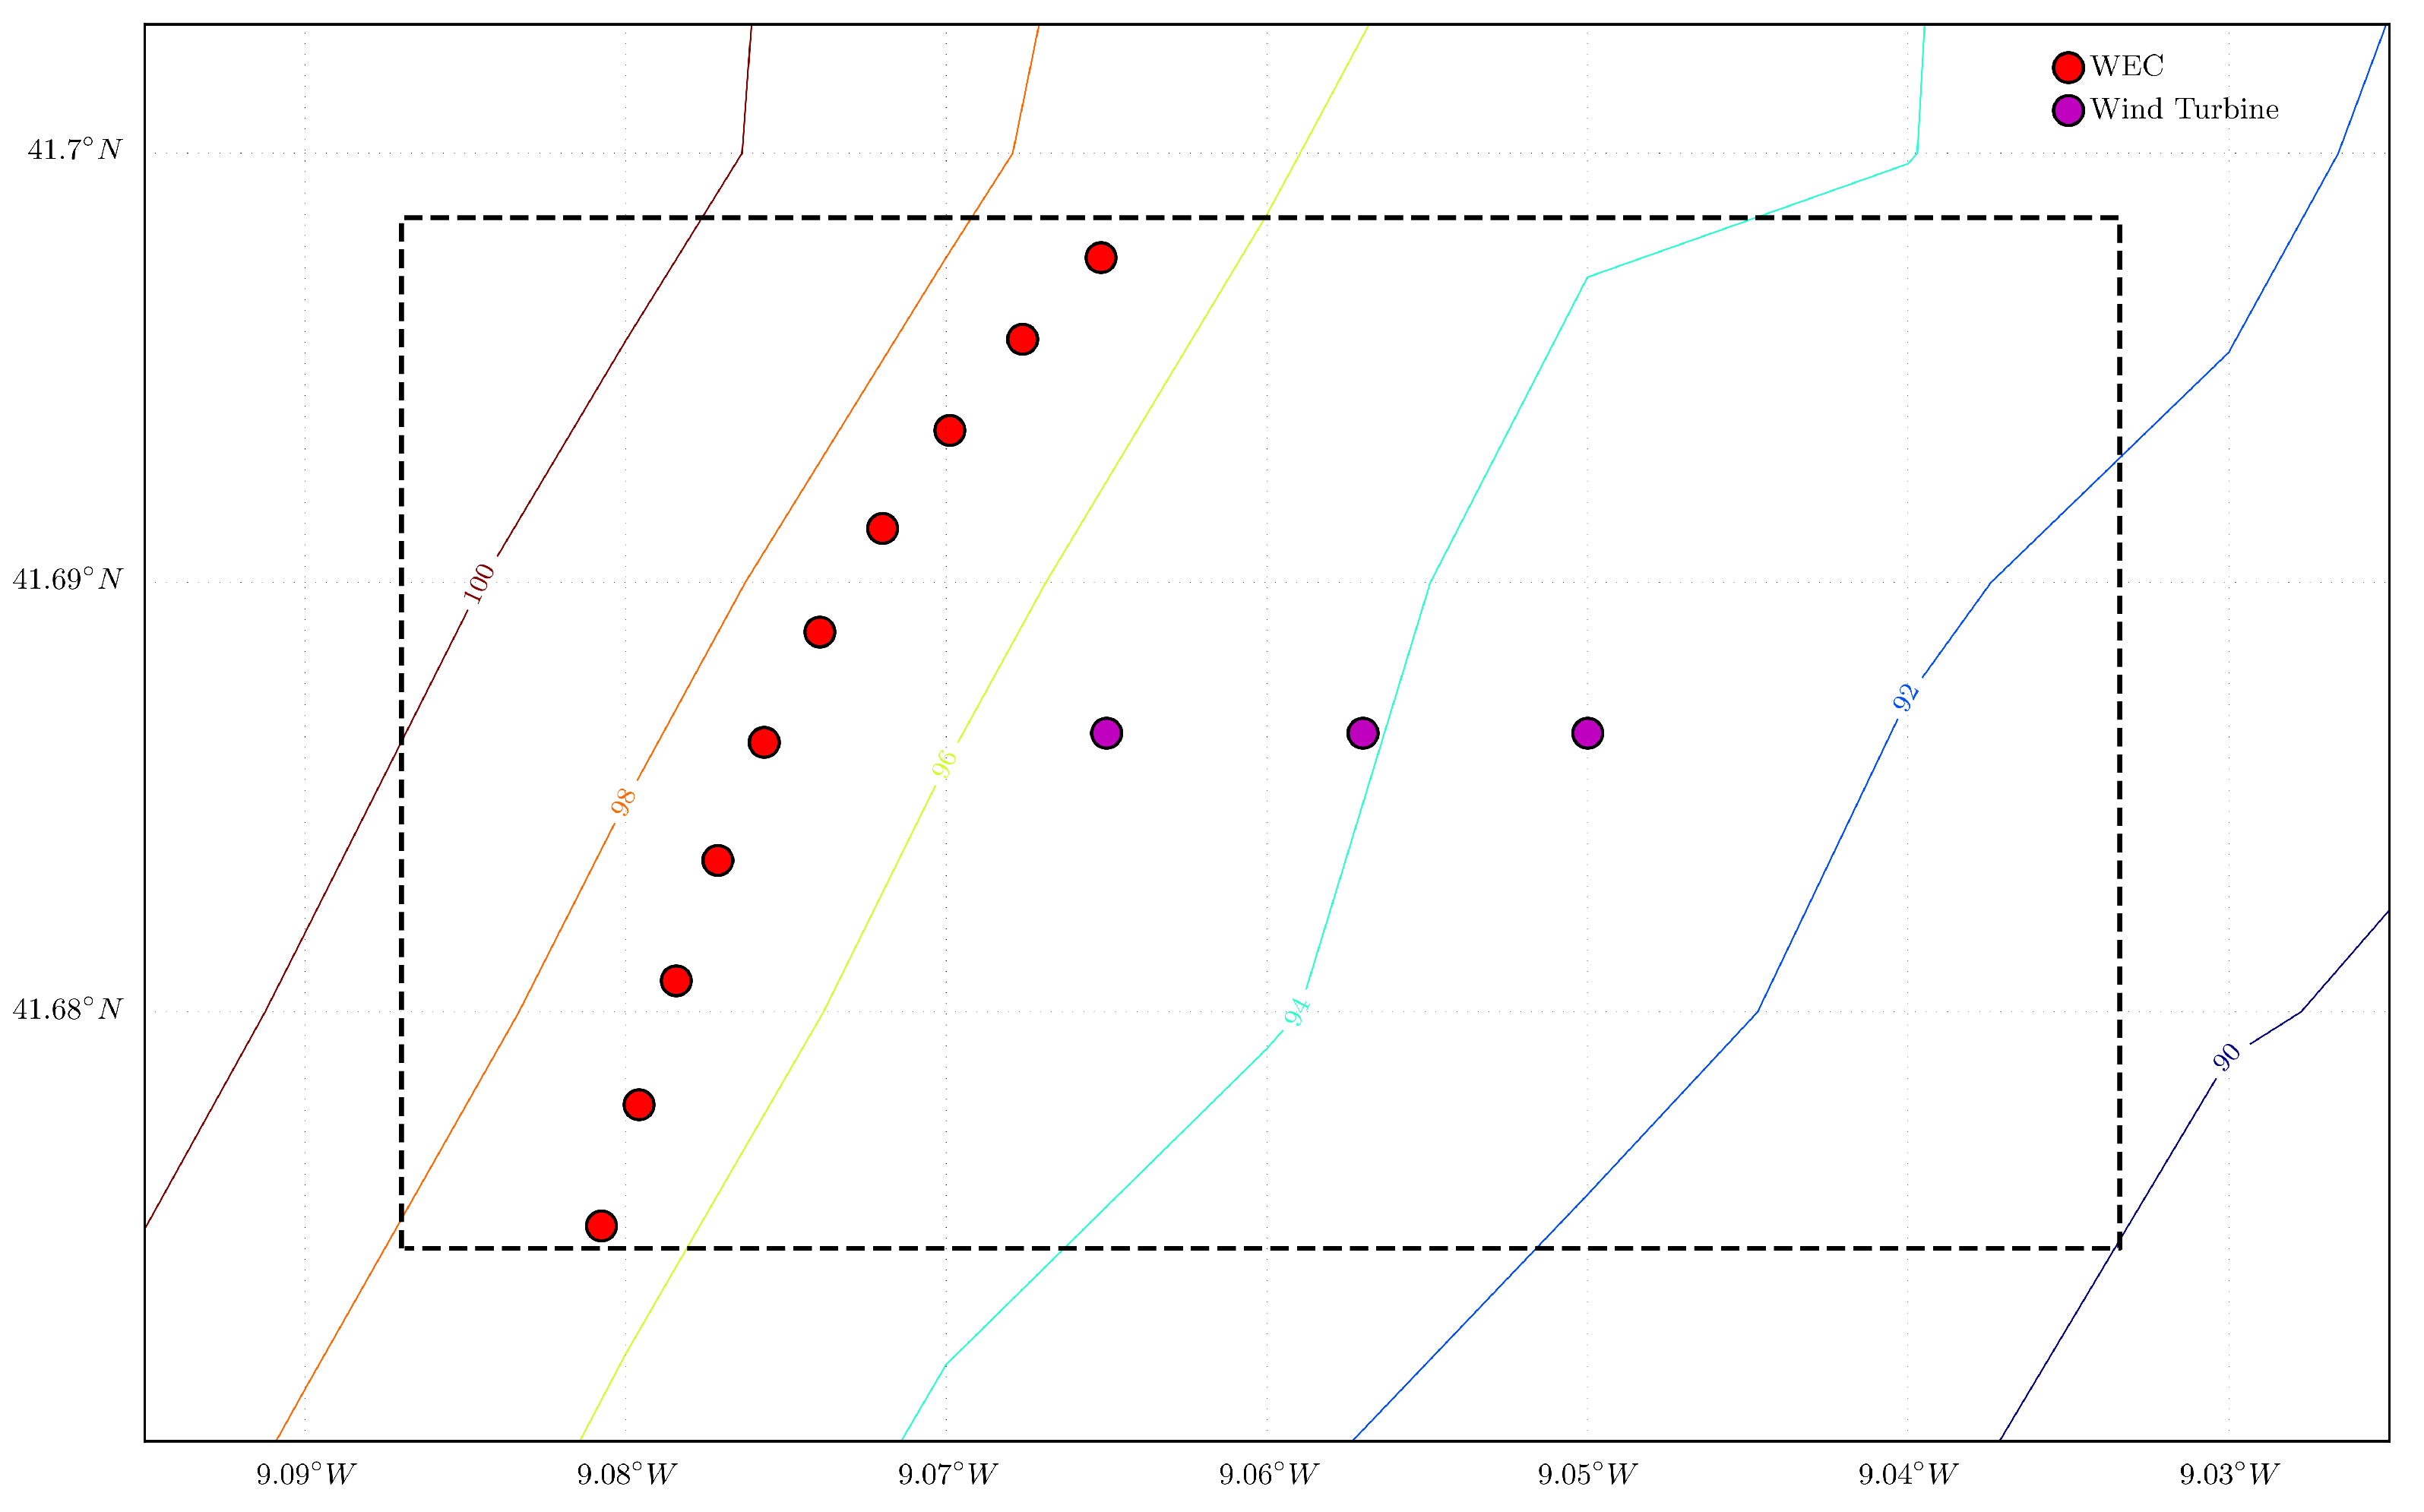
Figure 5.
Spatial distribution of the proposed co-located wave-wind farm. (Colour lines represent the bathymetric isolines. Red and magenta dots highlight the position of WECs and wind turbines, respectively. Black dashed line represents the allocated sea space for the WindFloat Atlantic farm).
Table 4.
Main characteristics of the co-located wind–wave farm.
2.3. Performance Assessment of the Co-Located Wave-Wind Farm
This section presents the methodology used for assessing the performance of the co-located wave–wind farm proposed in Section 2.2. The methodology focuses on evaluating the energy output of the co-located wind–wave farm in comparison with the individual wind and wave farms (Section 2.3.1), the reduction in power production variability (Section 2.3.2) and the potential LCoE reductions (Section 2.3.3).
2.3.1. Energy Output
The energy output produced by the co-located wind–wave farm () can be expressed as
where and are the energy outputs produced by the wind and wave farms, respectively. In this sense, the energy production of the wind farm is calculated as follows:
where is the total number of wind turbines and is the energy output produced by an individual wind turbine, which can be computed as
where T is the period of time considered, and are, respectively, the cut-in and cut-off velocity values of the turbine, is the power curve of the wind turbine (Equation (1)) and V the wind velocity at the hub height of the wind turbine. Assuming a logarithmic wind velocity profile, V can be obtained as
where z is the hub height, is the wind speed at a reference height (in this case, a 10 m height) and is an empirical coefficient that depends on the surface roughness characteristics. Based on previous studies on the region, a value of = 0.056 was used [62]. Finally, is the wind probability distribution. For the present work, the well-known Weibull distribution was used. Therefore, can be expressed as
where k and c are the so-called scale and shape parameters of the Weibull distribution, respectively. In consequence, combining Equations (1), (4) and (6), can be expressed as
On the other hand, the energy output produced by the wave farm can be expressed as
where is the total number of WECs forming the wave farm and is the energy output produced by an individual WEC, which can be calculated according to Equation (9).
where is the power generated by the WEC for the i-th sea state (Figure 3) and is the occurrence for a certain reference period (year, month or day) of the i-th sea state.
To compute the energy production of the farms, the wind and wave conditions of the area of study were obtained from the SIMAR datasets. SIMAR is an hourly re-analysis dataset managed by the Spanish Port Authority (Puertos del Estado), which covers the period from 1958 to date. Wind and wave conditions were computed for the North Atlantic and the Mediterranean Sea, with a spatial resolution of 0.25° × 0.25°, by means of joint numerical modelling of atmospheric, sea level and wave conditions [63]. From the SIMAR dataset, hourly wind and wave data, covering the period from 1 January 1960 to 31 December 2020, were obtained for the location highlighted in Figure 1. This large number of data allowed us to estimate the energy outputs on an annual and monthly bases. Finally, due to the simplicity of the proposed co-located wind–wave array (Section 2.2.2), the wave and wind park effects were not considered when computing energy production.
2.3.2. Power Smoothing
The contributions of the CECO array to reduce the power output variability of the WindFloat Atlantic farm was assessed by means of the Power Smoothing Index (PSI) [62], which can be computed by means of Equation (10).
where and are the variation coefficients for the energy outputs of the wind and co-located wind–wave farms, respectively. Overall, PSI values range in a scale from zero to one. Therefore, a PSI value of one indicates that the power variability, for a certain reference period, is eliminated. Conversely, PSI values close to zero indicate that reductions in power output variability are almost negligible.
2.3.3. Cost Benefits
With the aim of assessing the potential cost benefits of the co-located wind–wave farm proposed in Section 2.2.2 (Figure 5), the LCoE was computed and compared for three different scenarios, the stand-alone wind farm (WindFloat Atlantic), the stand-alone wave farm (CECO array) and the co-located wind–wave farm. For this purpose, the analytical cost model proposed by Clark et al. [30], which was developed ad hoc for co-located floating wind–wave farms, was used. The model computes the LCoE using a life-cycle cost approach [30].
where T is the lifespan of the project in years; and are the costs and energy output for the t-th year of the project, respectively; and r is the discount rate, which can be computed as
where and are the inflation and loan rates, respectively. Following the work of Clark et al. [30], for the present study, values of 2% inflation rate and 10% loan rate were used. With respect to the costs, Clark et al. [30] classified them into four main categories, pre-installation (), implementation (), operational () and decommissioning costs ().
Pre-installation costs include expenses related to market analysis, resource and feasibility assessment, site selection, metocean data acquisition, engineering design and consenting and licensing procedures. For this cost item, Clark et al. [30] suggested the use of different values found in the literature. For the present work, the value of USD 250,000 per installed MW, proposed by Myhr et al. [64], was considered.
On the other hand, implementation costs include expenses covering the design (), construction () and installation () of conversion technologies and electrical subsystems, such as substations (), as well as inter-array and export cables ().
Table 5 summarises the analytical expressions proposed by Clark et al. [30], for each of the sub-costs of Equation (14).
Table 5.
Values and analytical expressions proposed by Clark et al. [30] for implementation costs of wind and wave energy farms (, length of the anchoring and mooring lines; , length of inter-array cable; , length of export cable).
With regards to the operational costs, these include O&M (), administrative() and insurance () expenses.
Similarly, the values and analytical expressions proposed by Clark et al. [30], for each of the sub-costs of Equation (15), are summarised in Table 6.
Table 6.
Values and analytical expressions proposed by Clark et al. [30] for operational costs of wind and wave energy farms (, insurance rate of the project).
Finally, decommissioning costs can be computed according to Equation (16).
where is the decommissioning rate, which, for the present work, was set to 3% [30]. For further details of the cost model, the readers are referred to the work of Clark et al. [30].
3. Results
3.1. Energy Output
The energy output produced by the wind, wave and co-located farms was computed on annual (Section 3.1.1) and monthly (Section 3.1.2) bases, using the methodology presented in Section 2.3.1.
3.1.1. Energy Output: Annual Scenario
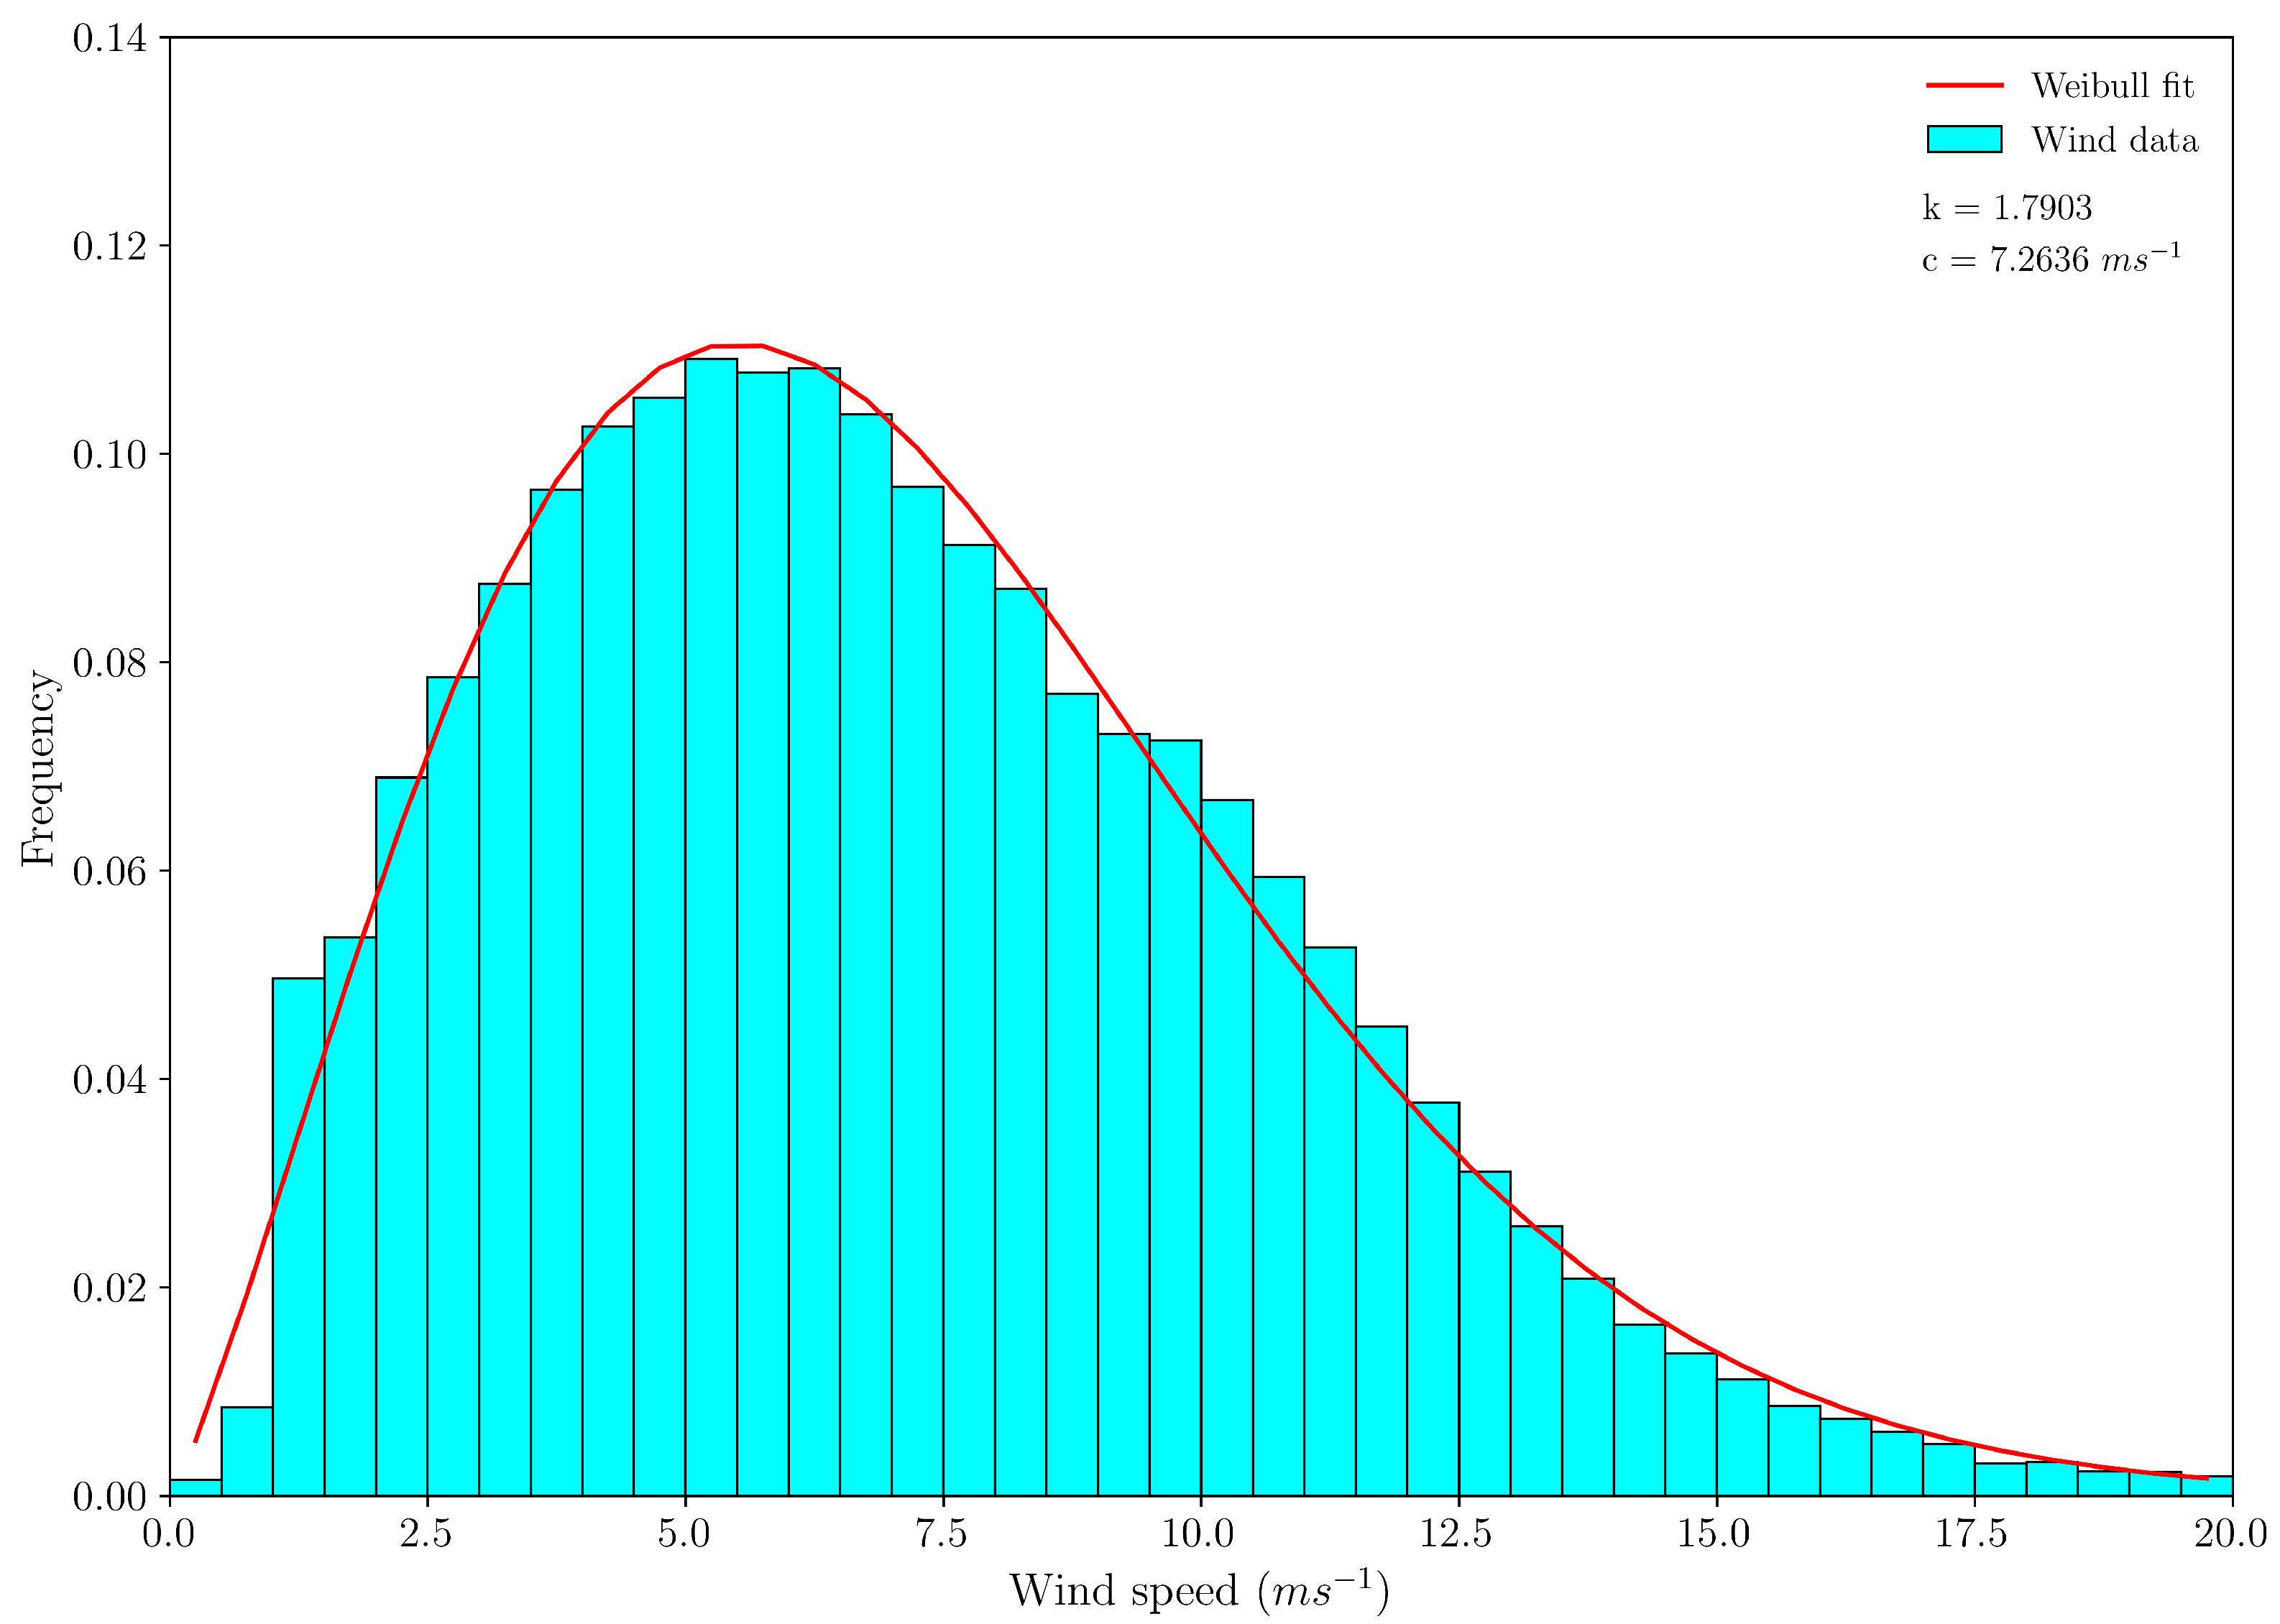
For the stand-alone wind farm, the hourly wind velocities at the hub height (105 m) of the wind turbine were computed by means of Equation (5) from the SIMAR reanalysis datasets (Section 2.3.1) and then fitted to the Weibull probability density function, as can be observed in Figure 6. Overall, the wind distribution presents its largest frequency for wind speeds in the order of 7 ms, ensuring the operation of the Vestas V164-8.0 MW wind turbine for more than 78% of annual hours. Furthermore, the fraction of time for which the turbine operates at its rated power exceeds 9%, representing approximately 630 annual hours. On these grounds, the annual energy production of the wind farm was obtained combining Equations (3) and (7), yielding a value of 70.44 gigawatt hours per year (GWh/a). This value is in good agreement with the annual energy output reported by WindFloat Atlantic during its first year of operation [65].
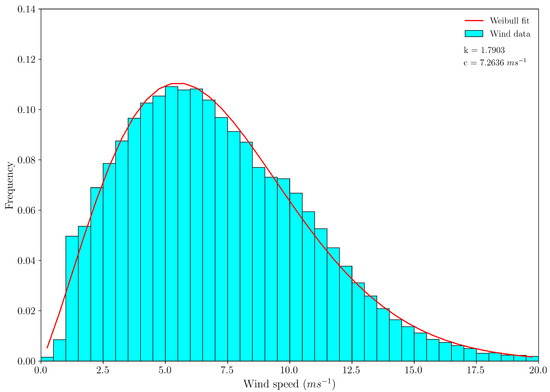
Figure 6.
Observed wind data (histogram) and Weibull probability density function (red line) for the annual scenario (k and c are the annual scale and shape parameter values of the Weibull distribution).
On the other hand, the SIMAR hourly records of wave data (spanning from 1 January 1960 to 31 December 2020) were used to assess the wave energy resource in the area of study. For this purpose, the omni-directional wave energy matrix (Figure 7) was constructed in terms of significant wave height (), peak period () and annual number of hours of occurrence (). In general, the most recurrent sea states are concentrated in the range of 1–3 m of and 9–13 s of . However, the bulk of wave energy shifts towards the region of 2–5 m of and 9–15 s of , with some sea states exceeding values of 20 MWhm. On these grounds, the annual energy production of the wave farm was computed by combining the CECO and wave resource matrices as indicated in Equations (8) and (9). Therefore, the annual energy output of the wave farm resulted as 13.52 GWh/a.
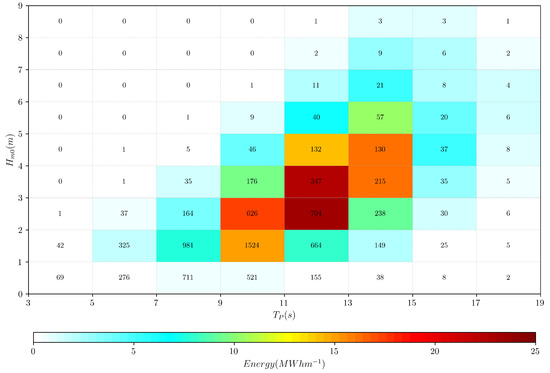
Figure 7.
Wave resource energy matrix. (Colourmap represents the annual energy per meter of wave front and the numbers represent the occurrence in annual hours for each sea state ()).
As a result, the co-located wind–wave farm yields a total annual energy production of approximately 84 GWh/a, with the wind and wave farms contributing 84% and 16%, respectively. Finally, Table 7 summarises the values and contributions of the energy production for the annual scenario.
Table 7.
Annual energy production for the co-located and stand-alone wind and wave farms.
3.1.2. Energy Output: Monthly Scenario
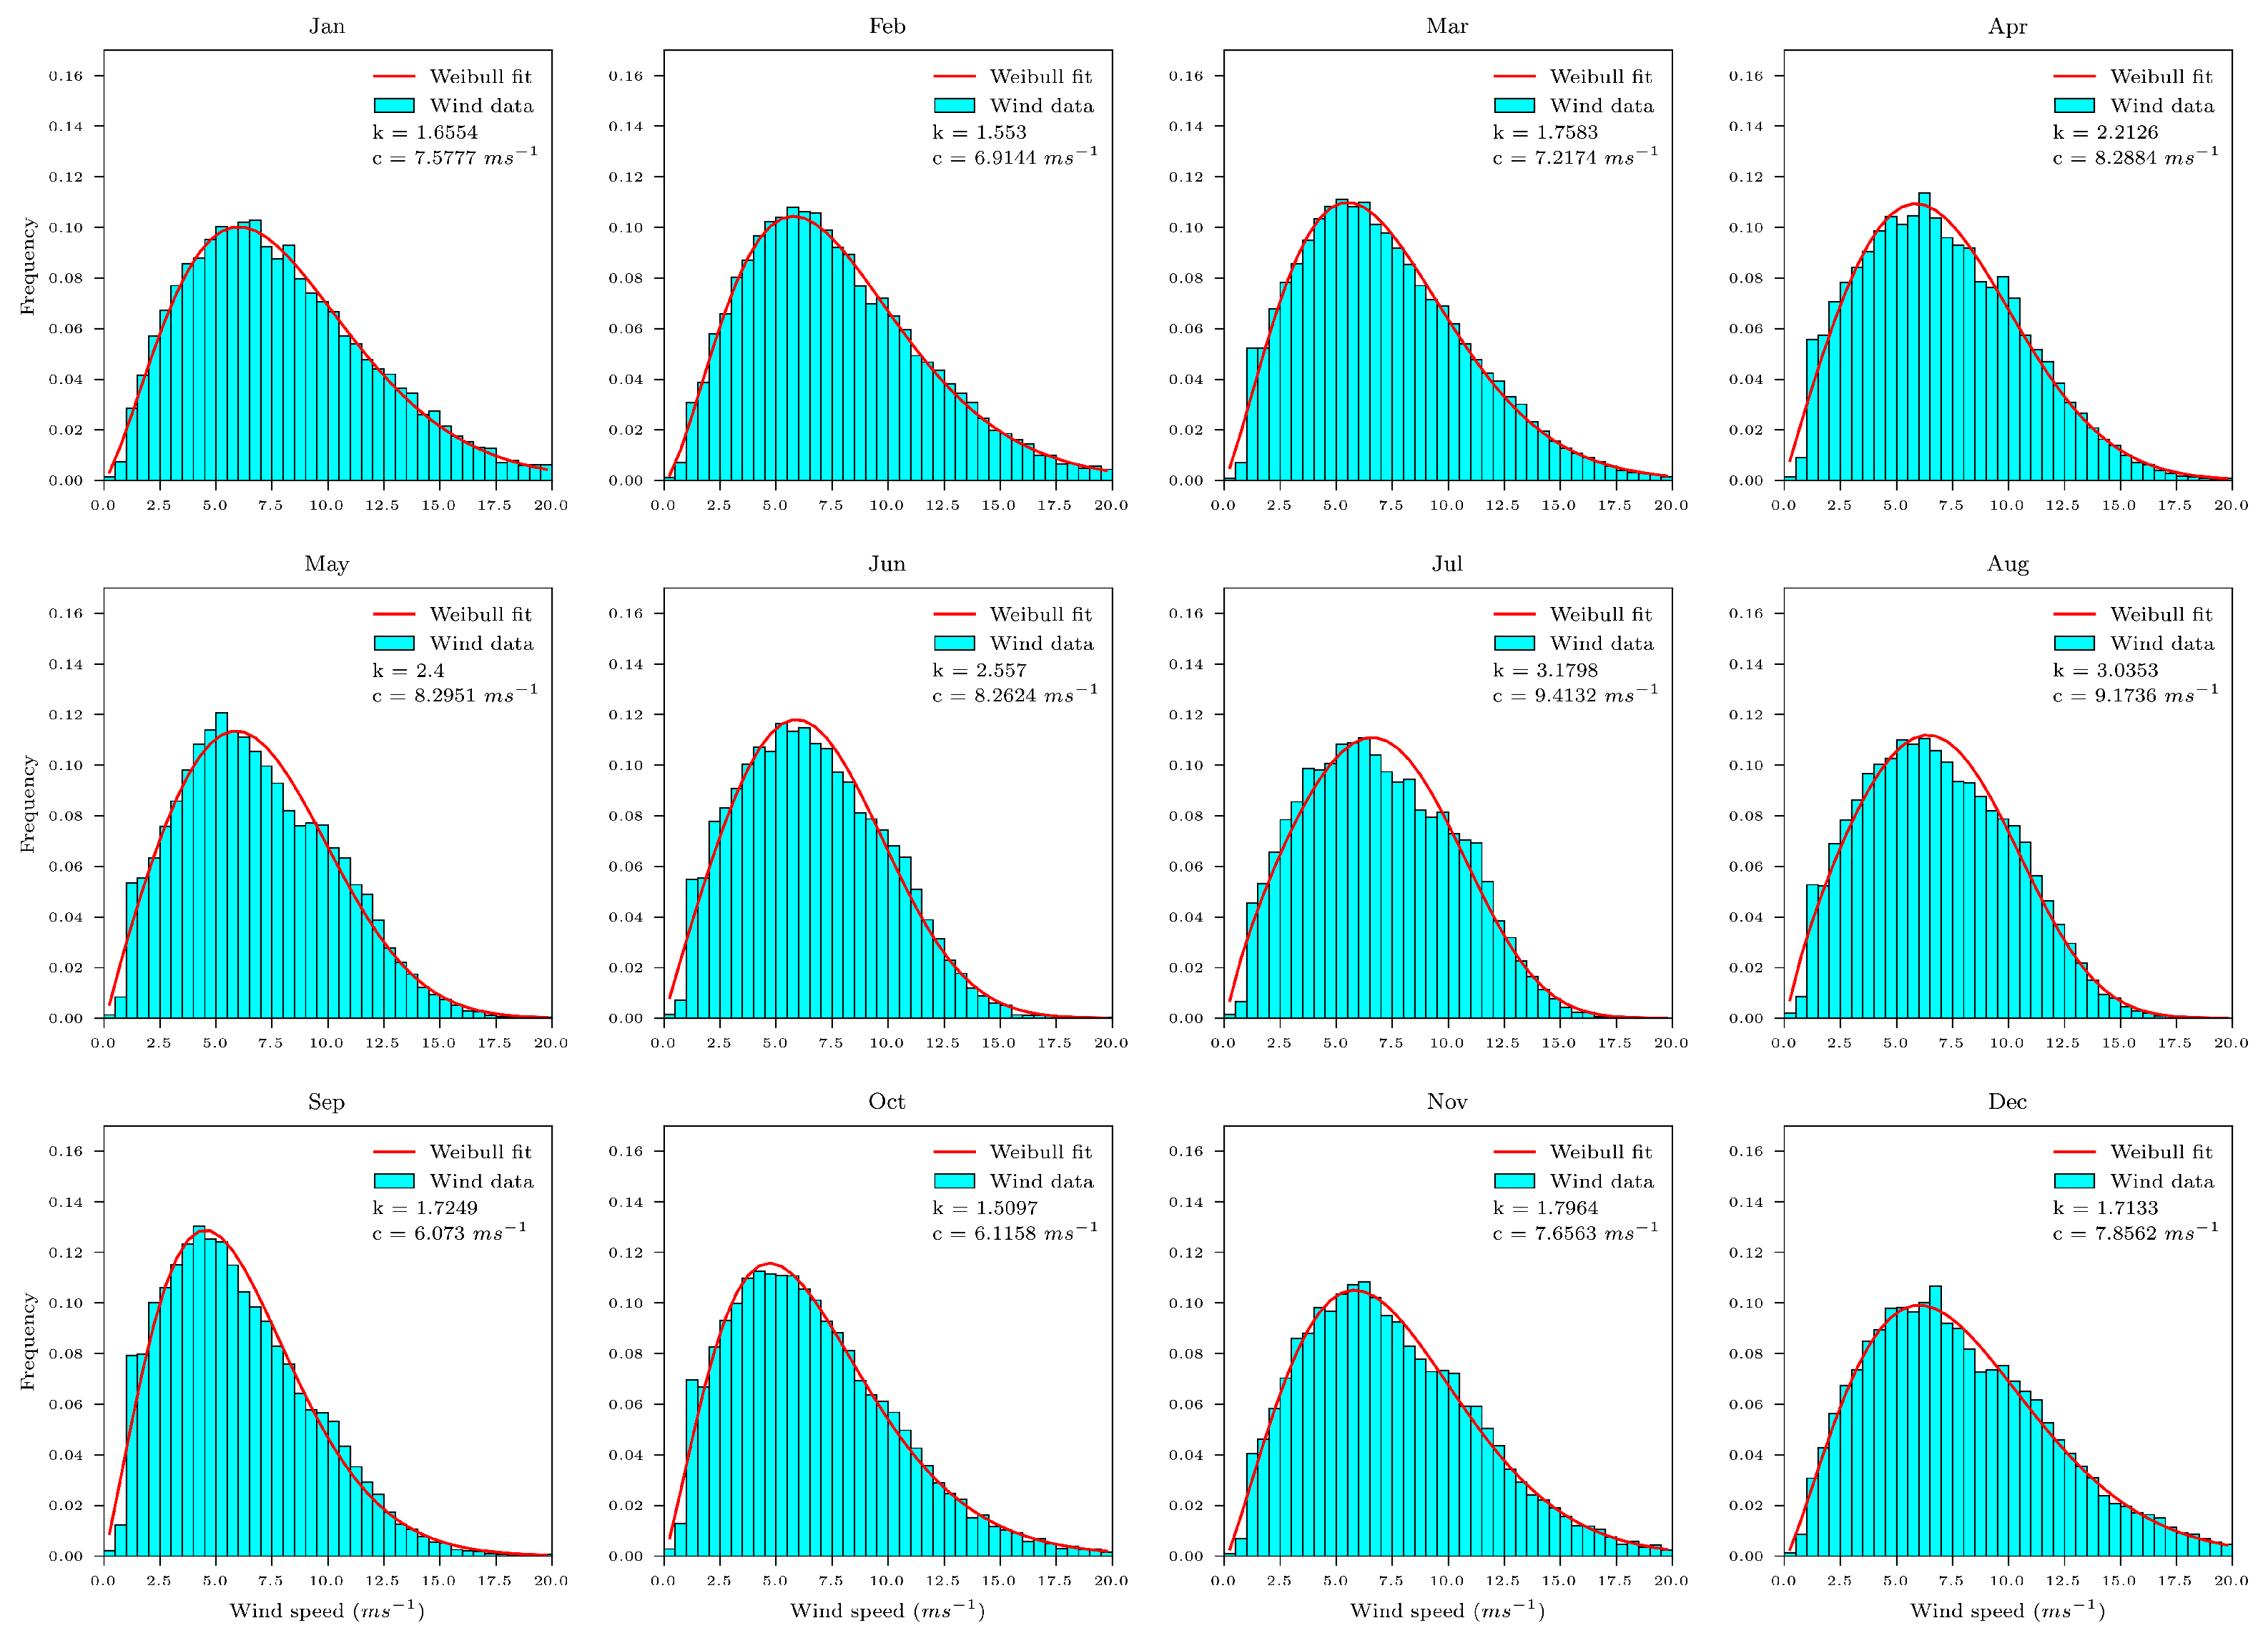
Following the methodology presented in the previous section, the monthly energy production was computed for the stand-alone and co-located wind and wave farms. For the stand-alone wind farm, the SIMAR wind records were used to obtain the monthly Weibull probability density functions, which are shown in Figure 8. In general, the wind distribution presents a homogeneous behaviour across the different months of the year, with the most recurrent wind speeds located between 5.5 and 7 ms. As a result, the percentage of time for which the turbine is operating, ranges from 82% in January to 70% in September. Conversely, the fraction of time for which the turbine operates at its rated power varies significantly during the year, from 12% in January and December to only 3% in September. According to Equations (3) and (7), the monthly energy production of the wind farm was computed and is presented in Figure 9. As expected, with the exception of September, a uniform monthly energy production, ranging from 7.20 GWh to 5.5 GWh, was obtained.
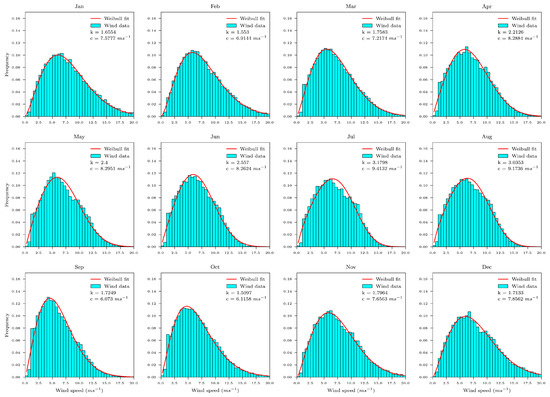
Figure 8.
Observed wind data (histogram) and Weibull probability density function (red line) for the monthly scenario (k and c are the monthly scale and shape parameter values of the Weibull distribution).

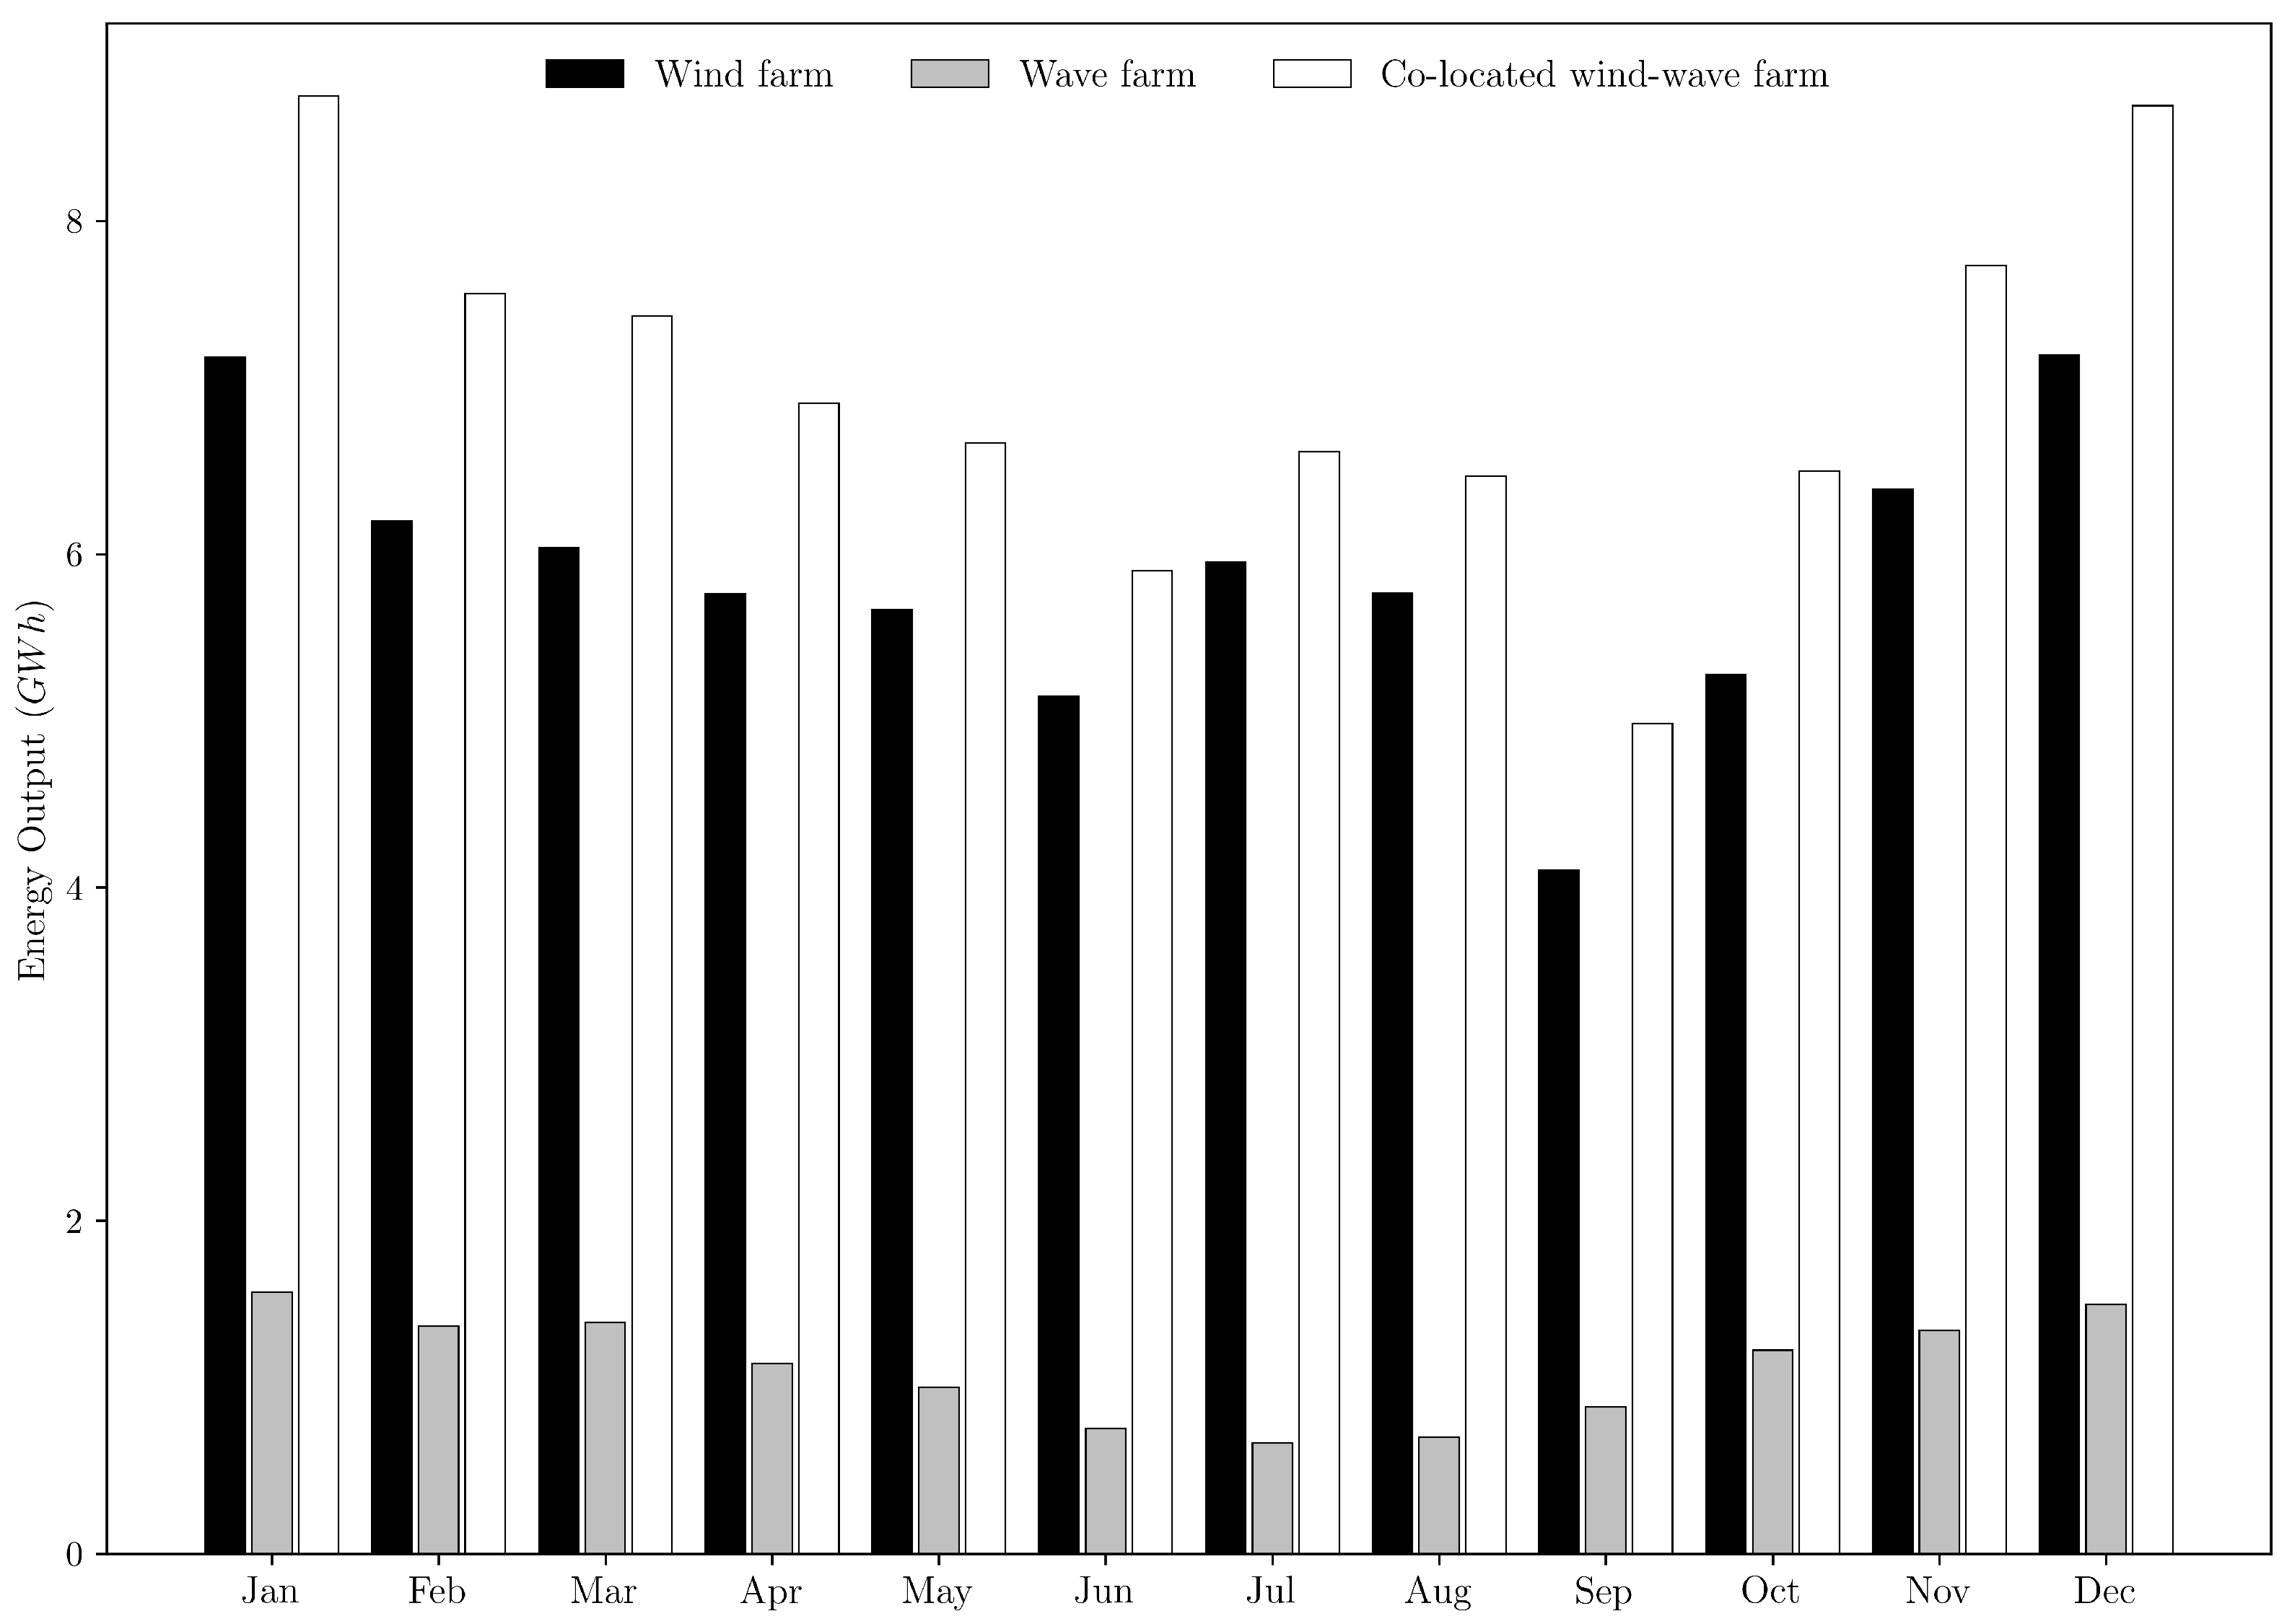
Figure 9.
Monthly energy output for the stand-alone and co-located wind and wave farms.
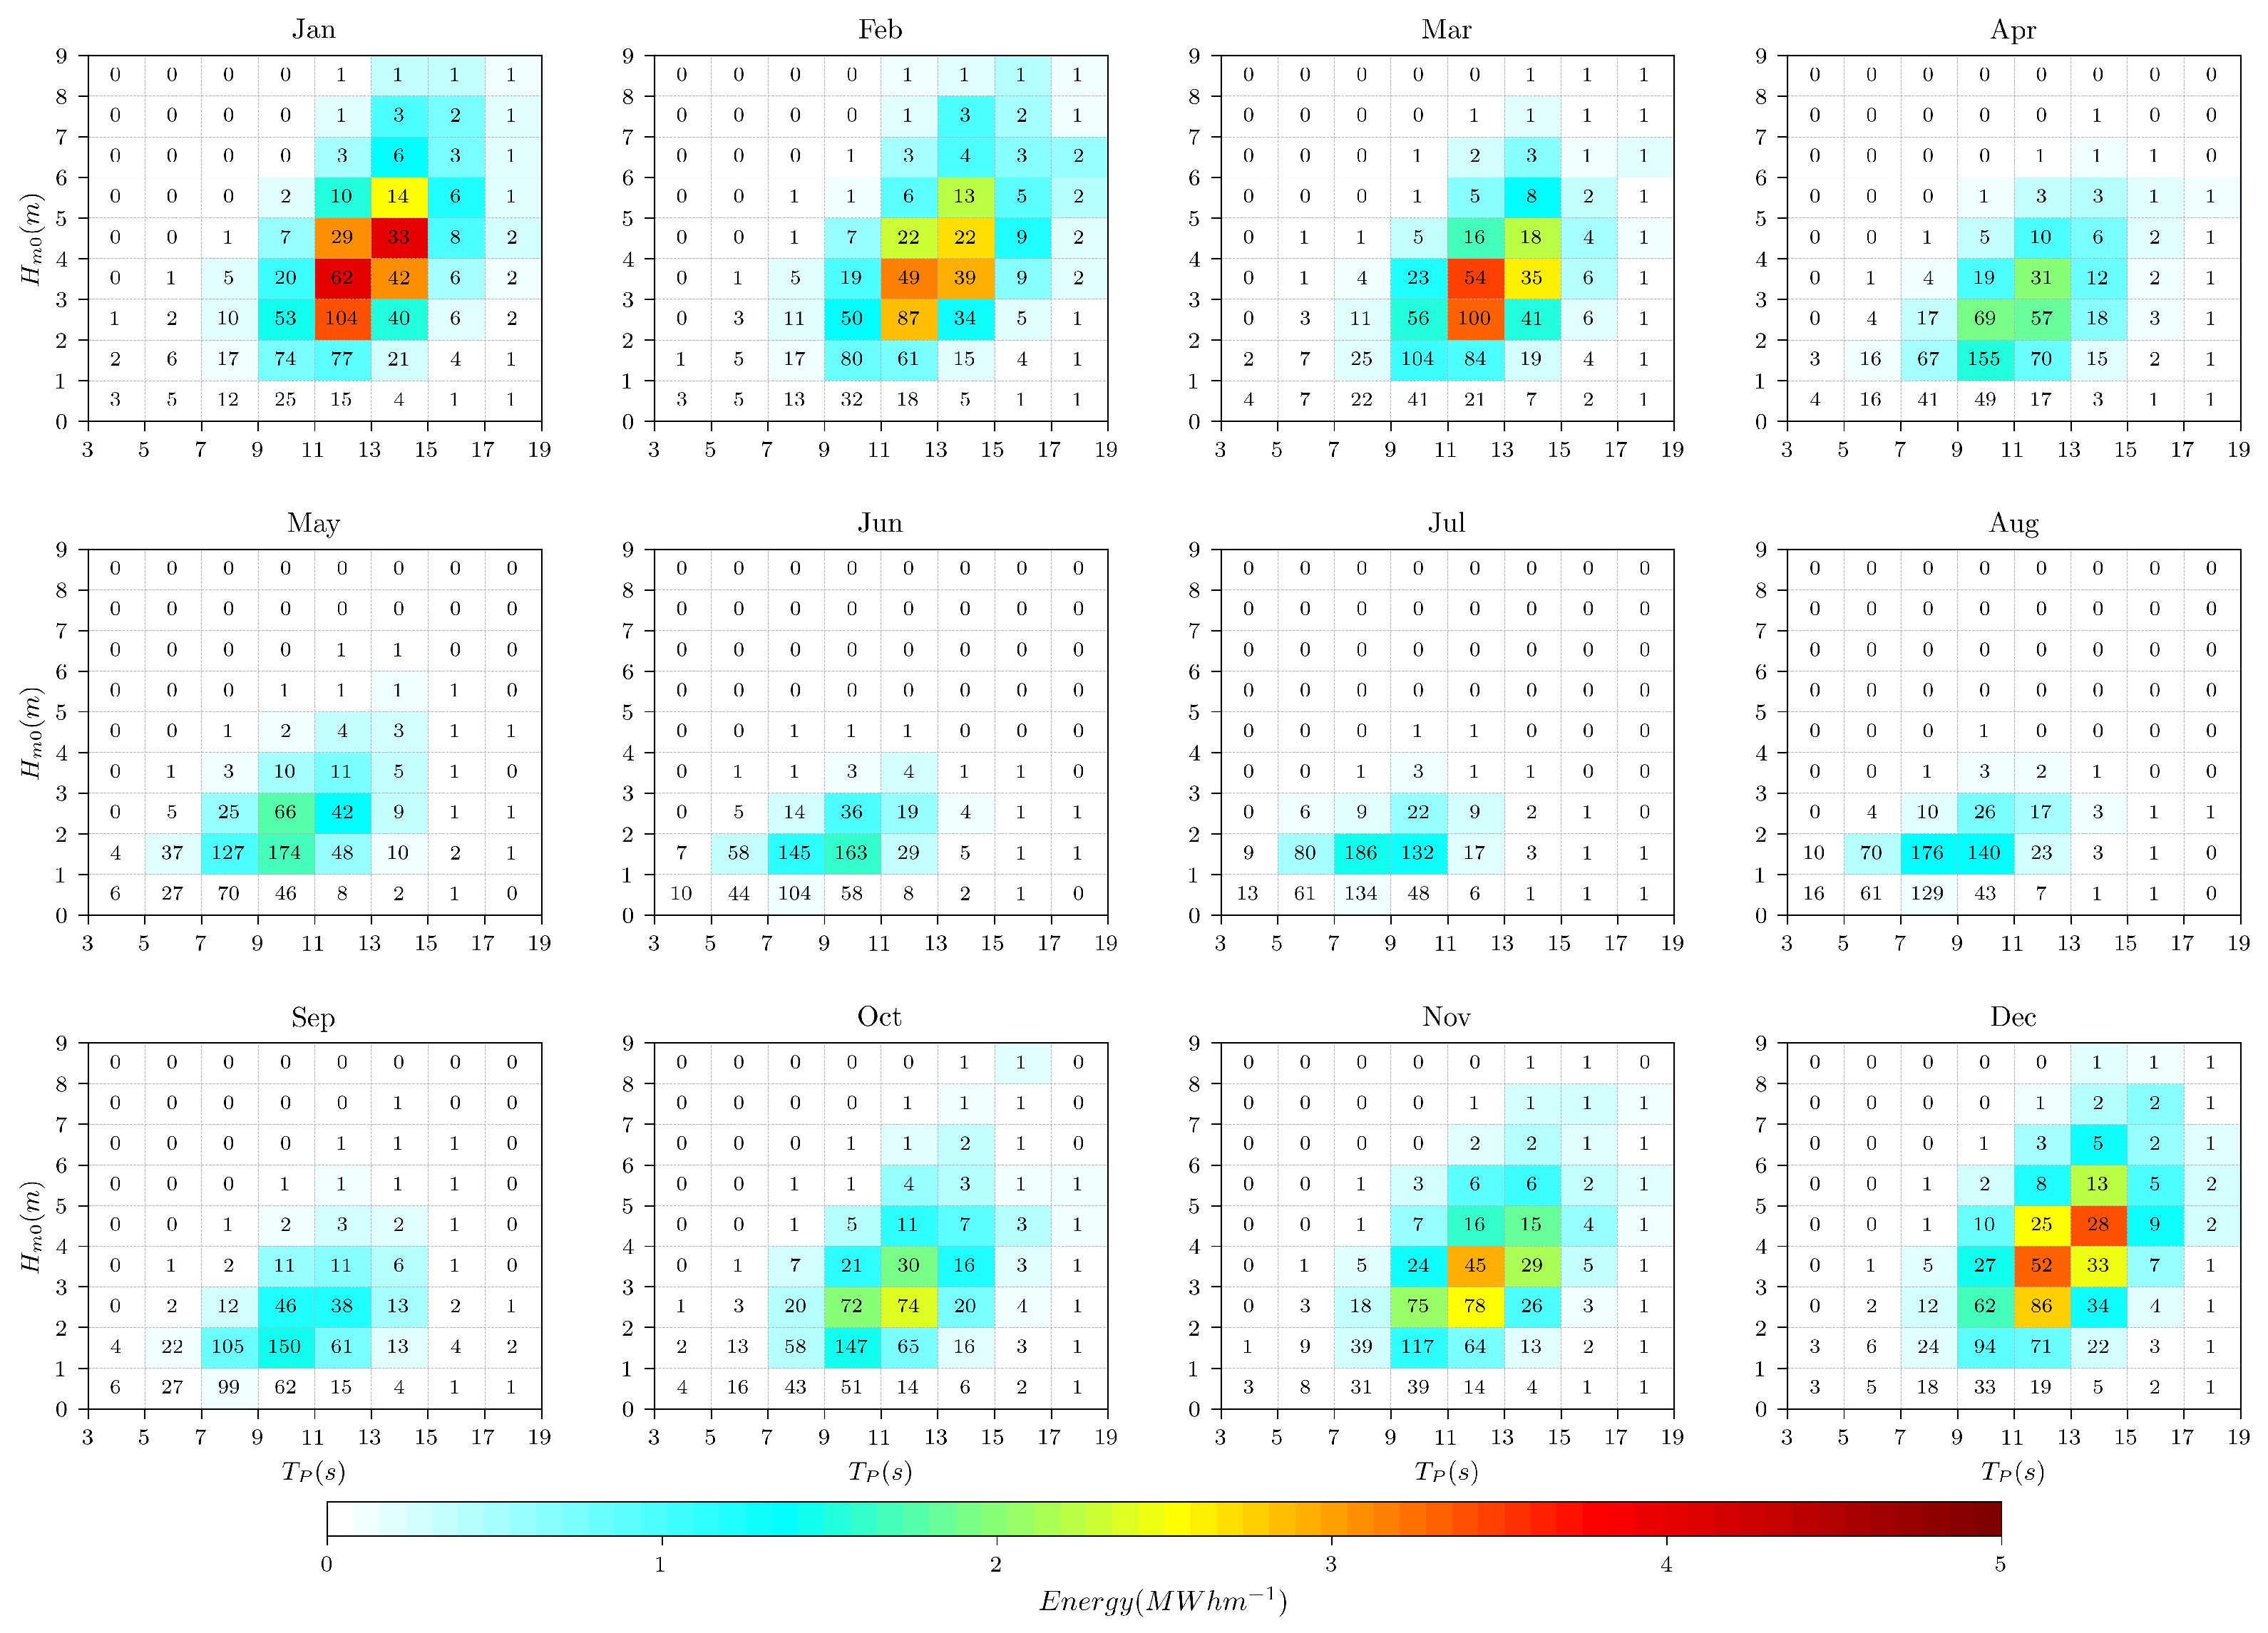
For the case of the wave farm, the SIMAR wave records were used to characterise the wave resource on a monthly basis. Therefore, the omni-directional monthly wave energy matrices were constructed and plotted in Figure 10. Overall, the wave energy resource presents a strong seasonal variability. For the winter months (January, February, March and December), the bulk of wave energy is concentrated in the range of 2–5 m of and 9–15 s of , with some sea states exceeding monthly energy values of 4 MWhm. Conversely, for the summer months (from June to August), the wave energy resource is significantly lower, with a very limited number of sea states exceeding 1 MWhm, which is mainly concentrated in the range of 1–3 m of and 5–13 s of . Again, combining the CECO and wave resource matrices (Equations (8) and (9)), the monthly energy output of the wave farm was computed and plotted in Figure 9. As expected, energy production presents a strong intra-annual variability, ranging from 1.57 GWh in January to 0.67 GWh in July.

Figure 10.
Wave resource energy matrix. (Colourmap represents the monthly energy per meter of wave front and the numbers represent the occurrence in annual hours for each sea state ()).
On these grounds, the monthly energy production of the co-located wind–wave farm is presented in Figure 9. In general, the energy output varies significantly across the year. During the winter period, the production is in the range from 7.5 to 8.5 GWh, while, for the summer months is in the order of 5–6.5 GWh. This behaviour is strictly related to the strong intra-annual variability of the wave energy resource (Figure 10). For instance, during the winter months, the energy output of the wave farm represents, approximately, from 20 to 25% of the wind farm. This fact highlights the potential of CECO in terms of energy production, considering that the installed capacity of the wave farm is a fifth of the wind farm. However, for the summer months, the wave farm barely represents 10% of the wind farm energy output. All in all, the presence of the co-located wave farm would increase the overall energy production up to 23% and 10% during the winter and summer months, respectively.
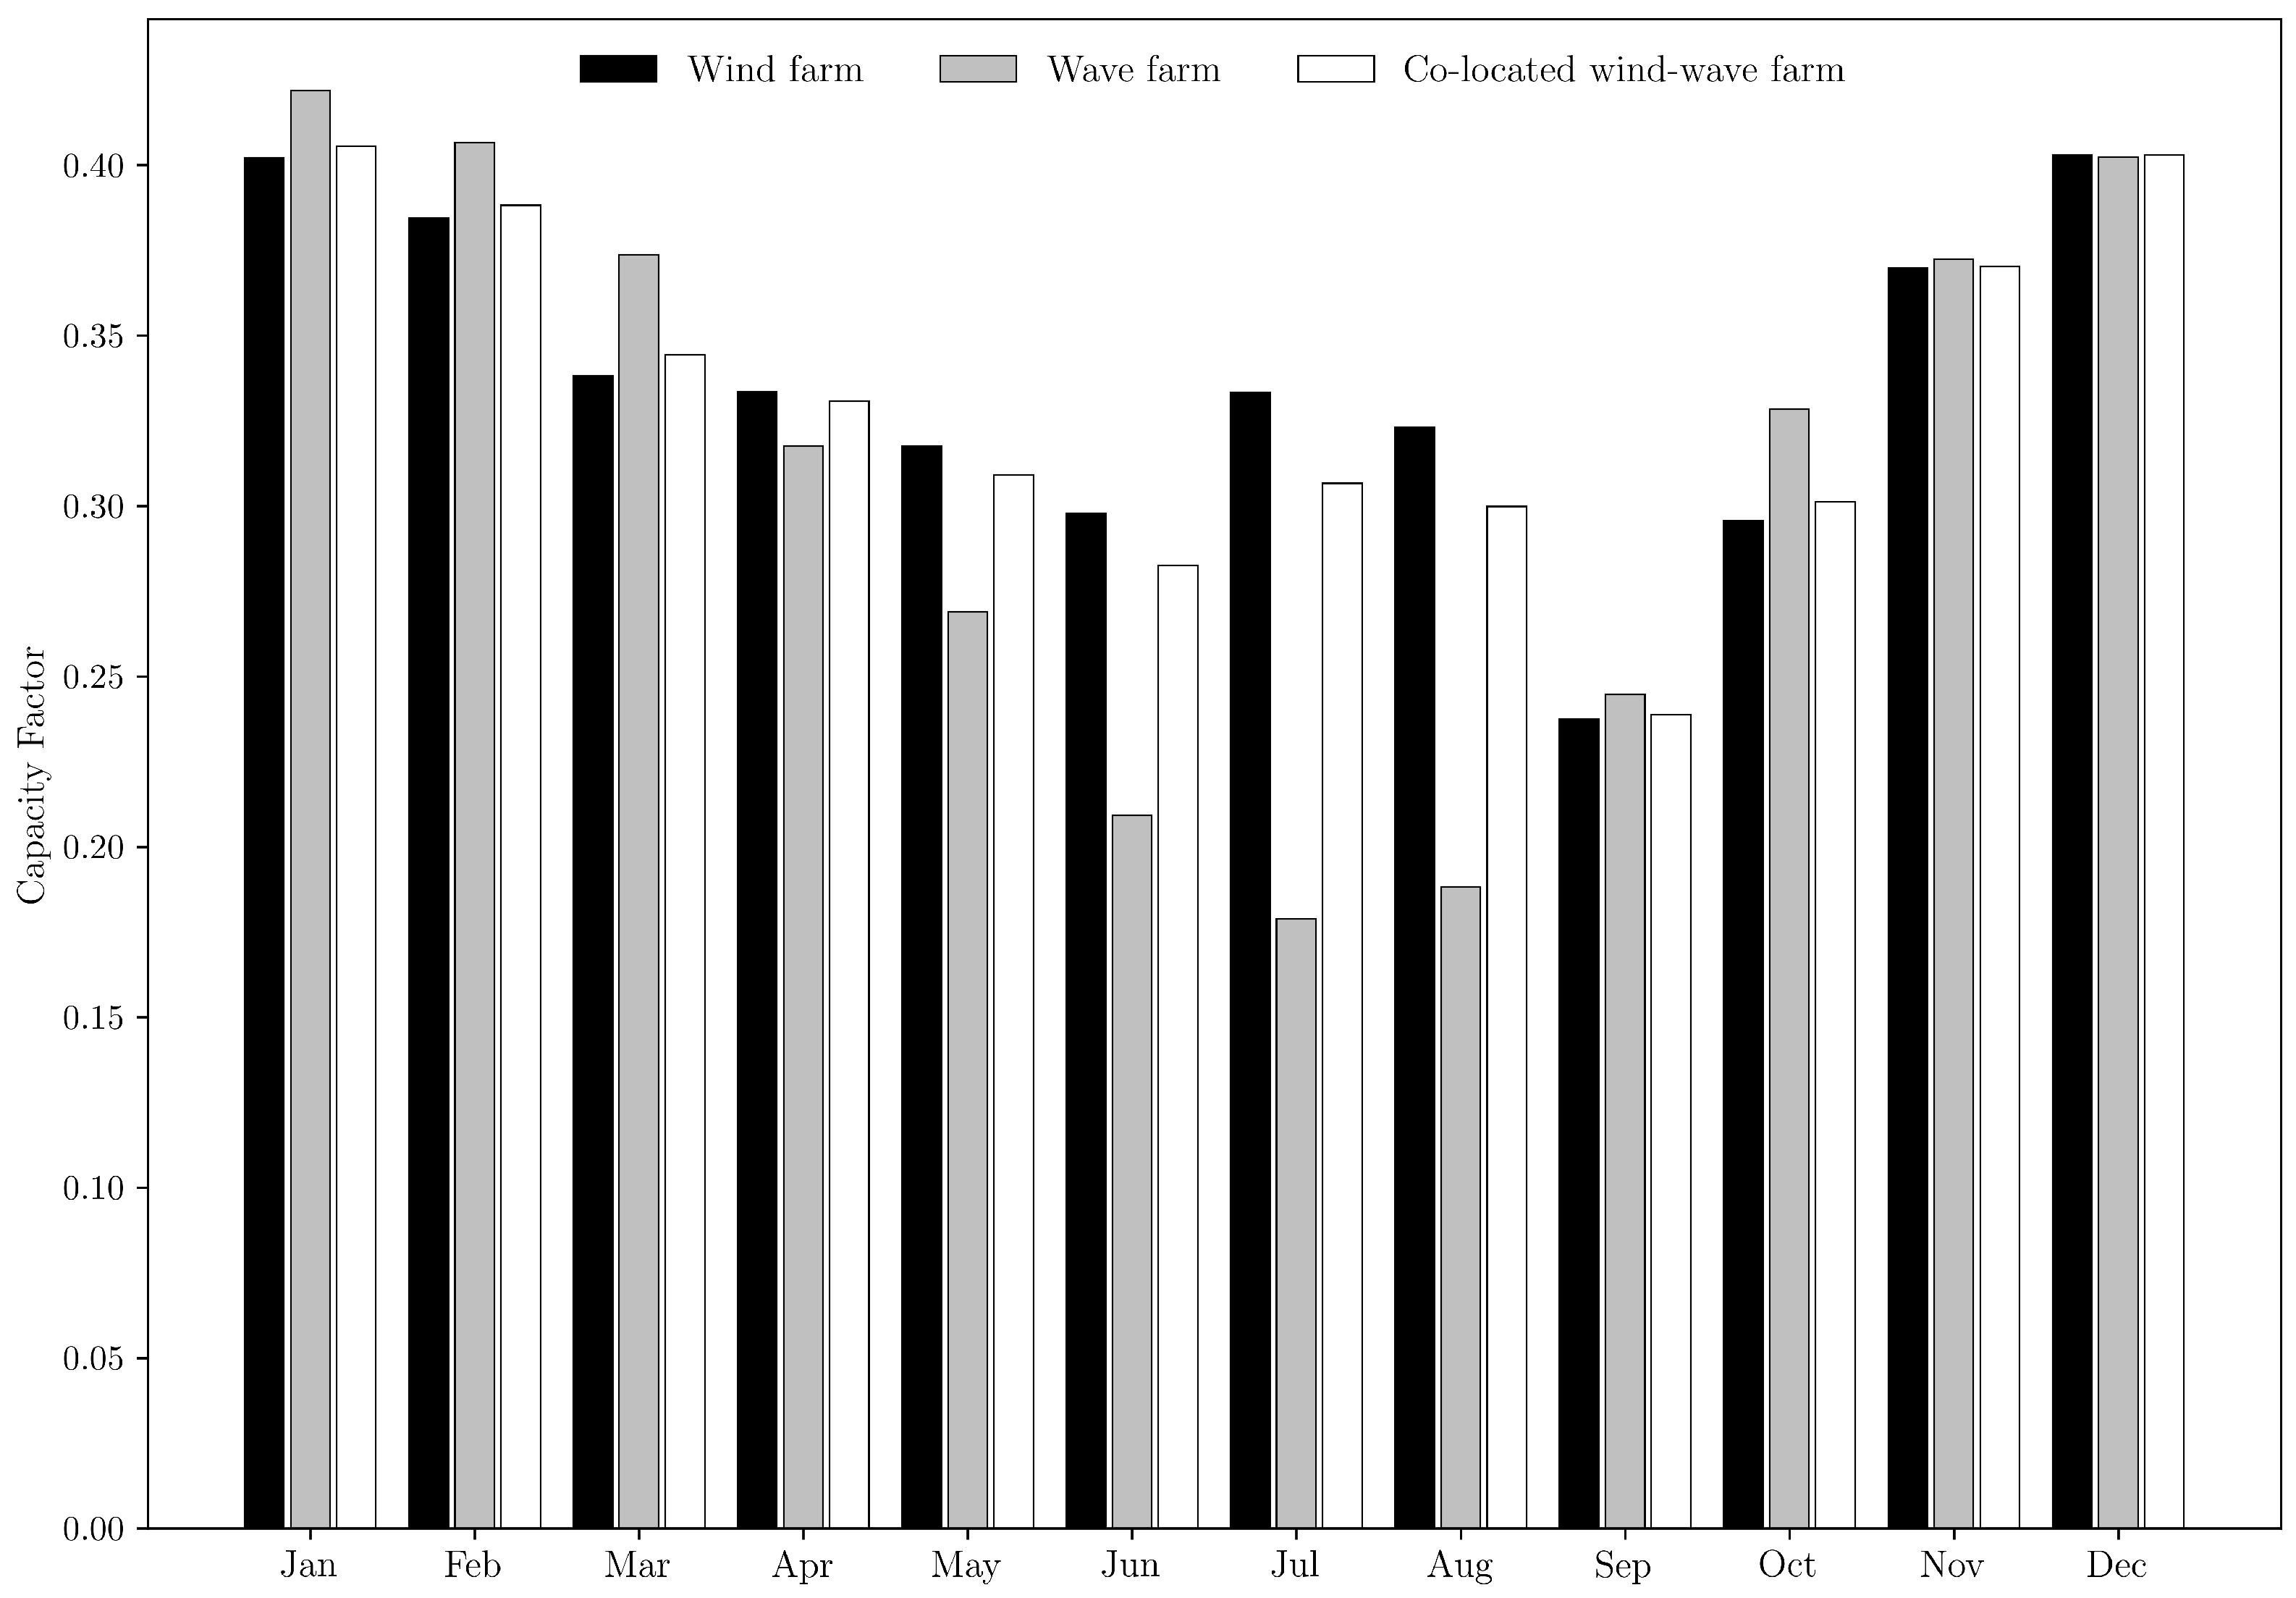
In addition, the monthly variation in the capacity factor for the stand-alone and co-located wind and wave farms is shown in Figure 11. Overall, the wind farm presents a low intra-annual variability in the capacity factor, with its values ranging between 0.41 and 0.30, with the exception of September, with the lowest value of 0.24. This fact is in good agreement with the homogeneous monthly distribution of the wind resource shown in Figure 8. On the other hand, the capacity factor of the wave farm presents a strong intra-annual variability (ranging from 0.42 in the winter months to 0.17 in the summer months), which is coherent with the seasonal behaviour of the wave resource in the area of study (Figure 10). It is worth pointing out that, for the winter months, the capacity factor of the wave farm exceeds the values obtained for the wind farm. This fact is due to the relatively small electric generator used by the CECO device (500 kW). Finally, for the co-located wind–wave farm, the capacity factor is similar to the stand-alone wind farm, with the highest discrepancies present in the summer months, for which the low values of the wave farm hinder the overall capacity factor of the co-located farm.

Figure 11.
Monthly capacity factor for the stand-alone and co-located wind and wave farms.
3.2. Power Smoothing
From the results presented in Figure 9 and Figure 11, it becomes apparent that the presence of the co-located wave farm would be counterproductive to reduce the variability in the intra-annual energy produced by the wind farm. In this context, the power output for the stand-alone wind farm presents a variation coefficient of , while the combined wind–wave farm presents a value of . Therefore, according to Equation (10), the power smoothing index (PSI) would be close to zero, confirming that the co-located wave farm has no positive effects in smoothing the power output of the wind farm. This fact is mainly due to the combination of the strong seasonal behaviour of the wave resource in the area of study (Figure 10) and the present stage of development of CECO, which must be optimised to improve its efficiency and energy production for milder wave conditions [46].
3.3. LCoE Analysis
The LCoE associated with the wind, wave and co-located farms was assessed using the analytical cost model proposed by Clark et al. [30], which is described in detail in Section 2.3.3. In this context, Table 8 summarises the main input values of the LCoE model used in the present work. It is important to note that the most conservative values proposed by Clark et al. [30] were taken for parameters, such as inflation, loan, insurance and decommissioning rates.
Table 8.
Input parameters for the LCoE model.
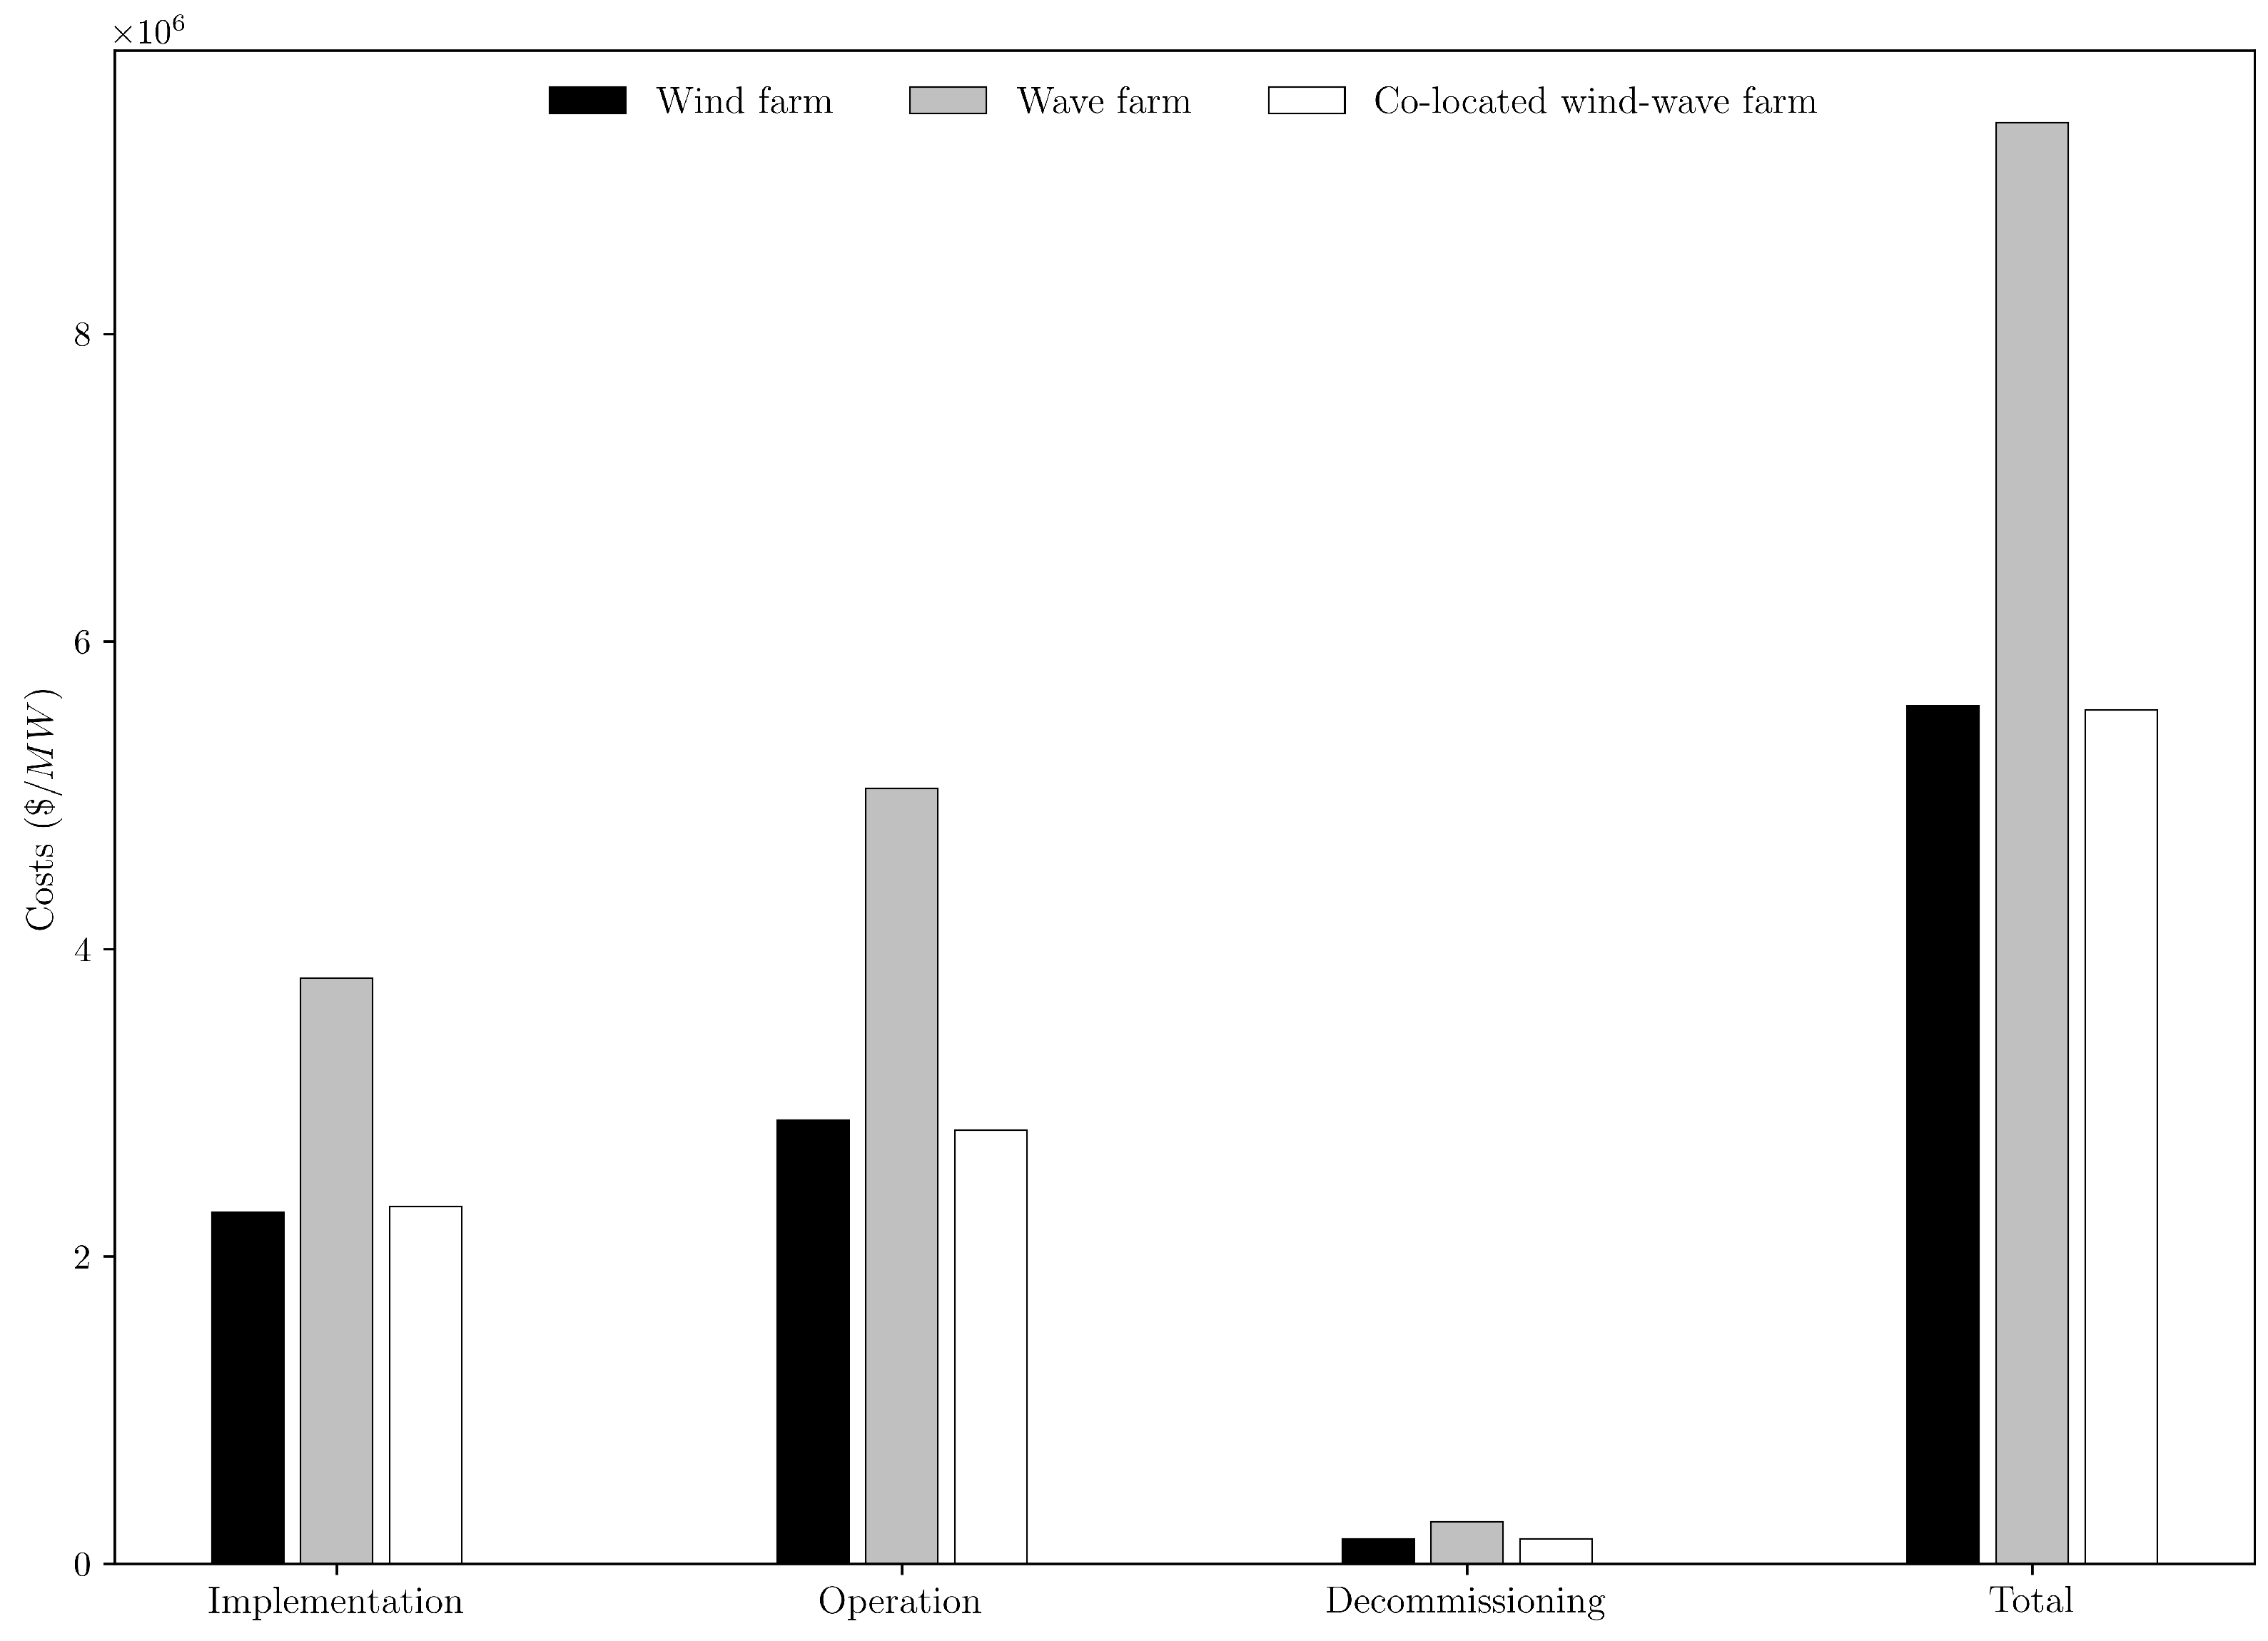
For the stand-alone wind farm, an LCoE of 0.096 USD/kWh was obtained, which is in good agreement with the values reported by the floating offshore wind energy industry [66,67]. Figure 12 summarises the pre-installation, implementation, operation and decommissioning costs per megawatt of installed capacity. As expected, the implementation and operation stages account for the majority of the total costs, representing 41% and 52%, respectively. The remainder costs are split between the pre-installation (4.47%) and decommissioning (2.92%) stages.
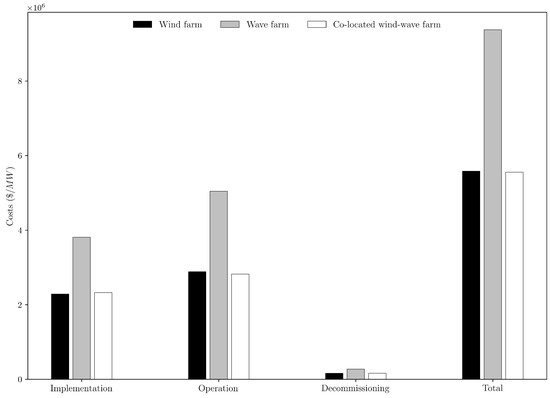
Figure 12.
Costs per megawatt of the stand-alone and co-located wind and wave farms.
On the other hand, the LCoE obtained for the stand-alone wave farm was 0.347 USD/kWh, which is in line with previous works dealing with the LCoE assessment of wave energy farms [30]. In comparison with the wind farm, the total cost, per megawatt of installed capacity, would increase by 68%. This fact is explained by the low maturity level of the wave energy industry, which is especially relevant for the installation, operation and maintenance tasks (Figure 12). In consequence, it can be concluded that a CECO wave farm is not yet ready for full commercial exploitation. Nonetheless, CECO is still at an early stage of development; therefore, significant LCoE reductions could be achieved by the optimisation of its design and the economy-of-scale effect.
Finally, the co-located wave–wind farm yields an LCoE of 0.115 USD/kWh, which represents a substantial reduction (up to 200%) in comparison with the stand-alone wave farm. As can be observed in Figure 12, the largest savings are concentrated in the implementation and operation costs. On the one hand, for the implementation stage, expenses are reduced by 39%, taking advantage of the shared electrical infrastructures such as the offshore and onshore substations and the export cable. On the other hand, operation costs present reductions in the order of 44%, as a result of shared administration, operation, maintenance, transport, insurance and facility costs. Considering the total cost per megawatt of installed capacity, the results are even more encouraging. In this context, the co-located wave–wind farm would present a similar total cost (per megawatt) to that of the stand-alone wind farm and a reduction of 41% in comparison with the stand-alone wave farm. Consequently, from the economic point of view, CECO appears as a feasible option to be used in a co-located wave–wind farm.
4. Discussion
This section presents a discussion related to the main aspects tackled in this investigation, namely, (i) the comparative analysis between the stand-alone wave and wind farms and (ii) the potential benefits derived from the co-located wave–wind farm.
First of all, the results obtained in Section 3.1.1 and Section 3.1.2 confirm the promising potential of the CECO concept to harvest wave energy. In annual terms, the energy output, per megawatt of installed capacity, of CECO is larger than the one produced by the offshore wind turbine (Table 7). This fact is especially noticeable during the winter months (Figure 9). It is noteworthy to point out that the annual performance of CECO is clearly hindered by the strong seasonal variability in the wave resource in the area of study (Figure 10). Therefore, in locations with a more homogeneous intra-annual wave resource, the performance of CECO could be even better. In terms of LCoE, the values obtained for the stand-alone CECO farm are aligned with the trends observed for the wave energy industry (i.e., approximately ten times higher than traditional renewable sources). Consequently, at its current stage, CECO is not viable from the commercial point of view. Nonetheless, CECO is still at an early stage of development; therefore, the design optimisation of mooring systems, device geometry, PTO configuration and control strategies may result in significant reductions in the associated LCoE. Furthermore, mass production of the CECO device would contribute to decreasing, even more, its associated costs due to the economy-of-scale effect.
On the other hand, the results obtained proved that, in combination with offshore wind farms, CECO could progress more rapidly towards commercialisation. In comparison with the stand-alone CECO farm, the LCoE value obtained for the co-located wave–wind farm (0.115 USD/kWh) is almost three times lower. This value is similar to the LCoE of the offshore wind industry as of five years ago [8]. Therefore, the proposed co-located CECO–wind farm would be on the edge of commercial viability. These results appear even more encouraging when considering that a preliminary layout was used for the CECO farm, since its optimum design is beyond the scope of this work. Furthermore, it is worth noting that the LCoE model [30] was applied without considering any discount method, such as the so-called learning rates, and taking conservative values for parameters, such as inflation, loan, insurance and decommissioning rates. On the other hand, it is important to point out that the cost model developed by Clark et al. (2019) presents certain limitations, which may contribute to uncertainties in the LCoE estimations [30]. Therefore, the results presented in the present work should be taken as a first approximation and a more accurate estimation of the LCoE would require the use of a higher TRL version of CECO and a technology-specific LCoE model. Besides the LCoE reductions observed, the co-location of the wave array would also increase the annual energy output by 19%. However, the presence of the co-located wave array would not contribute to reducing the intra-annal variability of the energy produced by the wind farm. As aforementioned, the power smoothing capacity of the wave farm is hindered by the strong seasonal variations of the wave resource in the area of study (Figure 10). Nonetheless, it is important to point out that the contribution of CECO to power smoothing could be significantly improved by device optimisation and the adoption of control strategies, which may lead to an increase in the energy production for milder wave conditions, consequently reducing the intra-annual power variability. Another aspect that may have influence on the results obtained in terms of power smoothing is the design considered for the wave farm. As indicated in Section 2.2.2, several constraints were considered for its definition, including the use of a single row of devices, with a conservative separation of 330 m, restricted to the sea space allocated for the offshore wind farm. As a result, the layout obtained consisted of 10 CECO units (Figure 5), with an installed capacity of 5 MW, and should be considered as a preliminary design. In this context, the use of an optimised layout with a larger installed capacity could increase the energy output generated for milder wave conditions, consequently resulting in a greater contribution to smooth the power output of the wind farm. However, this fact should be corroborated with future research. Finally, additional benefits could derive from the presence of the co-located wave farm, such as milder wave conditions within the area of the wind farm, which could facilitate accessibility, operation and maintenance tasks.
5. Conclusions
In recent years, the interest in exploiting the energy resource of ocean waves has translated into the development of multiple WEC concepts. However, WEC technology is still in its infancy, with associated LCoE values up to ten times higher than traditional renewable sources, therefore, far from commercial viability. In this context, potential synergies with the offshore wind energy industry could significantly contribute towards the development of a fully fledged wave energy industry. Among them, the share of operational and capital costs and of power output smoothing stands out. On the other hand, offshore wind farms could also benefit from the sheltering effect of co-located wave farms, mitigating harsh wave conditions within the farm, consequently facilitating operation and maintenance tasks. On these grounds, the objective of this work is to assess the potential benefits of co-locating the CECO device, a promising WEC concept that uses a sloped PTO configuration to harness both the kinetic and potential energy of the waves, with the commercial WindFloat Atlantic offshore wind farm.
Overall, CECO presents promising results in terms of energy production (per megawatt of installed capacity), outperforming the offshore wind turbine, especially during the winter months. However, CECO is still far from commercial feasibility, presenting an associated LCoE of 0.347 USD/kWh, which is approximately 4 and 7 times higher than the values of the offshore and onshore wind industries, respectively. In consequence, significant design refinement dealing with mooring systems, device geometry, PTO configuration and control strategies must be conducted to reduce the associated LCoE of CECO. Furthermore, the results show that the co-location with offshore wind farms could facilitate the transition of CECO towards commercialisation. In this sense, the LCoE obtained for the co-located CECO-wind farm was 0.115 USD/kWh, which is almost three times lower than the value of stand-alone CECO wave farms and similar to the levels of the offshore wind industry as of five years ago. Finally, the expected know-how acquired from the offshore energy industry could also help to improve the efficiency of transport, deployment, operational and maintenance tasks of CECO farms.
In summary, the results presented in this paper highlight the benefits of co-locating the CECO device with an offshore wind farm. In addition, this study presents a benchmark to compare, in the same sea space, the performance of a WEC technology with a commercial offshore wind turbine. Lastly, it is worth mentioning that additional aspects of the CECO farm, including its optimum layout, associated shadow effects and impact on temporal windows for operation and maintenance tasks, are beyond the scope of this paper; therefore, they are to be addressed in detail in future research.
Author Contributions
Conceptualization, V.R., G.G., T.C.-C., M.L., P.R.-S. and F.T.-P.; methodology, V.R., G.G., T.C.-C., M.L., P.R.-S. and F.T.-P.; software, V.R., G.G. and M.L.; resources, V.R.; writing—original draft preparation, V.R.; writing—review and editing, V.R., G.G., T.C.-C., M.L., P.R.-S. and F.T-P.; funding acquisition, V.R., M.L., P.R.-S. and F.T.-P. All authors have read and agreed to the published version of the manuscript.
Funding
This research study was partially funded by the Ports Towards Energy Self-Sufficiency (PORTOS) project co-financed by the Interreg Atlantic Area Programme through the European Regional Development Fund, grant number EAPA-784/2018. Furthermore, during this research study, Victor Ramos was supported by the program of Stimulus of Scientific Employment Individual Support (CEECIND/03665/2018) from the Portuguese Foundation of Science and Technology (FCT).
Institutional Review Board Statement
Not applicable.
Informed Consent Statement
Not applicable.
Data Availability Statement
Not applicable.
Acknowledgments
The authors would like to thank the Spanish Port Authority (Puertos del Estado) for providing the wind and wave datasets required for the elaboration of the present work.
Conflicts of Interest
The authors declare no conflict of interest.
Abbreviations
The following abbreviations are used in this manuscript:
| EU | European Union |
| MRE | Marine renewable energy |
| WEC | Wave energy converter |
| LCoE | Levelised cost of energy |
| NAO | North atlantic oscillation |
| PTO | Power take-off |
| LLM | Lateral mobile module |
| TRL | Technology readiness level |
References
- United Nations. Adoption of the Paris Agreement. United Nations Framework Convention on Climate Change (UNFCCC); United Nations: San Francisco, CA, USA, 2015. [Google Scholar]
- United Nations. Transforming Our World, the 2030 Agenda for Sustainable Development; United Nations: San Francisco, CA, USA, 2015. [Google Scholar]
- Maris, G.; Flouros, F. The Green Deal, National Energy and Climate Plans in Europe: Member States Compliance and Strategies. Adm. Sci. 2021, 11, 75. [Google Scholar] [CrossRef]
- Melikoglu, M. Current status and future of ocean energy sources: A global review. Ocean. Eng. 2018, 148, 563–573. [Google Scholar] [CrossRef]
- Ocean Energy Forum. European Commission. Ocean Energy Strategic Roadmap. Building Ocean Eenergy for Europe. 2016. Available online: https://webgate.ec.europa.eu/maritimeforum/en/node/3962 (accessed on 22 January 2018).
- Perez-Collazo, C.; Greaves, D.; Iglesias, G. A review of combined wave and offshore wind energy. Renew. Sustain. Energy Rev. 2015, 42, 141–153. [Google Scholar] [CrossRef] [Green Version]
- Global Wind Energy Council, GWEC. Global Wind Report 2021. Available online: https://gwec.net/wp-content/uploads/2021/03/GWEC-Global-Wind-Report-2021.pdf (accessed on 10 November 2021).
- International Renewable Energy Agency (IRENA). Renewable Capacity Statistics 2021. Available online: https://www.irena.org/publications/2021/March/Renewable-Capacity-Statistics-2021 (accessed on 10 November 2021).
- De Castro, M.; Salvador, S.; Gómez-Gesteira, M.; Costoya, X.; Carvalho, D.; Sanz-Larruga, F.; Gimeno, L. Europe, China and the United States: Three different approaches to the development of offshore wind energy. Renew. Sustain. Energy Rev. 2019, 109, 55–70. [Google Scholar] [CrossRef]
- International Renewable Energy Agency (IRENA). Renewable Power Generation Costs in 2020. Available online: https://www.irena.org/publications/2021/Jun/Renewable-Power-Costs-in-2020 (accessed on 10 November 2021).
- International Renewable Energy Agency (IRENA). Floating Foundations: A Game Changer for Offshore Wind. Available online: https://www.irena.org/publications/2016/Dec/Floating-foundations-A-game-changer-for-offshore-wind (accessed on 10 November 2021).
- Martinez, A.; Iglesias, G. Wave exploitability index and wave resource classification. Renew. Sustain. Energy Rev. 2020, 134, 110393. [Google Scholar] [CrossRef]
- López, I.; Andreu, J.; Ceballos, S.; de Alegría, I.M.; Kortabarria, I. Review of wave energy technologies and the necessary power-equipment. Renew. Sustain. Energy Rev. 2013, 27, 413–434. [Google Scholar] [CrossRef]
- Todalshaug, J.H.; Ásgeirsson, G.S.; Hjálmarsson, E.; Maillet, J.; Möller, P.; Pires, P.; Guérinel, M.; Lopes, M. Tank testing of an inherently phase-controlled wave energy converter. Int. J. Mar. Energy 2016, 15, 68–84. [Google Scholar] [CrossRef]
- Giannini, G.; Day, S.; Rosa-Santos, P.; Taveira-Pinto, F. A Novel 2-D Point Absorber Numerical Modelling Method. Inventions 2021, 6, 75. [Google Scholar] [CrossRef]
- Kofoed, J.P.; Frigaard, P.; Friis-Madsen, E.; Sørensen, H.C. Prototype testing of the wave energy converter wave dragon. Renew. Energy 2006, 31, 181–189. [Google Scholar] [CrossRef] [Green Version]
- Fernandez, H.; Iglesias, G.; Carballo, R.; Castro, A.; Fraguela, J.; Taveira-Pinto, F.; Sanchez, M. The new wave energy converter WaveCat: Concept and laboratory tests. Mar. Struct. 2012, 29, 58–70. [Google Scholar] [CrossRef]
- Heath, T. A review of oscillating water columns. Philos. Trans. R. Soc. Math. Phys. Eng. Sci. 2012, 370, 235–245. [Google Scholar] [CrossRef] [PubMed] [Green Version]
- Calheiros-Cabral, T.; Clemente, D.; Rosa-Santos, P.; Taveira-Pinto, F.; Ramos, V.; Morais, T.; Cestaro, H. Evaluation of the annual electricity production of a hybrid breakwater-integrated wave energy converter. Energy 2020, 213, 118845. [Google Scholar] [CrossRef]
- Henderson, R. Design, simulation, and testing of a novel hydraulic power take-off system for the Pelamis wave energy converter. Renew. Energy 2006, 31, 271–283. [Google Scholar] [CrossRef]
- Wave energy device Oyster launched. Renew. Energy Focus 2009, 10, 14. [CrossRef]
- Carnegie Clean Energy. CETO Technology. Available online: https://www.carnegiece.com/ceto-technology/ (accessed on 22 January 2020).
- Aderinto, T.; Li, H. Ocean Wave Energy Converters: Status and Challenges. Energies 2018, 11, 1250. [Google Scholar] [CrossRef] [Green Version]
- European Commission. Working Group Ocean Energy. SET-Plan Ocean Energy Implementation Plan. 2018. Available online: https://setis.ec.europa.eu/system/files/set_plan_ocean_implementation_plan.pdf (accessed on 12 September 2020).
- Choupin, O.; Pinheiro Andutta, F.; Etemad-Shahidi, A.; Tomlinson, R. A decision-making process for wave energy converter and location pairing. Renew. Sustain. Energy Rev. 2021, 147, 111225. [Google Scholar] [CrossRef]
- Astariz, S.; Iglesias, G. Enhancing Wave Energy Competitiveness through Co-Located Wind and Wave Energy Farms. A Review on the Shadow Effect. Energies 2015, 8, 7344–7366. [Google Scholar] [CrossRef]
- Astariz, S.; Iglesias, G. The economics of wave energy: A review. Renew. Sustain. Energy Rev. 2015, 45, 397–408. [Google Scholar] [CrossRef]
- Astariz, S.; Perez-Collazo, C.; Abanades, J.; Iglesias, G. Co-located wind-wave farm synergies (Operation & Maintenance): A case study. Energy Convers. Manag. 2015, 91, 63–75. [Google Scholar] [CrossRef]
- Astariz, S.; Perez-Collazo, C.; Abanades, J.; Iglesias, G. Co-located wave-wind farms: Economic assessment as a function of layout. Renew. Energy 2015, 83, 837–849. [Google Scholar] [CrossRef]
- Clark, C.E.; Miller, A.; DuPont, B. An analytical cost model for co-located floating wind-wave energy arrays. Renew. Energy 2019, 132, 885–897. [Google Scholar] [CrossRef]
- Astariz, S.; Abanades, J.; Perez-Collazo, C.; Iglesias, G. Improving wind farm accessibility for operation & maintenance through a co-located wave farm: Influence of layout and wave climate. Energy Convers. Manag. 2015, 95, 229–241. [Google Scholar] [CrossRef]
- Astariz, S.; Iglesias, G. Co-located wind and wave energy farms: Uniformly distributed arrays. Energy 2016, 113, 497–508. [Google Scholar] [CrossRef] [Green Version]
- Astariz, S.; Iglesias, G. Selecting optimum locations for co-located wave and wind energy farms. Part II: A case study. Energy Convers. Manag. 2016, 122, 599–608. [Google Scholar] [CrossRef] [Green Version]
- Stoutenburg, E.D.; Jenkins, N.; Jacobson, M.Z. Power output variations of co-located offshore wind turbines and wave energy converters in California. Renew. Energy 2010, 35, 2781–2791. [Google Scholar] [CrossRef]
- Fusco, F.; Nolan, G.; Ringwood, J.V. Variability reduction through optimal combination of wind/wave resources—An Irish case study. Energy 2010, 35, 314–325. [Google Scholar] [CrossRef] [Green Version]
- Cradden, L.; Mouslim, H.; Duperray, O.; Ingram, D. Joint exploitation of wave and offshore wind power. In Proceedings of the Nineth European Wave and Tidal Energy Conference (EWTEC), Southampton, UK, 7 September 2011; pp. 5–9. [Google Scholar]
- Astariz, S.; Iglesias, G. Output power smoothing and reduced downtime period by combined wind and wave energy farms. Energy 2016, 97, 69–81. [Google Scholar] [CrossRef]
- Gaughan, E.; Fitzgerald, B. An assessment of the potential for Co-located offshore wind and wave farms in Ireland. Energy 2020, 200, 117526. [Google Scholar] [CrossRef]
- Astariz, S.; Iglesias, G. Selecting optimum locations for co-located wave and wind energy farms. Part I: The Co-Location Feasibility index. Energy Convers. Manag. 2016, 122, 589–598. [Google Scholar] [CrossRef] [Green Version]
- Astariz, S.; Vazquez, A.; Sánchez, M.; Carballo, R.; Iglesias, G. Co-located wave-wind farms for improved O&M efficiency. Ocean. Coast. Manag. 2018, 163, 66–71. [Google Scholar] [CrossRef]
- Astariz, S.; Iglesias, G. Accessibility for operation and maintenance tasks in co-located wind and wave energy farms with non-uniformly distributed arrays. Energy Convers. Manag. 2015, 106, 1219–1229. [Google Scholar] [CrossRef]
- Ramos, V.; López, M.; Taveira-Pinto, F.; Rosa-Santos, P. Performance assessment of the CECO wave energy converter: Water depth influence. Renew. Energy 2018, 117, 341–356. [Google Scholar] [CrossRef]
- Rosa-Santos, P.; Taveira-Pinto, F.; Rodríguez, C.A.; Ramos, V.; López, M. The CECO wave energy converter: Recent developments. Renew. Energy 2019, 139, 368–384. [Google Scholar] [CrossRef]
- EDP Renewables. WindFloat Atlantic Project. 2019. Available online: https://www.edpr.com/en/news/2019/10/21/windfloat-atlantic-begins-installation-first-floating-wind-farm (accessed on 20 January 2020).
- Salvação, N.; Soares, C.G. Wind resource assessment offshore the Atlantic Iberian coast with the WRF model. Energy 2018, 145, 276–287. [Google Scholar] [CrossRef]
- Ramos, V.; López, M.; Taveira-Pinto, F.; Rosa-Santos, P. Influence of the wave climate seasonality on the performance of a wave energy converter: A case study. Energy 2017, 135, 303–316. [Google Scholar] [CrossRef]
- EDP Renewables. WindFloat Atlantic Project. 2019. Available online: https://www.edpr.com/en/news/2019/12/30/second-platform-windfloatatlantic-has-set-port-ferrol (accessed on 11 October 2021).
- Silva, D.; Martinho, P.; Guedes Soares, C. Wave energy distribution along the Portuguese continental coast based on a thirty three years hindcast. Renew. Energy 2018, 127, 1064–1075. [Google Scholar] [CrossRef]
- Rosa-Santos, P.; Taveira-Pinto, F.; Teixeira, L.; Ribeiro, J. CECO wave energy converter: Experimental proof of concept. J. Renew. Sustain. Energy 2015, 7, 061704. [Google Scholar] [CrossRef]
- Rosa-Santos, P.; Taveira-Pinto, F.; Pinho-Ribeiro, J.; Teixeira, L.; Marinheiro, J. Harnessing the kinetic and potential wave energy: Design and development of a new wave energy converter. In Renewable Energies Offshore; CRC Press: Boca Raton, FL, USA, 2015; pp. 367–374. [Google Scholar]
- López, M.; Taveira-Pinto, F.; Rosa-Santos, P. Numerical modelling of the CECO wave energy converter. Renew. Energy 2017, 113, 202–210. [Google Scholar] [CrossRef]
- Rodríguez, C.A.; Rosa-Santos, P.; Taveira-Pinto, F. Hydrodynamic optimization of the geometry of a sloped-motion wave energy converter. Ocean. Eng. 2020, 199, 107046. [Google Scholar] [CrossRef]
- Giannini, G.; López, M.; Ramos, V.; Rodríguez, C.A.; Rosa-Santos, P.; Taveira-Pinto, F. Geometry assessment of a sloped type wave energy converter. Renew. Energy 2021, 171, 672–686. [Google Scholar] [CrossRef]
- Rodríguez, C.A.; Rosa-Santos, P.; Taveira-Pinto, F. Assessment of damping coefficients of power take-off systems of wave energy converters: A hybrid approach. Energy 2019, 169, 1022–1038. [Google Scholar] [CrossRef]
- López, M.; Ramos, V.; Rosa-Santos, P.; Taveira-Pinto, F. Effects of the PTO inclination on the performance of the CECO wave energy converter. Mar. Struct. 2018, 61, 452–466. [Google Scholar] [CrossRef]
- Giannini, G.; Rosa-Santos, P.; Ramos, V.; Taveira-Pinto, F. On the Development of an Offshore Version of the CECO Wave Energy Converter. Energies 2020, 13, 1036. [Google Scholar] [CrossRef] [Green Version]
- REVE News of the Wind Sector in Spain and in the World. Floating Wind Energy: First Wind Turbine of WindFloat Atlantic Moves Into Position. 2019. Available online: https://www.evwind.es/2019/10/22/floating-wind-energy-first-wind-turbine-of-windfloat-atlantic-moves-into-position/71445 (accessed on 11 October 2021).
- Principle Power Inc. The WindFloat Advantage. 2019. Available online: https://www.principlepower.com/windfloat/the-windfloat-advantage (accessed on 11 October 2021).
- EDP Renewables. WindFloat Atlantic Project. 2021. Available online: https://www.edpr.com/en/innovation (accessed on 11 October 2021).
- Vestas V164-8.0 MW Technical Specifcations. 2021. Available online: https://pdf.archiexpo.com/pdf/vestas/vestas-v164-80-mw/88087-134417.html (accessed on 11 October 2021).
- Astariz, S.; Perez-Collazo, C.; Abanades, J.; Iglesias, G. Towards the optimal design of a co-located wind-wave farm. Energy 2015, 84, 15–24. [Google Scholar] [CrossRef]
- López, M.; Rodríguez, N.; Iglesias, G. Combined Floating Offshore Wind and Solar PV. J. Mar. Sci. Eng. 2020, 8, 576. [Google Scholar] [CrossRef]
- Puertos del Estado. SIMAR Dataset. 2020. Available online: https://bancodatos.puertos.es//BD/informes/INT_8.pdf (accessed on 11 October 2021).
- Myhr, A.; Bjerkseter, C.; Ågotnes, A.; Nygaard, T.A. Levelised cost of energy for offshore floating wind turbines in a lifeăcycle perspective. Renew. Energy 2014, 66, 714–728. [Google Scholar] [CrossRef] [Green Version]
- EDP Renewables. WindFloat Atlantic Project. 2021. Available online: https://www.edpr.com/en/news/2021/09/23/windfloat-atlantic-reaches-75-gwh-its-first-year-operation (accessed on 11 October 2021).
- Kausche, M.; Adam, F.; Dahlhaus, F.; Großmann, J. Floating offshore wind—Economic and ecological challenges of a TLP solution. Renew. Energy 2018, 126, 270–280. [Google Scholar] [CrossRef]
- Lerch, M.; De-Prada-Gil, M.; Molins, C.; Benveniste, G. Sensitivity analysis on the levelized cost of energy for floating offshore wind farms. Sustain. Energy Technol. Assessments 2018, 30, 77–90. [Google Scholar] [CrossRef]

Publisher’s Note: MDPI stays neutral with regard to jurisdictional claims in published maps and institutional affiliations. |
© 2022 by the authors. Licensee MDPI, Basel, Switzerland. This article is an open access article distributed under the terms and conditions of the Creative Commons Attribution (CC BY) license (https://creativecommons.org/licenses/by/4.0/).