1. Introduction
Wave energy is a kind of marine renewable energy, which has attracted much attention because of its merits of high energy density, being clean and renewable and having great potential for development. It has been explored for nearly 200 years [
1,
2,
3,
4]. For wave energy utilization, the basic principle is to use the wave energy converters (WECs) of various mechanisms to extract the mechanical energy of the wave including the potential energy and the kinetic energy to generate electricity [
5,
6,
7]. At present, varieties of wave energy conversion devices have been developed all over the world, whose principle and structure are simple and convenient for large-scale production, and the energy conversion efficiency of wave energy generation devices is higher than that of other renewable energy sources. Therefore, the use of wave power generation as a means of energy supply in coastal areas has a wide application prospect [
8,
9,
10].
On the basis of the absorption type, WEC can be primarily classified into oscillating water columns (OWCs), overtopping or terminator devices, attenuators, oscillating buoy devices (point absorbers), oscillating wave surge, submerged pressure differential and rotating mass [
11,
12,
13,
14,
15,
16,
17,
18]. Oscillating buoy device is a hot spot in recent years, and it is also the most probable wave device for commercialization. The device absorbs wave energy by means of a cylinder or sphere placed in water as a carrier for energy absorption, depending on the relative motion between the floating body and the device, and then drives the mechanical system or hydraulic system connected with the buoy to run the generator to generate electrical energy [
19,
20,
21,
22]. The key feature of oscillating buoy device is the high energy conversion rate and stable power generation process. The buoy has low production cost and simple construction process [
23]. The oscillating buoy WEC has entered the stage of commercial power generation in developed countries in Europe and America. It was originally a fixed Archimedes Wave Swing (AWS) device developed by Amsterdam Company of the Netherlands. The device was later modified by the British AWS Ocean Energy company into a floating Archimedes power plant. The Power Buoy device developed by OPT (Ocean Power Technologies) in the United States has been successfully tested in the Pacific Ocean and Atlantic Ocean. British Ocean Navitas Limited Company has successfully developed Aegir Dynamo wave generator unit set with a pontoon structure [
24,
25]. In China, Shi [
26], Cheng [
27] and Gou [
28] et al. have independently studied the oscillating buoy devices and conducted sea tests. The performance of a single buoy is always limited. As the scale of power generation increases, it is a trend in this field to combine the buoys and arrange them in an array to coordinate power generation. Therefore, the concept of array optimization is proposed, which uses a group of buoys to form an array to complete the unified extraction and transformation of wave energy. Nielsen [
29], Tokić [
30], Folley [
31], Do [
32], Amini [
33] and Neshat [
34] have carried out in-depth studies on the layout optimization of oscillating buoys.
According to the research status and development trend of the world, the current research on wave power generation is mainly focused on how to effectively promote the specific mechanical design of wave energy conversion devices in the fields of energy transfer and conversion performance and the combined wave energy generation device. The layout optimization, microgrid and other fields have also been studied in depth. To the best of our knowledge, however, there are few research results to improve the performance of wave energy generation by increasing the wave energy density of the target sea area. What is more, in the previous experimental research on wave power generation with oscillating buoys, the traveling waves are the main concerns in wave type, while there is no research on the characteristics of power generation equipment under the condition of fully standing waves or partial standing waves.
Tao [
35] preliminarily studied the behavior of wave energy generation enhancement by Bragg resonance through physical model experiments, that is, through the interaction between incident waves and periodic wavy bottom. Thus, the wave energy density of the target region is increased. The results show that, compared with the wave power generated by the oscillating buoy (point absorption) device on flat bottom, the Bragg resonance energy can cause the power to increase by more than 10 times. By analyzing the reason for the improvement, it is also found that the increase of generation power is not only due to the increase of wave energy density but also to the wave types. This is because when the Bragg resonance occurs, the superposition of incident waves and reflected waves forms standing waves, which causes the motion of water particles under the wave action to change from the approximately closed elliptical trajectory to an approximate straight line, and water particles at the wave antinodes only move up and down vertically. Thus, the stability of the oscillating buoy is enhanced, and the mechanical resonance of oscillating buoy along with water particles could be enhanced, which will affect the generation performance of the WEC.
For further investigation of the effects of wave types on wave energy conversion by oscillating buoy on the basis of previous research above, series wave flume experiments are performed to investigate the effects of different wave types at the same wave height on the performance of wave energy generation. The main wave types considered are traveling waves, partial standing waves and fully standing waves. This study aims to deepen and enrich our understanding about the wave energy generation. It provides the experimental evidence to compare the wave energy conversion response of oscillating buoy devices between travelling waves and standing (fully or partial) wave conditions.
The remainder of this paper is organized as follows. The motion characteristics of water particles under traveling waves, partial standing waves and fully standing waves are briefly described respectively in
Section 2. The experimental design and model layout are presented in
Section 3. Results and discussions are provided in
Section 4. Concluding remarks are summarized in
Section 5.
2. Characteristics of Water Particles Motion of Different Types of Waves
In the Airy wave, the horizontal and vertical displacement of the water particle at (
x0,
z0) under travelling waves can be described as below [
36]:
in which,
A is the wave amplitude of travelling wave.
k is the wave number and
h is the water depth.
is the circular frequency.
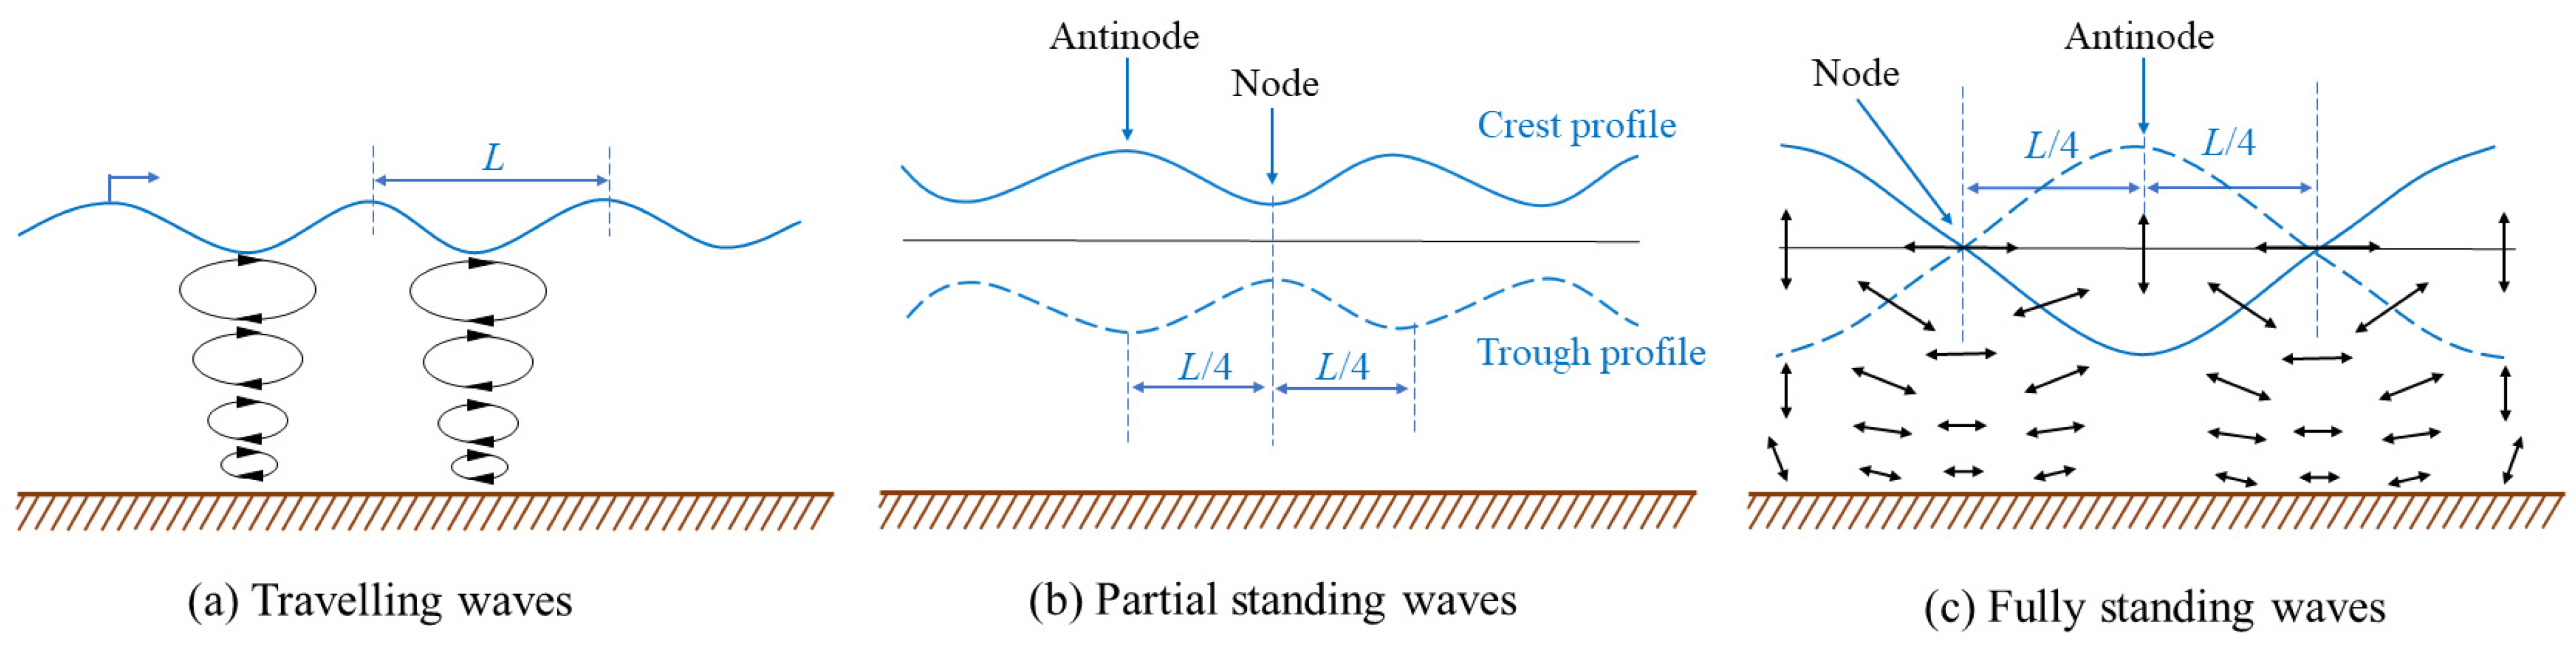
It is evident that the particle orbit of traveling waves is a closed ellipse (circle in deep water), which is a combination of both horizontal (amplitude ) and vertical (amplitude ) wave motions. The orbit of the water particle on free surface at any position is the same.
Fully standing waves refer to a kind of wave superimposed when two traveling waves are opposite in direction while same in wave amplitude (expressed still as
A) and wave period, the horizontal and vertical displacement of water particle under fully standing waves can be written as [
36]:
It should be noted that the amplitude parameter
A is still the original amplitude of travelling waves of either direction. After the superposition of two opposite travelling wave with same amplitude
A, the values of horizontal and vertical displacements will be doubled compared with the travelling wave component. Furthermore,
and
are dependent on the position (
,
). The motion of water particle is oscillating in the vertical direction at the wave antinodes (
,
) and in the horizontal direction at the wave nodes (
,
). The condition of generating above-mentioned fully standing waves is that traveling waves are directly incident to the vertical wall and completely reflected. The horizontal velocity
u and the vertical velocity
ω of the water particle are [
36]:
Similarly to displacement expressions, at wave antinodes, the horizontal velocity u of water particles is constant to zero, and the amplitude of vertical velocity and water surface fluctuation reaches the maximum. At wave nodes, the horizontal velocity u has the maximum amplitude, while the vertical velocity and the amplitude of the water surface fluctuation are always zero.
When traveling waves are not completely reflected, the superposition of incident and reflected waves is called partial standing waves. Assuming the amplitude of the incident waves is
, the amplitude of the reflected waves
will be less than
, the combination of these two waves gives
The amplitude is at antinodes and is at nodes.
The general sketches of the travelling waves, partial standing waves and fully standing waves are presented in
Figure 1 as below.
It is worth noting that when the incident waves pass through the underwater sinusoidal topography and satisfy the topography wavelength as the integer multiple of half wavelength of the surface wave, it will induce the wave Bragg resonance phenomenon. The incident waves will be reflected and superimposed on the incident waves as partial standing waves.
3. Experimental Design and Model Layout
Based on the existing knowledge of water particles’ motion under different wave types, the buoy’s oscillating motion state will be significantly affected by specified wave types. The trajectories of water particles of traveling waves are closed ellipses. So, there are no differences for the corresponding trajectories of water particles on free surface at any position. By comparison, when the wave field of the flume is composed of standing waves and the oscillating buoy of WEC is arranged in the wave antinodes, because the water particles of standing waves oscillate vertically at the wave antinodes, the buoy is only oscillating vertically under the influence of the water particles. During the experiment, in order to study the effects of different types of waves on the performance of oscillating buoy WEC, traveling waves, fully standing waves and partial standing waves (induced by Bragg resonance) of the same wave height were generated in the wave flume, respectively. In other words, on the basis of the calibration stage, the wave heights in the travelling wave cases are kept identical to the wave height values at the antinodes in the corresponding partial and fully standing waves’ cases. Furthermore, the generating power of the device was compared and analyzed.
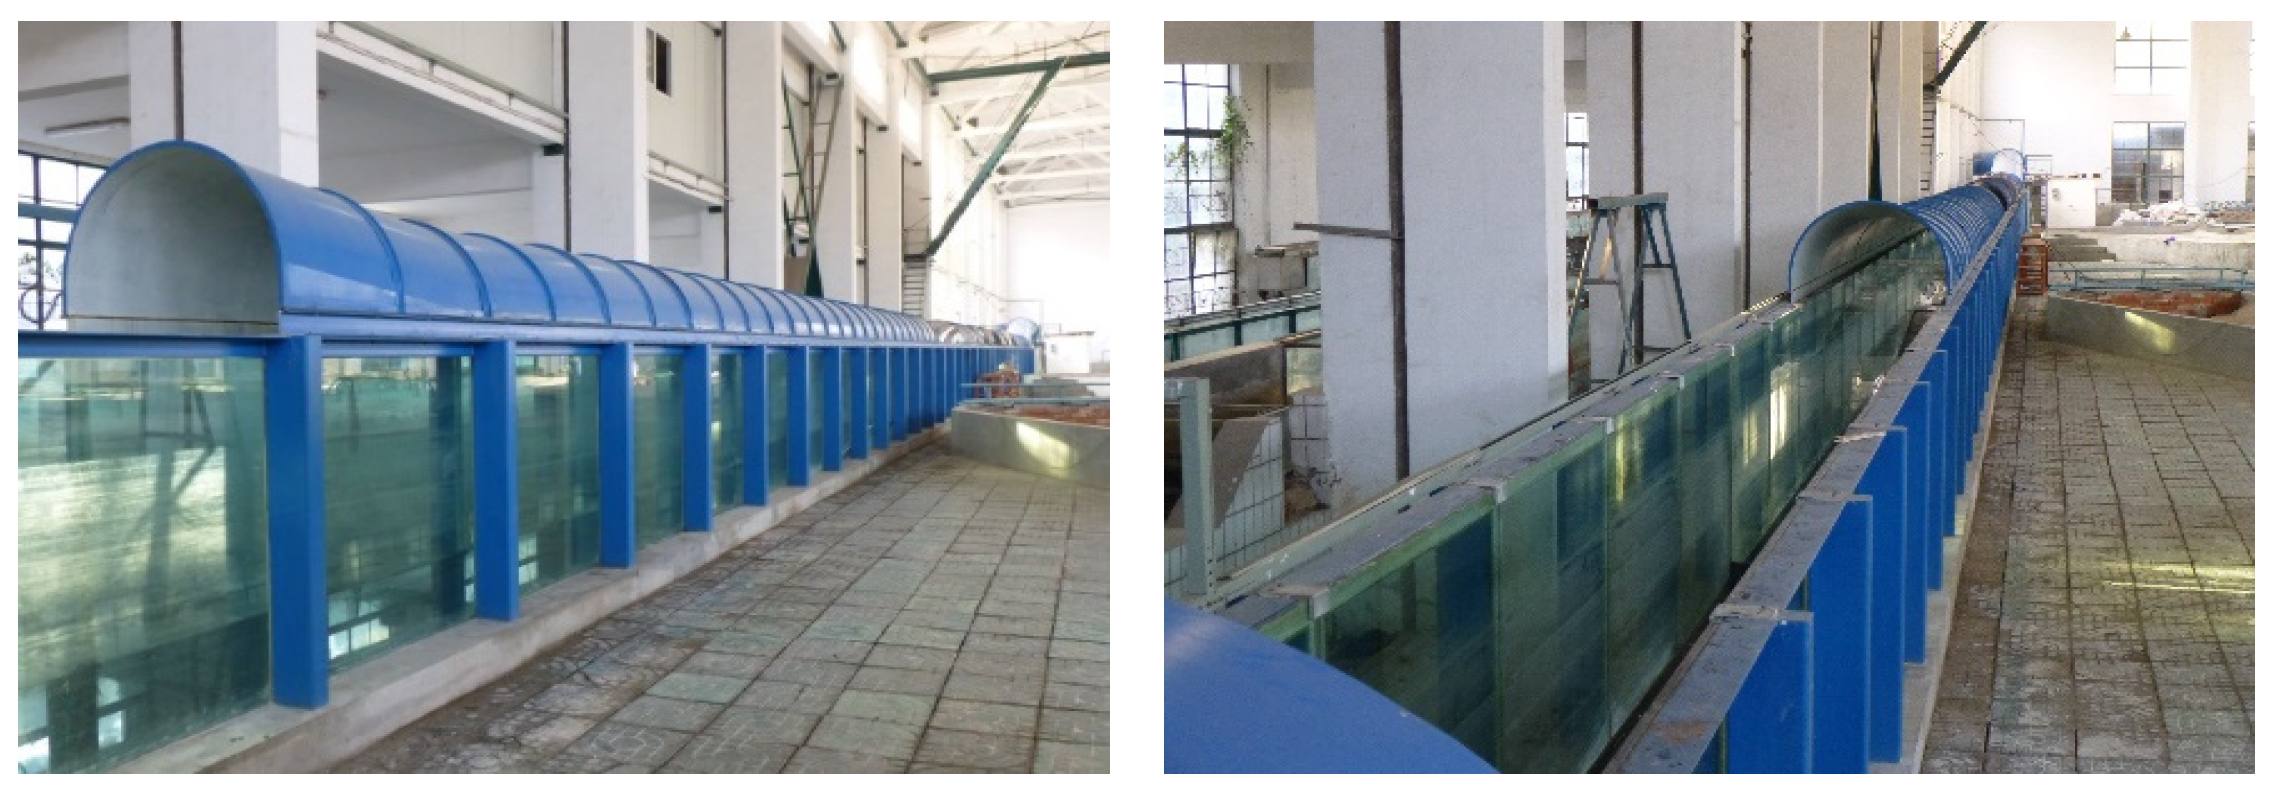
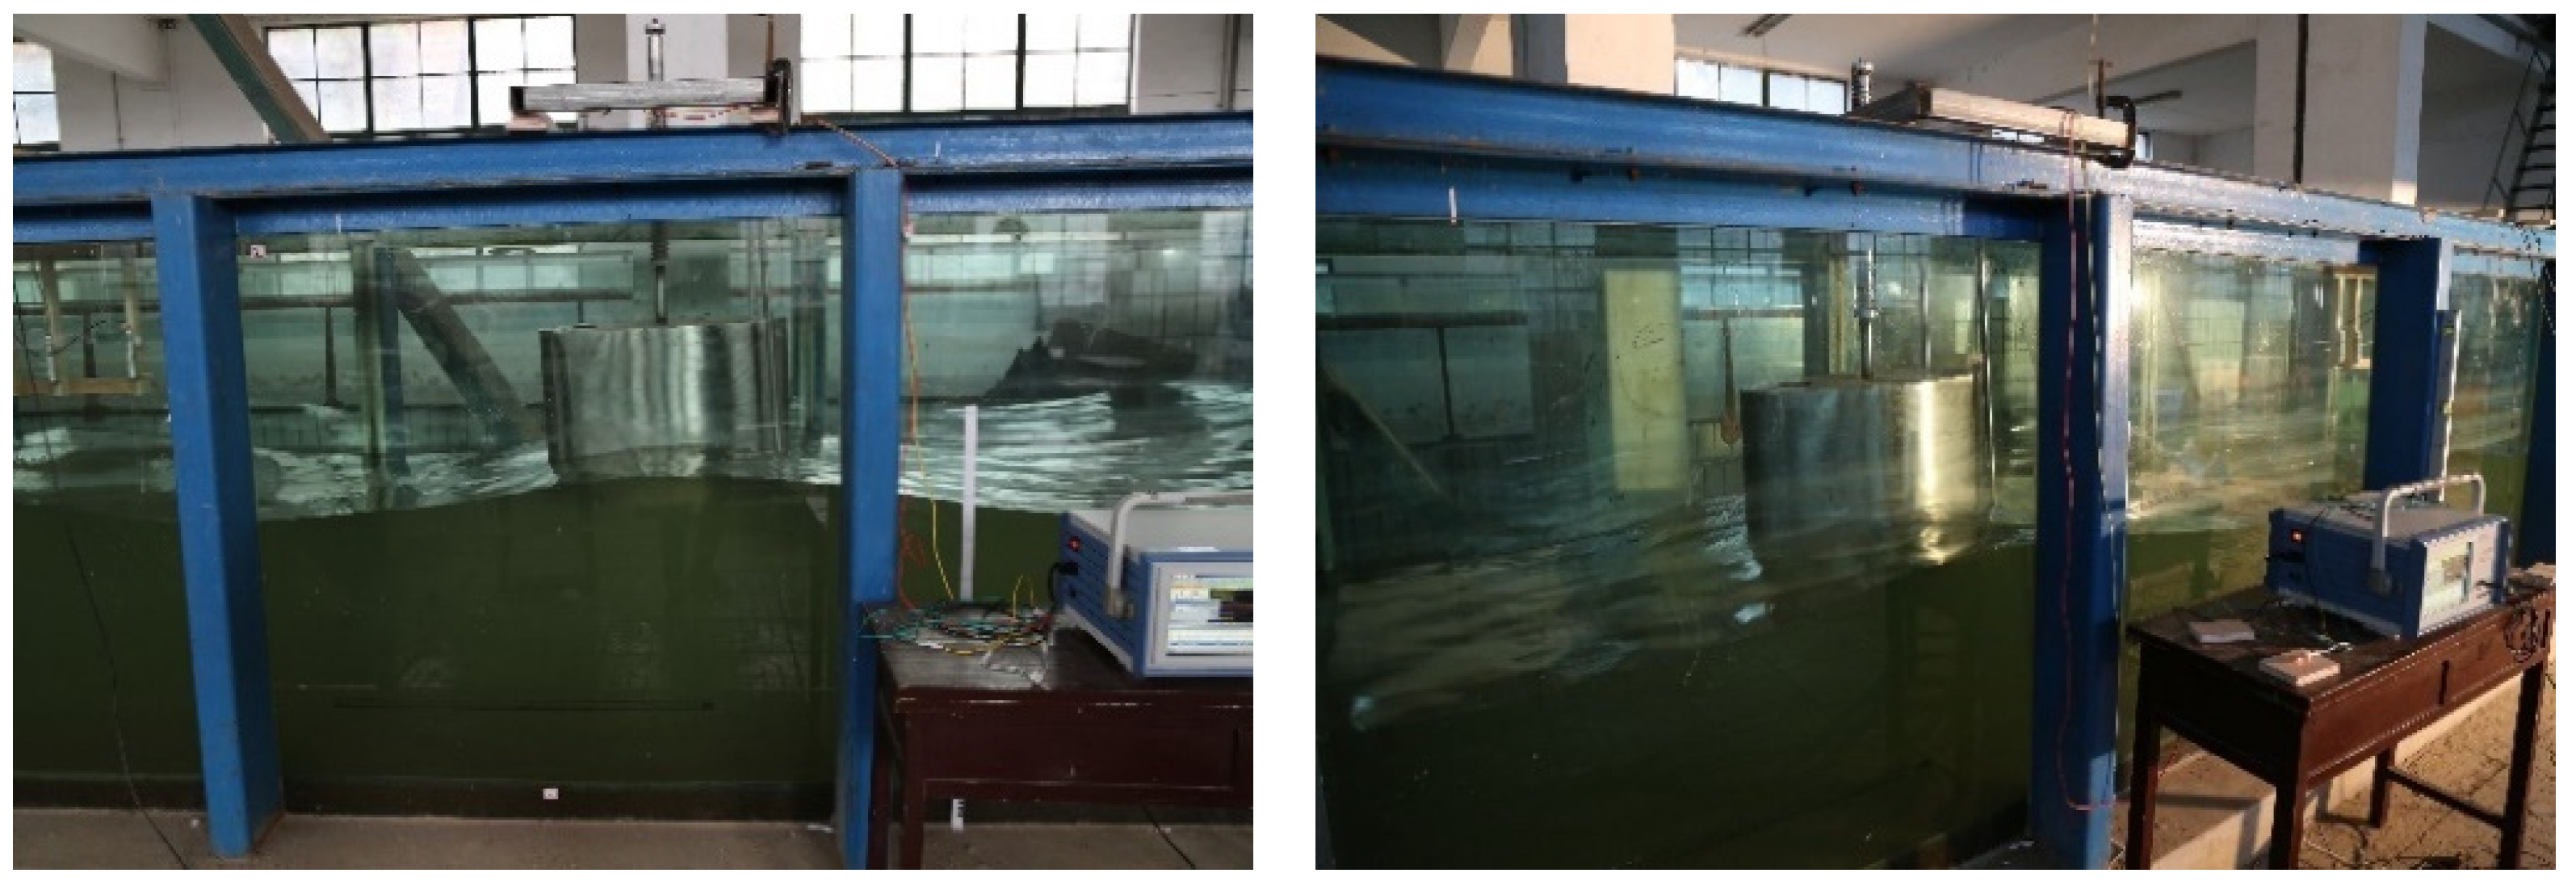
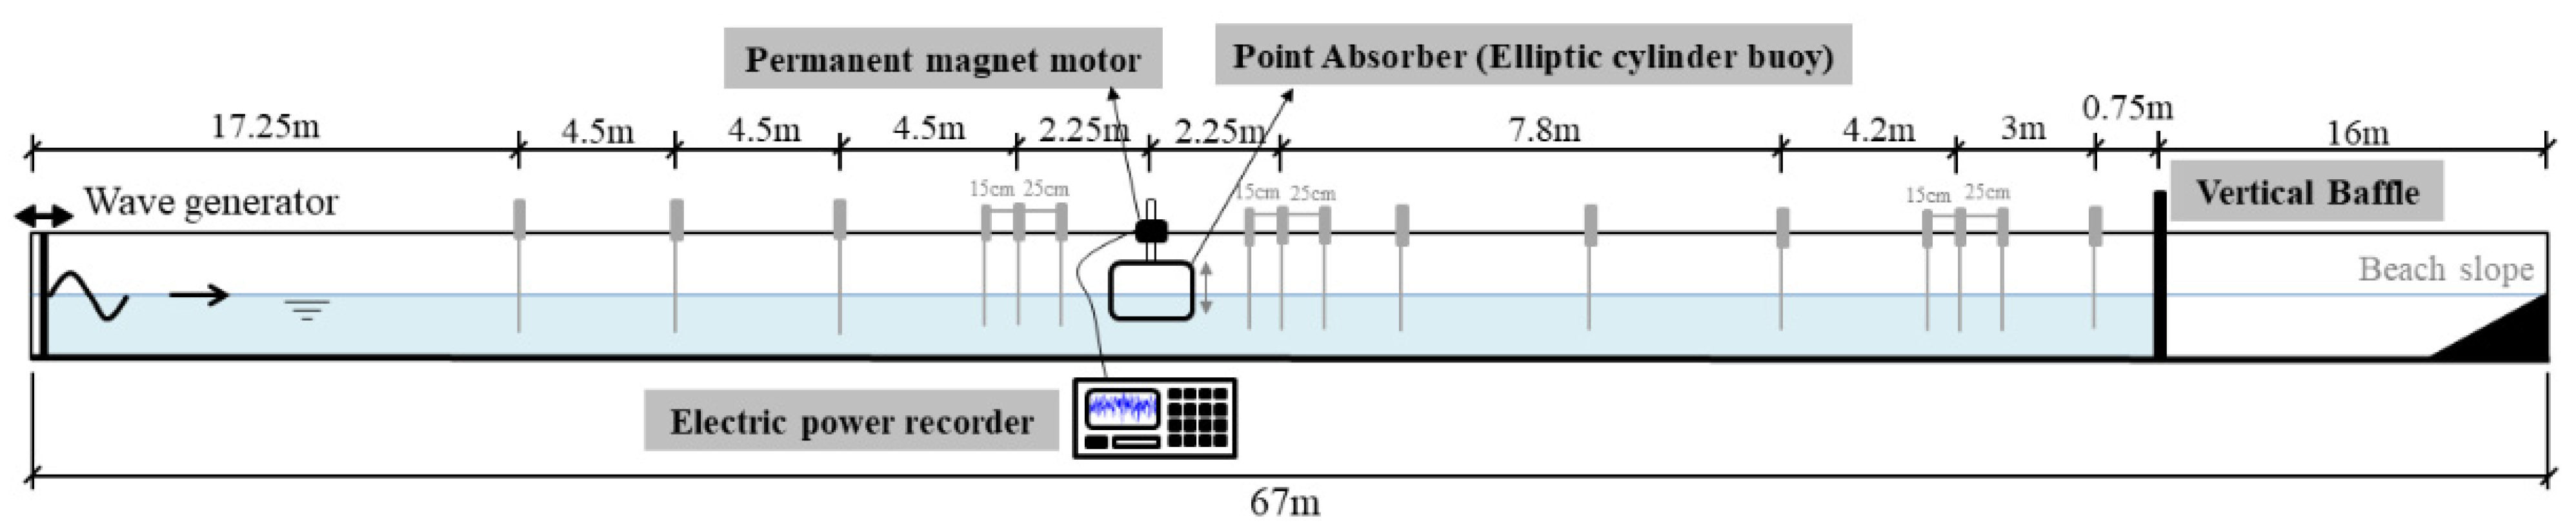
The experiment was carried out in the flume of Estuary Waterway Experiment Hall of Hohai University, which is 67 m long, 1 m wide and 1.5 m deep (
Figure 2). The front end of the flume was equipped with a plate-type wave maker, which can stably generate waves corresponding to various operating conditions required for the experiment. The back end of the flume was installed with the rubble slope, which can effectively dissipate the effects of wave reflection. Along the flume, 16 wave probes were arranged to measure the wave field in the flume primarily for the calibration of wave parameters and corresponding wave field status in flume.
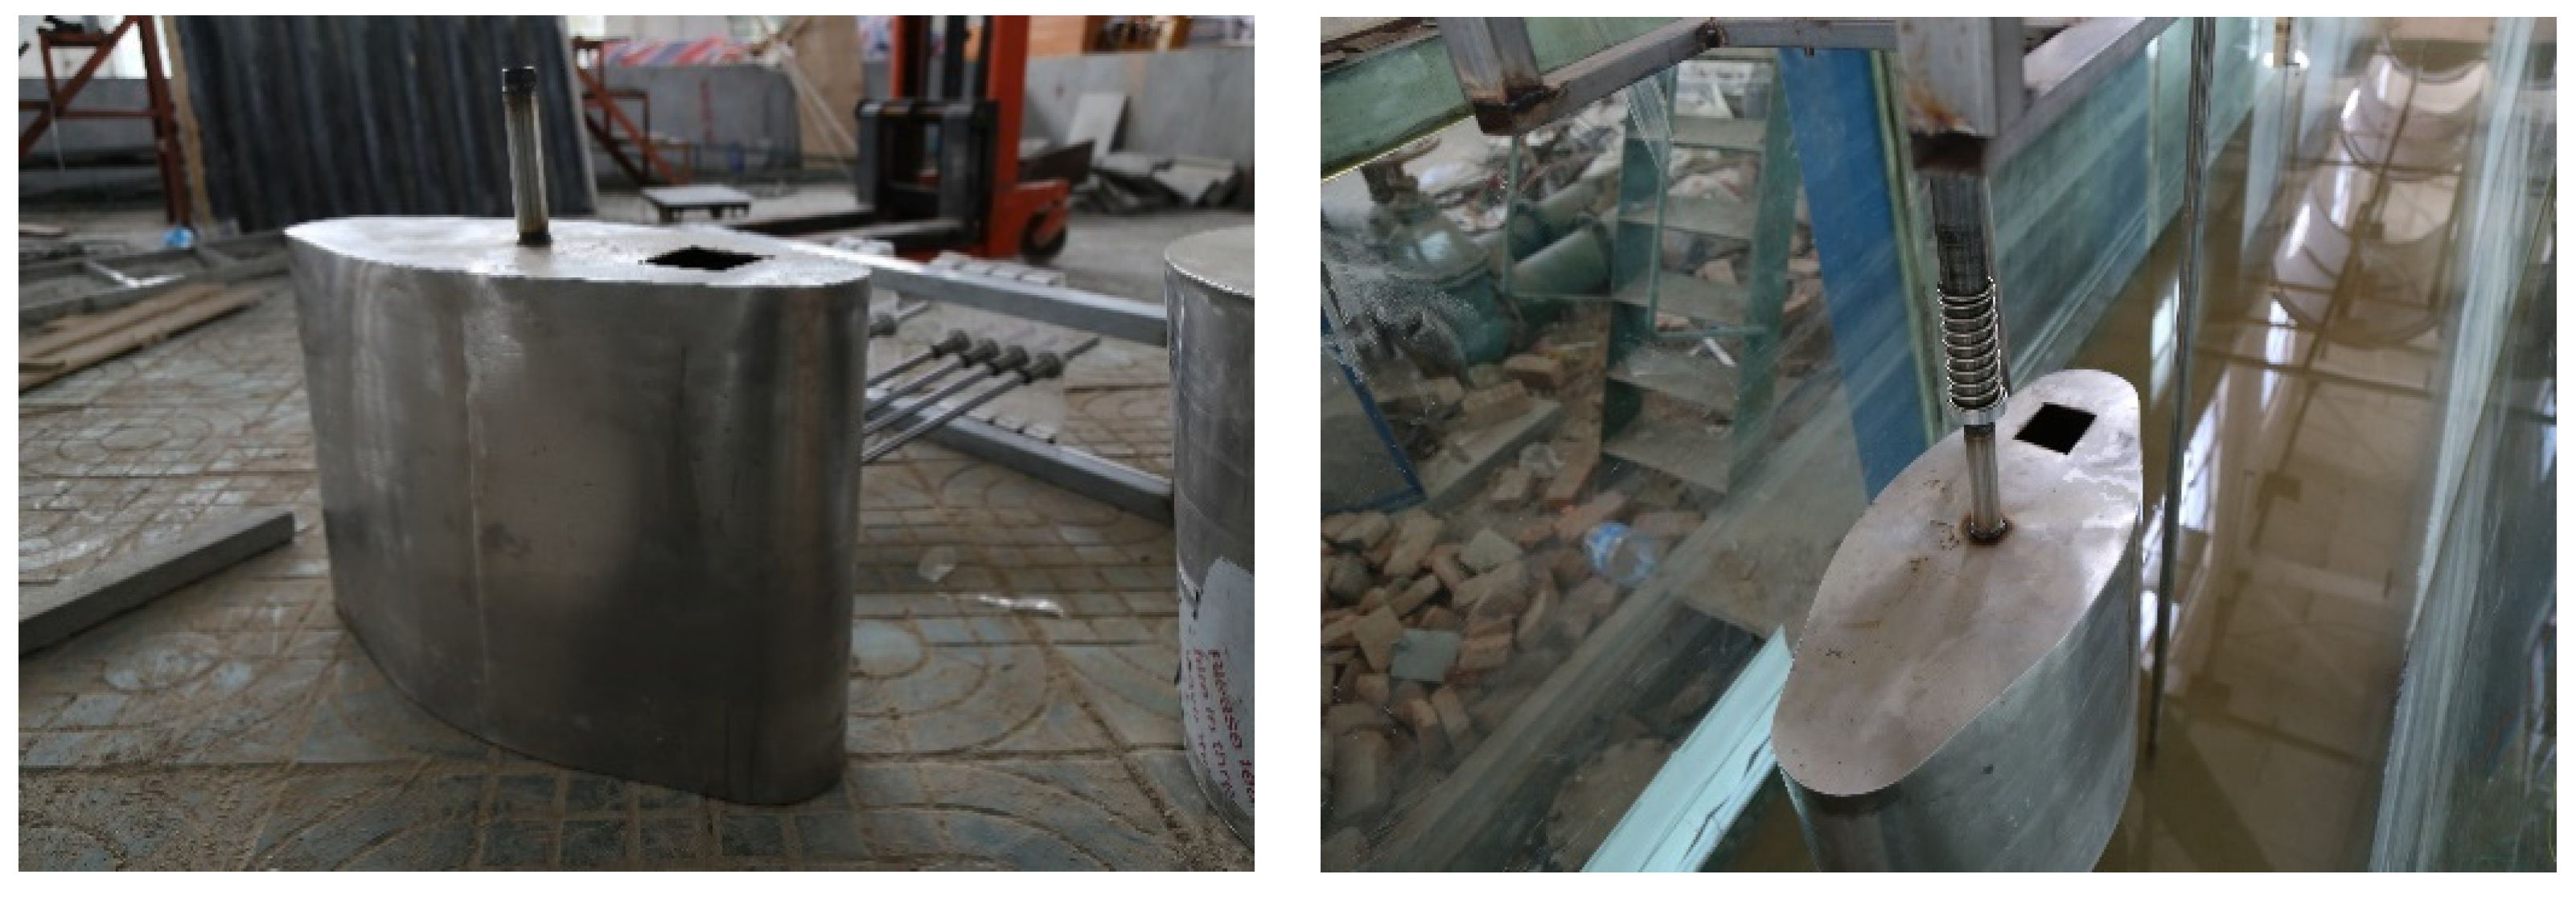
For wave energy conversion, a buoy was made by a hollow steel buoy of elliptical cylinder (
Figure 3), which was installed at the incident side of the wavy bottoms with a distance of 33 m to the wave maker. Its dimensions are: the semi-major axis
Ra = 0.75 m, semi-minor axis
Rb = 0.3 m, height
Hbuoy = 0.45 m, quality
m = 25 kg. The reason for choosing the buoy with an elliptical cross-section was that its minor axis occupies less space of the width of the flume; reflection of incident waves can be reduced to obtain a stabler wave field.
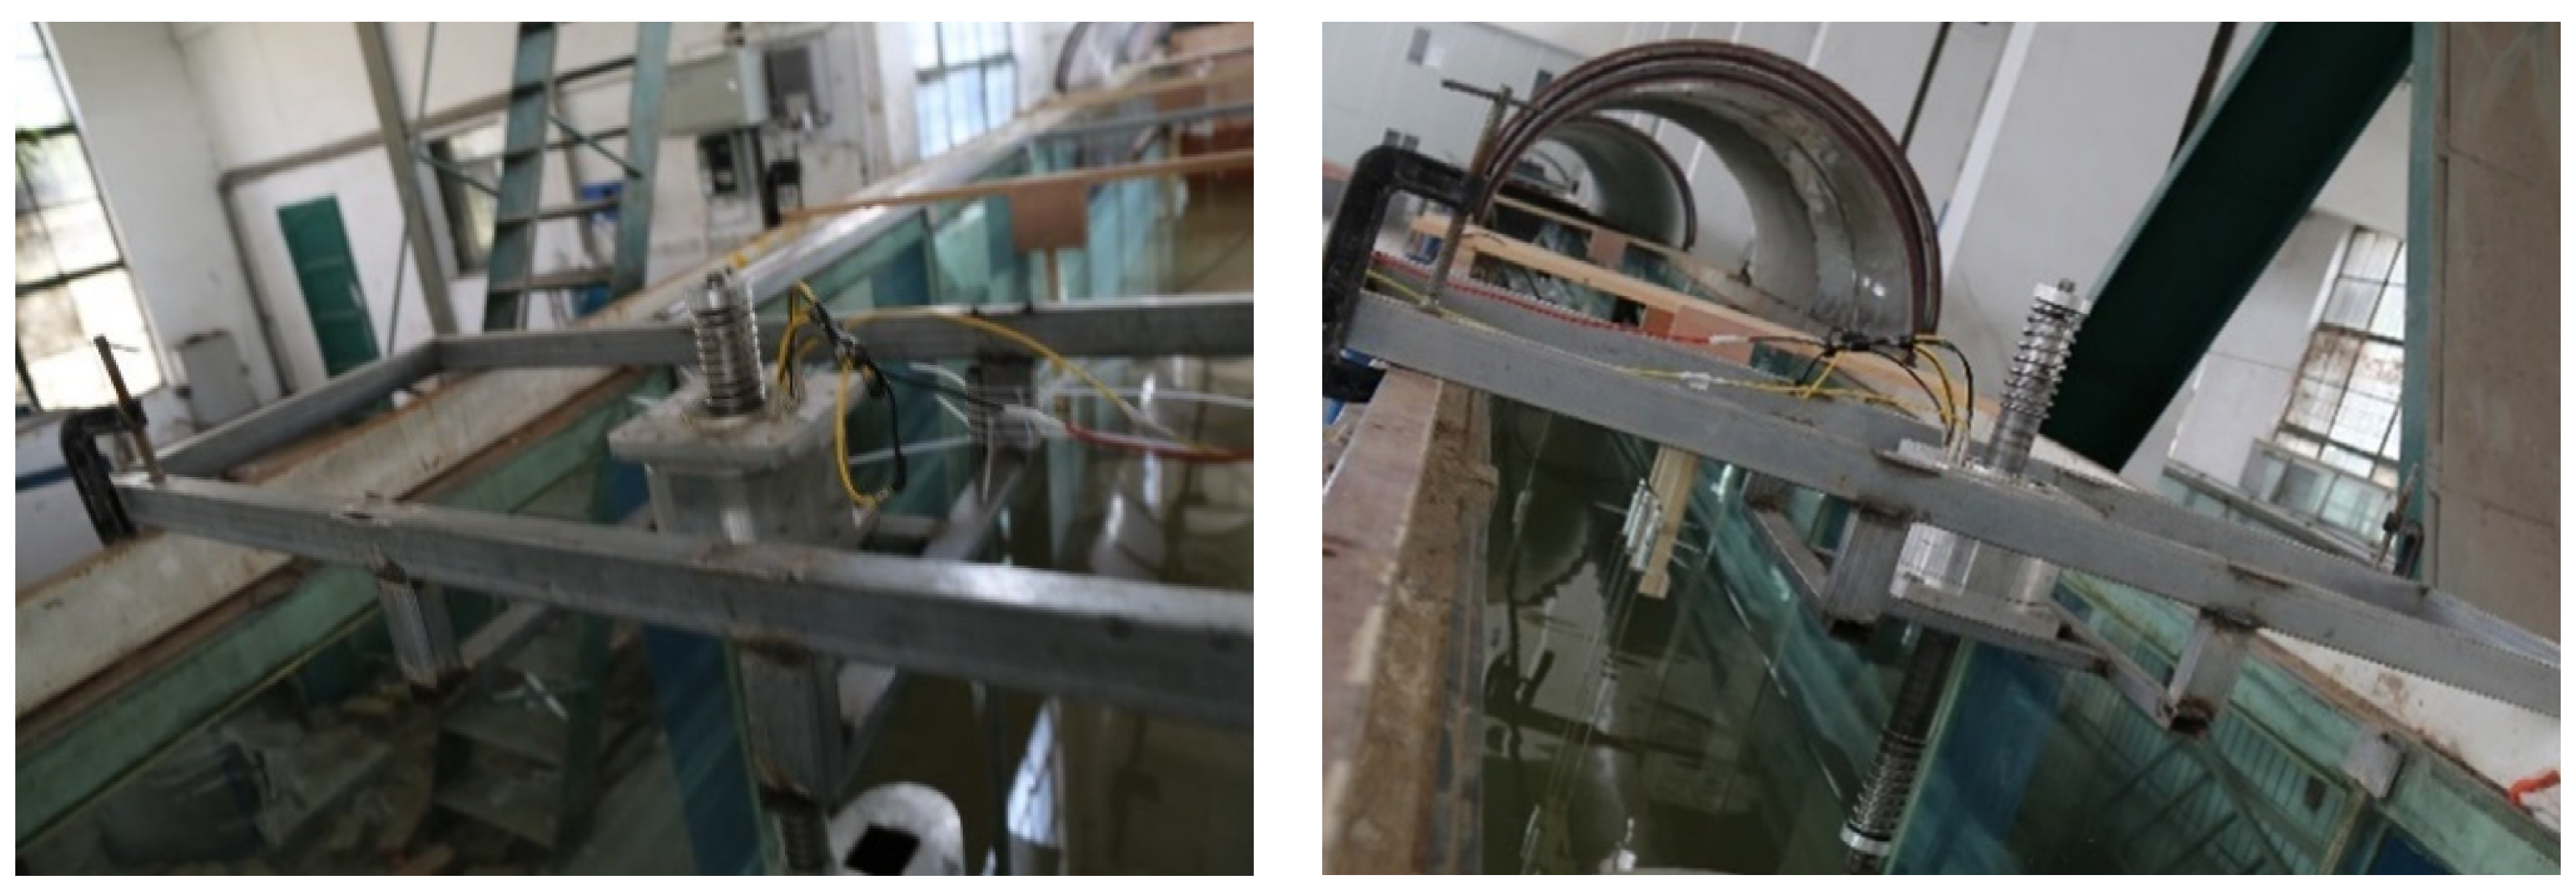
The buoy adopted permanent magnet single phase linear motor which was arranged 33 m away from the end of the flume (
Figure 4). The lead wires of the three disk windings of the primary part of the motor (stator) were connected successively in series. A spring structure was installed at the end of the secondary part of the motor (rotor) to adjust its motion length according to the actual wave height. The rotor was connected with an elliptical cylindrical buoy and the buoy floated on the water surface. The stator was fixed on the flume, and the primary winding was connected with the rectifier circuit (including the load bulb and electric power recorder). The detailed information of motor’s performance has been stated by Yu et al. [
37] and Huang et al. [
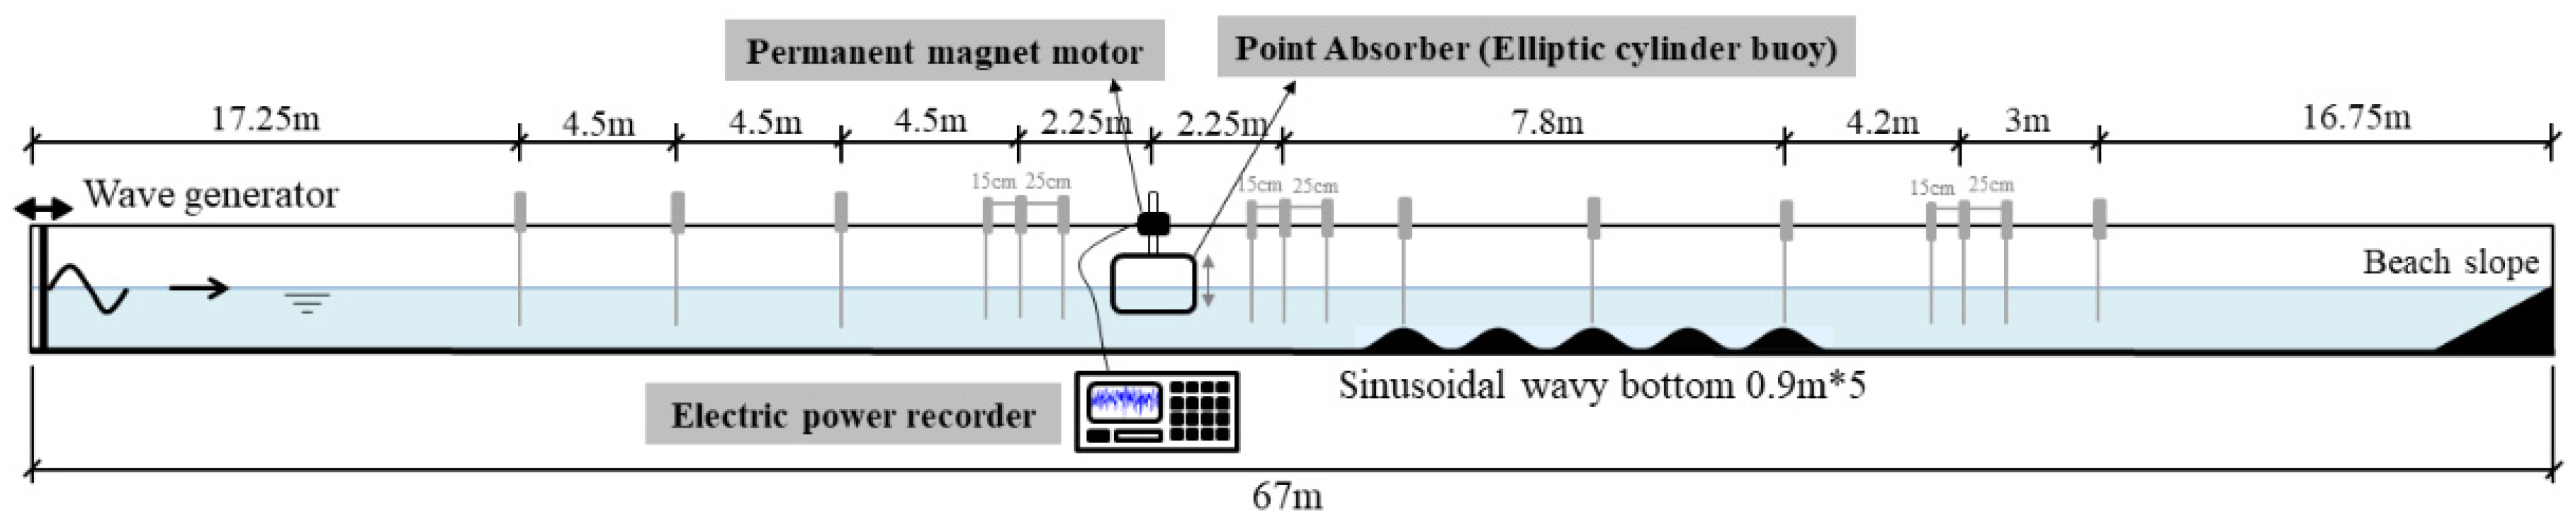
38]. The voltage and current signals outputted from the motor were collected and recorded by the electric power recorder. The overall arrangement of the WEC experimental devices in this study is shown in
Figure 5. It should be noted that only the heaving motion is allowed for the oscillating buoy for wave energy conversion. Furthermore, the spring structures at the up and downside of the cylinder are primarily applied to limit the extreme vertical displacement of the rotor.
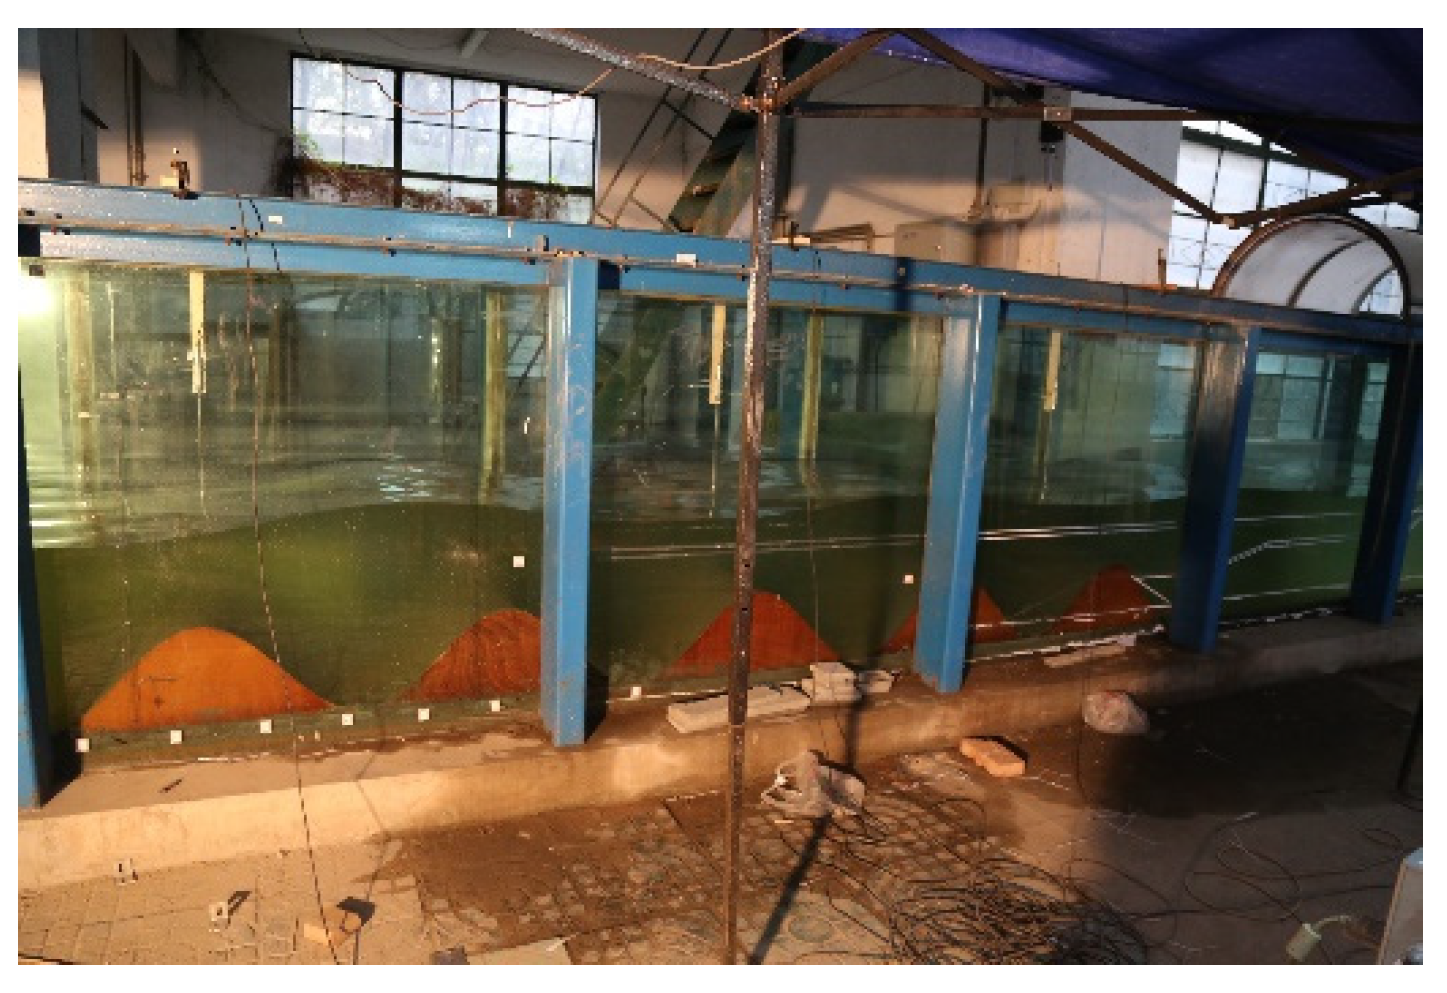
(1) For the cases of partial standing waves, the corresponding wave field are induced by Bragg resonance. In the study of the effects of Bragg resonance on the performance of wave energy generation [
35], five fixed continuous sinusoidal wavy bottoms (
Figure 6) were installed in the flume to induce the Bragg resonance, whose wavelength is 0.9 m and height is 0.3 m.
Figure 7 presents the experimental devices’ layout for partial standing waves induced by Bragg resonance.
According to the dispersion relation and the bottom designed, the incident wave period corresponding to the resonance peak Tp is 1.15 s, which means that the Bragg resonance effect is strongest at 1.15 s. Thus, the value of incident wave period T is centered on 1.15 s and varies within an appropriate range, in which case strong Bragg resonance can be generated. Based on the analysis above, the non-dimensional incident wave period T/Tp of this experiment is 0.96, 1.0, 1.04, the water depth is 0.6 m, 0.7 m, 0.8 m and all the incident waves are regular. Meanwhile, the wave field on the incident side of the rippled bottoms is partial standing waves when Bragg resonance occurs. Thus, the measurement of the power generation of the device under partial standing waves conditions (caused by the Bragg resonance) has been completed. For all the cases of partial standing waves, the locations of the antinodes have been determined at the calibration stage. Then the oscillating buoy will be placed at the corresponding location of antinode for each case.
In this work, we additionally performed the flume experiment to measure the power generation of the device under traveling waves and fully standing waves and set the same wave parameters for comparative analysis.
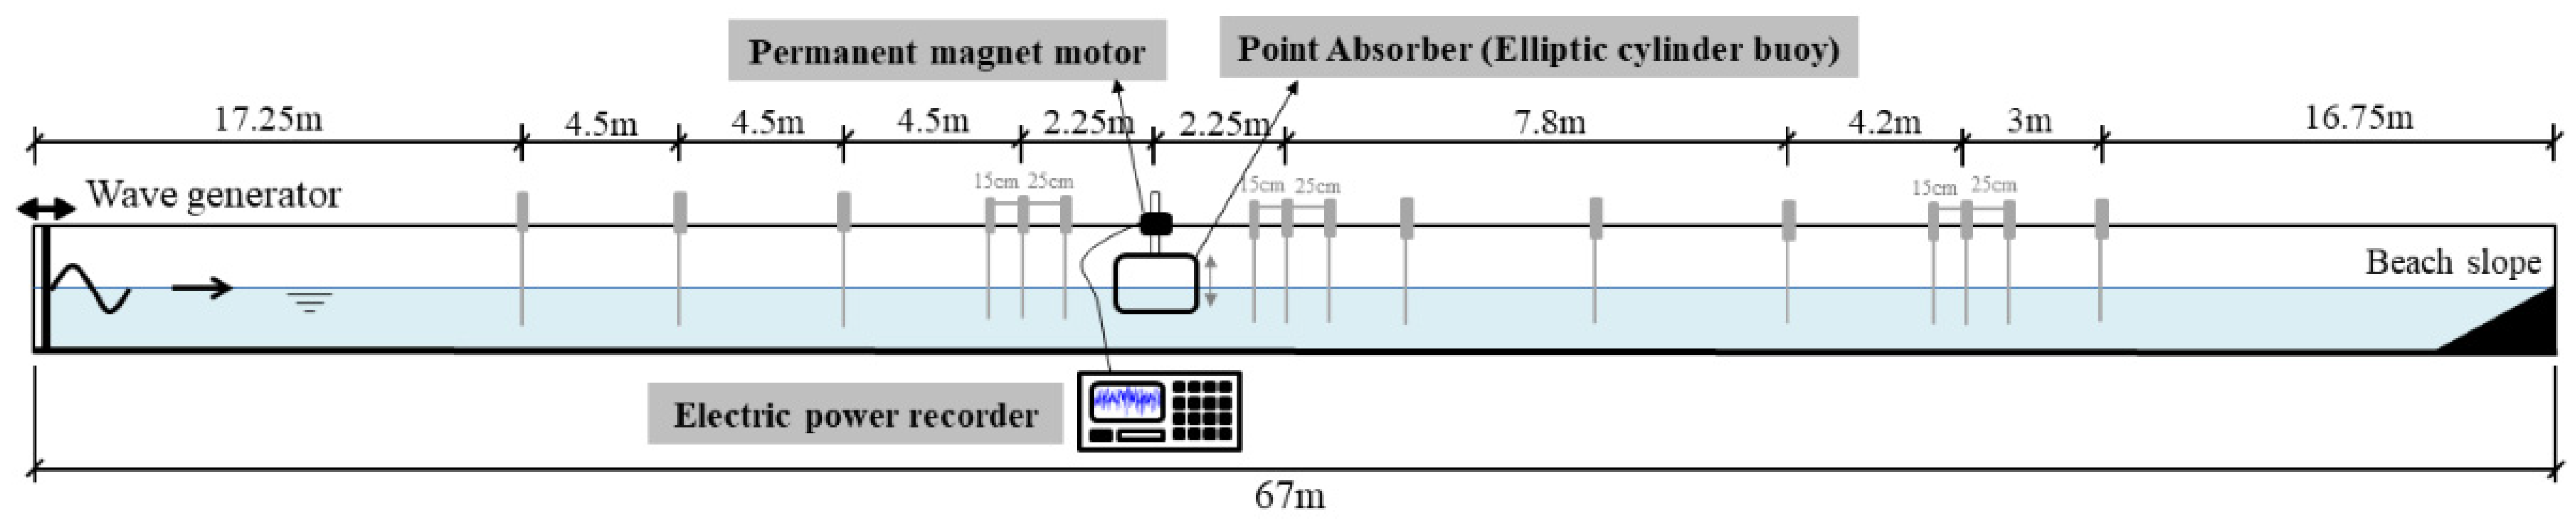
(2) For the cases of travelling waves, the wave height of travelling waves at the location of buoy was calibrated to be the same as partial standing waves [
35]. In the cases of travelling waves, all five rippled bottoms have been removed from the flume. The flume’s bottom is completely flat in this situation (as shown in
Figure 8). Furthermore, the oscillating buoy WEC was still installed at the same location.
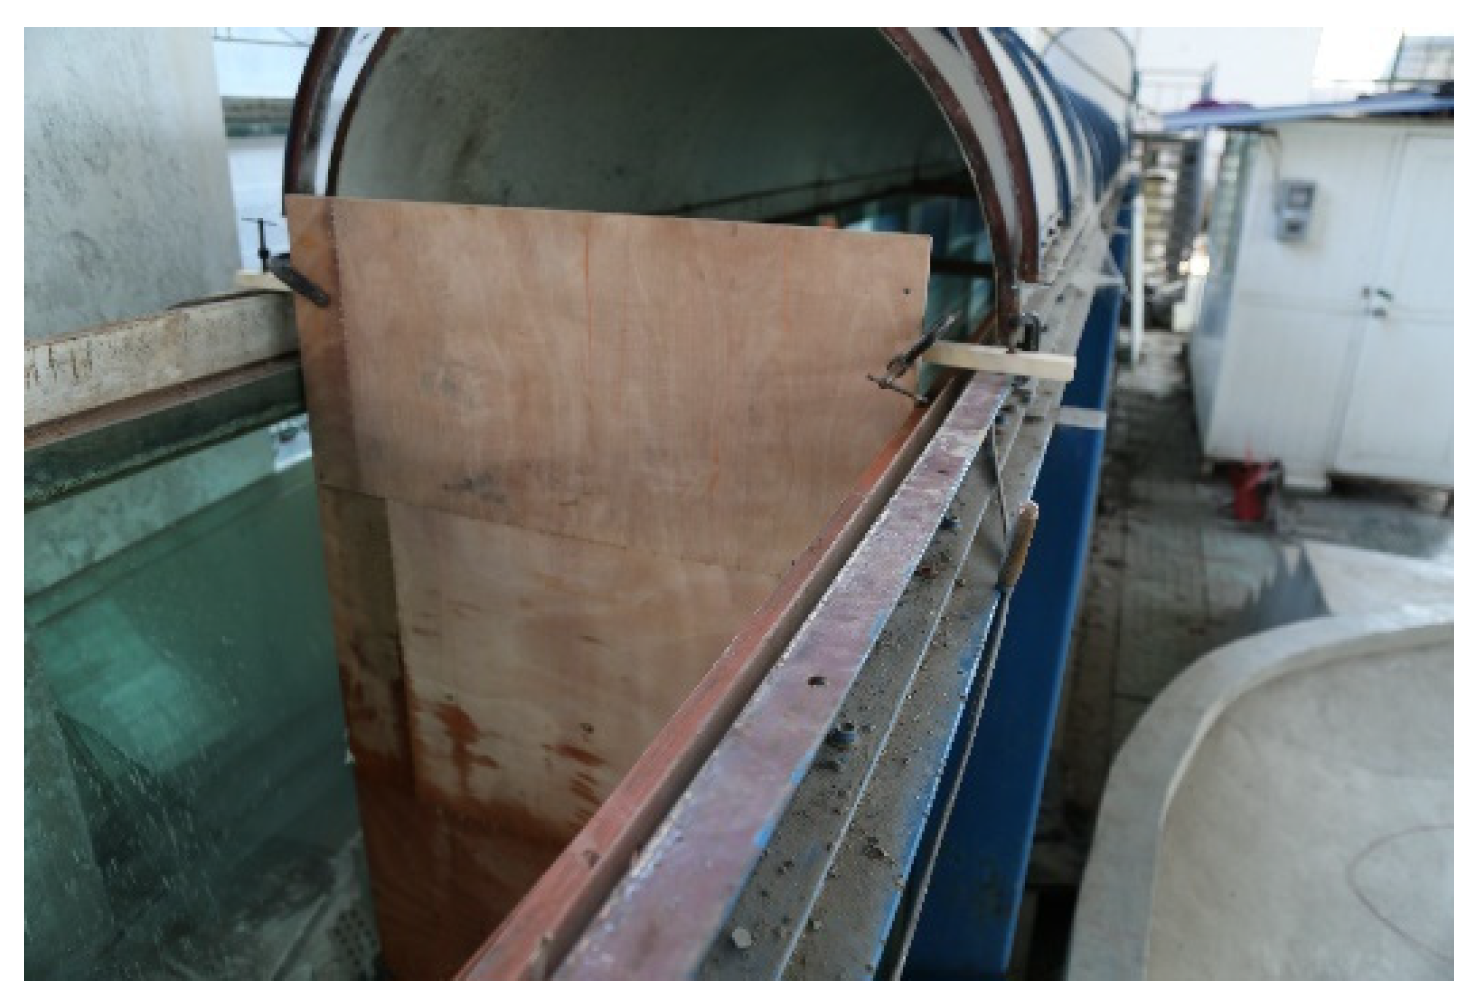
(3) For the cases of fully standing waves, in order to create the wave field of fully standing waves, a vertical rigid baffle was installed in the end of flume to reflect the incident waves completely (
Figure 9). Furthermore, wave height of fully standing waves at the location of buoy was set and adjusted to be same as traveling waves and partial standing waves (
Figure 10).
On the basis of this, the buoy was installed after the wave height calibration, and the power of the oscillating buoy WEC was measured. The vertical baffle was set at 0.75 m away from the last wave probe in order to keep enough space for reflected waves (by rigid vertical baffle firstly and wave paddle secondly) to avoid disturbing the wave field around buoy. So, there will be sufficient time to keep stable standing wave region near buoy (avoid transverse sloshing in the wave field) and to measure the power of the WEC. Similar to the cases of partial standing waves, the oscillating buoys were always located at the antinodes which have been calibrated and determined. The experimental cases and conditions are listed in
Table 1.
It should be noted that the minimum water depth set in our flume experiment is 0.6 m. Although the smaller water depth will induce the stronger Bragg resonance, the reflected wave component will break above the rippled bottoms if the water depth h is less than 0.6 m. This is because the water depth above the bottoms’ crest will be (h-Hb) which is much smaller. Therefore, the lower bound value of the water depth in our experiment is set as 0.6 m. Besides, the electrical signals measured will be discussed in the next section without the free-surface elevation measured in flume. The reason is that the wave fields were interfered by oscillating buoy (irregular reflection) during the experimental process. Furthermore, the wave patterns observed at the experimental stage are not considerable to be compared with the electric signals observed by electric power recorder. So, the free-surface elevations measured by wave probes along the flume are utilized for calibrating the wave parameters and wave field spatial distribution in this study.
During the calibration stage of flume experiment, the wave height and period are calculated by the zero-upcrossing method. Furthermore, the reflection coefficient is calculated by the incident-reflected separation method of Mansard [
39]. The detailed information of the reflection coefficient by Bragg resonance has been introduced in Tao [
35].
4. Results and Discussions
In this section, we discuss the electrical energy generation characteristics of traveling waves, partial standing waves and fully standing waves by instantaneous voltage, instantaneous current, instantaneous power and active power respectively. In addition, the electrical energy generation performance will be compared by average active power in detail for three different wave types.
4.1. Comparison of Measured Instantaneous Voltage and Current
The electric power recorder is utilized to record the power generation of the oscillating buoy WEC under each case and to collect the instantaneous current and voltage data. The sampling frequency of the electric power recorder is 1000 Hz, and the data acquisition starts from the wave propagation to the buoy and the duration is 1 min.
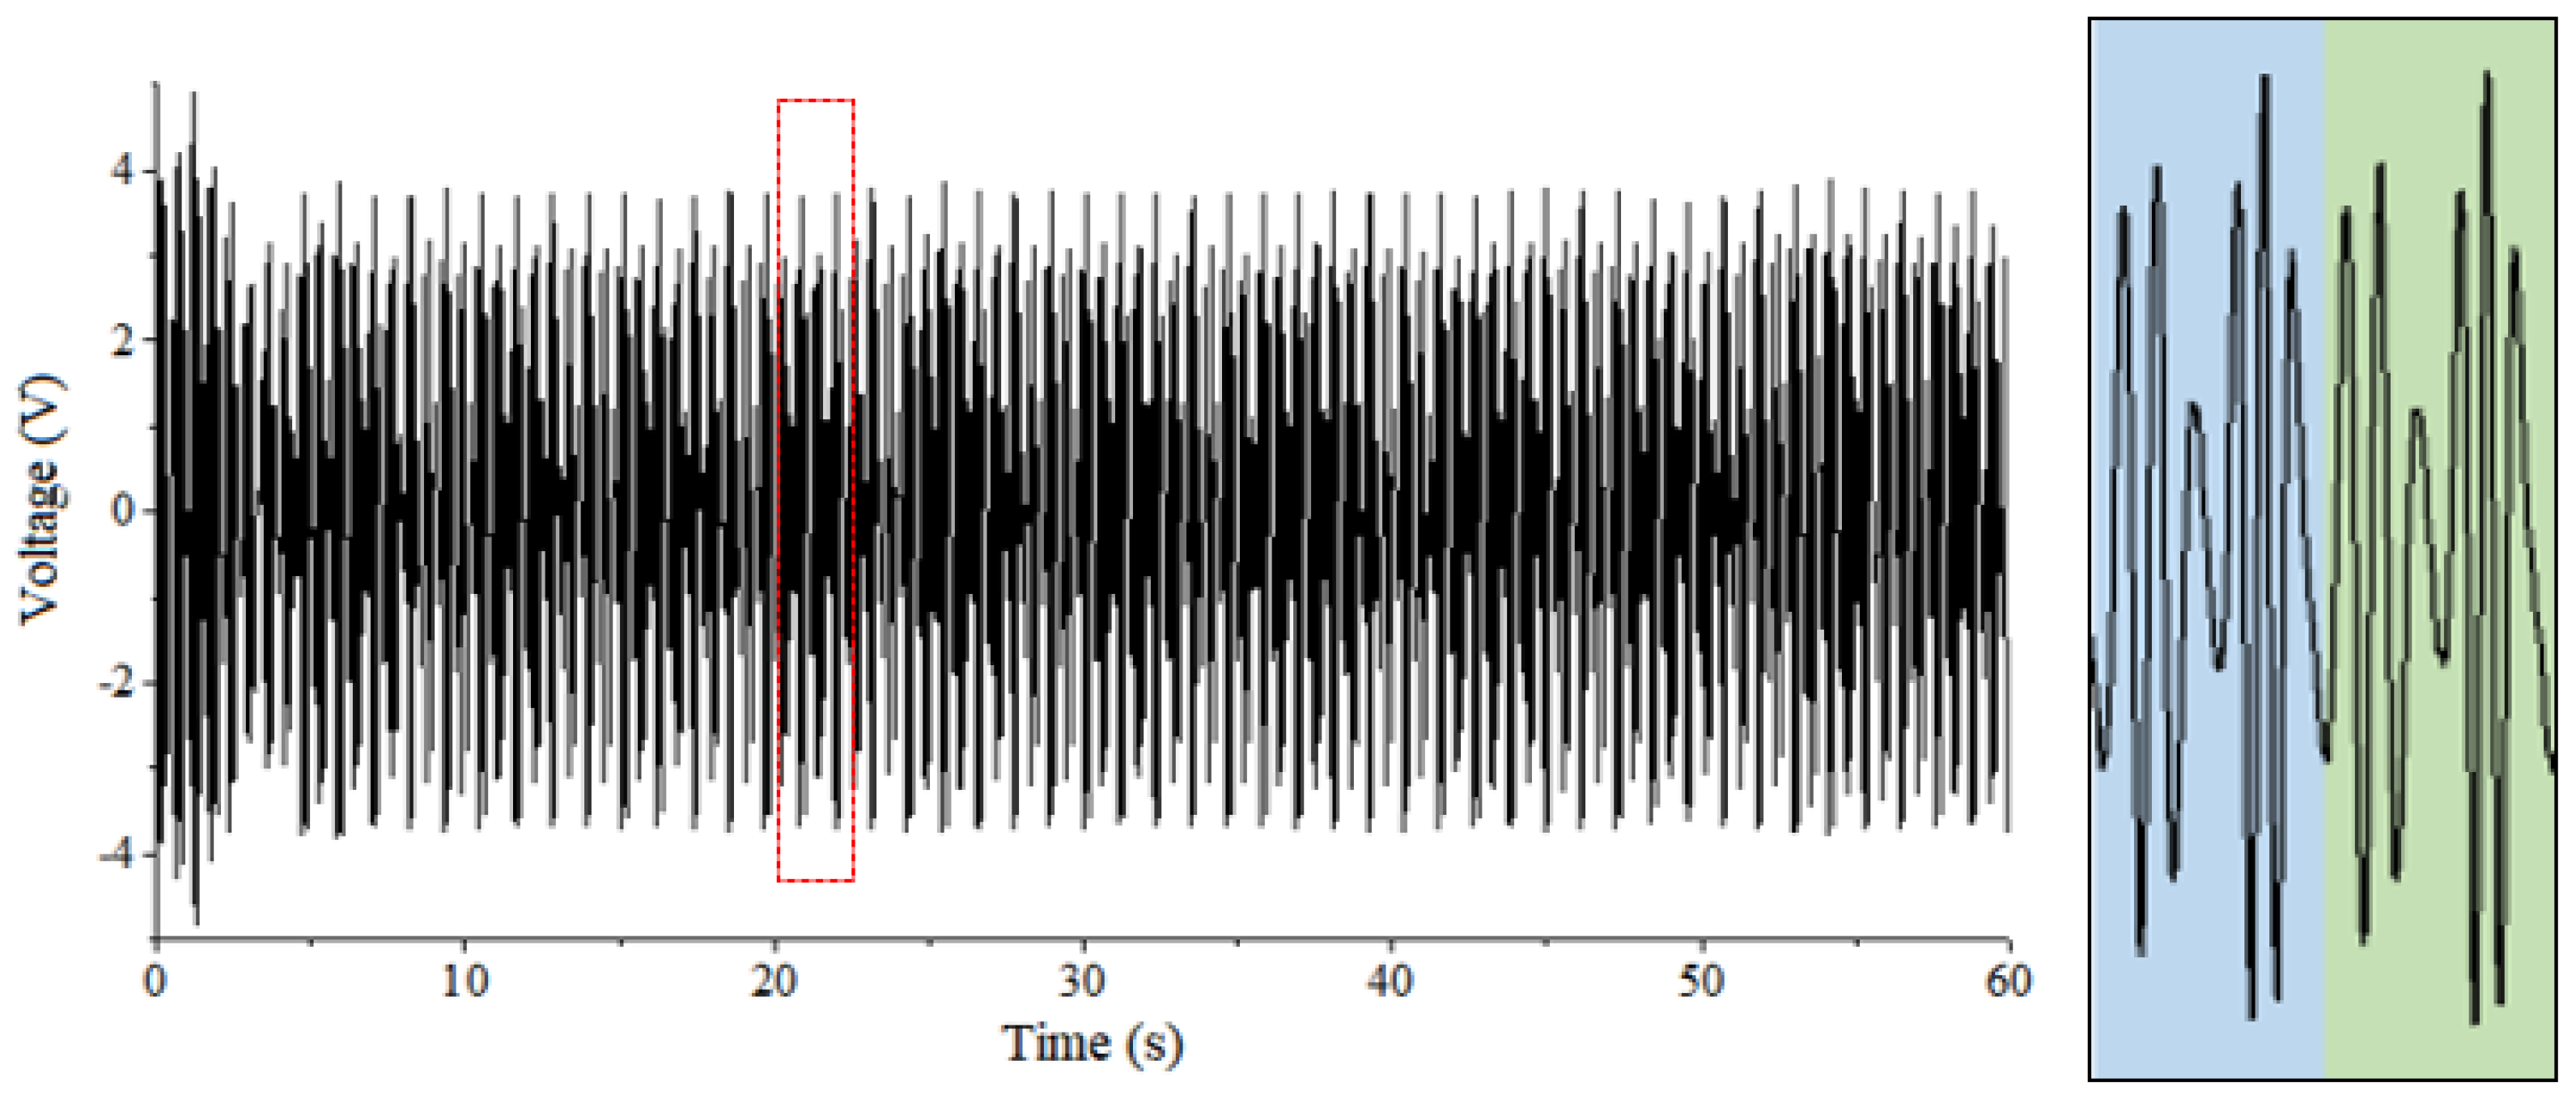
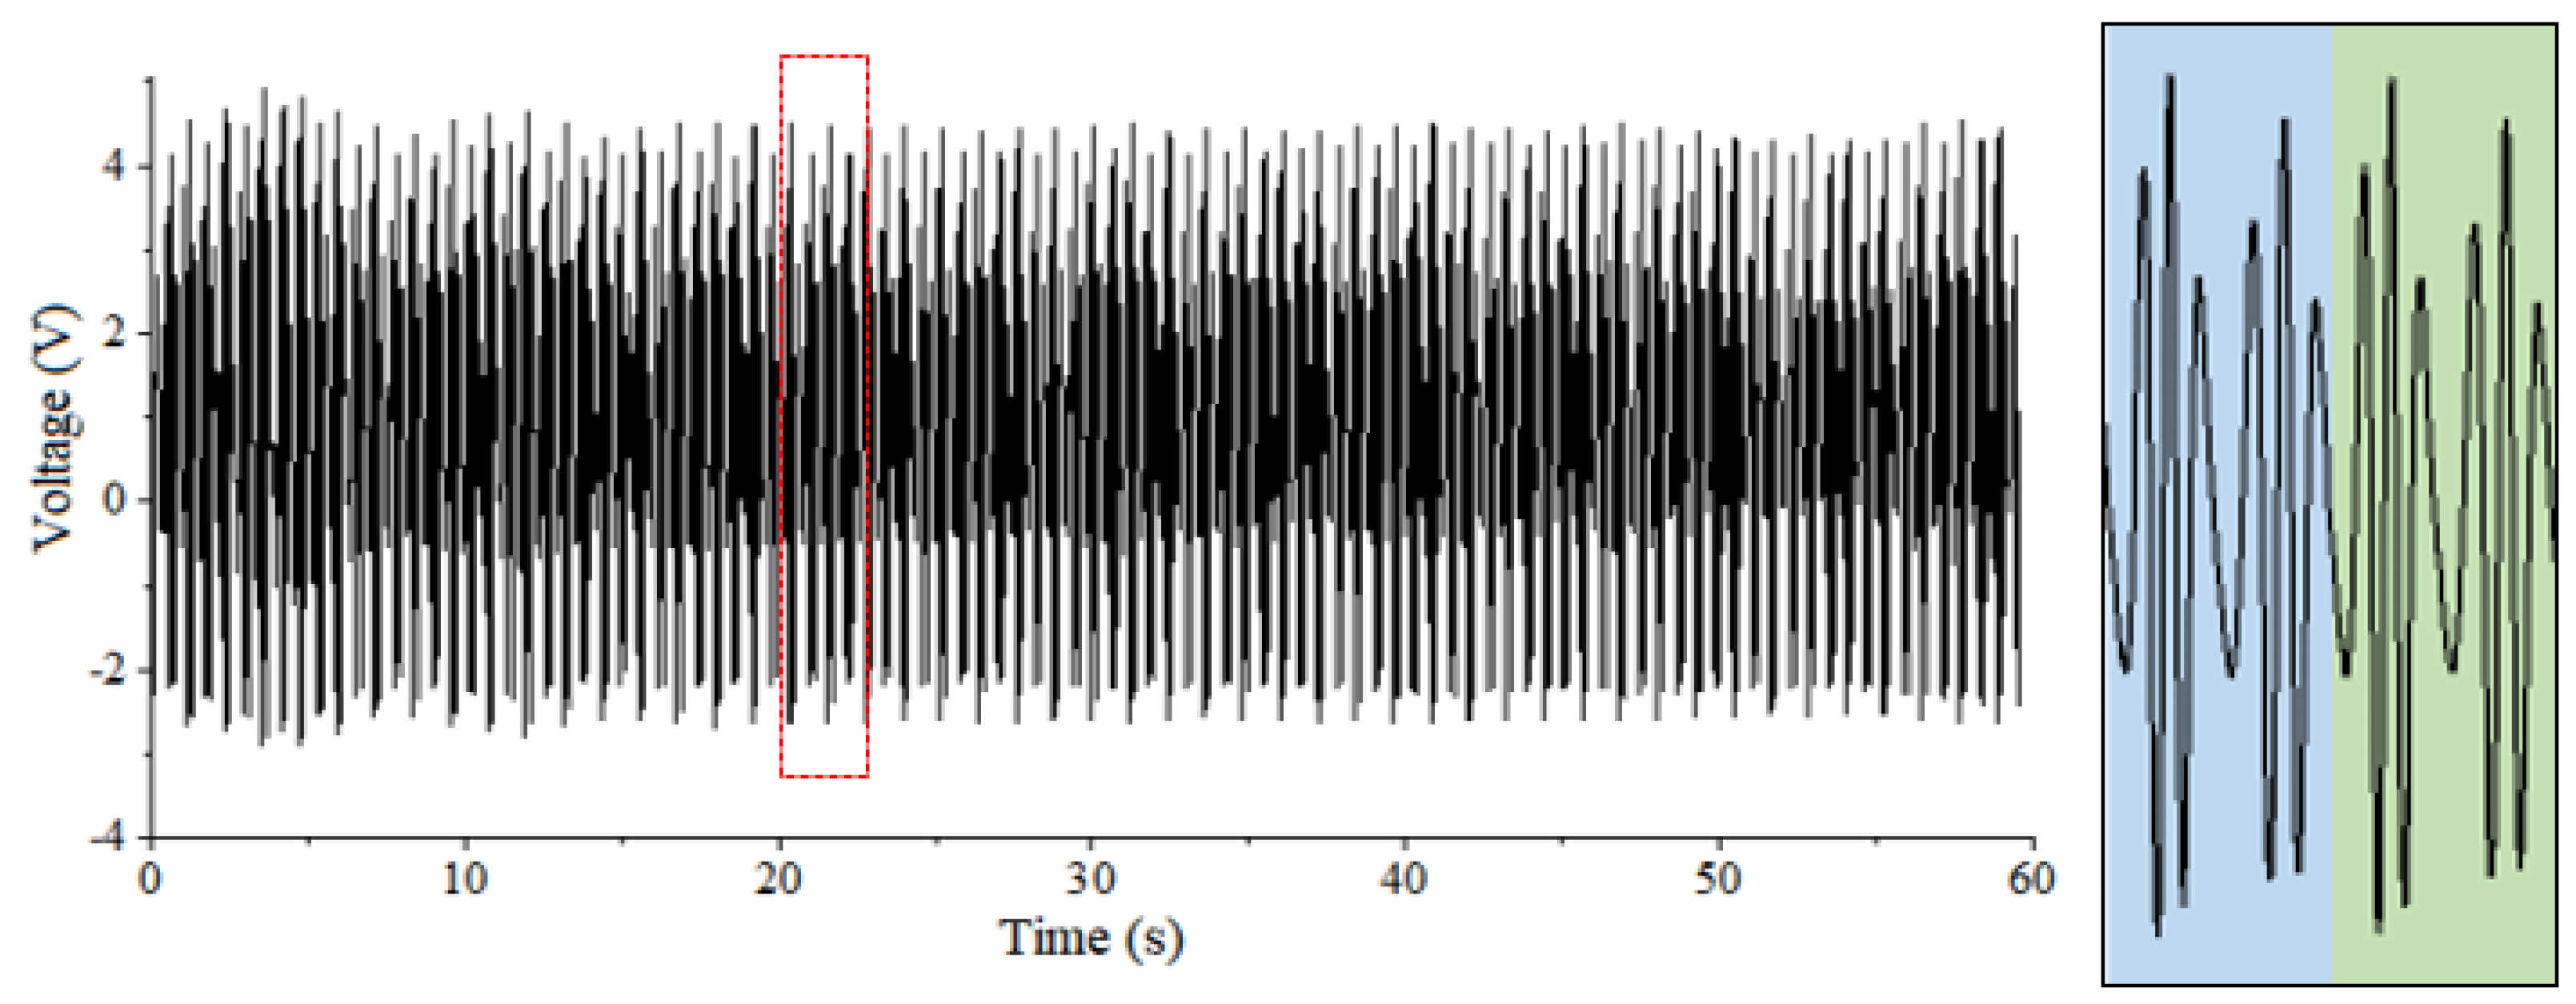
Figure 11,
Figure 12 and
Figure 13 show the measured voltage time series diagrams when the wave types are traveling waves, partial standing waves and fully standing waves, respectively. The water depth
h = 0.6 m and the incident wave period
T/
Tp= 1.0. From
Figure 11, it could be easily found that, due to the wave front induced at the initial stage of wave generation by wave paddle, the voltage amplitude also has the similar pattern around 1 s of its time series. Then the incident wave at the buoy begins to be stable and regular, and the voltage waveform tends to be stable correspondingly. In
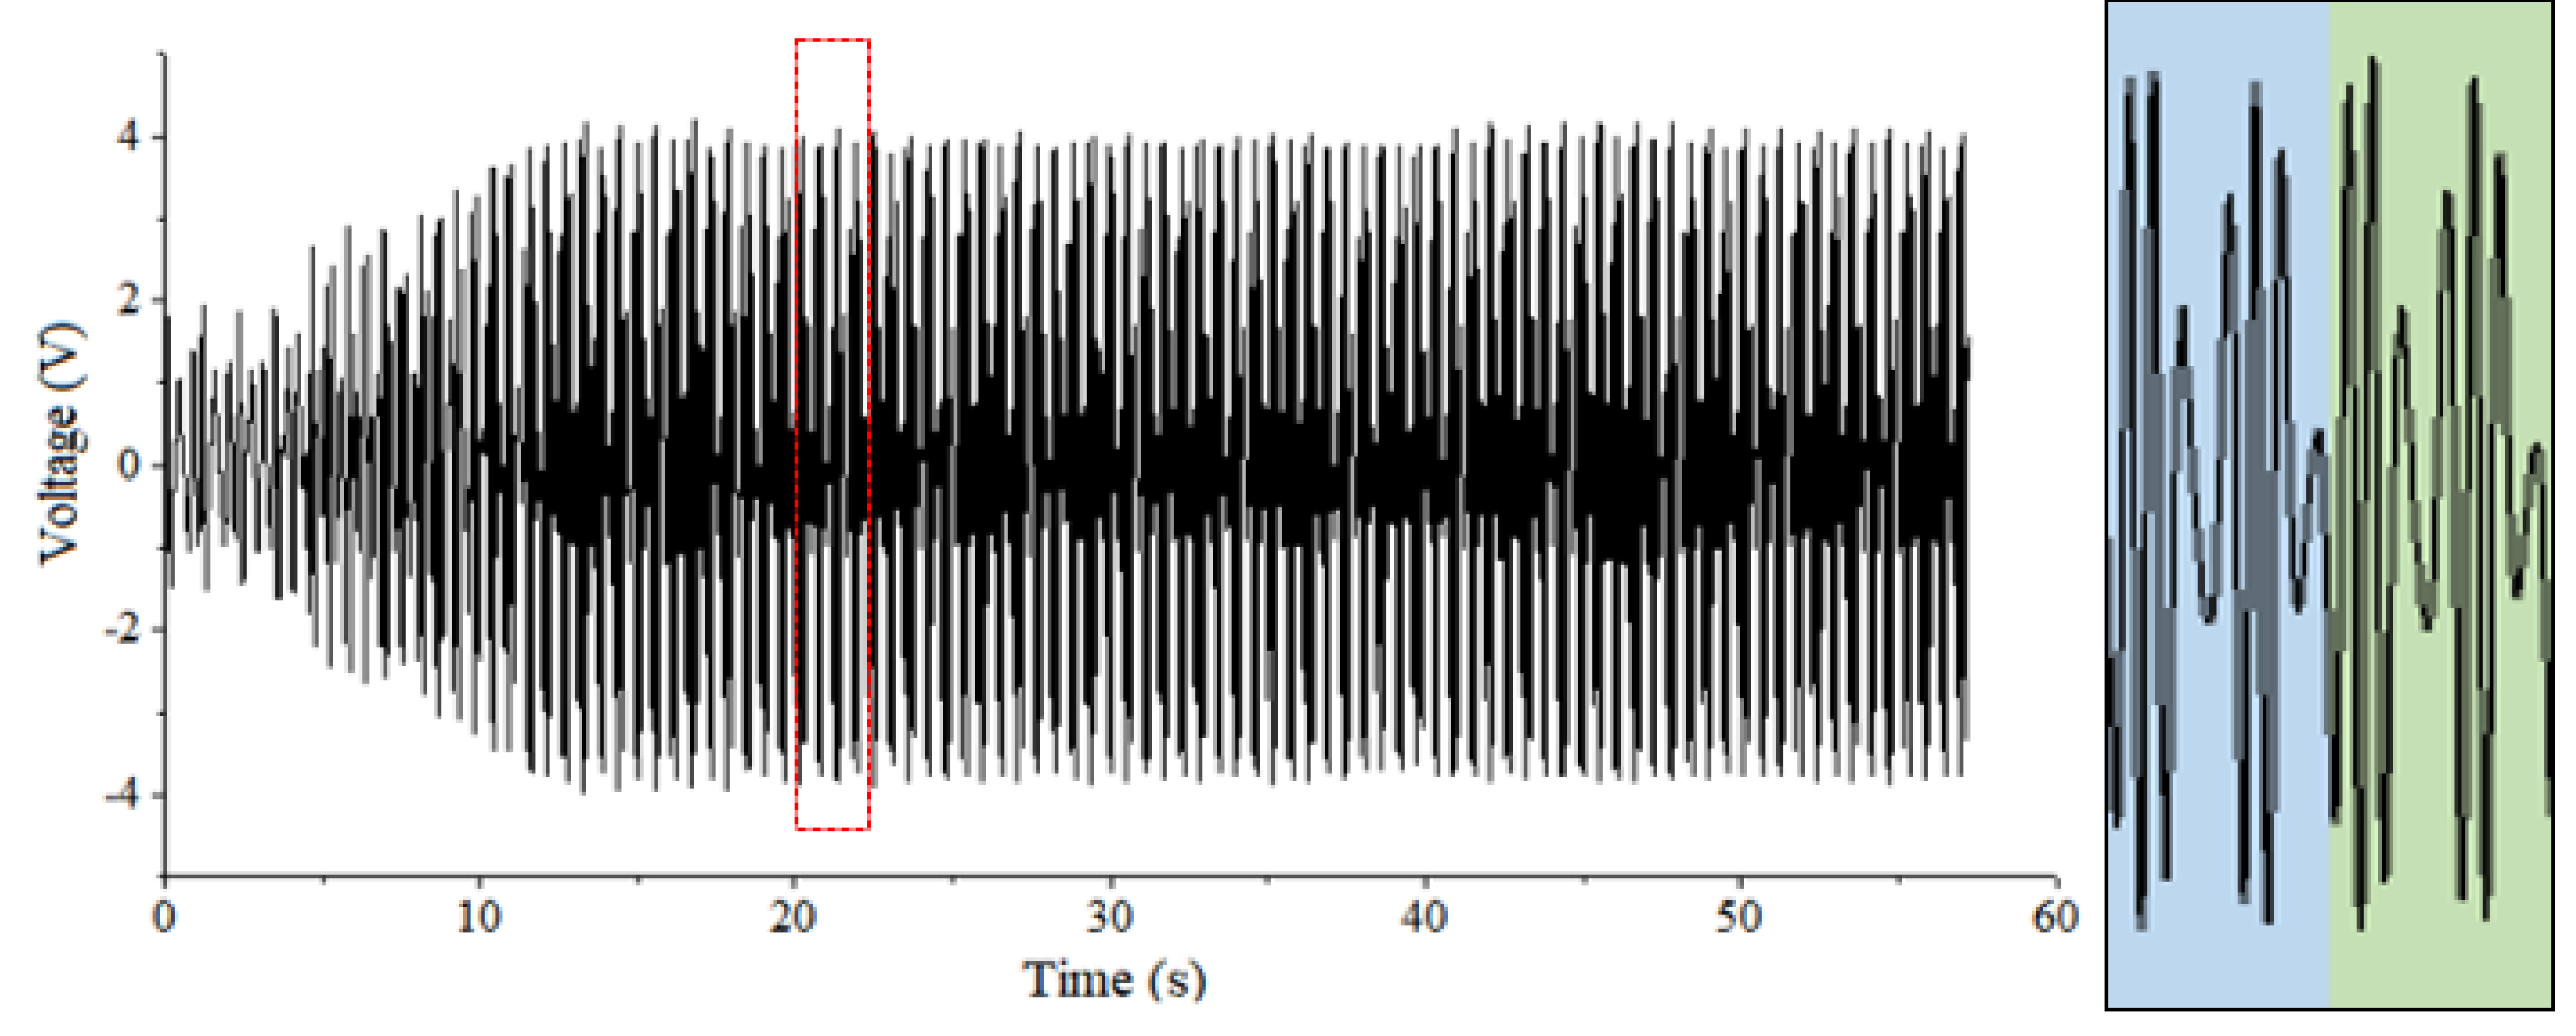
Figure 12, the initial waveform also fluctuates because of the effect of the wave group. Later, due to the superposition of incident waves and reflected waves caused by Bragg resonance, partial standing waves are formed in flume, and the wave peak of the instantaneous voltage increases gradually. The stable state is reached in about 20 s, which coincides with the calculated time when the reflected wave induced by Bragg scattering propagates to the buoy. Compared with
Figure 11, when the wave field is stabilized under the condition of partial standing waves, the measured instantaneous voltage peak is larger than that under traveling waves.
Figure 13 gives the instantaneous voltage waveform under fully standing waves. After the buoy motion is stable, the voltage peak is close to that in partial standing waves.
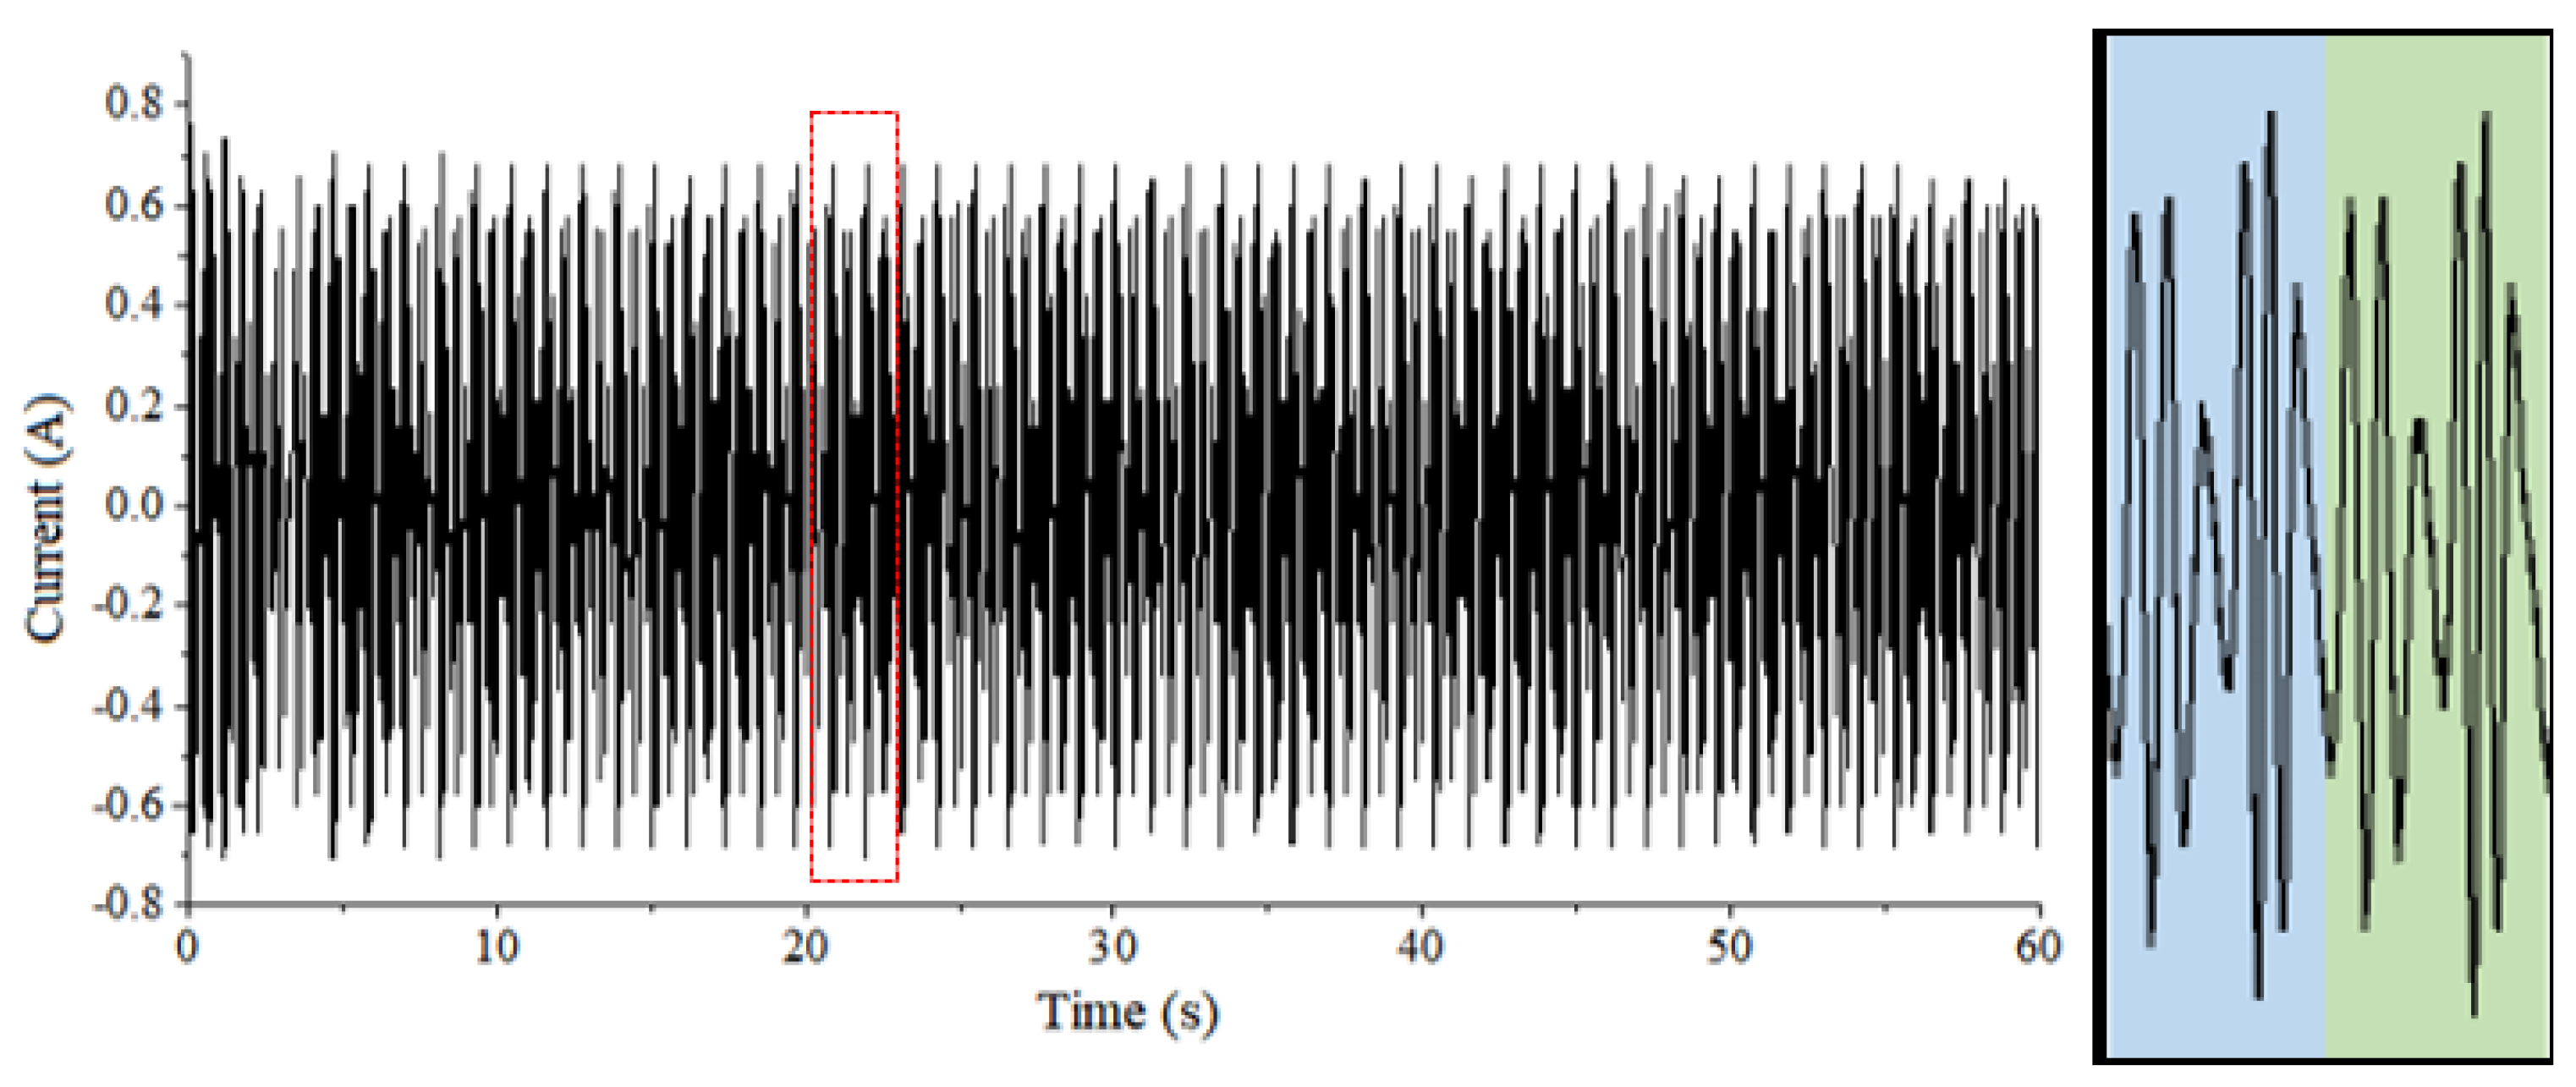
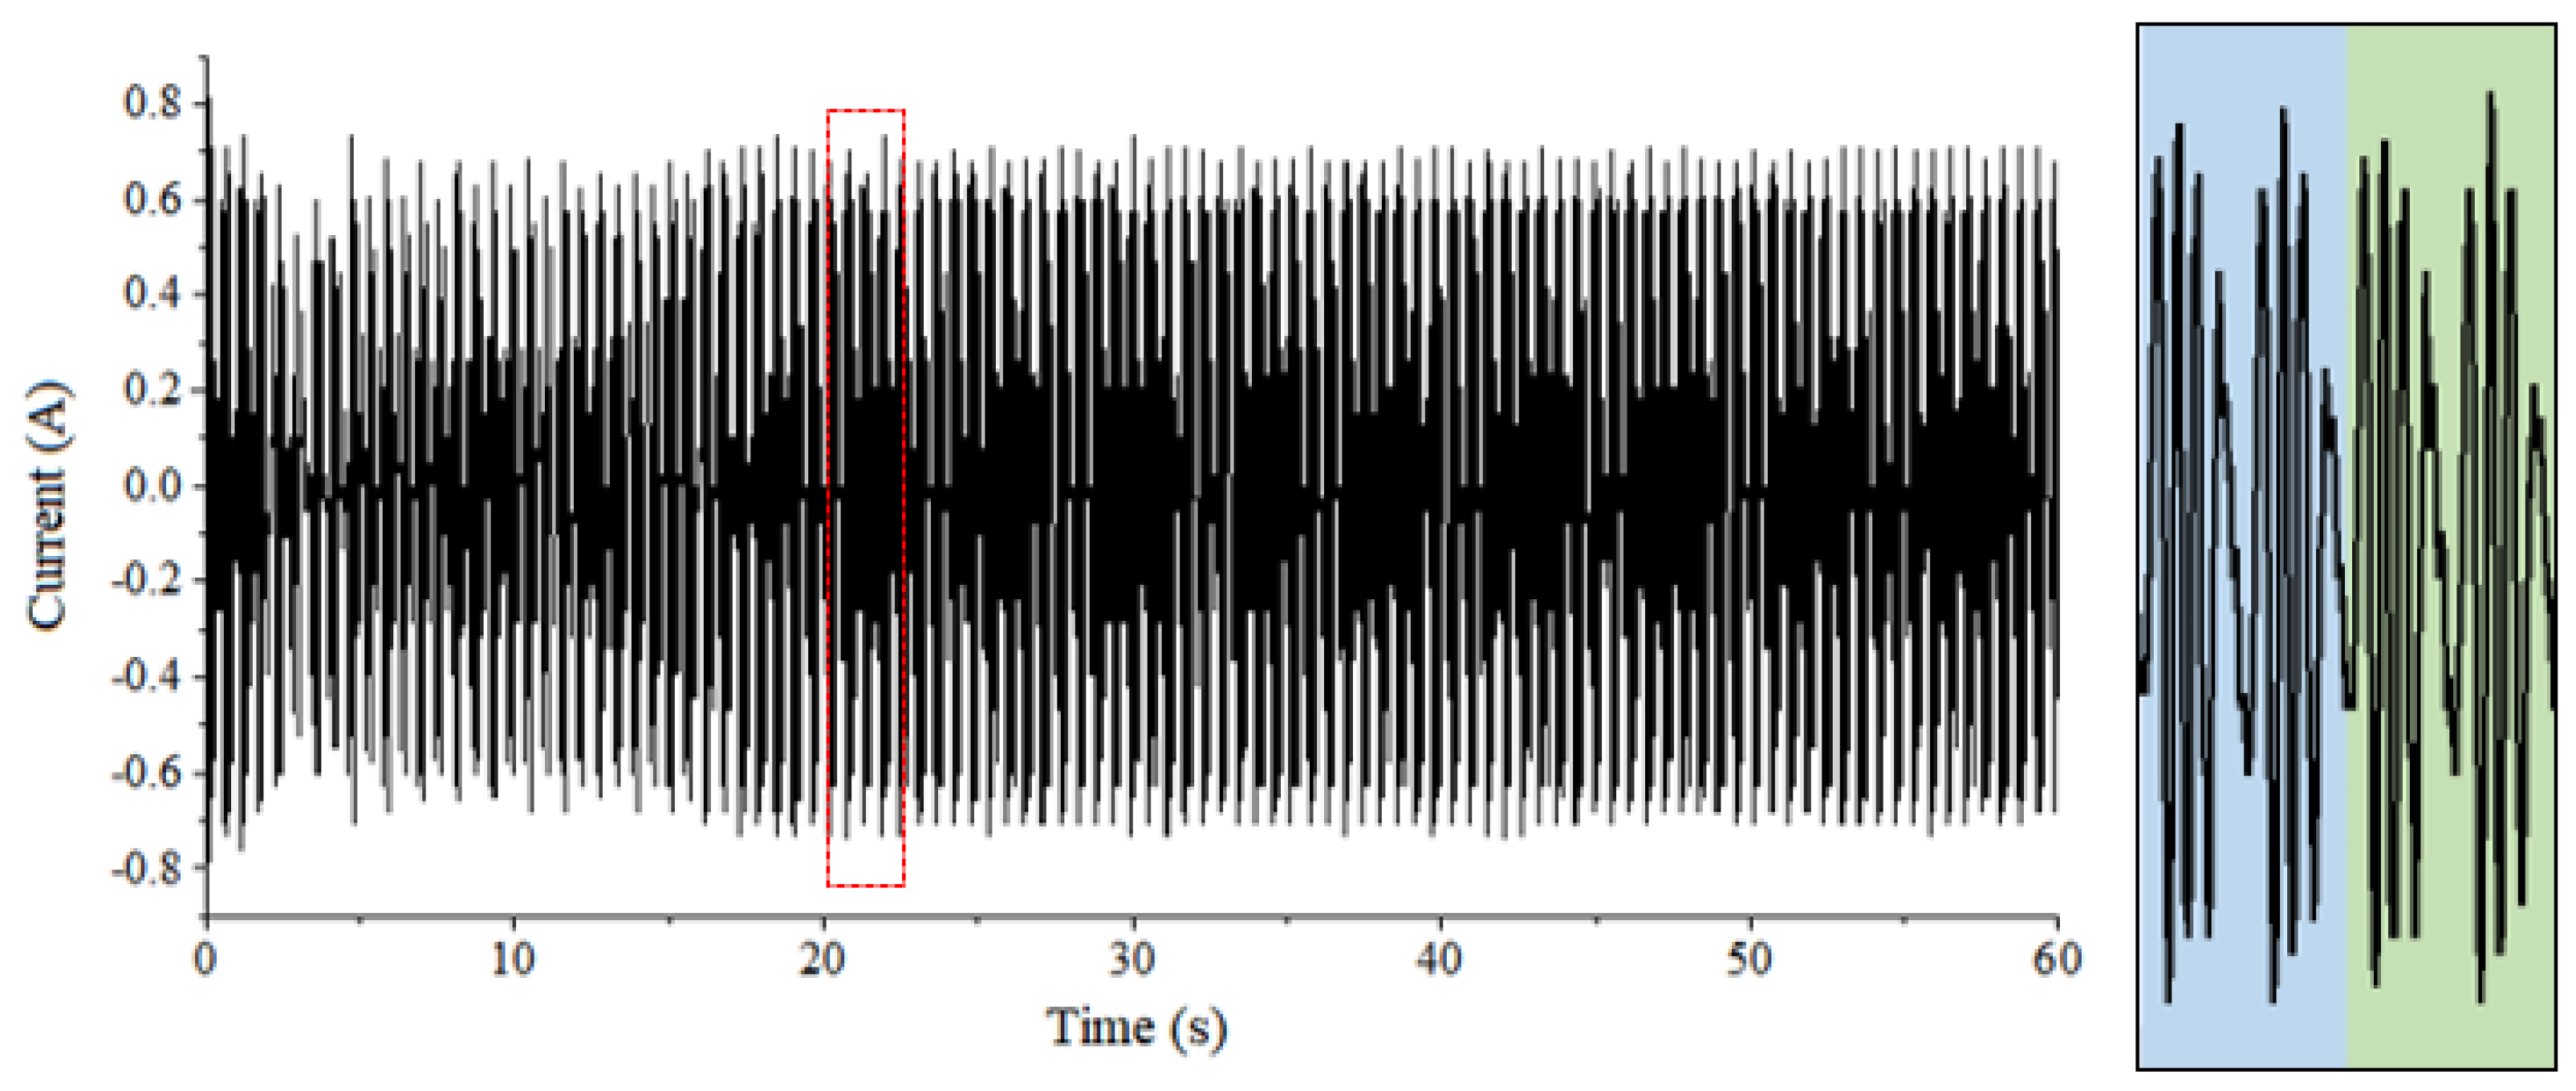
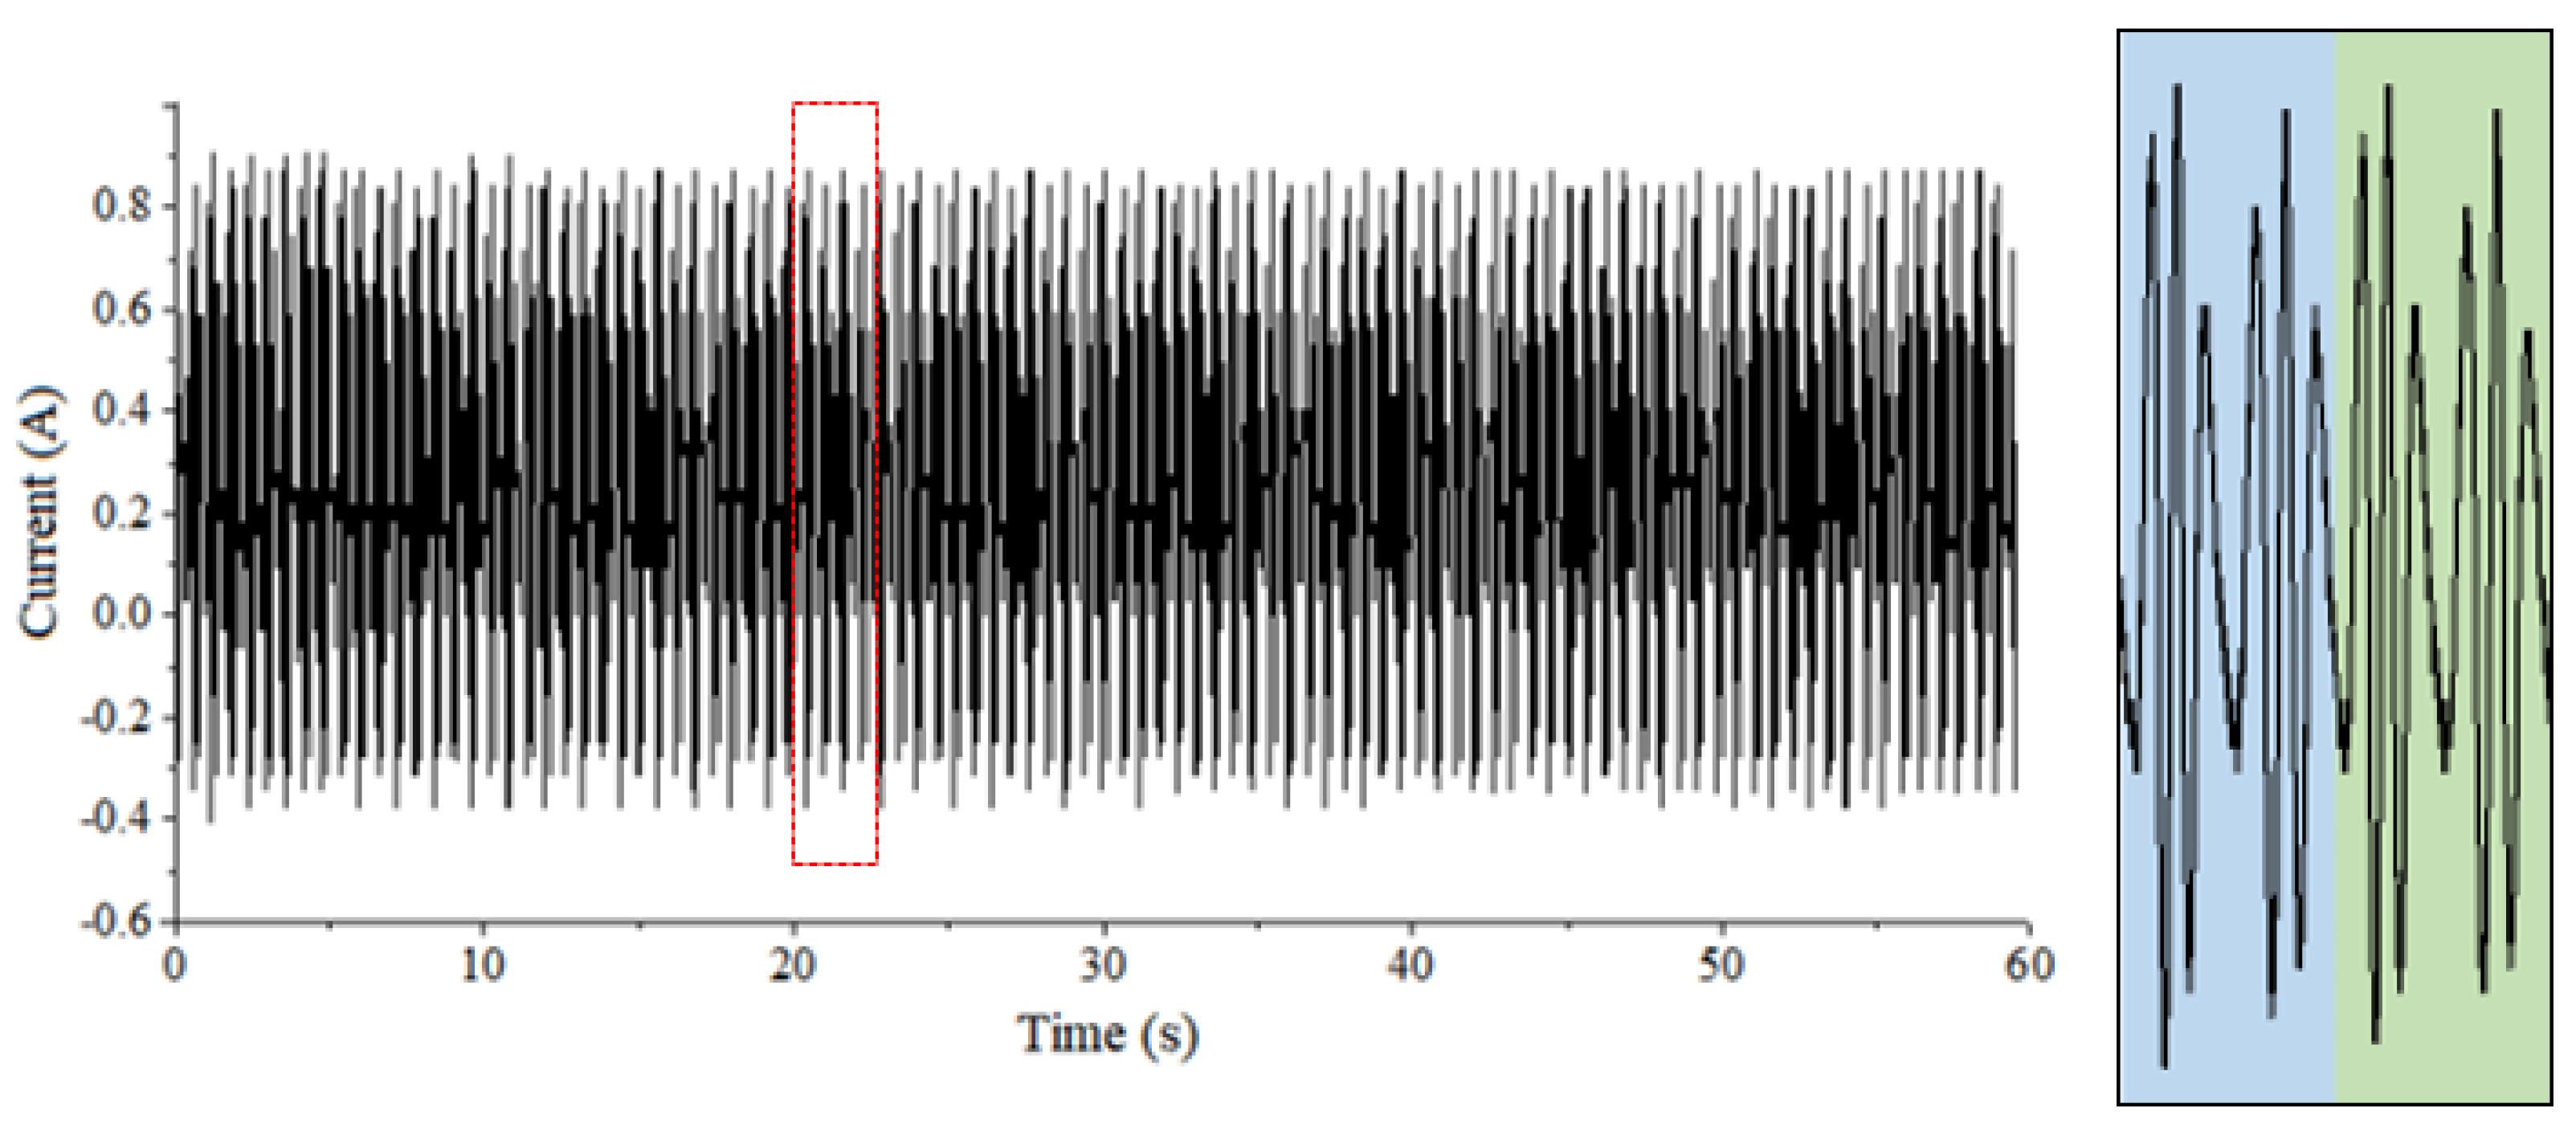
Figure 14,
Figure 15 and
Figure 16 show the current time series diagrams measured under the conditions that the wave types are traveling waves, partial standing waves and fully standing waves, respectively. The trends in current variation time series could not be identified obviously in these three charts. After the wave field is stabilized in the flume, the peak value of instantaneous current measured under fully standing waves is the largest, second for partial standing waves and the smallest for traveling waves.
4.2. Comparison of the Instantaneous Power
The instantaneous power can reflect the instantaneous absorbed power of the circuit, which is helpful to analyze the power variation of the WEC with the change of the wave field. Taking the incident wave period T/Tp = 1.0 and the water depth of 0.6 m as an example, the instantaneous power of traveling waves, partial standing waves and fully standing waves is compared and analyzed, respectively.
The electric power recorder begins to collect data since the arrival of the incident waves to the buoy, and the acquisition time is 1 min. It should be noted that the influence of irregular wave packets (wave front) appeared at the very beginning of wave recording, a stable standing wave region has not yet been formed. In addition, the reflected waves generated by the incident waves propagating to the end of the flume will affect the experimental results. Thus, when calculating the power generation, the data used should be within the interval from the arrival of Bragg reflection waves at the buoy to the arrival of the reflected waves at the buoy.
The waveform propagation velocity (phase velocity)
c is given by
in which
L is the wavelength and
T is the corresponding wave period.
The wave energy propagation velocity
cg is given by
in which,
k is the wavenumber and
h is the water depth.
The velocity of wave energy propagation in Equation (9) is utilized to calculate the propagation time of wave train in order to estimate the effective range in total time series of measurements. Furthermore, the effective time
can be expressed as:
in which,
s is the length wave energy propagating path. The lower bound of
s represents the propagating length of initially induced wave train. The upper bound of
s usually depends on the total propagating length of disturbance wave components before reaching the measurement location (i.e., reflected waves from wave maker or bottom slope).
Taking the case of period T/Tp = 1.0, water depth h = 0.6 m as an example, the actual wave energy propagation velocity is 1.0035 m/s. The wave recording begins from the steady waveform to the buoy, and the Bragg reflection waves arrive at the buoy after 20.03 s. After 72.25 s, the reflected waves reach the buoy. The recording time is 1 min, so the range used to calculate the power is 20.03 s~60 s. When calculating the instantaneous power of the WEC under fully standing waves, due to the change of the experiment model and corresponding set-up, the wave recording begins after 15 s from the steady wave to the buoy, and completely standing waves reach the buoy after 20.87 s. The range of power available for calculation is 20.87 s~60 s. In general, this time interval analysis aims at selecting the time series which are effective to capture the Bragg reflection (or baffle reflection) waves and avoid the reflected interference waves by both sides of the flume (wave paddle and/or rubble mounds).
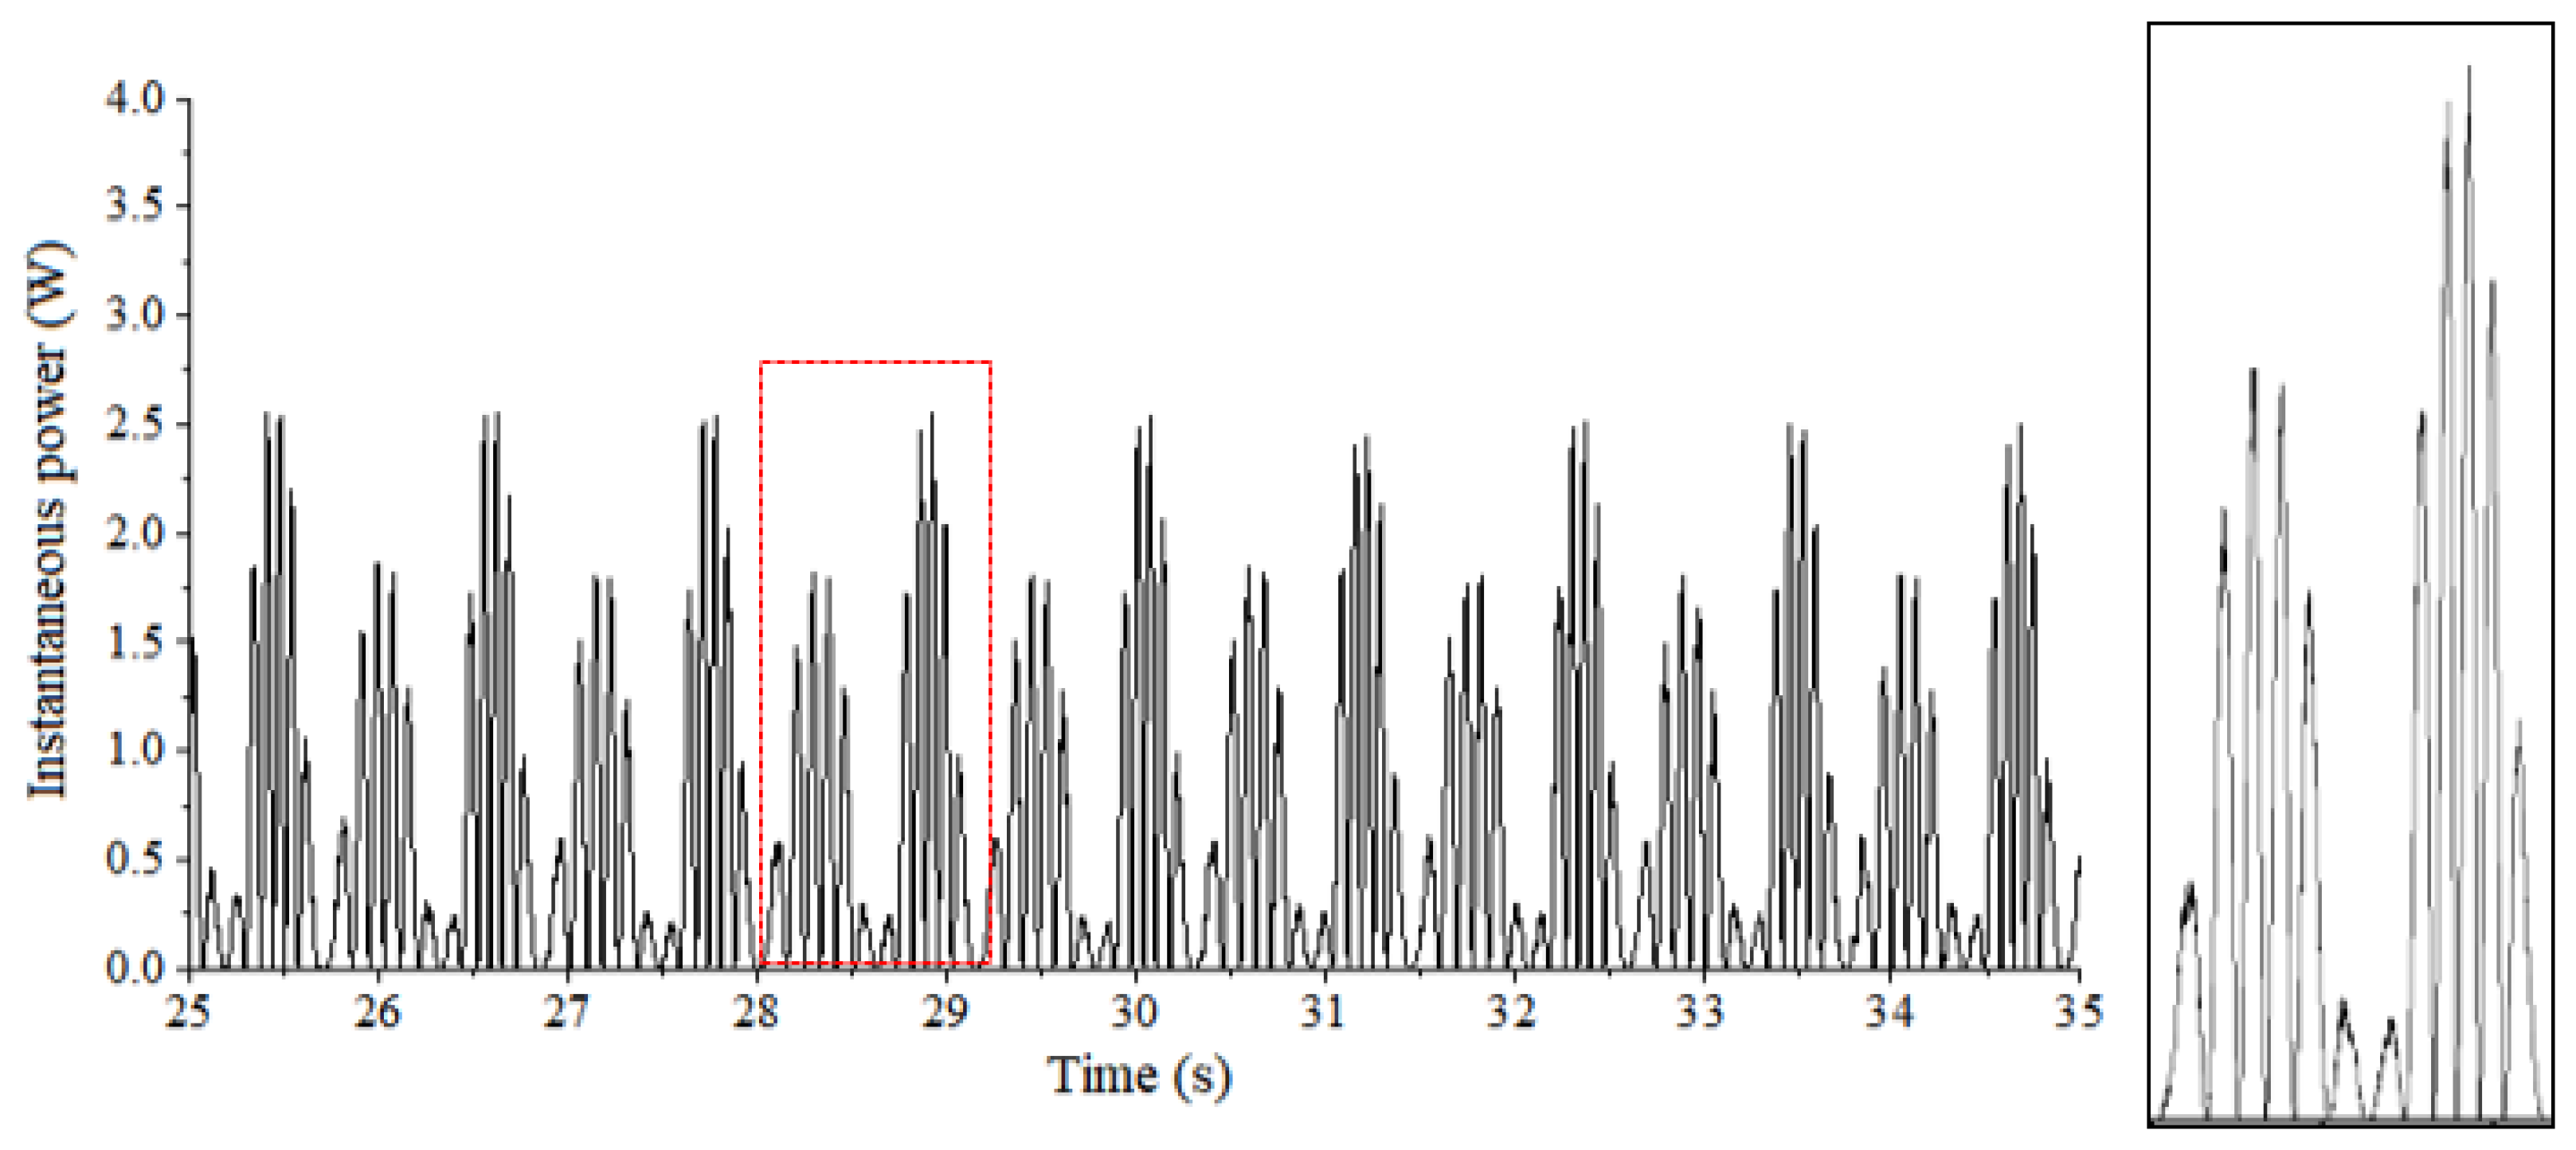
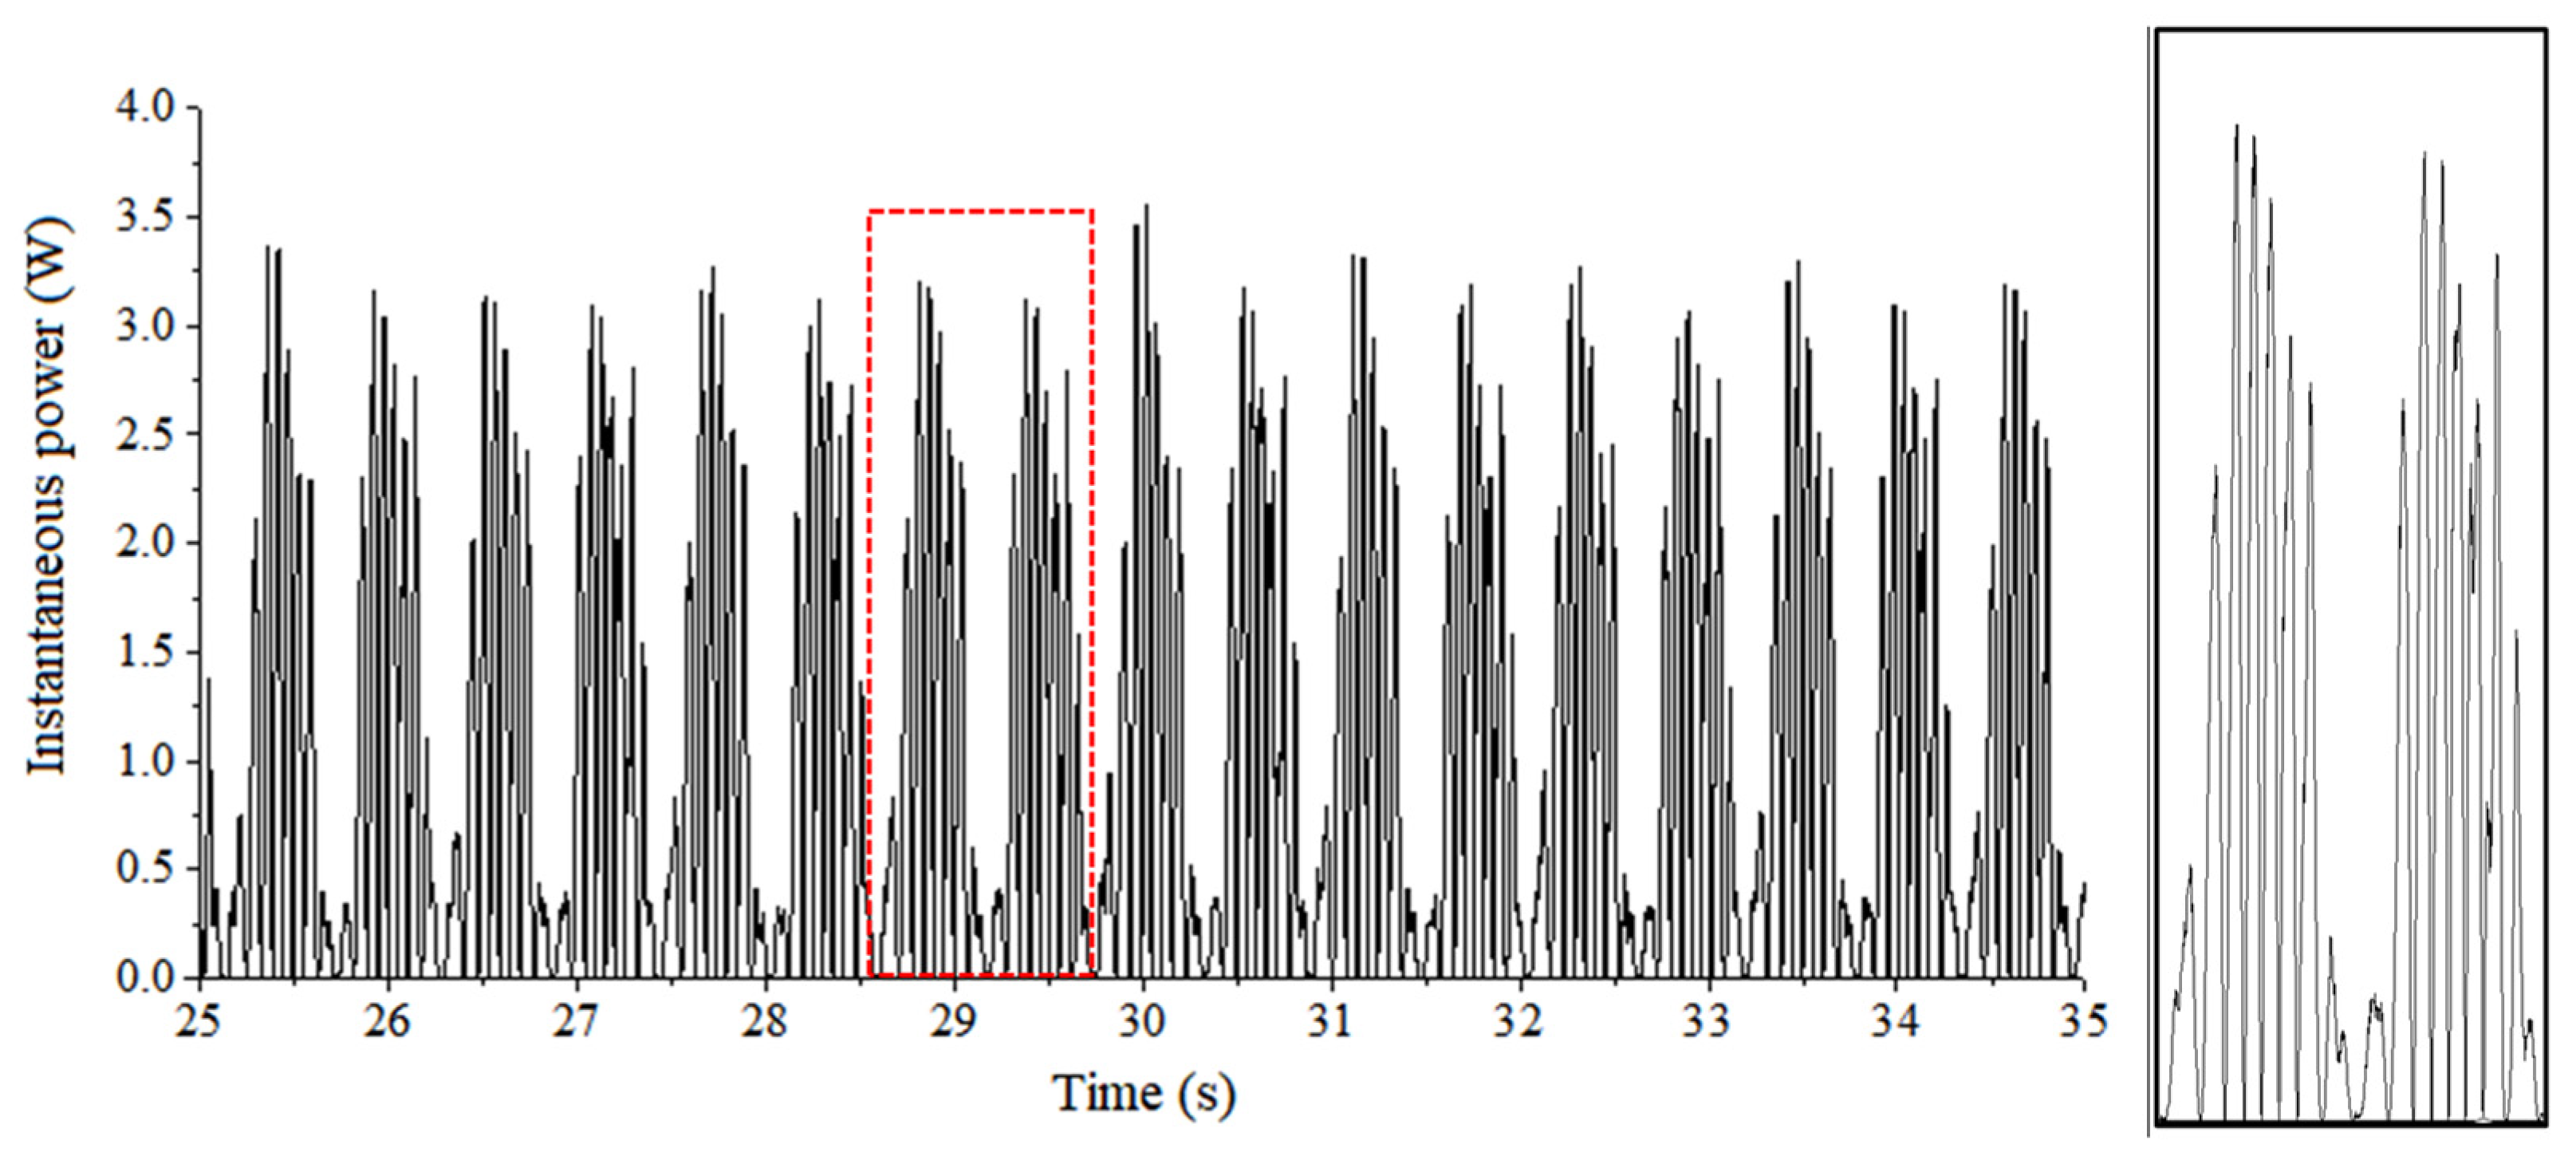
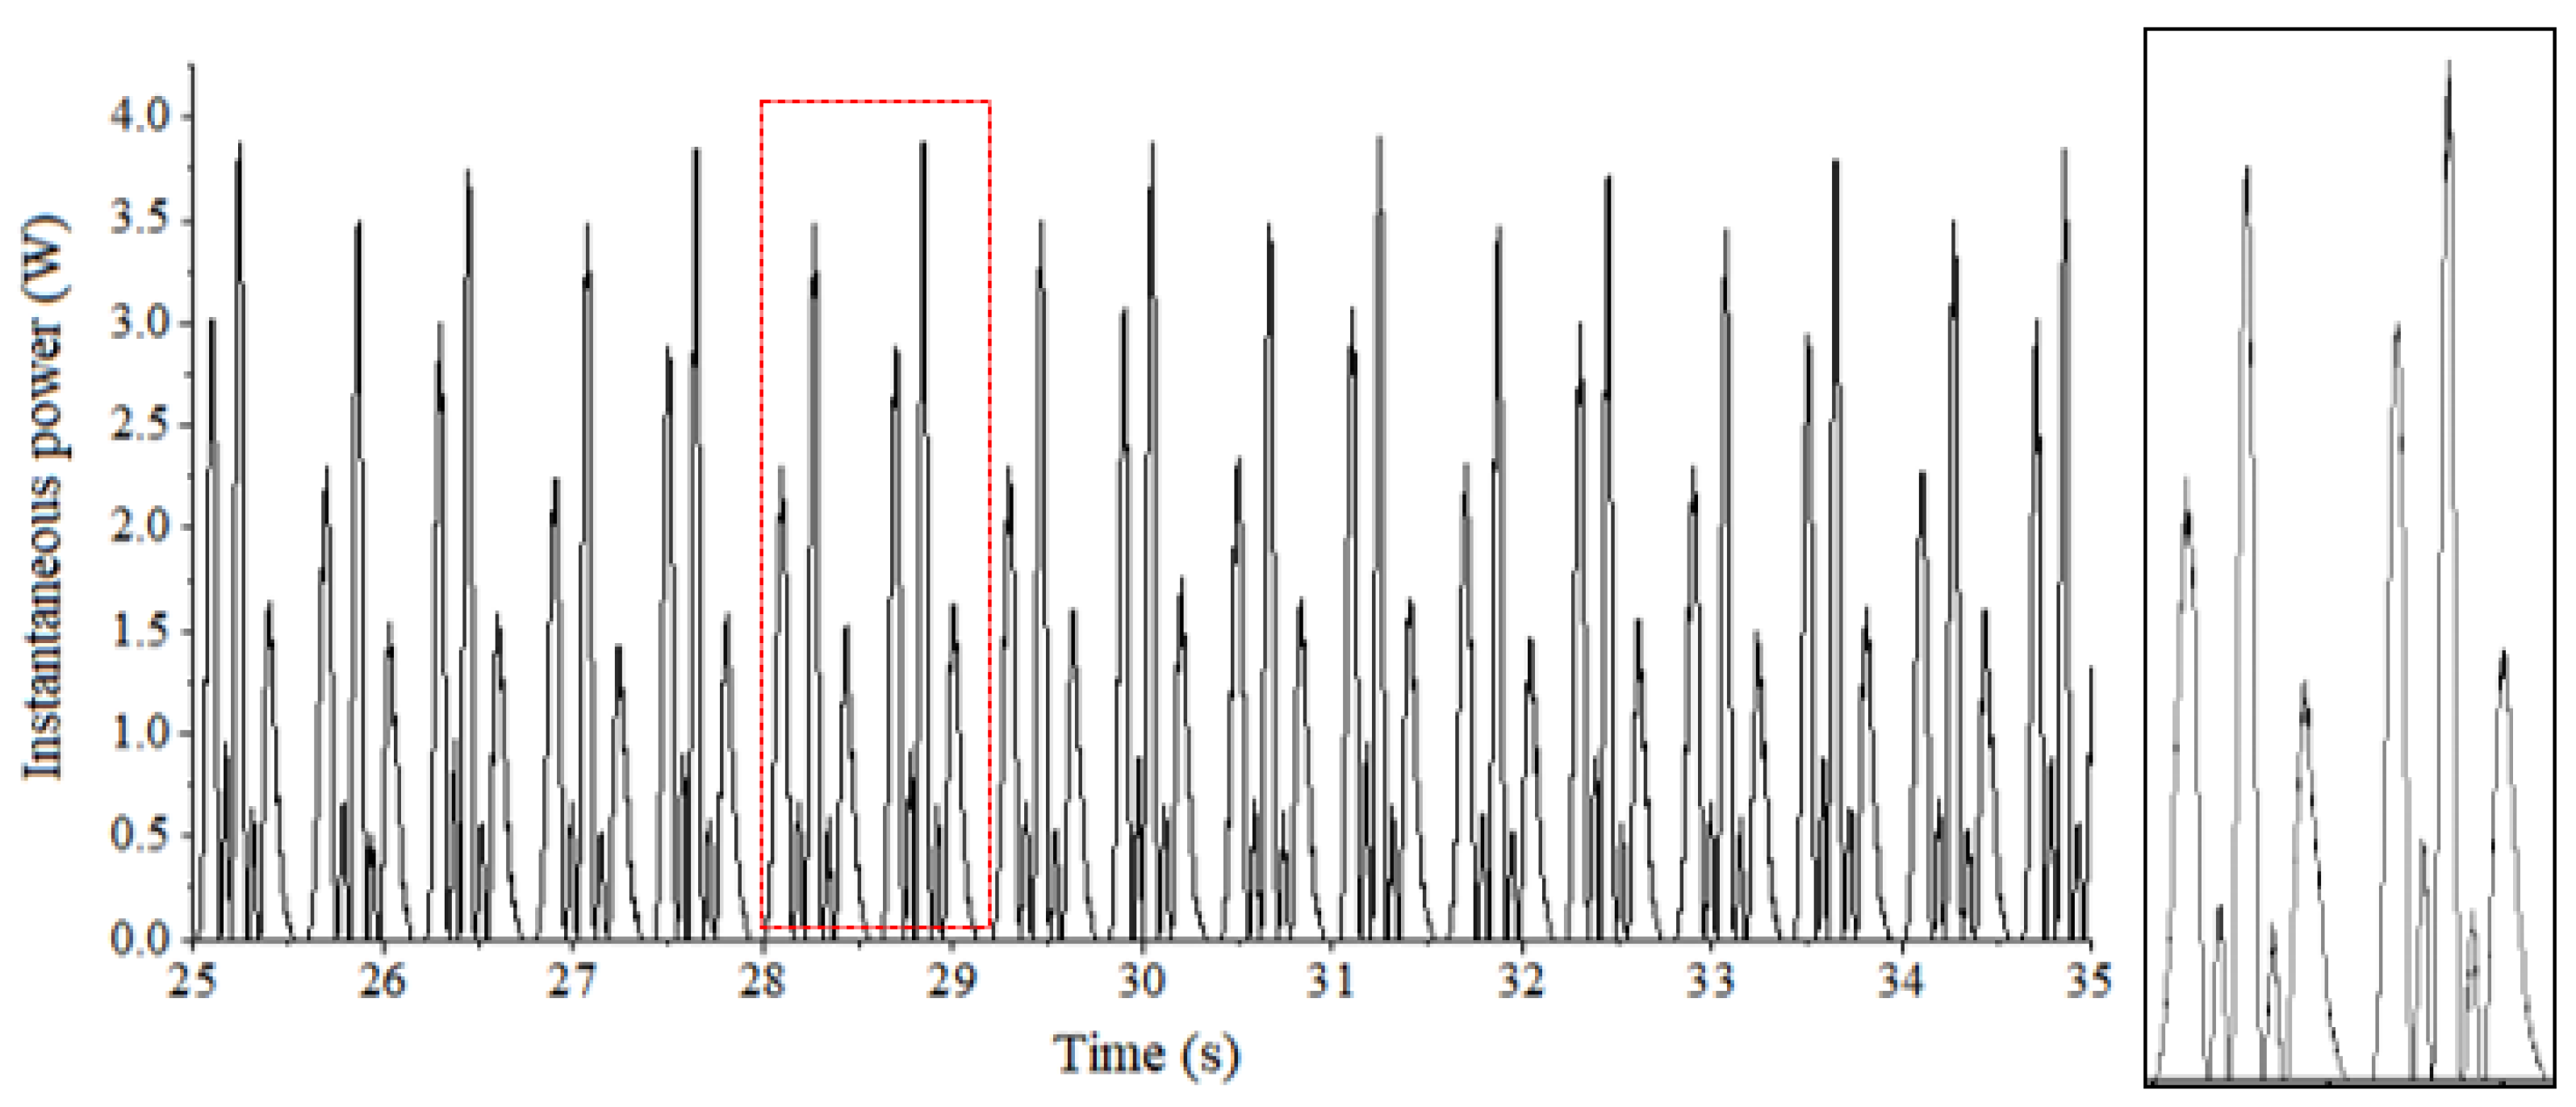
Thus, the instantaneous power variation of WEC within 25 s~35 s under various wave types is compared. The instantaneous power of traveling waves, partial standing waves and fully standing waves is calculated respectively.
The formula for calculating instantaneous power
p is as follows:
Here u denotes the voltage, and i denotes the current.
Figure 17,
Figure 18 and
Figure 19 show the comparative diagram of instantaneous power of the WEC under the conditions of traveling waves, partial standing waves and fully standing waves respectively when the water depth
h = 0.6 m and the incident wave period
T/
Tp = 1.0. It can be seen from these three figures that the instantaneous power peak of the WEC under traveling waves is stable at about 2.5 W. Furthermore, the peak value under partial standing waves is larger than 3 W. The instantaneous power peak of the WEC under fully standing waves exceeds 3.5 W, but its waveform is more irregular than that of traveling waves and partial standing waves, which indicates that the motion state of buoy is unstable during power generation. When the incident wave period
T/
Tp = 1.0, a total of 17 peaks occur within 10 s, and 8.7 waves are measured in the same time period. The calculated peak number of generations is exactly twice the number of waves.
4.3. Comparison of the Active Power
As in the calculation of instantaneous power, the active power of the oscillating buoy WEC under different wave types is also calculated. The related calculation method and expressions could be referred by Equations (3) and (4) in the previous research of Tao et al. [
35]. Furthermore, the obtained results are shown in
Figure 20,
Figure 21 and
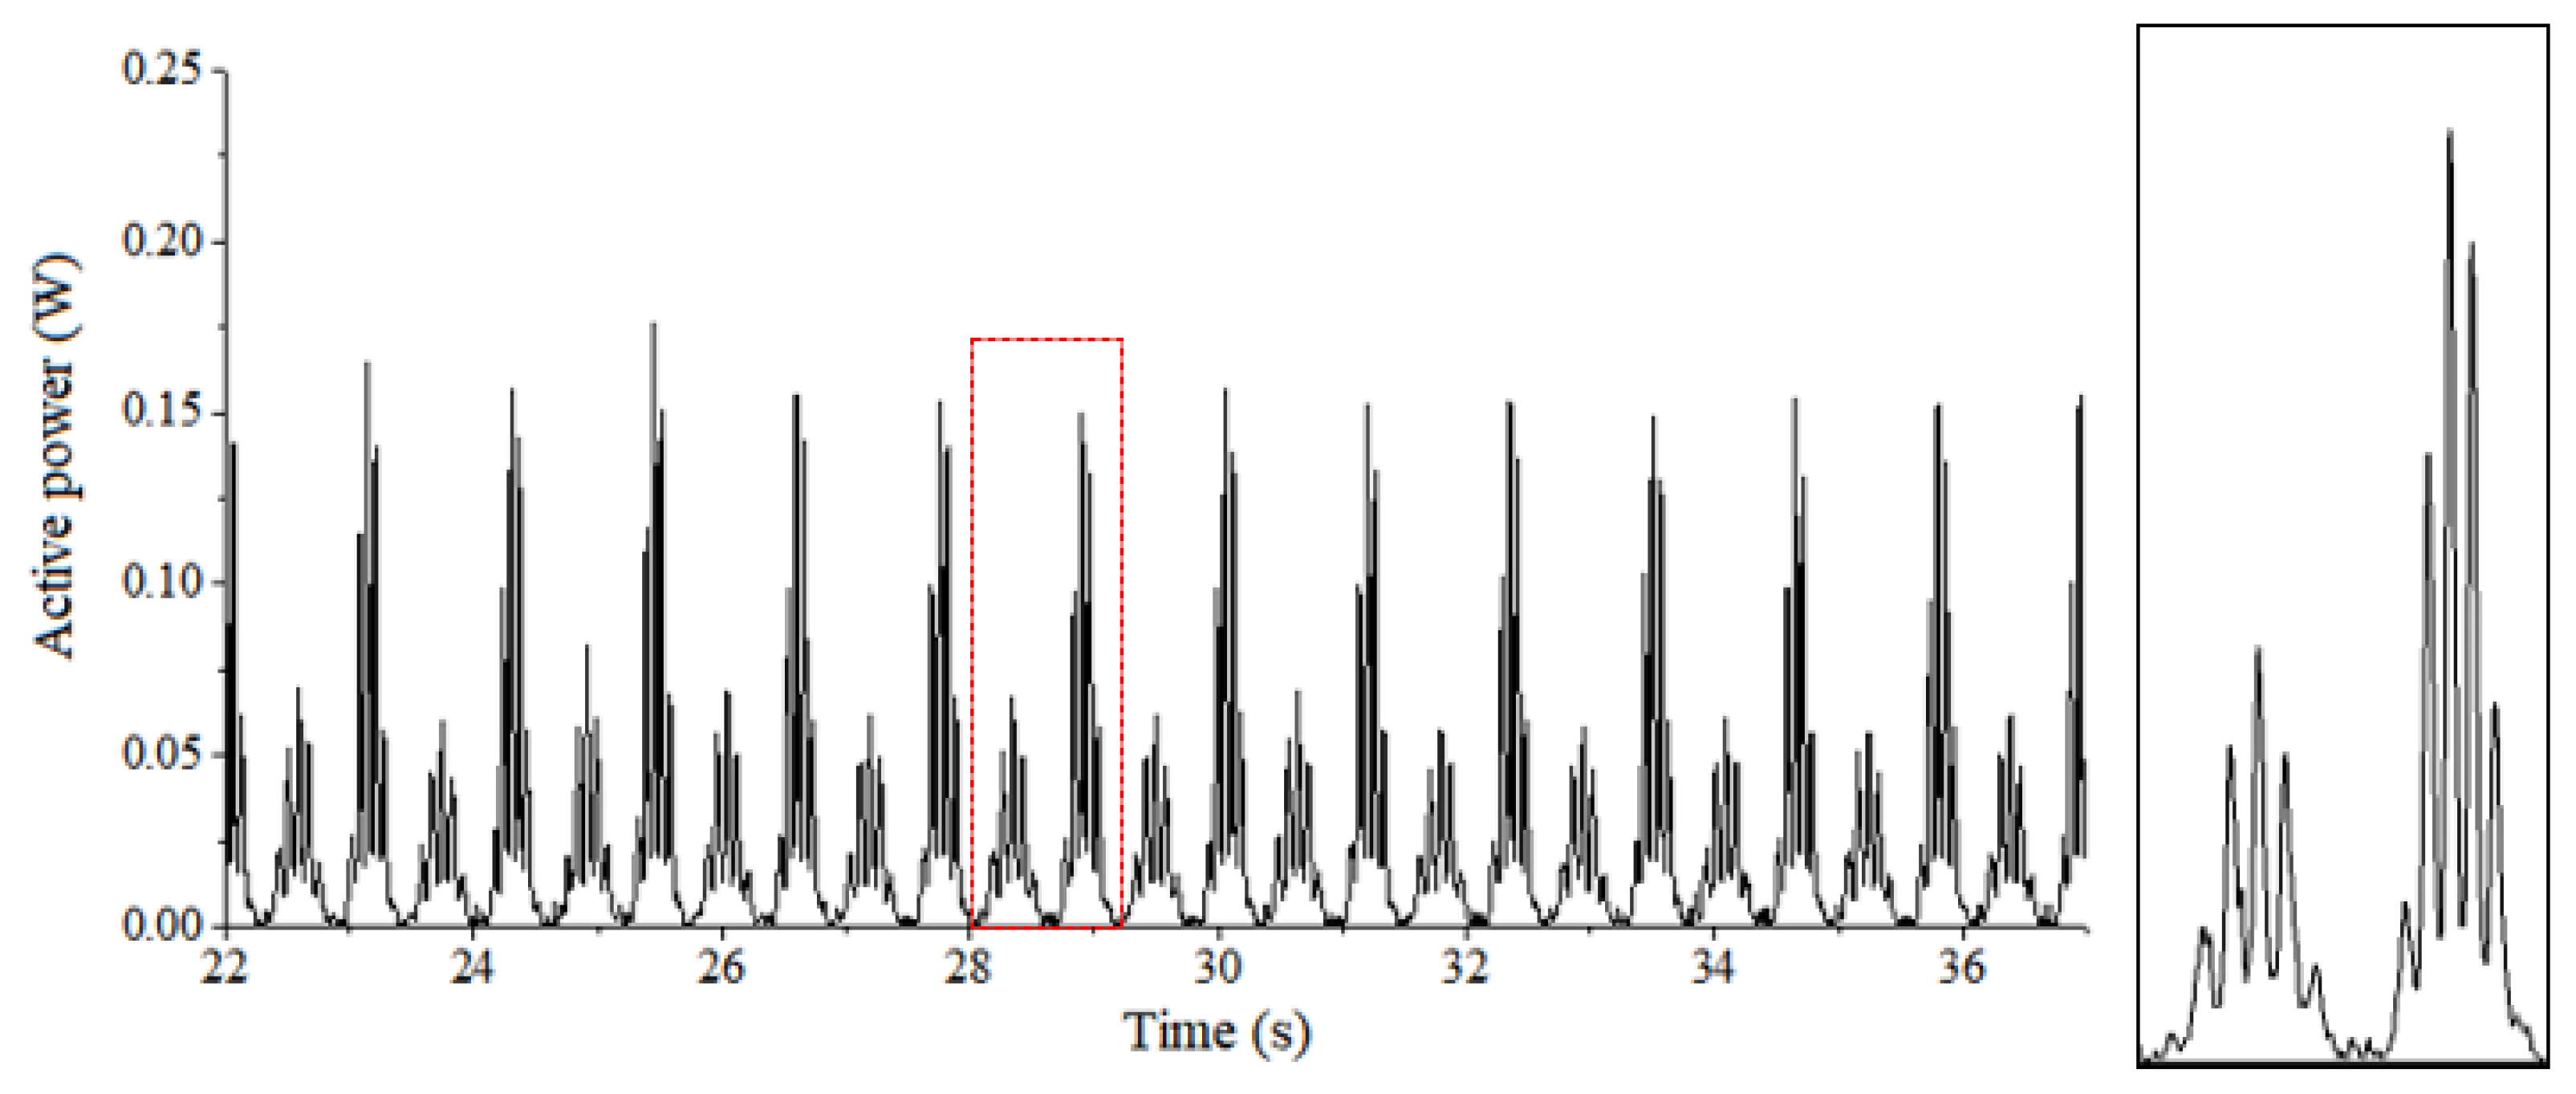
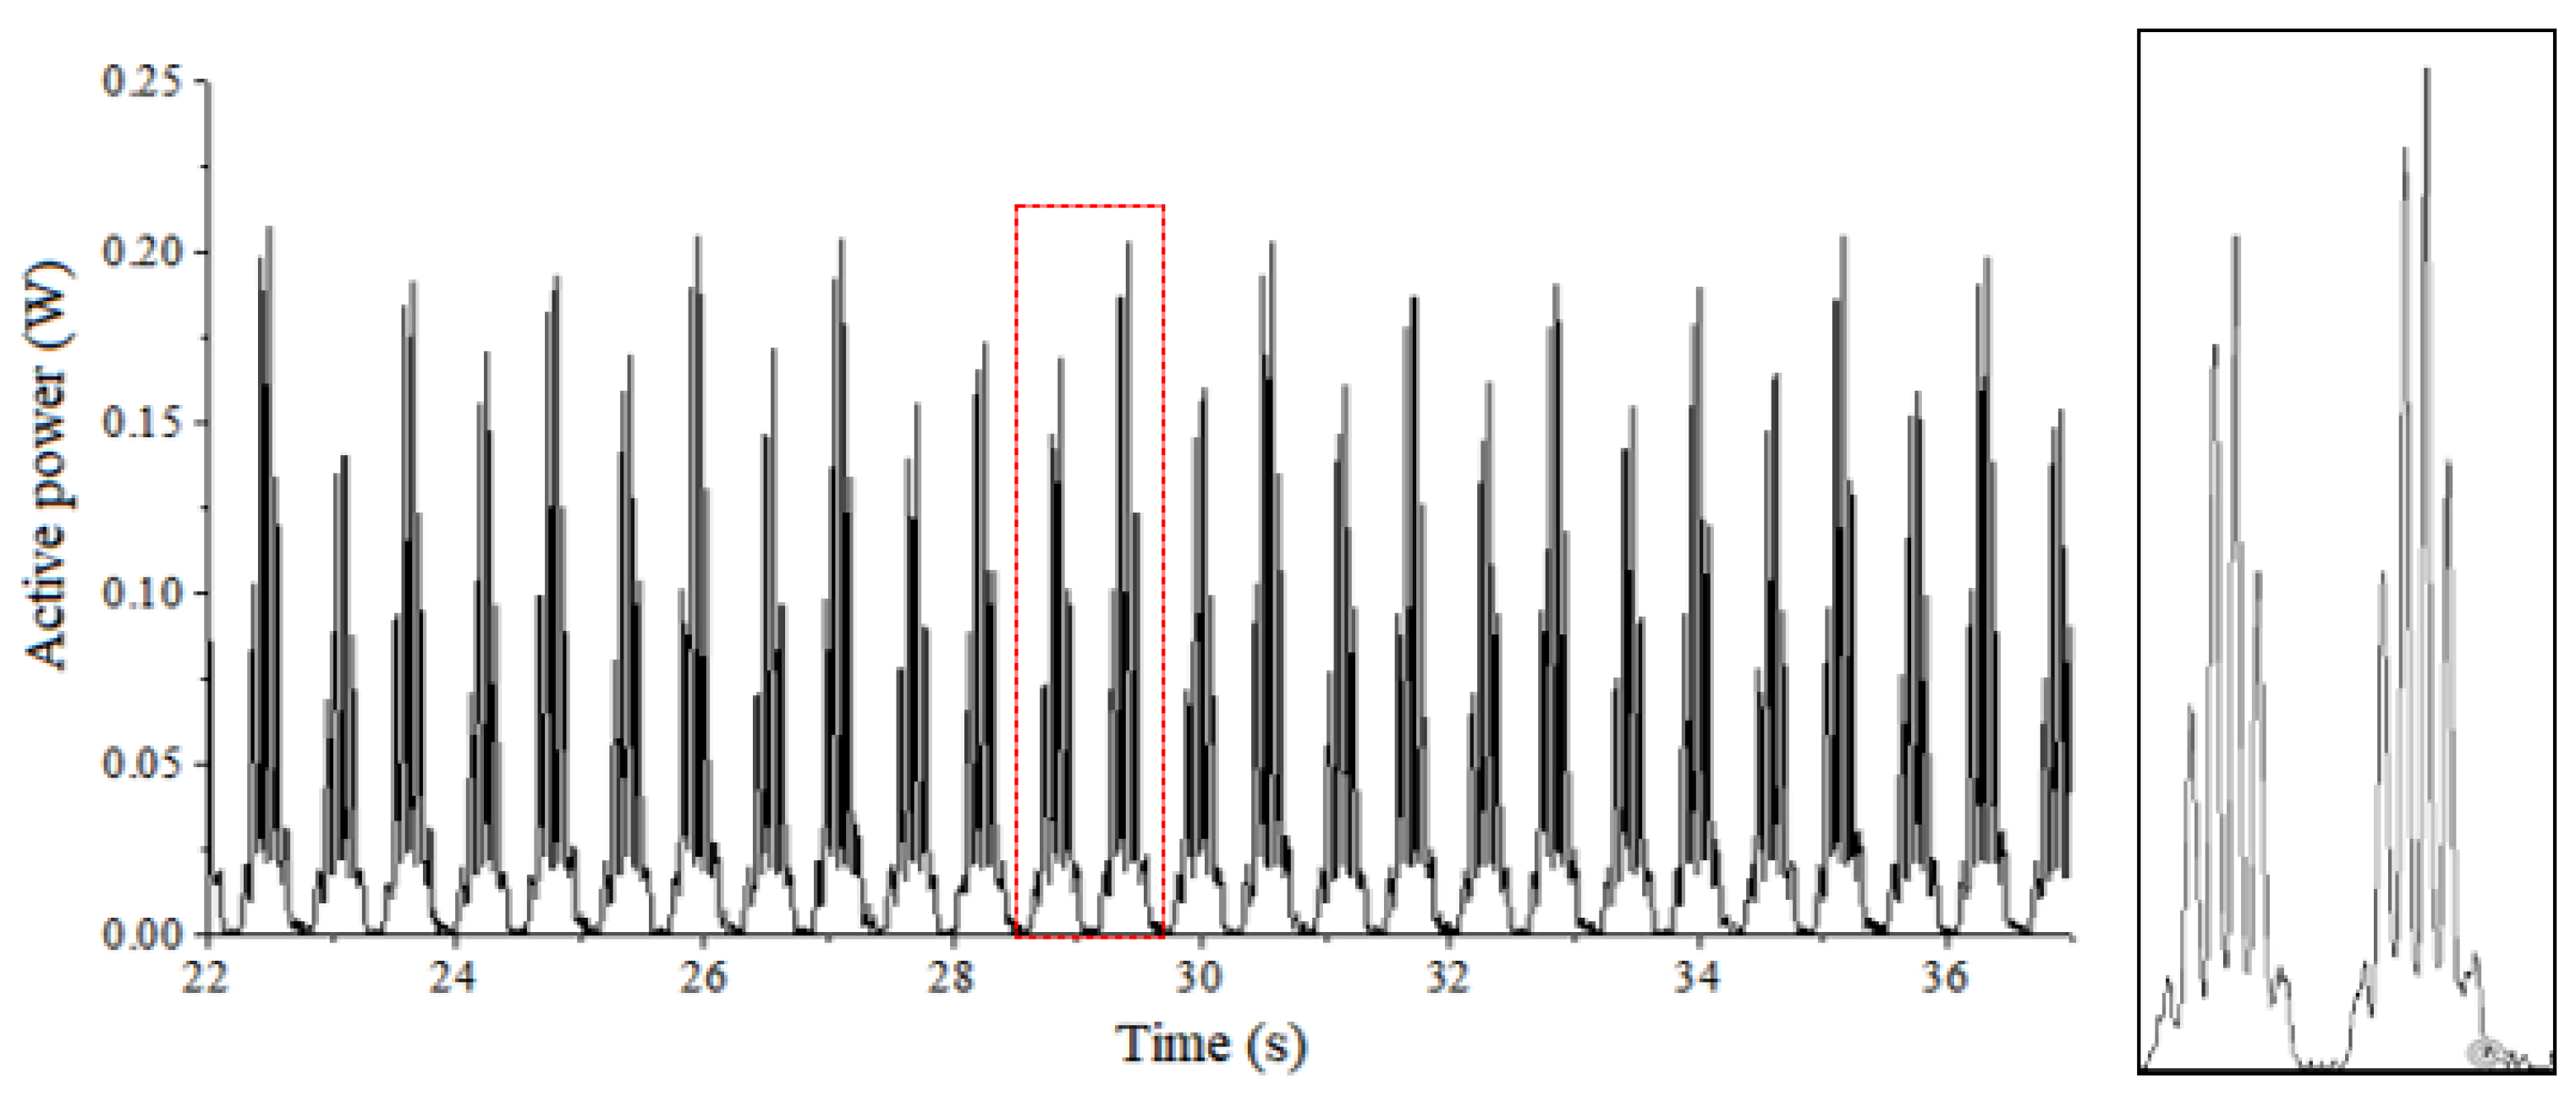
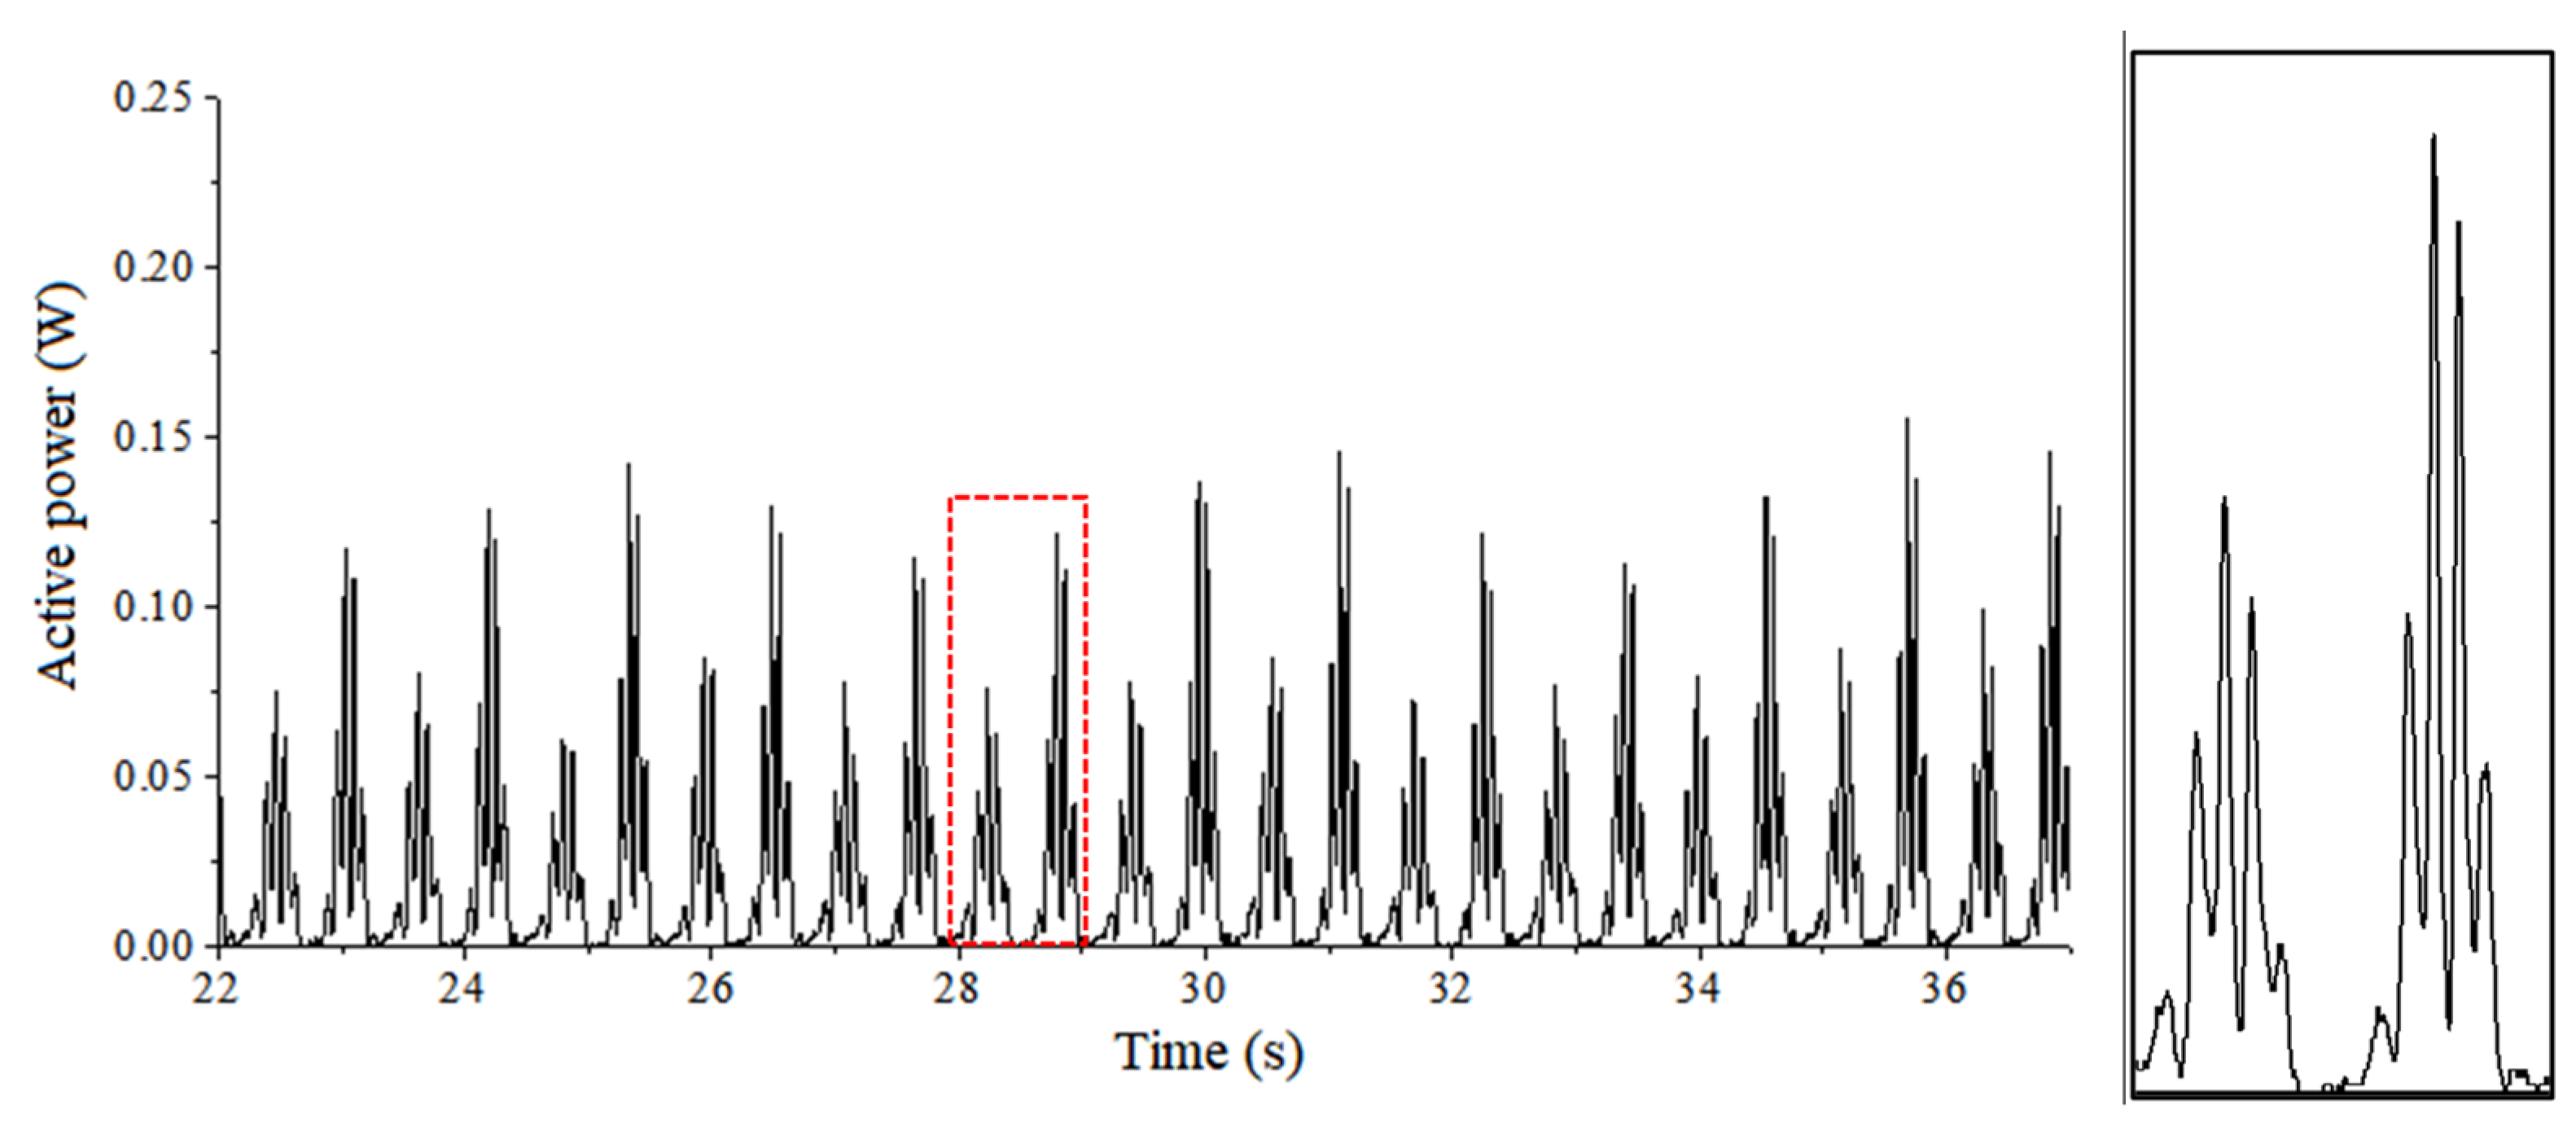
Figure 22, respectively, which are under conditions of traveling waves, partial standing waves and fully standing waves. Data from 22 s to 37 s are selected to calculate the active power. Active power, also known as the average power, is the average value of the instantaneous power integral consumed by the load within a period.
By comparison, when the water depth h = 0.6 m, the period T = 1.5 s and the wave type is partial standing waves, the active power value of the oscillating buoy WEC is the maximum, and the amplitude reaches 0.2 W; when the wave type is traveling waves, the active power amplitude of the generator exceeds 0.16 W; when the waves in the flume are fully standing waves, the active power amplitude of the WEC is about 0.12 W. Within 15 s, there are 26 active power peaks and 13 waves in the same time period, which is the same as the previous calculation of instantaneous power, and the peak number of the device generation is exactly twice the number of waves.
The total wave energy per unit wave crest width over one wavelength of three wave types is analyzed from the perspective of energy. Assuming that the maximum wave height is 2
H, when the wave type is traveling waves, the incident wave height is 2
H. The total wave energy per unit wave crest width over one wavelength
Et is given on the basis of the expression from [
36]:
For fully standing waves, the incident and reflected wave height are
H, and the total wave energy per unit wave crest width over one wavelength
Ef is as follows:
The total wave energy
Ep per unit wave crest width over one wavelength of partial standing waves is related to its reflection coefficient, which is between fully standing waves and partial standing waves. Therefore, when the maximum wave height is the same, the total wave energy per unit wave crest width over one wavelength is compared as follows:
Through the comparison of active power, in the case of T/Tp = 1.0 and h = 0.6 m, it is found that the active power of WEC is the smallest under fully standing waves, slightly larger than that under traveling waves and the maximum under partial standing waves. This is different from the previous analysis of three types of wave energy. The reasons might be concluded twofold as follows:
Firstly, the performance of oscillating buoy WEC under different wave types is related to the ratio of buoy diameter to wavelength. In traveling waves, the wave energy density is spatially uniform within a wavelength range. In fully standing waves, the wave energy density at the wave antinodes of a wavelength range is the largest, the wave energy density gradually decreases to the minimum at the wave nodes and it reaches zero at the wave nodes. Thus, in fully standing waves, the larger the ratio of buoy diameter to wavelength, the lower the performance of WEC. While in partial standing waves with the same maximum wave height, the wave energy density is the same at the wave antinodes and decreases gradually to the minimum at the wave nodes, but the wave energy density at the wave nodes is not zero. Therefore, for large ratio values of , the buoy of the same diameter has the lowest generation performance in fully standing waves. For the cases of T/Tp = 1.0, the values of are 0.380, 0.373 and 0.368 for 0.6 m, 0.7 m and 0.8 m water depths correspondingly in this study.
Then, for comparison between the situations under travelling waves and partial standing waves, the performance of oscillating buoy WEC is also related to the trajectories of water particles. The trajectories of the particles of traveling waves are elliptical. Under the action of wave force, the buoy will have heaving, surging and rolling movements in water simultaneously. For the linear motor used in this paper, the heaving energy can be converted directly into electric energy, while the friction damping of the motor is increased by surging and rolling, which will significantly affect the performance of power generation. The trajectories of water particles motion of the partial standing waves are oscillating in the vertical direction, so when the center of gravity of the buoy is the same as the x-axis coordinate of the point of the wave antinodes, the buoy is mainly subjected to the vertical wave force and oscillating vertically, which weakens the surging and rolling motion of the buoy. Thus, the effect of friction damping on the performance of motor generation is reduced. Therefore, when the maximum wave height in the flume is the same, the energy conversion performance of partial standing waves is higher than that of traveling waves. So, in general, considering the combined effects of the water particles’ trajectories and the ratio of buoy diameter to wavelength, the WEC could have the largest active power in partial standing waves.
4.4. Effects of Wave Types on the Performance of WEC under Different Wave Parameters
According to the active power calculation method, the active power curves corresponding to each group of working conditions in
Table 1 are obtained. By summing the active power
P in this time period, the average active power value
in that time period is obtained.
Due to the different velocity of wave energy propagation, the time period selected for calculation under different incident wave periods is not exactly the same. It is required that the active power waveform in the selected time period is more stable to ensure that the buoy is in a stable state. Under the same incident wave period, the calculated time period should be the same. If the incident wave periods are different, the starting point and the ending point of the calculated time period may be different correspondingly, but the length of the calculated time period keeps the same.
Figure 23,
Figure 24 and
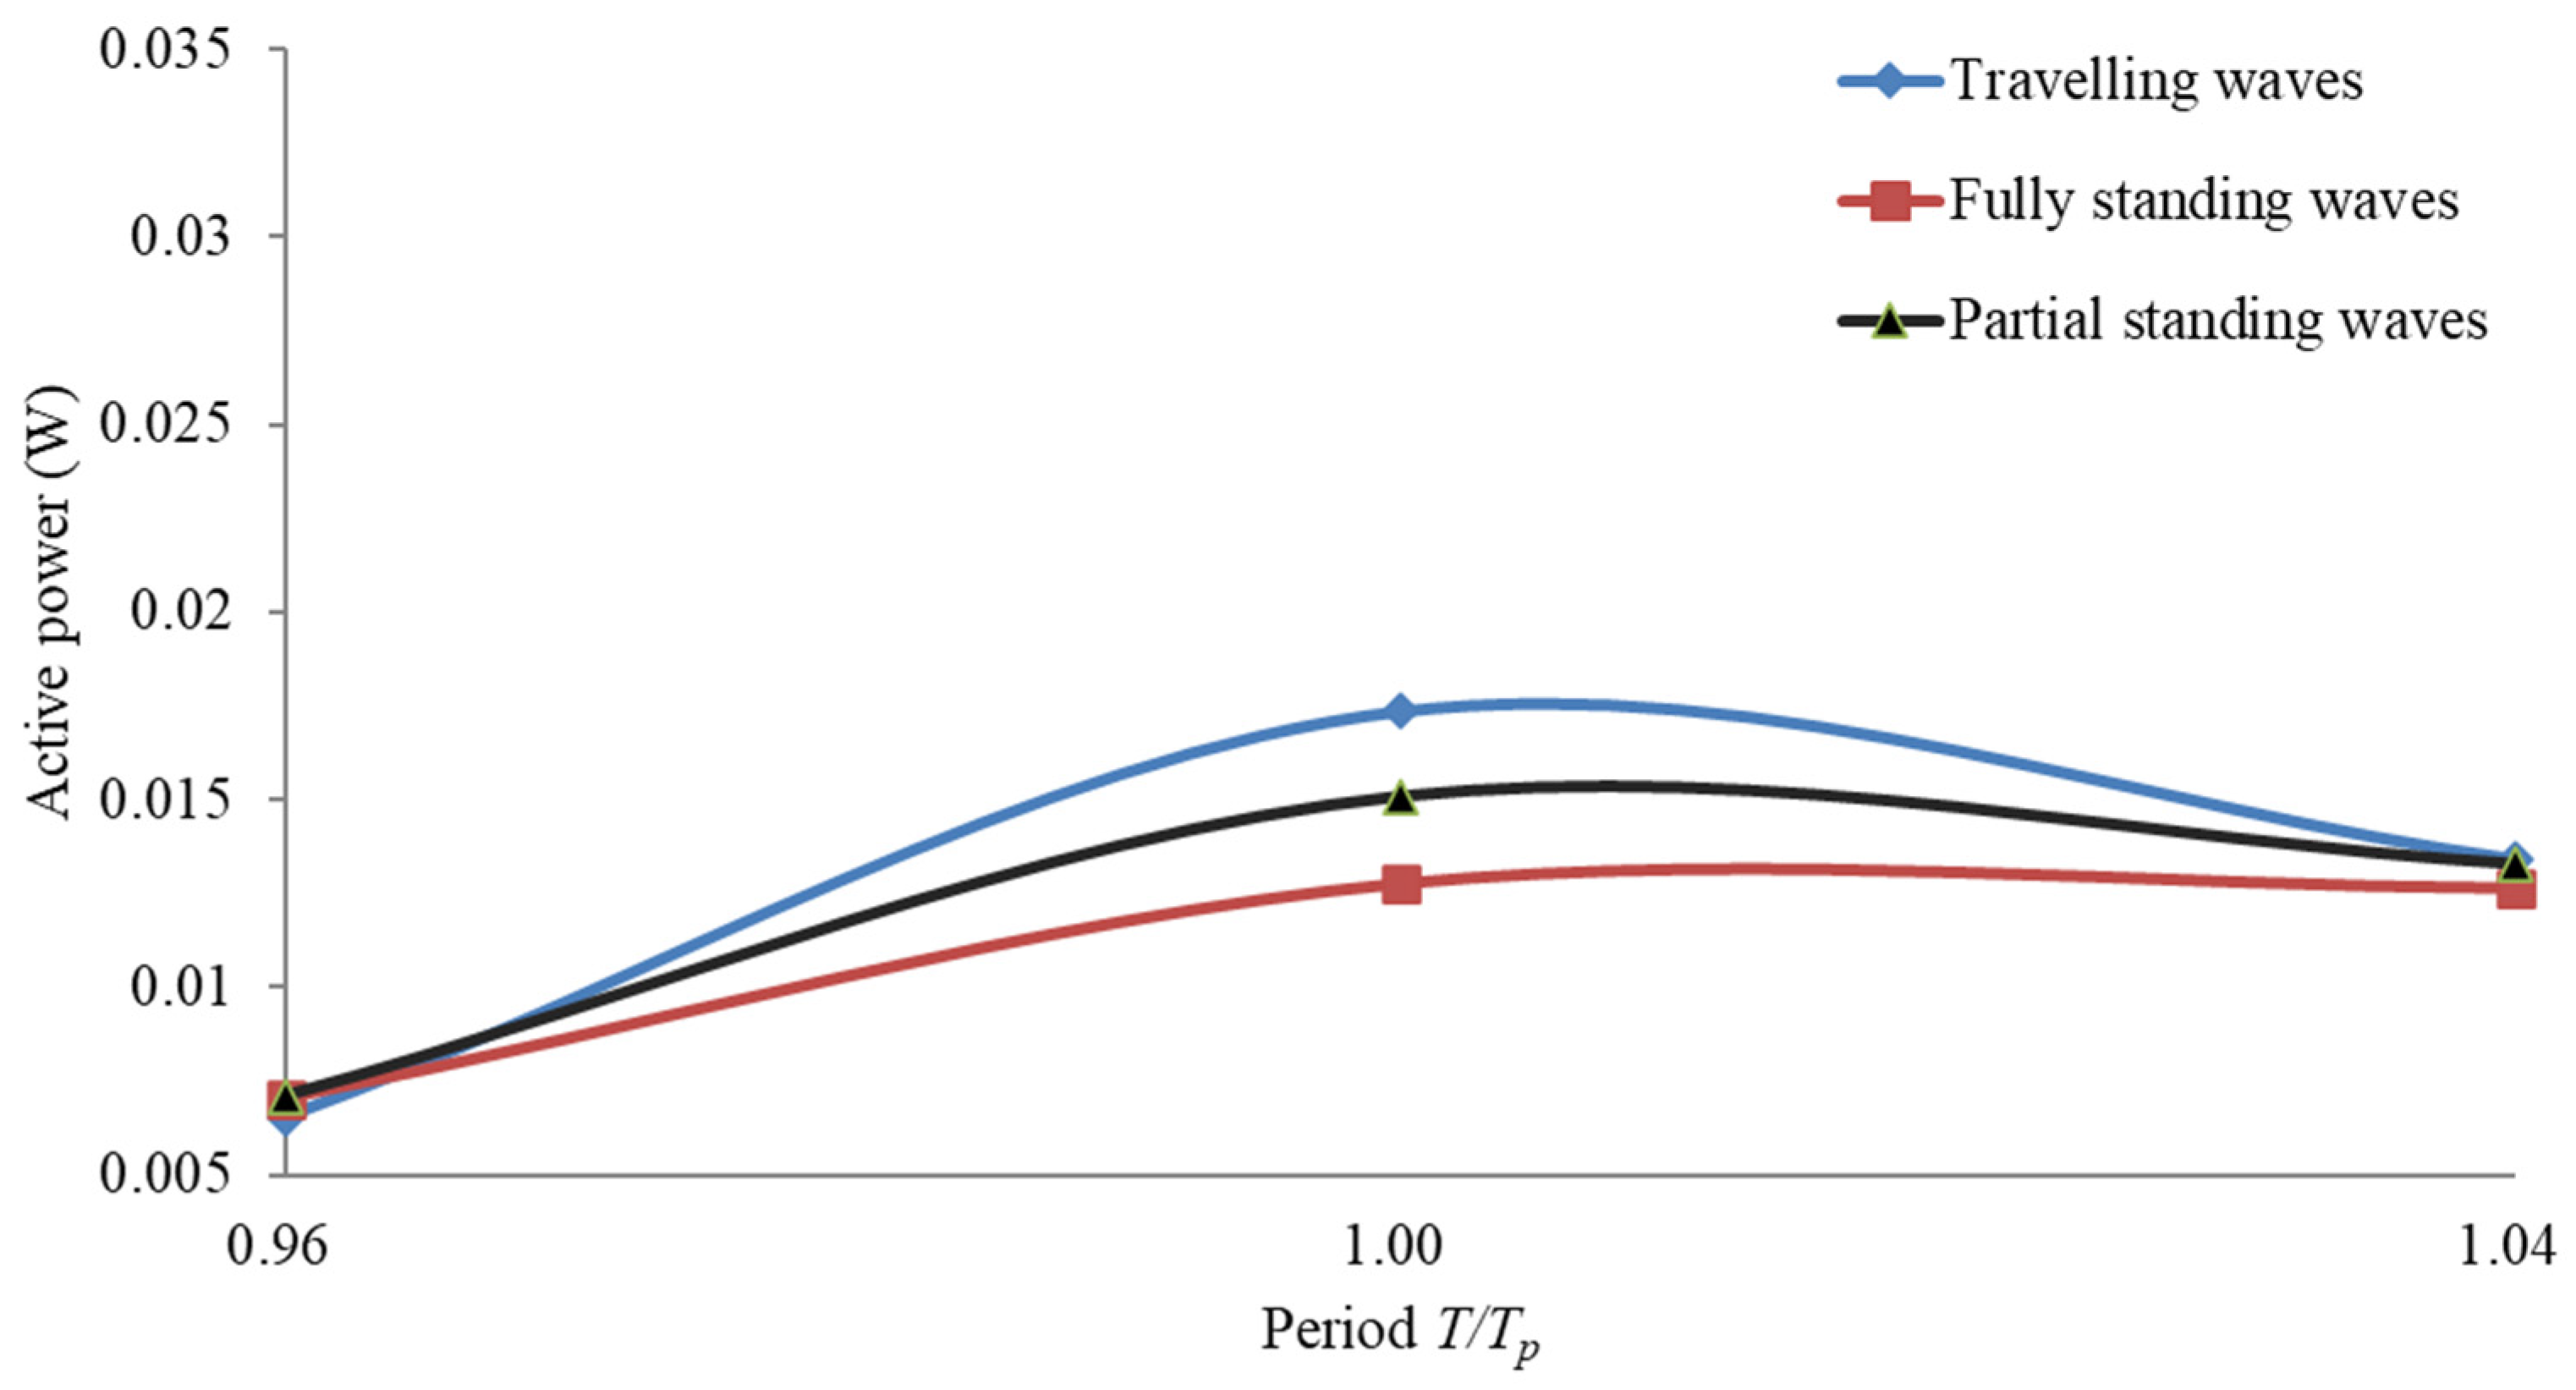
Figure 25 show the performance comparisons of oscillating buoy WEC under three different wave types. Among them, under the condition of partial standing waves, when the incident wave period
T/
Tp = 1.0, the average active power is the largest corresponding to the peak of Bragg reflection. In
Figure 23, when the incident wave period
T/
Tp = 0.96, since the Bragg resonance effect is relatively weak and the standing wave height is not significantly increased with respect to the incident wave height, the average active power value of the WEC under three wave types is basically identical. When the incident wave period
T/
Tp = 1.04, the average active power of the WEC under partial standing waves is the highest, followed by that under traveling waves. Furthermore, the average active power under fully standing waves is the lowest. The reason might be that, when the maximum wave height is the same, the total wave energy per unit wave crest width over one wavelength of the three different wave types is different, and the relationship can be expressed as
. However, the performance of wave energy generation is not only related to the density of wave energy but also to the motion trajectories of water particles. The buoy’s motion not only includes heaving but also surging and rolling under the condition of traveling waves, while the buoy only has heaving motion in partial standing waves at the wave antinodes. So, for the linear motor utilized in our flume experiments, the friction damping of the buoy decreases under the condition of partial standing waves, thus increasing the energy conversion performance. Therefore, the final total performance of the WEC under partial standing waves is higher than that in traveling waves.
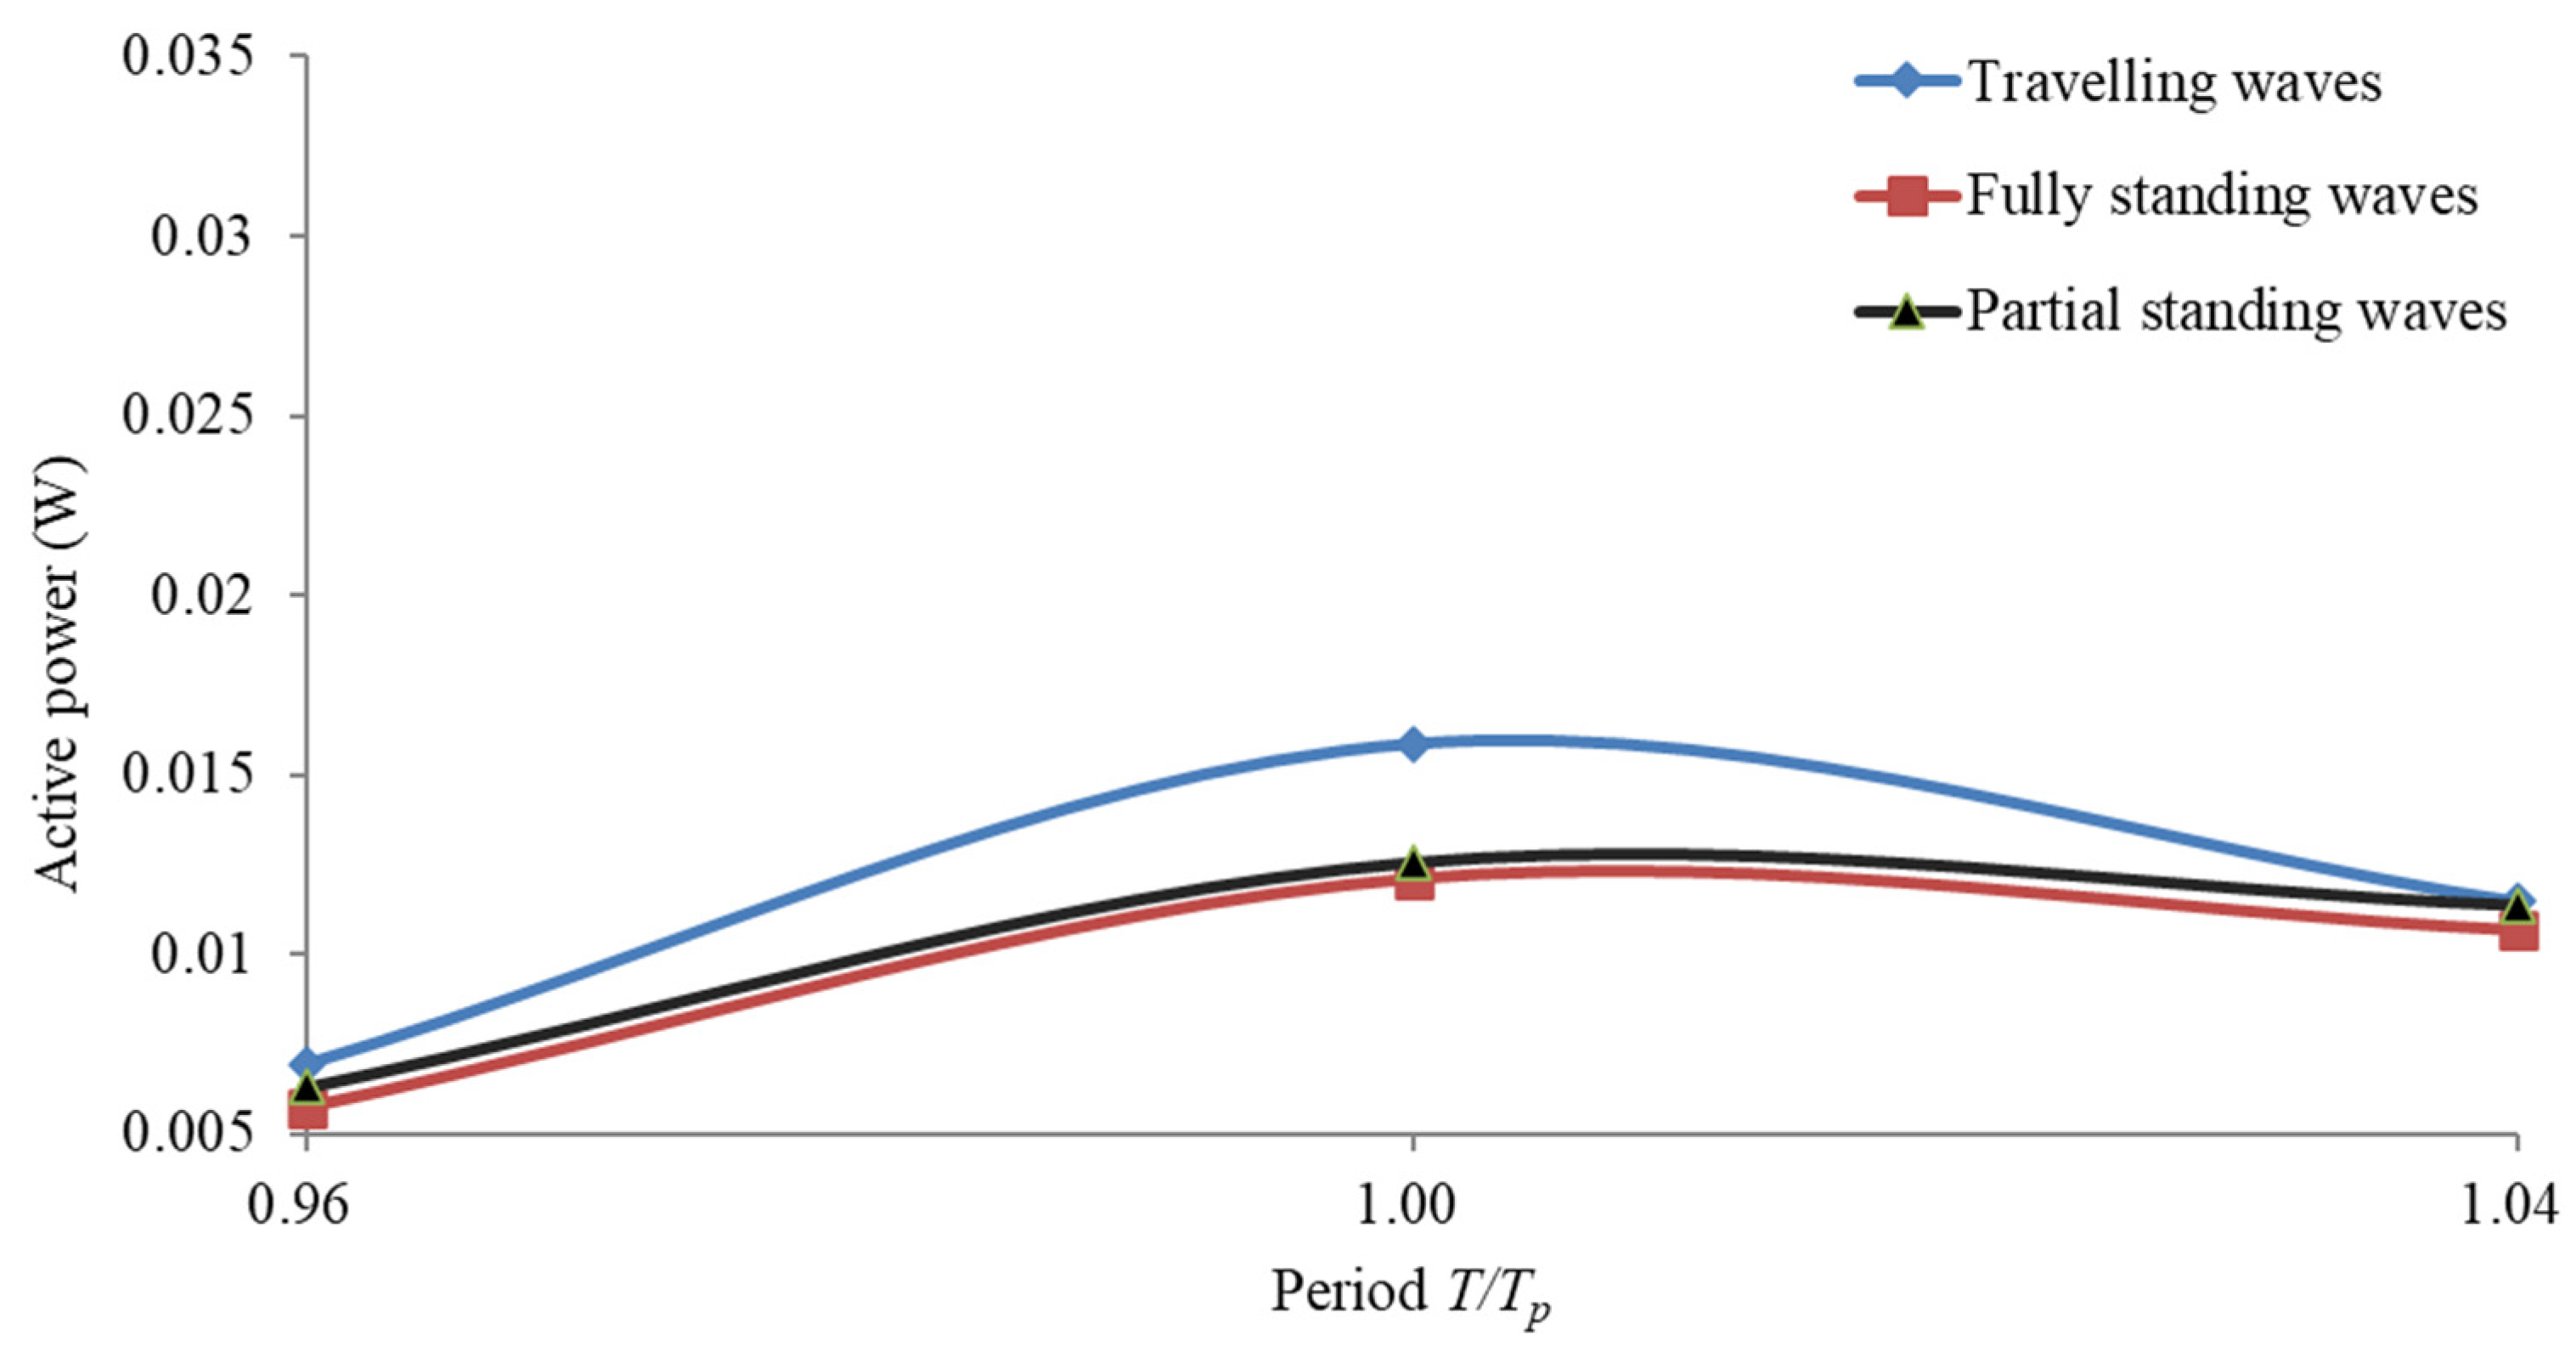
Figure 24 and
Figure 25 compare the performance of wave power generation device under three different wave types when the water depth of the flume is 0.7 m and 0.8 m, respectively. In these two figures, the oscillating buoy WEC has the highest power generation performance in traveling waves, which is second in partial standing waves and lowest in fully standing waves. In
Figure 25, the difference between the total wave energy and the energy conversion performance of these two kinds of (partial and fully) standing waves reduces further, so the generation performance is similar at different periods’ conditions. This might be related to the effects of increasing wavelength at larger water depth (compared with same buoy’s size, especially to the behavior of buoy’s oscillation under partial and fully standing wave conditions), which is stated in detail after.
Overall, when the water depth h = 0.6 m, the generation performance of partial standing waves is 39% higher than that of traveling waves and 65% higher than that of fully standing waves. For this condition (with large wave steepness and small wavelength), the improvement of the energy conversion performance of WEC by (partial) standing wave types along with the effects of associated water particles’ motion is quite obvious.
For the cases with larger water depth, the lifting effect of standing waves on the oscillating buoy wave power generation device is limited due to the smaller difference of the wave energy density and the decrease of the vertical motion distance of the buoy. In the following, the effects of ratio of buoy’s semi-major axis to the wavelength will be discussed. Under the condition of relatively large ratio of the semi-major axis to the wavelength of buoy (small L with small water depth) in this experiment, the differences of effects between fully standing waves and partial standing waves on the performance of generator are prominent at the same wave height. When the value of theis small, the buoy could be nearly regarded as a particle moving with free-surface oscillation, and the wave energy density within the buoy’s wave energy length range is basically identical. At this time, the generation performance of partial standing waves is the same as that of fully standing waves. When the value of theis large, the generation power of fully standing waves at the same wave height is smaller than that of partial standing waves and traveling waves, which is worth noting. This might be related to more complex nonlinear behaviors of water particles’ motion and buoy’s response, which need further investigation in the future. Besides, in China, some representative wave periods values are 3.2 s, 3.8 s, 4.0 s and 4.4 s, and the corresponding deep-water wavelengths are 16.0 m, 22.5 m, 25.0 m and 30.2 m respectively. For rough estimation of the effect of buoy’s size, their estimated ratios of buoy’s size to wavelength are no longer small values. Therefore, if the wave types’ influence is considered to improve the performance of oscillating buoy WEC, the effect of buoy size on generation performance should be evaluated (to avoid over-sized buoy device).
5. Conclusions
In this work, the influence of different wave types (travelling waves, partial and fully standing waves) on the energy conversion performance of oscillating buoy WEC is preliminarily studied by flume experiments. The measured instantaneous voltage, instantaneous current, instantaneous power and active power of the WEC are analyzed and compared under three different wave types. It is found that standing wave field could enhance the energy conversion performance of the oscillating buoy WEC to some extent. By representative experimental cases with 0.6 m water depth and the incident wave period T/Tp = 1.0, the performance of the WEC in partial standing waves is increased by 39% with respect to traveling waves of the same wave height, and this increment could not be ignored if the multiple submerged breakwaters exist in the seabed in nearshore areas.
Although the wave energy density among these three wave types (largest in traveling waves, second in partial standing waves and minimal in fully standing waves) is not consistent with the measurements concluded above, the trajectories could have more connections to the kinetical and dynamical behavior of oscillating buoy WEC facilities. Besides, higher wave steepness will increase the vertical motion distance of the buoy to enlarge the effects of standing waves on the performance of wave energy conversion. It should also be noted that, from the perspective of relative size of the buoy compared with the wavelength, the performance of WEC is also related to the ratio of buoy semi-major axis to wavelength. Due to the relatively large ratio in our flume experiment, the generation power of fully standing waves is smaller than that of partial standing waves and traveling waves. It reveals that should be limited when standing wave field is utilized to improve generation performance. So, the comparison results of dynamic response of oscillating buoy between fully and partial standing waves in this work might be limited with our experimental set-up. Furthermore, the detailed connections between oscillating buoy’s behavior and under fully and partial standing waves will be perused underway. Besides, the methodology in this study is based on flume experiments. In order to obtain more detailed response of the WEC oscillating buoy devices, the numerical simulation as well as its comparison with experimental results is necessary as future work.


