Article

Nitrogen Fixation in Subtropical Seagrass Sediments: Seasonal Patterns in Activity in Santa Rosa Sound, Florida, USA

1
Center for Environmental Diagnostics and Bioremediation, University of West Florida, 11000 University Parkway, Pensacola, FL 32561, USA
2
Darling Marine Center, University of Maine, 193 Clarks Cove Road, Walpole, ME 04573, USA
*
Author to whom correspondence should be addressed.
J. Mar. Sci. Eng. 2021, 9(7), 766; https://doi.org/10.3390/jmse9070766
Submission received: 16 May 2021 / Revised: 9 July 2021 / Accepted: 10 July 2021 / Published: 14 July 2021

Abstract

:
Seagrass beds are important coastal habitats that are diminishing globally. Nitrogen, a key nutrient, often limits seagrass growth. Nitrogen fixation provides new, bioavailable nitrogen to the plants. This study explores its importance and factors controlling rates in sediments colonized by two dominant taxa in Northwest Florida, Thalassia testudinum and Halodule wrightii, compared to unvegetated sediments. We hypothesized that nitrogen fixation rates would be greater in seagrass colonized sediments, particularly during high growth periods. We expected to observe a positive relationship between rates and porewater sulfide concentrations because sulfate reducers were the dominant diazotrophs in similar studies. Rates were higher in vegetated areas. In H. wrightii beds, nitrogen fixation was driven by the decreased availability of porewater ammonium relative to phosphorus. In T. testudinum beds, rates were highest during winter. Organic matter may be a controlling factor in all substrate types albeit the exact mechanism driving nitrogen fixation differs slightly. During the summer and fall, nitrogen fixation provided between 1–15% of T. testudinum nitrogen demand. Annually, nitrogen fixation provided 4% and 1% of T. testudinum and H. wrightii nitrogen demand, respectively. Nitrogen fixation was an important source of nitrogen during periods of senescence and dormancy when organic matter content was high.

1. Introduction

Seagrass beds are critical marine habitats that increase biodiversity by providing habitat during vital periods of the life histories of many commercially and recreationally important vertebrate and invertebrate species [1]. Due to extensive rhizomes and multitudes of leaves, they stabilize sediments, decrease wave attenuation, prevent the resuspension of particles, improve water quality and protect shorelines [2,3]. Seagrasses play a significant role in global carbon and nutrient cycling [4] as well as reducing bacterial pathogens [5]. Although seagrasses are important coastal resources, more than 40 large scale declines of 24 different species have been reported since the 1970s [6].
Seagrass meadows demonstrate natural cycles of expansion and decline on the scale of several years or even decades. They also experience annual cycles composed of several key periods of growth. In the Northern Gulf of Mexico, the key periods include early growth (March through April), peak growth (May through July) and late growth (August through mid-September) [7,8]. Senescence and dormancy take place in fall and winter months. Seagrasses slough off their leaves during senescence which occurs from late September to December. Following senescence, dormancy generally takes place during January and February. Seagrass growth, productivity and reproduction change throughout the annual growth cycle due to factors such as temperature, light attenuation, salinity, epiphytic and algal growth, phytoplankton productivity in the water column, substrate quality and nutrient availability [9].
Like all plants, seagrass productivity is primarily altered and dictated by the availability of nutrients, frequently nitrogen [10]. Nitrogen fixation, the reduction of dinitrogen (N2) to ammonium (NH4+), is a key nitrogen cycling process due to its generation of biologically available nitrogen from a source otherwise unavailable to most organisms [11]. This process is solely carried out by prokaryotes, known as diazotrophs, and include both bacteria and archaea [12]. Nitrogenase is the enzyme complex required for nitrogen fixation [13], and all of its necessary components are encoded by the nif genes. In some diazotrophs that lack the ability to protect the enzyme system from external conditions, exposure to oxygen can decrease or inhibit expression of nitrogenase [12]. Other environmental conditions that influence the level of nitrogenase are ammonium concentrations, light availability and energy availability. Diazotrophs are found on seagrass leaves and in sediments surrounding seagrass root systems [10].
Although seagrasses are able to take up nitrogen from the water column and sediment, they obtain nitrogen mainly from the sediments [14,15]. Therefore, nitrogen fixation in sediments is potentially an important source of nitrogen for seagrasses. Nitrogen fixation rates are usually higher in seagrass colonized sediments compared to unvegetated sediments [3,16,17,18], where they are often associated with the seagrass rhizosphere [19,20]. Nitrogen fixation activity increases as belowground biomass increases [3,21], indicating that the rhizosphere provides a propitious environment for diazotrophic microbial communities to develop and thrive [3,22]. Seagrass rhizomes release oxygen and organic compounds, including labile carbon which create an attractive environment for diazotrophs. Some sulfate reducing bacteria can fix nitrogen and may be important diazotrophs in marine sediments [23,24,25,26]. Cook et al. [27] found that nitrogen fixation corresponded to increases in plant biomass, consistent with the idea that seagrasses supply labile, organic compounds to sulfate-reducing diazotrophs. Sulfate reduction was correlated with nitrogen fixation even when ammonium concentrations were relatively high (1 mM), and the overlying water column was hypoxic [28,29,30]. In previous studies, sulfate reduction was stimulated and enhanced by the root exudates released by belowground seagrass biomass, which also stimulated nitrogen fixation [3,17,31,32]. However, hydrogen sulfide produced by sulfate reduction inhibits plant growth and decreases nutrient uptake by the plant [33]. Sulfide toxicity can be a serious problem by inhibiting growth and killing seagrasses if concentrations reach thresholds of approximately 300 μM and 2000 μM, respectively [34]. In organic-rich sediments, bacterial activity is increased, the anoxic layer is very close to the sediment surface, and hydrogen sulfide concentrations can be high [22]. To combat this detrimental impact from hydrogen sulfide, seagrasses pump oxygen through their root systems to oxidize the toxic hydrogen sulfide [35].
This study was carried out in the northern Gulf of Mexico, where the two dominant, subtropical seagrass species, Thalassia testudinum (turtle grass) and Halodule wrightii (shoal grass), have experienced declines due to anthropogenic causes. In the Pensacola Bay system, increased nutrient input resulted in significant decreases in submerged aquatic vegetation from the late 1940s to the early 1970s [36]. Understanding how different nitrogen cycling processes contribute to the total seagrass nitrogen demand is vital for understanding the factors limiting their productivity and guiding appropriate management actions. We compared the role of nitrogen fixation in T. testudinum, H. wrightii and unvegetated sediments at Big Sabine Point, Florida, USA. The sampling of nitrogen fixation encompassed an entire year to assess how it changed over the annual growth cycle of seagrass. We examined how nitrogen fixation was affected by seasonality, biogeochemical conditions of the sediment and overlying water column and seagrass colonization. We hypothesized that nitrogen fixation rates would be higher in seagrass colonized sediments than unvegetated sediments and during periods of high seagrass productivity. Because the activity of sulfate reducers has been linked with nitrogen fixation in seagrass beds [37], we hypothesized that nitrogen fixation rates would correlate with porewater sulfide concentration, a reflection of sulfate reduction activity, regardless of porewater ammonium concentrations.

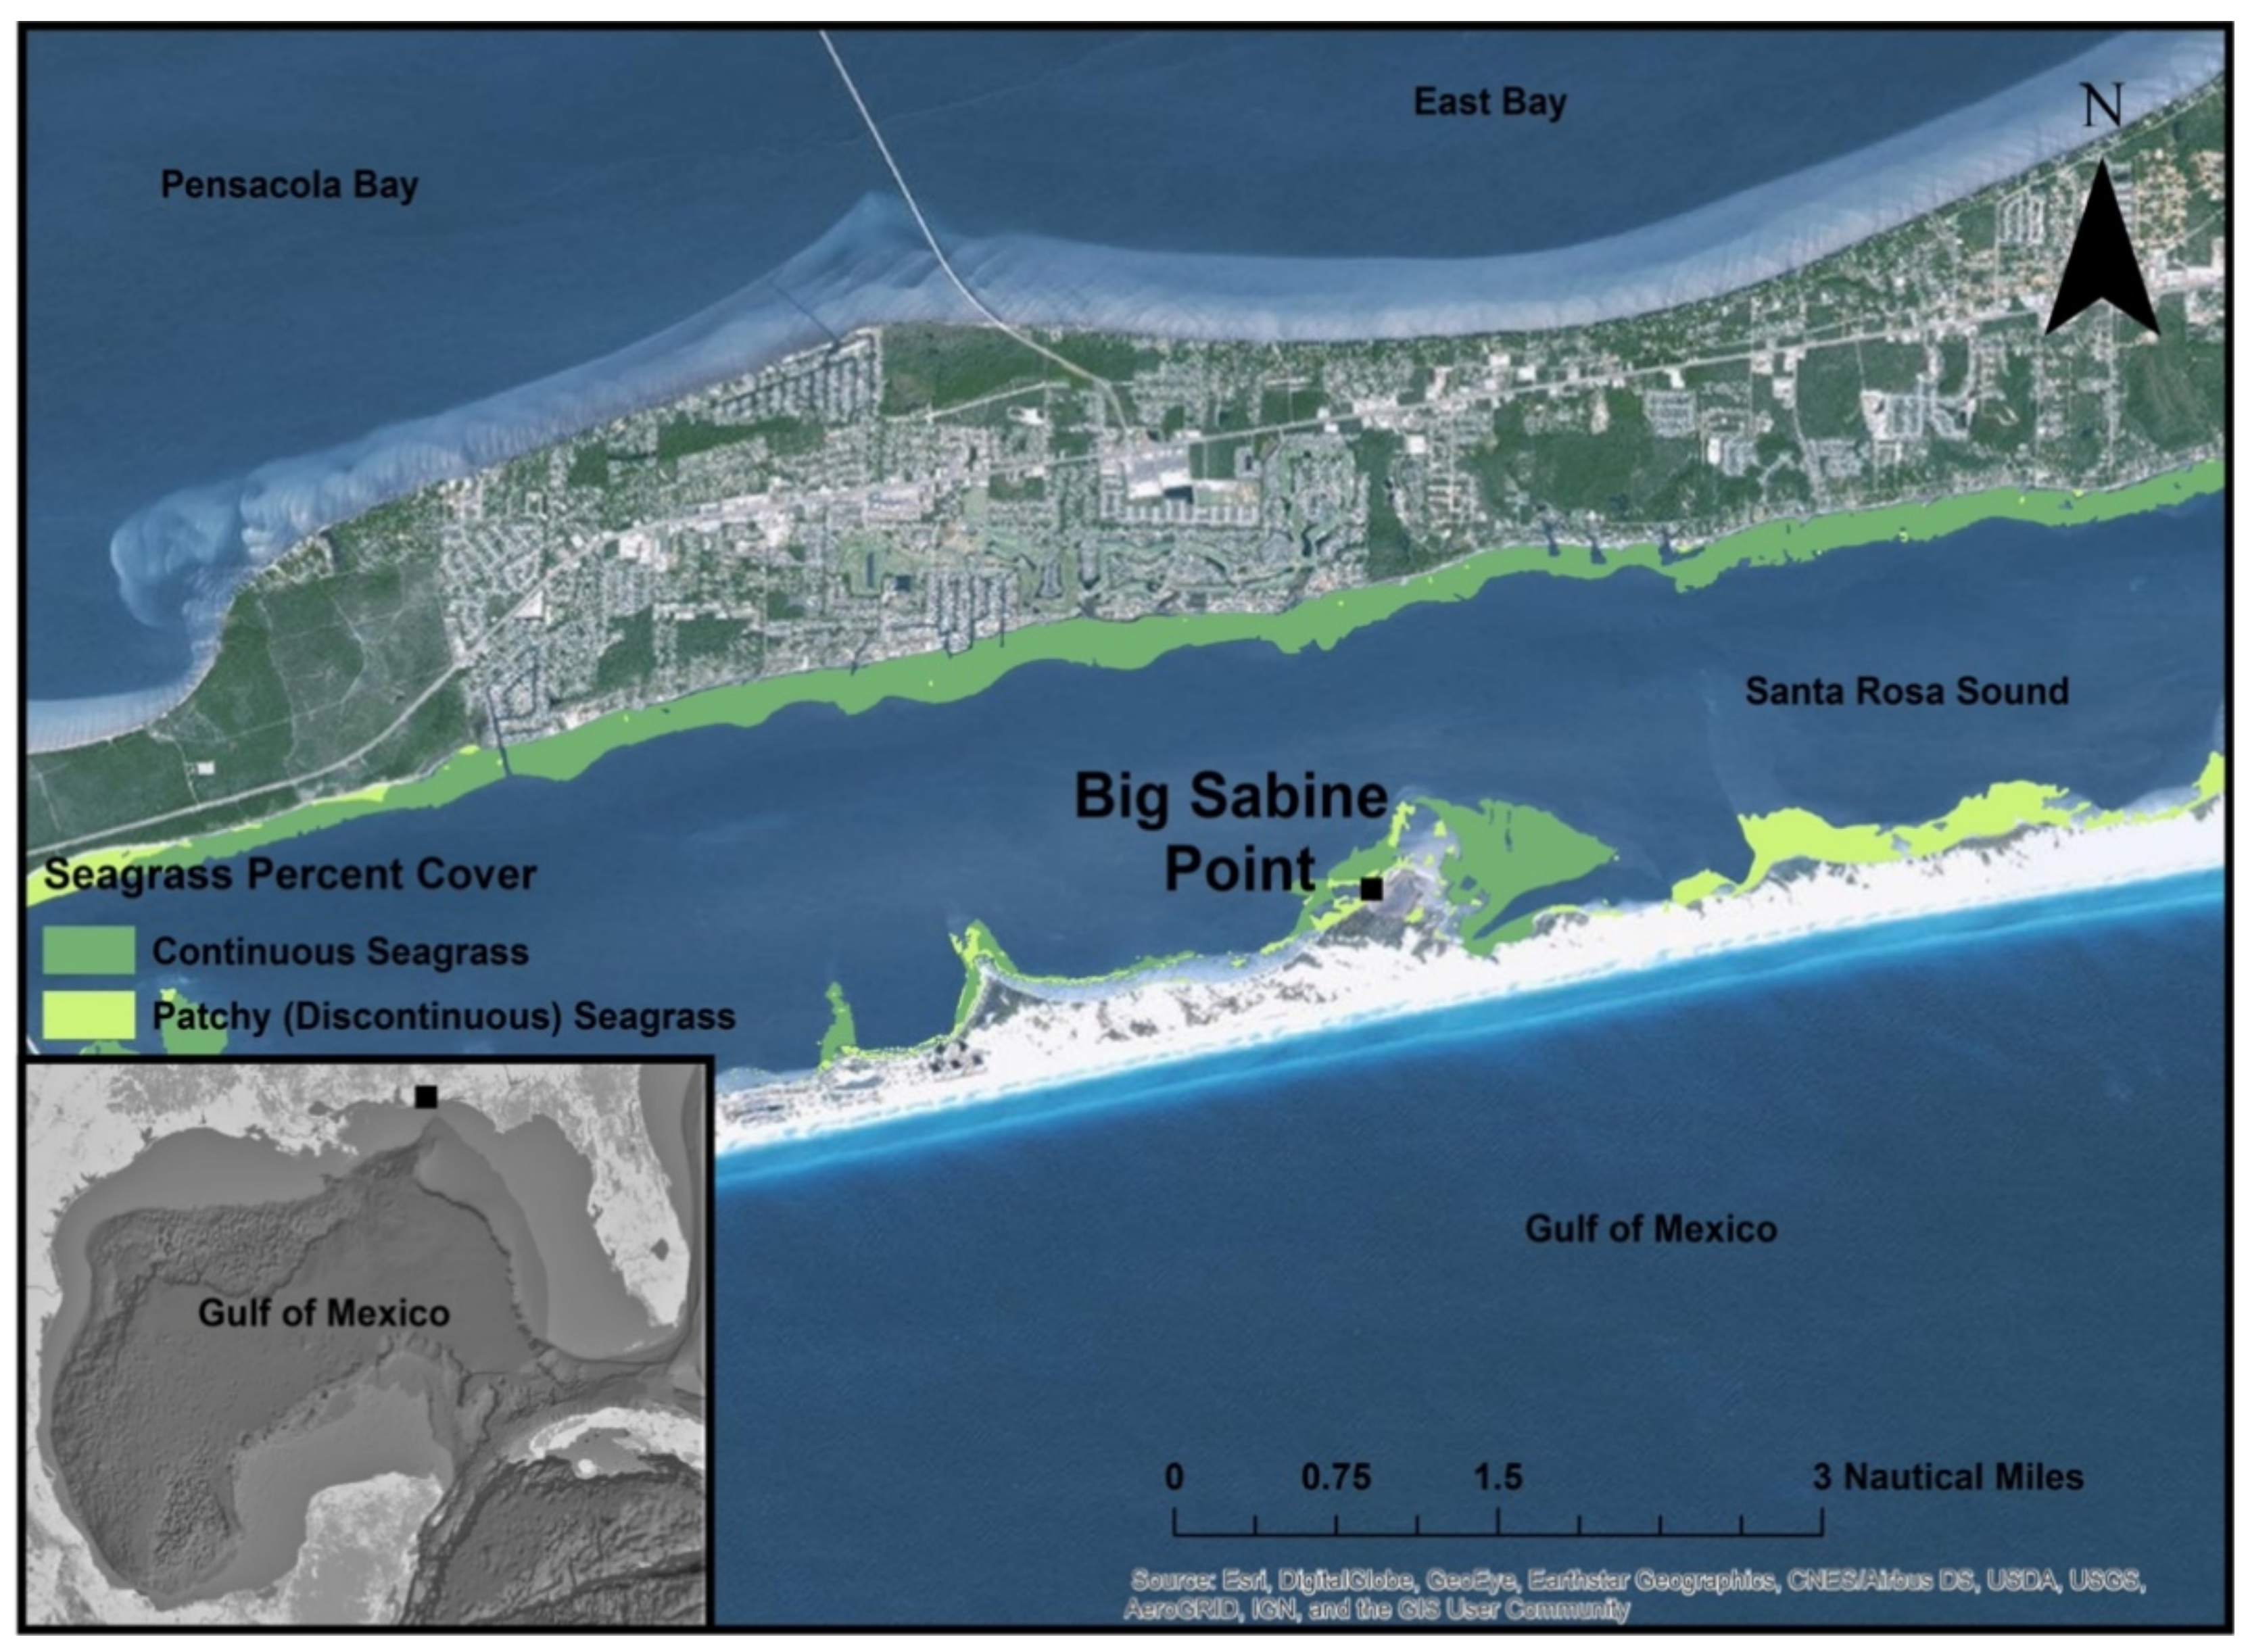
2. Materials and Methods

The Pensacola Bay System (PBS) watershed covers almost 18,130 km2 [38]. Two-thirds of the watershed is located in Alabama, and the remainder is located in Florida. This watershed drains mostly agricultural land, but urbanized areas also contribute significant non-point source runoff to the system [38]. Freshwater inputs to the Pensacola Bay System average 245 m3 s−1 [39], and salinity within the estuary fluctuates throughout time and space in the system based on rainfall in the watershed. Low evaporation rates during the winter and high rates during the summer exacerbate this effect. This study was conducted in Santa Rosa Sound, a subestuary of the PBS and a shallow (<10 m) 109 km2 lagoon [38,39]. Water temperatures range from 15 to 32 °C in Santa Rosa Sound (SRS) [40]. SRS has a 0.5 m tidal range and tides are diurnal [41]. It is well mixed and oxygenated throughout the year due to the relatively shallow water. In the PBS, T. testudinum and H. wrightii are the dominant species [42]. Syringodium filiforme (manatee grass) also occurs in the PBS, but it is not as common as T. testudinum or H. wrightii [42]. In SRS, seagrass presence is almost continuous on the north and south shores [42]. The study site at Big Sabine Point in Santa Rosa Sound (Northwest Florida) was selected because it was undeveloped and experienced little anthropogenic pressure relative to other nearby seagrass meadows (Figure 1). Sediments found at this site are almost entirely composed of quartz sands [40,43]. Both species of interest, T. testudinum and H. wrightii, occurred at this locale in monospecific and mixed beds in ecological succession. Varying sizes of bare patches occurred throughout the seagrass meadows at Big Sabine Point.
Sampling was conducted from May 2015 through September 2016. During each sampling event, environmental parameters were measured, and the following samples were collected: overlying water, porewater and triplicate cores from each substrate type. Abiotic environmental parameters, including water temperature, salinity, pH, dissolved oxygen and light attenuation were measured at the surface and bottom of the water column. Overlying water was collected and filtered through GF/F 0.7 µm filters immediately upon collection. The filtrate was collected for dissolved inorganic nutrients (nitrate + nitrite, nitrite only, ammonium and dissolved inorganic phosphate), and the filter was saved for subsequent chlorophyll analysis. Triplicate porewater samples at an approximated 10 cm depth were collected with a PVC sipper, filtered through GF/F 0.7 µm filters and analyzed for hydrogen sulfide (H2S), dissolved inorganic phosphate (DIP) and ammonium (NH4+). Porewater samples for H2S analysis were preserved with 1 mL of zinc acetate. Beginning in September 2015, triplicate cores were taken in each substrate type (T. testudinum colonized, H. wrightii colonized and unvegetated sediments). The sediments from these cores were used to assess nitrogenase activity using the acetylene reduction assay (ARA) and percent water and percent organic matter of the sediments.
All nutrient samples were frozen at −2 °C until analysis. The protocol for analyses of dissolved inorganic phosphate (DIP) concentrations followed the molybdate method with a 5 cm quartz cell and measured on a Shimadzu Pharma-Spec UV-1700 UV-Visible Spectrophotometer [44]. The detection limit for this assay was 0.05 μM. The Holmes et al. [45] method was used to analyze ammonium concentrations using different ratios of working reagent and sample depending on the type of sample (overlying water or porewater). All samples used 4 mL of working reagent and either 2 mL of overlying water or 1 mL porewater and 1 mL of Milli-Q water. A Turner Designs TD-700 Fluorometer was used to analyze ammonium concentrations in samples collected in May 2015 through March 2016; A Turner Designs Trilogy Model 7200-0000 was used to analyze ammonium concentrations in samples collected in April 2016 through September 2016. The detection limit for this assay was 0.03 μM. Nitrate + nitrite and nitrite only concentrations were analyzed via vanadium reduction and chemiluminescence on a Thermo Scientific™ Model 42i (NO-NO2-NOx) analyzer [46]. The detection limit for this assay was 0.1 μM. Porewater samples for H2S analysis were stored at 4 °C, processed within one week following sampling and measured on a Shimadzu Pharma-Spec UV-1700 UV-Visible Spectrophotometer. The protocol followed Fonselius [47] and had a detection limit of 1 μM. Filters used for the chlorophyll a analysis were frozen at −2 °C until they could be processed. The chlorophyll a concentration was determined using the Welshmeyer [48] method with extraction in 6 mL of 90% acetone for 24 h in the freezer at −2 °C. Samples from September 2015 through November 2015 were read on a Turner Designs TD-700 Fluorometer, and samples from January 2016 through September 2016 were read on a Turner Designs Trilogy Model 7200–0000. The detection limit for this assay was 0.14 μg L−1.
The protocol for the ARA experiments conducted in this study was modified from Capone [49] and Capone and Montoya [50]. Nitrogen fixation experiments included the sediments from the top 10 cm of the sediment core and were conducted under dark and anoxic conditions. In order to exclude diazotrophs located on the leaves of the seagrasses, the seagrass leaves were removed from the samples. Nitrogen fixation rate measurements were determined with a gas chromatograph fitted with a 3 m × 1/8 in stainless steel column packed with Porapak N, 100/120 mesh. The carrier gas was helium, and the gases utilized by the flame ionization detector (FID) were Airgas Zero Grade Air® and hydrogen. The injector temperature was 100 °C on samples run from September 2015 through January 2016 and 150 °C on subsequent samples when a different GC was utilized. The oven temperature was 80 °C, the hydrogen flame ionization detector (H2 FID) was set to 100 °C, and carrier gas flow was set to 30 mL min−1. Nitrogen fixation rate measurements were determined with a Hewlett Packard 5890 Series II Gas Chromatograph on samples collected in September 2015 through January 2016. Nitrogen fixation rates for samples collected in February through September 2016 were determined using a Thermo Fisher Scientific TRACE 1310 Gas Chromatograph. Retention times were around 2.4 min and 1.5 min for acetylene and ethylene, respectively.
Acetylene made up 10% of the gas phase in these experiments. The samples were incubated at temperatures equivalent to water temperatures at the sampling site. For the samples collected in September 2015 through January 2016, sample gas volumes of 100 μL were injected immediately into the GC sample port after addition of acetylene and at regular periods over the course of 4 h. For samples collected in February 2016 through September 2016, 7 mL gas samples were taken from the incubation flasks and replaced with 7 mL of N2 gas at regular periods throughout the 4 h incubation time, the gas samples were injected into 7 mL BD Vacutainers for subsequent gas chromatograph analysis.
The standard curve was constructed based on ethylene concentration (ppm) and peak area. The following equation from Capone [49] that was used to calculate the number of moles of acetylene fixed in each 100 µL injection was modified by removing the solubility correction:
E = (A1/A2) s g,
where E is nmol acetylene fixed, A1 is the peak area of unknown, A2 is the peak area of the standard, s is the standard concentration (nmol mL−1), and g is the gas phase volume (mL). The samples used in this study did not require a solubility correction because the flasks did not contain any water. The gas phase volume was the total volume of the flask (250 cm3) minus the sediment volume (100 cm3). For each mole of dinitrogen reduced, four moles of acetylene are reduced to ethylene [49]. After completion of ARA experiments, the sediments were dried at 65 °C in a Fisher Scientific Isotemp Incubator Model 655D, weighed and muffled at 500 °C for 4 h in a Fisher Scientific Isotemp Programmable Forced-Draft Furnace. Additional sediment from each core was used to measure water and organic matter content, where samples were dried at 65 °C in a Fisher Scientific Isotemp Incubator Model 655D for at least one week before dry weights were recorded and muffled at 500 °C for 4 h in a Fisher Scientific Isotemp Programmable Forced-Draft Furnace to obtain the percent organic matter. In addition to sediment parameters, plant parameters were included in this study. Percent cover was assessed utilizing 625 cm2 PVC quadrats; there were ten quadrat assessments per substrate type (T. testudinum colonized, H. wrightii colonized and unvegetated).
Nitrogen limitation was evaluated based on comparisons between ratios of ammonium to dissolved inorganic phosphorus (DIP) concentrations in porewater samples and established nitrogen to phosphorus ratios in plant tissue from Atkinson and Smith [51]. The hypotheses were tested using R (Version 3.4.0) and R Studio (Version 1.0.414) statistical packages. All data were checked to see if assumptions for each statistical analysis were met. If assumptions were not met, non-parametric tests were used. We tested for differences in nitrogen fixation rates from ARA experiments using parametric ANOVA statistical tests to see if there were differences in either one based on the substrate or growth periods, senescence, early growth, peak growth and late growth. We ran correlation analyses (spearman method) on environmental parameters (salinity, temperature, dissolved oxygen and surface irradiance), water column and porewater nutrients (nitrate + nitrite, ammonium and dissolved inorganic phosphate), porewater hydrogen sulfide concentrations and nitrogen fixation rates. We checked assumptions using the “stats” R package, and we ran correlation analysis using the “Hmisc” package. We included multivariate analyses, analysis of similarities (ANOSIM) and principal component analysis (PCA) to determine if there were differences between substrate types or growth periods using the “devtools”, “factoextra” and “vegan” R packages.
We estimated the relative contribution of nitrogen fixation to plant nitrogen demand using productivity data from the literature. Nitrogen demand was estimated from productivity measurements using the following conversions. The conversion of grams dry weight m−2 to carbon was 0.5. The carbon to nitrogen atomic ratios used were 35.8 and 13.9 for T. testudinum and H. wrightii, respectively [51].

3. Results

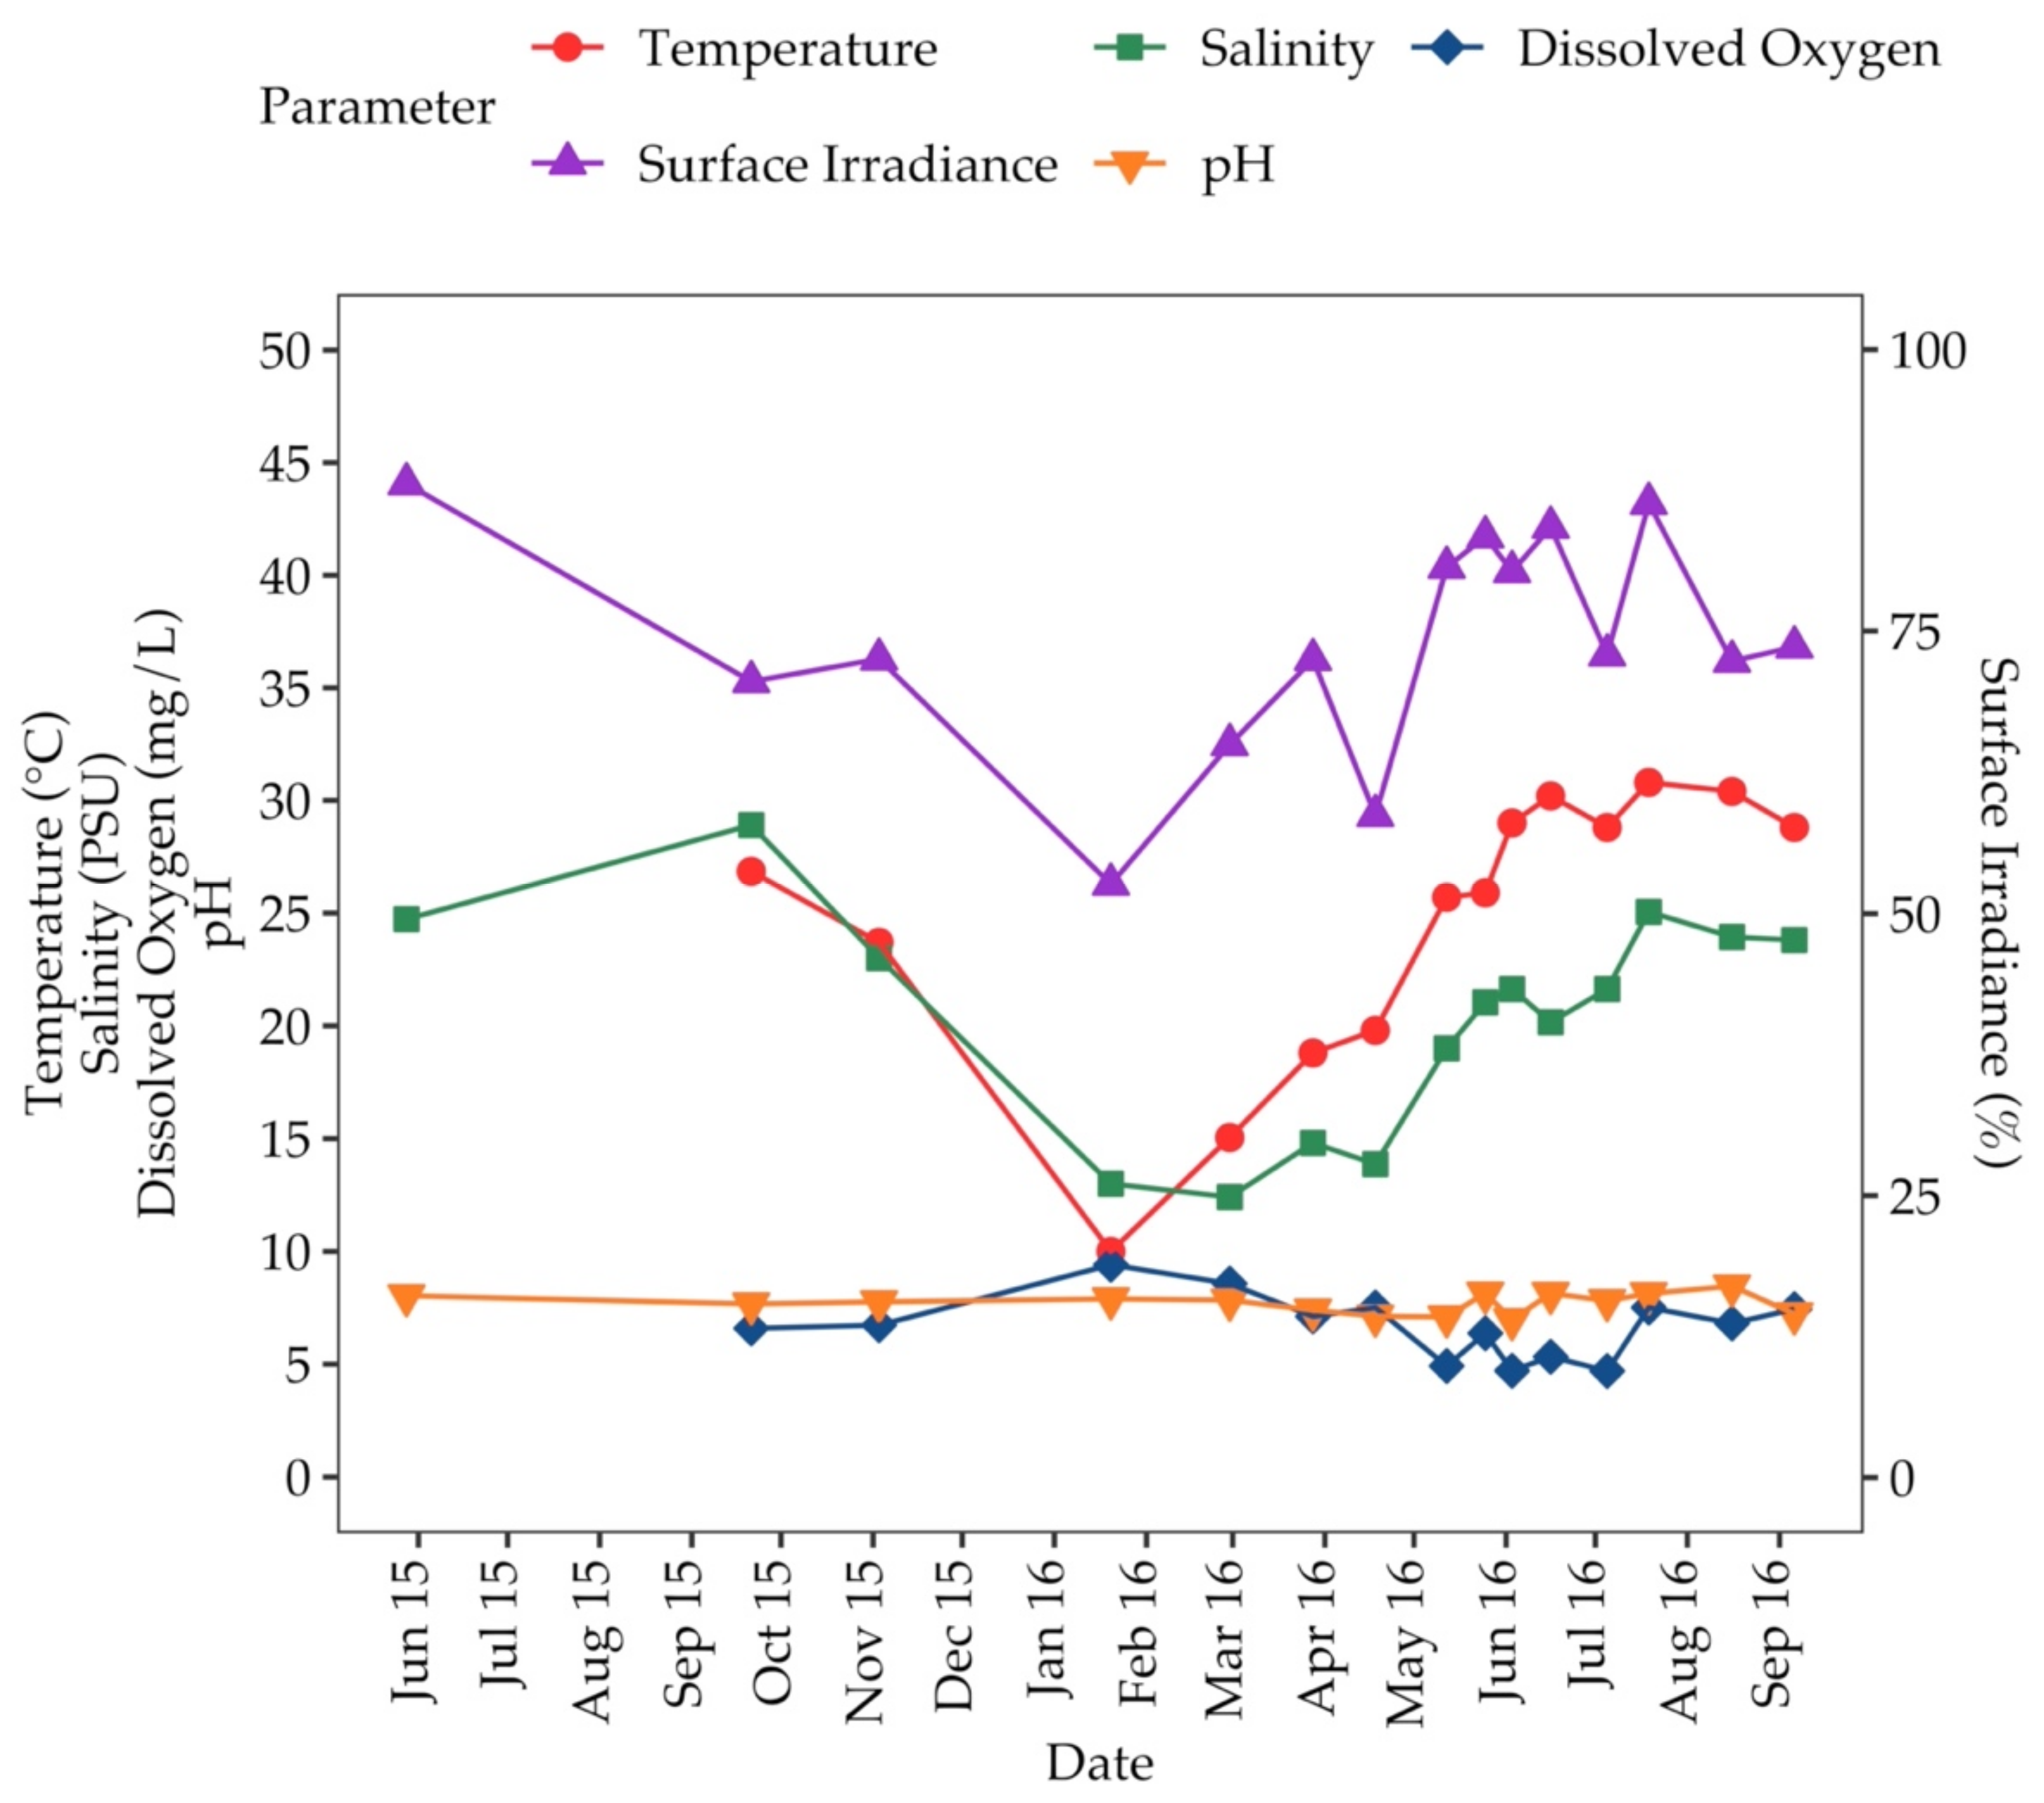
3.1. Environmental Parameters

Water temperature, salinity and surface irradiance were highest during summer months (Figure 2). The water temperature ranged from 10.0–30.8 °C. Salinity ranged from 12.4–28.9. Percent of surface irradiance in the beds ranged from 52.6–88.1%. The dissolved oxygen concentration was highest during winter months, lowest during summer months and ranged from 4.70–9.41 mg L−1 (Figure 2). The pH ranged from 6.98–8.47 (Figure 2).

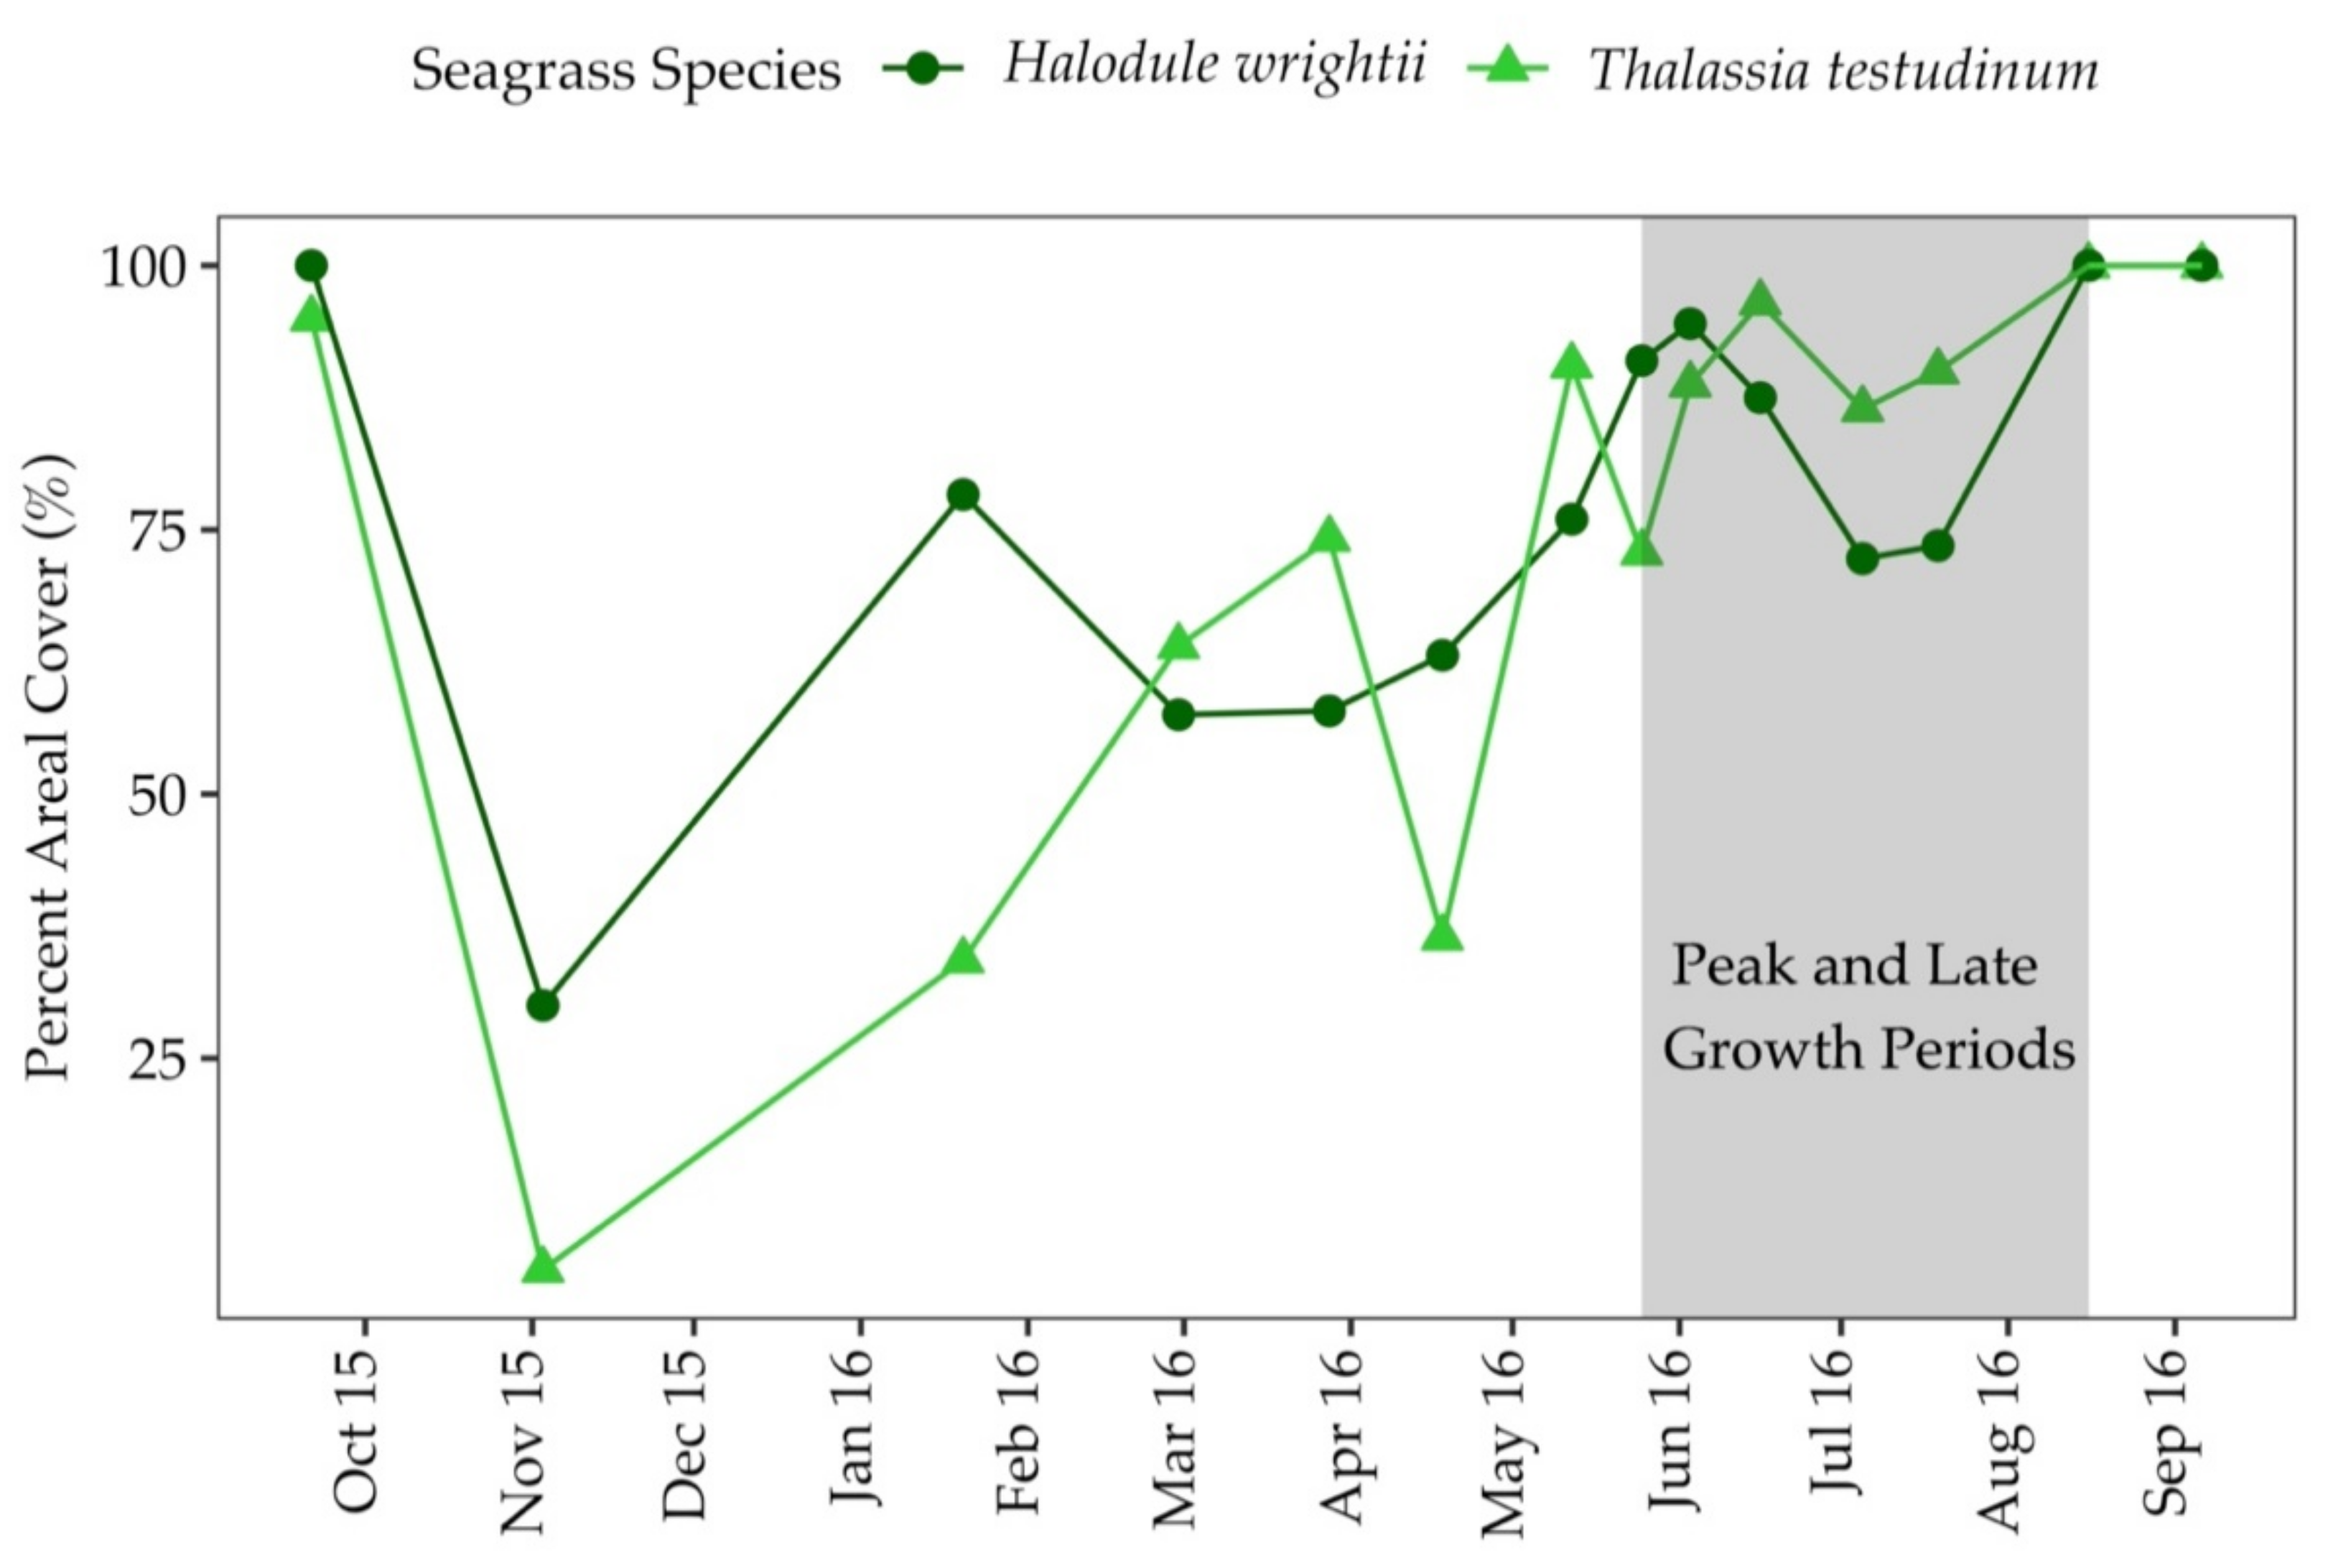
3.2. Percent Areal Cover and Sediment Characteristics

Percent areal cover of both seagrass species, T. testudinum and H. wrightii, was highest during the summer and fall months which correspond to the peak and late growth periods (Figure 3). T. testudinum areal cover ranged from 5–100%, and H. wrightii areal coverage ranged from 30–100% (Figure 3). In sediments colonized by T. testudinum, areal cover was positively correlated with surface irradiance (Correlation analysis; r = 0.57, p = 0.05), temperature (r = 0.66, p = 0.01) and salinity (r = 0.46, p = 0.10). In sediments colonized by H. wrightii, areal cover was positively correlated with temperature (r = 0.46, p = 0.10).
The average percent water was 28.9 ± 0.7% in sediments colonized by T. testudinum, 26.2 ± 0.3% in sediments colonized by H. wrightii and 20.2 ± 0.2% in unvegetated sediments (Table 1). The average percent organic matter content in sediments colonized by seagrass (1.20 ± 0.04%) was significantly higher than adjacent unvegetated sediments (0.29 ± 0.02%, p = 7.98 × 10⁻¹³). Sediment organic matter content was much more variable in sediments colonized by seagrass compared to unvegetated sediment (Figure S1). In T. testudinum colonized sediments, H. wrightii colonized sediments and unvegetated sediments organic content ranged from 0.34–2.07%, 0.30–2.75% and 0.09–0.89%, respectively (Table 1). The average percent organic matter was 1.27 ± 0.06% in sediments colonized by T. testudinum, 1.14 ± 0.07% in sediments colonized by H. wrightii and 0.29 ± 0.02% in unvegetated sediments (Table 1). In sediments colonized by T. testudinum or H. wrightii, the sediment organic matter content was positively correlated with sediment water content (r = 0.80, p = 0.01; r = 0.70, p = 0.01, respectively).

3.3. Water Column Chlorophyll a and Nutrients

Water column dissolved inorganic phosphate (DIP), ammonium, nitrate + nitrite and chlorophyll a concentrations were variable throughout the sampling period and showed no distinct seasonal patterns (Figure S2). Water column DIP concentrations ranged from below detection to 0.26 µM, ammonium concentrations ranged from 0.04–2.40 µM, and nitrate + nitrite concentrations ranged from 0.31–7.78 µM. Nitrite concentrations were below the detection limit. Chlorophyll a concentrations ranged from 0.36–6.06 µg L−1. Chlorophyll a concentrations were positively correlated with water column DIP concentrations (r = 0.49, p = 0.10). There were no other significant statistical correlations between water column chlorophyll a, ancillary nutrients and abiotic environmental parameters.

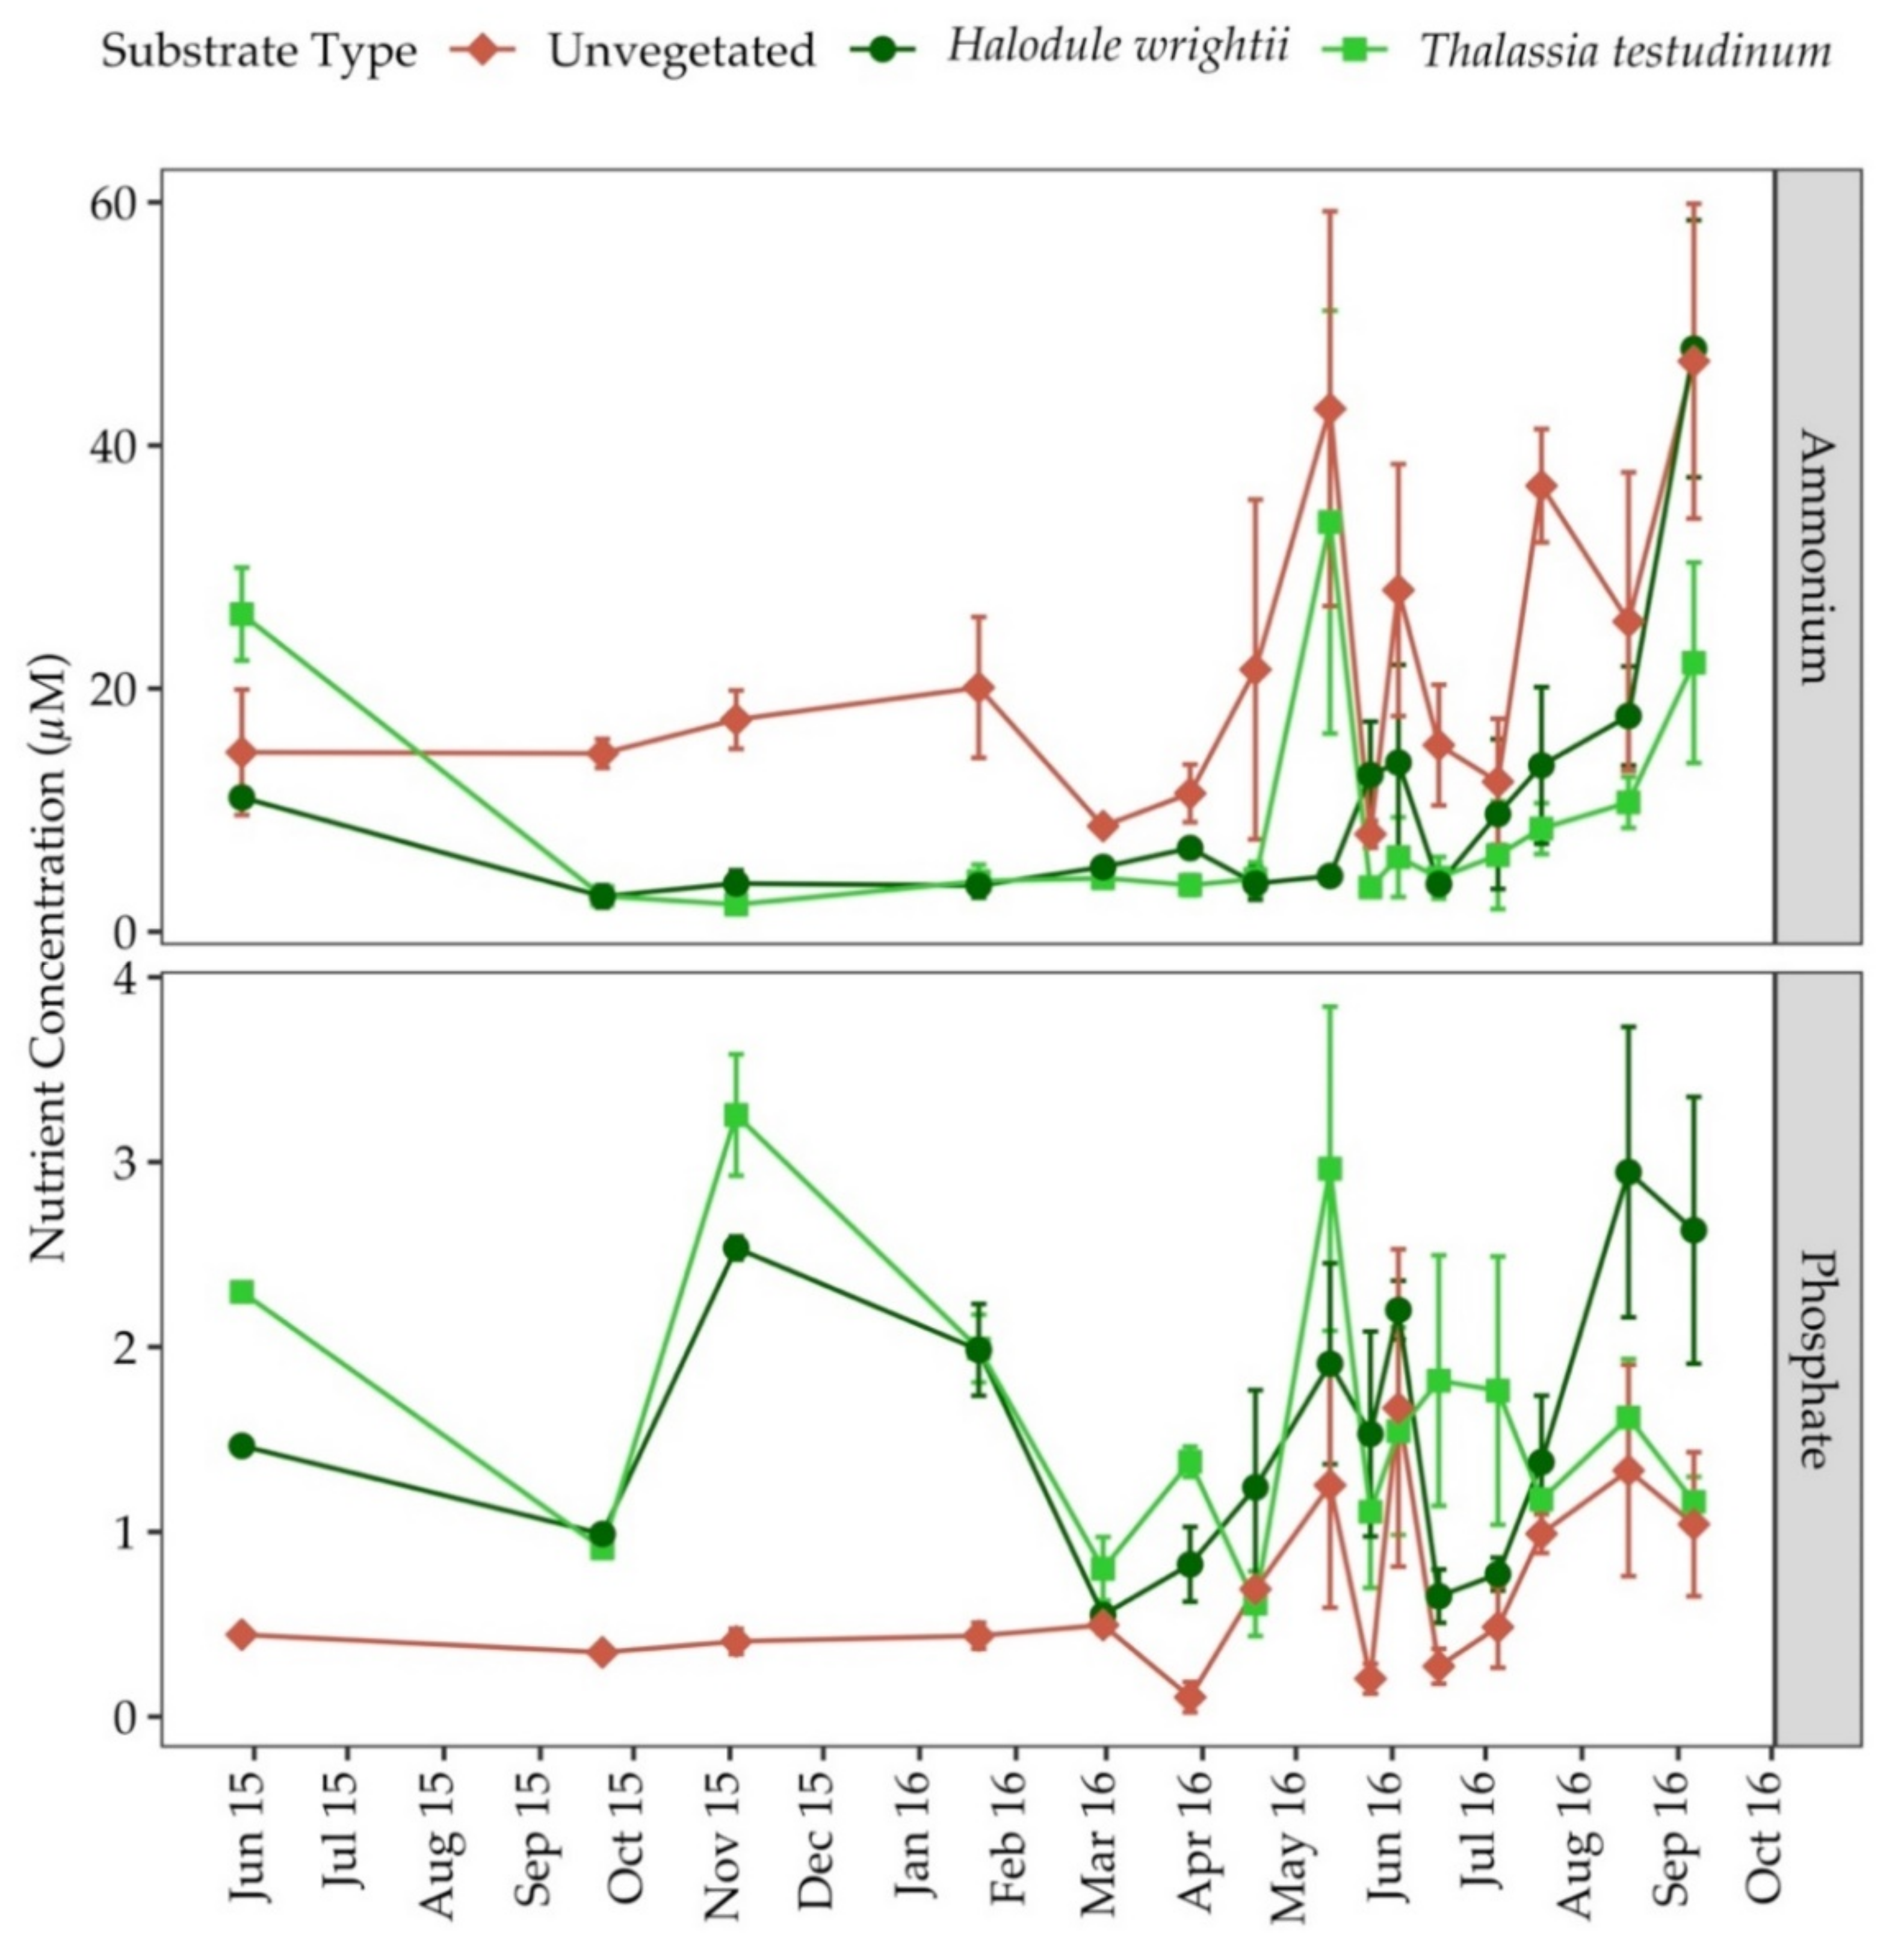
3.4. Porewater Nutrients

Porewater ammonium and DIP concentrations showed no seasonal patterns in any substrate type (Figure 4). Unvegetated sediments had significantly less DIP and more ammonium than sediments colonized by seagrass. In unvegetated sediments, porewater DIP and ammonium averaged 0.7 ± 0.1 µM and 21.6 ± 3.4 µM, respectively (Table 1). In sediments colonized by H. wrightii, porewater DIP and ammonium averaged 1.6 ± 0.2 µM and 10.8 ± 3.1 µM, respectively (Table 1). In sediments colonized by T. testudinum, porewater DIP and ammonium averaged 1.6 ± 0.2 µM and 9.6 ± 2.7 µM, respectively (Table 1).
Porewater N:P in unvegetated areas were much higher (39.6 ± 6) than sediments colonized by H. wrightii and T. testudinum which were 7.0 ± 1.3 and 6.0 ± 1.3, respectively (Table 1). The average porewater N:P ratios for both seagrass species were much lower than their respective leaf N:P ratio (Table 1). Porewater ammonium and DIP were positively correlated with one another in unvegetated sediments (r = 0.75, p = 0.01). In sediments colonized by H. wrightii, the porewater ammonium concentration was positively correlated with percent areal cover (r = 0.46, p = 0.10), sediment percent water (r = 0.59, p = 0.05), porewater DIP concentration (r = 0.51, p = 0.05) and the water column ammonium concentration (r = 0.60, p = 0.01). Porewater DIP was positively correlated with sediment organic content in sediments colonized by only H. wrightii (r = 0.54, p = 0.01). In sediments colonized by T. testudinum, there were no significant correlations between porewater nutrients, abiotic environmental parameters, percent areal cover or sediment characteristics.

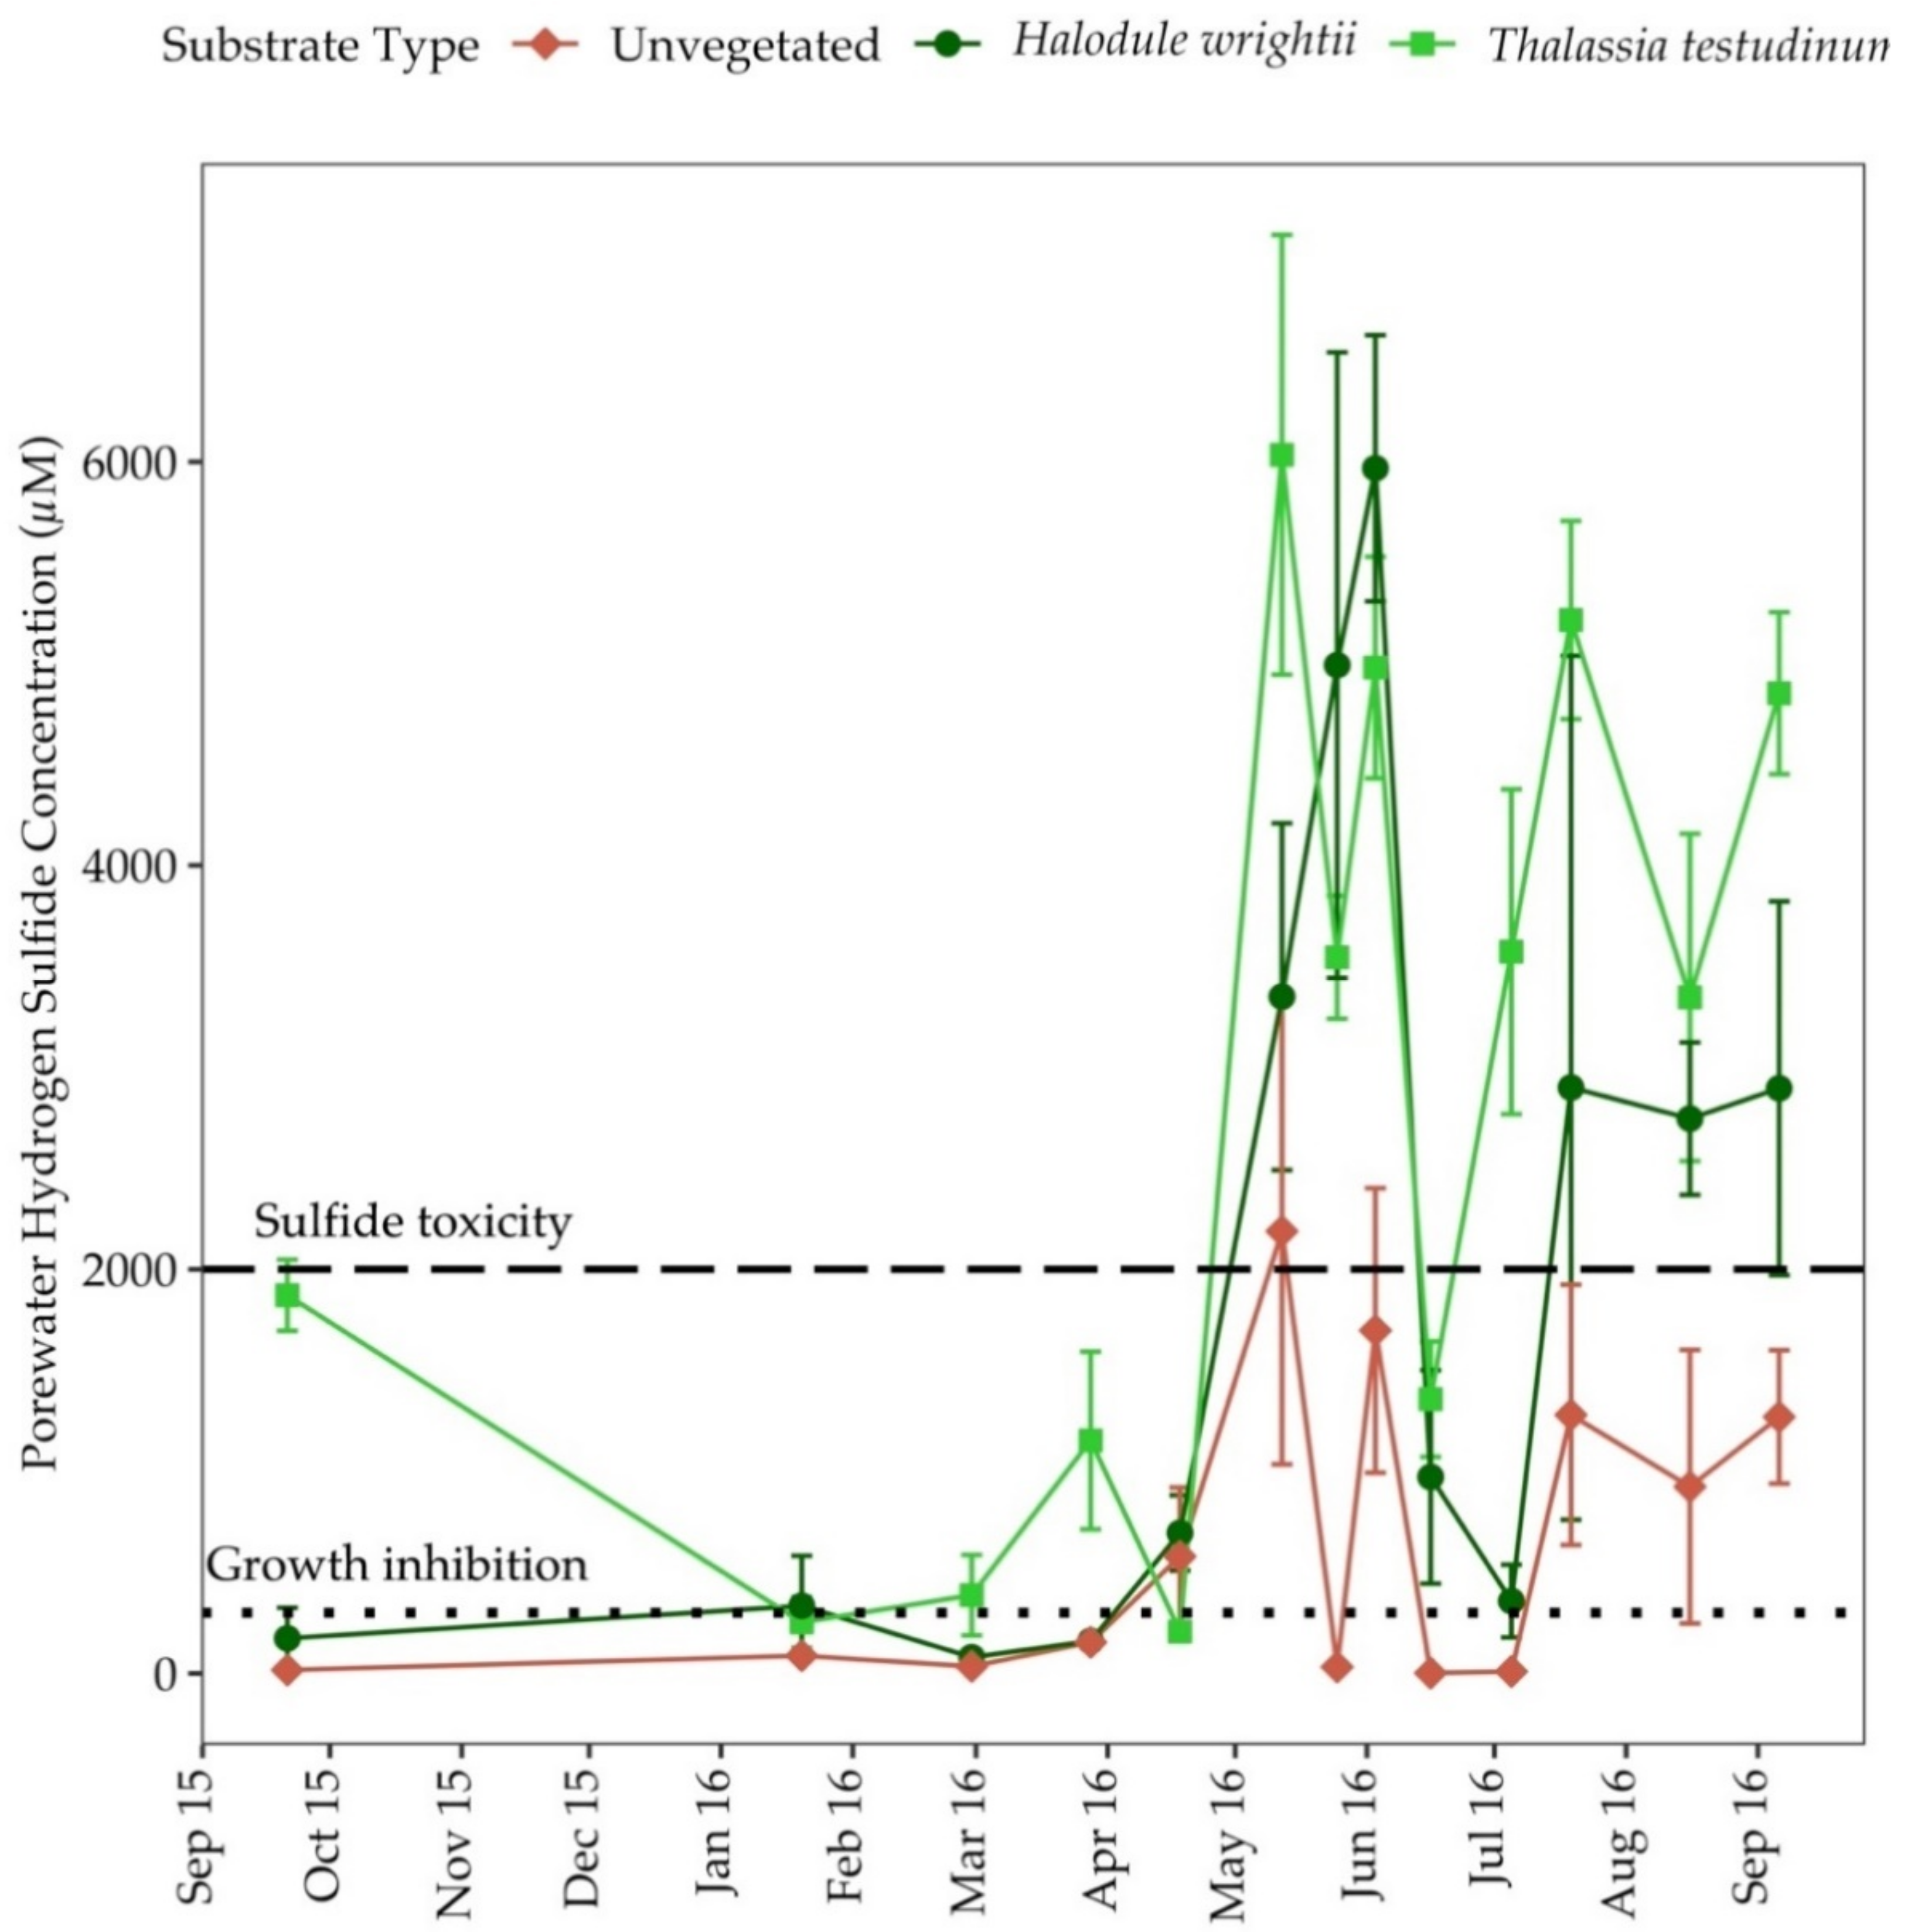
3.5. Porewater Sulfide (H2S)

Porewater H2S concentrations in sediments colonized by H. wrightii and T. testudinum ranged from 0–5968 µM and 0–6035 µM, respectively. The average H2S concentration was 591.4 ± 199.6 µM in unvegetated sediments, 1830 ± 529.0 µM in sediments colonized by H. wrightii and 2627 ± 568.5 µM in sediments colonized by T. testudinum. In all substrate types, H2S concentrations were highest during the summer in seagrass sediments and were often above the threshold for seagrass growth inhibition (>300 µM) throughout the year (Figure 5). Measurements of H2S were above the growth inhibition level for 79% of the sampling events in T. testudinum colonized sediments and 71% of the sampling events in H. wrightii colonized sediments. Porewater H2S was higher during peak and late growth periods relative to other annual seagrass growth periods when concentrations were above the threshold for sulfide toxicity (>2000 µM) (Figure 5). H2S concentrations were above the threshold for sulfide toxicity in 50% of the sampling occasions in sediments colonized by T. testudinum and 43% of the sampling occasions in sediments colonized by H. wrightii (Figure 5).
In all substrate types, porewater H2S was positively correlated with seagrass percent cover (r = 0.62, p = 0.01), sediment percent organic matter (r = 0.49, p = 0.01) and porewater DIP (r = 0.46, p = 0.01), but negatively correlated with porewater N:P (r = −0.30, p = 0.05). In unvegetated sediments, H2S was positively correlated with porewater ammonium and DIP (Table S1). In areas colonized by H. wrightii, H2S was positively correlated with seagrass percent areal cover, surface irradiance and temperature (Table S1). In T. testudinum colonized sediments, H2S was positively correlated with seagrass percent areal cover, surface irradiance, temperature, salinity and porewater ammonium (Table S1). Moreover, H2S was negatively correlated with water column dissolved oxygen concentration (Table S1).

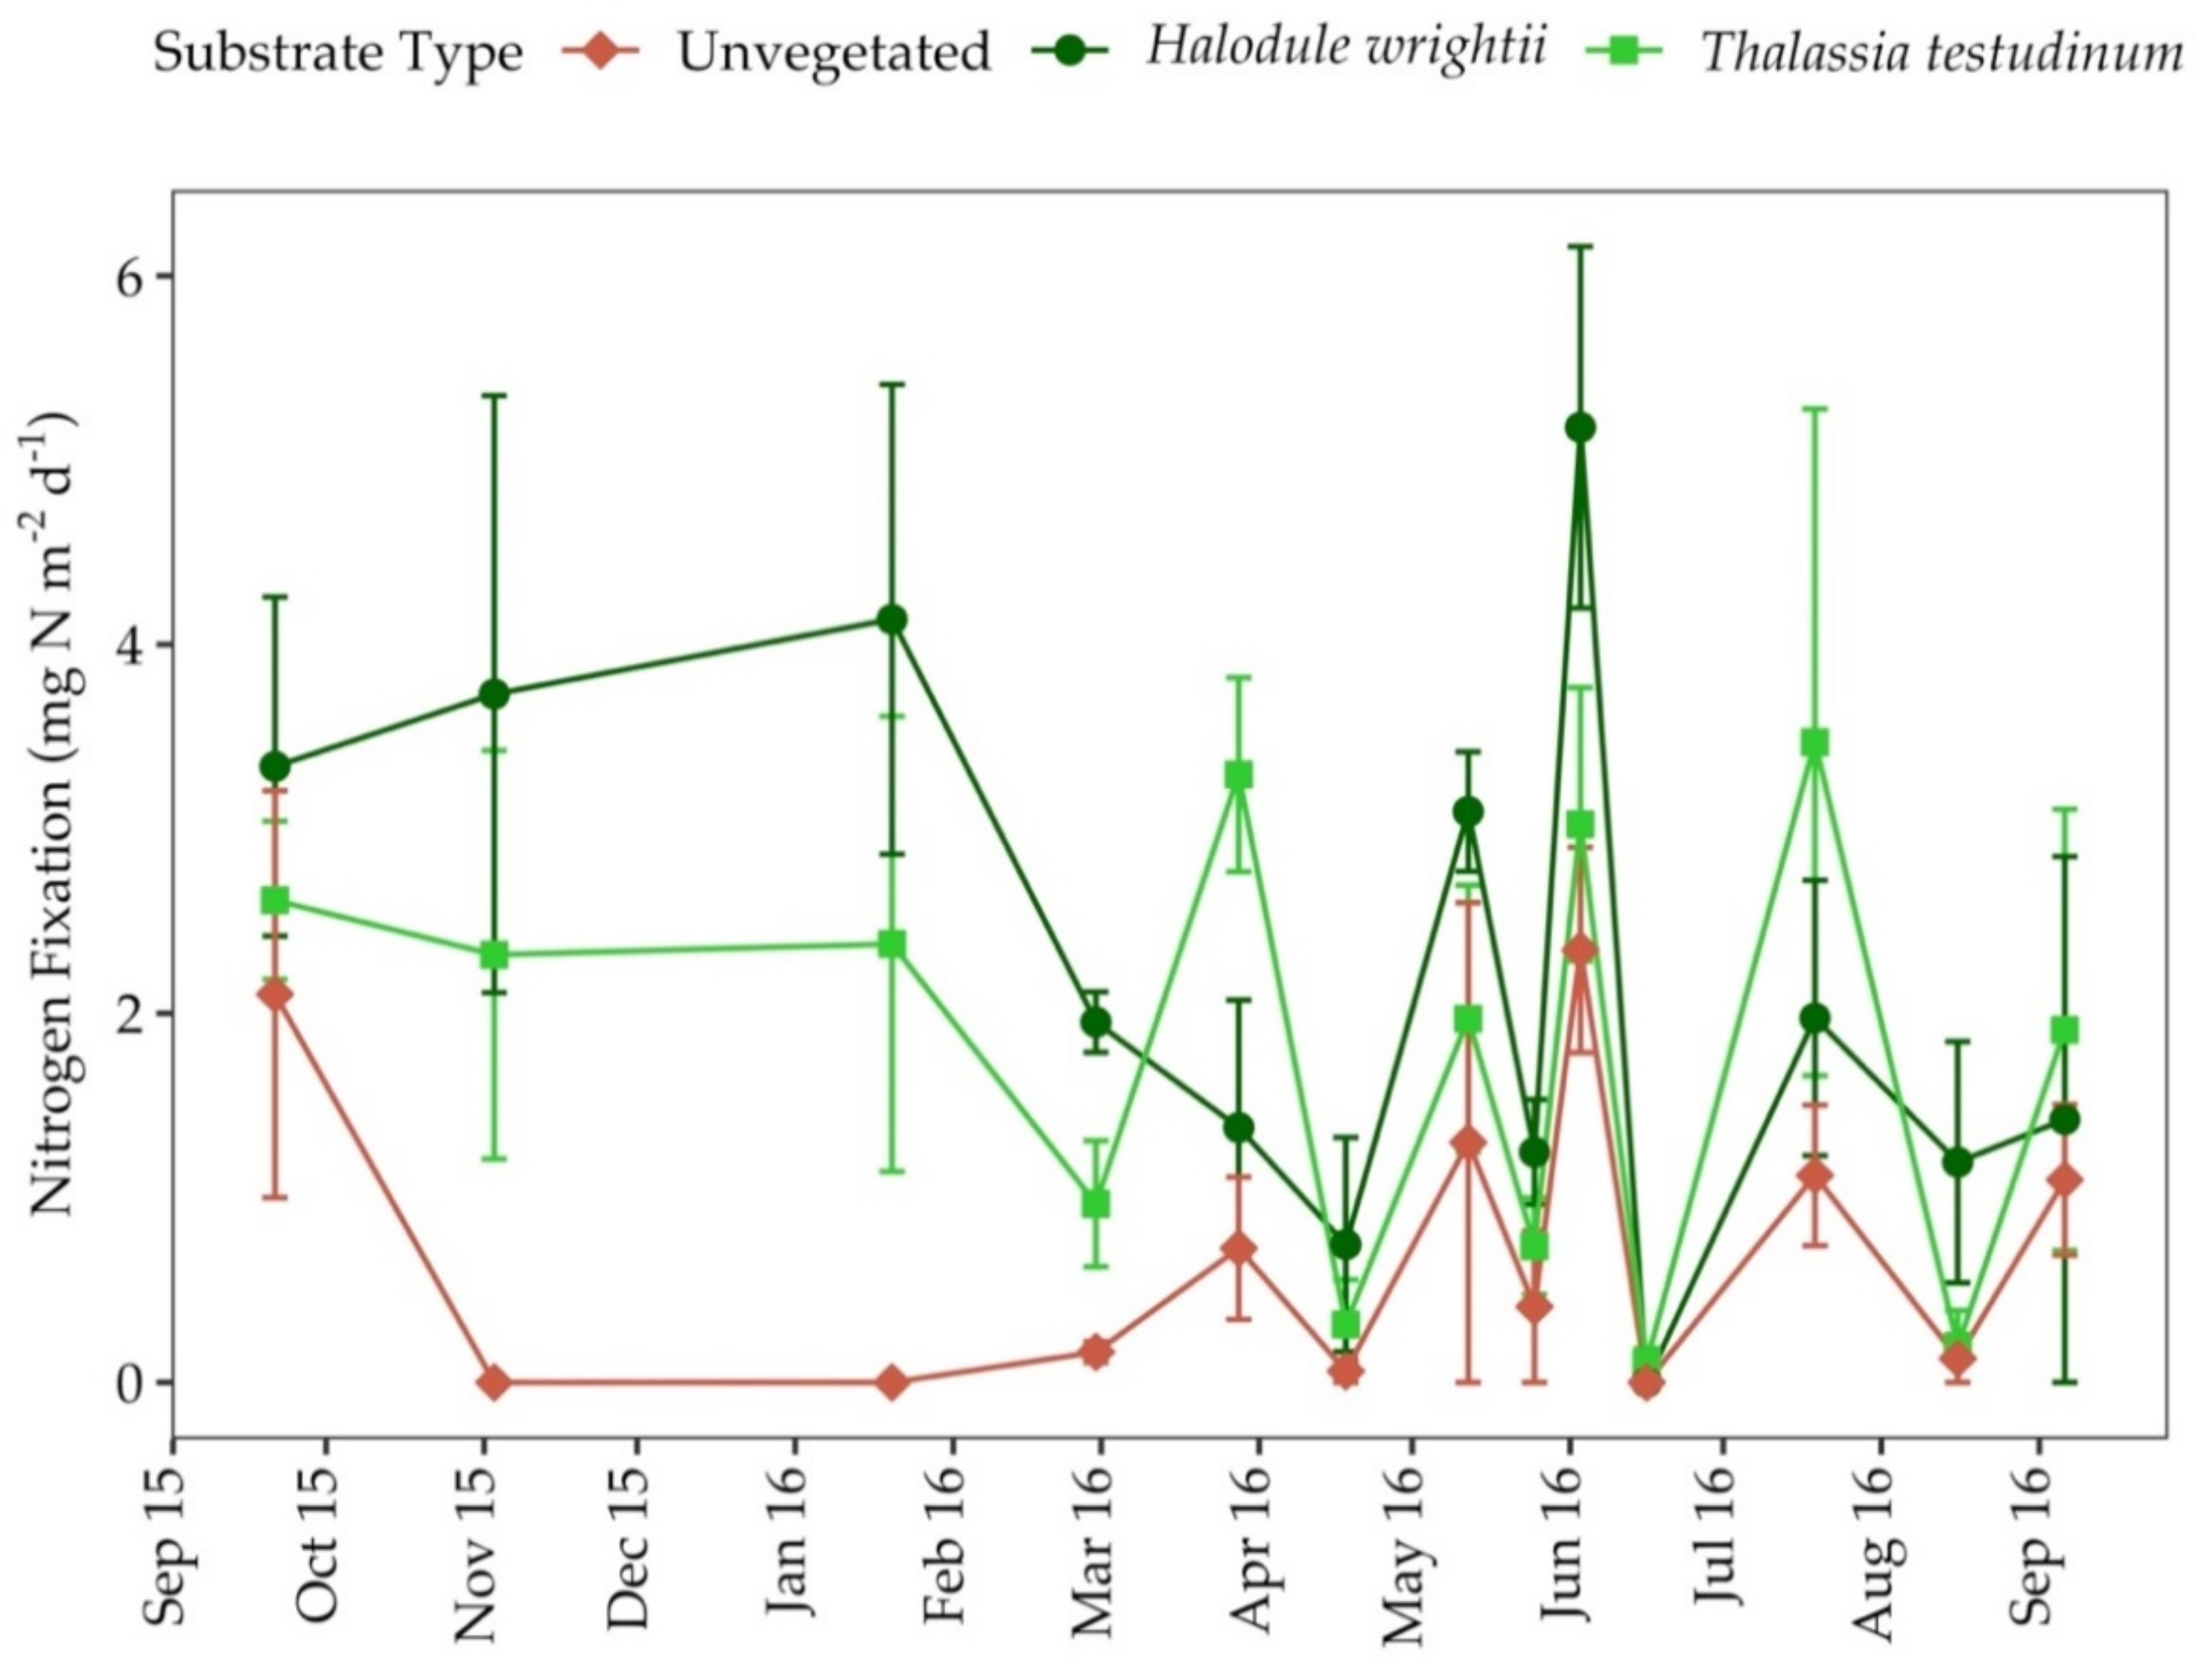
3.6. Nitrogen Fixation Rates

Nitrogen fixation rates were variable in all substrate types throughout the study period (Figure 6); however, rates were higher during senescence for both seagrass species (Table 2). The average nitrogen fixation rates across all growth periods were 0.98 ± 0.25 mg N m−2 d−1 in unvegetated sediments and 2.61 ± 0.26 mg N m−2 d−1 in seagrass colonized sediments. Nitrogen fixation rates averaged across all seagrass growth periods were significantly higher in sediments colonized by T. testudinum and H. wrightii than adjacent unvegetated sediments (ANOVA; p < 0.001).
In all substrate types, nitrogen fixation was positively correlated with porewater DIP (r = 0.36, p = 0.05), sediment percent organic matter (r = 0.36, p = 0.05) and sediment percent water (r = 0.34, p = 0.05). In unvegetated sediments, nitrogen fixation was positively correlated with porewater hydrogen sulfide concentration, surface irradiance and salinity (Table S1). In sediments only colonized by H. wrightii, nitrogen fixation was negatively correlated with porewater N:P (Table S1). In sediments colonized by T. testudinum, nitrogen fixation was negatively correlated with surface irradiance and temperature; however, it was positively correlated with dissolved oxygen concentration (Table S1).

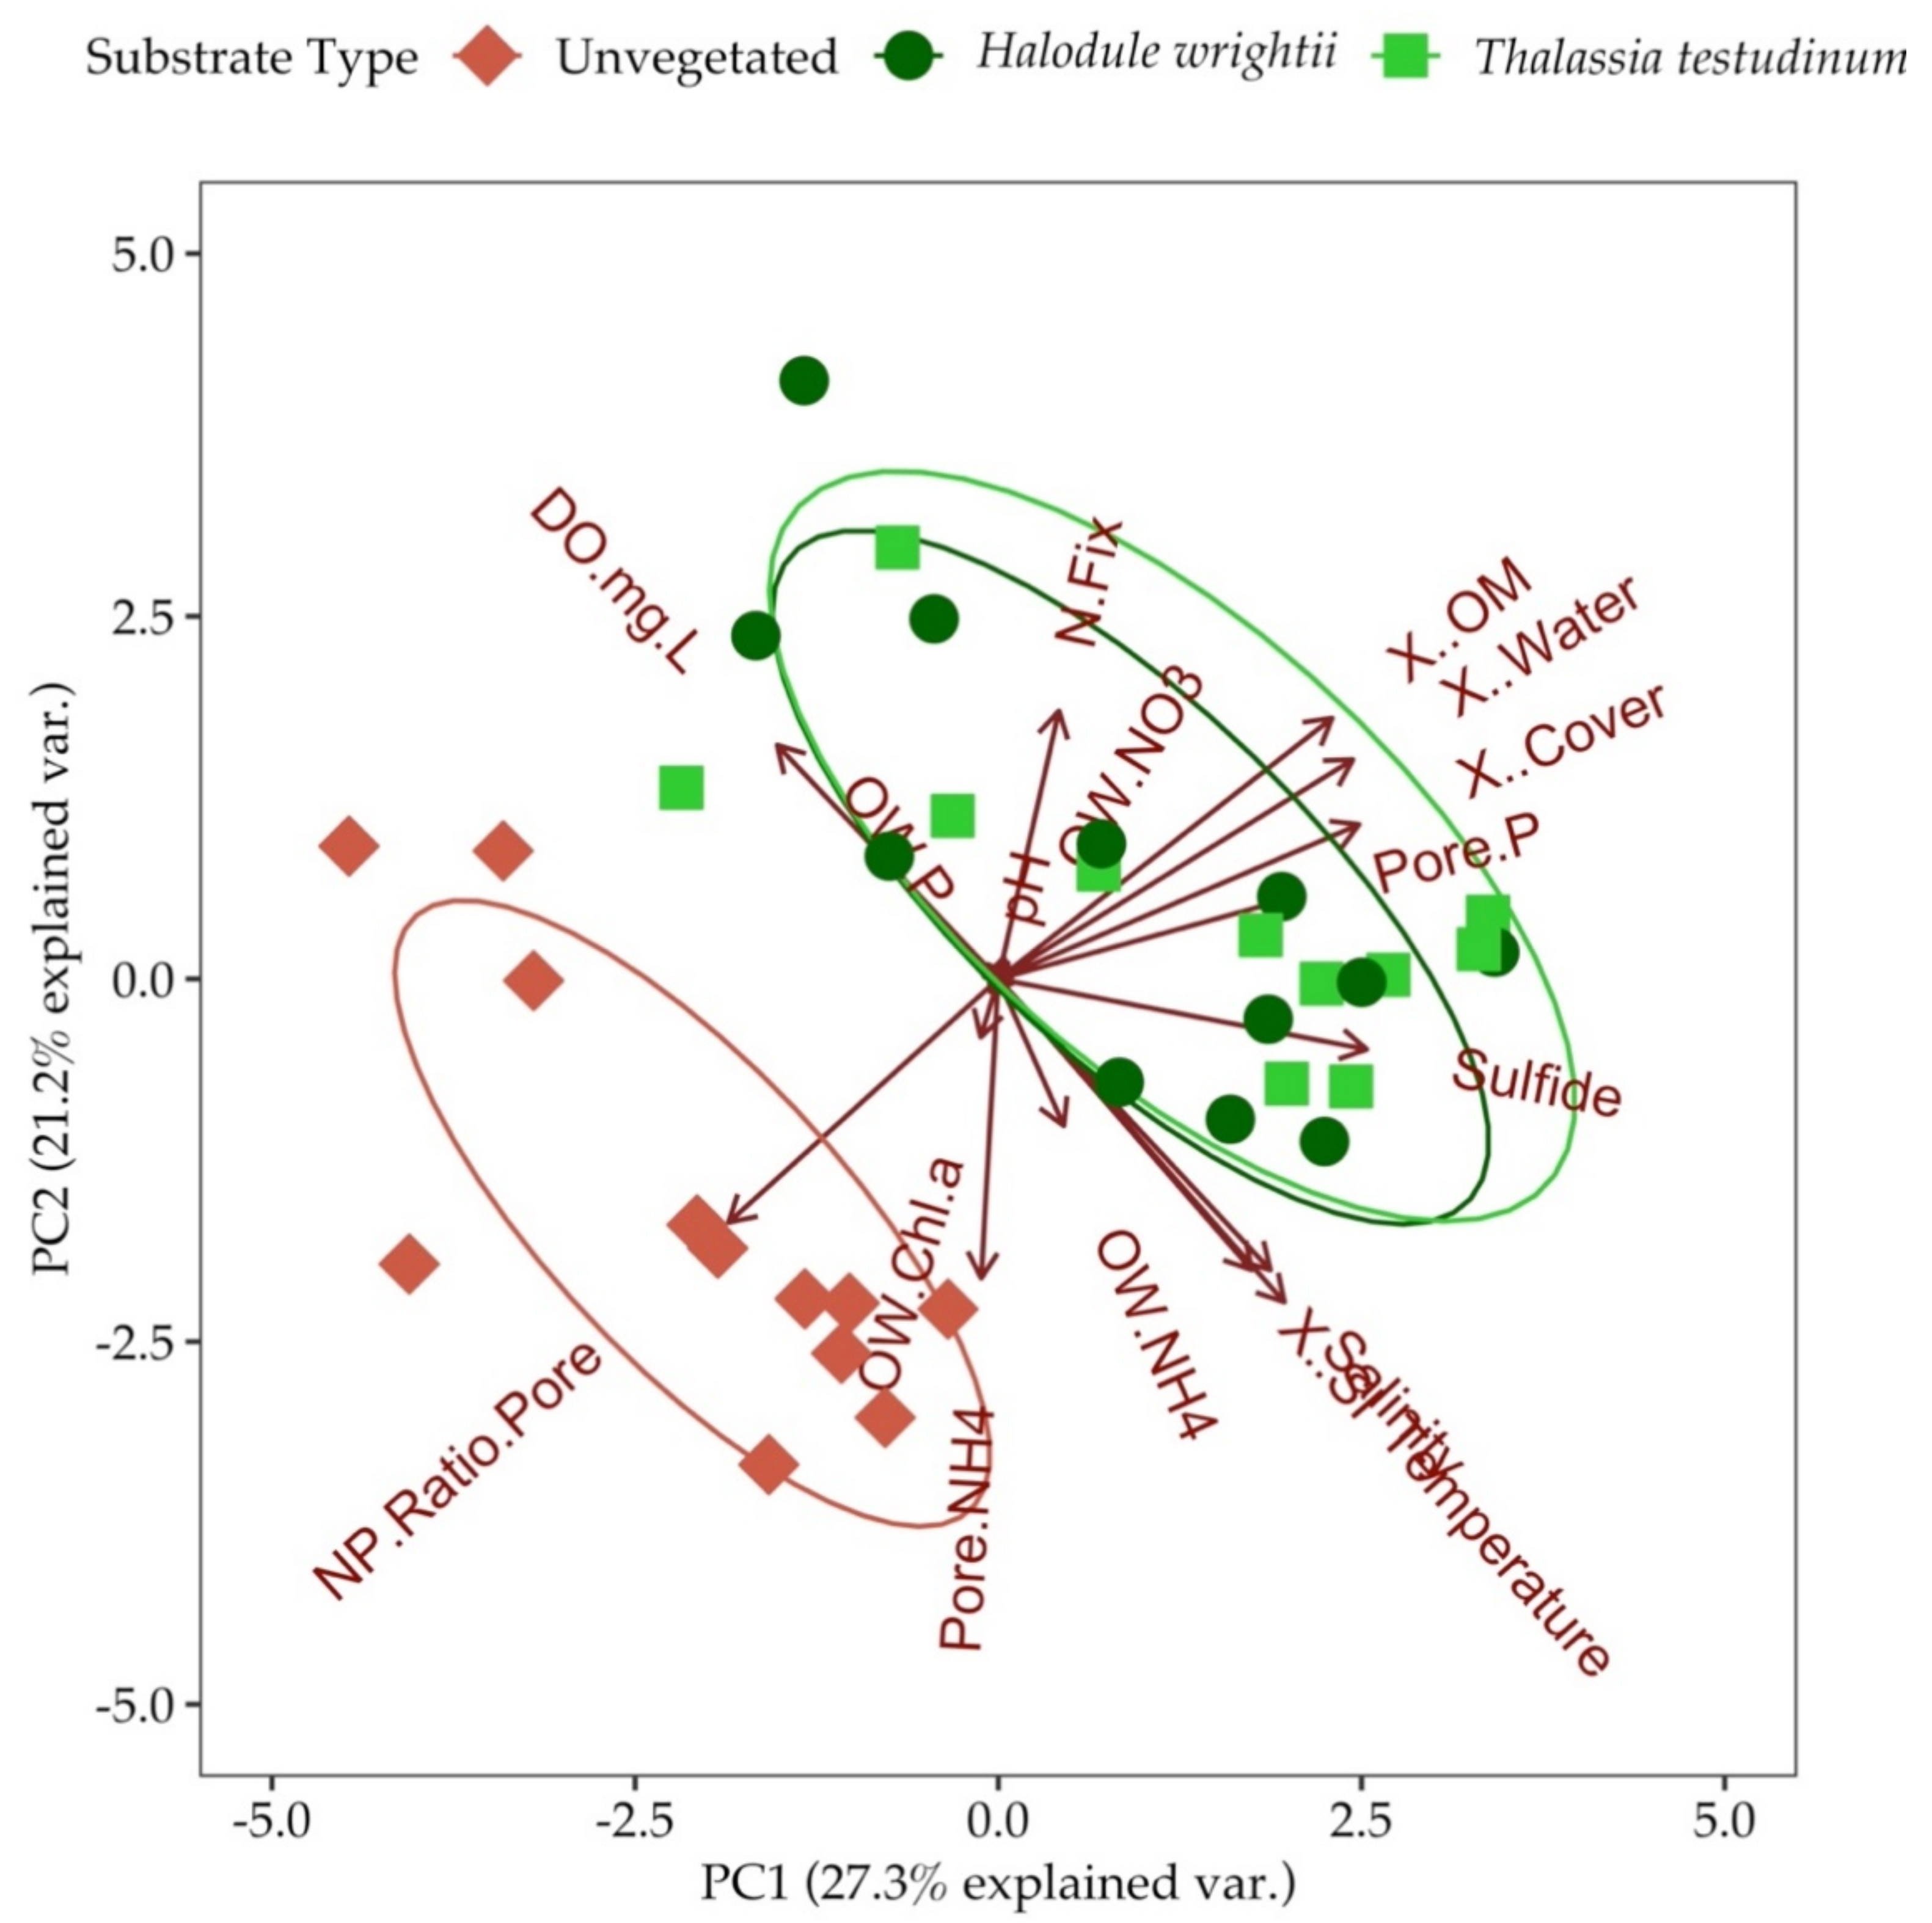
3.7. Principal Component Analysis (PCA) and Analysis of Similarities (ANOSIM)

Principal component one (PC1) explained 27.3% of the variation and was most strongly associated with porewater H2S concentration, percent water, percent organic matter and percent areal cover of seagrass (Figure 7, Tables S2 and S3). Principal component two (PC2) explained 21.2% of the variation and was most strongly associated with temperature, porewater ammonium, salinity and surface irradiance (Figure 7, Tables S2 and S3). The principal component analysis (PCA) of the data revealed a separation of the unvegetated samples compared to seagrass. This was confirmed by an analysis of similarities (ANOSIM; r = −0.098). PCA revealed a negative relationship between nitrogen fixation and porewater ammonium (Figure 7).

4. Discussion

In Northwest Florida (30.35° N), H. wrightii is well within its normal geographic range which extends to 35.6° N [58]. However, T. testudinum is at the northern extent of its range where it is frequently exposed to suboptimal temperatures [58]. During the study period, the water temperature dropped to 10 °C in January 2016. Salinity varied little throughout most of the study period but was below the optimal salinity range for T. testudinum and H. wrightii during the winter and early spring. Throughout the study, light attenuation was low and within optimal ranges for T. testudinum and H. wrightii. Water temperatures, salinities, pH and dissolved oxygen in this study were similar to previous studies conducted within SRS [40,42,53,59]. In this study, temperature, salinity and percent surface irradiance were highest during the summer, and dissolved oxygen was highest during the winter, similar to previous studies in the same area [40,53,59]. Seagrass cover of both species was highest during peak and late growth periods, the same time period aboveground biomass of T. testudinum in Santa Rosa Sound was highest [40]. Positive correlations between seagrass areal cover and percent surface irradiance, temperature and salinity correspond to increased seagrass growth rates during summer months. Temperature is the foremost variable controlling seagrass growth for many species [60]. Because T. testudinum at Big Sabine Point is at the northern edge of its range, distribution and growth rates were likely controlled by temperature [41,61].
Water column nutrient concentrations were approximately 10% of porewater nutrient concentrations, did not display any clear seasonal patterns and were likely a less important sources of nutrients to the seagrasses than sediment porewater. Porewater ammonium in sediments colonized by T. testudinum from this study were low compared to a study conducted in Texas [58]. Porewater ammonium had a significant, positive correlation with seagrass percent cover in sediments colonized by H. wrightii similar to Devereux et al. [40] which suggested that seagrass growth and leaf production were stimulated by ammonium availability.
Previous studies suggested that nitrogen is the limiting nutrient for T. testudinum growth when porewater ammonium concentrations are below 100 μM [62]. Ammonium concentrations were well below 100 µM across all substrate types during the entire study period. Moreover, porewater N:P ratios in seagrass colonized sediments were much lower than leaf N:P ratios as measured by Atkinson and Smith [51], below the 25–30 N:P ratio threshold for P limitation [34,63] and were considered N limiting (Table 1). Previous studies on H. wrightii and T. testudinum leaves collected from Grand Bay, MS and Big Lagoon, FL, respectively, suggest phosphorus limitation [64], but Devereaux et al. [40] found high phosphorus levels in T. testudinum leaves from SRS. High porewater N:P ratios in adjacent unvegetated sediments suggested that relatively high uptake of nitrogen from sediment porewater by seagrasses was mostly likely the cause for the apparent nitrogen limitation (Table 1). The relatively high uptake of nitrogen from sediment porewater by seagrass was most likely the cause for the apparent nitrogen limitation. Devereux et al. [40] found that T. testudinum leaf growth rates were positively correlated with porewater NH4+ concentrations. In this study, porewater NH4+ was positively correlated with percent areal cover in sediments colonized by H. wrightii, but not areas colonized by T. testudinum.
H2S accumulation was higher in areas colonized by seagrass than bare sediments. Release of dissolved organic carbon by seagrasses as well as microbial breakdown of dead seagrass tissue represent significant organic matter sources for sulfate reduction [65]. In sediments colonized by either seagrass species, porewater H2S concentrations were positively correlated with water temperature, consistent with the positive correlation between sulfate reduction rates and temperature found by Devereux et al. [40]. Although H2S is toxic and kills seagrasses when porewater concentrations are too high (>2000 µM) [52], our porewater H2S concentrations exceeded the sulfide toxicity threshold in 50% of the sampling events in sediments colonized by T. testudinum and 43% of the sampling events in sediments colonized by H. wrightii (Figure 5). In sediments colonized by seagrass, porewater H2S concentrations were higher than the threshold during warmer months and in peak and late growth periods (Figure 5). Although porewater H2S was very high during peak and late growth periods in seagrass colonized sediments, there was no apparent dieback most likely due to the oxic microshield around the roots and rhizomes [66]. Borum et al. [35] found that seagrass oxygen release through their roots and rhizomes depended on water column oxygen concentration and seagrass photosynthetic activity [35]. Oxygen release by roots has not been measured for H. wrightii. Using the leaf to root dry weight ratio to predict root oxygen release as in Sand-Jensen et al. [67], both species may release about 1–2% of their total oxygen production through their roots. H. wrightii may release more oxygen from its roots than T. testudinum because H. wrightii has a higher leaf to root dry weight ratio [67]. Jovanovic et al. [68] found that Ruppia maritima, which is found in conditions similar to H. wrightii, released more oxygen from its roots that Zostera marina which is found is areas with more stable conditions similar to T. testudinum. In order to maintain an oxic microshield against the sulfide intrusion, H. wrightii may need to release more oxygen from its roots and rhizomes due to the greater surface area its subterranean root system compared to T. testudinum. Both species of interest in this study may have released more oxygen from their roots and rhizomes during summer, when plant photosynthetic activity and sulfide concentrations were highest, as observed in other species [69]. Koch and Erskine [70] found that seagrass may be tolerant to exposure of high porewater sulfide concentrations (up to 10 mM) for short periods of time (<28 d) and not result in a dieback; however, a combination with other stressors, such as high temperature (35 °C), salinity (55–60 PSU) and hypoxia, may elicit a dieback [71]. Koch and Erskine [70] observed high rhizome-extracted oxygen levels (>30%), which may be retained during extended periods of darkness (18 h). Other stressors, such as hypersalinity (65 PSU), may result in higher seagrass respiration rates and lower the time it takes for H2S intrusion into seagrass tissues to occur [72]. The lack of other stressors might explain why we did not witness a seagrass dieback even though porewater hydrogen sulfide concentrations were as high as 6 mM.
Vegetated sediments had significantly higher nitrogen fixation rates than adjacent unvegetated sediments, particularly during the winter (Figure 6). In T. testudinum colonized sediments, nitrogen fixation rates were highest during the colder, winter months which was unexpected. In areas colonized by H. wrightii, results suggest that the decreased availability of bioavailable nitrogen (NH4+) stimulated nitrogen fixation. The PCA plot showed a negative relationship between porewater ammonium and nitrogen fixation. Nitrogen fixation rates were positively correlated with porewater H2S concentrations which were correlated with porewater NH4+ and DIP. We believe that increased organic matter mineralization resulted in increased inorganic nutrient concentrations and dissolved organic carbon which stimulated diazotrophic sulfate-reducing bacteria. Sulfate-reducing bacteria have a higher threshold of ammonium concentrations, usually millimolar concentrations, in order to inhibit nitrogen fixation [10,73]. This might explain why there was no significant negative correlation between nitrogen fixation rates and porewater ammonium concentration. Nitrogen fixation rates from this study were lower than a previous study conducted in Santa Rosa Sound, especially in unvegetated sediments (Table 2) [53]. Price [53] observed higher nitrogen fixation rates relative to this study during winter, especially in H. wrightii colonized sediments and unvegetated sediments (Table 2). Price [53] observed the following trends in nitrogen fixation, albeit they were not statistically significant: increased nitrogen fixation rates in aerobically incubated sediment, increased nitrogen fixation rates in unvegetated sediments compared to vegetated sediments, increased nitrogen fixation rates in upper sedimentary layers (0–10cm) compared to lower layers (10–15 cm), a positive relationship between nitrogen fixation rates and temperature and a negative relationship between nitrogen fixation rates and dissolved oxygen.
Price [53] concluded that diazotrophs may meet nitrogen requirements in Santa Rosa Sound because seagrass nitrogen demand may be lower in cooler waters. On an annual basis, this study showed that nitrogen fixation in sediments contributed 0.8 and 1.0 g m−2 to T. testudinum and H. wrightii. At Big Sabine Point, nitrogen the demand for T. testudinum estimated from productivity measurements was 47.6 mg N m−2 d−1, 459 mg N m−2 d−1 and 248 mg N m−2 d−1 during June 2016, July 2016 and September 2016, respectively [74]. This represented 14%, 1.0% and 2.0% of the plant nitrogen demand during those months. On an annual basis, nitrogen fixation from sediment may supply 4% of the nitrogen demand [75]. In contrast, annual mean nitrogen demand of H. wrightii was estimated to be 310 mg N m−2 d−1 with nitrogen fixation providing 1% of the annual nitrogen demand for this seagrass species [75]. Measurements from the Bahamas suggest that nitrogen fixation provided between 12 and 47% of the estimated nitrogen demand of 11–44 mg N m−2 d−1 by T. testudinum observed by Capone et al. [55] The contribution of nitrogen fixation to nitrogen demand in mature Zostera marina beds was also high, about 20%, compared to this study [76]. This appears to be true even during periods of decreased growth (senescence and dormancy). Different factors appear to influence nitrogen fixation rates in different habitats. High H2S concentrations were apparent in seagrass colonized sediments. Sulfate reducing bacteria may be primarily responsible for nitrogen fixation, especially in unvegetated sediments.
Because this study was conducted in an area with very little anthropogenic impacts, future studies should focus on areas with greater anthropogenic impact and higher nutrient inputs. Root and rhizome oxygen release should be measured for both seagrass species and compared to porewater sulfide concentrations. This would determine if the oxic microzone seagrasses have around their root system is maintained or strengthened in order to withstand very high sulfide concentrations during summer. In order to more accurately assess nitrogen fixation rates and sedimentary organic carbon utilization, stable isotope techniques should be applied. In addition to nitrogen fixation, porewater nitrate concentrations, nitrification rates and dissimilatory nitrate reduction to ammonia (DNRA) rates should be quantified in order to assess the importance of other nitrogen cycling processes to meeting seagrass nitrogen demands. The sources of N loss, including denitrification and anaerobic ammonium oxidation (anammox) should be quantified to determine if there is net loss or gain of N in seagrass ecosystems.

5. Conclusions

Nitrogen fixation rates from this study are comparable to rates found by previous studies (Table 2). Organic matter content in the sediments may be an important factor controlling nitrogen fixation, but the mechanism driving nitrogen fixation is slightly different in each substrate type. In unvegetated sediments, organic supply to sulfate reducing prokaryotes seems to be driving nitrogen fixation (Figure 8a). Rates were higher during summer months when microbial activity was likely highest. In H. wrightii colonized sediments, decreased availability of bioavailable nitrogen relative to phosphorus may be stimulating nitrogen fixation (Figure 8b). Moreover, nitrogen fixation rates were highest during periods with higher organic matter availability. In T. testudinum colonized sediments, nitrogen fixation rates were higher during dormancy when organic matter availability was highest (Figure 8c). Lee and Dunton [15] found that T. testudinum acquired the majority of its total nitrogen acquisition from its leaves during summer and from its roots during winter. Perhaps, sediment nitrogen fixation rates were higher in winter and a more important source of N for seagrasses during this period due to lower remineralization rates and overall lower N availability. Sediment nitrogen fixation at Big Sabine Point may be an important source of bioavailable nitrogen during winter when seagrasses experience decreased growth and less important during summer when seagrasses experience high growth.

Supplementary Materials

The following are available online at https://www.mdpi.com/article/10.3390/jmse9070766/s1, Table S1: Spearman correlation coefficients and significance levels for the following correlations between the various environmental and biogeochemical parameters for the three substrate types, Table S2: Eigenvalues for principal components calculated by R for the PCA biplot found in Figure 7, the percent variation explained by each principal component, and the total cumulative percent variation explained by eigenvectors, Table S3: Contributions of each variable represented in Figure 7 to PC1 and PC2, Figure S1: Sediment organic matter content during major periods of the seagrass growth cycle. Error bars represent the standard error of the mean, Figure S2: Water column chlorophyll a (µg L−1), ammonium (µM), nitrate and nitrite (µM), and DIP (µM) concentrations from September 2015 through September 2016 at Big Sabine Point. Data from this study is available in Supplemental Data.csv.

Author Contributions

Conceptualization, R.P., J.M.C.; R.P. conducted this study; Original draft preparation, R.P.; Review and editing, R.P., J.M.C.; funding acquisition, J.M.C. All authors have read and agreed to the published version of the manuscript.

Funding

This research was supported by the University of West Florida, and the National Fish and Wildlife Federation Gulf Environmental Benefit Fund (Grant FN003 49540) to Florida Fish and Wildlife Conservation Commission (subcontract to JMC).

Institutional Review Board Statement

Not applicable.

Informed Consent Statement

Not applicable.

Data Availability Statement

The data presented in this study are available in Supplementary Materials as a comma delimited file.

Acknowledgments

We thank Barbara Albrecht, Lisa Waidner, Joe Moss, Stew Hood, Melissa Hagy, Fred Hileman, and Kate Dawson for assistance in the field and laboratory.

Conflicts of Interest

The authors declare no conflict of interest.

References

  1. Thayer, G.W.; Wolfe, D.A.; Williams, R.B. The impact of man on seagrass systems. Am. Sci. 1975, 63, 288–296. [Google Scholar]
  2. Short, F.T.; Wylle-Echeverria, S. Natural and human-induced disturbances of seagrasses. Environ. Conserv. 1996, 23, 17–27. [Google Scholar] [CrossRef]
  3. Hemminga, M.A.; Duarte, C.M. Seagrass Ecology; Cambridge University Press: Cambridge, UK, 2000. [Google Scholar]
  4. Orth, R.J.; Carruthers, J.B.; Dennison, W.C.; Duarte, C.M.; Fourqurean, J.W.; Heck, K.L., Jr.; Hughes, A.R.; Kendrick, G.A.; Kenworthy, W.J.; Olyarnik, S.; et al. A global crisis for seagrass ecosystems. Bioscience 2006, 56, 987–996. [Google Scholar] [CrossRef] [Green Version]
  5. Lamb, J.B.; Van De Water, J.A.J.M.; Bourne, D.G.; Altier, C.; Hein, M.Y.; Fiorenza, E.A.; Abu, N.; Jompa, J.; Harvell, C.D. Seagrass ecosystems reduce exposure to bacterial pathogens of humans, fishes, and invertebrates. Science 2017, 355, 731–733. [Google Scholar] [CrossRef]
  6. Waycott, M.; Duarte, C.M.; Carruthers, T.J.B.; Orth, R.J.; Dennison, W.C.; Olyarnik, S.; Calladine, A.; Fourqurean, J.W.; Heck, K.L., Jr.; Hughes, A.R.; et al. Accelerating loss of seagrass across the globe threatens coastal ecosystems. PNAS 2009, 106, 12377–12381. [Google Scholar] [CrossRef] [PubMed] [Green Version]
  7. Iverson, R.L.; Bittaker, H.F. Seagrass distribution and abundance in Eastern Gulf of Mexico Coastal Waters. Estuar. Coast. Shelf Sci. 1986, 22, 577–602. [Google Scholar] [CrossRef]
  8. Devereaux, R. Seagrass Rhizosphere Microbial Communities. In Interactions between Macro- and Microorganisms in Marine Sediments; Kristensen, E., Haese, R.F., Kostka, J.E., Eds.; AGU: Washington, DC, USA, 2005; Volume 60, pp. 199–216. [Google Scholar]
  9. Greve, T.M.; Binzer, T. Which factors regulate seagrass growth and distribution? In European Seagrass: An Introduction to Monitoring and Management; Borum, J., Duarte, C.M., Krause-Jensen, D., Greve, T.M., Eds.; EU Project Monitoring and Managing of European Seagrass (M&MS): Copenhagen, Denmark, 2004; pp. 19–23. [Google Scholar]
  10. Welsh, D.T. Nitrogen fixation in seagrass meadows: Regulation, plant-bacteria interactions and significance to primary production. Limnol. Oceanogr. 2000, 3, 58–71. [Google Scholar] [CrossRef]
  11. Bray, C.M. Nitrogen Metabolism in Plants; Longman Inc.: New York, NY, USA, 1983. [Google Scholar]
  12. Müller, A.; Newton, W.E. Nitrogen Fixation: The Chemical-Biochemical-Genetic Interface; Plenum Press: New York, NY, USA, 1983. [Google Scholar]
  13. Howard, J.B.; Rees, D.C. Structural Basis of Biological Nitrogen Fixation. Chem. Rev. 1996, 96, 2965–2982. [Google Scholar] [CrossRef] [PubMed]
  14. Zimmerman, R.C.; Smith, R.D.; Alberte, R.S. Is growth of eelgrass nitrogen limited? A numerical simulation of the effects of light and nutrients on the growth dynamics of Zostera marina. Mar. Ecol. Prog. Ser. 1987, 41, 167–176. [Google Scholar] [CrossRef]
  15. Lee, K.S.; Dunton, K.H. Inorganic nitrogen acquisition in the seagrass Thalassia testudinum: Development of a whole-plant nitrogen budget. Limnol. Oceanogr. 1999, 44, 1204–1215. [Google Scholar] [CrossRef] [Green Version]
  16. O’Donohue, M.J.; Moriarty, D.J.W.; Rae, I.C.M. Nitrogen fixation in sediments and the rhizosphere of the seagrass Zostera capricorni. Microb. Ecol. 1991, 22, 53–64. [Google Scholar] [CrossRef]
  17. Welsh, D.T.; Bourguès, S.; De Wit, R.; Herbert, R.A. Seasonal variations in nitrogen-fixation (acetylene reduction) and sulphate-reduction rates in the rhizosphere of Zostera noltii: Nitrogen fixation by sulphate-reducing bacteria. Mar. Biol. 1996, 125, 619–628. [Google Scholar] [CrossRef]
  18. McGlathery, K.J.; Risgaard-Petersen, N.; Christensen, P.B. Temporal and spatial variation in nitrogen fixation activity in the eelgrass Zostera marina rhizosphere. Mar. Ecol. Prog. Ser. 1998, 168, 245–258. [Google Scholar] [CrossRef]
  19. Capone, D.G.; Taylor, B.F. N2 fixation in the rhizosphere of Thalassia testudinum. Can. J. Microbiol. 1980, 26, 998–1005. [Google Scholar] [CrossRef]
  20. Capone, D.G. Nitrogen fixation (acetylene reduction) by rhizosphere sediments of the eelgrass Zostera marina. Mar. Ecol. Prog. Ser. 1982, 10, 67–75. [Google Scholar] [CrossRef]
  21. Howarth, R.W.; Butler, T.; Lunde, K.; Swaney, D.; Chu, C.R. Turbulence and planktonic nitrogen fixation: A mesocosm experiment. Limnol. Oceanogr. 1993, 38, 1696–1711. [Google Scholar] [CrossRef]
  22. Hemminga, M.A. The roots/rhizome system of seagrasses: An asset and a burden. J. Sea Res. 1998, 39, 183–196. [Google Scholar] [CrossRef]
  23. Capone, D.G.; Oremland, R.S.; Taylor, B.F. Significance of N2 fixation to the production of Thalassia testudinum communities. In Proceedings of the CICAR-II: Symposium on Progress in Marine Research in the Caribbean and Adjacent Regions, Caracas, Venezuela, 12–16 July 1976; pp. 71–85. [Google Scholar]
  24. Capone, D.G. Benthic Nitrogen Fixation. In Nitrogen in the Marine Environment; Carpenter, E.J., Capone, D.G., Eds.; Academic Press: New York, NY, USA, 1983; pp. 105–138. [Google Scholar]
  25. Nedwell, D.; Aziz, S. Heterotrophic nitrogen fixation in intertidal salt marsh sediment. Estuar. Coast. Mar. Sci. 1980, 10, 699–702. [Google Scholar] [CrossRef]
  26. Oremland, R.S.; Capone, D.G. Use of “specific” inhibitors in biogeochemistry and microbial ecology. Adv. Microb. Ecol. 1988, 10, 285–383. [Google Scholar]
  27. Cook, P.L.M.; Evrard, V.; Woodland, R.J. Factor controlling nitrogen fixation in temperate seagrass beds. Mar. Ecol. Prog. Ser. 2015, 525, 41–51. [Google Scholar] [CrossRef]
  28. Bertics, V.J.; Löscher, C.R.; Salonen, I.; Dale, A.W.; Gier, J.; Schmitz, R.A.; Treude, T. Occurrence of benthic microbial nitrogen fixation coupled to sulfate reduction in the seasonally hypoxic Eckernförde Bay, Baltic Sea. Biogeosciences 2013, 10, 1243–1258. [Google Scholar] [CrossRef] [Green Version]
  29. Fulweiler, R.W.; Nixon, S.W.; Buckley, B.A.; Granger, S.L. Reversal of the net dinitrogen gas flux in coastal marine sediments. Nature 2007, 448, 180–182. [Google Scholar] [CrossRef]
  30. Sim, M.S.; Ono, S.; Bosak, T. Effects of iron and nitrogen limitation on sulfur isotope fractionation during microbial sulfate reduction. Appl. Environ. Microbiol. 2012, 78, 8368–8376. [Google Scholar] [CrossRef] [PubMed] [Green Version]
  31. Blaabjerg, V.; Mouritsen, K.N.; Finster, K. Diel cycles of sulphate reduction rates in sediments of a Zostera marina bed (Denmark). Aquat. Microb. Ecol. 1998, 15, 97–102. [Google Scholar] [CrossRef]
  32. Blackburn, T.H.; Nedwell, D.B.; Wiebe, W.J. Active mineral cycling in a Jamaican seagrass sediment. Mar. Ecol. Prog. Ser. 1994, 110, 233–239. [Google Scholar] [CrossRef]
  33. Lamers, L.P.M.; Govers, L.L.; Janssen, I.C.J.M.; Geurts, J.J.M.; Van Der Welle, M.E.W.; Van Katwijk, M.M.; Van Der Heide, T.; Roelofs, J.G.M.; Smolders, A.J.P. Sulfide as soil phytotoxin—A review. Front. Plant Sci. 2013, 4, 1–14. [Google Scholar] [CrossRef] [Green Version]
  34. Duarte, C.M. The future of seagrass meadows. Environ. Conserv. 2002, 29, 192–202. [Google Scholar] [CrossRef] [Green Version]
  35. Borum, J.; Pedersen, O.; Greve, T.M.; Frankovich, T.A.; Zieman, J.C.; Fourqurean, J.W.; Madden, C.J. The potential role of plant oxygen and sulphide dynamics in die-off events of the tropical seagrass, Thalassia testudinum. J. Ecol. 2005, 93, 148–158. [Google Scholar] [CrossRef]
  36. Olinger, L.W.; Rogers, R.; Fore, P.; Todd, R.; Mullins, B.; Blisterfield, F.; Wise, L. Environmental and Recory Studies of Escambia Bay and the Pensacola Bay System; Florida US Environmental Protection Agency, Region IV: Gulf Breeze, FL, USA, 1975; pp. 1–345.
  37. Lehnen, N.; Marchant, H.K.; Schewdt, A.; Milucka, J.; Lott, C.; Weber, M.; Dekaezemacker, J.; Seah, B.K.B.; Hach, P.F.; Mohr, W.; et al. High rates of microbial dinitrogen fixation and sulfate reduction associated with the Mediterranean seagrass Posidonia oceanica. Syst. Appl. Microbiol. 2016, 39, 476–483. [Google Scholar] [CrossRef] [PubMed]
  38. USEPA. The Ecological Condition of the Pensacola Bay System, Northwest Florida (1994–2001); U.S. Environmental Protection Agency, Office of Research and Development, National Health and Ecological Effects Research Laboratory, Gulf Ecology Division: Gulf Breeze, FL, USA, 2004.
  39. NWFWMD. Pensacola Bay System Surface Water Improvement and Management Plan; Northwest Florida Water Management District: Havana, FL, USA, 2017. [Google Scholar]
  40. Devereaux, R.; Yates, D.F.; Aukamp, J.; Quarles, R.L.; Jordan, S.J.; Stanley, R.S.; Eldridge, P.M. Interactions of Thalassia testudinum and sediment biogeochemistry in Santa Rosa Sound, NW Florida. Mar. Biol. Res. 2011, 7, 317–331. [Google Scholar] [CrossRef]
  41. Macauley, J.M.; Clark, J.R.; Price, W.A. Seasonal changes in the standing crop and chlorophyll content of Thalassia testudinum Banks ex König and its epiphytes in the northern Gulf of Mexico. Aquat. Bot. 1988, 31, 277–287. [Google Scholar] [CrossRef]
  42. Lores, E.M.; Pasko, E.; Patrick, J.M.; Quarles, R.L.; Campbell, J.; Macauley, J. Mapping and monitoring of submerged aquatic egetation in Escambia-Pensacola Bay System, Florida. Gulf Mex. Sci. 2000, 18, 1–14. [Google Scholar]
  43. Scott, T.M. Geology of the Florida Platform. In Gulf of Mexico Origin, Waters, and Biota; Buster, N.A., Holmes, C.W., Eds.; Texas A&M University Press: College Station, TX, USA, 2011; Volume 3, pp. 17–31. [Google Scholar]
  44. Parsons, T.R.; Maita, Y.; Lalli, C.M. Determination of Phosphate. In A Manual of Chemical and Biological Methods for Seawater Analysis; Pergamon Press: New York, NY, USA, 1984; pp. 22–24. [Google Scholar]
  45. Holmes, R.M.; Aminot, A.; Kérouel, R.; Hooker, B.A.; Peterson, B.J. A simple and precise method for measuring ammonium in marine and freshwater ecosystems. Can. J. Fish. Aquat. Sci. 1999, 56, 1801–1808. [Google Scholar] [CrossRef]
  46. Braman, R.S.; Hendrix, S.A. Nanogram nitrite and nitrate determination in environmental and biological materials by vanadium(III) reduction with chemiluminescence detection. Anal. Chem. 1989, 61, 2715–2718. [Google Scholar] [CrossRef]
  47. Fonselius, S.H. Determination of Hydrogen Sulphide. In Methods of Seawater Analysis; Grasshoff, K., Ehrhardt, M., Kremling, K., Eds.; Wiley-VCH Verlag GmbH: Weinheim, Germany, 1983; pp. 73–80. [Google Scholar]
  48. Welshmeyer, N.A. Fluorometric analysis of chlorophyll a in the presence of chlorphyll b and pheopigments. Limnol. Oceanogr. 1994, 39, 1985–1992. [Google Scholar] [CrossRef]
  49. Capone, D.G. Determination of Nitrogenase Activity in Aquatic Samples Using the Acetylene Reduction Procedure. In Handbook of Methods in Aquatic Microbial Ecology; Kemp, P.F., Cole, J.J., Sherr, B.F., Sherr, E.B., Eds.; CRC Press: Boca Raton, FL, USA, 1993; pp. 621–632. [Google Scholar]
  50. Capone, D.G.; Montoya, J.P. Nitrogen fixation and denitrification. Method. Microbiol. 2001, 30, 501–515. [Google Scholar]
  51. Atkinson, M.J.; Smith, S.V. C:N:P ratios of benthic marine plants. Limnol. Oceanogr. 1983, 28, 568–574. [Google Scholar] [CrossRef]
  52. Carlson, P.R.; Yarbro, L.A.; Barber, T.R. Relationship of sediment sulfide to mortality of Thalassia testudinum in Florida Bay. Bull. Mar. Sci. 1994, 54, 733–746. [Google Scholar]
  53. Price, W.A. A Comparison of Nitrogen Fixation (Acetylene Reduction) Rates in Seagrass Communities Dominated by Thalassia Testudinum and Halodule Wrightii; University of West Flordia: Pensacola, FL, USA, 1988. [Google Scholar]
  54. McRoy, C.P.; Goering, J.J.; Chaney, B. Nitrogen fixation associated with seagrasses. Limnol. Oceanogr. 1973, 18, 998–1002. [Google Scholar] [CrossRef]
  55. Capone, D.G.; Penhale, P.A.; Oremland, R.S.; Taylor, B.F. Relationship between productivity and N2 (C2H2) fixation in a Thalassia testudinum community. Limnol. Oceanogr. 1979, 24, 117–125. [Google Scholar] [CrossRef]
  56. Patriquin, D.; Knowles, R. Nitrogen fixation in the rhizosphere of marine angiosperms. Mar. Biol. 1972, 16, 49–58. [Google Scholar] [CrossRef]
  57. Smith, G.W.; Hayasaka, S.S. Nitrogenase actvity associated with Halodule wrightii roots. Appl. Environ. Microbiol. 1982, 43, 1244–1248. [Google Scholar] [CrossRef] [PubMed] [Green Version]
  58. Hartog, C.D. The Sea-Grasses of the World; North-Holland Publishing Co.: Amsterdam, The Netherlands, 1970. [Google Scholar]
  59. Moshiri, G.A.; Aumen, N.G.; Swann, W.G. Water Quality Studies in Santa Rosa Sound; US Environmental Protection Agency: Gulf Breeze, FL, USA, 1980; pp. 1–71.
  60. Lee, K.S.; Park, S.R.; Park, Y.K. Effects of irradiance, temperature, and nutrients on growth dynamics of seagrass: A review. J. Exp. Mar. Biol. Ecol. 2007, 350, 144–175. [Google Scholar] [CrossRef]
  61. Moore, D.R. Distribution of the sea grass, Thalassia, in the United States. Bull. Mar. Sci. 1963, 13, 329–342. [Google Scholar]
  62. Lee, K.S.; Dunton, K.H. Effects of nitrogen enrichment on biomass allocation, growth, and leaf morphology of the seagrass Thalassia testudinum. Mar. Ecol. Prog. Ser. 2000, 196, 39–48. [Google Scholar] [CrossRef] [Green Version]
  63. Fourqurean, J.W.; Cai, Y. Arsenic and phosphorus in seagrass leaves from the Gulf of Mexico. Aquat. Bot. 2001, 71, 247–258. [Google Scholar] [CrossRef]
  64. Johnson, M.W.; Heck, K.L., Jr.; Fourqurean, J.W. Nutrient content of seagrasses and epiphytes in the northern Gulf of Mexico: Evidence of phosphorus and nitrogen limitation. Aquat. Bot. 2006, 85, 103–111. [Google Scholar] [CrossRef]
  65. Lee, K.S.; Dunton, K.H. Diurnal changes in pore water sulfide concentrations in the seagrass Thalassia testudinum beds: The effects of seagrasses on sulfide dynamic. J. Exp. Mar. Biol. Ecol. 2000, 255, 201–214. [Google Scholar] [CrossRef]
  66. Borum, J.; Sand-Jensen, K.; Binzer, T.; Pedersen, O. Oxygen movement in seagrasses. In Seagrasses: Biology, Ecology and Conservation; Larkum, A.W.D., Orth, R.J., Duarte, C.M., Eds.; Springer: Dordrecht, The Netherlands, 2006; pp. 255–270. [Google Scholar]
  67. Sand-Jensen, K.; Prahl, C.; Stokholm, H. Oxygen release from roots of submerged aquatic macrophytes. Oikos 1982, 38, 349–354. [Google Scholar] [CrossRef]
  68. Jovanovic, Z.; Pedersen, M.Ø.; Larsen, M.; Kristensen, E.; Glud, R.N. Rhizosphere O2 dynamics in young Zostera marina and Ruppia maritima. Mar. Ecol. Prog. Ser. 2015, 518, 95–105. [Google Scholar] [CrossRef] [Green Version]
  69. Caffrey, J.M.; Kemp, W.M. Seasonal and spatial patterns of oxygen production, respiration and root-rhizome release in Potamogeton perfoliatus L. and Zostera marina L. Aquat. Bot. 1991, 40, 109–128. [Google Scholar] [CrossRef]
  70. Koch, M.S.; Erskine, J.M. Sulfide as a phytotoxin to the tropical seagrass Thalassia testudinum interactions with light, salinity and temperature. J. Exp. Mar. Biol. Ecol. 2001, 266, 81–95. [Google Scholar] [CrossRef]
  71. Koch, M.S.; Schopmeyer, S.; Kyhn-Hansen, C.; Madden, C.J. Synergistic effects of high temperature and sulfide on tropical seagrass. J. Exp. Mar. Biol. Ecol. 2007, 341, 91–101. [Google Scholar] [CrossRef]
  72. Johnson, C.R.; Koch, M.S.; Pederson, O.; Madden, C.J. Hypersalinity as a trigger of seagrass (Thalassia testudinum) die-off events in Florida Bay: Evidence based on shoot meristem O2 and H2S dynamics. J. Exp. Mar. Biol. Ecol. 2018, 504, 47–52. [Google Scholar] [CrossRef]
  73. Knapp, A.N. The sensitivity of marine N2 fixation to dissolved inorganic nitrogen. Front. Microbiol. 2012, 3, 1–4. [Google Scholar] [CrossRef] [PubMed] [Green Version]
  74. Caffrey, J.M.; Albrecht, B.; Capps, R.E. Seagrass Abundance and Productivity in Pensacola Bay and Santa Rosa Sound; Florida Fish and Wildlife Comission FIsh and Wildlife Research Insitute: St. Petersburg, FL, USA, 2017. [Google Scholar]
  75. Duarte, C.M.; Chiscano, C.L. Seagrass biomass and production: A reassessment. Aquat. Bot. 1999, 65, 159–174. [Google Scholar] [CrossRef]
  76. Cole, L.W.; McGlathery, K.J. Nitrogen fixation in restored eelgrass meadows. Mar. Ecol. Prog. Ser. 2012, 448, 235–246. [Google Scholar] [CrossRef] [Green Version]
Figure 1. Location of sampling location at Big Sabine Point within the Pensacola Bay System and in relation to the Gulf of Mexico (ArcMap 10.4.1). Sampling at this site began in May 2015 and ended in September 2016.
Jmse 09 00766 g001
Figure 2. Water temperature (°C), salinity (PSU), dissolved oxygen (mg L−1) surface irradiance (%), and pH from May 2015 to September 2016 at Big Sabine Point.
Jmse 09 00766 g002
Figure 3. Percent areal cover for both seagrass species, T. testudinum and H. wrightii, between September 2015 and September 2016 at Big Sabine Point.
Jmse 09 00766 g003
Figure 4. Porewater ammonium (top panel) and phosphate (bottom panel) in bare sediments, colonized by H.wrightii and T. testudinum from May 2015 to September 2016 at Big Sabine Point. Error bars represent standard error of the mean.
Jmse 09 00766 g004
Figure 5. Porewater hydrogen sulfide concentrations in all substrate types from September 2015 to September 2016 at Big Sabine Point. Error bars represent the standard error of the mean. Growth inhibition begins at 300 µM; sulfide toxicity is approximately equal to 2000 µM [52].
Jmse 09 00766 g005
Figure 6. Nitrogen fixation rates in all substrate types from September 2015 to September 2016 at Big Sabine Point. Error bars represent the standard error of the mean.
Jmse 09 00766 g006
Figure 7. Principal component analysis (PCA) biplot showing relatedness of variables based on substrate type. The variables included in this plot are pH (pH), temperature (Temperature), salinity (Salinity), surface irradiance (X..SI), dissolved oxygen (DO.mg.L), water column chl a (OW.Chl.a), water column ammonium (OW.NH4+), water column DIP (OW.P), water column nitrate (OW.NO3), percent areal seagrass cover (X..Cover), sediment water content (X..Water), sediment organic matter content (X..OM), porewater ammonium (Pore.NH4), porewater DIP (Pore.P), nitrogen fixation (N.fix), porewater sulfide (Sulfide, and porewater N:P (NP.Ratio.Pore). The relatedness of temperature, salinity and surface irradiance overlap their respective vectors in the lower right-hand corner of the biplot.
Jmse 09 00766 g007
Figure 8. Conceptual models for conditions that stimulated sediment nitrogen fixation in the different substrate types: (a) Organic matter remineralization in unvegetated sediments resulted in increased inorganic nutrients and carbon energy sources for diazotrophic sulfate reducing bacteria which produced sulfide; (b) Decreased availability of bioavailable nitrogen relative to phosphorus stimulated nitrogen fixation in sediments colonized by H. wrightii; (c) In sediments colonized by T. testudinum, nitrogen fixation was highest when water column temperature and percent surface irradiance were at their lowest and water column dissolved oxygen was at its highest. These conditions were associated with dormancy which had the highest percent organic matter content in the sediments.
Jmse 09 00766 g008aJmse 09 00766 g008b
Table 1. Percent water, percent organic matter, and porewater nutrients in unvegetated sediments and H. wrightii and T. testudinum sediments. Leaf N:P ratios are from Atkinson and Smith [51].
Substrate TypeUnvegetatedH. wrightiiT. testudinum
Sediment Water (%)Range17.2–22.220.9–32.221.2–44.9
Average ± SE20.2 ± 0.226.2 ± 0.328.9 ± 0.7
Sediment Organic Matter (%)Range0.09–0.890.30–2.750.34–2.07
Average ± SE0.29 ± 0.021.14 ± 0.071.27 ± 0.06
Dissolved Inorganic Phosphate (DIP) (µM)Range0.1–1.70.6–3.00.6–3.3
Average ± SE0.7 ± 0.11.6 ± 0.21.6 ± 0.2
Ammonium (µM)Range8.0–46.92.9–48.02.2–33.7
Average ± SE21.6 ± 3.410.8 ± 3.19.6 ± 2.7
Porewater Nitrogen:Phosphorus Ratio (N:P)Range16.8–1071.6–18.20.7–19.0
Average ± SE39.6 ± 6.17.0 ± 1.36.0 ± 1.3
N:P Seagrass Leaves N/A1626
Table 2. Nitrogen fixation rates from this study compared to other studies.
Substrate TypeLocationSeason or MonthNitrogen Fixation Rate (mg N m−2 d−1)Reference
T. testudinumNW Florida, USAEarly Growth (Mar.-Apr.)2.40 ± 0.95This Study
Peak Growth (May-Jul.)1.40 ± 0.89This Study
Late Growth (Aug.-Sept.)2.48 ± 0.66This Study
Senescence (Sept.-Nov.)3.33 ± 0.57This Study
Dormancy (Dec.-Feb.)2.04 ± 0.74This Study
Spring2.54[53]
Summer4.21[53]
Fall10.45[53]
Winter4.95[53]
Florida, USAJanuary/March0.03[54]
Biscayne Bay, Florida, USAAugust/October5–24[19]
Bimini Harbor, BahamasJuly5.1–5.3[55]
August6–9[55]
BarbadosSeptember27–140[56]
H. wrightiiNW Florida, USAEarly Growth (Mar.-Apr.)1.42 ± 0.57This Study
Peak Growth (May-Jul.)1.74 ± 0.94This Study
Late Growth (Aug.-Sept.)3.06 ± 0.69This Study
Senescence (Sept.-Nov.)4.66 ± 0.97This Study
Dormancy (Dec.-Feb.)3.53 ± 0.68This Study
Spring5.50[53]
Summer3.15[53]
Fall7.39[53]
Winter8.25[53]
North Carolina, USAJune0.021[57]
August0.023[57]
November0.001[57]
H. beaudetteiJamaicaDecember28[32]
UnvegetatedNW Florida, USAEarly Growth (Mar.-Apr.)0.53 ± 0.31This Study
Peak Growth (May-Jul.)0.82 ± 0.39This Study
Late Growth (Aug.-Sept.)1.27 ± 0.46This Study
Senescence (Sept.-Nov.)1.68 ± 1.06This Study
Dormancy (Dec.-Feb.)0.13 ± 0.07This Study
Spring2.61[53]
Summer12.05[53]
Fall3.89[53]
Winter64.71[53]
Publisher’s Note: MDPI stays neutral with regard to jurisdictional claims in published maps and institutional affiliations.

