Article

Variation in Micro-Pores during Dynamic Consolidation and Compression of Soft Marine Soil

1
Research Center of Coastal and Urban Geotechnical Engineering, College of Architecture and Civil Engineering, Zhejiang University, Hangzhou 310058, China
2
Power China Huadong Engineering Corporation Limited, Hangzhou 310014, China
3
Engineering Research Center of Smart Rail Transportation of Zhejiang Province, Hangzhou 310014, China
4
Chair of Soil Mechanics, Foundation Engineering and Environmental Geotechnics, Ruhr-Universität Bochum, 44801 Bochum, Germany
5
Taizhou Huangyan Social Development Group Co., Ltd., Taizhou 318000, China
6
School of Civil Engineering & Architecture, Taizhou University, Taizhou 318000, China
*
Authors to whom correspondence should be addressed.
J. Mar. Sci. Eng. 2021, 9(7), 750; https://doi.org/10.3390/jmse9070750
Submission received: 7 June 2021 / Revised: 1 July 2021 / Accepted: 5 July 2021 / Published: 6 July 2021
(This article belongs to the Section Geological Oceanography)

Abstract

:
In this study, to explore the microstructure deformation mechanism of marine soft marine soil under cyclic loading, we analyzed the dynamic properties of soft marine soil under cyclic loading via dynamic consolidation compression testing. Then, using Image-Pro Plus (IPP) 6.0 image analysis software, and according to the dynamic consolidation compression test results and the images from a scanning electron microscope (SEM), we determined the weakening effect of soft soils under different consolidation confining pressures, different cyclic stress ratios, and different over-consolidation ratios. After dynamic consolidation and compression, the pore structure of undisturbed soft marine soil tends to compact, the degree of soil particle fragmentation intensifies, small pores increase, large pores decrease, the pores become more regular, and the distribution of pores is directional. Subsequently, for undisturbed soft marine soil, the higher the consolidated confining pressure, cyclic dynamic stress ratio, and over-consolidation ratio, the greater the damage to the pore structure, and the more obvious the structural weakening effect exhibited under cyclic loading.

1. Introduction

With ongoing economic development, the resulting increased construction of large infrastructure is facing significant challenges when soft soil is encountered. Soft marine soil has low strength, high natural moisture content, and high compressibility. Under cyclic loading, soft marine soil foundation shows large deformation, long settlement times, and uneven settlement, and predicting problems is difficult [1]. Thus, understanding the deformation mechanism of a marine soft soil foundation under cyclic loading can help to effectively prevent damage to a superstructure caused by the deformation of the foundation.
The dynamic properties of soil are strongly related to changes in the internal structure of porous media. Using microscopic tests to study changes in the internal structure of soft soil during cyclic loading can reveal the primary reasons for the macroscopic dynamic behavior of soft soil in unit tests [2,3].
The microscopic characteristics of soil can be studied from a geometric point of view. The arrangement of soft soil particles and pores is complex and random. Under dynamic loading, the particles and pores usually exist in a complex dynamic equilibrium. Structural units, such as particles, pores, and pore water, are constantly changing, which results in the overall structure being in a stable state under stress. Low-amplitude vibration may be extremely small and difficult to observe, but it can accumulate under the action of tens of thousands of vibrations, and so provide the conditions for observation. The main focus of research on the micro-geometric characteristics of soil has been on particles, pores, and structural connections. For particles and pores, morphological characteristics and arrangement characteristics are the research hot spot. Morphological characteristics include diameter, perimeter, area, roundness, fractal dimension, and others; arrangement characteristics include orientation, order, etc. For a structural connection, the connection formed between particles and the form of contact bands can be observed, such as typical flocs, agglomerates, honeycombs, pores, and cracks [4,5]. When soft soil properties change, the change in pores is the most direct and significant change. Therefore, the study of soil microstructure should focus on changes in pores in the soil [6].
For the study of soil pore structure, traditional test methods include gas adsorption, neutron scattering, X-ray, mercury intrusion (MIP), and others [7]. Miyata et al. [8] used the gas adsorption method to evaluate the pore size of a micropore and mesopore boundary area. Zhang et al. [9] used the mercury intrusion method (MIP) to study the influence of freeze-thaw and cyclic loading on the pore size distribution of silty clay under subway loading. However, quantitatively analyzing the complex void structure of samples using traditional experimental methods is difficult [10]. One of the advances in modern science and technology, scanning electron microscopy, is widely used in the microscopic research and analysis of soil. The SEM image analysis method can be used to visually evaluate pore structure characteristics [11]. Scholars around the world have focused on the microstructure of soil under dynamic load using scanning electron microscopy. For example, Griffiths et al. [12] studied the pore size distribution of different types of clays in different stages of consolidation. Tang et al. [13] analyzed the correlation between the microstructure change and macroscopic deformation in saturated soft soil under subway loading, with the help of a scanning electron microscope. Fang et al. [14] analyzed the micro-pore change characteristics of soft marine soil during the consolidation process based on SEM photos. Zhang et al. [15] studied the evolution of the size, number, and distribution of micro-pores in the consolidation process of soft soil by comparing SEM photos of soft soil before and after consolidation. Jiang et al. [16] studied the distribution characteristics and change principles of pores under traffic load. Ding et al. [17] researched the microscopic characteristics of frozen-thawed soft marine soil under cyclic loading using a scanning electron microscope and explained the potential reasons for the change in the macroscopic dynamic characteristics from the microscopic point of view. Zhou et al. [18] introduced a directional probability entropy approach to analyze the micro parameters of SEM and proposed a macro and micro coupling creep model of soft marine soil. The structure of soft marine soil is complex and uncertain. At present, research on the laws governing changes of the microstructure of soft marine soil under cyclic loading is still in the exploratory stage. Thus, to describe the macroscopic deformation mechanism of marine soft soil under cyclic loading, it is necessary to conduct in-depth research on the microscopic properties of soft marine soil before and after cyclic loading.
When reviewing the studies above, we found that research on the dynamic characteristics of soft marine soil under cyclic loading is scarce, and that research on the coupling analysis of the macroscopic dynamic response and microscopic internal characteristics is also relatively rare. As such, to explore the laws governing soft marine soil macroscopic mechanical behavior and microscopic characteristics, we used microstructure parameters to qualitatively analyze the dynamic characteristics of the changes in soils through dynamic consolidation compression and SEM tests. The research results help explain the microscopic deformation mechanism of undisturbed soft marine soil under cyclic loading, which is of reference value for theoretical exploration and engineering practice.

2. Materials and Methods
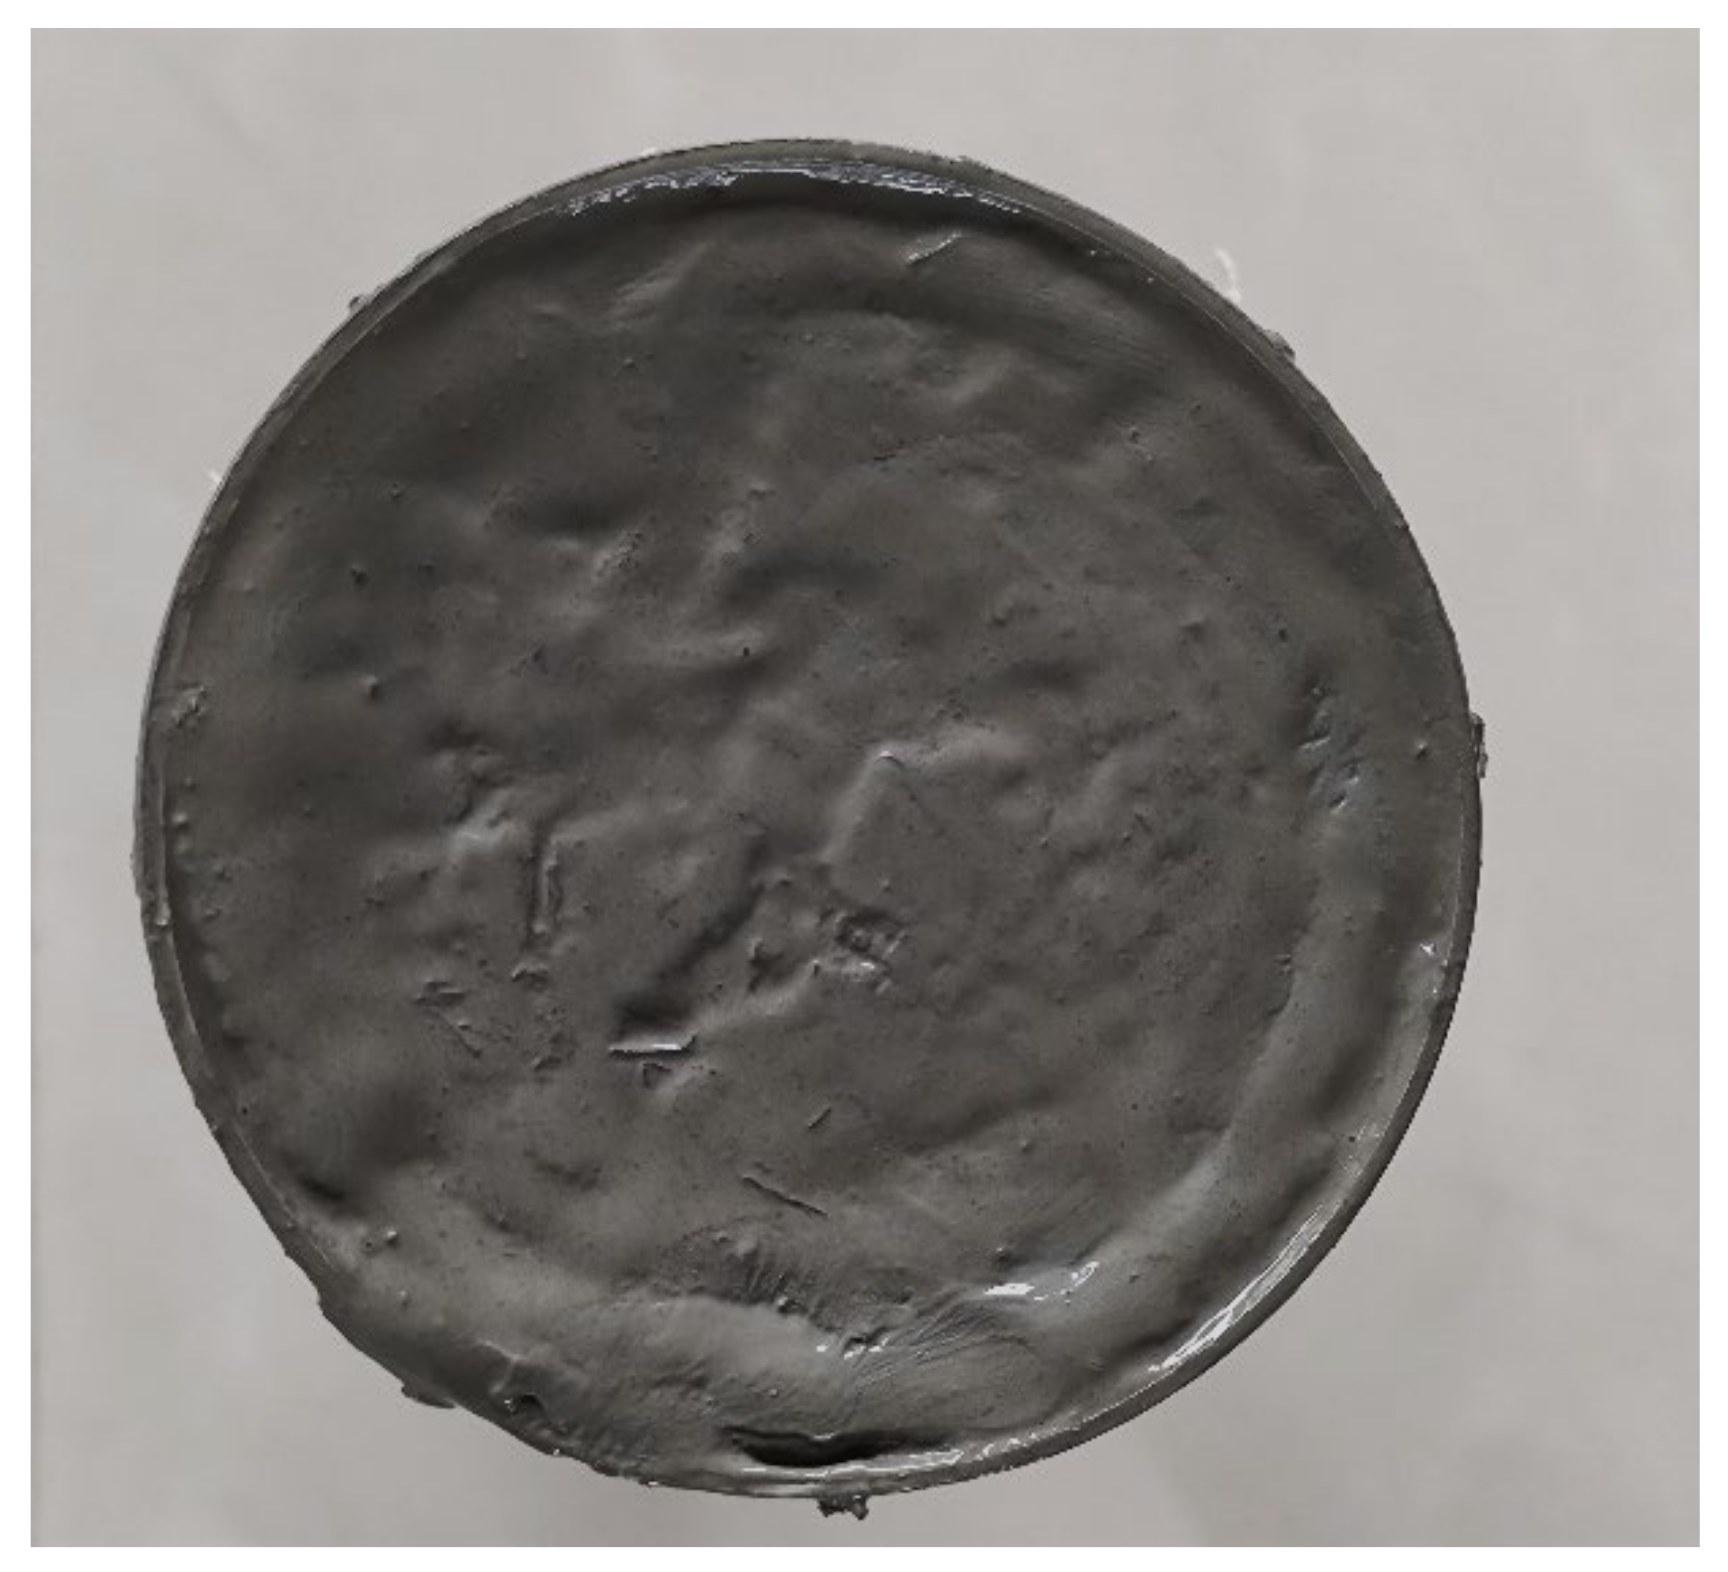
2.1. Test Materials

The soil samples were obtained from near Hangzhou Metro Line 2. They were categorized as fourth-phase marine sedimentary saturated silty soft soil (Figure 1). A TB3 open-piston thin-wall soil extractor (length = 508 mm, diameter = 76.2 mm; Shanghai Gongcheng Investigation Equipment Co., Ltd., Shangai, China) was used for soil sampling. After the soil was obtained, it was sealed with medical tape, a wax seal, and transparent tape, in sequence; placed into a special shock-proof box; and then placed in a constant-temperature and-humidity room for storage. Considering the Technical Regulations for Geological Exploration and Sampling of Construction Engineering (JGJ-T87-2012) and Technical Standards for Sampling of Undisturbed Soil JGJ 89-92, the soil samples were considered Class I undisturbed soil. Through indoor geotechnical tests, the basic physical parameters of the soil were determined, as shown in Table 1.

2.2. Test Instrument

The main instruments used in this test were an automatic consolidation and expansion tester and a field emission scanning electron microscope. The parameters of the various instruments are as follows:
(1)
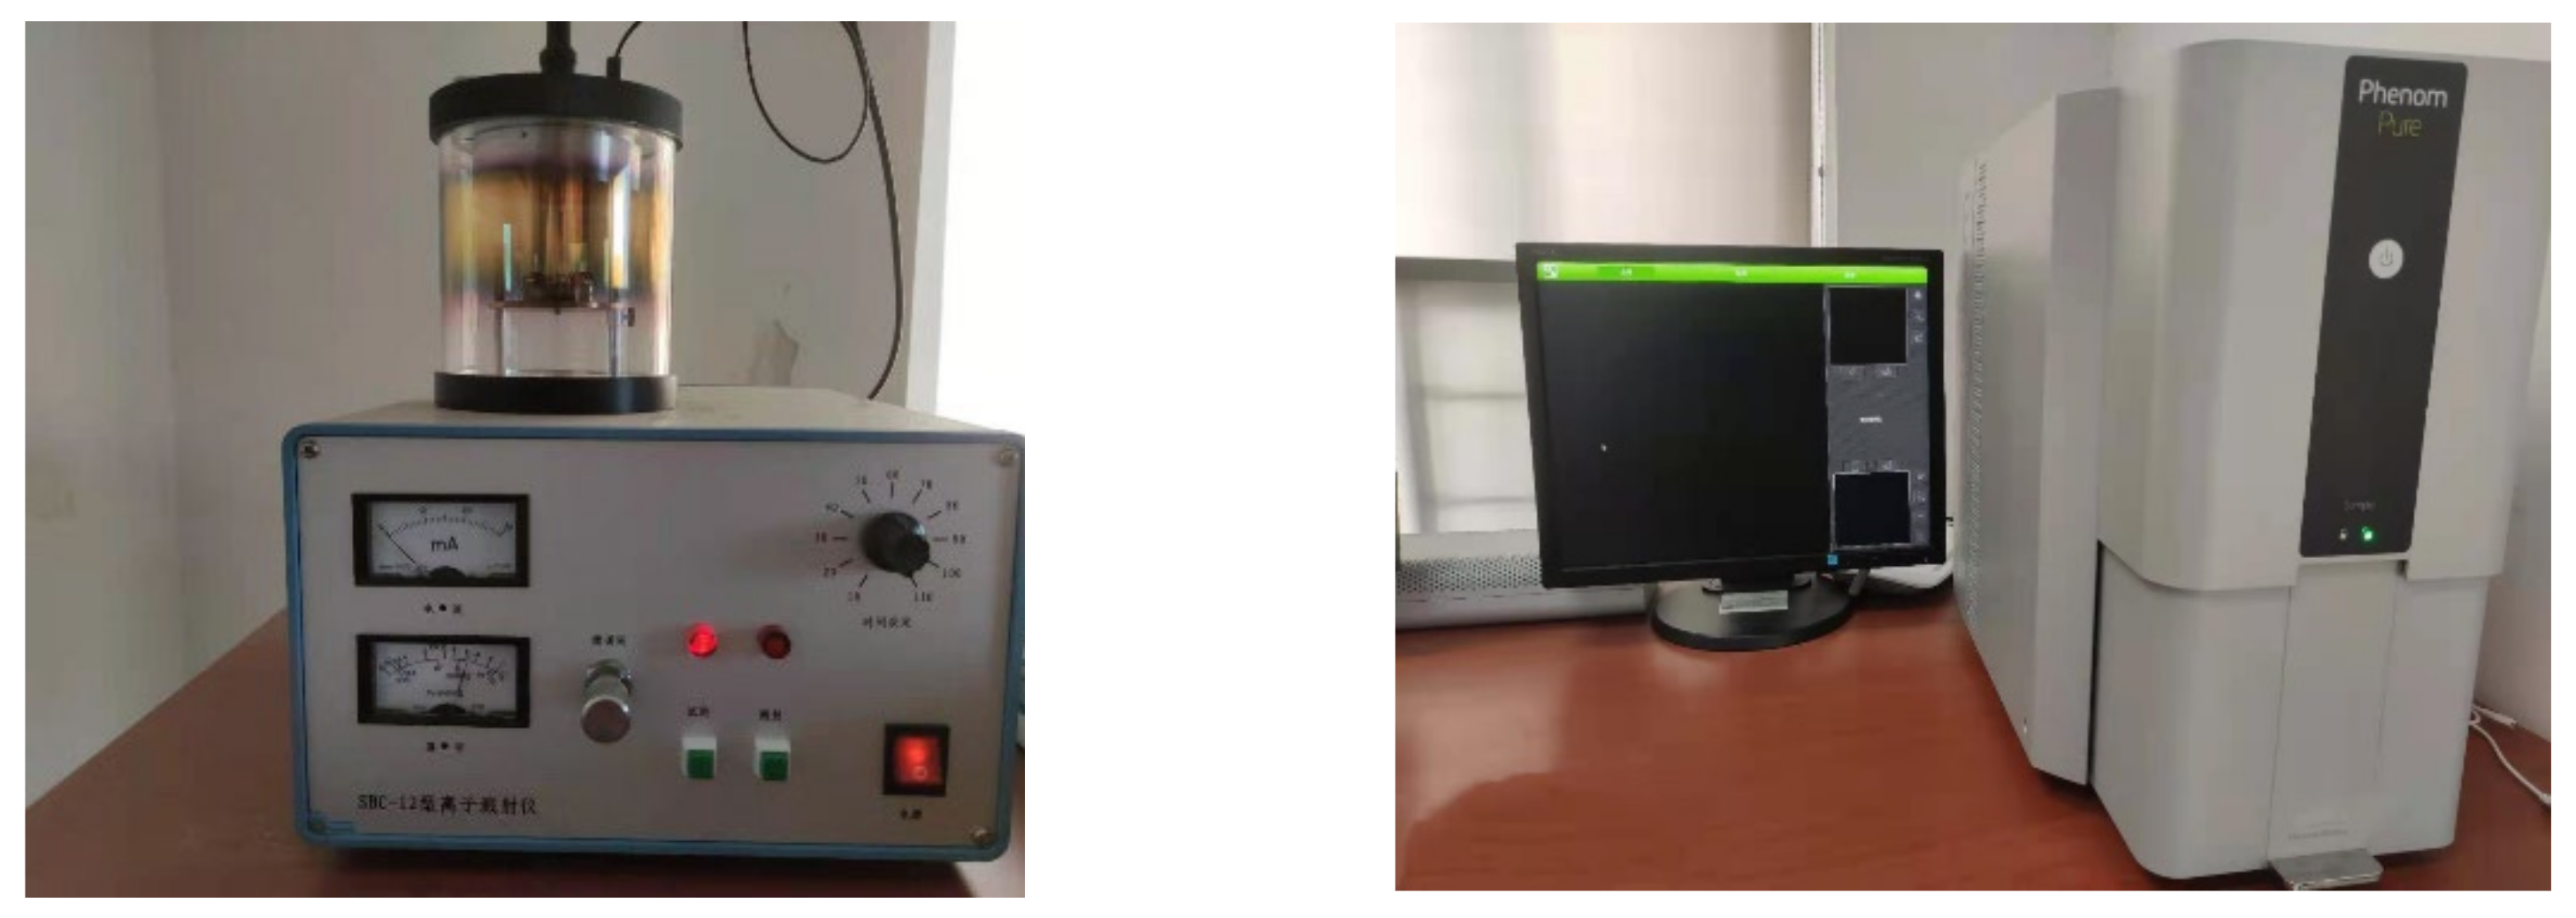
The automatic consolidation and expansion test instrument consisted of a pressure chamber, acquisition system, computer, and other components, as shown in Figure 2. The sample was installed in the pressure chamber. After setting the test conditions, the sample cyclic loading test was performed through the built-in control panel to collect the readings from the force and displacement sensors, controlling the stepper motor, and with the high-speed and accurate micro-stepper motor imposing a vertical load on the sample.
(2)
In this study, a QUANTA FEG 650 field emission scanning electron microscope (FEI company, Eindhoven, The Netherlands), depicted in Figure 3, was used to study the pores of the soft marine soil. An SEM is primarily composed of vacuum, electron beam, and imaging systems. The electron beam system emits high-energy incident electrons to bombard the material surface, producing secondary and backscattered electrons, which are received by the probe for imaging.

2.3. Test Plan

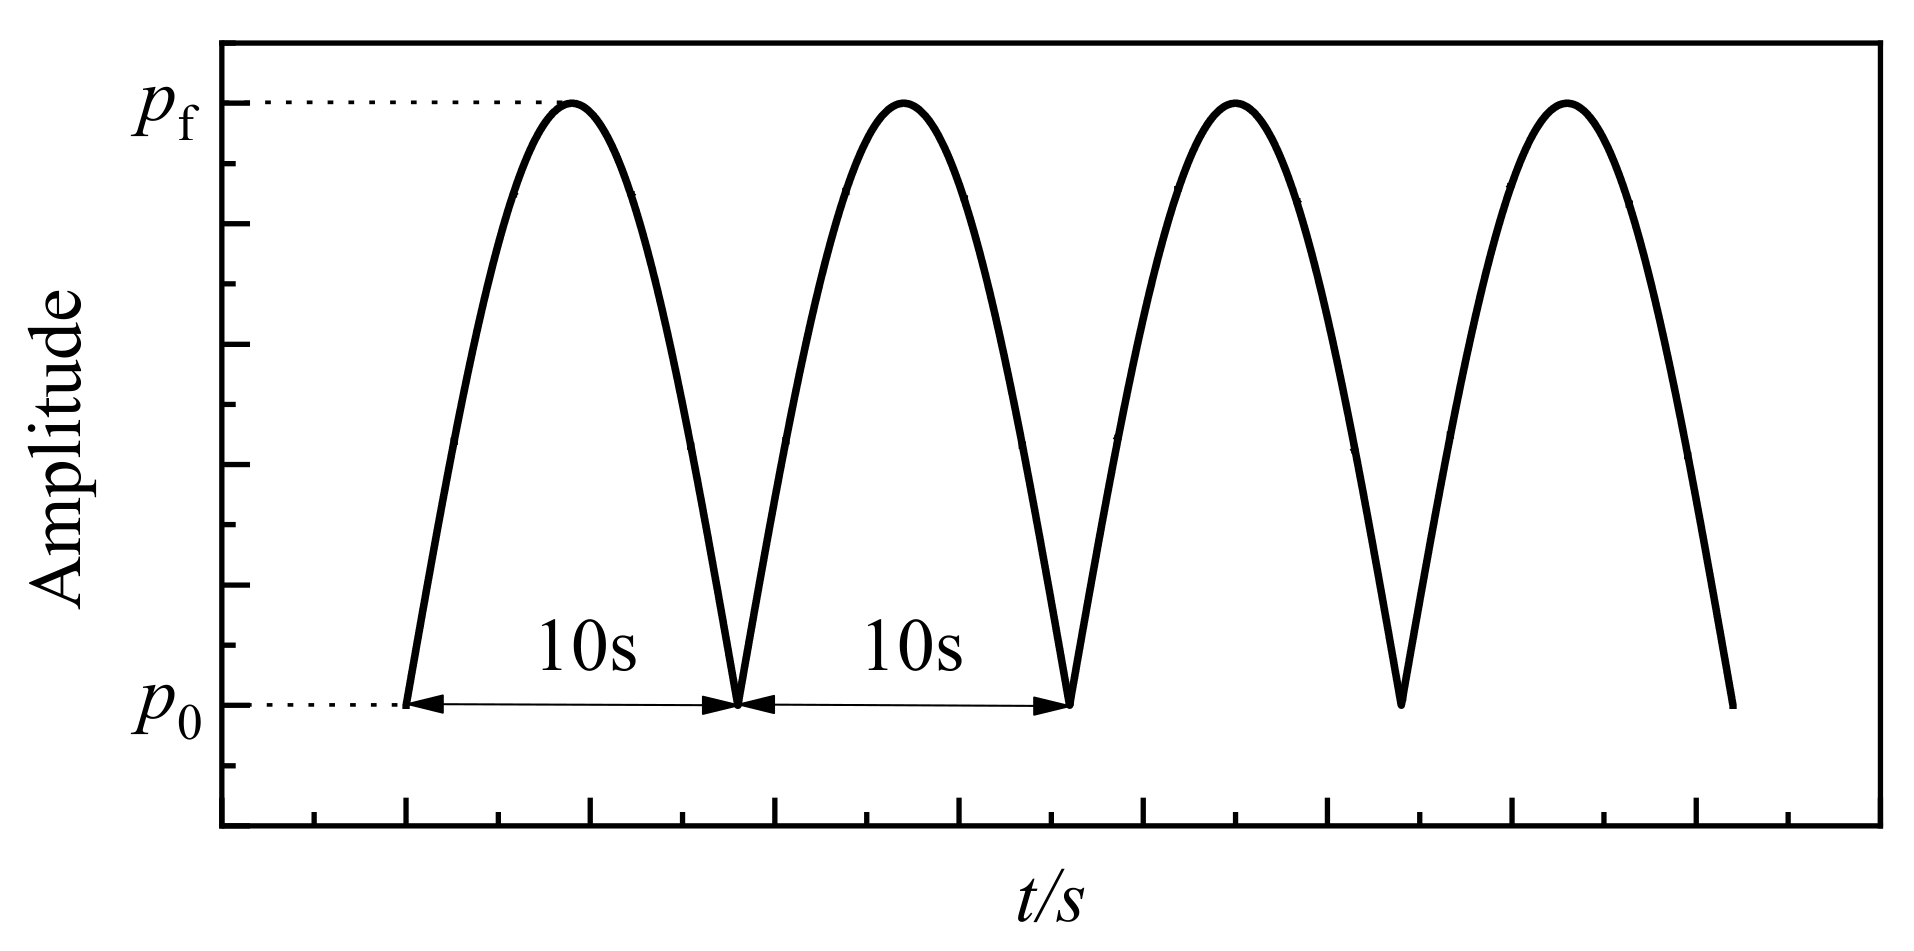
2.3.1. Dynamic Consolidation Compression Test

The samples were divided into three groups: SEM-A, SEM-B, and SEM-C. The cumulative strain characteristics under different consolidation confining pressures (p0; 100, 200, 300, 400, and 500 kPa), different cyclic dynamic stress ratios (ζ; 3, 6, 8, 10, and 15), and different over-consolidation ratios (OCR; 1, 3, 6, and 9) were studied. Samples A0, B0, and C0 represent the sample before loading (parallel sample).
In this study, the relationship between microscopic pores and macroscopic deformation was used to determine the dynamic characteristics of soft marine soil. A half-sine amplitude waveform was used to simulate cyclic loading, as shown in Figure 4. The number of vibrations is represented by N, which refers to the number of half-sine waves experienced by the load. The total number of vibrations was recorded as Nmax. To simulate long-term cyclic loading on the soft marine soil, 20,000 loading repetitions were chosen. We selected 0.1 Hz for the frequency of the cyclic loading. The amplitude of vibration is the cyclic dynamic stress pf, which is the stress difference between each vibration peak and trough; the cyclic dynamic stress ratio ζ is the ratio of the cyclic dynamic stress pf to the consolidated confining pressure p0. The data collection density was 500 points/cycle. The test plan is shown in Table 2.

2.3.2. SEM Test

The SEM technique is one of the main methods used for investigating the surface structure of soils. In this study, SEM was adopted for soil microstructure analysis. After the dynamic consolidation compression test, soil under different test conditions was used as the SEM samples.
SEM sample preparation is the basis of capturing SEM photos. To ensure that the scanning image can accurately reflect the true morphology of the sample, there are certain requirements that should be met in the preparation of SEM samples: disturbance and damage of the sample should be minimized, shrinkage deformation of the sample should be minimized in the drying process, uniformity should be ensured as much as possible when spraying conductive medium, and the thickness should be appropriate [19].
The sample preparation process was as follows:
(1)
A total of 17 groups of undisturbed soft marine soil samples under different test conditions were obtained for drying treatment. A horizontal section of the sample was selected as the observation surface. When the soil sample was in a semi-solid state, we selected the core of the sample to cut into strips with a 5 × 1 × 1 cm cross-section. Then, drying was continued.
(2)
After drying, to ensure that the observation section was not disturbed, the samples were cut into 5 × 5 × 2 mm microscopic samples and polished. Then, we used a washing ear ball to blow away loose floating particles.
(3)
Before scanning, due to the poor electrical conductivity of the soft clay, to ensure the quality of the micro-images, we coated the dry soil surface with a layer of 20–50 nm gold film as a conductive material.

2.4. Image Acquisition

We acquired images to accurately determine the surface features of the soil sample with the help of scanning electron microscopy. However, some problems needed to be solved during the image acquisition: the determination of magnification, image number, accelerating voltage, contrast, brightness, and the selection of a camera probe [20]. We adjusted the acceleration voltage, contrast, and brightness, according to the requirements of the photos, which are described in detail below.
The selection of the amplification factor has a non-negligible effect on the accuracy of the test results. When the magnification is too large, the main body of the scanning image tends to be the soil particles rather than the pores. The obtained porosity is less than the macroporosity, and the deviation increases significantly, with the increase in the magnification. When the magnification is too small, the small soil particles are inevitably misjudged as pores. The obtained porosity is greater than the macroporosity. Given the small size of clay particles in soft marine soil, we selected 8000× as the magnification in this study. The size unit of the obtained image was a pixel, and the actual size corresponding to each pixel was 0.0324 nm.
Differences may have existed in the microstructure of soil samples in different analysis regions. Therefore, it was necessary to capture multiple photos of the test soil samples to ensure the accuracy of the SEM images. An appropriate number of photos can ensure that microscopic photos accurately reflect the properties of soft marine soil. Bascoul et al. [21] studied the influence of the number of photos on the statistical variance of the data set at a magnification of 200× of cement mortar, and the results showed that 20 photos resulted in the variance being sufficiently small. Scrivener et al. [22] show that, at 400× magnification, 10 images were enough to reduce the standard error to 0.6%. After comprehensive consideration, the number of test soil sample photos was set to 25.
The photographing probes of SEM include a backscattering BSED probe, an environmental scanning GSED probe, and a secondary electron ETD probe. The GSED probe is suitable for observing samples with appropriate amounts of moisture. Both BSED and ETD probes are suitable for observing dry samples. However, photos captured by the GSED and ETD probes can reflect more details of the sample than the BSED probe [20]. In the test, therefore, the samples were dry, and an ETD probe was used.

2.5. SEM Image Processing

In our study, Image-Pro Plus 6.0 was used for image processing and quantitative analysis. The purpose of image processing is to obtain information from images and output pore characteristic data for statistical analysis [23].
The processing steps were divided into three: the calibration of pixel space, binarization processing, and automatic software analysis. IPP software takes the pixel as the analysis unit by default. To convert it into a length unit, it is necessary to establish a reference plane scale. After the scale is established and applied, the image is binarized. Figure 5b depicts the contrast picture after binarization. The black part of the picture after binarization is the soil particles, and the white part is the pores. The color can also be changed according to the requirements. After binarization, as shown in Figure 5c, the software can automatically identify the pore units and calculate the geometric information of each pore unit.

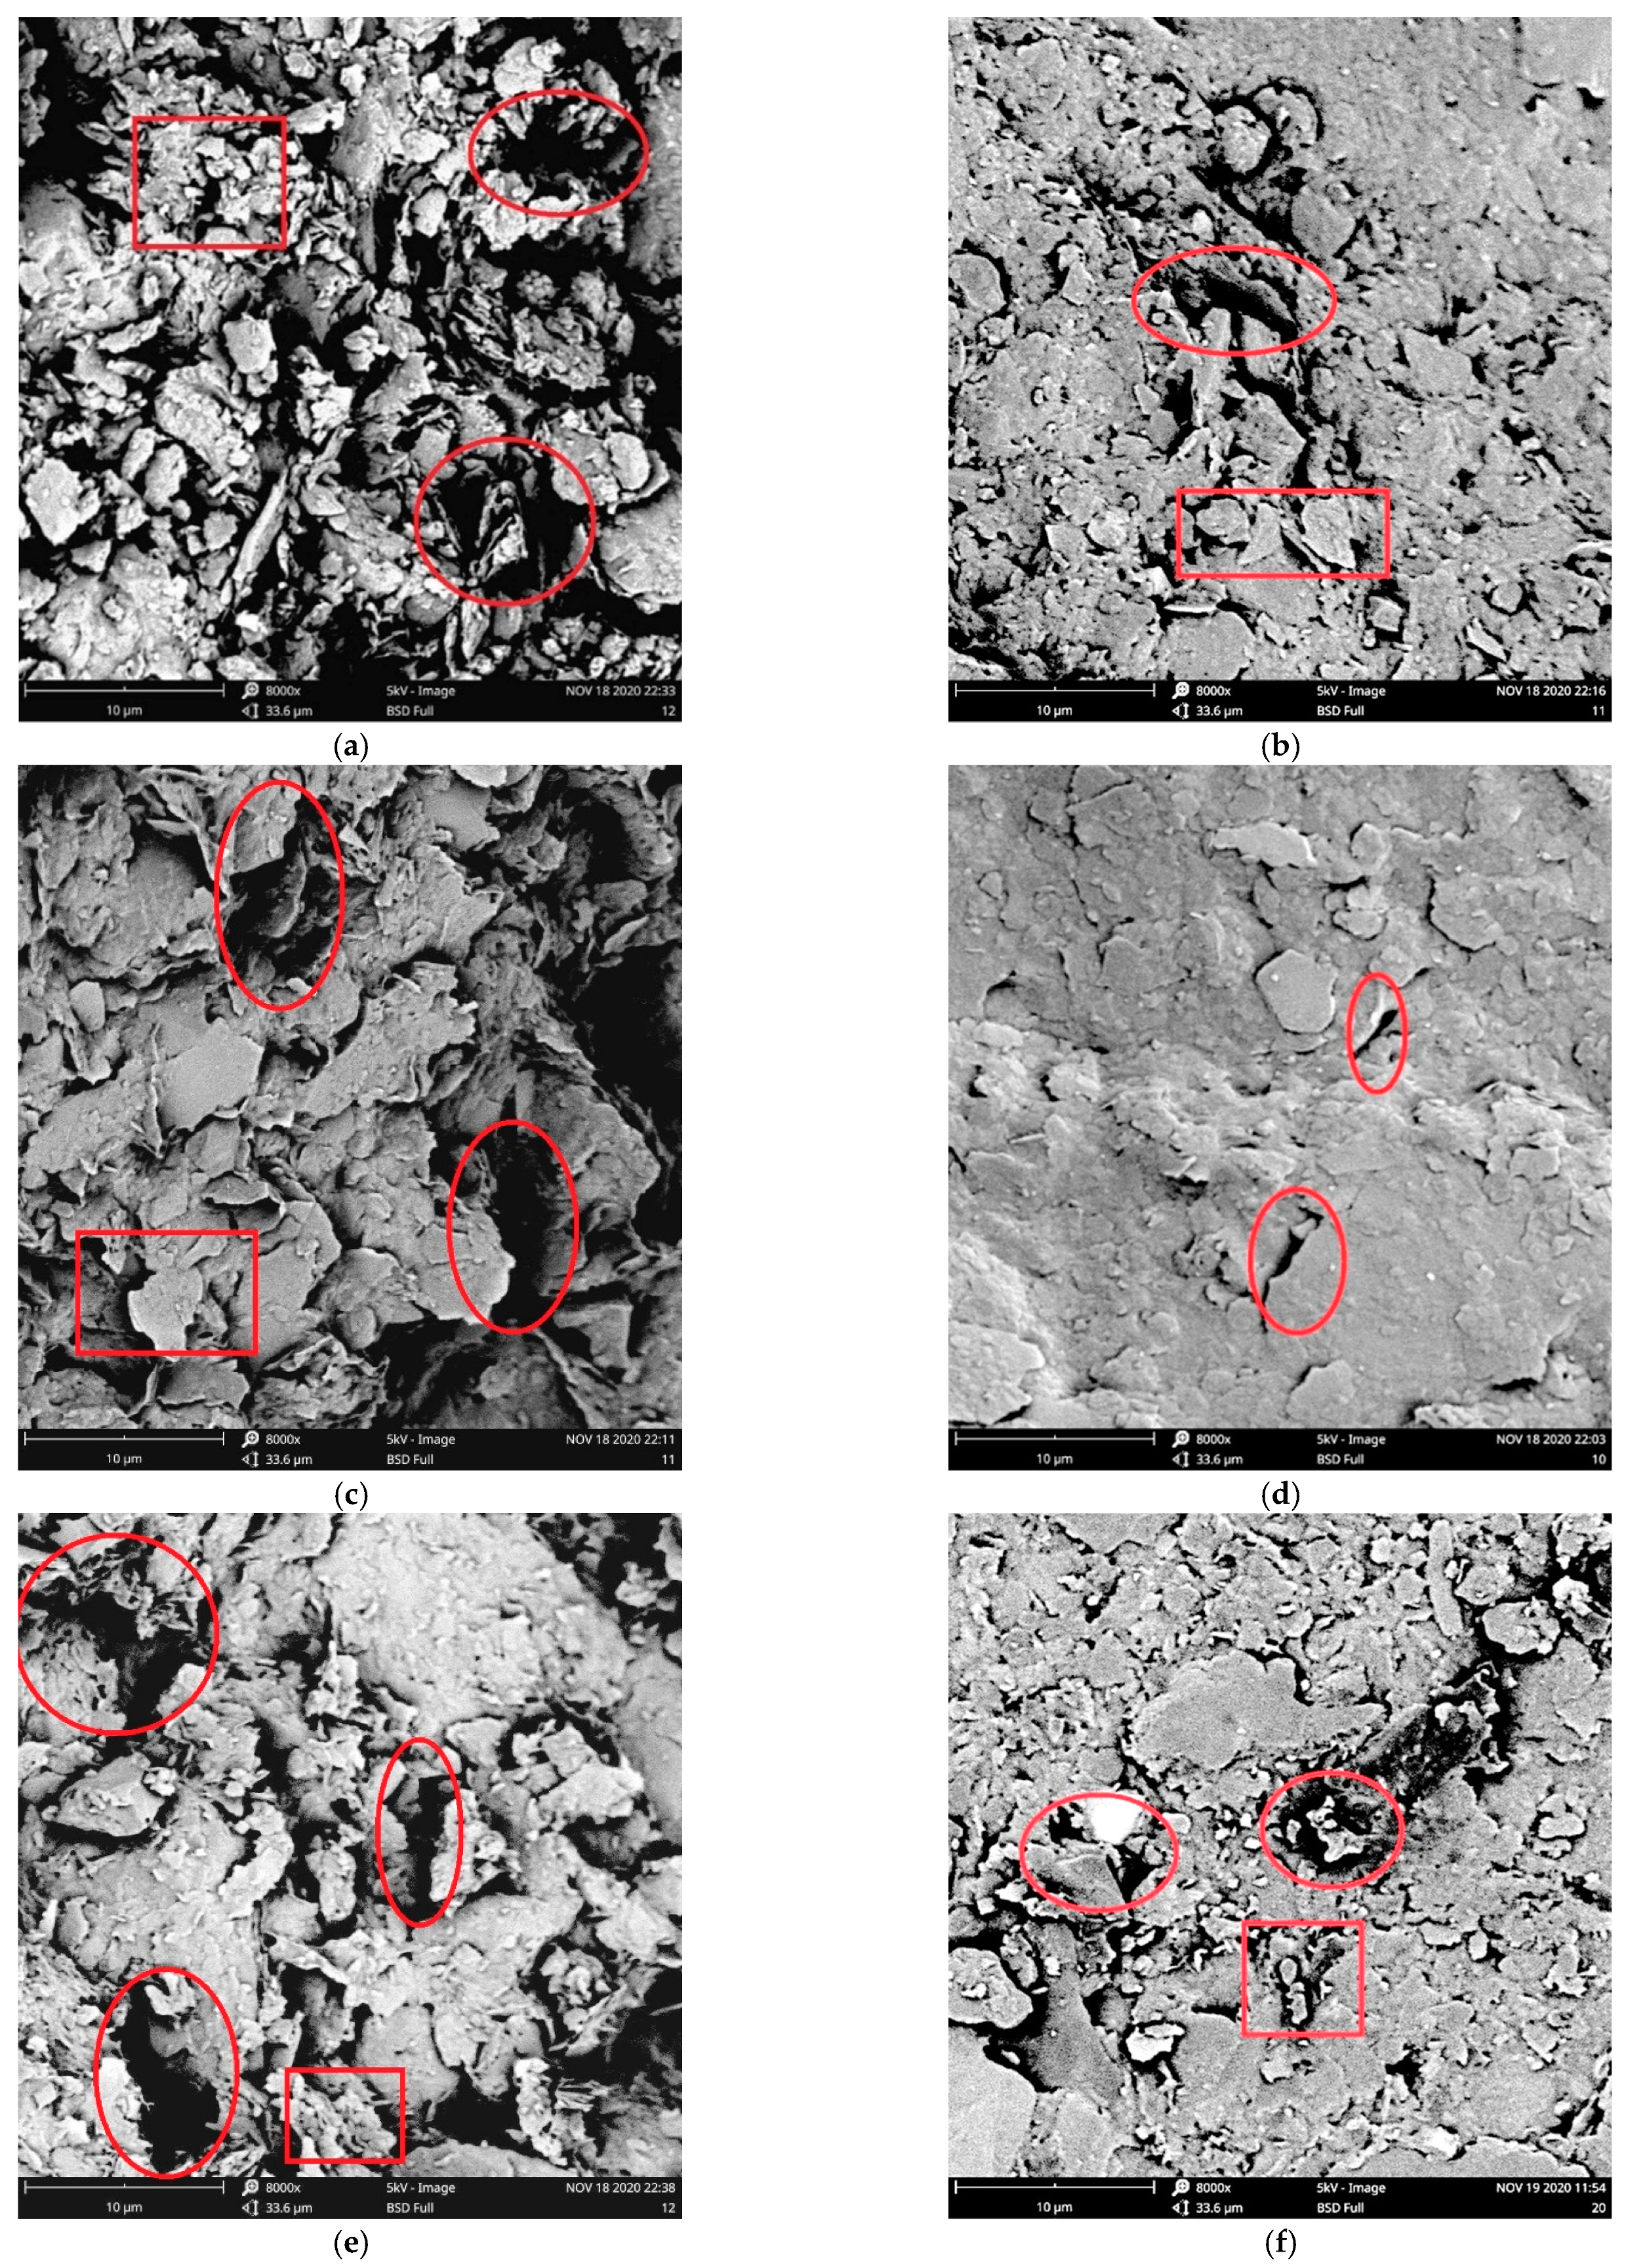
3. Qualitative Analysis of the Microstructure of Soft Marine Soil under Cyclic Loading

Figure 6 depicts a microscopic image of dynamic consolidation before and after compression loading. The particle shape before loading was rich, with a large-area continuous flocculent structure and a typical honeycomb structure. The particle size was random, and there were various forms of flake, granular, and block. Before loading, most of the irregular large-area pores formed a local weakening zone because dynamic loading destroys the connection between the soil particle aggregates, forms more overhead structures among the particles, and the micropores are penetrated, and large pores are formed.
After dynamic loading, the large pores significantly reduced due to squeezing, and the strip-shaped contact zone increased. Large particle fragmentation and small particle aggregation occurred simultaneously, and the structures of the soil particle aggregate were inlaid with each other in the sheet. Therefore, after cyclic loading, the macropores in the soft marine soil decrease obviously, and the small pores increase (indicated by the rectangle in Figure 6). The broken soil particles and the aggregate of soil particles existed at the same time (indicated by the ellipse in the figure). During the loading process, the adjacent soil particles approached, gathered, and compacted, and the soil skeleton structure changed gradually. With the increase in loadings, the compaction effect of soil particles became more obvious, the macropores decreased, and the skeleton structure tended to be stable.
Therefore, the compaction effect of the soil was significant on the micro-scale. This can better explain the micro-mechanism of plastic deformation.
Figure 7 depicts the microscopic images of before and after dynamic consolidation loading at p0 = 500 kPa, ζ = 15, and OCR = 9. After dynamic loading, the pore area reduced, the structure was more compact, the particle spacing reduced, the flake unit was finely broken, the floc unit reduced, the aggregate compressed, and the thin narrow contact zone increased. The above findings show the qualitative change of the soil after dynamic consolidation compression under different test conditions. The test results showed that the change in the microstructure can explain the macroscopic dynamic characteristics of the undisturbed soft marine soil to a certain extent.

4. Quantitative Analysis of the Microstructure of Soft Marine Soil under Cyclic Loading

4.1. Introduction of Microstructure Parameters

The existence of pores in soil structure is one of its important characteristics. The characteristics of pore structure directly affect the macro-engineering properties of soil. After dynamic loading, the change in pore characteristics is the main factor affecting the structural characteristics of undisturbed soft marine soil. In this study, we obtained a series of microstructure characteristic parameters using IPP.
The following characteristic parameters were selected to analyze the change in pore structure.
(1)
Diameter (D) is the most basic characteristic of pore size. The pore diameter is the average length of two points on the edge of the pore profile passing through the centroid, which can be directly measured using IPP.
(2)
Area (S) is also a basic characteristic of pore size. The pore area is the area surrounded by the edge of the pore profile, which can be directly measured using IPP.
(3)
Roundness (R0) is used to describe how close the target shape is to a circle. Roundness is calculated as:
R0 = L2/(4πS),
where S is the area of the pores, and L is the perimeter of the pores. The smaller the R0, the closer the pore to a circle.
(4)
Directional frequency (Pi(α)).
To represent the variation in the distribution intensity of the unit in a certain direction, we divided 0°~180° into N equal parts (locations). The angle range of each location representing the direction is α = 180°/N. Thus, the directional distribution frequency of the ith location unit in N locations within 0°~180° can be calculated:
P i ( α ) = m i M × 100 %
where mi is the number of the elliptic elements in the ith location in the long-axis direction, M is the total number of elements or pores, and α is the number of locations. By changing α, different frequency distributions can be obtained. In this study, we selected α = 10°.
(5)
Probability entropy (Hm).
Shi et al. [24] introduced the concept of probabilistic entropy in modern system theory to the study of microstructures and used Hm to represent the ordered arrangement of soil microstructure units, as defined in Formula (3):
H m = i = 1 n P i ( α ) ln P i ( α ) ln n
where Hm is an effective expression of the order of the unit body distribution. The smaller the Hm, the higher the ordering of the arrangement of unit bodies. First, IPP software required spatial calibration before using [25]. We adopted a magnification of 8000×, so that a uniform reference spatial calibration could be used. In addition, due to the difference in the uniformity of light and gold plating during the photographing process, there were inevitably some isolated spots and flaws in the image. To eliminate the influence of solitary points, flaw points, and micro-pores on the test data, the starting value of pore diameter counting was set to 0.03 μm.

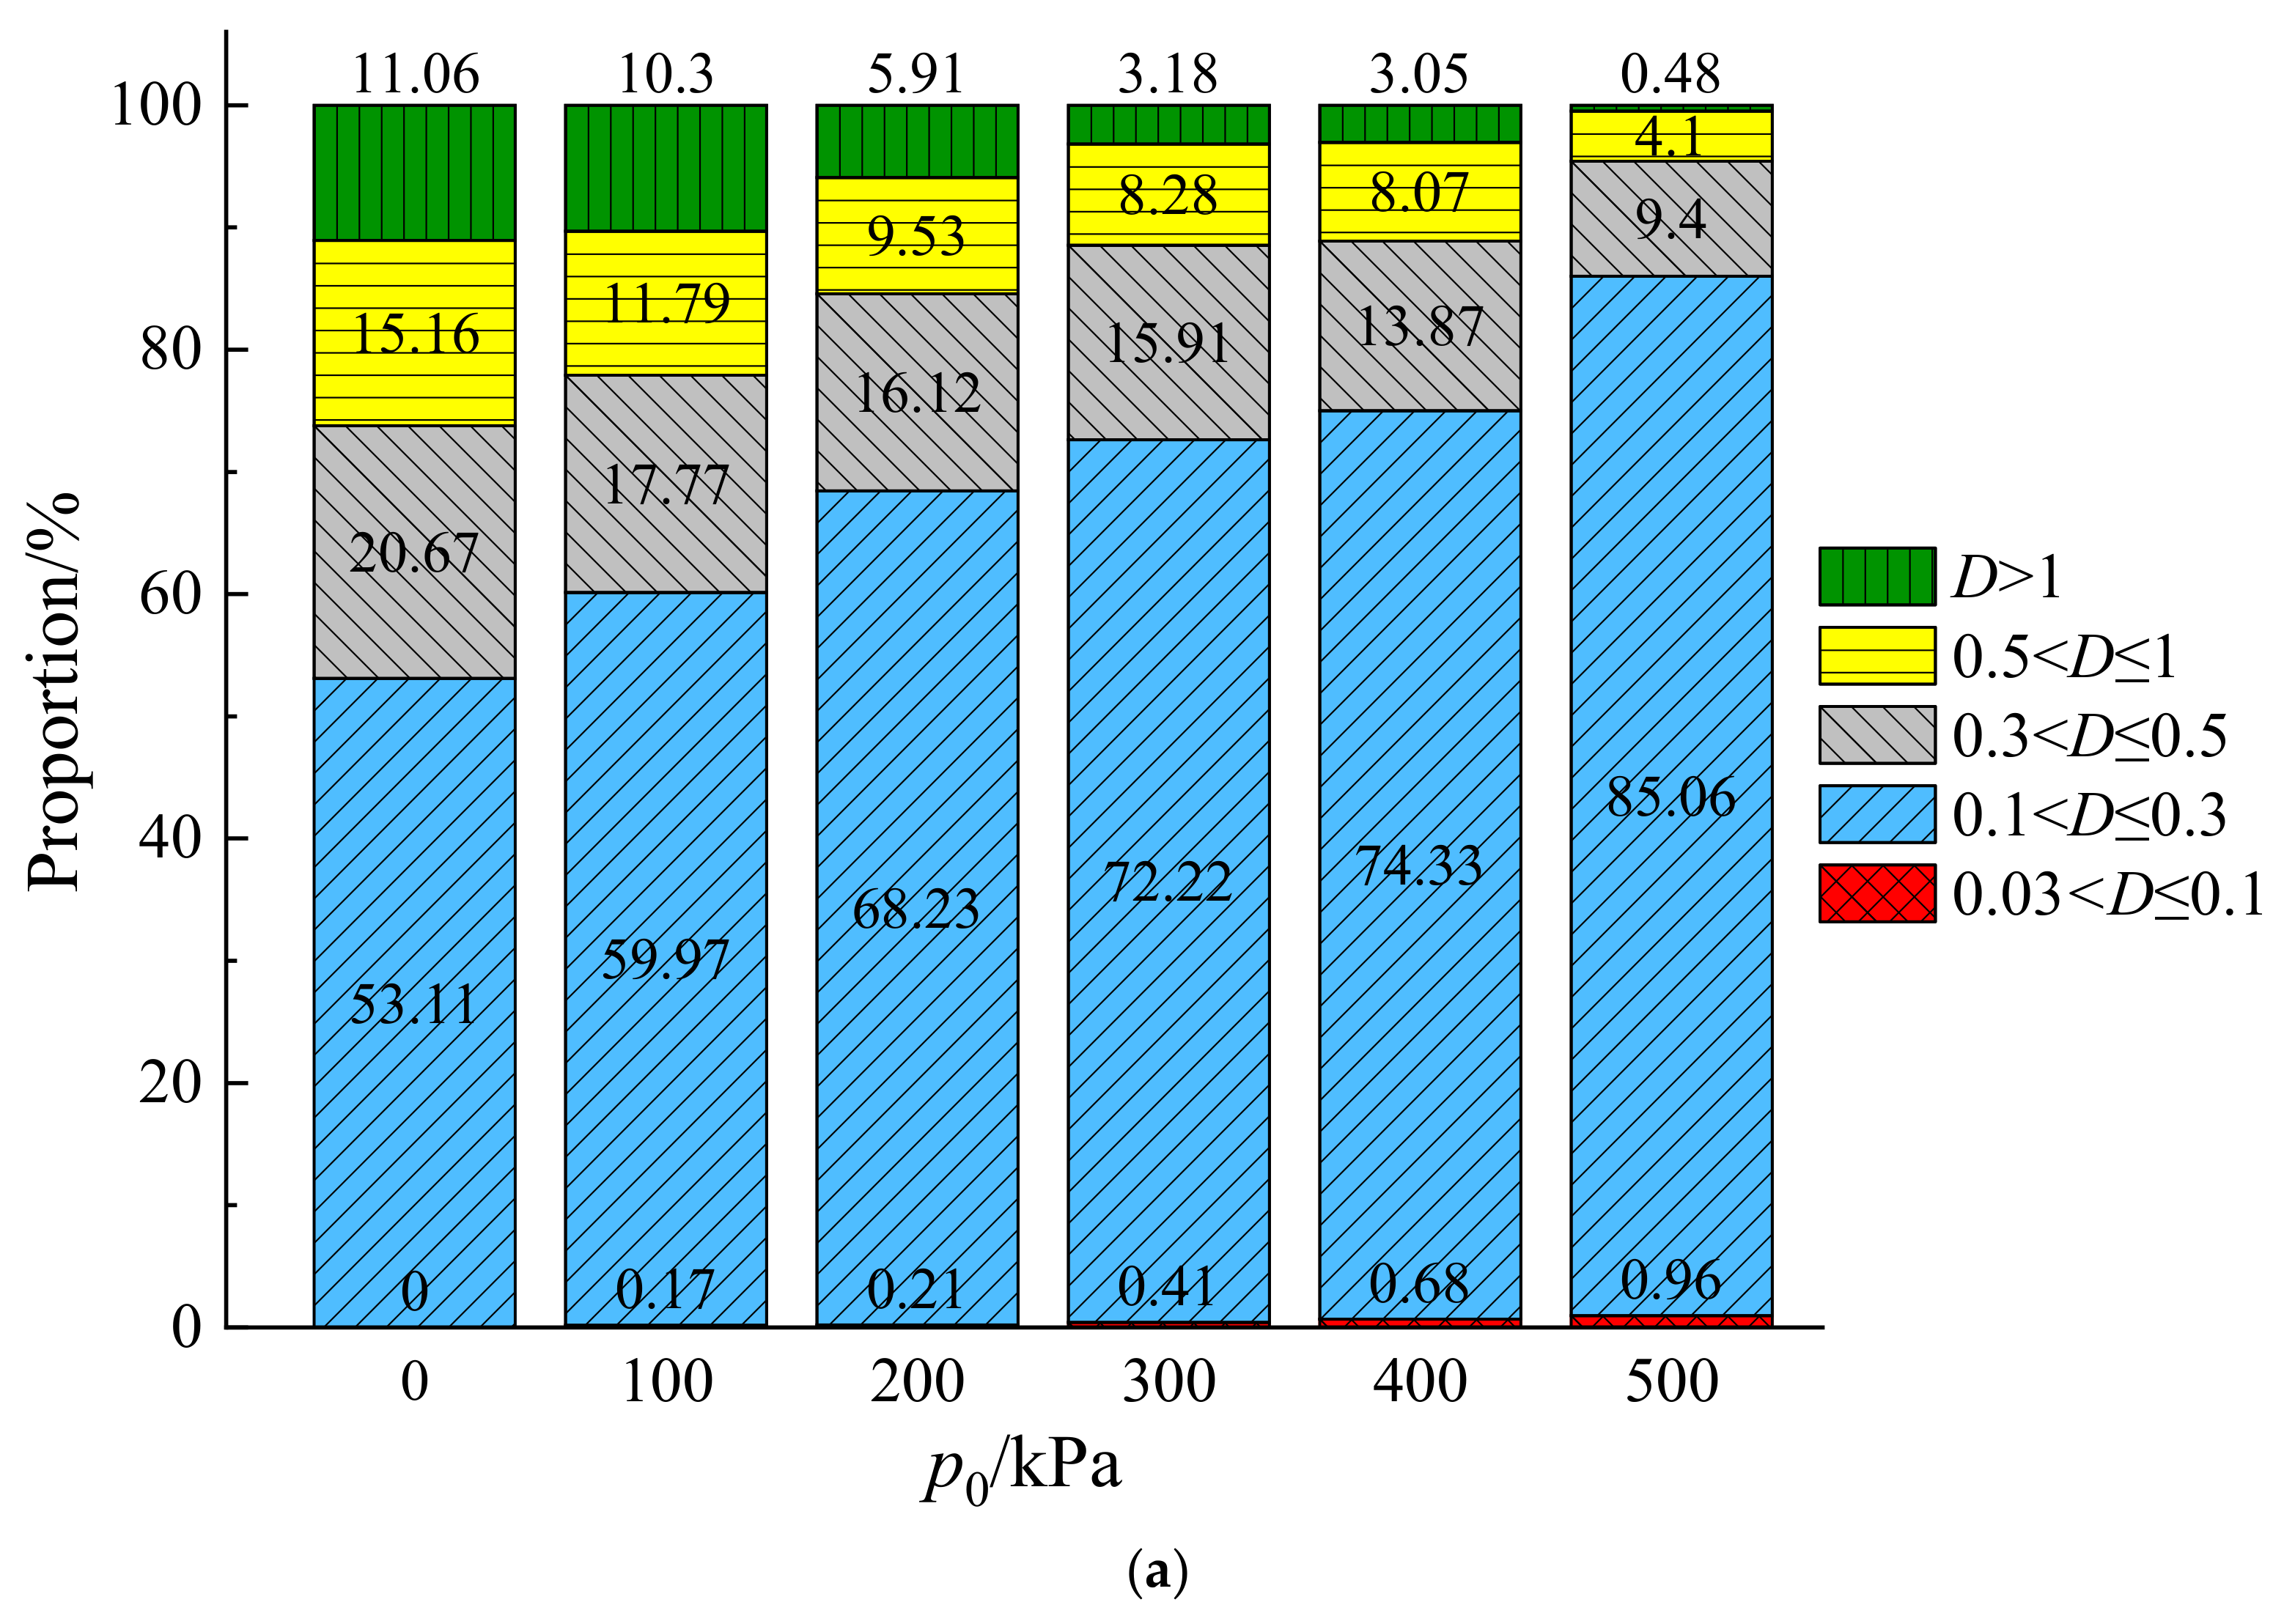
4.2. Pore Equivalent Diameter Distribution

Figure 8a–c shows the distribution of pore diameters under different consolidation confining pressures, different cyclic dynamic stress ratios, and different over-consolidation ratios. In the figure, the ordinate is the percentage of different pore size groups in the total amount of statistical pores. About 90% of the pore diameter of undisturbed soft marine soil before and after dynamic consolidation compression was concentrated in D ≤ 1. After loading, we observed that the proportion of medium and large pores reduced, while the proportion of micro and small pores increased.
The reason for the change in the ratio is that the soil generates additional stress under consolidation and vibration, the soil particles slip, and the connection between some soil particles is destroyed, resulting in the compression and densification of the soil skeleton.
Because the structural units of medium and large pores have a weaker resistance to deformation than those of micropores, the effect of compression and densification on them was more obvious. Therefore, medium and large pores were significantly reduced or dispersed into micropores, and the proportion of micropores increased. As shown in Figure 9, where ε is the axial strain, the accumulation of macro-residual deformation during loading was caused by the compaction of pores between soil particle aggregates, which further explains the principle of strain development in the macro dynamic test.
Figure 8 shows the that consolidation confining pressure, cyclic dynamic stress ratio, and over-consolidation ratio had a certain influence on the change in pore distribution. With increases in p0, ζ, and OCR, the proportion of medium and large pores decreased, and the proportion of micropores increased. This trend indicates that increases in p0, ζ, and OCR promote a changing trend of equivalent pore diameter caused by cyclic loading. With increases in p0, ζ, and OCR, the ability of the soil skeleton to bear a dynamic load is weakened, thus reducing the compaction and dispersion of medium and large pores, producing a trend of pore diameter gradually increasing.
As shown in Figure 8 and Figure 9, the development of a macroscopic strain of undisturbed soft marine soil under cyclic loading is essentially related to the change in pore structure. In the initial stage of cyclic loading, the pore is squeezed by an external load, and strain accumulation occurs. The macroscopic expression is the increasing rate of axial accumulated strain. With the increase in cyclic loading times, the aggregate of soil particles gradually approach each other, and the compaction effect of pore structure decreases. At this time, the soil structure is denser, reaching a more stable state, and the macroscopic manifestation is the decrease in the cumulative strain rate of axial strain.

4.3. Pore Area Distribution
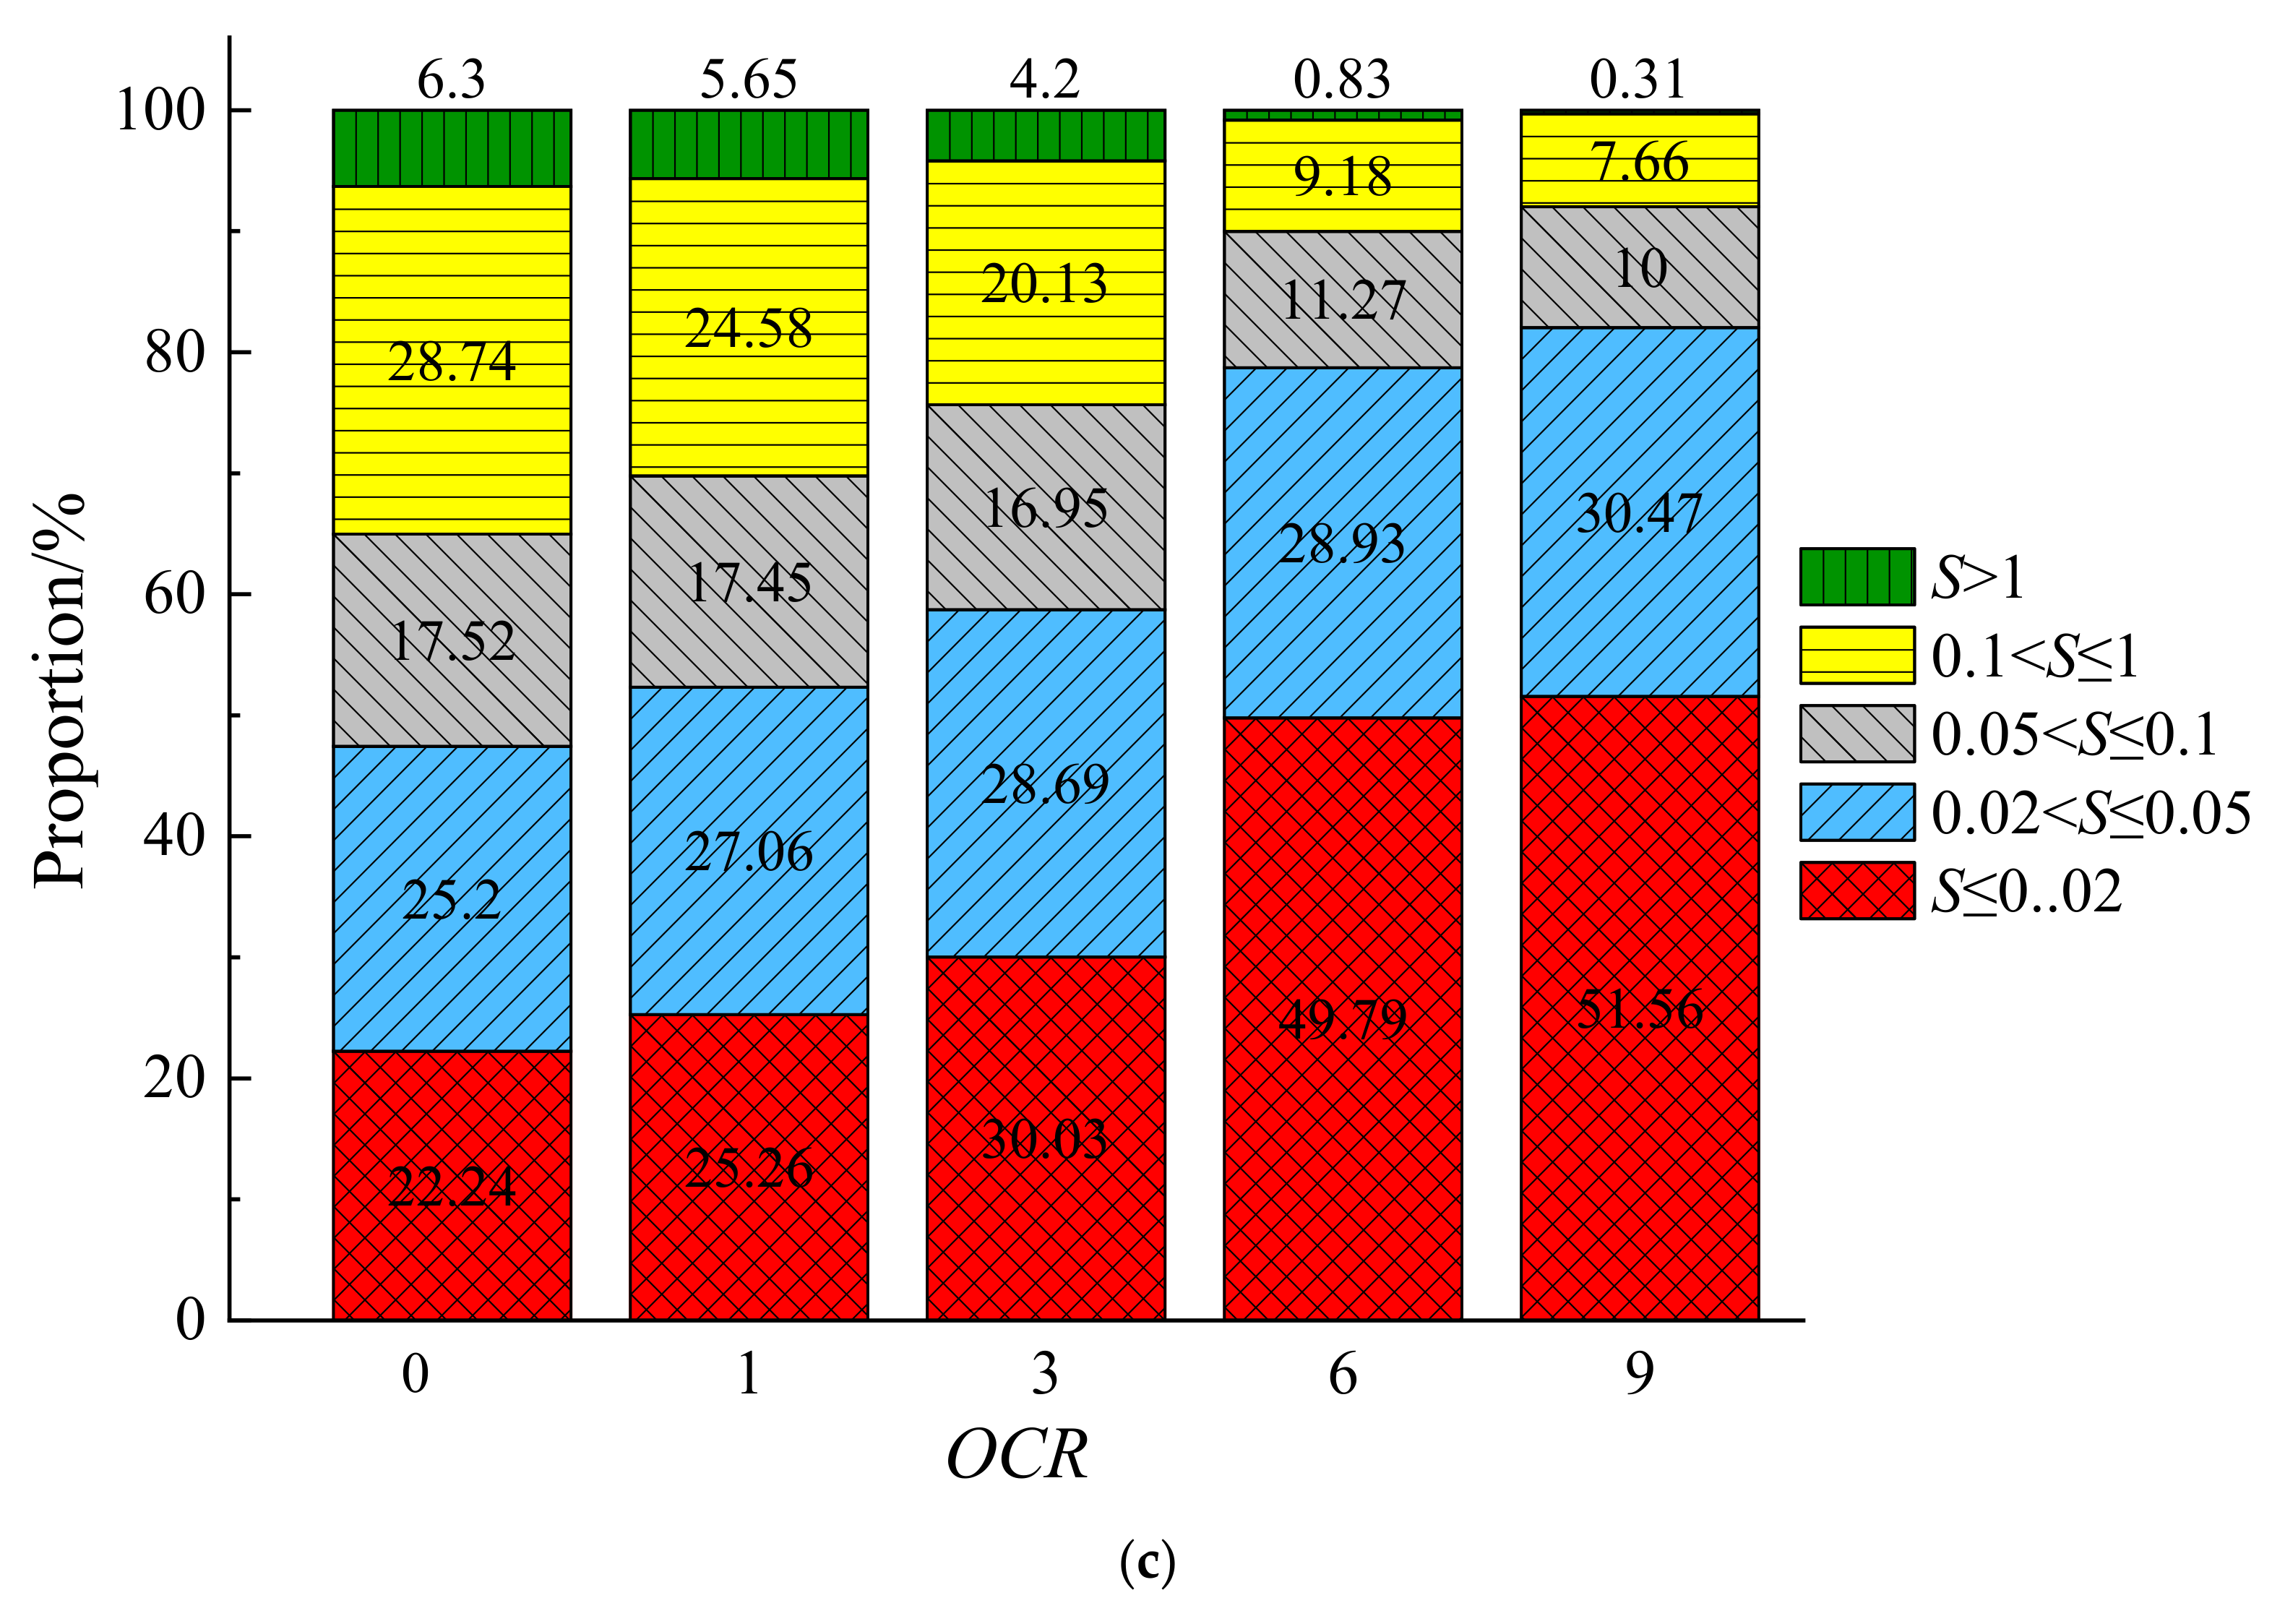
Figure 10 shows the pore area distribution before and after dynamic consolidation compression under different test conditions. We observed that the proportion of micropores (S ≤ 0.05 μm2) increased after consolidation compression, while the proportion of larger pores (S > 0.05 μm2) decreased. With increases in p0, ζ, and OCR, the proportion of medium and large pores decreased, and the proportion of micropores increased. This trend indicated that increases in p0, ζ, and OCR promote the area change trend caused by cyclic loading, which is consistent with the trend of pore diameter distribution and with the macroscopic deformation characteristics.

4.4. Pore Roundness

Figure 11 shows the changes in pore roundness before and after dynamic consolidation compression under different test conditions. After dynamic consolidation compression, pore roundness decreased to varying degrees. With increases in p0, ζ, and OCR, pore roundness decreased more obviously. This indicated that, after cyclic loading, the pores of undisturbed soft marine soil become more regular and more circular. It can be inferred that, under cyclic loading, the soil skeleton is squeezed, with a dynamic adjustment in the particle arrangement and the gradual collapse and reorganization of large and irregular pores; the original large pores are filled with fine soil, and the soil particle aggregate redistributes, reaching a more stable equilibrium state again. At the same time, due to the compression of the surrounding structural units, the soil particle aggregates are arranged more closely, forming stable-state micropores with a regular shape, increasing the degree of pore homogenization and decreasing the roundness. After loading, the variation in roundness obviously decreased, but it had a certain regularity, which indicates that the degree of pore homogenization tended to be consistent with the increase in the number of cyclic loading vibration times. This reflects that the law governing strain development in undisturbed soft marine soil under different consolidation confining pressures, different cyclic dynamic stress ratios, and different over-consolidation ratios is maintained. The macroscopic dynamic test strain results shown in Figure 9 support the above conclusion.

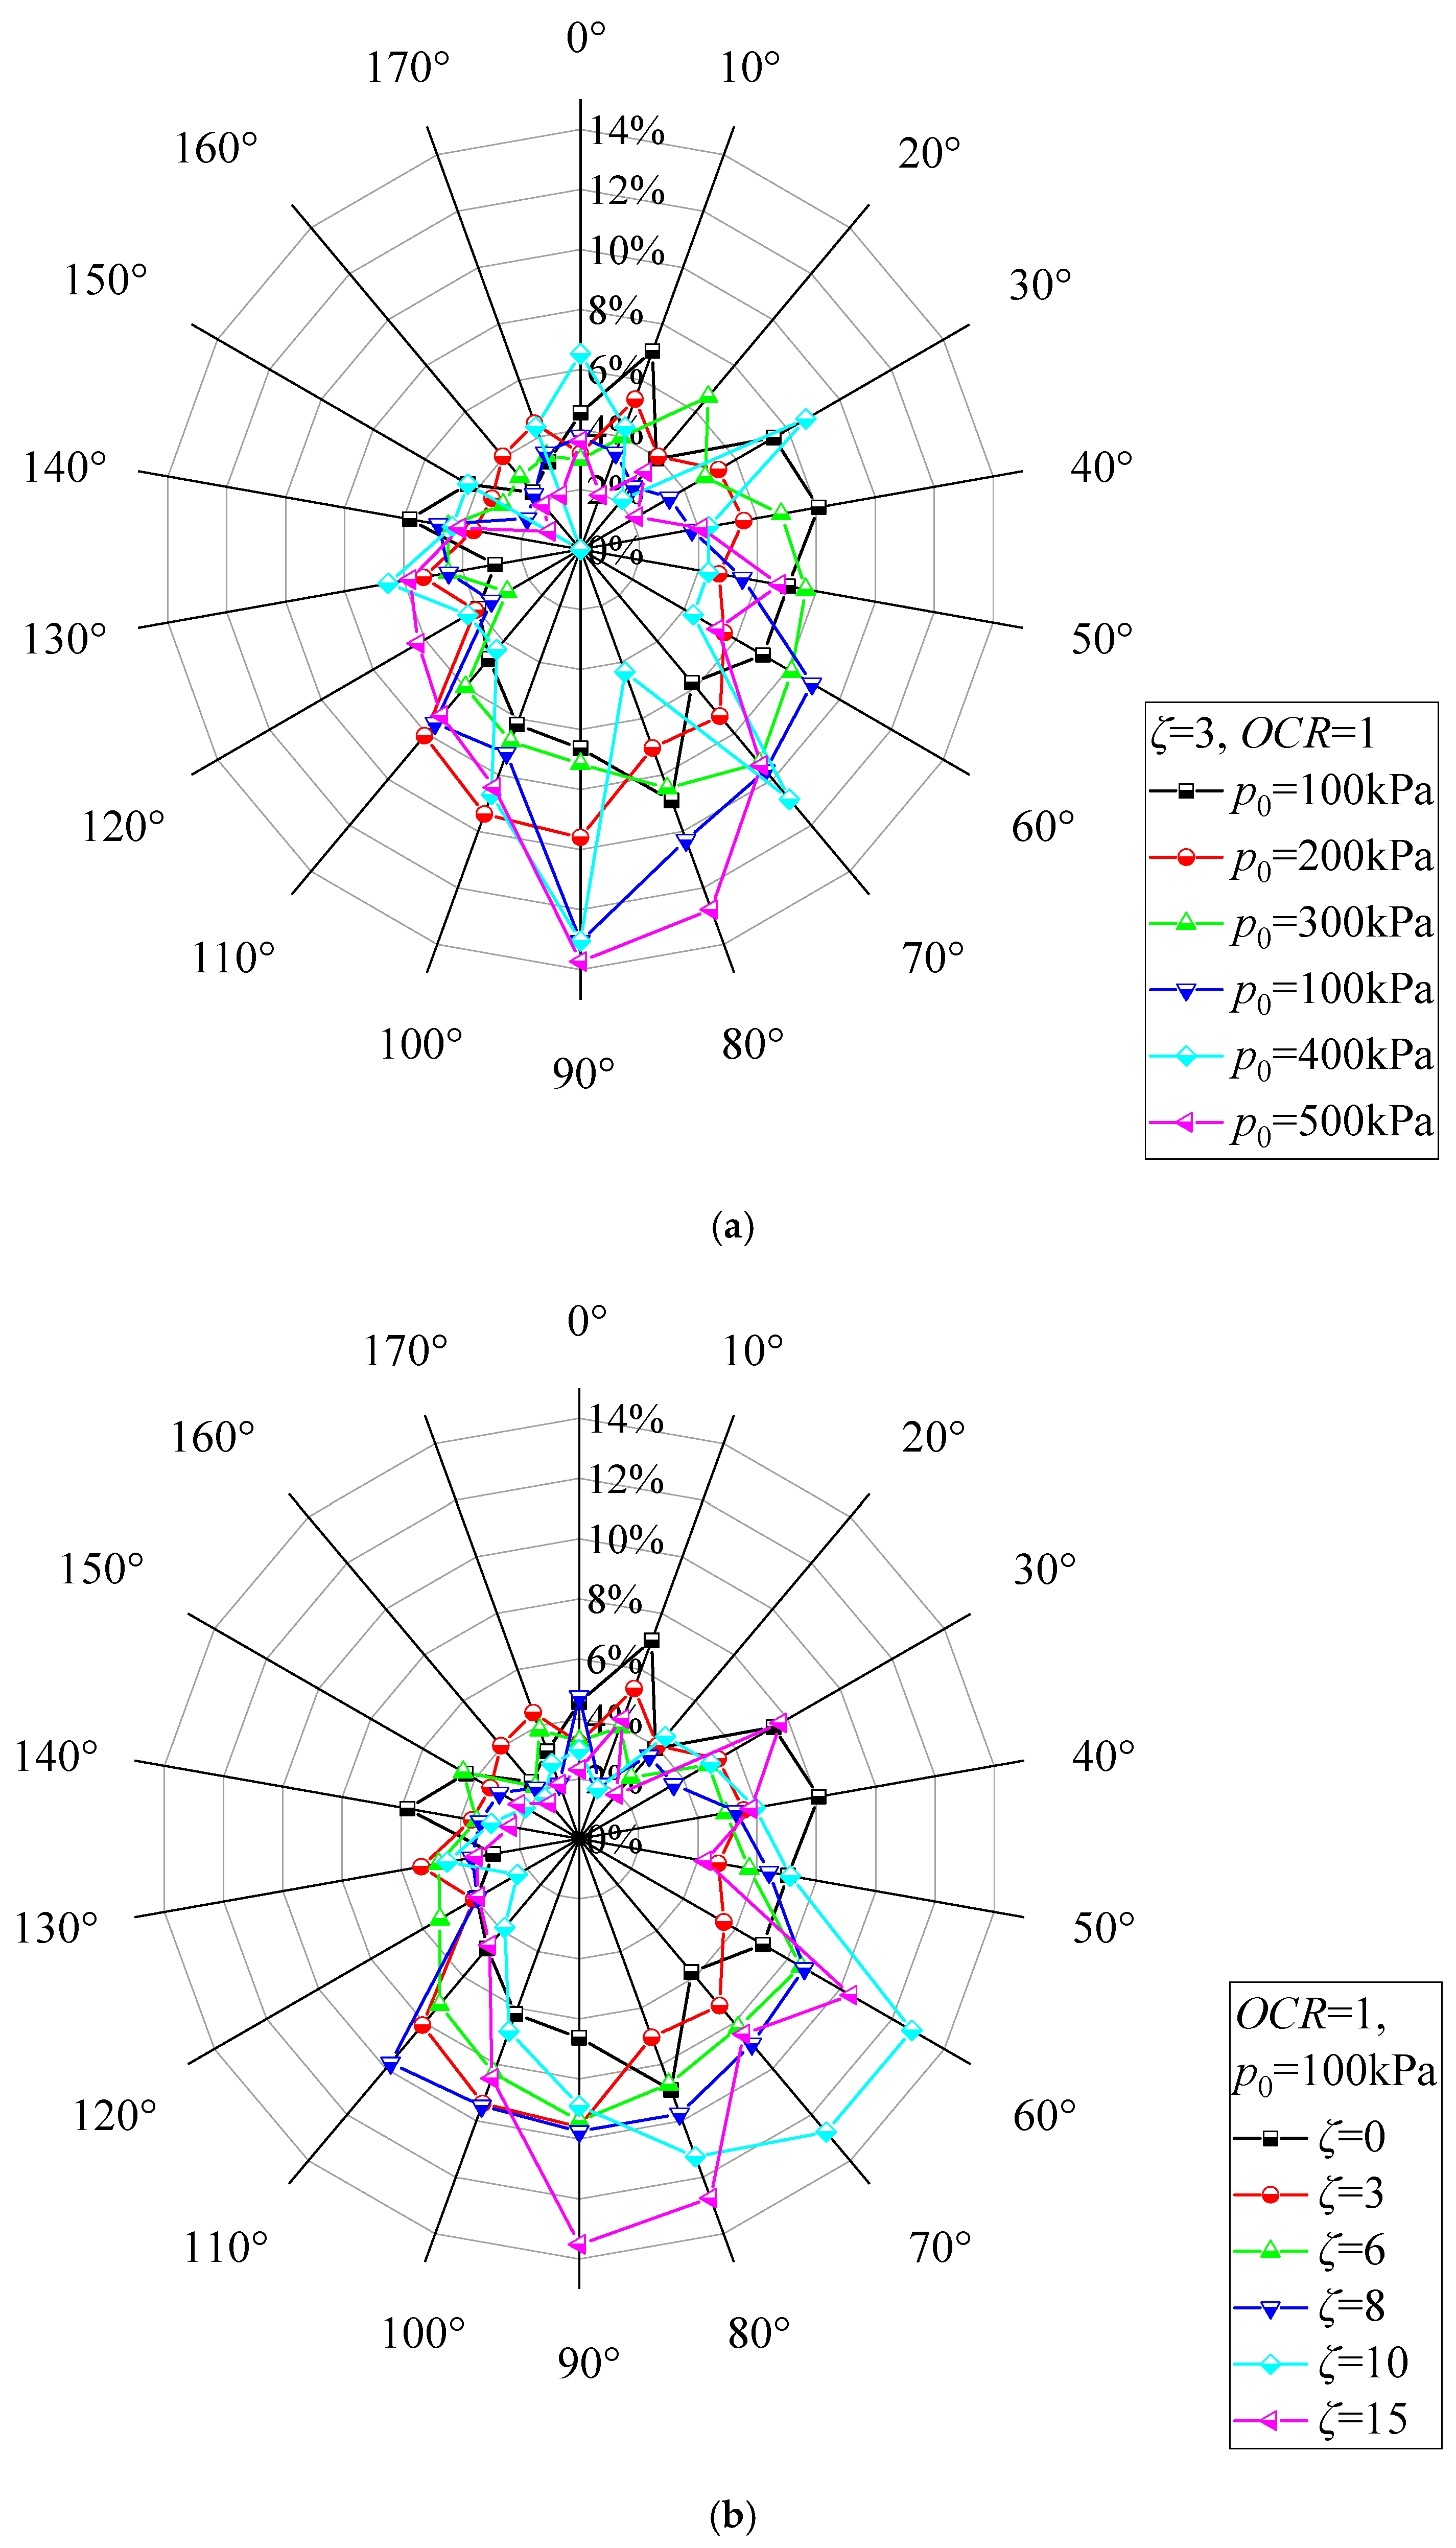
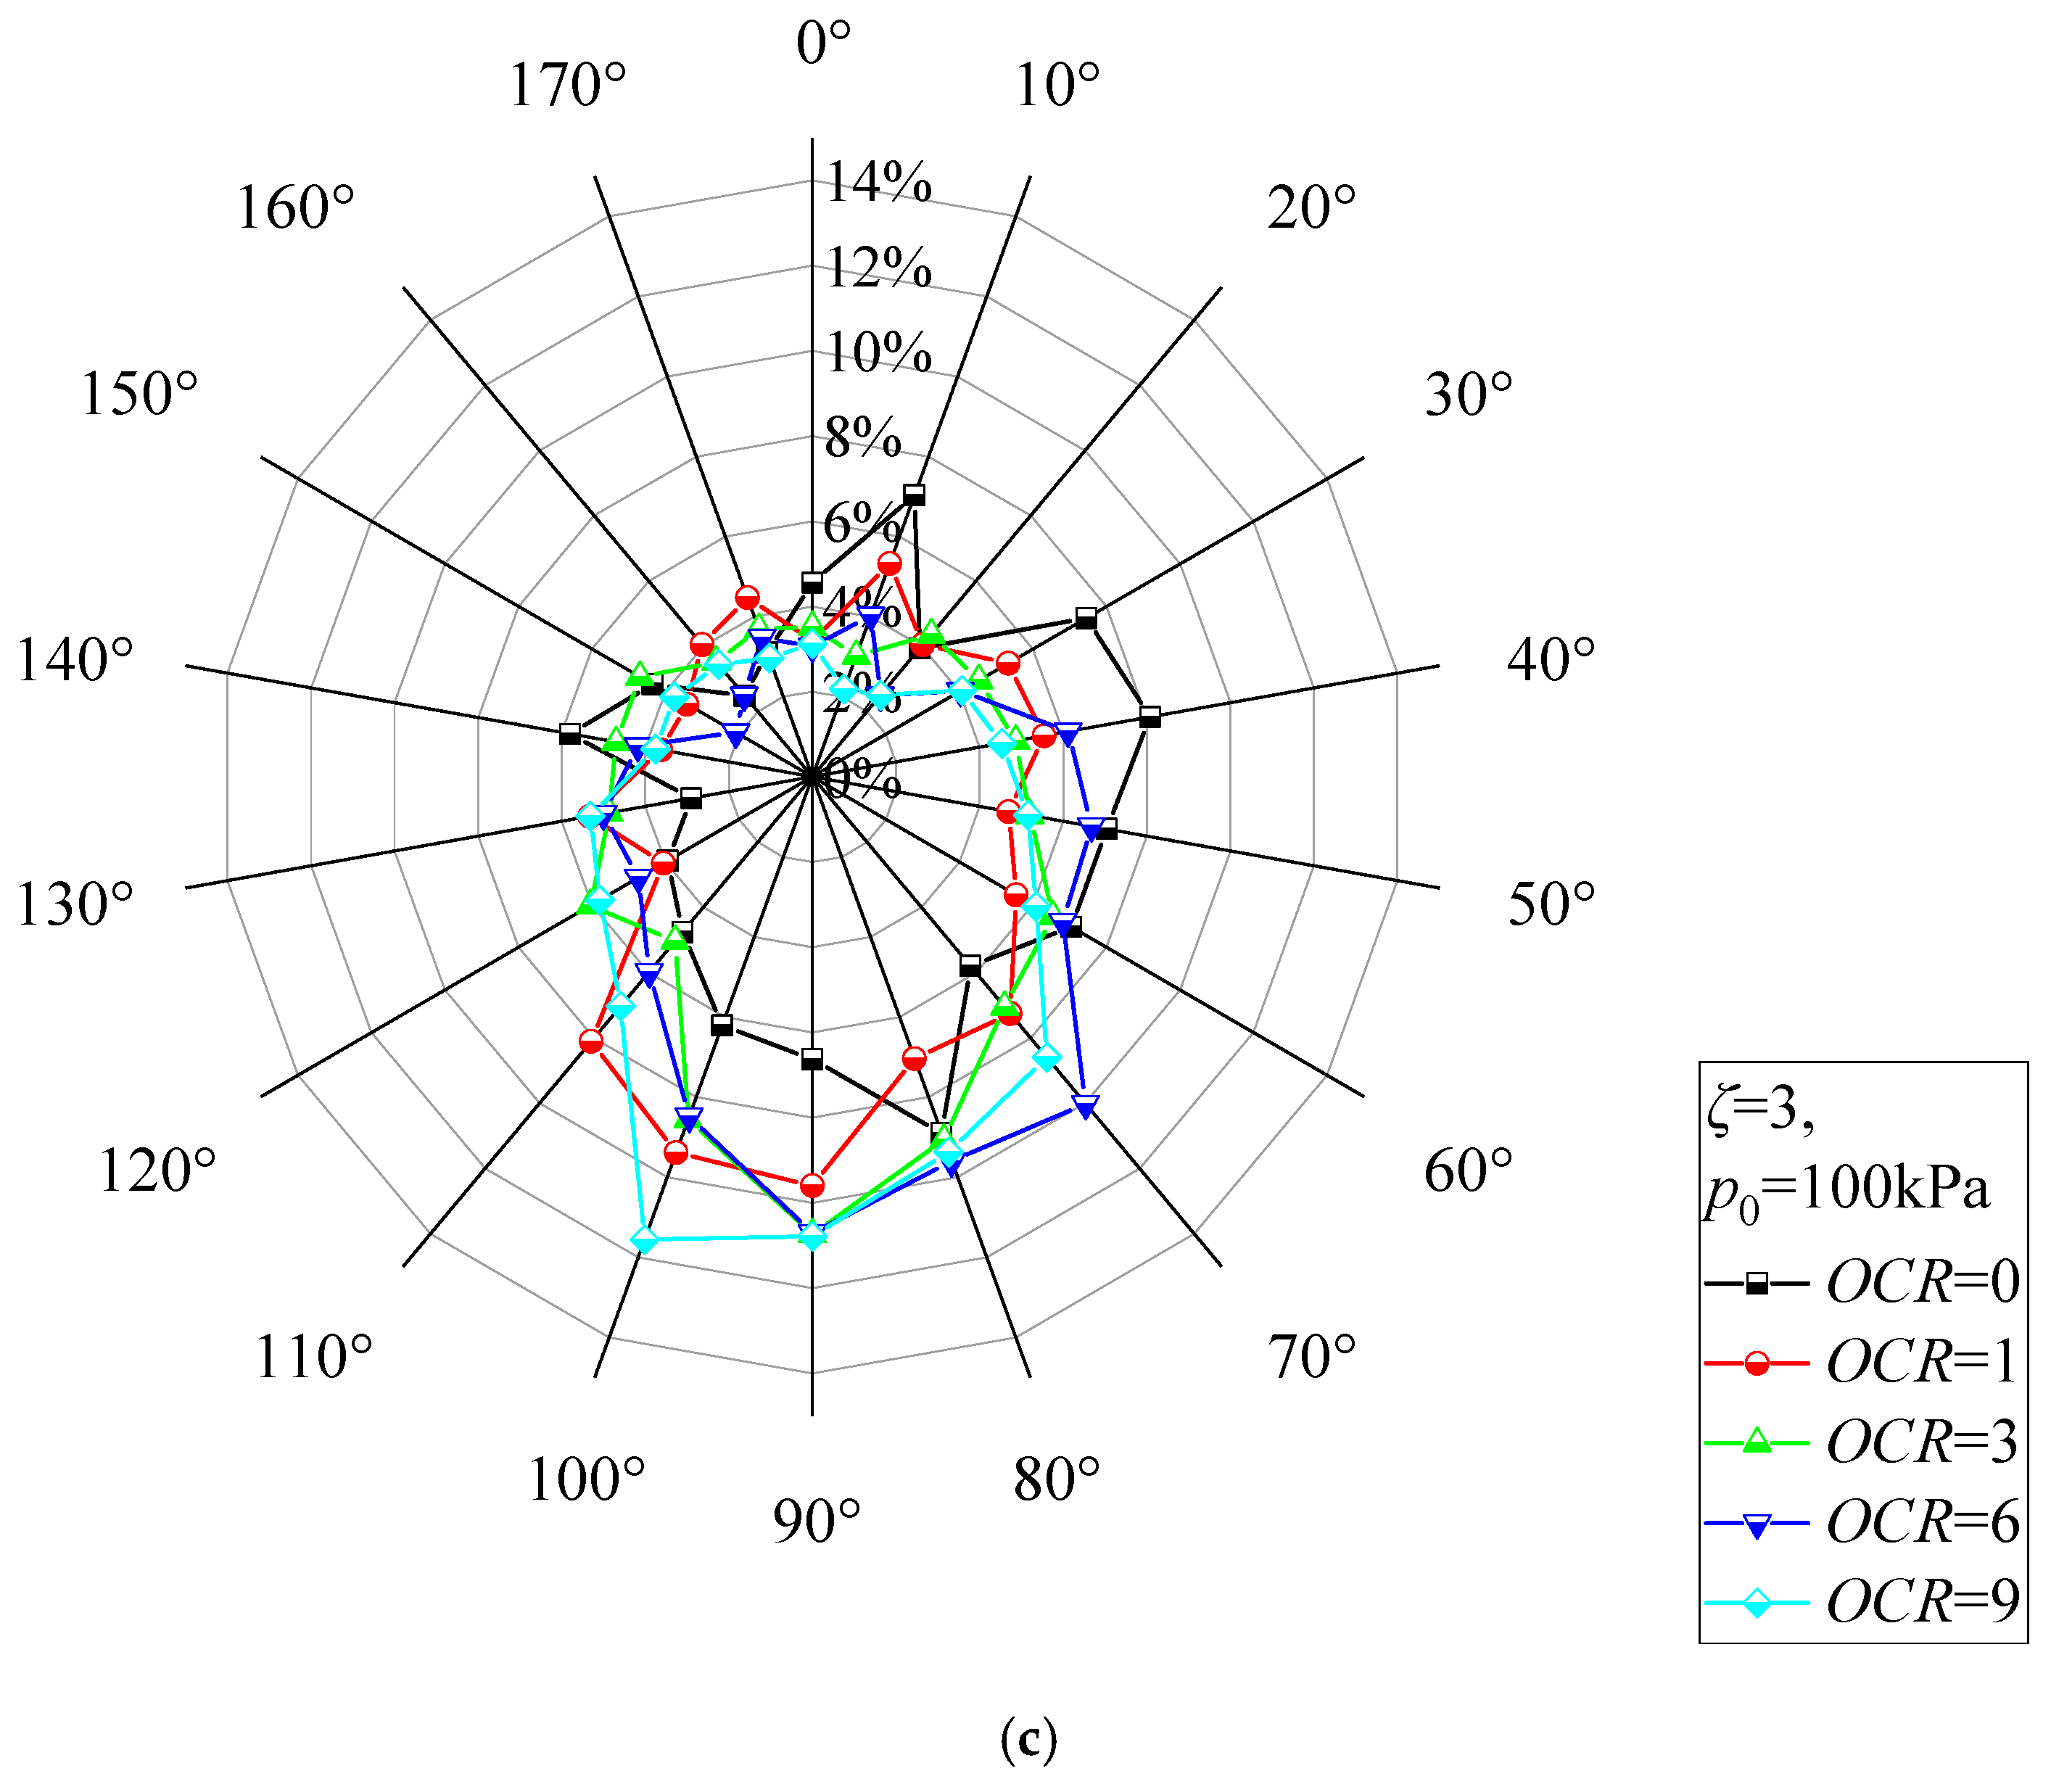
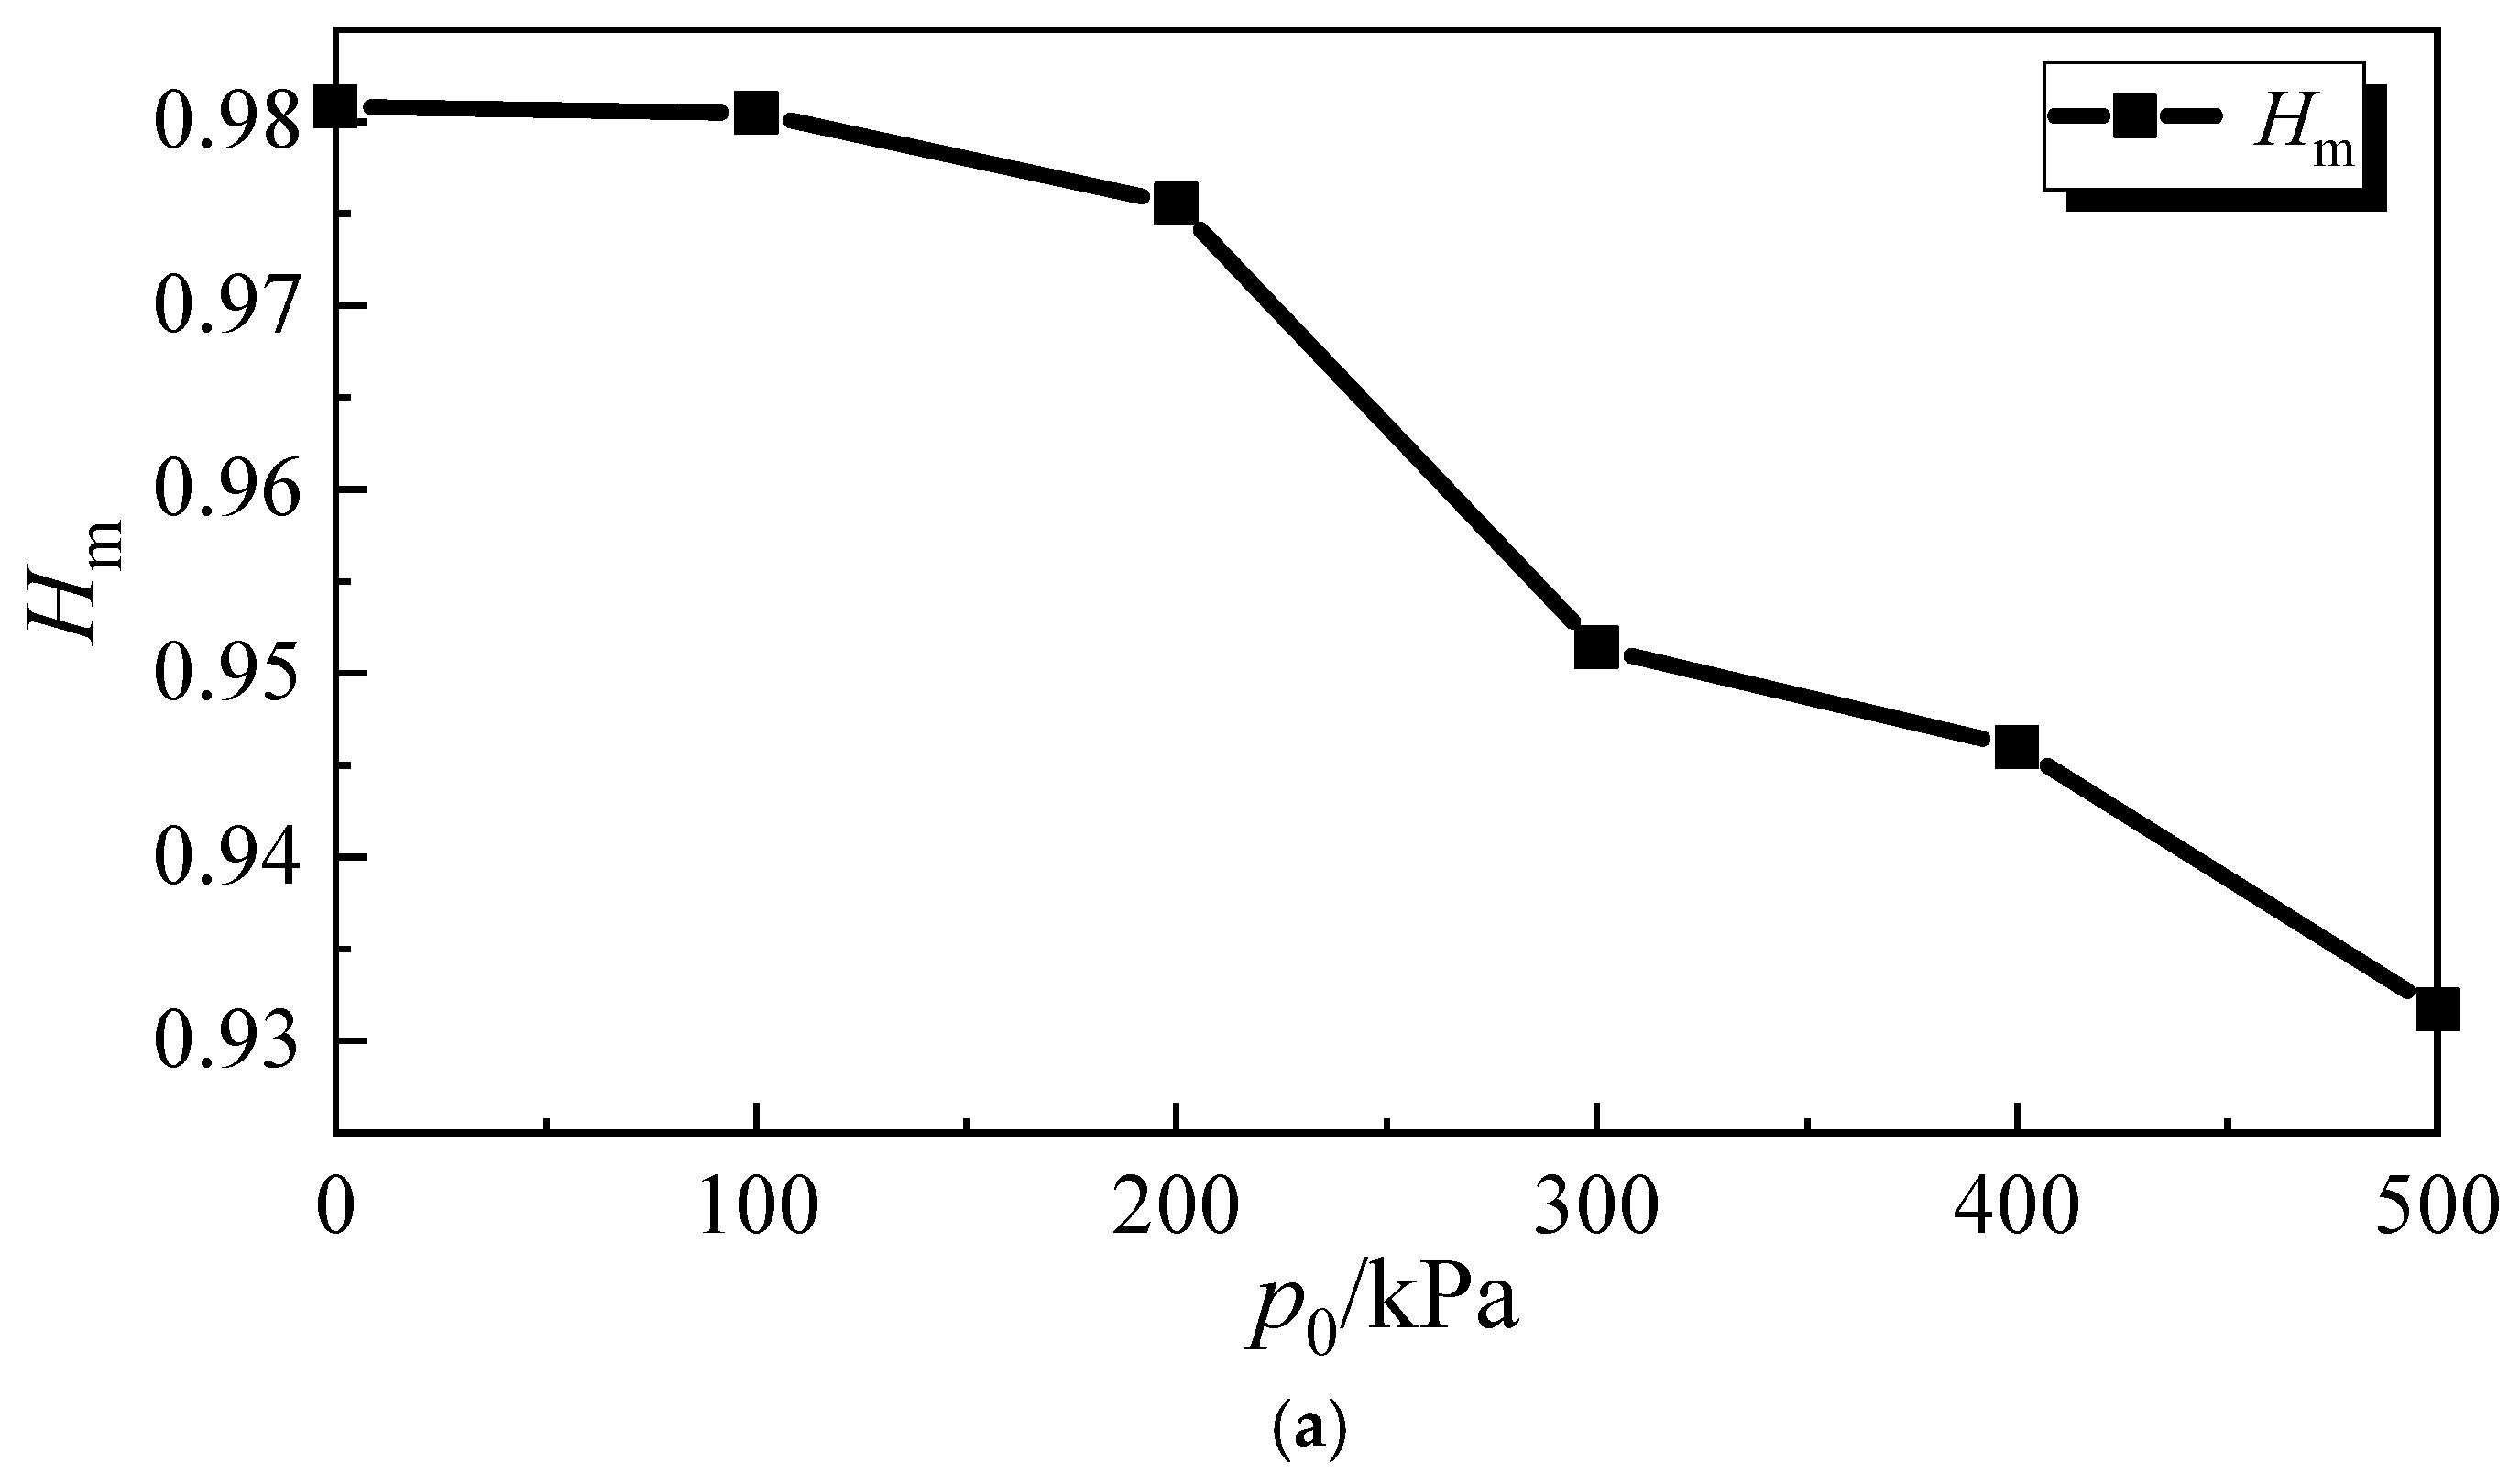
4.5. Directional Frequency

Figure 12 provides a comparison of the directional frequency radar images of pores before and after dynamic consolidation compression under different test conditions. We observed that, before loading, the directional frequency distribution of the sample in each location was relatively uniform. After loading, the degree of non-uniformity of the directional frequency distribution increased. Taking p0 = 500 kPa as an example, the directional frequency angle of the pores was concentrated in 70° to 90° after dynamic consolidation compression, which indicated that the dynamic consolidation compression developed the pores in the undisturbed soft marine soil in a certain direction, and the pore distribution had better directionality. We inferred that the vibration destroys the cementation between soil particle aggregates, which weakens the cementation in one direction than in other directions. Thus, the weak-direction structure is destroyed first. With constant loading, the soil structure is destroyed in this direction until the failure line extends to the whole section.
Figure 12 shows that the direction of the arrangement of soil particles under different consolidation confining pressures, different cyclic dynamic stress ratios, and different over-consolidation ratios was not consistent, which indicated that although soil particles were arranged along a certain direction under different working conditions, the orientation angle of the final stable state was not completely concentrated in the area nearby. This indicated that the arrangement direction of undisturbed soft marine soil particle aggregates in the loading process has a certain randomness, and that the ultimate angle of pore directional development is not fixed. The deformation of undisturbed soft marine soil is uneven and random, and that the deformation is concentrated in some parts, while some other parts show almost no change. Thus, to further understand the particle arrangement of undisturbed soft marine soil after loading, a follow-up study is required, which would be helpful for grasping the inherent principle governing the deformation of undisturbed soft marine soil and would have practical engineering significance.

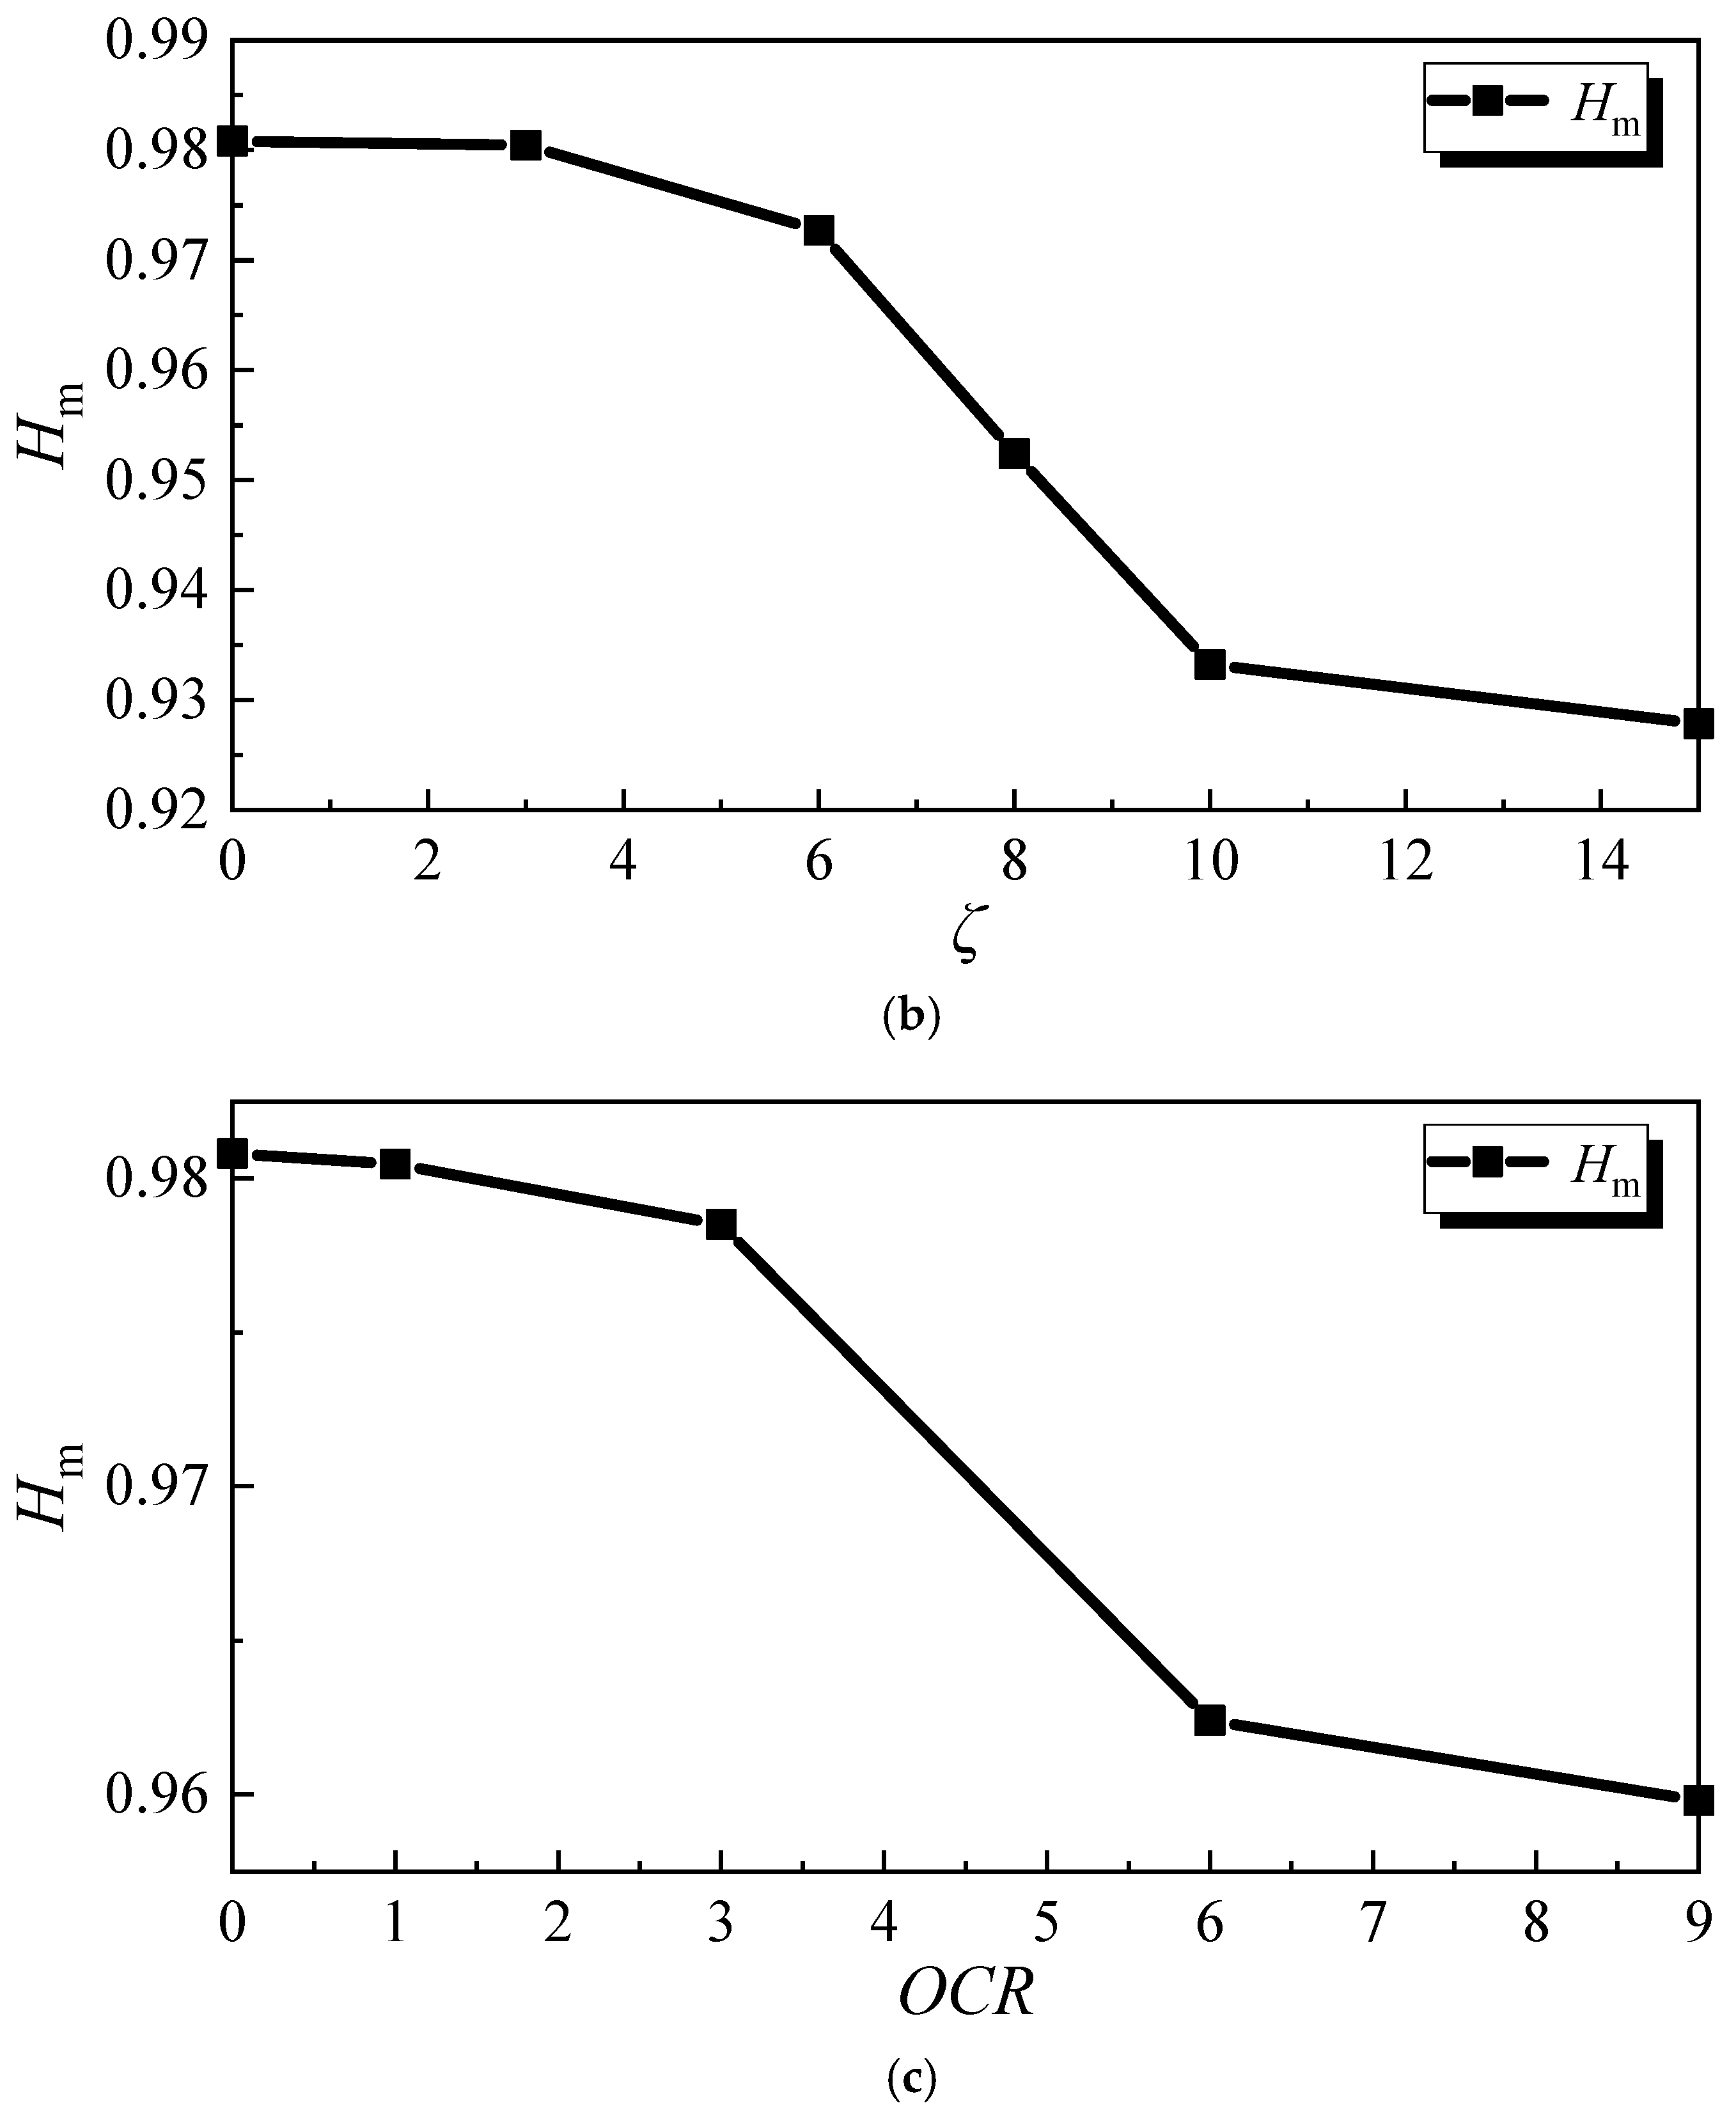
4.6. Probability Entropy

Figure 13 shows the change in pore probability entropy before and after dynamic consolidation compression loading. We observed that the probability entropy before loading was always greater than the probability entropy after loading; the greater the consolidation confining pressure, the greater the cyclic dynamic stress ratio; and the greater the over-consolidation ratio, the smaller the porosity probability entropy. This showed that the pores became more orderly after loading soft soil. This is consistent with the conclusion that the pore orientation frequency Pi (10) increases significantly in a certain location. We conclude that the loading process of soft marine soil develops the pores along a certain direction, and that the pore distribution becomes more orderly. At the same time, the strain growth also increases, and the microscopic test results further verified the macroscopic strain law.

5. Conclusions

In this study, a series of dynamic consolidation compression and SEM tests was conducted on soft marine soil. The cumulative strain and microstructure characteristics of soft marine soil under cyclic loading were qualitatively and quantitatively analyzed. Three conclusions were obtained from this study:
(1)
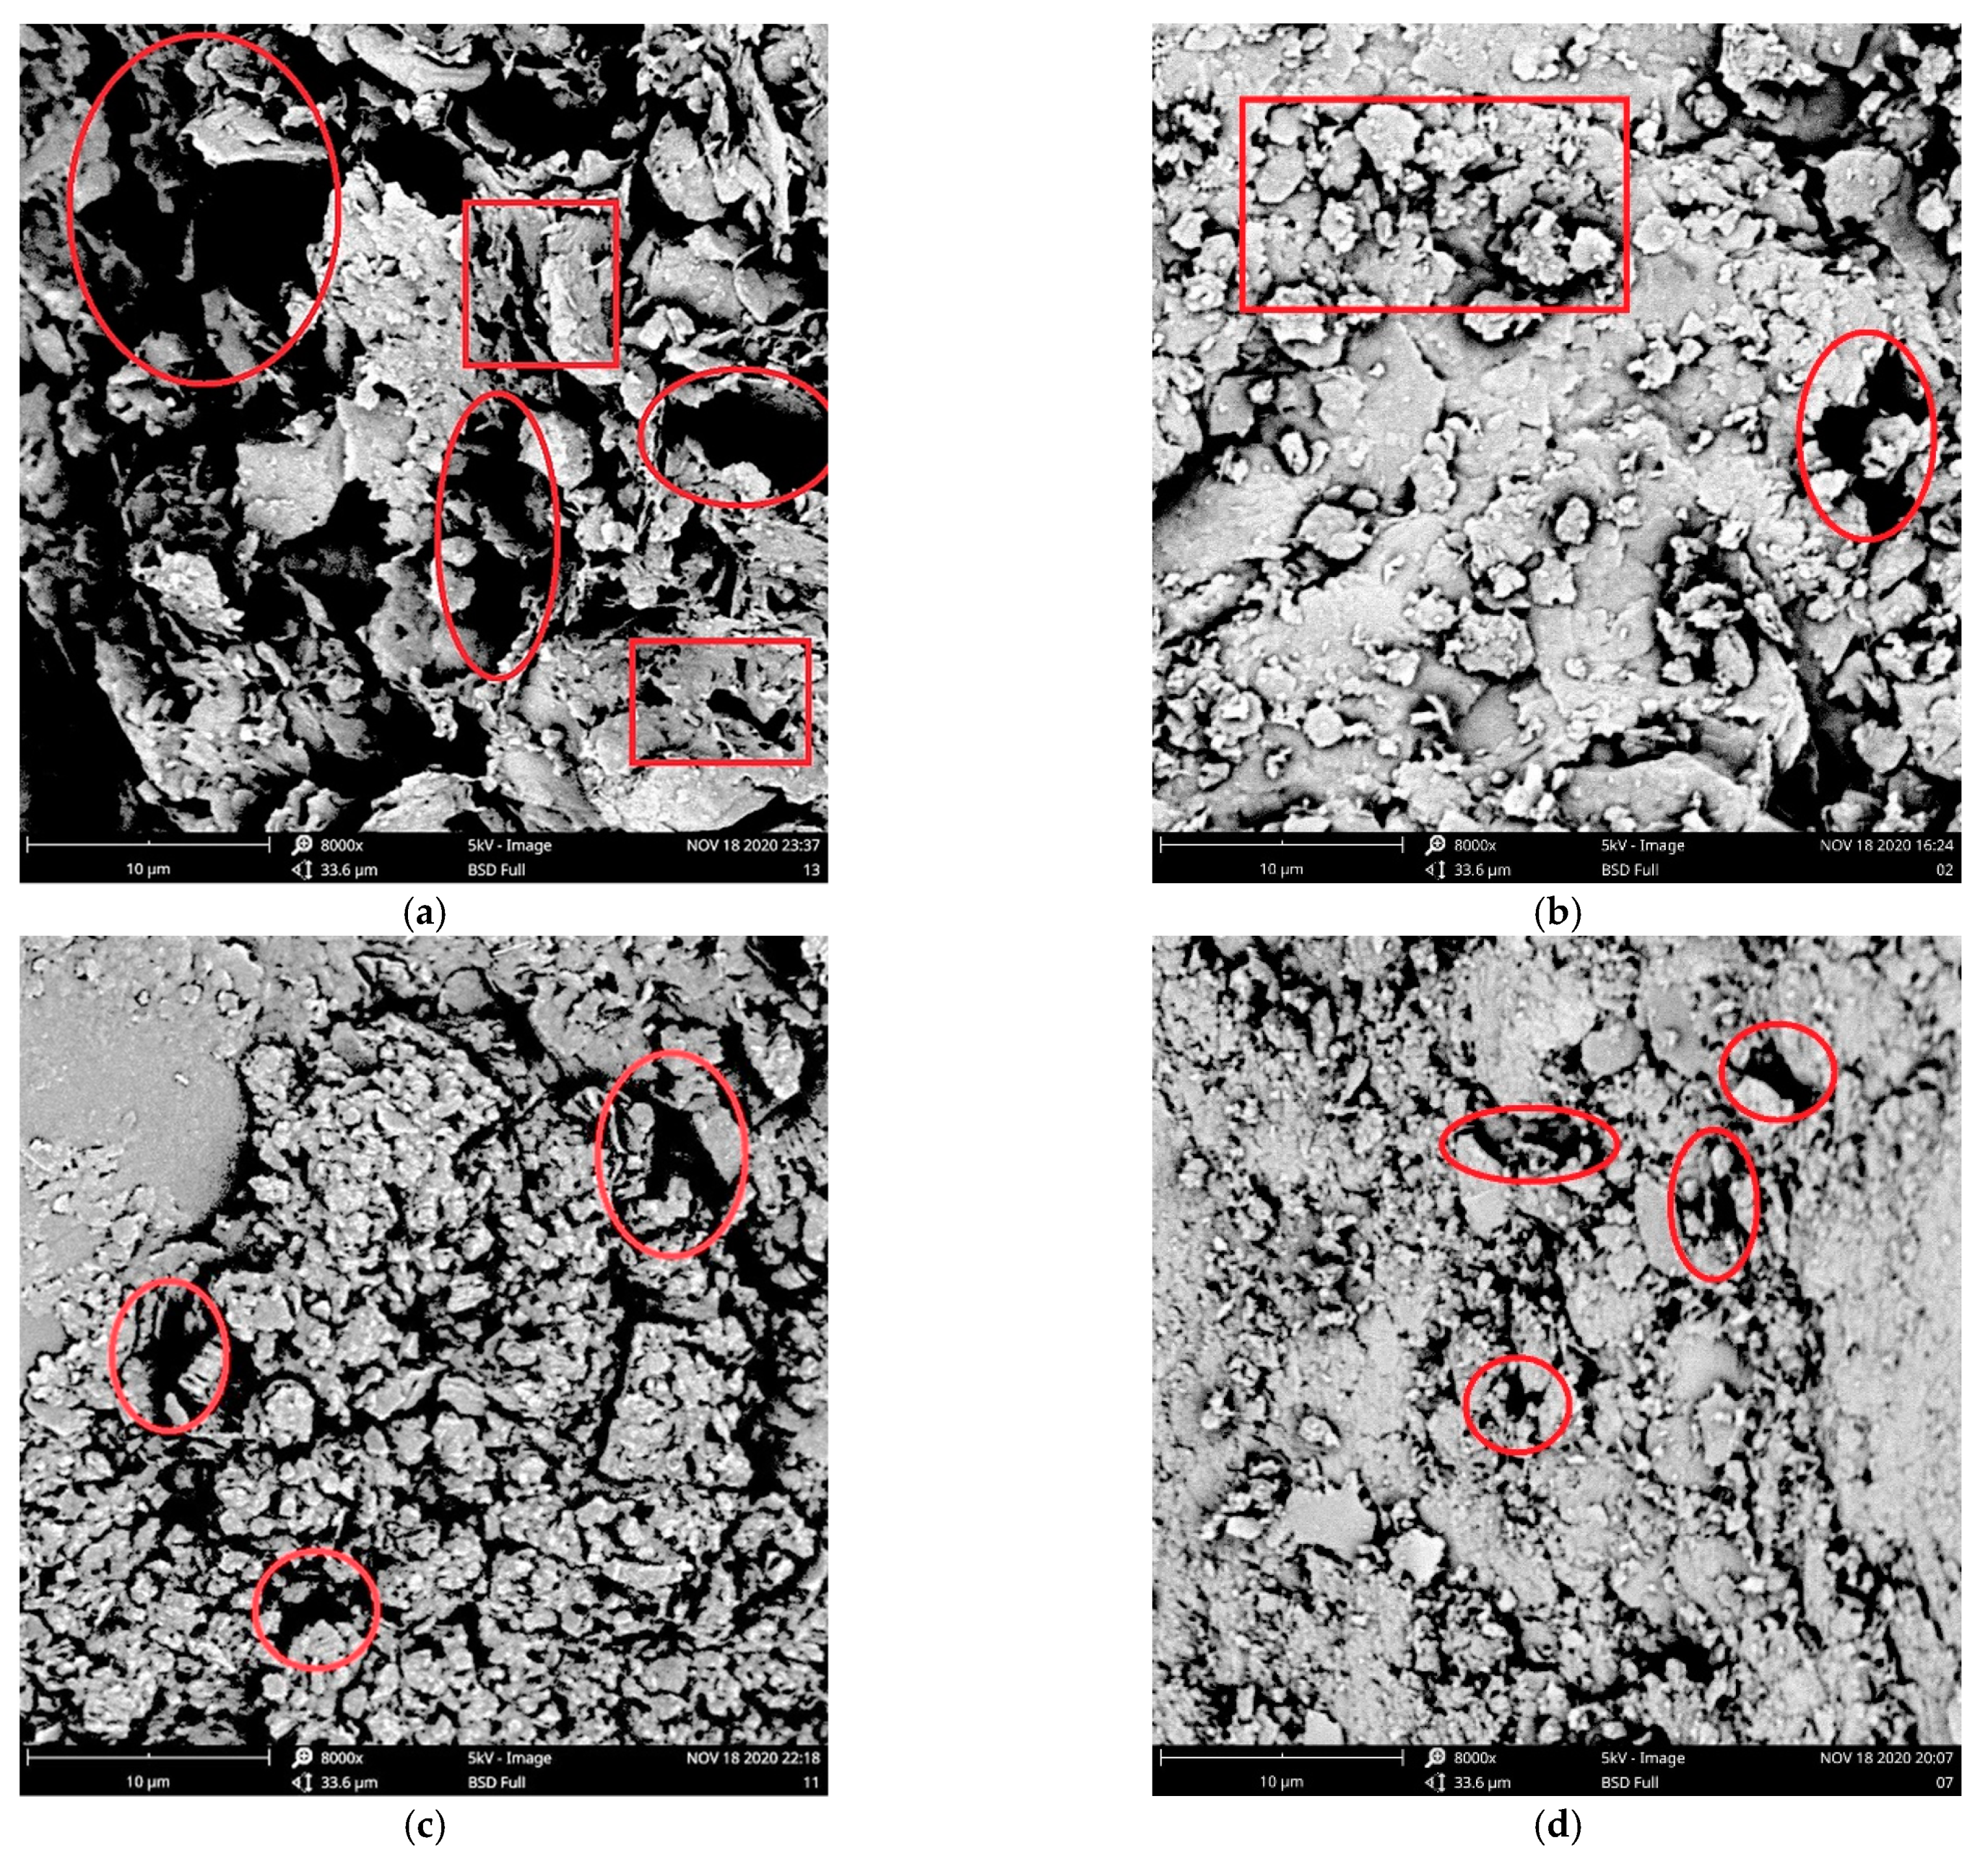
Before cyclic loading, the microscopic images of soft marine soil show flocculation and a honeycomb flocculation structure. The aggregates are mostly flocculent, and the pores between particles are large, forming a local weakening area. After cyclic loading, the macropores decrease, and the structure becomes denser. The fragmentation of large particles and the aggregation of small particles occur simultaneously, and the aggregate structures of soil particles are inlaid with each other.
(2)
After cyclic loading, the large pores are squeezed and broken, resulting in decreases in pore diameter and pore roundness, and an increase in uniformity. At this time, the internal structure of soft marine soil gradually stabilizes. With increases in p0, ζ, and OCR, the compression effect of the soil is more obvious, and the degree of change in the above microstructure parameters is larger.
(3)
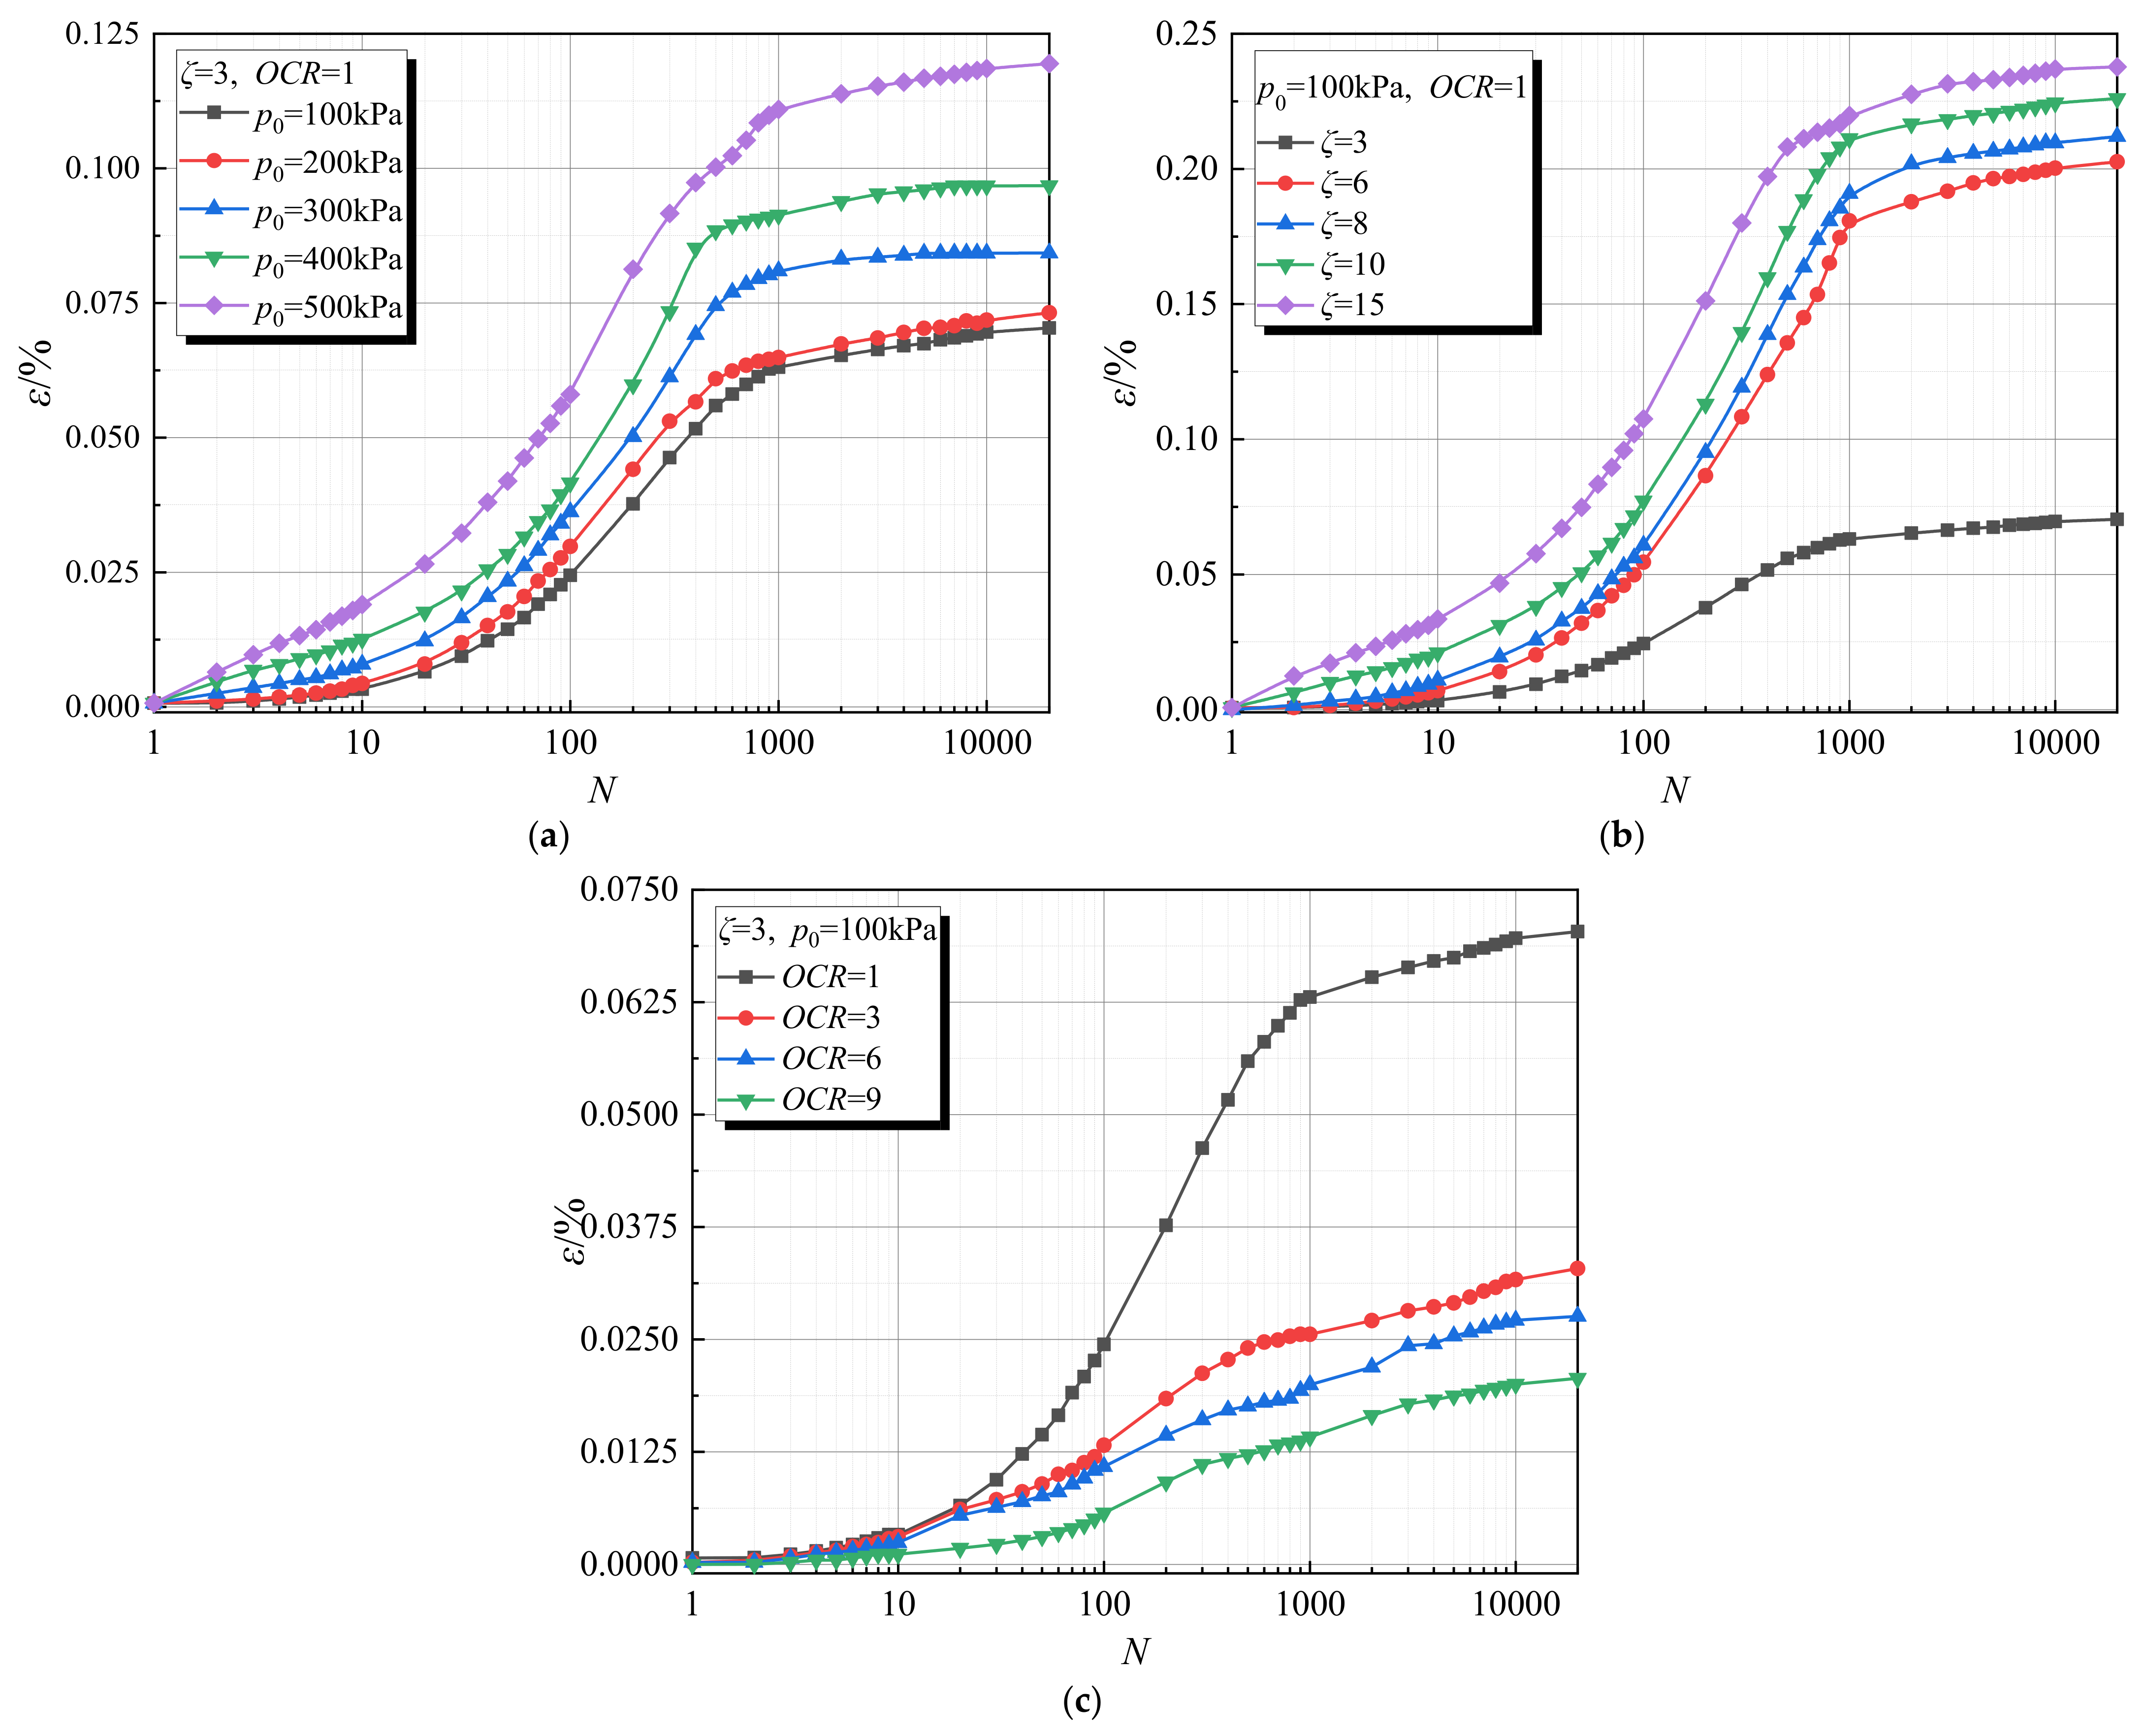
After cyclic loading, the directional frequency Pi (10) of the pores in a certain location at 0° to 180° increases significantly. This shows that, after loading, the pores in soft marine soil develop in a certain direction, giving the pores directional property. As the consolidation confining pressure, cyclic dynamic stress ratio, and over-consolidation ratio increase, the porosity probability entropy decreases. This shows that, after loading, the pores of the soft marine soil become more orderly, and the strain growth also increases. The microscopic test results further verify the macroscopic strain law.

Author Contributions

Conceptualization, C.-X.D. and Q.-F.Z.; investigation, H.-F.S. and A.Z.; resources, T.-D.X.; writing—original draft preparation, C.-X.D.; writing—review and editing, Q.-F.Z. and S.-H.H.; supervision, T.-D.X. and S.-H.H.; funding acquisition, T.-D.X. and H.-F.S. All authors have read and agreed to the published version of the manuscript.

Funding

This research was funded by The National Natural Science Foundation of China (51508506); The Key Research and Development Program of Zhejiang Province (2019C03103); The Joint Fund of Zhejiang Provincial Natural Science Foundation (LHZ20E080001); Key R & D Program Project of Zhejiang Province(2020C01102); The Exploration project of Zhejiang Natural Science Foundation (LQ20E080010); and Hangzhou Science Technology Plan Project (20172016A06, 20180533B06, 20180533B12, and 20191203B44).

Institutional Review Board Statement

Not applicable.

Informed Consent Statement

Not applicable.

Data Availability Statement

The data presented in this study are available on request from the corresponding author. The data are not publicly available due to privacy.

Conflicts of Interest

The authors declare no conflict of interest.

References

  1. Wang, C.J. Research on Dynamic Stress and Saturated Soft Clay Characteristics of Foundation under Moving Trainload. Ph.D. Thesis, Zhejiang University, Hangzhou, China, 2006. [Google Scholar]
  2. Gong, S.L. Study on micro-properties of Shanghai soft clay and its effect on soil deformation and land subsidence. J. Eng. Geol. 2002, 10, 378–384. [Google Scholar]
  3. Cheng, Z.; Wang, J.F. Mini-triaxial tester for micro-mechanical behavior test of granular soil. Rock Soil Mech. 2018, 39, 1123–1129. [Google Scholar]
  4. Hu, R.L.; Li, X.Q. The key points of engineering geology students in the 21st century: Soil microstructure mechanics. Hydrogeol. Eng. Geol. 1999, 26, 5–8. [Google Scholar]
  5. Zheng, Q.Q. Study on Macro and Micro-Dynamic Characteristics of Hangzhou Silty Soft Clay under Intermittent Cyclic Loading. Ph.D. Thesis, Zhejiang University, Hangzhou, China, 2019. [Google Scholar]
  6. Xue, R.; Hu, R.L.; Mao, L.T. Fractal study of microstructure change in soft soil reinforcement process. China Civ. Eng. J. 2006, 39, 87–91. [Google Scholar]
  7. Sun, W.J.B.; Zuo, Y.J.; Wu, Z.H.; Liu, H.; Xi, S.J.; Shui, Y.; Wang, J.; Liu, R.B.; Lin, J.Y. Fractal analysis of pores and the pore structure of the Lower Cambrian Niutitang shale in northern Guizhou province: Investigations using NMR, SEM, and image analyses. Mar. Petrol. Geol. 2019, 99, 416–428. [Google Scholar] [CrossRef]
  8. Miyata, T.; Endo, A.; Ohmori, T.; Akiya, T.; Nakaiwa, M. Evaluation of pore size distribution in a boundary region of micropore and mesopore using gas adsorption method. J. Colloid Interface Sci. 2003, 262, 116–125. [Google Scholar] [CrossRef]
  9. Zhang, Z.L.; Cui, Z.D. Effects of freezing-thawing and cyclic loading on pore size distribution of silty clay by mercury intrusion porosimetry. Cold Reg. Sci. Technol. 2018, 145, 185–196. [Google Scholar] [CrossRef]
  10. Wang, H.M.; Liu, Y.; Song, Y.C.; Zhao, Y.C.; Zhao, J.F.; Wang, D.Y. Fractal analysis and its impact factors on the pore structure of artificial cores based on the images obtained using magnetic resonance imaging. J. Appl. Geophys. 2012, 86, 70–81. [Google Scholar] [CrossRef]
  11. Zhang, X.W.; Kong, L.W.; Guo, A.G.; Tuo, Y.F. Based on the SEM and MIP test structured clay microscopic pore changes during compression. Chin. J. Rock Mech. Eng. 2012, 31, 406–412. [Google Scholar]
  12. Griffiths, F.J.; Joshi, R.C. Discussion: Change in pore size distribution due to consolidation of clays. Géotechnique 1990, 40, 303–309. [Google Scholar] [CrossRef]
  13. Tang, Y.Q.; Zhang, X.; Zhou, N.Q.; Huang, Y. Microscopic study on the properties of saturated soft clay under subway vibration load. J. Tongji Univ. (Nat. Sci. Ed.) 2005, 33, 626–630. [Google Scholar]
  14. Fang, H.G.; Liu, P.H.; Yuan, Z.G. Analysis of the characteristics of microstructure changes during the consolidation of soft marine soil. Hydrogeol. Eng. Geol. 2007, 34, 49–52. [Google Scholar]
  15. Zhang, J.R.; Zhu, J.; Huang, L.; Xia, Y.F. Evolution and fractal description of the microscopic pore structure of soft clay under consolidation conditions. J. Hydraul. Eng. 2008, 39, 394–400. [Google Scholar]
  16. Jiang, Y.; Lei, H.Y.; Zheng, G.; Yang, X.J. Fractal study on microstructure changes of structural soft soils under dynamic loading. Rock Soil Mech. 2010, 31, 3075–3080. [Google Scholar]
  17. Ding, Z.; Kong, B.W.; Wei, X.J.; Zhang, M.Y.; Xu, B.L.; Zhao, F.J. Laboratory testing to research the micro-structure and dynamic characteristics of frozen–thawed soft marine soil. J. Mar. Sci. Eng. 2019, 7, 85. [Google Scholar] [CrossRef] [Green Version]
  18. Zhou, C.Y.; Cui, G.J.; Liang, W.Y.; Liu, Z.; Zhang, L.H. A Coupled Macroscopic and Mesoscopic Creep Model of Soft Marine Soil Using a Directional Probability Entropy Approach. J. Mar. Sci. Eng. 2021, 9, 224. [Google Scholar] [CrossRef]
  19. Zhang, M.Y. Experimental Study on Dynamic Characteristics and Microstructure of Freeze-Thaw Soft Soil under Subway Cyclic Loading. Ph.D. Thesis, Zhejiang University, Hangzhou, China, 2016. [Google Scholar]
  20. Xu, R.Q.; Xu, L.; Deng, Y.W.; Zhu, Y.H. Tests for measuring the contact area of soft clay based on sem and IPP. J. Zhejiang Univ. (Eng. Sci. Ed.) 2015, 49, 1417–1425. [Google Scholar]
  21. Bascoul, M. Image analysis: A tool for the characterization of hydration of cement in concrete—Metrological aspects of magnification on measurement. Cem. Concr. Comp. 2001, 23, 201–206. [Google Scholar] [CrossRef]
  22. Scrivener, K.L.; Patel, H.H.; Pratt, P.L.; Parrott, L.J. Analysis of phases in cement paste using backscattered electron images, methanol adsorption, and thermogravimetric analysis. MRS Online Proc. Libr. 1986, 85, 67–76. [Google Scholar] [CrossRef]
  23. Wang, S.L. Research on life source pollution clay SEM based on IPP. Build. Mater. Decor. 2019, 564, 242–243. [Google Scholar]
  24. Shi, B. Quantitative evaluation of the microstructure of cohesive soil during compaction. Chin. J. Geotech. Eng. 1996, 18, 57–62. [Google Scholar]
  25. Ding, Z.; Hong, Q.H.; Wei, X.J.; Zhang, M.Y.; Zheng, Y. Microscopic test study of artificial freezing and thawing soft soil under subway trainload. J. Zhejiang Univ. (Eng. Sci. Ed.) 2017, 51, 1291–1299. [Google Scholar]
Figure 1. Test soil sample.
Jmse 09 00750 g001
Figure 2. Fully automatic consolidation and expansion test instrument.
Jmse 09 00750 g002
Figure 3. Field emission scanning electron microscope.
Jmse 09 00750 g003
Figure 4. Schematic diagram of loading waveform.
Jmse 09 00750 g004
Figure 5. IPP software analysis process: (a) original image, (b) picture after binarization and (c) identifying the pore units.
Jmse 09 00750 g005
Figure 6. Microscan images (a) before and (b) after typical loading; honeycomb structure (c) before and (d) after loading. Note: circles indicate pores, and rectangles indicate flocculent structures.
Jmse 09 00750 g006
Figure 7. Microscopic scan images before and after loading under different test conditions: (a) p0 = 0, before loading; (b) p0 = 100 kPa, after loading; (c) ζ = 0, before loading; (d) ζ = 15, after loading; (e) OCR = 0, before loading; (f) OCR = 9, after loading. Note: circles indicate pores, and squares indicate flocculent structures.
Jmse 09 00750 g007
Figure 8. Changes in the distribution of equivalent pore diameters before and after loading under different test conditions: (a) SEM-A, (b) SEM-B, and (c) SEM-C.
Jmse 09 00750 g008aJmse 09 00750 g008b
Figure 9. Vibration frequency-accumulated strain diagram under different test conditions: (a) SEM-A, (b) SEM-B, and (c) SEM-C.
Jmse 09 00750 g009
Figure 10. Changes in pore area distribution before and after loading under different test conditions: (a) SEM-A, (b) SEM-B, and (c) SEM-C.
Jmse 09 00750 g010aJmse 09 00750 g010b
Figure 11. Changes in pore roundness before and after loading under different test conditions: (a) SEM-A, (b) SEM-B, and (c) SEM-C.
Jmse 09 00750 g011
Figure 12. Directional frequency distribution diagram before and after loading under different test conditions: (a) SEM-A, (b) SEM-B, and (c) SEM-C.
Jmse 09 00750 g012aJmse 09 00750 g012b
Figure 13. Probability entropy change diagram before and after loading under different test conditions: (a) SEM-A, (b) SEM-B, and (c) SEM-C.
Jmse 09 00750 g013aJmse 09 00750 g013b
Table 1. Basic physical parameters of the soil sample.
Weight
(kN·m−3)
Moisture Content (%)Specific GravityPlastic
Limit
Liquid Limit (%)Plasticity
Index
Liquidity Index
Mean15.762.472.7427.044.617.62.01
Table 2. Dynamic consolidation compression test and scanning electron microscope test scheme for the undisturbed saturated soft marine soil.
GroupSoil Sample Numberp0
(kPa)
ζNumber of
Vibrations
OCR
SEM-AA0Undisturbed soft marine soil (unloaded)
A1100320.0001
A2200320.0001
A3300320.0001
A4400320.0001
A5500320.0001
SEM-BB0Undisturbed soft marine soil (unloaded)
B1100320.0001
B2100620.0001
B3100820.0001
B41001020.0001
B51001520.0001
SEM-CC0Undisturbed soft marine soil (unloaded)
C1100320.0001
C2300320.0003
C3600620.0006
C4900920.0009
Publisher’s Note: MDPI stays neutral with regard to jurisdictional claims in published maps and institutional affiliations.

