Article

Research on Improving the Working Efficiency of Hydraulic Jet Submarine Cable Laying Machine

1
State Grid Zhoushan Electric Power Company, Zhoushan 316021, China
2
Ocean College, Zhejiang University, Zhoushan 316021, China
*
Author to whom correspondence should be addressed.
J. Mar. Sci. Eng. 2021, 9(7), 745; https://doi.org/10.3390/jmse9070745
Submission received: 1 June 2021 / Revised: 29 June 2021 / Accepted: 1 July 2021 / Published: 5 July 2021
(This article belongs to the Special Issue Marine Power Systems)

Abstract

:
The anchoring and hooking of ships, bedrock friction and biological corrosion threaten the safety and stability of submarine cables. A hydraulic jet submarine cable laying machine manages to bury the submarine cables deep into the seabed, and effectively reduces the occurrence of external damage to the submarine cables. This machine uses a hydraulic jet system to realize trenching on the seabed. However, the hydraulic jet submarine cable laying machine has complicated operation and high power consumption with high requirements on the mother ship, and it is not yet the mainstream trenching method. In this paper, a mathematical model for the hydraulic jet nozzle of the submarine cable laying machine is established, and parameters that affect the trenching efficiency are studied. The effects of jet target distance, flow, angle and nozzle spacing on the working efficiency of the burying machine are analyzed by setting up a double-nozzle model. The results of the theory, numerical simulation and experiment show that the operational efficiency of the hydraulic jet submarine cable laying machine can be distinctly improved by setting proper jet conditions and parameters.

1. Introduction

Submarine cables directly laid on the seabed are vulnerable to damage caused by the anchoring and hooking of ships, bedrock friction and biological corrosion. Among them, defects caused by the ship anchoring and hooking process account for around 95%, indicating the highest risk [1,2,3]. Therefore, burying the submarine cables into the seabed can effectively reduce the occurrence of external damage, making it necessary to develop a submarine cable laying machine. There are mainly two types of laying machine, namely self-propelled and towed, depending on the embodiment of trenching, while towed submarine cable laying machines can be further divided into the water jet, the plow chain wheel and the Plough type [4,5,6]. Compared with the other two towed submarine cable laying machines, the hydraulic jet one has a large load requirement on the mother ship, while the related equipment is complicated to operate. However, its trench depth can be adjusted, making the protection of the cable more direct and effective [7,8]. Therefore, further improvement of its operational efficiency has become a research hotspot.
Scholars at home and abroad have paid less attention to submarine cable laying machines, but research on underwater operation systems is more extensive. Mai The Vu et al. conducted analyses on the design and mechanics of a developing UTV (underwater tracked vehicle) with a rotating RC (radial component) tool for rock excavation. They analyzed the parameters that affect the performance, including the cutting forces, torque, and power requirements of the UTV with the RC tool in rock conditions for designing [9]. RC is an effective tool for trenching but will require more energy when used in a submarine cable laying machine. Simultaneously, Mai The Vu et al. conducted physical analysis of the design and mechanics of a UTV with an LT (ladder trencher). They studied the factors that affect the feasibility of the UTV with LT in soft soil conditions and sought to understand the factors that affect the cutting performance to provide an improved trencher performance prediction model [10]. Compared with RC tools, LT is a more effective trenching tool in soft mud conditions. However, LT has higher requirements for installation and operability, and it is more suitable for a UTV than a submarine cable laying machine as it moves mainly through the drag of the ship. Mai The Vu et al. also described how the analytical model is derived and implemented for the design and analysis of the mechanics of a UTV with a rotating LT for cutting underwater soil by considering all target specifications [11]. The rotating LT is obviously more effective, but the limitations of its application in a submarine cable laying machine are the same as those of the ordinary LT as described above. In addition, Mai The Vu et al. showed how an analytical trenching machine model is derived and they designed and analyzed the trenching machine operation in the up-cutting operation mode. To obtain improved trenching performance modeling, the factors that affect the cutting performance of the UTV with the CB in soft soil conditions regarding the cutting-mode operation were analyzed [12]. CB is an overly complicated trenching tool that is very expensive to develop and use, while it exceeds the trenching requirements of the CD submarine cable laying machine. In summary, trenching methods are complex and diverse, but they do not meet the actual needs of submarine cable engineering with high operating costs. In applications, as a practical tool, further improving the operational efficiency of the hydraulic jet is more important than using other complex methods.
The State Grid Zhoushan Power Supply Company has a professional construction team for submarine power cable laying in China, equipped with the most advanced and dedicated submarine cable laying construction ship, Qifan No. 9. This workboat adopts a self-developed hydraulic jet submarine cable laying machine to dig trenches. The submarine cable laying construction ship Qifan No. 9 and the hydraulic jet submarine power cable laying machine are shown in Figure 1 and Figure 2, respectively.
In this paper, the influences of nozzle standoff distance, jet flow rate, jet angle and nozzle spacing on the trench depth and width of the laying machine are numerically and theoretically analyzed, based on which factors that affect the operational efficiency of the laying machine are determined. The theoretical and numerical simulation analysis are then verified by experiments, and from the above investigation, the design parameters of the hydraulic jet nozzle are given.

2. Mechanism Analysis

The schematic diagram of the soil-breaking of a hydraulic impinging jet is shown in Figure 3. With the impinging of the hydraulic jet, the disturbing of the soil depends on the characteristics of both the jet and soil. One of the most important parameters considered here is the resistance in the process of soil-breaking, which is called the critical failure pressure of soil. The critical failure pressure of soil under the action of jet flow is related to the soil particle size, permeability, density and other parameters, expressed as follows [13,14,15,16]:
F c r = β τ f 2 ( d 60 k ) 2 γ d 1
where Fcr is the critical jet pressure on the failure surface, τf is the shear strength of soil, d60 is the soil particles’ limited size, γd is the dry unit weight of soil, k is the soil permeability coefficient, d60/k is the erosion resistance of soil, and N and β are correction factors. It was experimentally determined that β = 1.8 × 10¹³ [17].
Equation (1) is an empirical model obtained from experimental research and is only related to the properties of soil. The condition of hydraulic flow rate should also be taken into account considering that the jet flow at the nozzle tip is perpendicular to the soil surface. The total pressure in the half width range is:
F b = 0 b 1 / 2 p ( y ) 2 π y π d y = 5 7 π b 1 / 2 2 P m
where b1/2 is the half width and thickness of the jet, and Pm is the dynamic pressure at the center of the jet stream, which can be obtained as:
P m = 1 2 ρ u m a x 2
The average stress within the half width can be calculated as:
P b ¯ = F b S = 5 7 P m = 45 ρ Q 2 u 2 896 π 2 v 2 l 2
where Q is the flow rate, u is the nozzle exit velocity, v is the hydrodynamic viscosity and l is the distance from the nozzle to the jet surface.
In reality, there is a certain inclination angle between the scouring jet and the stressed soil surface. The diagram is shown in Figure 4.
The curved surface equation of the scour surface is:
( x tan q + z L sin q ) 2 [ x 2 + y 2 + ( z L sin q ) ] sin a ( tan 2 q + 1 ) = 0
The equation of the scour surface contour curve is:
( x 2 + y 2 + ( L sin α ) 2 L cos α ) 2 + ( L sin α ) 2 = ( x L cos α ) 2 + y 2
where θ is the supplementary angle of the jet scour angle, L is the distance between the jet pole and the jet hitting the surface along the direction of the jet, α is the angle of jet expansion and {x, y, z} is the coordinate of any point on the surface.
The average force acting on the jet plane during the tilting scour is [18,19]:
P b ¯ = ρ Q u f ( L , θ )
where f(L,θ) is jet area. Research shows that the sediment settlement is faster when the scour angle of the nozzle is increased, so the post-spray should be considered in the actual scour to wash off the suspended sediment.
The formula of the bed-load transport rate is as follows [20,21]:
q b = π 6 ρ s d u b p
where ρs is the sediment density, ub is the bottom critical average velocity of sediment entrainment, and p is the probability of sediment entrainment, p = nd3. It can be inferred that the sediment transport rate is mainly related to the flow velocity on the surface of the sand bed, so increasing the flow velocity can enhance the sediment transport volume.
The essential condition for the destruction of the upper body under the jet impinging is that the jet impact force of the upper body is greater than the critical failure pressure. In other words, the average force within the half width range is larger than the critical failure pressure of the soil.

3. Numerical Simulation Analysis

3.1. Finite Element Method

The process of jet trenching is a complex solid–liquid two-phase flow problem. In this paper, the Euler multiphase flow model is adopted [22,23,24]. Its continuity equation is expressed as:
t α i ρ i χ d V + A α i ρ i χ ( v i v g ) · d a = V j i ( m i j m j i ) χ d V + V S i a d V
where αi is the volume fraction of phase i, ρi is the density of phase i, χ is the cavitation rate, vi is the rate of phase i, vg is the grid velocity, mij is the mass transfer from phase j to phase i, mji is the mass transfer from phase i to phase j, and Siα is the quality source term. In addition, the volume fraction satisfies: Σiαi = 1. The momentum equation of multiphase separation flow is:
t α i ρ i χ d V + A α i ρ i χ ( v i v g ) · d a = V α i χ ρ d V + V α i ρ i χ g d V + A [ α i ( τ i + τ i t ) ] χ · d a + V M χ d V + V V S i a d V V Σ ( m i j v j m j i v i ) χ d V
where p is pressure, assuming that it is equal in the two phases; g is the acceleration vector; τi is molecular stress; τit is turbulent stress; Mi is the interphase momentum transfer per unit volume; (Fint)i is the internal force; Siv is the phase quality source term; mij is the mass transfer rate from phase j to phase i, and mji is the mass transfer rate from phase i to phase j. The interphase momentum transfer represents all the forces acting from phase to phase and satisfies the following equation:
i M i = 0
To simplify the simulation computation, the following assumptions are made when establishing the numerical simulation model, on the premise of meeting the simulation requirements: (1) soil is an isotropic medium; (2) the fluid is incompressible; (3) the influence of the ocean current on the soil-breaking of the hydraulic jet is ignored. (Based on the above three assumptions and formulas, we can use the multiphase separation flow model to simulate the trenching process through a hydraulic jet.) The ocean sediment in the case of soil-breaking is mainly silt and sand, so we select clayey sand powder as the simulation object. The soil parameters are shown in Table 1.
The dual-nozzle numerical simulation model is shown in Figure 5. The three-dimensional model simulates the soil-breaking of the hydraulic jet in still water, including the nozzle, cement interface and bottom mud [25,26]. During the simulation, some parameters, such as standoff distance, flow rate, jet angle and nozzle spacing, are adjusted according to the change in the study object [27].
We use STAR-CCM + [28,29] to simulate and analyze the effects of jet target distance, jet flow, jet angle and nozzle spacing on the jet trenching effect in a 2D plane, which is mainly judged based on the depth and width of the trenching.

3.2. Simulation Results

3.2.1. Influence of Standoff Distance on Jet Flow Effect

We set the nozzle angle θ = 90°, nozzle diameter d = 60 mm, nozzle spacing as 300 mm and jet flow rate as 1.187 m3/min and analyze the scour depth and width at different jet standoff distances. The analysis results are shown in Figure 6 and Figure 7.
It is not difficult to see from the figure that the scouring depth reaches the maximum at around 3 s under different target distances, and then the scouring depth decreases and stabilizes with the siltation of the soil. The increase in the standoff distance will reduce the depth and width of the scouring. When the target distance is 0.1 m, the scouring depth and scouring width reach the maximum.

3.2.2. Influence of Jet Flow Rate on Jet Flow Effect

We set the nozzle angle θ = 90°, nozzle diameter d = 60 mm, nozzle spacing as 300 mm, standoff distance as 300 mm and jet flow rate ranging from 3 m/s to 20 m/s—that is, jet flow rate changing from 0.509 m3/min to 3.393 m3/min. We analyze the scour depth and width at different jet flow rates and Figure 8 and Figure 9 show the numerical simulation results.
It can be seen from the figure that as the flow rate increases, the scouring depth and width will increase, while the time for the scouring depth to stabilize will become longer. Once the flow rate is greater than 10 m/s, there will be two scouring effects—that is, the scouring depth will increase again, which is unfavorable. Therefore, the flow velocity is selected as 7 m/s in the subsequent experiments—that is, the flow rate is 1.187 m3/min.

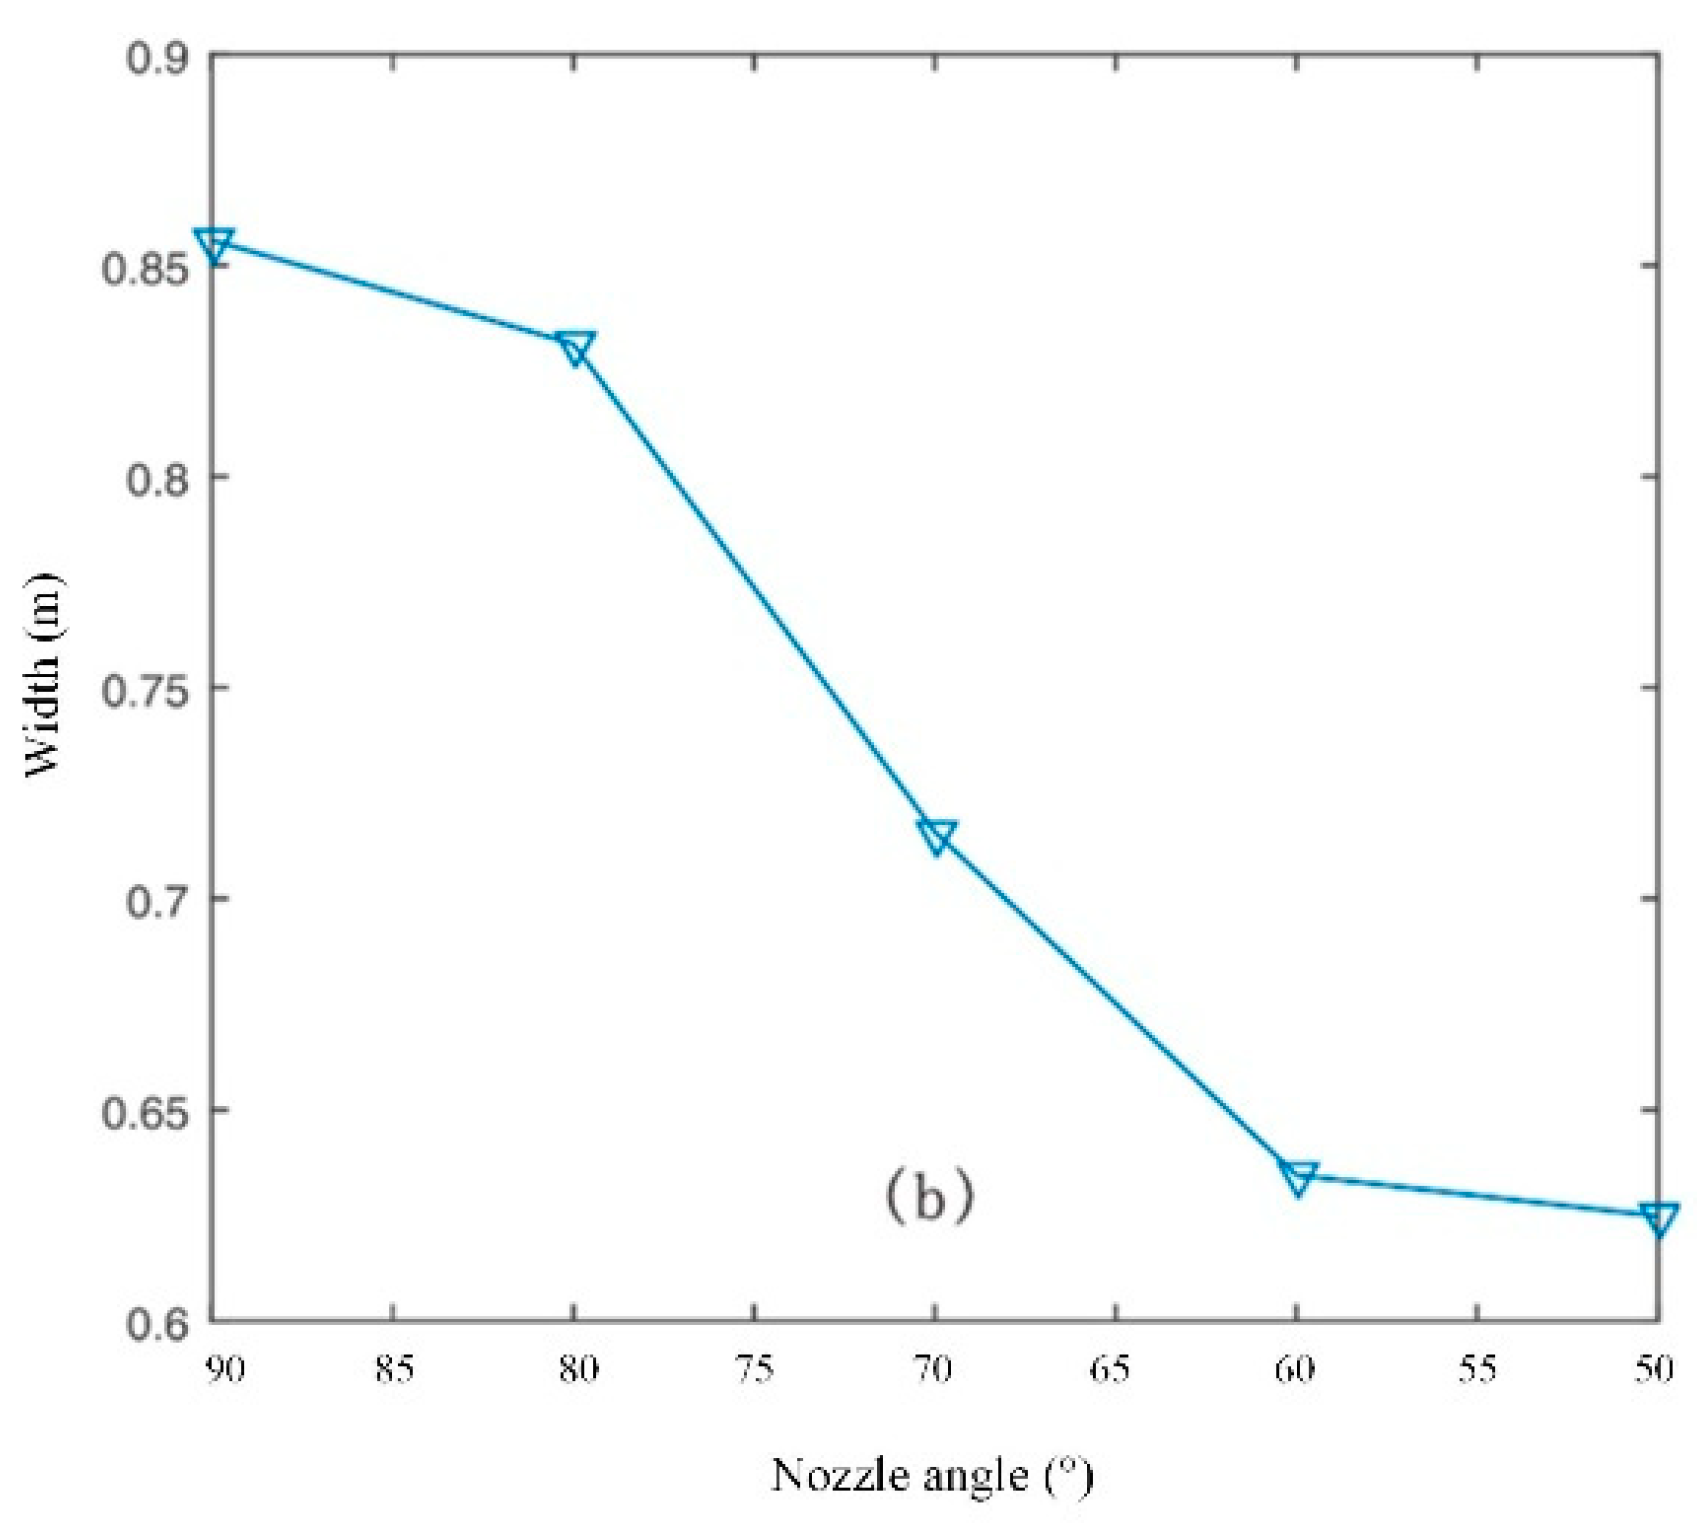
3.2.3. Influence of Jet Angle on Jet Flow Effect

We set the nozzle diameter d = 60 mm, nozzle spacing as 300 mm, standoff distance as 300 mm and jet flow rate as 1.187 m3/min. We analyze the scour depth and width at different jet angles and Figure 10, Figure 11, Figure 12 and Figure 13 show the numerical simulation results.
Obviously, as the nozzle angle decreases, the scour depth increases, but the width decreases. Thus, the selection of the nozzle angle is analyzed in detail.

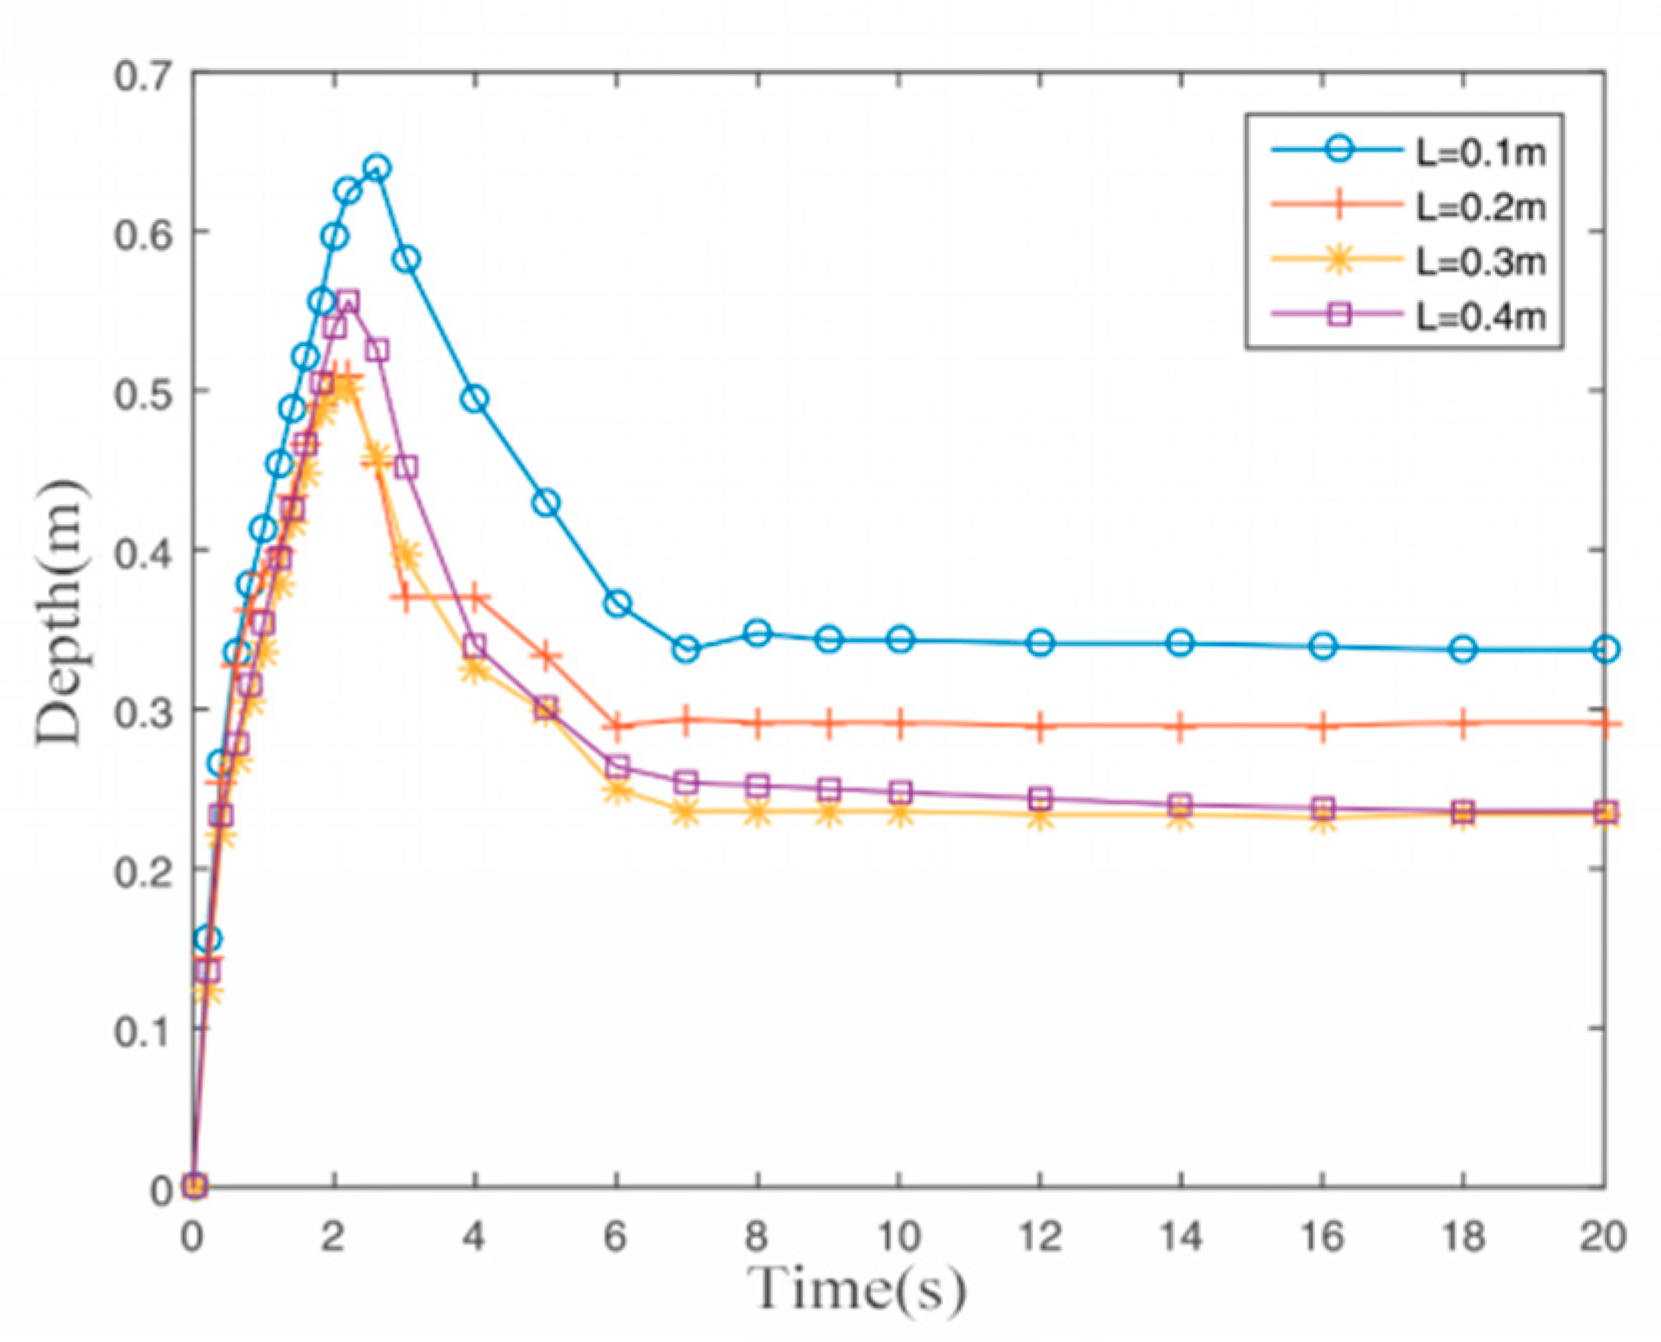
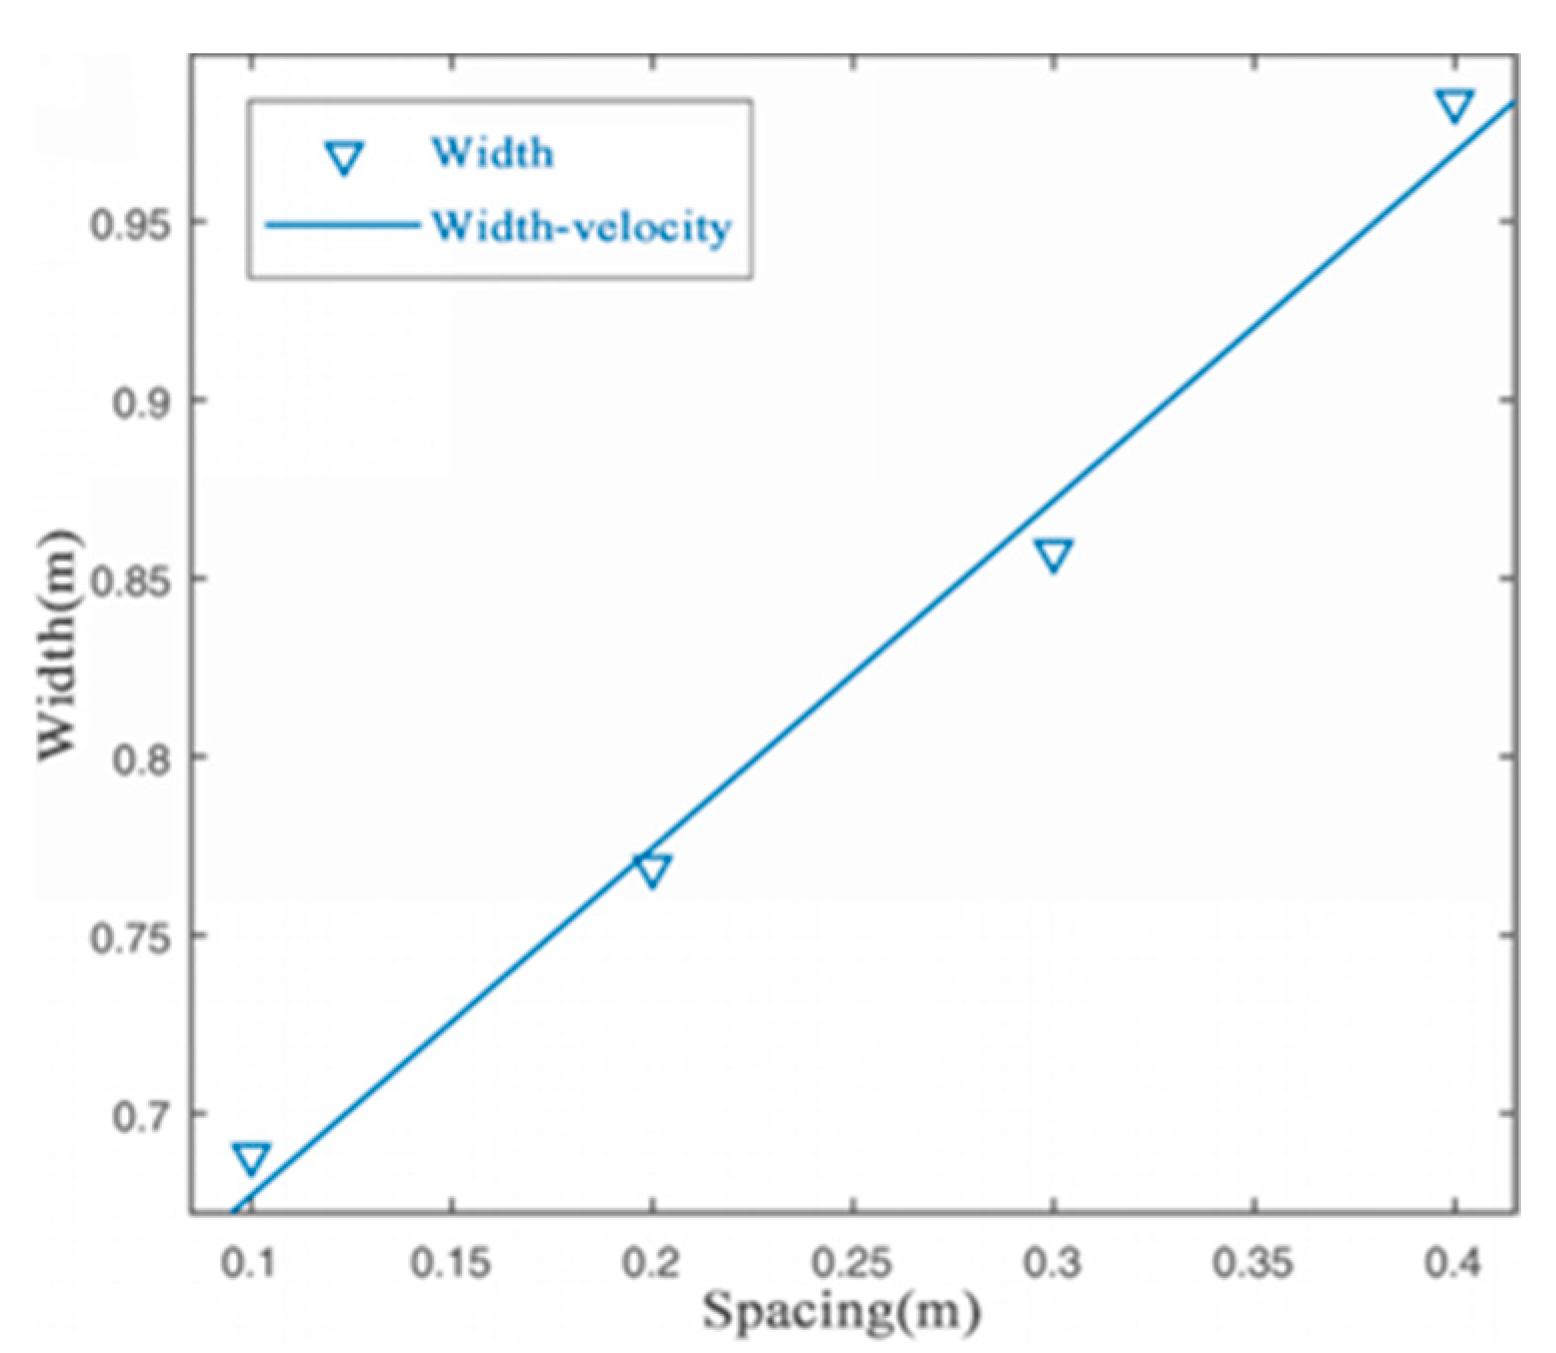
3.2.4. Influence of Jet Spacing on Jet Flow Effect

We set the nozzle angle θ = 90°, nozzle diameter d = 60 mm, standoff distance as 300 mm and jet flow rate as 1.187 m3/min. We analyze the scour depth and width at different jet spacing values and Figure 14, Figure 15 and Figure 16 show the numerical simulation results.
It can be obtained from the figure that the scour depth decreases as the nozzle spacing increases. When the distance is greater than 0.3 m, the scouring depth will no longer change. Correspondingly, the scouring width will increase accordingly, but when the spacing is greater than 0.3 m, there will be siltation of unscoured soil in the middle of the trench, which is obviously undesirable.

4. Experiment Analysis

The jet parameters of the numerical simulation analysis are set based on actual working conditions, which are difficult to establish under experimental conditions. Therefore, a model experiment is conducted that follows the Froude similarity criterion [30,31]. In hydrodynamics, the Froude number is expressed as the ratio of the inertial force and gravity of the fluid. Therefore, the prototype is scaled down according to the similarity principle, the similarity model is observed and analyzed, and then the results of the model experiment are converted to the engineering laying machine, thus obtaining the analytical results of the engineering machine. The experimental parameters are shown in Table 2.

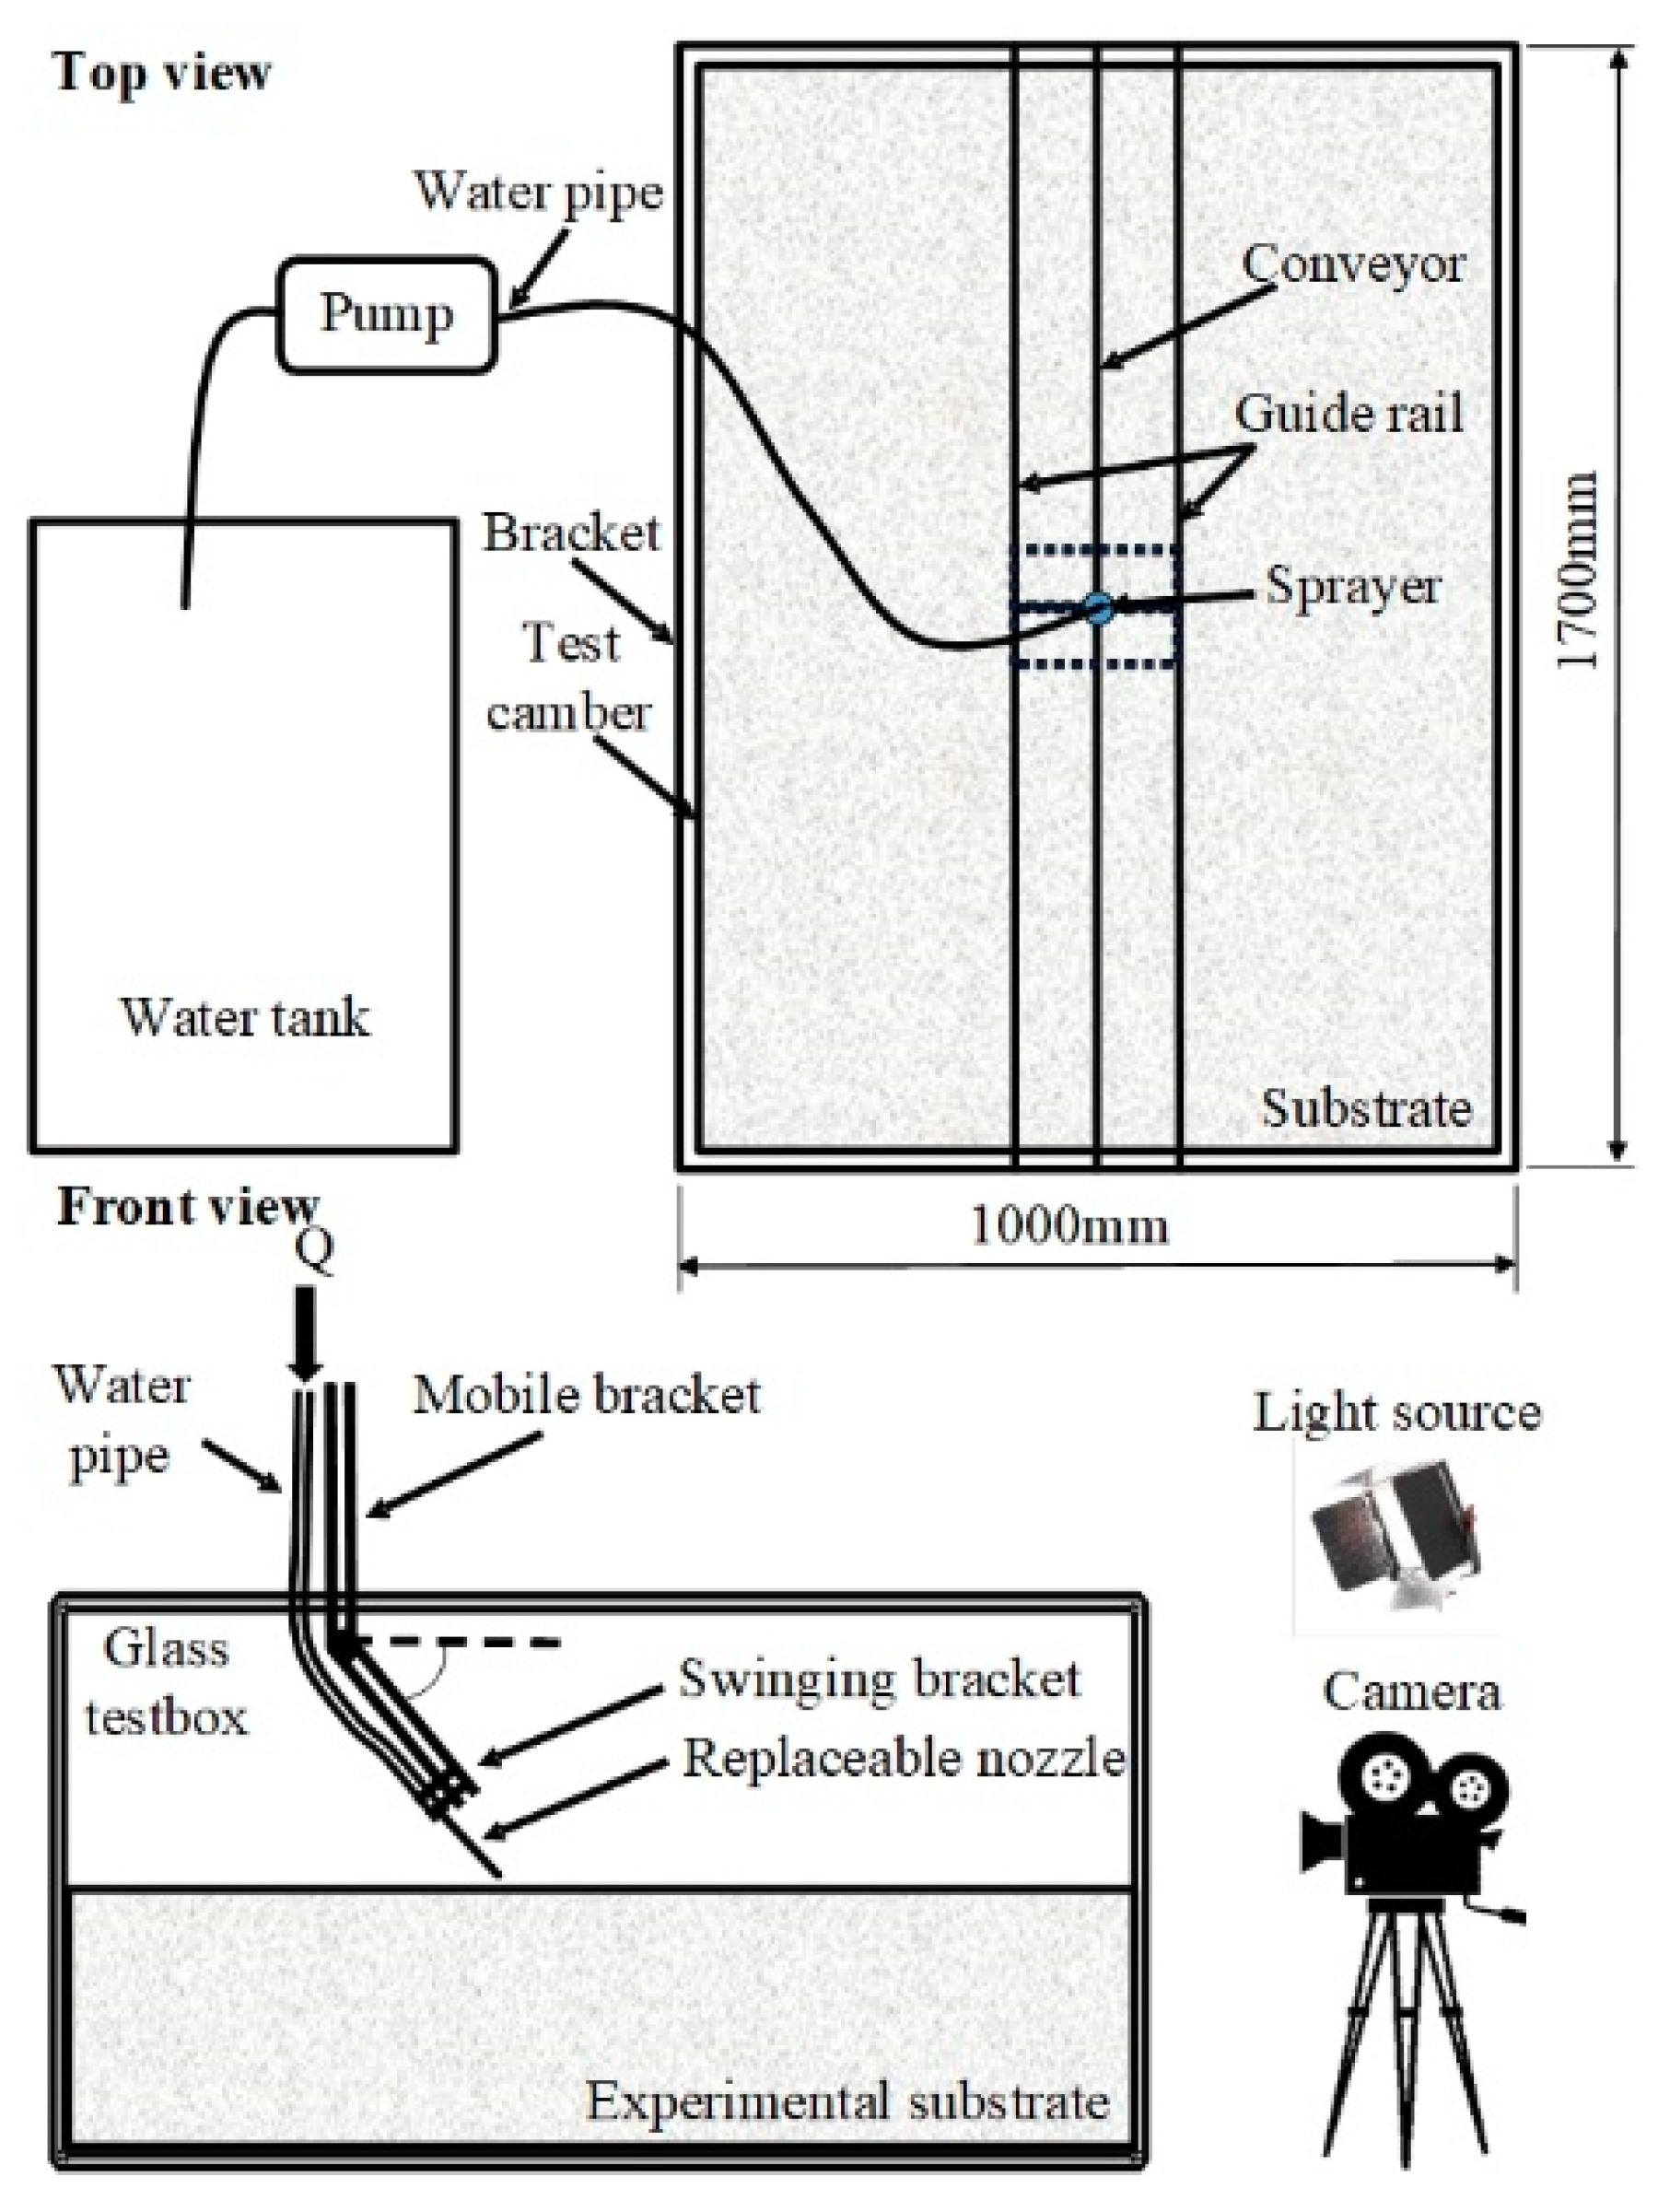
4.1. Design of Experiment Platform

As shown in Figure 17 and Figure 18, the influences of jet flow rate, jet standoff distance and jet angle on trenching morphology and trenching depth [32] are studied using the experimental platform for the soil-breaking of the hydraulic jet. The experimental platform is composed of the experimental substrate, water tank, sandbox, bracket, pump and its auxiliary facilities, the driving and debugging system, as well as the observation and measurement system. Among them, the experimental soil samples are prepared in batches according to the unified production standard through a certain proportion of kaolin and water. Moreover, the jet flow of the nozzle is controlled by a water pump and speed-regulating valve, the standoff distance and angle of the jet are adjusted by swinging the support, and the depth and width of the jet are recorded by an HD camera.
Experiments include a static scouring experiment and dynamic moving scouring experiment. In the static scouring experiment, the influence of different scour angles on the scour depth and width, as well as the influence of the jet standoff distance and jet flow rate on the scour effect, are investigated. In the dynamic scouring experiment, the influence of different scour angles on the scour depth and width, and the influence of the jet standoff distance and jet flow rate, are studied when the nozzle is moving horizontally.

4.2. Experimental Results

4.2.1. Static Scouring Experiment

Firstly, the simulation and experimental results are compared from two aspects of the scour pit shape and depth to verify the reliability of the simulation results. According to the numerical simulation results, experimental restriction conditions are set as shown in Table 3. Table 4 compares the experimental and simulation results of the scour pit depth and width, and the simulation data refer to the scaling criterion to scale the original simulation results.
The development trend of the scour pit depth and width of the simulation results is close to the results from the experiment. However, the scour depth from the simulation is relatively small compared with the experimental value, which is mainly caused by the wall effect of the glass tank [14,15]. On the other hand, the simulated scouring width is larger than the experimental result, which is due to the certain deviation in the smoothness of the sand surface and the viscosity of the glass wall to the fine sand, causing the width of the scouring pit on the upper part to narrow during the scouring.
(a) Influence of jet standoff distance on scour effect
According to the curve trend in Figure 7 of the single-nozzle simulation, once the standoff distance exceeds 600 mm, the scouring depth will further decrease, even not exceeding 200 mm, which is not in line with our ideal situation. Therefore, in the experiment, 8 standoff distances are set to verify the changes in scour pit depth and width at different standoff distances of 0–70 mm, where the experiment is repeated twice for each scour condition.
As shown in Table 5 and Figure 19, the scour pit depth decreases with the increase in the jet standoff distance, while the scour pit width increases. Here, the jet is submerged, leading to an entrainment flow during the spraying process. Currently, the flow rate increases while the average velocity decreases. With the increase in the jet standoff distance, the hydraulic jet flow expands along the direction of the jet. Although the shear generated by the flow velocity decreases, the scour flow rate and effective area increase, resulting in a decrease in the scour pit depth and increase in the scour width [30,33,34].
(b) Influence of jet angle on scouring effect
According to the results of the single-nozzle simulation, when the jet inclination angle is 60–90°, the scour depth is relatively deep, with little influence on the side wall. When the jet inclination angle is less than 60°, the jet depth decreases sharply. Therefore, 4 scour conditions are set in this experiment, where the jet angle ranges from 60° to 90°. The experiment is repeated twice for each scour condition.
As shown in Table 6 and Figure 20, the maximum scour depth can be achieved at the jet angle of 90°. The scour pit width is the largest when the scour angle is 60°, while the scour pit widths are similar at other different scour angles.
(c) Influence of jet flow rate on scour effect
In order to verify the changes in the scour pit depth and width at different jet flow rates, 6 scour conditions are set, and the experiment is repeated twice for each scour condition. Table 7 and Figure 21 show the scour pit depths and widths under different jet flow rate conditions.
The scouring depth does not increase with the increasing flow rate within the experimental range. In working conditions 6 and 7, the scour pit depth is basically the same, but the scour pit width in working condition 7 is larger. Moreover, compared with conditions 5 and 6, the scour pit depth changes slowly, but the scour pit width changes at a higher rate. This is because at a low flow rate, the scour is mainly achieved by the friction between the flow and the sediment surface, so, within this range, the greater the flow rate, the greater the scour pit depth. Once the velocity exceeds a certain value, the intensity of the hydraulic jet flow penetrating the water is enough to generate a turbulence vortex [25,35], thus decreasing the scour pit depth.

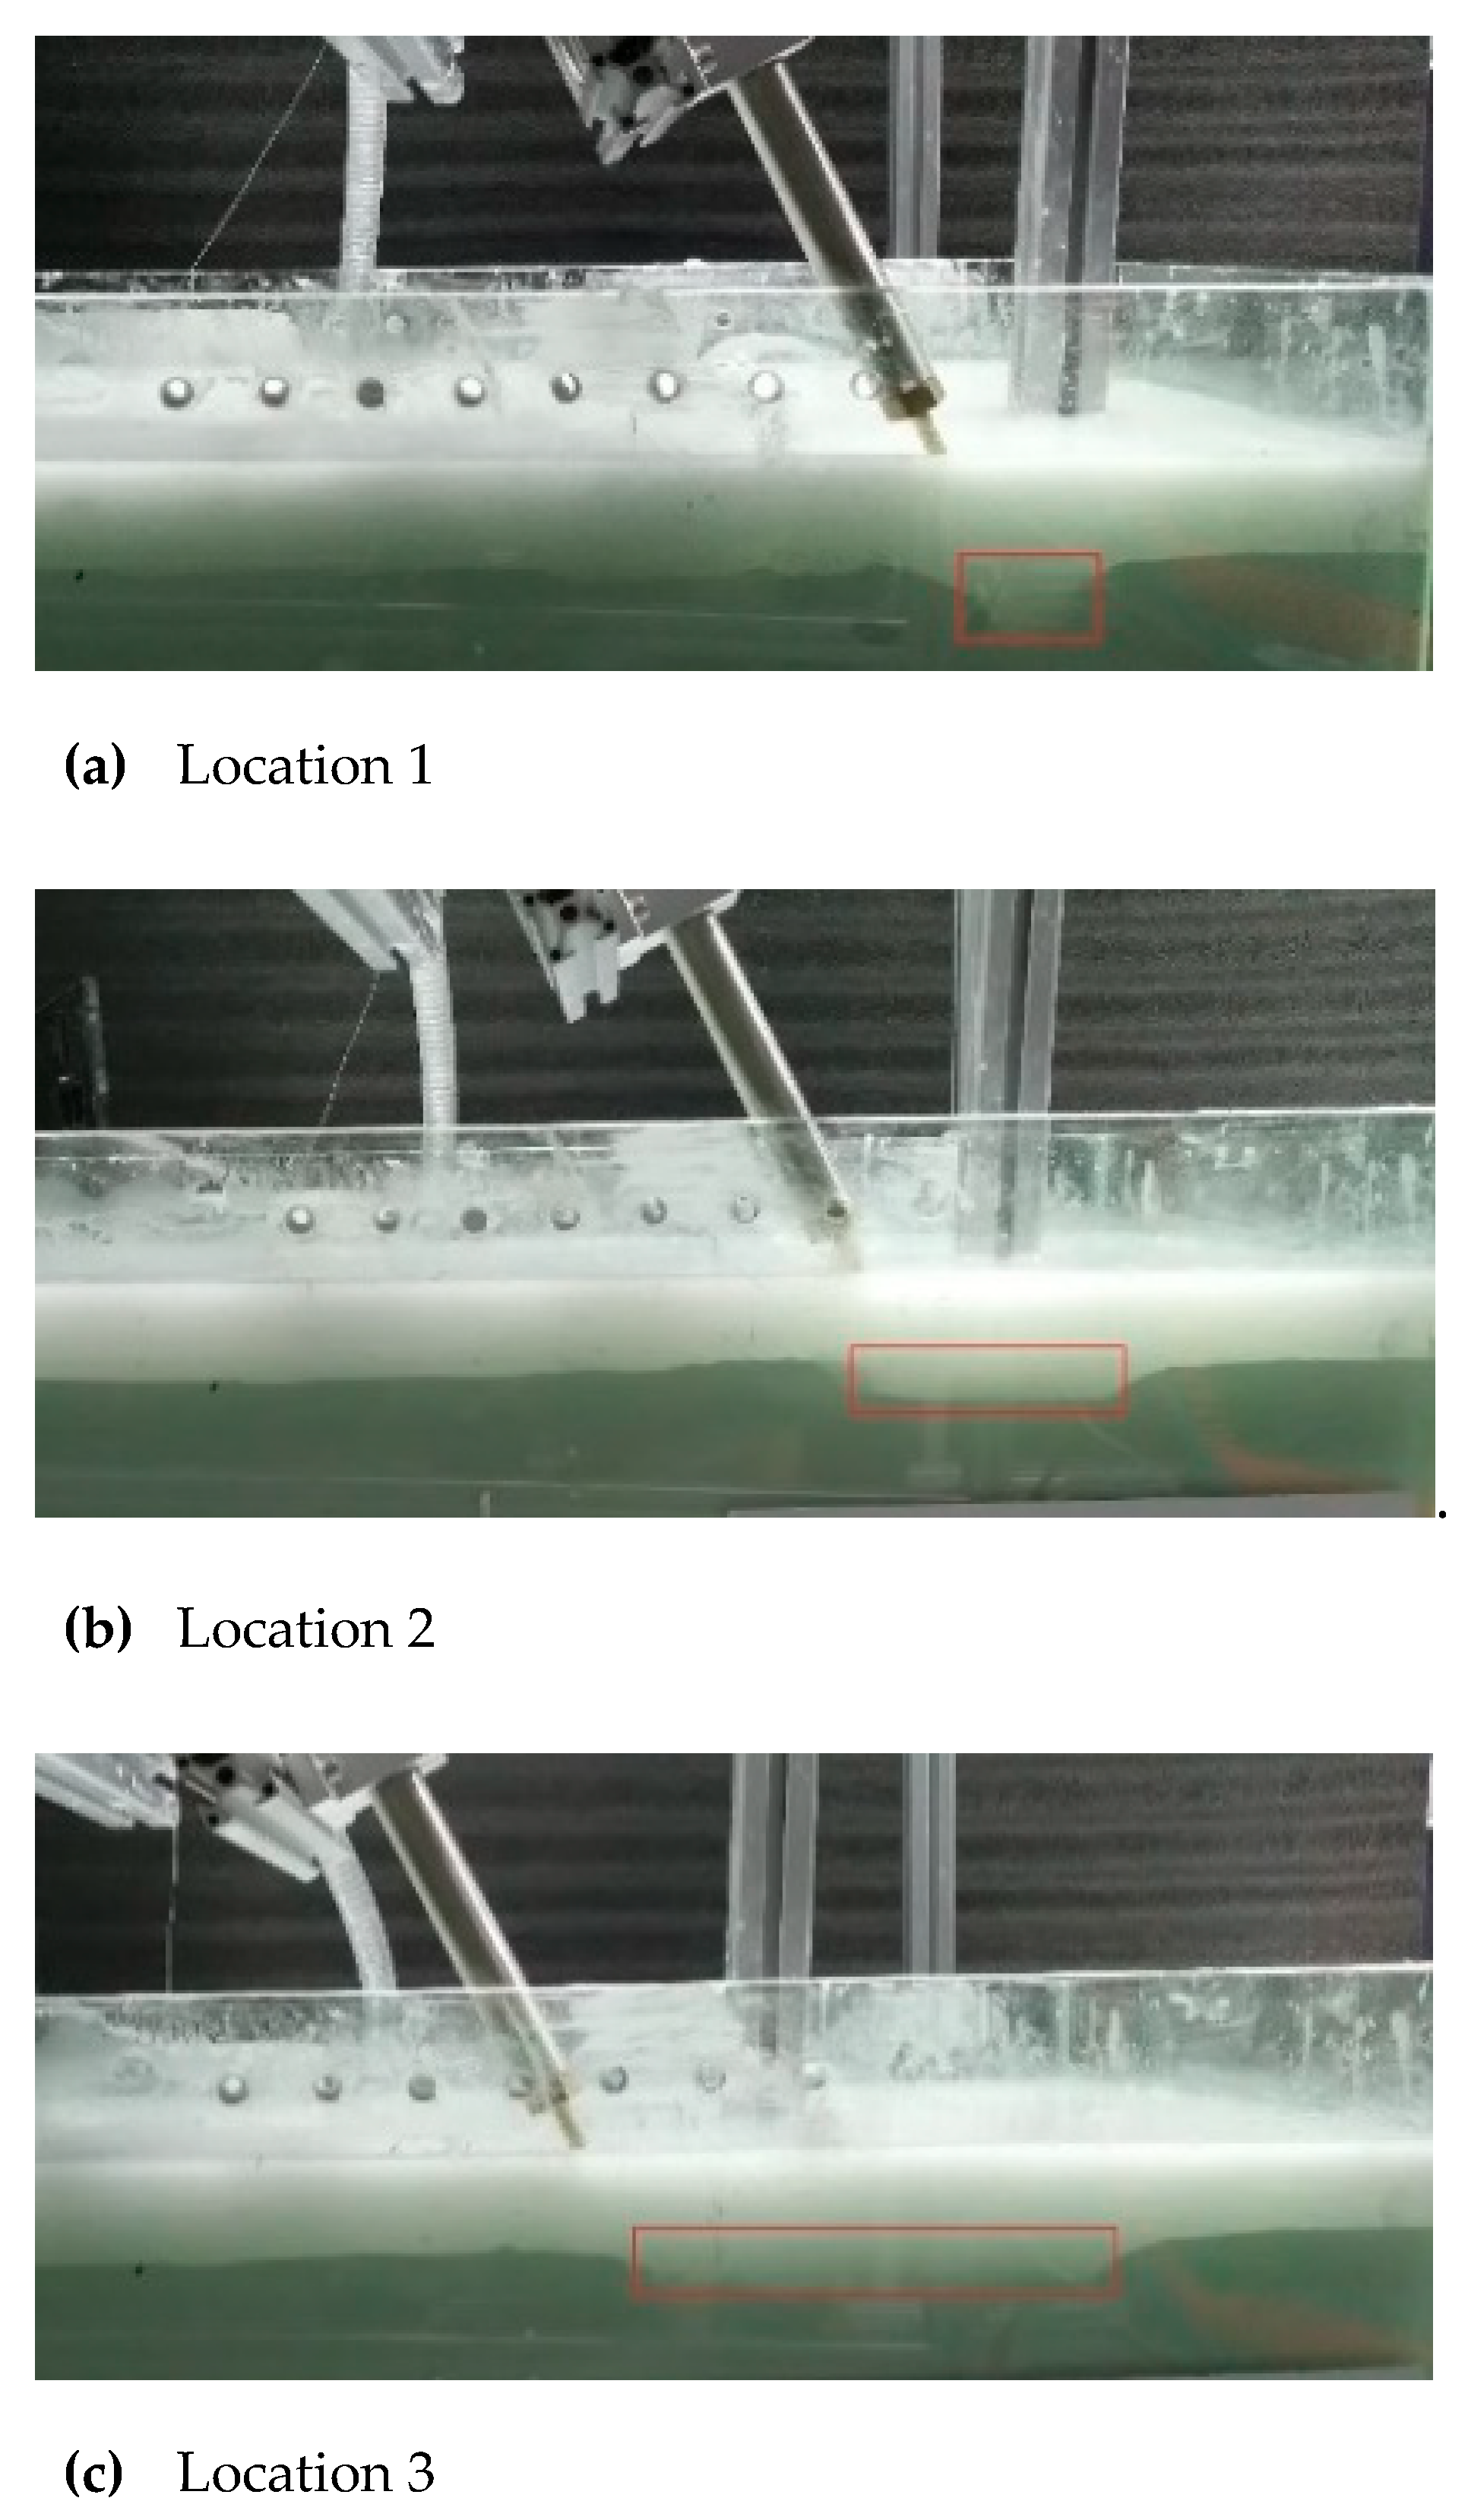
4.2.2. Dynamic Scouring Experiment

The dynamic scouring experiment mainly analyzes the influence of different scour angles and moving speeds of the scour platform on the scour effect. The maximum working speed of the laying machine is set as 150 m/h—that is, the maximum moving speed is 41.7 mm/s. Thus, 4 scour conditions are set in the experiment, as shown in Table 8, where the experiment is repeated twice for each group.
Figure 22 shows the change in the scour shape in the experiment at working condition 2. A deep scour pit is observed at the early stage of the experiment. Later, the overall scour depth decreases, and it is basically the same in the nozzle moving path. At the beginning of the scour, it can be approximated as static scour, forming a deeper scour pit. As the nozzle moves, the tilting nozzle flushes the sediment to the scour pits previously formed, resulting in a decrease in the scour depth [16].
Compared with the working condition 4 in the nozzle inclination variable experiment, the two working conditions only differ in the moving speed. It is obvious that the depth of the scour pit in the dynamic scouring condition is less than that in the static scouring condition. In the static scouring experiment, there is a lot of suspended sand in the scour pit during the scour process, and most of the suspended sand is settled during the mobile scour measurement, so the depth of the scour pit is smaller during dynamic scouring.
By comparing the results of working condition 3 and 4, it is found that the scour depth increases slightly when the scour angle increases. According to the results, the scour in all directions is equally difficult during the static scour, so the inclined scour has no advantage in the static scour experiment. On the contrary, it is easiest to scour the sediment backward for the dynamic scour experiment, as the inclined nozzle can flush the sediment into the scour pit formed by the previous period. Therefore, in the mobile scour experiment, increasing the jet inclination angle within a certain range can increase the scour sludge discharge effect.
Compared with the working conditions 1, 2, 3, and 5, the scour depth decreases slightly when the moving speed of the scour platform increases. In other words, for the substrate used in the experiment, the traveling speed change within a certain range has little influence on the trench depth and width.

5. Conclusions

The research shows that the depth of jet trenching first increases rapidly to a maximum value in a short period of time. As previously disturbed sediment is backfilled into the pit, the trench depth decreases to some extent. After some fluctuations, the trench depth finally settles at a certain value. The simulation result of sediment backfill is shown in Figure 23, and the backfilling effect is more obvious with the larger jet dip angle.
The experimental results show that, under the same jet conditions, the greater the standoff distance from the nozzle to the sediment surface, the greater the depth and width of the jet trenching will be, and the relationship between scouring performance and the standoff distance can be matched in terms of two exponential functions. Moreover, under the same jet conditions, with the increase in the fluid flow velocity, the depth and width of the trench will increase, the change rate of the trench depth will gradually increase, and the change rate of the trench width will gradually decrease. Their relationships can be fit into two opposite exponential curves. The jet angle also has an influence on the trench effect, and the trench depth of the trenching increases with the increase in the angle within 0–40°. Moreover, the trench depth can be improved by changing the spacing between nozzles. When the spacing increases to a certain value, the double-nozzle jet system becomes two independent single-nozzle jet systems, and its influence on the jet trenching depth becomes very small. The width of the jet is linearly related to the spacing between nozzles, and they change in the same direction.
The fitting functions of the burying results (depth and width) and jet flow rate, jet standoff distance, jet spacing and jet angle are shown in Table 9. The trenching ability of the laying machine can be effectively enhanced by adjusting the jet flow velocity and the jet standoff distance. When the operating power of the laying machine is constant, the working efficiency of the laying machine can be effectively improved by changing the configuration of the spray arm nozzle, such as the nozzle angle and nozzle spacing.
In the future, the authors will adjust the parameters (such as jet target distance, flow, angle, and nozzle spacing, etc.) of the hydraulic jet submarine cable laying machine on Qifan No. 9. On this basis, we will study whether the working efficiency of the machine has been significantly improved in actual applications.

Author Contributions

Methodology, Z.Y. and Z.L.; formal analysis, C.C., J.H. and Y.G.; investigation, J.H. and Y.G.; resources, Z.L.; data curation, Z.Y. and Y.G.; writing—original draft preparation, C.C.; writing—review and editing, C.C.; visualization, C.C.; project administration, J.C. and X.Z.; funding acquisition, J.C. and X.Z. All authors have read and agreed to the published version of the manuscript.

Funding

This research was supported by the Key Research and Development Project of Zhejiang Province (2019C03115).

Conflicts of Interest

The authors declare no conflict of interest.

References

  1. Mei, X.; He, C.; Huang, X. Study on sea surface monitoring scheme of submarine cable routing in Hainan Networking Project. China Water Transp. 2011, 11, 86–87. [Google Scholar]
  2. Szyrowski, T.; Sharma, S.; Sutton, R.; A Kennedy, G. Developments in subsea power and telecommunication cables detection: Part 2—Electromagnetic detection. Underw. Technol. 2013, 31, 133–143. [Google Scholar] [CrossRef]
  3. Carter, L.; Gavey, R.; Talling, P.; Liu, J. Insights into Submarine Geohazards from Breaks in Subsea Telecommunication Cables. Oceanography 2014, 27, 58–67. [Google Scholar] [CrossRef] [Green Version]
  4. Negishi, Y.; Ishihara, K.; Murakami, Y.; Yoshizawa, N. Design of Deep-Sea Submarine Optical Fiber Cable. IEEE J. Sel. Areas Commun. 1984, 2, 879–885. [Google Scholar] [CrossRef]
  5. Zajac, E.E. Dynamics and Kinematics of the Laying and Recovery of Submarine Cable. Bell Syst. Tech. J. 1957, 36, 1129–1207. [Google Scholar] [CrossRef]
  6. Choi, J.K.; Yokobiki, T.; Kawaguchi, K. Automated cable-laying system rov-based installation of donet2 ocean floor observatory. Sea Technol. 2015, 56, 43–55. [Google Scholar]
  7. Kurashima, T.; Horiguchi, T.; Yoshizawa, N.; Tada, H.; Tateda, M. Measurement of distributed strain due to laying and recovery of submarine optical fiber cable. Appl. Opt. 1991, 30, 334–337. [Google Scholar] [CrossRef]
  8. Prpi-Ori, J.; Nabergoj, R. Nonlinear dynamics of an elastic cable during laying operations in rough sea. Appl. Ocean. Res. 2005, 27, 255–264. [Google Scholar] [CrossRef]
  9. Vu, M.T.; Choi, H.; Ji, D.H.; Jeong, S.-K.; Kim, J.Y. A study on an up-milling rock crushing tool operation of an underwater tracked vehicle. Proc. Inst. Mech. Eng. Part M J. Eng. Marit. Environ. 2019, 233, 283–300. [Google Scholar] [CrossRef]
  10. Vu, M.T.; Choi, H.-S.; Kim, J.Y.; Tran, N.H. A study on an underwater tracked vehicle with a ladder trencher. Ocean Eng. 2016, 127, 90–102. [Google Scholar] [CrossRef]
  11. Vu, M.T.; Jeong, S.-K.; Choi, H.-S.; Oh, J.-Y.; Ji, D.-H. Study on down-cutting ladder trencher of an underwater construction robot for seabed application. Appl. Ocean Res. 2018, 71, 90–104. [Google Scholar] [CrossRef]
  12. Vu, M.T.; Choi, H.-S.; Nguyen, N.D.; Kim, S.-K. Analytical design of an underwater construction robot on the slope with an up-cutting mode operation of a cutter bar. Appl. Ocean Res. 2019, 86, 289–309. [Google Scholar] [CrossRef]
  13. Aderibigbe, O.; Rajaratnam, N. Erosion of loose beds by submerged circular impinging vertical turbulent jets. J. Hydraul. Res. 1996, 34, 19–33. [Google Scholar] [CrossRef]
  14. Beltao, S.; Rajaratnam, N. Impinging circular turbulent jets. J. Hydraul. Div. 1974, 100, 1313–1328. [Google Scholar] [CrossRef]
  15. Beltao, S.; Rajaratnam, N. Impinging of axisymmentric developing jets. J. Hydraul. Div. 1977, 15, 311–326. [Google Scholar] [CrossRef]
  16. Qi, M.; Fu, R.; Chen, Z. Study on equilibrium scour depth of impinging jet. J. Hydrodyn. 2005, 20, 368–372. [Google Scholar]
  17. Li, F.; Du, J.; Shi, X.; Guo, W.; Wang, J. Research on the mechanism of hydraulic jet soil-breaking and its engineering application. Fluid Machinery. 1997, 25, 26–29. [Google Scholar]
  18. Kochin, N.E.; Kibel, I.A.; Roze, N.V.; Boyanovitch, D.; Radok, J.R.M.; Talbot, L. Theoretical Hydromechanics. Phys. Today 1966, 19, 76. [Google Scholar] [CrossRef]
  19. Fursikov, A.V.; Vishi, M.I. Mathematical problems of statistical hydromechanics. Math. It’s Appl. 1988, 39, 620–622. [Google Scholar]
  20. Einstein, H.A. The Bed-Load Function for Sediment Transportation in Open Channel Flows; US Department of Agriculture: Washington, DC, USA, 1950; pp. 12–35.
  21. Engelund, F.; Fredsøe, J. A Sediment Transport Model for Straight Alluvial Channels. Hydrol. Res. 1976, 7, 293–306. [Google Scholar] [CrossRef] [Green Version]
  22. Drew, D.A. Averaged Field Equations for Two-Phase Media. Stud. Appl. Math. 1971, 50, 133–166. [Google Scholar] [CrossRef]
  23. Ishii, M. Thermo-Fluid Dynamics Theory of Two-Phase Flow; Eyrolles: Paris, France, 1975; pp. 107–110. [Google Scholar]
  24. Enwald, H.; Peirano, E.; Almstedt, A.E. Eulerian two-phase flow theory applied to fluidization. Int. J. Multiph. Flow 1996, 22, 21–66. [Google Scholar] [CrossRef]
  25. Huai, W.-X.; Xue, W.-Y.; Qian, Z. Numerical Simulation of Sediment-Laden Jets in Static Uniform Environment using Eulerian Model. Eng. Appl. Comput. Fluid Mech. 2012, 6, 504–513. [Google Scholar] [CrossRef] [Green Version]
  26. Xue, W.-Y.; Huai, W.-X.; Li, Z.-W.; Zeng, Y.-H.; Qian, Z.; Yang, Z.-H.; Zhi-Wei, L.; Yu-Hong, Z.; Zhong-Hua, Y. Numerical simulation of scouring funnel in front of bottom orifice. J. Hydrodyn. 2013, 25, 471–480. [Google Scholar] [CrossRef]
  27. Mih, W.C.; Kabir, J. Impingement of water jets on non-uniform stream bed. J. Hydraul. Eng. 1983, 109, 536–548. [Google Scholar] [CrossRef]
  28. Bao, J.; Zhou, T.; Huang, M.; Hou, Z.; Perkins, W.; Harding, S.; Titzler, S.; Hammond, G.; Ren, H.; Thorne, P.; et al. Modulating factors of hydrologic exchanges in a large-scale river reach: Insights from three-dimensional computational fluid dynamics simulations. Hydrol. Process. 2018, 32, 3446–3463. [Google Scholar] [CrossRef]
  29. Ling, B.; Bao, J.; Oostrom, M.; Battiato, I.; Tartakovsky, A.M. Modeling variability in porescale multiphase flow experiments. Adv. Water Resour. 2017, 105, 29–38. [Google Scholar] [CrossRef]
  30. Aderibigbe, O.; Rajaratnam, N. Effect of Sediment Gradation on Erosion by Plane Turbulent Wall Jets. J. Hydraul. Eng. 1998, 124, 1034–1042. [Google Scholar] [CrossRef]
  31. Rajaratnam, N.; Mazurek, K.A. Erosion of Sand by Circular Impinging Water Jets with Small Tailwater. J. Hydraul. Eng. 2003, 129, 225–229. [Google Scholar] [CrossRef]
  32. Ansari, S.A.; Kothyari, U.C.; Raju, K.G.R. Influence of Cohesion on Scour under Submerged Circular Vertical Jets. J. Hydraul. Eng. 2003, 129, 1014–1019. [Google Scholar] [CrossRef]
  33. Ozan, A.Y.; Yüksel, Y. Simulation of a 3D submerged jet flow around a pile. Ocean Eng. 2010, 37, 819–832. [Google Scholar] [CrossRef]
  34. Lei, G.U.; Yan, N.I.; Jiali, H.; Fusheng, N.I. Experimental study on the sand scouring by submerged vertical plane jet. Yellow River 2019, 41, 38–43. [Google Scholar]
  35. Roulund, A.; Sumer, B.M.; Fredsøe, J.; Michelsen, J. Numerical and experimental investigation of flow and scour around a circular pile. J. Fluid Mech. 2005, 534, 351–401. [Google Scholar] [CrossRef]
Figure 1. Qifan No. 9 with a cable capacity of 5000 tons.
Jmse 09 00745 g001
Figure 2. The hydraulic jet submarine cable laying machine.
Jmse 09 00745 g002
Figure 3. The schematic diagram of soil-breaking of vertical impinging jet.
Jmse 09 00745 g003
Figure 4. The schematic diagram of soil-breaking of oblique impinging jet.
Jmse 09 00745 g004
Figure 5. The dual-nozzle numerical simulation model.
Jmse 09 00745 g005
Figure 6. The relationship between scour depth and time at different standoff distances.
Jmse 09 00745 g006
Figure 7. The correlation curve of scouring performance and standoff distance.
Jmse 09 00745 g007
Figure 8. The relationship between scour depth and time at different flow rates.
Jmse 09 00745 g008
Figure 9. The correlation curve of scouring performance and flow rates.
Jmse 09 00745 g009
Figure 10. Numerical simulation results of different jet angles.
Jmse 09 00745 g010
Figure 11. The relationship between scour depth and time at different jet angles.
Jmse 09 00745 g011
Figure 12. The correlation curve of scour depth and jet angle.
Jmse 09 00745 g012
Figure 13. The correlation curve of scour width and jet angle.
Jmse 09 00745 g013
Figure 14. The correlation curve of scour width and jet angle.
Jmse 09 00745 g014
Figure 15. The relationship between scour depth and time at different jet spacing values.
Jmse 09 00745 g015
Figure 16. The correlation curve of scour width and jet spacing.
Jmse 09 00745 g016
Figure 17. Schematic diagram of experimental analysis platform and observation platform.
Jmse 09 00745 g017
Figure 18. The experimental platform for soil-breaking of hydraulic jet.
Jmse 09 00745 g018
Figure 19. Scour depth and width at different standoff distances of the nozzle.
Jmse 09 00745 g019
Figure 20. Scour depth and width at different jet inclination angles.
Jmse 09 00745 g020
Figure 21. Scour depth and width at different jet flows.
Jmse 09 00745 g021
Figure 22. The scour contour of working condition 2.
Jmse 09 00745 g022
Figure 23. The experimental platform for soil-breaking of hydraulic jet.
Jmse 09 00745 g023
Table 1. The numerical simulation result of sediment backfills.
Soil ParametersValue
shear strength τf54 kPa
critical pressure of failure surface Fcr0.23 MPa
soil particles limited size d601.2 mm
density ρ2560 kg/m3
turbulent Prandtl number Pr0.9
particle distribution size (Sauter average diameter)1 mm
Table 2. Experimental parameters and numerical simulation parameters.
Related ParametersExperimental PrototypeSimulation Parameters (Engineering Embedding Machine)
scale factor110
nozzle diameter6 mm60 mm
jet flow rate(1.61–10.73) × 10−3 m3/min(0.509–3.393) m3/min
jet standoff distance0–140 mm0–1400 mm
jet angle0–90°0–90°
shear strength of soil5.4 kPa54 kPa
Table 3. Experimental restriction conditions.
ParametersValue
scour angle90°
jet standoff distance30 mm
scour flow rate3.75 × 10−3 m3/min
nozzle diameter6 mm
Table 4. Comparison between numerical simulation results and experimental results.
Nozzle DiametersScour Depth (mm)Scour Width (mm)
SimulationExperimentSimulationExperiment
60 mm/6 mm193.2319884.2478
Table 5. Scouring effect at different standoff distances of nozzle.
Working ConditionFlow Rate
(×10−3 m3/min)
Nozzle Diameter (mm)Standoff Distance (mm)Angle (°)Scouring Width (mm)Scouring Depth (mm)
13.75609063.3229.5
23.756109068.1221.7
33.756209073.5210.3
43.756309089.5196.8
53.7564090111.3177.1
63.7565090129.3147.4
73.7566090165.2116.3
83.7567090209.477.3
Table 6. Scouring effect at different jet angles.
Working ConditionFlow Rate
(×10−3 m3/min)
Nozzle Diameter (mm)Standoff Distance (mm)Angle (°)Scouring Width (mm)Scouring Depth (mm)
13.7563090159.3147.6
23.7563080180.5108.4
33.7563070187.093.0
43.7563060197.789.3
Table 7. Scouring effect at different jet flow rate.
Working ConditionFlow Rate
(×10−3 m3/min)
Nozzle Diameter (mm)Standoff Distance (mm)Angle (°)Scouring Width (mm)Scouring Depth (mm)
11.6163090108.574.9
22.68263090153.183.7
33.75463090198.089.8
45.36363090240.1108.0
56.43863090281.7134.6
68.04863090291.1174.1
710.7363090290.4218.9
Table 8. Scouring effect of dynamic scour.
Working ConditionFlow Rate (×10−3 m3/min)Nozzle Diameter (mm)Standoff Distance (mm)Moving Speed (mm/s)Angle (°)
13.756301090
23.756302090
33.756303060
43.756303090
53.7563041.760
Table 9. Relation fitting functions.
CurveFitting Function
depth–velocityf(x) = 0.0015x2.071 + 0.0572
width–velocityf(x) = 0.4808x0.2559
depth–standoff distancef(x) = 0.047x−1.365
width–standoff distancef(x) = 0.2671x−0.9791
depth–nozzle spacingf(x) = 0.974x + 0.58
depth–jet anglef(x) = 0.0025x + 0.235
Publisher’s Note: MDPI stays neutral with regard to jurisdictional claims in published maps and institutional affiliations.

