Abstract
The national measures in several European countries during the COVID-19 pandemic also affected offshore human activities, including shipping. In this work, the temporal and spatial variations of shipping sound are calculated for the years before and during the pandemic in selected shallow water test areas from the Southern North Sea and the Adriatic Sea. First, the monthly sound pressure level maps of ships and wind between 2017 and 2020 are calculated for frequencies between 100 Hz to 10 kHz. Next, the monthly changes in these maps are compared. The asymptotic approximation of the hybrid flux-mode propagation model reduces the computational requirements for sound mapping simulations and facilitates the production of a large number of sound maps for different months, depths, frequencies, and ship categories. After the strictest COVID-19 measures were applied in April 2020, the largest decline was observed for the fishing, passenger and recreational ships. Although the changes in the number of fishing vessels are large, their contribution to the soundscape is minor due to their low source level. In both test areas, the spatial exceedance levels and acoustic energies were decreased in 2020 compared to the average of the previous three years.
1. Introduction
Anthropogenic underwater sound creates potential risk for marine life with its possible effects on communication, prey–predator relations, behavioral changes, and temporary and permanent effects on hearing [1,2,3]. Underwater noise international regulations [4,5,6] aim to avoid the potential impact of the underwater sound caused by anthropogenic activities. Sound maps are a cost-effective tool to evaluate and monitor the underwater sound characteristics over large areas, as they do not require large-scale measurements [7,8,9]. The North Sea and Adriatic Sea involve busy traffic lanes of various ship types [10]. Thus, it is crucial to monitor [11,12] and predict underwater sound, which is sensitive to temporal and spatial variations of the sound sources [13].
The offshore human activities’ temporal and spatial patterns were affected by the precautions against the spread of the COVID-19 due to the radical changes in transportation, tourism, fisheries, cargo, and constructions. According to March et al. [14], the number of ships and shipping densities at sea based on AIS data of the global ocean decreased after the WHO Pandemic Declaration on 11 March 2020 [15]. Based on statistics of port calls in the EU, the average decline over the first 49 weeks of 2020 compared to 2019 is 12.3 %, with the highest decline in chemical tankers, cruise, and passenger ships, especially around Croatia, Iceland, Slovenia, and Spain [16]. Another study also confirmed that the passenger ships were the most affected category during the pandemic in 2020, followed by the container ships [17]. The changes in the shipping traffic naturally led to changes in the shipping sound. The sound pressure levels around the Port of Vancouver decreased 1.5 dB due to the reduction in shipping traffic [18]. On the Oregon coast, the measurement showed the sound pressure level at 63 Hz third-octave band reduced in the spring of 2020 by about 1.6 dB compared to the prior five years [19]. In addition to the COVID-19 pandemic, other factors such as the oil crisis and Brexit in 2020 could influence the cargo and tanker shipping densities in the North Sea [14]. Because the ships are the most significant contributor to the North Sea underwater soundscape [13], a detailed investigation of shipping sound is essential for the pandemic-related changes in the shipping density.
In this work, the shipping sound is investigated before and during the pandemic for the selected shallow water test areas from the North Sea and the Adriatic Sea. First, the monthly averaged shipping densities [10] are investigated for the chosen years from January 2017 to December 2020. The shipping densities are used as an input to calculate the average source level depending on the number of ships per unit area. Next, the sound propagation is modeled with the asymptotic approach of hybrid mode-flux theory, which has comparable accuracy to adiabatic mode theory (within 1–1.5 dB) without requiring long computational time [20]. The adiabatic mode theory is usually used for the slowly varying bathymetry and environmental parameters. The computational efficiency of the proposed method allows the generation of a large number of sound maps with detailed spatial and spectral resolution without long computational times. Finally, the selected test areas’ monthly shipping and wind sound maps are calculated for 21 center decidecade frequencies from 100 Hz to 10 kHz. The comparison between these maps provides an insight into the temporal changes in the shipping sound before and during the pandemic. In Section 2, the model inputs such as the shipping density, bathymetry and source level are introduced. Next, the proposed underwater propagation model and its advantages for sound mapping are described in Section 3. Based on the model inputs and propagation model, sound maps for the selected test areas are calculated and compared before and during the pandemic in Section 4. Finally, the conclusions are discussed in Section 5.
2. Model Inputs: Shipping Densities and Bathymetry in the Test Areas
For the investigation of changes in sound pressure levels during the pandemic, two test areas were chosen. The first test area involves the entire Dutch, Belgian and German Exclusive Economic Zones in the Southern North Sea, and part of the Danish, British and French Exclusive Economic Zones. The second area is around the Gulf of Venice in the Adriatic Sea. These areas were chosen because of their high shipping density and shallow water depth. These two test areas and their bathymetries are shown in Figure 1 [21]. The ETRS89-Extended/LAEA Europe coordinate system (EPSG:3035) was used to calculate the compatibility with the EAA datasets [22].
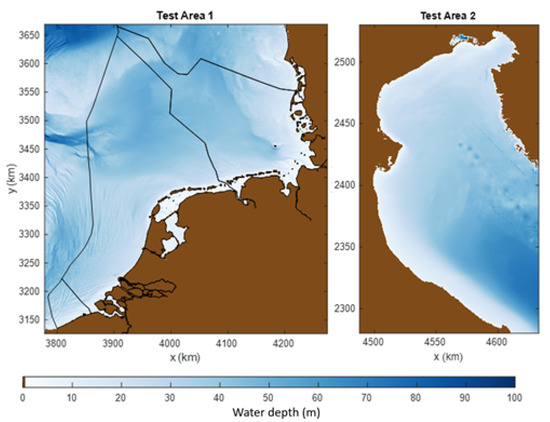
Figure 1.
The selected test areas and their bathymetries. Test area 1 (the Dutch, Belgian and German Exclusive Economic Zones in the Southern North Sea) and test area 2 (The Gulf of Venice). Test area 1 partly involves the Danish, French and English Exclusive Zones.
Shipping density maps based on AIS data provide the temporal and spatial distribution for various ship categories. The number of ships in the world fleet has increased in previous years [23,24] and is expected to increase in the future [25]. However, the number of ships is affected due to the various measures in EU countries during the pandemic. First, we analyzed the total number of ships three years earlier than the pandemic (in 2017, 2018 and 2019) and during the pandemic in 2020. Figure 2 shows the monthly variation of the total number of ships from the different categories in test areas 1 and 2.
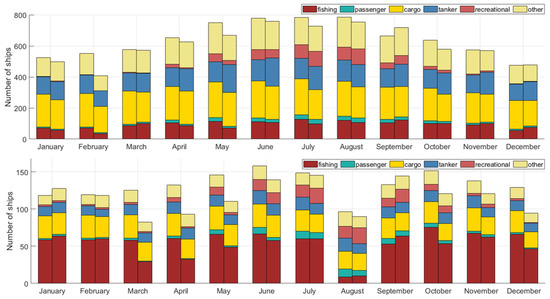
Figure 2.
The total number of ships in test area 1 (upper) and test area 2 (lower). The left bar of each month is for the 3-year average (from 2017 to 2019). The right bar of each month is for 2020. The different colors in the bars correspond to different ship categories.
The composition of ship densities differs between the test areas (Figure 2). Cargo ships and fishing vessels form the largest proportion in test areas 1 and 2, respectively. The smallest number of ships in test area 1 is observed in February 2020, with a noticeable decline in the tanker, cargo and fishing ships. This seems related to high wind speed due to the storms Ciara [26] and Dennis [27], which affected shipping traffic in the North Sea. In area 2, the smallest number of ships is observed in March 2020. Furthermore, fishing is prohibited in some areas during August, which leads to a smaller number of fishing vessels in that month [28]. As it can be noticed from the comparisons between test areas, monthly variations of the number of ships are different during the pandemic. This difference could be related to the composition of shipping densities, size of the areas and local measures against the pandemic in 2020. In test area 2, Italy was one the most affected countries and applied the first strict measures against the pandemic. In test area 2, a noticeable decline in the fishing vessels (which have the largest proportion of the number of ships in test area 2) compared to the prior years was observed in March 2020. Test area 1 is relatively larger than test area 2. Furthermore, test area 1 involves busy traffic lanes in the exclusive economic zones of different countries such as the Netherlands, Germany, Belgium, France, Denmark and the United Kingdom. Furthermore, the cargo and tanker ships with the largest proportion of ships in test area 1 have a lower proportional decline than the fishing vessels due to the pandemic. Thus, the impact of the national measures was not easily visible, as observed in test area 2.
The wind speed corresponding to the same months is shown in Figure 3. The wind speed dataset is based on the measurements that are freely accessible from the data portal of the Royal Netherlands Meteorological Institute (KNMI) [29] and were extrapolated over the sea by the analysis tools in the same data portal.
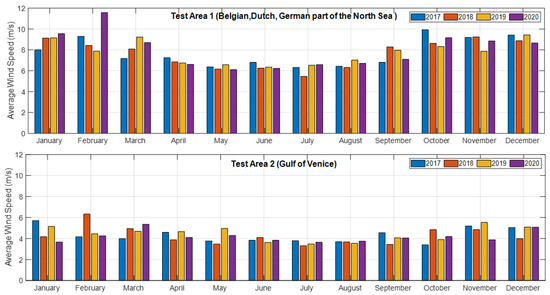
Figure 3.
Monthly variation of average wind speed in test areas 1 and 2 for 2017, 2018, 2019 and 2020.
The average wind speed in test area 1 was very high (11.8 m/s) during February 2020. These extreme weather conditions affected the shipping traffic for the corresponding month. The wind speed’s seasonal change can be seen in Figure 3, as low wind speed in the summer and high wind speed in the winter months.
When the strictest measures were taken in April 2020 by the European countries, the number of ships and their spatial distribution were changed. Figure 4 shows the shipping density maps of April (3-year average) and April 2020 [10]. The 3-year average is the average of the shipping densities’ in April 2017, April 2018 and April 2019.
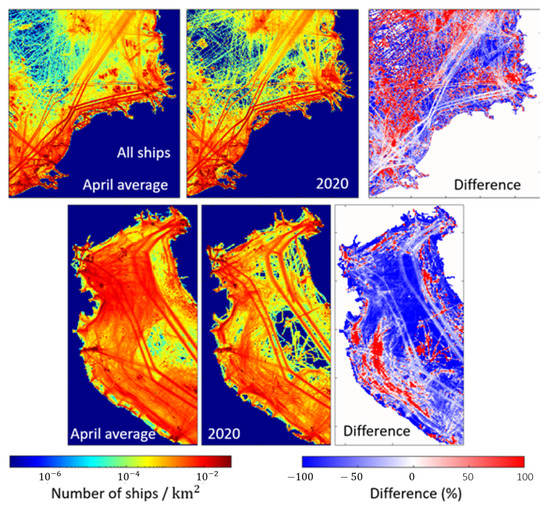
Figure 4.
The shipping densities (number of ships per km) of the test area 1 (upper) and test area 2 (below) for April Average (over April 2017, 2018 and 2019) and April 2020.
When we compared the April average of shipping density, the monthly averaged density of all ships decreased by approximately 8% and 13% in test areas 1 and 2, respectively. The differences between the selected ship types are visualized in Figure 5.
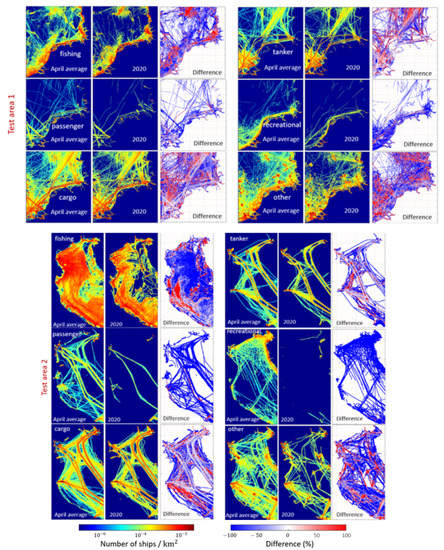
Figure 5.
The shipping densities (number of ships per km ) of the test area 1 (upper) and test area 2 (below) for April Average (over April 2017, 2018 and 2019) and April 2020.
Comparing the shipping densities of April Average and April 2020, each category has a different change during the pandemic. The fishing, passenger and recreational ships decreased most during April 2020 in both test areas. The total number of tankers slightly increased, related to increasing crude oil exports during the record falls in oil prices [14]. Shipping density-based sound maps can provide practical information related to the ship sound in the test areas. For more accurate sound maps, AIS-based sound maps can be calculated, including ship speed and length information. The AIS-based sound maps should be repeated for each time-snapshot to have an insight into the monthly and annual variation of the ship noise by requiring large computational time, disk space and memory. Alternatively, sound maps based on shipping density input require less computation. The balance between accuracy and computational load should be decided depending on the problem type. In this work, the long-term changes (from 2017 to 2020) are analyzed. Thus, the shipping density-based maps are calculated for practical reasons. In the shipping density dataset of EMODNET used here, all ships with AIS signals are included. However, some stationary ships with an active AIS such as passenger ships or service vessels may stand still for several hours close to the platforms and ports. In the calculations, these ships are first identified by comparing the available AIS data from the previous years. The locations of the stationary ships around the ports and platforms are estimated from these comparisons. For instance, some of the passenger ships waiting around the ports instead of their regular routes are assumed to be stationary based on these comparisons. The locations where the stationary ships are expected are excluded from the shipping densities. There may be more stationary ships far from the ports, platforms, and seashores that cannot be easily identified without the speed information; thus, the AIS-based sound maps that consider the speed and length of the vessels could provide more detailed results. However, AIS-based sound maps require more computation than shipping density-based sound maps and when a long-term trend is investigated, as in this study, over a large area.
The average source level of the ships was modified according to the number of ships in the ship source location; that information is obtained from the shipping density maps. A source-level that takes into account ship speeds, type and lengths [30] was used based on the measurements during the Joint North Sea Monitoring Program (JOMOPANS) [11]. In Figure 6, the source level for the different ship categories is shown. The average speed and length values were used for the different categories since the used shipping density dataset does not have these details.
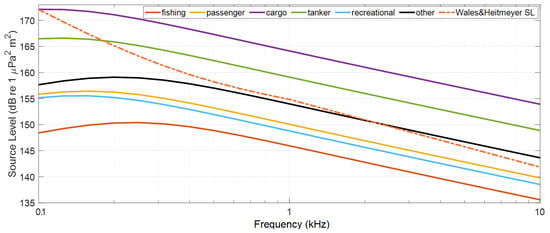
Figure 6.
Source level of different ship categories based on the formulas from MacGillivray and de Jong [30] and Wales and Heitmeyer [31].
Due to the use of different source levels in each category, the contribution of the different ship categories to the underwater sound pressure levels are different. Some of the previous works of sound maps [13] often uses the Wales and Heitmeyer source level [31], which is based on the measurements of 272 merchant vessels in the Mediterranean Sea and Eastern Atlantic Ocean over 7 years (from 1985 to 1992). However, the Wales and Heitmeyer formula neglects the vessel speed and length, which can be critical for the sound mapping simulation. For instance, there is a large difference between the Wales–Heitmeyer source level and that of fishing ships, which may lead to misleading results if we would use the Wales and Heitmeyer formula for all ship categories, as described in Appendix B, especially for test area 2.
3. Sound Propagation Modeling
The method for modeling the underwater sound propagation can be chosen depending on the frequency range, water depth and environmental conditions (such as sediment type, sound speed profiles, etc.). For large-scale problems, the number of sources and receivers also plays a critical role in choosing a convenient model to find a balance between significant computational expenses and the accuracy. To overcome computational resource problems, a hybrid method based on normal mode and flux theories [20], called SOPRANO (Sound Propagation Algorithm for Noise Mapping), brings together the accuracy of the adiabatic range dependent normal mode and the speed of Weston’s flux theories for shallow water propagation problems [32]. SOPRANO considers bathymetric variations and range-dependent sediment properties. The accuracy of SOPRANO was verified against a detailed multi-model comparison based on the propagation loss calculations of various methods (adiabatic mode theory, coupled modes, ray tracing, parabolic equation, and flux theory) [20] and compared with the measurements for shipping [33] and explosions [34]. These benchmark studies showed that the propagation loss (PL) for a variable sediment type and bathymetry is similar in accuracy to the adiabatic mode theory. SOPRANO is freely available for research purposes from the underwater acoustic simulation tools webpage of TU Delft [35]. Despite the computational benefits of SOPRANO, sound mapping simulations can sometimes require a more practical model than SOPRANO. For these simulations, alternatively, an asymptotic approximation of SOPRANO’s is preferred for fast calculations in the mode-stripping region, especially at high frequencies when the mode-contribution is relatively small. M-SOPRANO is another implementation of hybrid mode-flux formulation, where the solution of flux integral is replaced with its asymptotic approximation (as described in Equation (13) in Sertlek et al. [20]). The formulation is described in detail in Appendix A. In Figure 7, propagation loss (PL) calculations of different methods are compared for a realistic North Sea water depth profile. Results obtained by SOPRANO, M-SOPRANO and KRAKENC with the adiabatic approximation were considered. Comparisons were made for 250 Hz, 1 kHz and 2.5 kHz, to a maximum range of 100 km. The depth and range resolutions were chosen as 0.1 and 5 m, respectively, while the source depth is 6 m.
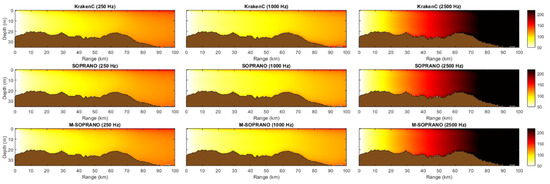
Figure 7.
Comparisons for the propagation loss (dB re 1 m) at 250 Hz, 1 kHz and 2.5 kHz with KRAKENC (upper), SOPRANO (middle) and M-SOPRANO (lower).
The differences between KRAKENC and SOPRANO are less than 0.9 dB, except for the receiver close to the seabed for the selected bathymetry. KRAKENC uses a stair-step approximation, which differs from the piecewise linear approximation of SOPRANO. Thus, the differences between KRAKENC and SOPRANO results increase ( 1.8 dB for 0.5 m above the sediment ) when the receiver points are close to the seabed. The differences between SOPRANO and M-SOPRANO were investigated with systematic tests, including various frequencies, receiver depths and bathymetry slices. Figure 8 shows propagation loss vs. frequency comparisons for specified ranges between 500 m and 100 km. Mean-square sound pressure is averaged over the water depth (dz = 0.01 m).
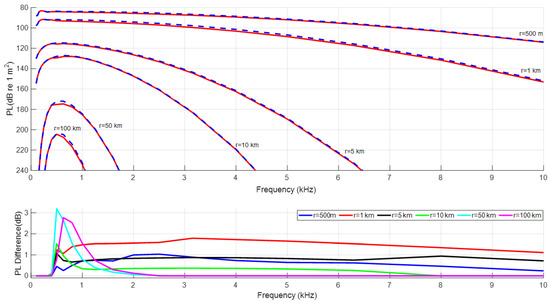
Figure 8.
PL vs. frequency comparisons for the different distances over a range-dependent bathymetry. The dashed blue curve is M-Soprano. The red curve is Soprano. The lower figure shows the differences between SOPRANO and M-SOPRANO at different distances, i.e., 500 m, 1 km, 5 km, 10 km, 50 km and 100 km. PL Difference is .
SOPRANO and M-SOPRANO both use the same mode sum up to 400 Hz, which makes the difference zero in this frequency range. The asymptotic approach over-predicts the propagation loss up to 3.2 dB for frequencies below 1 kHz. For increasing range and frequency, the differences are less than 1 dB after a few kilometers. Based on the convergence tests, the total number of the discrete modes in the mode sum was chosen as M = 10. When more discrete modes propagate, the asymptotic solution of mode-flux integral is used. Figure 9 shows calculation times at the same bathymetry slice (Figure 7).

Figure 9.
Comparisons for the calculation time of KRAKENC, SOPRANO and M-SOPRANO for an arbitrary bathymetry.
Figure 9 shows that SOPRANO and M-SOPRANO’s calculation times do not depend on frequency, while KRAKENC does. M-SOPRANO is approximately 720 times faster than SOPRANO for all frequencies. Although the flux-integral of SOPRANO is equal to zero up to 400 Hz, this integral is still numerically evaluated. Thus, the calculation times are different up to 400 Hz. For 10 kHz, M-SOPRANO is approximately 70,000 times faster than KRAKENC for the selected case. The use of M-SOPRANO decreases the computational times further with an accuracy within 1 dB above 1 kHz for the shallow water bathymetry (20–25 m). For low frequencies (<1 kHz) and short ranges (<5 km), an exact solution of mode-flux integral or mode-theory can be used.
4. Sound Maps of Ship and Wind
In this section, sound pressure level (SPL) maps are calculated based on monthly shipping densities between January 2017 and December 2020. The calculations are performed for the center frequencies of decidecade bands (100 Hz to 10 kHz) [36]. Although the source level formula of ships is described at lower frequencies than 100 Hz, some part of the frequency range is usually below the cut-off frequency in the test areas. The mode sum part of the hybrid solution uses only discrete modes above the cut-off frequency. The calculation of propagation loss in a range-dependent waveguide below the cut-off frequency requires more detailed propagation modeling, considering the effect of the evanescent field, which is not included in this paper. The asymptotic solution of mode-flux theory (M-SOPRANO) makes it possible to create a large number of different sound maps based on various source distributions, which is implemented for the large-scale problem with a high spatial and spectral resolution. A total of 3780 different monthly sound maps were calculated for the selected 5 ship categories (fishing, passenger, tanker, cargo, all ships), 4 years, 12 months and 21 frequencies. Each sound map contains 268832 point sources for test area 1 and 35,074 point sources for test area 2, located at the center of receiver cells. The receiver grid cell has a 1 × 1 km resolution, corresponding to a spatial observation window of 1 km. Propagation loss was calculated at 10 different receiver depths for the selected radial slices over the test area’s bathymetry with 100 m range steps to include the bathymetric changes accurately. For each source, 120 radial slices were used. This selected resolution requires 32.3 million and 4.2 million radial slices for test areas 1 and 2, respectively. Mean-square sound pressure was spatially averaged over receiver cell and receiver depths, as described by Equations (1) and (2) of Sertlek et al. [13]. Figure 10 and Figure 11 show the monthly averaged shipping sound maps of test areas 1 and 2. The month average maps are averaged from 2017 to 2019 as a pre-pandemic reference map. Adding wind-generated sound pressure levels facilitates realistic results at high frequency. First, monthly wind sound maps were calculated based on the wind speed data [29] and added to the ship sound maps. Next, monthly shipping and wind sound maps were compared for the different years. Wind generated sound was modeled using the analytical approach of Ainslie et al. [37], which assumes a constant water depth for each source cells. This constant water depth was calculated as an average water depth of each source cell. Based on the wind speed data [29], wind source is described as a sheet dipole source [38,39,40].
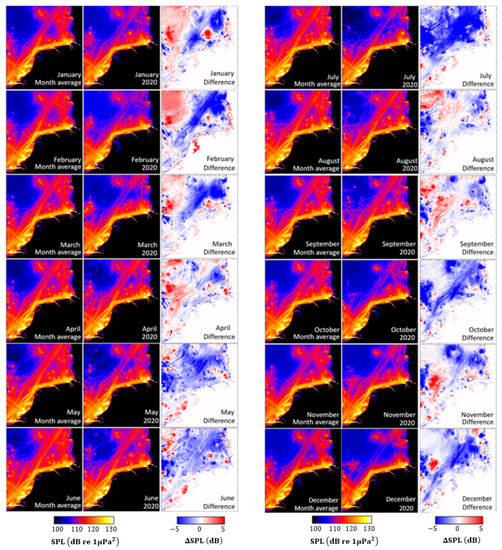
Figure 10.
The monthly averaged sound maps before (as a month-average of 2017 to 2019 sound maps) and during the pandemic (2020) in test area 1. The frequency band is from 100 Hz to 10 kHz.
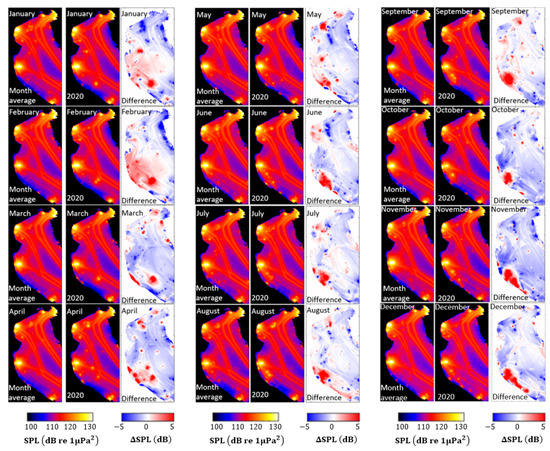
Figure 11.
The monthly averaged sound maps before (as a month-average of 2017 to 2019 sound maps) and during the pandemic (2020) in test area 2. The frequency band is from 100 Hz to 10 kHz.
The smallest and largest variations are observed in the Belgian and German parts of the North Sea, respectively. The UK, Danish and French parts of the North Sea are not completely included in this study. The changes are related to the number of ships in the different categories and included ship lanes in the selected areas. The Belgian North Sea, which is smaller than the Dutch and German parts of the North Sea, involves the busy main ship lanes (Figure 2). When the strictest COVID-19 measures were applied during April 2020, the sound maps were investigated in detail for the selected ship categories of the fishing, passenger, tanker, cargo, recreational and sum of all ship categories. Figure 12 and Figure 13 show the April average’s shipping and wind sound maps (from 2017 to 2019) and 2020. The most significant decline was observed for the passenger, recreational and fishing ships when the strictest measures of COVID-19 were announced during April 2020. The sound from the tankers increased at the north of test areas 1 and 2.
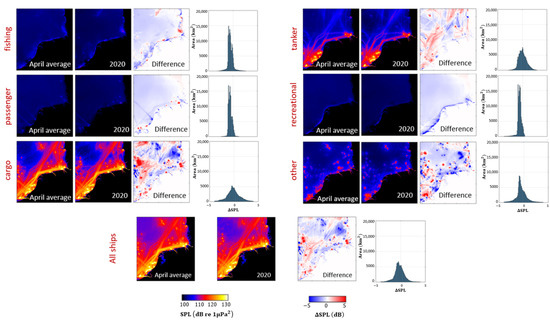
Figure 12.
Comparisons for the sound maps of April Average and April 2020 for 100 Hz to 10 kHz in test area 1. The histograms show the amount of the difference in SPL per km for test area 1.
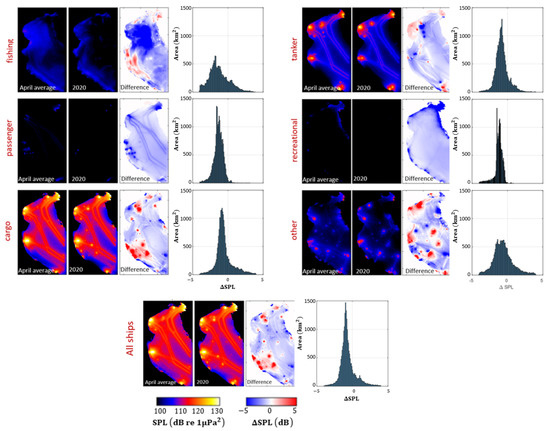
Figure 13.
Comparisons for the sound maps of April Average and April 2020 for 100 Hz to 10 kHz in test area 2. The histograms show the amount of the difference in SPL per km for test area 2.
Figure 12 and Figure 13 show that the contribution of each ship category is different based on their numbers and source levels. The contribution from fishing vessels is low despite the large number of shipping vessels (Figure 2). This is because the source level of fishing ships is the lowest between the selected categories in this work (Figure 6).
4.1. Comparison of the Exceedance Levels Based on the Spatial Distribution
Sound maps are calculated for each month for all ship categories. To quantify SPL changes before and during the pandemic, the spatial exceedance levels with the selected percentiles were compared. The ADEON terminology standard defines the N percent spatial exceedance level as “mean-square sound pressure level that is exceeded for N % of the space in a specified spatial analysis window” [41]. A 50% exceedance level corresponds to the median value of SPL. The 10% and 90% exceedance levels help to identify the contribution of very low and high SPL in the sound map, respectively. (The same method as Sertlek et al. [13] but with 25× higher spatial resolution in this work). The monthly variation of the 10%, 50% and 90% exceedance levels before and during the pandemic is shown in Figure 14. The spatial analysis window size is 1 km, equal to the receiver grid size of the sound maps.
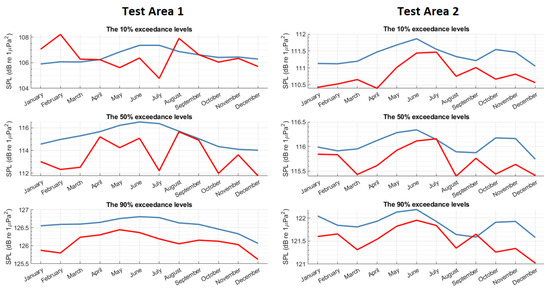
Figure 14.
Comparisons for the spatial exceedance levels for 100 Hz to 10 kHz decidecade frequency bands in the test areas. The blue curve is the 2017–2019 average for each month. The red curve is the spatial exceedance levels of 2020.
These comparisons show that the 2020 spatial exceedance levels are lower than the 3-year monthly average for most of the areas. The 3-year monthly average is smoother because it is calculated as an average of three years’ curves (2017, 2018 and 2019). The difference is more significant during the winter months, when the pandemic started. Furthermore, in the same period, the oil crisis affected the number of tankers around Europe. With the strictest measures in April 2020, the shipping sound stays lower than in previous years, as seen from the 50% spatial exceedance levels.
4.2. Comparison of Total Acoustic Energies
The monthly total acoustic energy can help quantify the spectral and temporal differences. The energy density can help to compare the shipping sound in the different areas. Figure 15 shows the energy densities (left y axis) and energy (right y axis) for both areas for 100 Hz to 10 kHz. The observed maximum and minimum total energies are also marked for the month average bars.
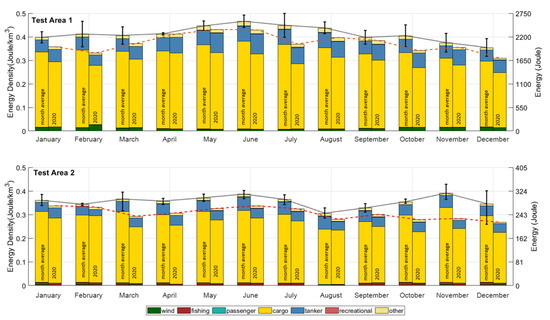
Figure 15.
Comparisons for the difference in monthly averaged total acoustic energy (right y-axis) and energy density (left y-axis) for 100 Hz to 10 kHz decidecade frequency bands. The dotted black curve is based on the month-average of energies between 2017 and 2019. The vertical bars indicate the minimum and maximum energies between 2017 and 2019. The dashed-red curve is the energy density during 2020. The bars show total and individual energy densities of selected ship categories and wind for the month average (left bars) and 2020 (right bars).
In test area 1, the acoustic energy differences were largest during the storms Ciara and Dennis [26,27], in February 2020. July 2020 also has less acoustic energy due to the decrease in the cargo vessels. A decrease in the fishing and passenger ships have a relatively minor contribution to the total acoustic energy. The increasing trend of the shipping sound slows down in contrast to the expected trend before the pandemic [25]. In Test area 2, the most significant decreases in acoustic energy were seen in March and November 2020. During summer, the shipping sound increased with the increasing mobility and relaxed pandemic regulations. The monthly-averaged energy in 2020 is lower than the 3-year month averages for all months in both test areas. For many months, the sound energy densities are even lower than the minimum from the previous 3 years (shown by black bars in Figure 15). The annual average energy density for test area 1 is larger than for test area 2. However, the difference in energy density during 2020 is larger in test area 2 than the test area 1. The month-specific local differences in the total energy can be observed as it was experienced during February 2020 due to the storms in the North Sea.
For the calculations of the sound maps and energies, the source levels of the different ship categories are considered, as mentioned in Section 2. If the Wales and Heitmeyer source level [31] model was used, thus applying the same source level for all ship categories, the contribution from the fishing, recreational and passenger vessels would be overestimated. Thus, it is important to use the category-specific source levels to avoid misleading results. In Appendix B, the sound maps and acoustic energies based on the source levels of Wales and Heitmeyer are compared with the proposed sound maps based on the source levels from MacGillivray and de Jong [30].
The spectral variation of acoustic energy density for different ship categories and wind are compared in Figure 16. The wind and ship energy densities were calculated based on the mathematical models described in the previous sections.
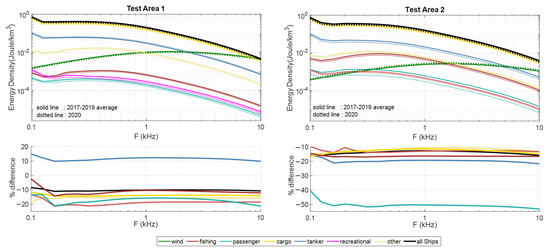
Figure 16.
Comparisons of the energy densities of different ship categories and wind for test area 1 (upper left) and test area 2 (upper right). The percentage differences for each ship categories are shown for test area 1 (lower left) and test area 2 (lower right).
In test area 1, the contribution of wind-generated acoustic energy density is lower than the total acoustic energy density of the ships up to 10 kHz. The largest and lowest contributions to acoustic energy density are from the tankers and passenger ships, respectively. The contribution of the wind noise is larger than fishing, passenger, and recreational ships. Although the contribution of tankers increased in test area 1, the contribution of all ships (black curve in Figure 16) declined about 10 % during the pandemic. In test area 2, the cargo and tanker categories are responsible from the largest contributions, respectively. The contribution of the fishing vessels are noticeable. The passenger ships have the largest decline in the energy density during the pandemic in 2020 in both test areas. The wind-generated acoustic energy density is lower in test area 2 than test area 1.
5. Conclusions and Discussion
The composition of the shipping densities from the various ship categories vary by time and area. This variation led to changes in the underwater sound pressure levels. This work analyzed the monthly changes in the shipping sound maps, the spatial exceedance levels and acoustic energies in the selected shallow water test areas from the Southern North Sea (test area 1) and the Adriatic Sea (test area 2), which had high shipping densities before the pandemic. Sound propagation was modeled with the asymptotic solution of the mode-flux integral when the propagating modes are larger than 10. The used propagation model had similar accuracy to the adiabatic mode theory, with errors less than 1 dB for ranges exceeding 1 km when multiple modes propagated in the selected test areas. This propagation method enabled the practical calculation of a large number of sound maps to analyze the temporal and spatial variations in detail over a large frequency band without requiring a long computation times.
The sound pressure levels due to the shipping activities decreased during the pandemic in 2020. The most significant fractional decrease in the total number of ships was observed for the passenger ships and fishing ships in both test areas. The differences between the monthly-averaged ship sound maps of 2020 and previous years were analyzed based on the 10%, 50% and 90% spatial exceedance levels. The 50% spatial exceedance level decreased up to 1.6 dB in test area 1 (includes entire Belgian, Dutch, German and partly the UK, French and Danish parts of the North Sea) and 0.7 dB in test area 2 (includes the Gulf of Venice).
The energy density is also a significant metric to compare the acoustic energies in different areas. In test area 1, the most significant differences in the acoustic energy density were observed in February and July 2020 as 0.06 J/km (14.2 % decline) and 0.05 J/km (11.1% decline). In test area 2, the change in the total energy density was around 0.05 J/km in March 2020, and it increases to 0.1 J/km in November. These changes correspond to a 13.5% and 25.6% decline in the total acoustic energy, respectively.
In both test areas, cargo vessels made the largest contribution to the total acoustic energy due to their high source level and large number (as shown by Figure 2 and Figure 6). The wind-generated acoustic energy was larger than the contribution of passenger, recreational and fishing vessels in the examined frequency band of 100 Hz–10 kHz in test area 1. Although the fishing vessels had large numbers, their contribution to the total acoustic energy was low. This showed the significance of the use of the convenient source-level formula for sound mapping.
The noise measurements from the noise monitoring programs in the test areas (JOMOPANS and SOUNDSCAPE) could be compared with the proposed model results. These comparisons between model and measurements could provide detailed validation for the spatial and temporal variation of sound pressure and improve the confidence in the simulations. In addition, the collected AIS dataset during these programs can help estimate the source level of each ship based on the actual ship speed and length, which can be used to create AIS-based sound maps for a specific time snapshot.
The biological relevance of the change in the sound pressure levels can be investigated by comparing with the fish and marine mammal distribution maps to analyze the potential impact of changed sound pressure levels on marine life during the same time period. In principle, the frequency weighting of these maps can help predict the possible impact on the marine animal’s hearing and behavior. A few dB decline in the sound pressure level can significantly extend the communication range of animals. These effects should be investigated as a multidisciplinary work between acousticians and biologists. The natural (such as rain, lightning, etc.) and other anthropogenic offshore activities (seismic airguns, pile driving, explosion, etc.) can be added to the proposed sound maps for the same time period to calculate the total soundscape of the selected areas.
Funding
This research received no external funding.
Acknowledgments
The author thanks Michael A. Ainslie for his extensive review, stimulating discussions and detailed comments, to Apostolos Tsouvalas for his review, encouragement, and support of this work, and to the EMODNET data portal, which makes the shipping density and bathymetry dataset freely available.
Conflicts of Interest
The author declares no conflict of interest.
Appendix A
The sound pressure level (SPL) is
The calculation of source level (SL) is based on the formula of MacGillivray and de Jong [30]. The propagation loss is defined as
where F is propagation factor [40]. Based the incoherent normal mode sum,
where and are horizontal and vertical eigenfunctions, respectively. Sertlek et al. [20] replaces this discrete mode sum with a continuous angle integral, which leads to
where is the water depth at range r, is receiver depth, is source depth, is the reflection coefficient of the seabed, and are the mode grazing angles at source and integrant range . represents the source and receiver depth weighting function (given by Equation (6) of Sertlek et al. [20]). For an exponential reflection coefficient, the angle integral can be analytically solved, and its asymptotic solution for the long ranges can be written as
where and is the sediment absorption coefficient, is the effective water depth (as described in Sertlek et al. [20] ), is the sediment absorption coefficient, is the wave number of the water layer, is the source depth, is the receiver depth and is the wave-shifted water depth.
Appendix B
Determining realistic source properties is critical for the sound mapping simulations. The Wales and Heitmeyer source level is widely used to represent the source level of ships in many underwater acoustic applications. The Wales and Heitmeyer formula is given as a function of frequency and compared with the measurements. MacGillivray and de Jong’s formulation [30] uses frequency and the vessel speed and length to calculate the source level for the different ship categories. If one compares two formulas, a significant difference can be observed for some ship categories such as fishing, passenger and cargo, as it was compared with the measurements in [30,42]. In this Appendix, the sound maps are calculated based on both two formulations. The obtained sound maps and differences are shown in Figure A1.
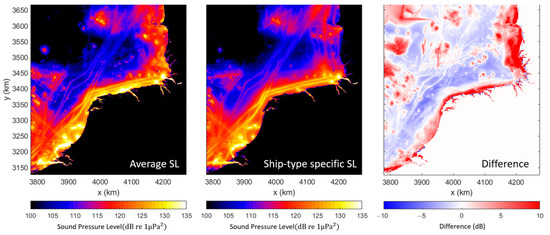
Figure A1.
Shipping sound maps for April in test area 1 based on Wales and Heitmeyer (left), and ship-type specific (middle) source levels are shown for 100 Hz to 10 kHz frequency bands. The differences (dB) between these maps are shown (right).
When the Wales and Heitmeyer source level is used, the sound pressure levels are overestimated at some areas, especially with the contribution of the fishing ships, and underestimated at the locations of cargo ships. The use of Wales and Heitmeyer formulations would lead to different total energy comparisons because of the assumption that all ship categories have identical source levels, as shown by Figure A2.
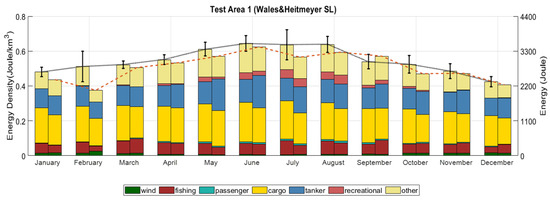
Figure A2.
Total acoustic energy (right y-axis) and energy density (left y-axis) based on Wales and Heitmeyer’s source level formula for 100 Hz to 10 kHz frequency bands. The black curve is the month average between 2017 and 2019, indicating the minimum and maximum energies. The red dashed curve is the energy density (and energy) for 2020. The bars show total and individual energy densities of selected ship categories and wind for the month average (left bars) and 2020 (right bars). The frequency range is from 100 Hz to 10 kHz.
In Figure A2, the modeled energy and energy densities are higher than in Figure 15. The total energy in September 2020 is even higher than the energy in the September average, which conflicts with the calculated results in this paper. Thus, the Wales and Heitmeyer source level should be carefully used to estimate the sound pressure level depending on the composition of the shipping density with various ship types. AIS-based sound maps can be preferred to increase the accuracy, including the exact shipping and length. However, depending on the size of the area and the number of ships, shipping density maps can be used for practical reasons.
References
- Slabbekoorn, H.; Bouton, N.; Opzeel, I.; Coers, A.; ten Cate, C.; Popper, A.N. A noisy spring: The impact of globally rising underwater sound levels on fish. Trends Ecol. Evol. 2010, 25, 419–427. [Google Scholar] [CrossRef] [PubMed] [Green Version]
- Rolland, R.M.; Parks, S.E.; Hunt, K.E.; Castellote, M.; Corkeron, P.J.; Nowacek, D.P.; Wasser, S.K.; Kraus, S.D. Evidence that ship noise increases stress in right whales. Proc. Biol. Sci. 2012, 279, 2363–2368. [Google Scholar] [CrossRef] [PubMed]
- Nowacek, D.P.; Johnson MPand Tyack, P.L. North Atlantic right whales (Eubalaena glacialis) ignore ships but respond to alerting stimuli. Proc. R. Soc. Lond. 2004, 271, 227–231. [Google Scholar] [CrossRef] [PubMed] [Green Version]
- Lucke, K.; Winter, E.; Lam, F.P.; Scowcroft, G.; Hawkins, A.; Popper, A.N. International harmonization of approaches to define underwater noise exposure criteria. J. Acoust. Soc. Am. 2014, 135, 2404. [Google Scholar] [CrossRef]
- EU 2008, Directive 2008/56/EC of the European Parliament and of the Council of 17 June 2008 Establishing a Framework for Community Action in the Field of Marine Environmental Policy (Marine Strategy Framework Directive). 2015. Available online: http://eur-lex.europa.eu/legal-content/en/txt/?uri=celex:32008l0056 (accessed on 20 May 2021).
- Andersson, M.H.; Andersson, S.; Ahlsén, J.; Andersson, B.L.; Hammar, J.; Persson, L.K.G.; Pihl, J.; Sigray, P.; Wikström, A. A framework for regulating underwater noise during pile driving. In A Technical Vindval Report; Swedish Environmental Protection Agency: Stockholm, Sweden, 2016. [Google Scholar]
- Colin, M.E.G.D.; Ainslie, M.A.; Binnerts, B.; de Jong, C.A.F.; Karasalo, I.; Östberg, M.; Sertlek, H.Ö.; Folegot, T.; Clorennec, D. Ship Noise Mapping in The North Sea. In Proceedings of the Underwater Acoustic Conference, Rhodos, Greece, 22–27 June 2014. [Google Scholar]
- Dekeling, R.P.; Tasker, M.L.; Van der Graaf, A.J.; Ainslie, M.A.; Andersson, M.H.; André, M.; Borsani, J.F.; Bresing, K.; Castellote, M.; Cronin, D.; et al. Monitoring Guidance for Underwater Noise in European Seas. Part I: Executive Summary; J.V. JRC Scientific and Policy Report EUR 26557 EN; Publications Office of the European Union: Luxembourg, 2014. [Google Scholar]
- Hatch, L.T.; Fristrup, K.M. No barrier at the boundaries: Implementing regional frameworks for noise management in protected natural areas. Mar. Ecol. Prog. Ser. 2009, 395, 223–244. [Google Scholar] [CrossRef] [Green Version]
- EMODNET Human Activities. Available online: https://www.emodnet-humanactivities.eu (accessed on 20 May 2021).
- JOMOPANS. Available online: https://northsearegion.eu/jomopans/ (accessed on 28 May 2021).
- SOUNDSCAPE. Available online: https://www.italy-croatia.eu/web/soundscape (accessed on 20 June 2021).
- Sertlek, H.Ö.; Ainslie, M.A.; Slabbekoorn, H.; ten Cate, C.J. Source-specific sound mapping: Spatial, temporal and spectral distribution of sound in the Dutch North Sea. Environ. Pollut. 2019, 247, 1143–1157. [Google Scholar] [CrossRef] [PubMed]
- March, D.; Metcalfe, K.; Tintoré, J.; Godley, B.J. Tracking the global reduction of marine traffic during the COVID-19 pandemic. Nat. Commun. 2021, 12, 2415. [Google Scholar] [CrossRef] [PubMed]
- WHO. Available online: https://www.euro.who.int/en/health-topics/health-emergencies/coronavirus-covid-19/news/news/2020/3/who-announces-covid-19-outbreak-a-pandemic (accessed on 2 March 2021).
- EMSA, Covid-19 Impact on Shipping. Available online: http://www.emsa.europa.eu/newsroom/latest-news/item/4395-may-2021-covid-19-impact-on-shipping-report.html (accessed on 28 May 2021).
- Millefiori, L.M.; Braca, P.; Zissis, D.; Spiliopoulos, G.; Marano, S.; Willett, P.K.; Carniel, S. COVID-19 Impact on Global Maritime Mobility, PREPRINT (Version 1) Available at Research Square. Available online: https://www.researchsquare.com/article/rs-100286/v1 (accessed on 19 June 2021).
- Thomson, D.J.M.; Barclay, D.R. Real-time observations of the impact of COVID-19 on underwater noise. J. Acoust. Soc. Am. 2020, 147, 3390. [Google Scholar] [CrossRef] [PubMed]
- Dahl, P.H.; Dall’Osto, D.R.; Harrington, M.J. Trends in low-frequency underwater noise off the Oregon coast and impacts of COVID-19 pandemic. J. Acoust. Soc. Am. 2021, 149, 4073. [Google Scholar] [CrossRef]
- Sertlek, H.Ö.; Ainslie, M.A.; Heaney, K. Analytical and Numerical Propagation Loss Predictions for Gradually Range-Dependent Isospeed Waveguides. IEEE J. Ocean. Eng. 2019, 44, 1240–1252. [Google Scholar] [CrossRef]
- EmodnetBathymetry. Available online: https://www.emodnet-bathymetry.eu (accessed on 20 May 2021).
- The EAA reference Grid. Available online: https://www.eea.europa.eu/data-and-maps/data/eea-reference-grids-1/about-the-eea-reference-grid/ (accessed on 20 May 2021).
- Hildebrand, J.A. Anthropogenic and natural sources of ambient noise in the ocean. Mar. Ecol. Prog. Ser. 2009, 395, 5–20. [Google Scholar] [CrossRef] [Green Version]
- Ainslie, M.A.; Andrew, R.K.; Howe, B.M.; Mercer, J.A. Temperature-driven seasonal and longer term changes in spatially averaged deep ocean ambient sound at frequencies 63–125 Hz. J. Acoust. Soc. Am. 2021, 149, 2531. [Google Scholar] [CrossRef] [PubMed]
- Sertlek, H.O.; Slabbekoorn, H.; Michael, A.A. The contribution of shipping sound to the dutch underwater soundscape: Past, present, future. Proc. Mtgs. Acoust. 2019, 37, 070010. [Google Scholar]
- Storm Wiki 1. Available online: https://en.wikipedia.org/wiki/Storm_Ciara (accessed on 20 May 2021).
- Storm Wiki 2. Available online: https://en.wikipedia.org/wiki/Storm_Dennis (accessed on 20 May 2021).
- OECD Report. Available online: https://www.oecd.org/eu/34431541.pdf (accessed on 20 May 2021).
- The Royal Netherlands Meteorological Institute (KNMI). Available online: https://climexp.knmi.nl (accessed on 20 May 2021).
- MacGillivray, A.; de Jong, C. A Reference Spectrum Model for Estimating Source Levels of Marine Shipping Based on Automated Identification System Data. J. Mar. Sci. Eng. 2021, 9, 369. [Google Scholar] [CrossRef]
- Wales, S.C.; Heitmeyer, R.M. An ensemble source spectra model for merchant ship-radiated noise. J. Acoust. Soc. Am. 2002, 111, 1211–1231. [Google Scholar] [CrossRef] [PubMed]
- Sertlek, H.Ö.; Ainslie, M.A. A depth-dependent formula for shallow water propagation. J. Acoust. Soc. Am. 2014, 136, 573–582. [Google Scholar] [CrossRef] [PubMed]
- Sertlek, H.Ö. Aria of the Dutch North Sea. Ph.D. Thesis, University of Leiden, Leiden, The Netherlands, 2016. [Google Scholar]
- Salomons, E.M.; Binnerts, B.; Betke, K.; von Benda-Beckmann, A.M. 2021, Noise of underwater explosions in the North Sea. A comparison of experimental data and model predictions. J. Acoust. Soc. Am. 2021, 149, 1878–1888. [Google Scholar] [CrossRef] [PubMed]
- TU Delft Underwater Acoustic Simulation Tools. Available online: ua.citg.tudelft.nl (accessed on 20 May 2021).
- ISO 18405. Available online: https://www.iso.org/standard/62406.html (accessed on 20 May 2021).
- Ainslie, M.A.; Harrison, C.H.; Zampolli, M. An analytical solution for signal, background and signal to background ratio for a low frequency active sonar in a Pekeris waveguide satisfying Lambert’s rule. In Proceedings of the 4th International Conference and Exhibition on Underwater Acoustic Measurements, Kos, Greece, 20–24 June 2011; pp. 491–498. [Google Scholar]
- Kuperman, W.A.; Ferla, M.C. A shallow water experiment to determine the source spectrum level of wind-generated noise. J. Acoust. Soc. Am. 1985, 77, 2067–2073. [Google Scholar] [CrossRef]
- APL-UW High-Frequency Ocean Environmental Acoustic Models Handbook; Applied physics Laboratory, University of Washington: Seattle, WA, USA, 1994.
- Ainslie, M.A. Principles of Sonar Performance Modeling; Springer: Berlin/Heidelberg, Germany; Praxis Publishing: Chichester, UK, 2010; pp. 32–58. [Google Scholar]
- Ainslie, M.A.; de Jong, C.A.F.; Martin, S.B.; Miksis-Olds, J.L.; Warren, J.D.; Heaney, K.D.; Hillis, C.A.; MacGillivray, A.O. Project Dictionary: Terminology Standard. Document 02075, Version 1, Technical Report by JASCO Applied Sciences for ADEON; University of New Hampshire: Durham, NC, USA, 2020. [Google Scholar]
- Jansen, E.; de Jong, C.A.F. Experimental Assessment of Underwater Acoustic Source Levels of Different Ship Types. IEEE J. Ocean Eng. 2017, 42, 439–448. [Google Scholar] [CrossRef]
Publisher’s Note: MDPI stays neutral with regard to jurisdictional claims in published maps and institutional affiliations. |
© 2021 by the author. Licensee MDPI, Basel, Switzerland. This article is an open access article distributed under the terms and conditions of the Creative Commons Attribution (CC BY) license (https://creativecommons.org/licenses/by/4.0/).