1. Introduction
Fire can create a tremendous hazard for offshore platforms and tends to spread due to hydrocarbons and combustible materials. Also, when isolated offshore, it is virtually impossible to expect rapid fire suppression from onshore facilities. Because of these characteristics, offshore platforms should consider fire safety from their early design stage and they are required to have rapid response capabilities with firefighting equipment [
1,
2].
In addition, deck space is a sparse resource on an offshore platform and is usually filled with complex jungles of pipes. Among these piping designs, in general, the piping for firefighting should be preceded by the layout design of the firefighting equipment on the platform. Conversely, most fire safety guidelines [
3,
4,
5,
6,
7] stipulate that the fire hydrants and fire extinguishers for the initial suppression in the event of a minor or large fire be placed within a certain distance from almost any route that can be moved by humans [
8,
9,
10,
11,
12]. The optimal design of the piping and firefighting equipment arrangement can greatly increase the safety of the offshore platform, so research on the optimal arrangement of fire hydrants/extinguishers for initial suppression is necessary.
2. Background
The purpose of this paper is to present the most efficient arrangement of fire extinguishers and fire hydrants for rapid suppression at the earlier design stage of offshore plants. In this process, the optimal arrangement of the firefighting equipment to maximize the coverage area on the complex offshore platform is sought. It is assumed that the amount of firefighting equipment is minimized while it is most accessible and is placed in a location preferred by the platform designer. Regarding the arrangement of portable firefighting equipment, only the manuals and regulations for each company or organization exist [
3,
4,
5,
6,
7], though little research from the viewpoint of layout optimization has been conducted.
The general problem of facility location has been researched extensively. This is an important element of the broader planning of public and private enterprises [
9,
10,
11,
12]. Among the models for this problem, most of the models that determine the number and location of facilities such as schools, police stations, bus stops, medical facilities, post offices, etc. are formulated as the set cover problem. Farahani summarized various models and solutions to solve the problem of facility location [
9]. When defining an area that a single facility can cover in the collective coverage problem of a given model, service is provided in a range that falls within a given critical distance [
13], and all the consumers are guaranteed service in at least one facility.
Unlike the urban planning facility layout problem, the arrangement of firefighting equipment should be designed with a rather conservative policy covering the entire area inside the offshore plant. Simplification such as a road network in urban planning may result in an uncovered area, which may be contrary to the design goal that prioritizes fire safety. The biggest problem is that, unlike the problem based on the road network, which usually is solved by Dijkstra algorithm [
14], the firefighting equipment arrangement must reflect movement in an arbitrary direction. As an area of research that reflects this movement in an arbitrary direction, there is any-angle path planning. Nash designed the Theta* algorithm, a method for real-time smoothing by determining the visibility in real time in the process of expanding the scope of exploration [
15]. Thorpe (1984) obtained the approximated shortest path by performing a best-first search with the A* algorithm while navigating the path of the mobile robot, enabling it to jump to a vertex with a smaller number of vertices and not connected by a mainline through post-smoothing [
16]. Yap devised a block A* method to calculate the distance between the non-adjacent vertices in advance and to find shorter paths using a precomputed database [
17]. Ferguson and Stentz proposed a field D* method that interpolates from other nodes to calculate the cost of movement for points in the air, not nodes [
18]. The theta* algorithm is a very powerful method in terms of path planning, but fundamentally this method is a one-to-one search focused on path planning [
15]. Therefore, there is a limitation that one-to-one route planning alone cannot achieve coverage areas where multiple arrival points can exist.
3. Proposed Method
Before optimization is carried out, one must first define how wide of a suppression area a single piece of firefighting equipment can cover. In terms of these fire suppression area and facility location problems, what is referred to as a coverage area is dependent on the travel distance specified in the firefighting equipment. The travel distance is the limit distance that is considered easy for a person to access in an emergency under the fire-related placement regulations. In other words, if the travel distance is 10 m, then everyone in the vicinity of 10 m can access it. In other words, for example, with a fire hydrant, all points that can be reached when a 10 m fire hose is extended to the maximum can be defined as the coverage area of the target fire hydrant—that is, a fire suppression area. This fire suppression range may vary depending on various conditions such as the location of the firefighting equipment, the travel distance, and the maximum water stream length from the fire hose.
The location of the firefighting equipment is the x,y coordinate of the target firefighting equipment when the entire design space is divided into a two-dimensional uniform grid. In the case of fire hydrants, the length of the fire hose is set. The length of the water stream is set when one considers the water sprayed from the equipment.
3.1. Definition of Input and Output
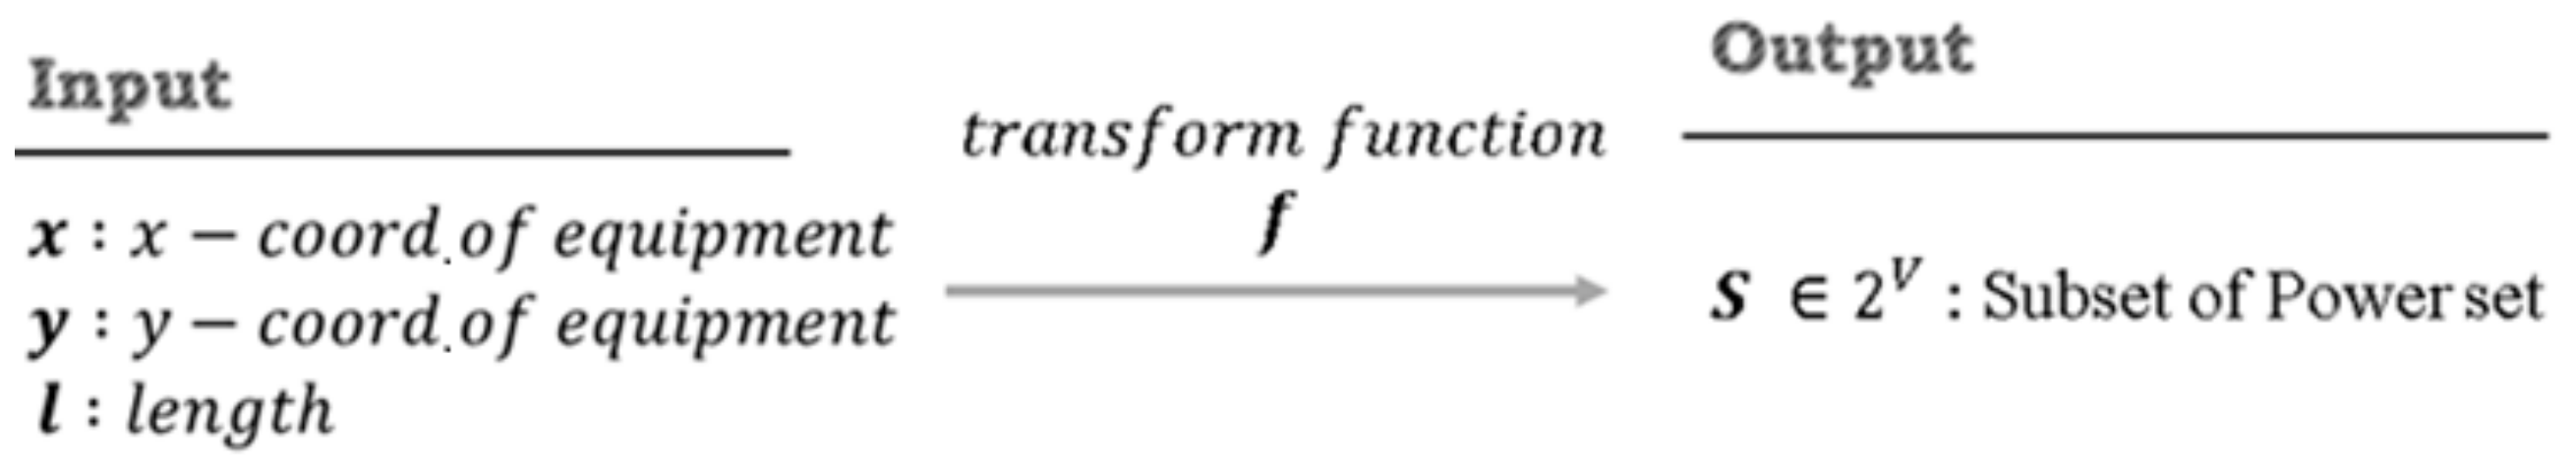
The process of obtaining the coverage area can be defined by the following conversion function
. As shown in
Figure 1, this function receives the
x,
y coordinates and travel distance
of the firefighting equipment to be placed on the grid graph as inputs and obtains the area covered by the corresponding firefighting equipment. This cover area is obtained in the form of a subset of the power set consisting of the vertices of a given grid graph. The power set
defined here is the vertices
of the grid graph
. When representing whether or not to cover with a Boolean of {0, 1}, it is a set that includes the number of all cases that can be represented by 0 and 1 for each vertex. For example, if the firefighting area of a piece of firefighting equipment includes 2 vertices
in a graph with a total of 3 vertices
, with the power set
representing all patterns covering the vertices
t can be said that we get a subset
as output.
3.2. Design Space
In this study, a given design space (plan view of the offshore platform) is approached from a discrete perspective. If approached in a continuous manner, the firefighting zone of the firefighting equipment cannot be represented as a subset of any overall design space with a finite number of elements. Instead, it can be expressed as a geometric formula within the design space, though this is also expressed as an irregular, geometrically complex formula when there are obstacles around it. To be precise, several sectors are represented in an overlapping form.
In this situation, when optimization is performed, a large number of quadratic equations must be solved over a wide domain by determining only whether or not the firefighting areas overlap, and the amount of overlapping of several pieces of firefighting equipment. This is very inefficient. In addition, because one of the discrete optimization problems, the set cover optimization problem, is already an NP-hard problem from a discrete point of view, it is inefficient to try to solve a more complex continuous model [
19].
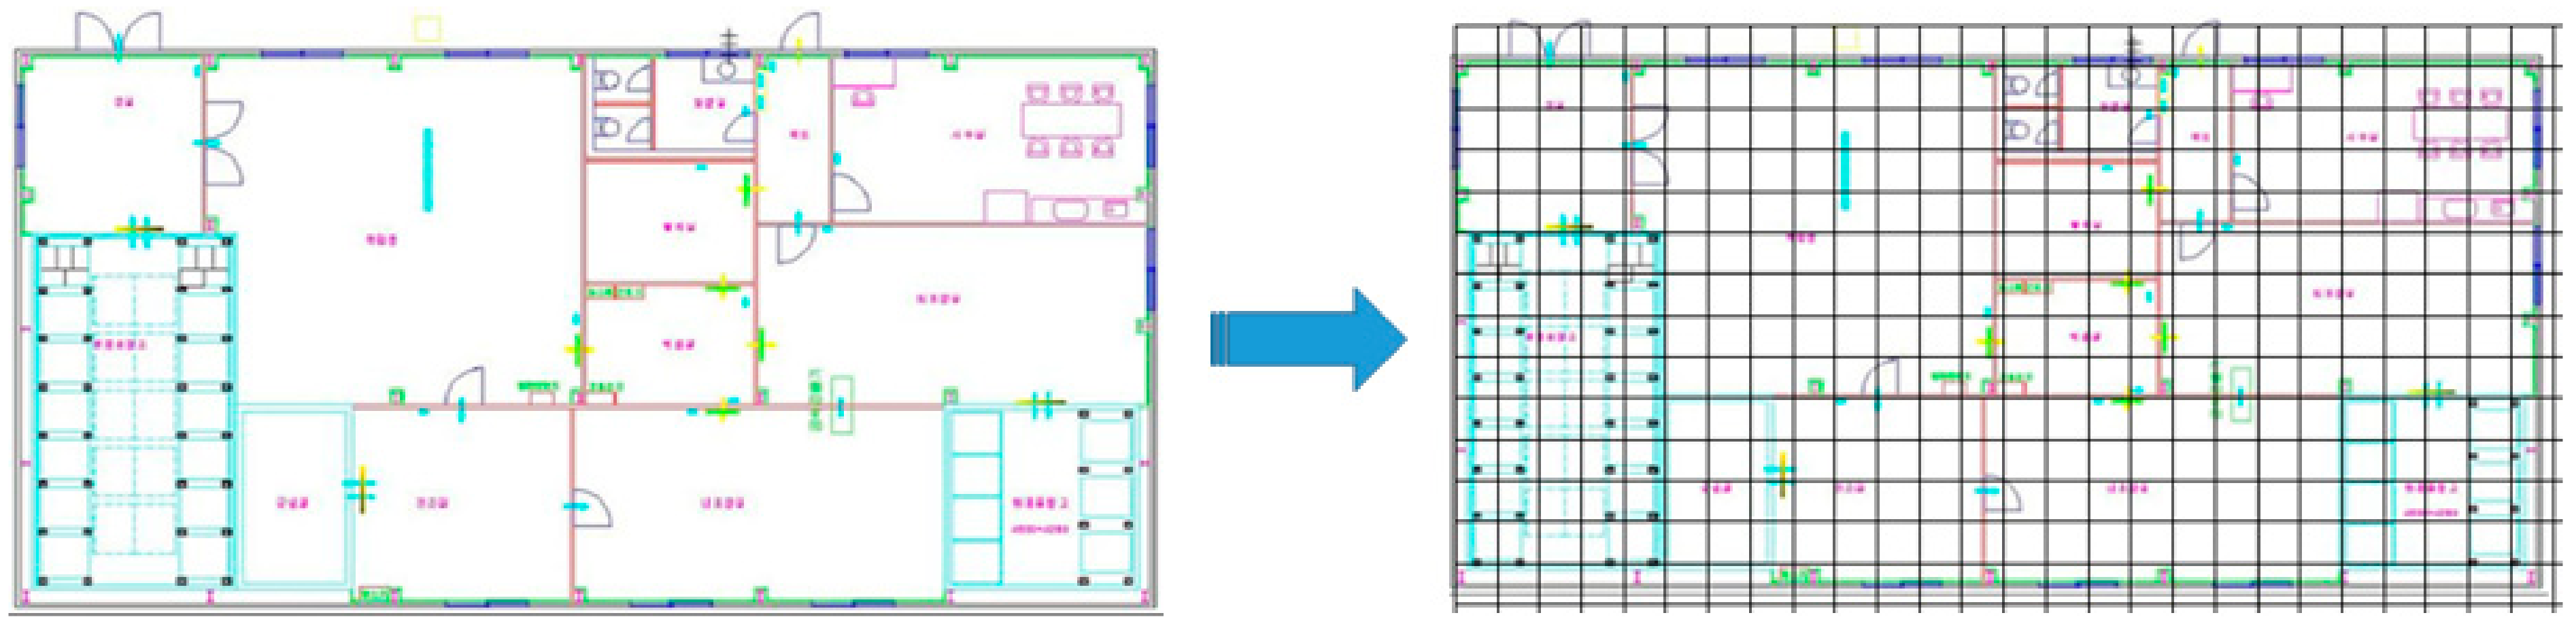
For the above reasons, in this study the design space is defined as a graph divided into a two-dimensional grid of a drawing containing the firefighting targets as shown in
Figure 2. The spacing of the grid is set equally because the destination is not defined in the input part in the input/output definition. Because the blind search used in the task of finding the firefighting area spreads without a destination and it is not known which point will be the boundary of the firefighting area, the grid spacing is divided equally to minimize the tolerance. As for the grid, the graph uses 4-neighbor or 8-neighbor neighbors. The evaluation of which of the two has good performance is dealt with in the results section to be described later.
3.3. Iterative-Deepening Search
Iterative-deepening search is a method of expanding the search range by gradually increasing the depth limit when a result is not obtained by one depth limit search [
20]. In this study, we propose an iterative-deepening search method to obtain a result close to the actual coverage area. This method was originally devised to find a route to the destination by increasing the search range step-by-step when the destination point cannot be found within the limit depth in the DFS-based route search.
As shown in
Figure 3, the same depth limit is similar to that of breadth-first search (BFS), so this method can be seen as a compromise between BFS and depth-first search (DFS).
3.4. Any-Angle Search
Based on the open space grid graph, the fire area obtained by the depth limit search has a diamond shape. This is because firefighting equipment or people are assumed to move parallel along the x and y axes of the grid, as the design space is composed of a grid network. This is suitable for a macro model that defines a design space as a road network in which the direction of movement is actually limited, but it is not the ultimate result desired in this study.
If you want to get results close to the actual coverage area at this stage, you need to allow movement in any direction. That is, when defining a graph, the edges must be connected from one point to all other points. In this case, when the number of vertices in the defined graph is , the number of edges per vertex is , and the limit depth is , a depth limit search with a time complexity of . In the search, the value is not fixed at 4 or 8 but is , which is highly dependent on the number of vertices. This means that even if the resolution is defined as slightly higher, a very big problem occurs in the computation speed.
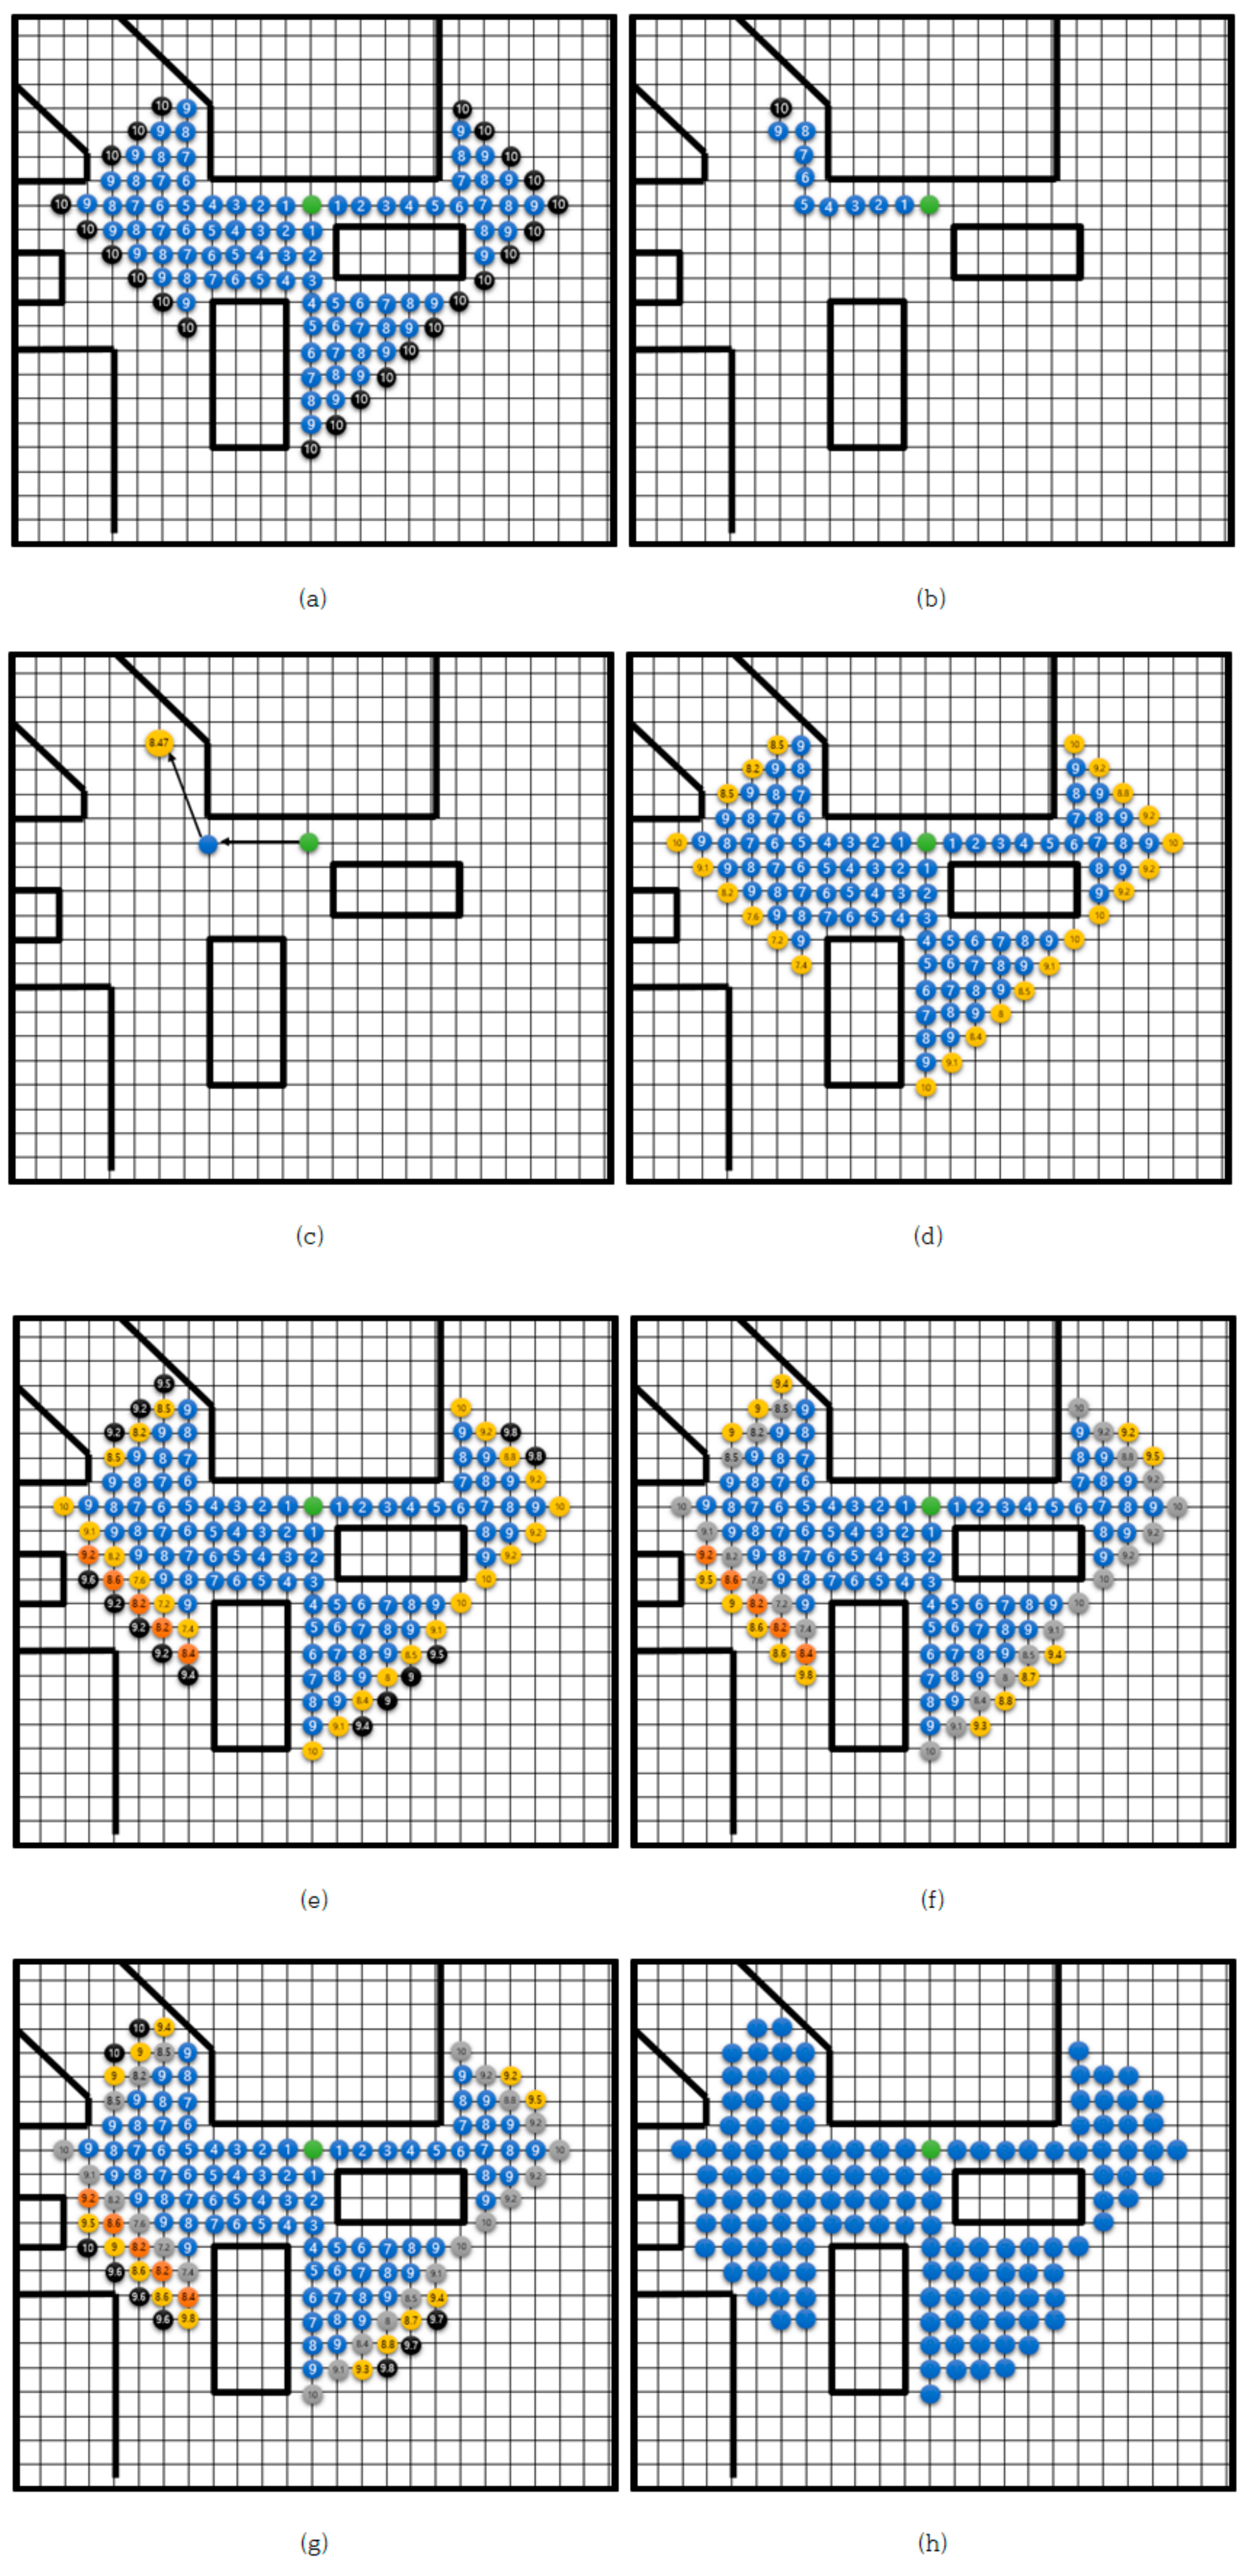
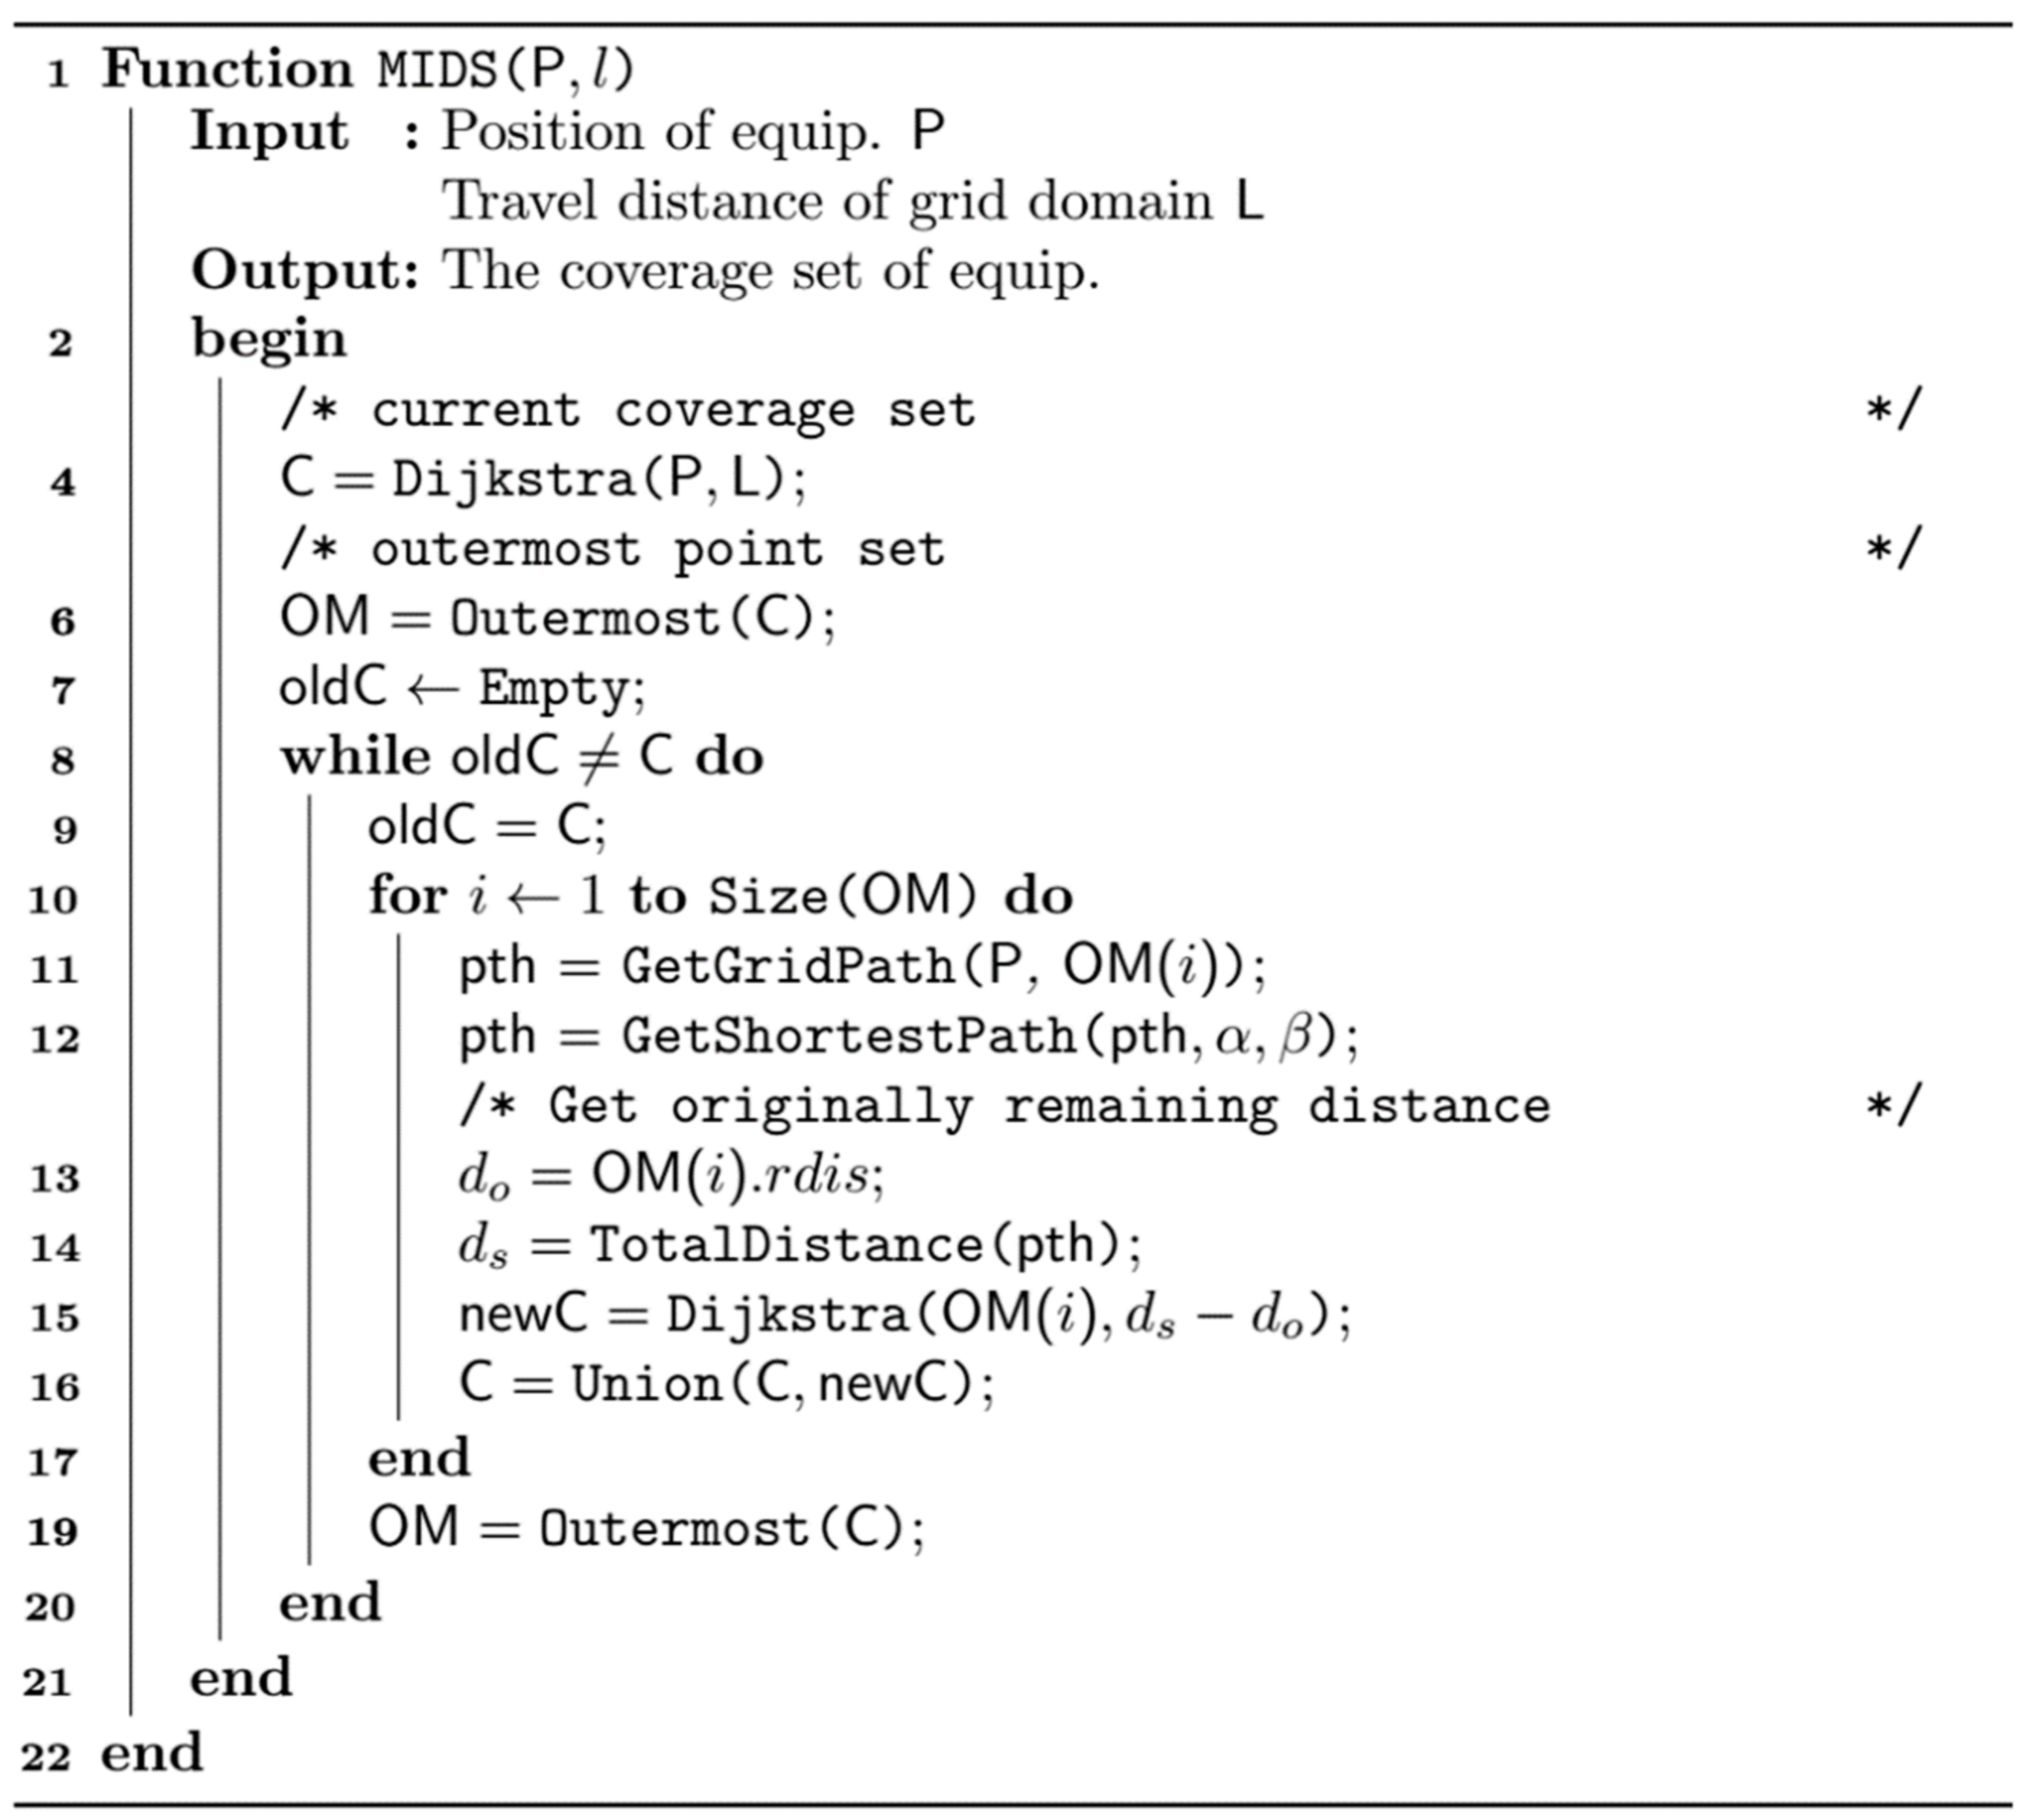
The iterative-deepening any-angle search (IDAAS) used in this paper adopts the concept of gradually increasing the search range in repetitive depth-increasing searches. In other words, the range is gradually expanded from the original diamond shape to finally obtain a shape close to the actual range. Here, the initial Dijkstra result is regarded as the 0th order deepening result, and the deepening order increases by 1 each time the search range increases. The overall process is shown in
Figure 4.
Figure 5 shows an illustration of
Figure 4 in each step.
Figure 5a shows that Dijkstra method was performed with the initial cover area as 10 grids. The outermost points mentioned here are points corresponding to the end of the Dijkstra search range. From the tree’s point of view, they correspond to the lowest leaf nodes. The step-by-step description of
Figure 5 is as follows.
- (1)
Remember the outermost points of the firefighting area obtained from the initial Dijkstra search;
- (2)
Select one of the outermost points and get the Dijkstra path from the starting point to the point. This can be easily achieved by going back through the nodes passed in the tree graph structure;
- (3)
The obtained Dijkstra path is trimmed to the shortest path using the method of obtaining the shortest distance. Then, the Dijkstra cost to the outermost point is covered by the shortest distance;
- (4)
Perform (2) and (3) for all the outermost points;
- (5)
Investigate the modified Dijkstra cost of each of the outermost points and additionally conduct Dijkstra searches for points lower than travel distance;
- (6)
A new cover area (red) and a new outermost point (black) were obtained (1st deepening);
- (7)
Again, perform (2) and (3) for all the outermost points;
- (8)
A new coverage area and outermost point are obtained (2nd order deepening);
- (9)
Again, perform (2) and (3) for all the outermost points, but because the range cannot be extended anymore, the algorithm is terminated. The search range up to that point is obtained as the cover area of the firefighting equipment (blue).
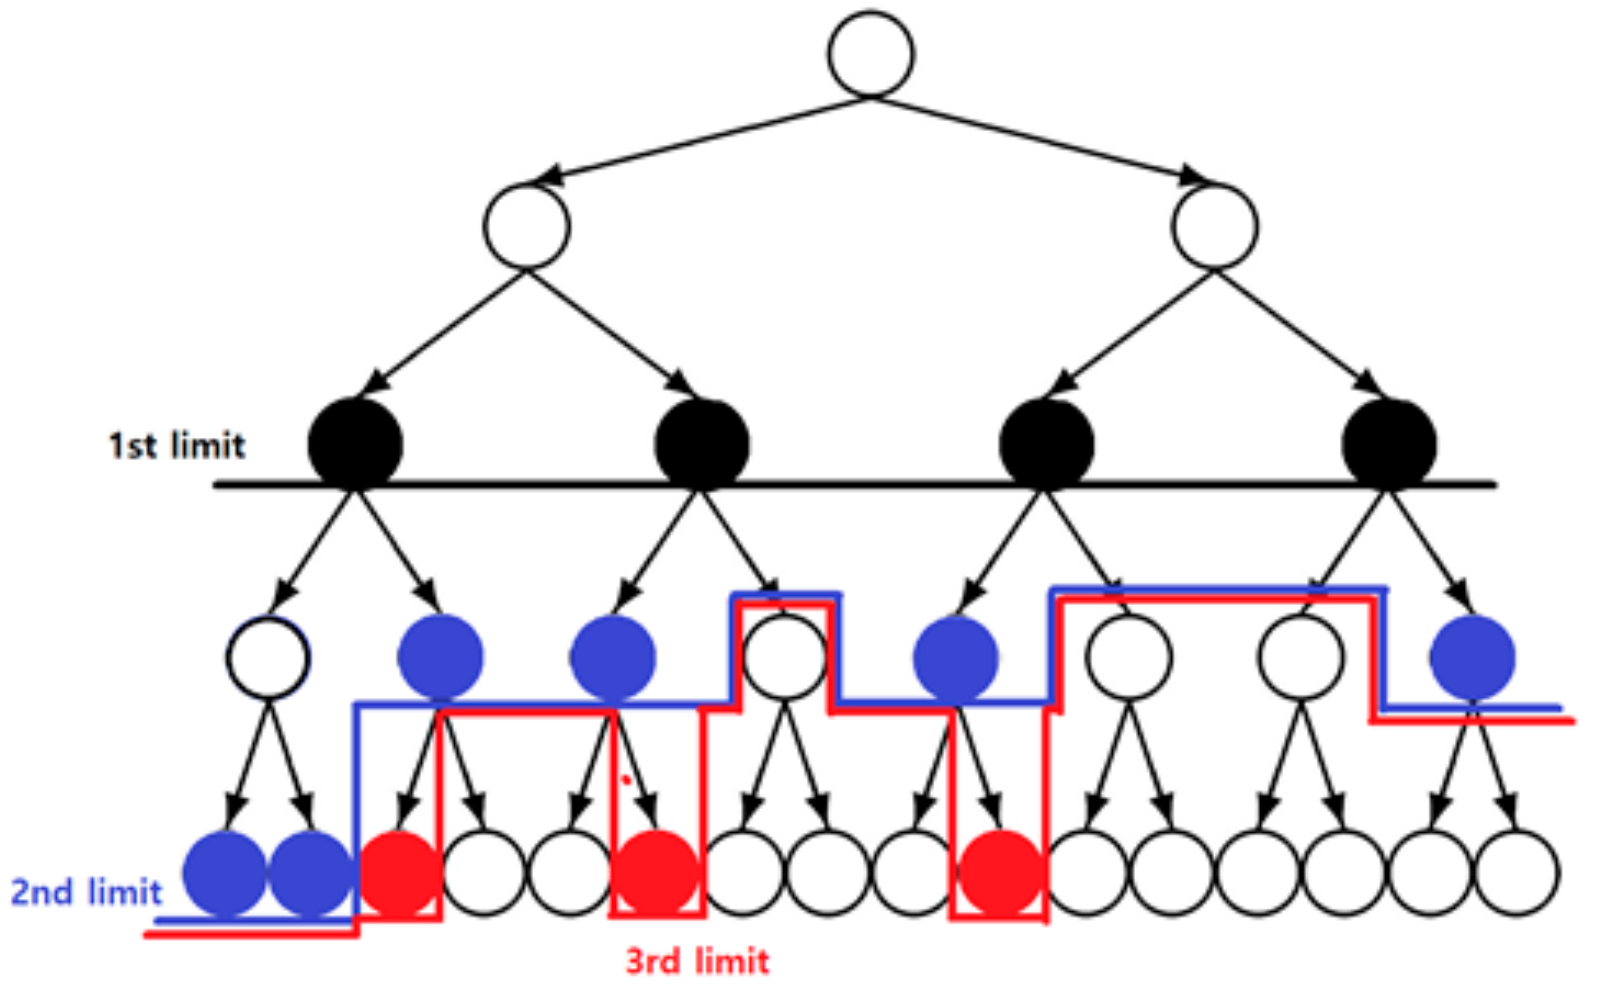
In other words, this method has the characteristic of selectively increasing the depth as shown in
Figure 6 by examining each end point, unlike the iterative depth increase search method, which collectively increases the depth limit.
Figure 7 shows the pseudo-code of the IDAAS method.
3.5. Acquisition of Firefighting Areas Including Water Stream
Firefighting equipment basically sprays fire-extinguishing materials (water, carbon dioxide, etc.). Until now, if a single piece of firefighting equipment has been found to be effectively accessible to a person, the following process is taken to determine the extent to which a real person can use the firefighting equipment to perform a fire extinguishing operation, i.e., a fire extinguishing area:
- (1)
Obtain a fire zone with IDAAS;
- (2)
Perform ray-casting as long as the length of the water stream at all coverable points.
Figure 8 is a diagram explaining the concept of obtaining the extinguishing range of a fire hydrant. For illustration purposes, only the outermost point of the coverage area is represented as the water that is sprayed. In other words, the result of the Boolean union of the areas covered by the gray circles in the existing cover area is the resultant firefighting area.
4. Arrangement Optimization
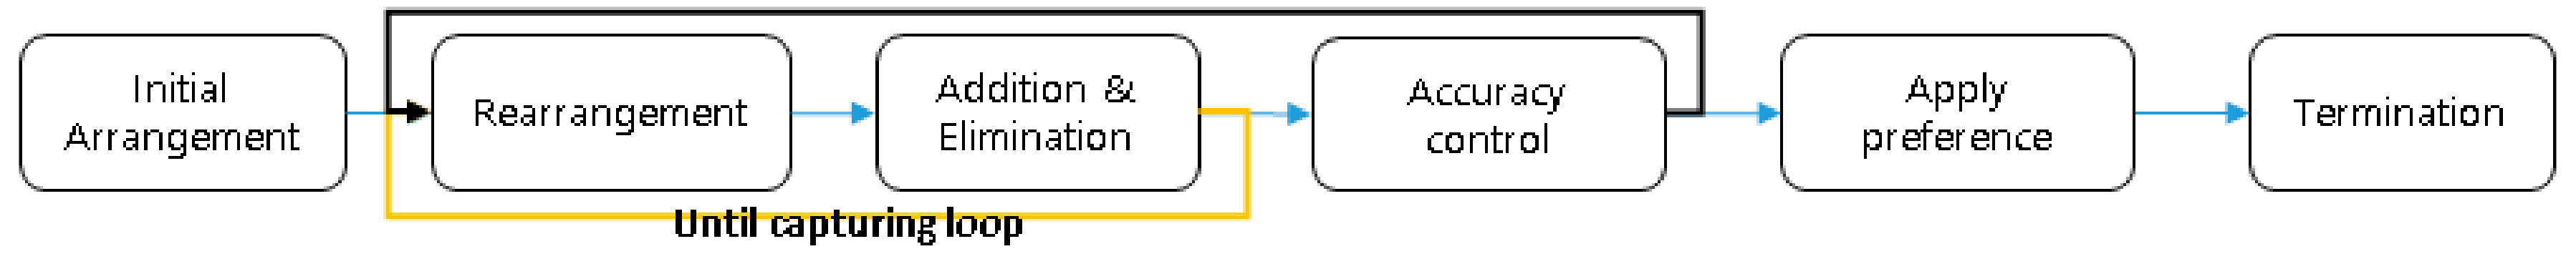
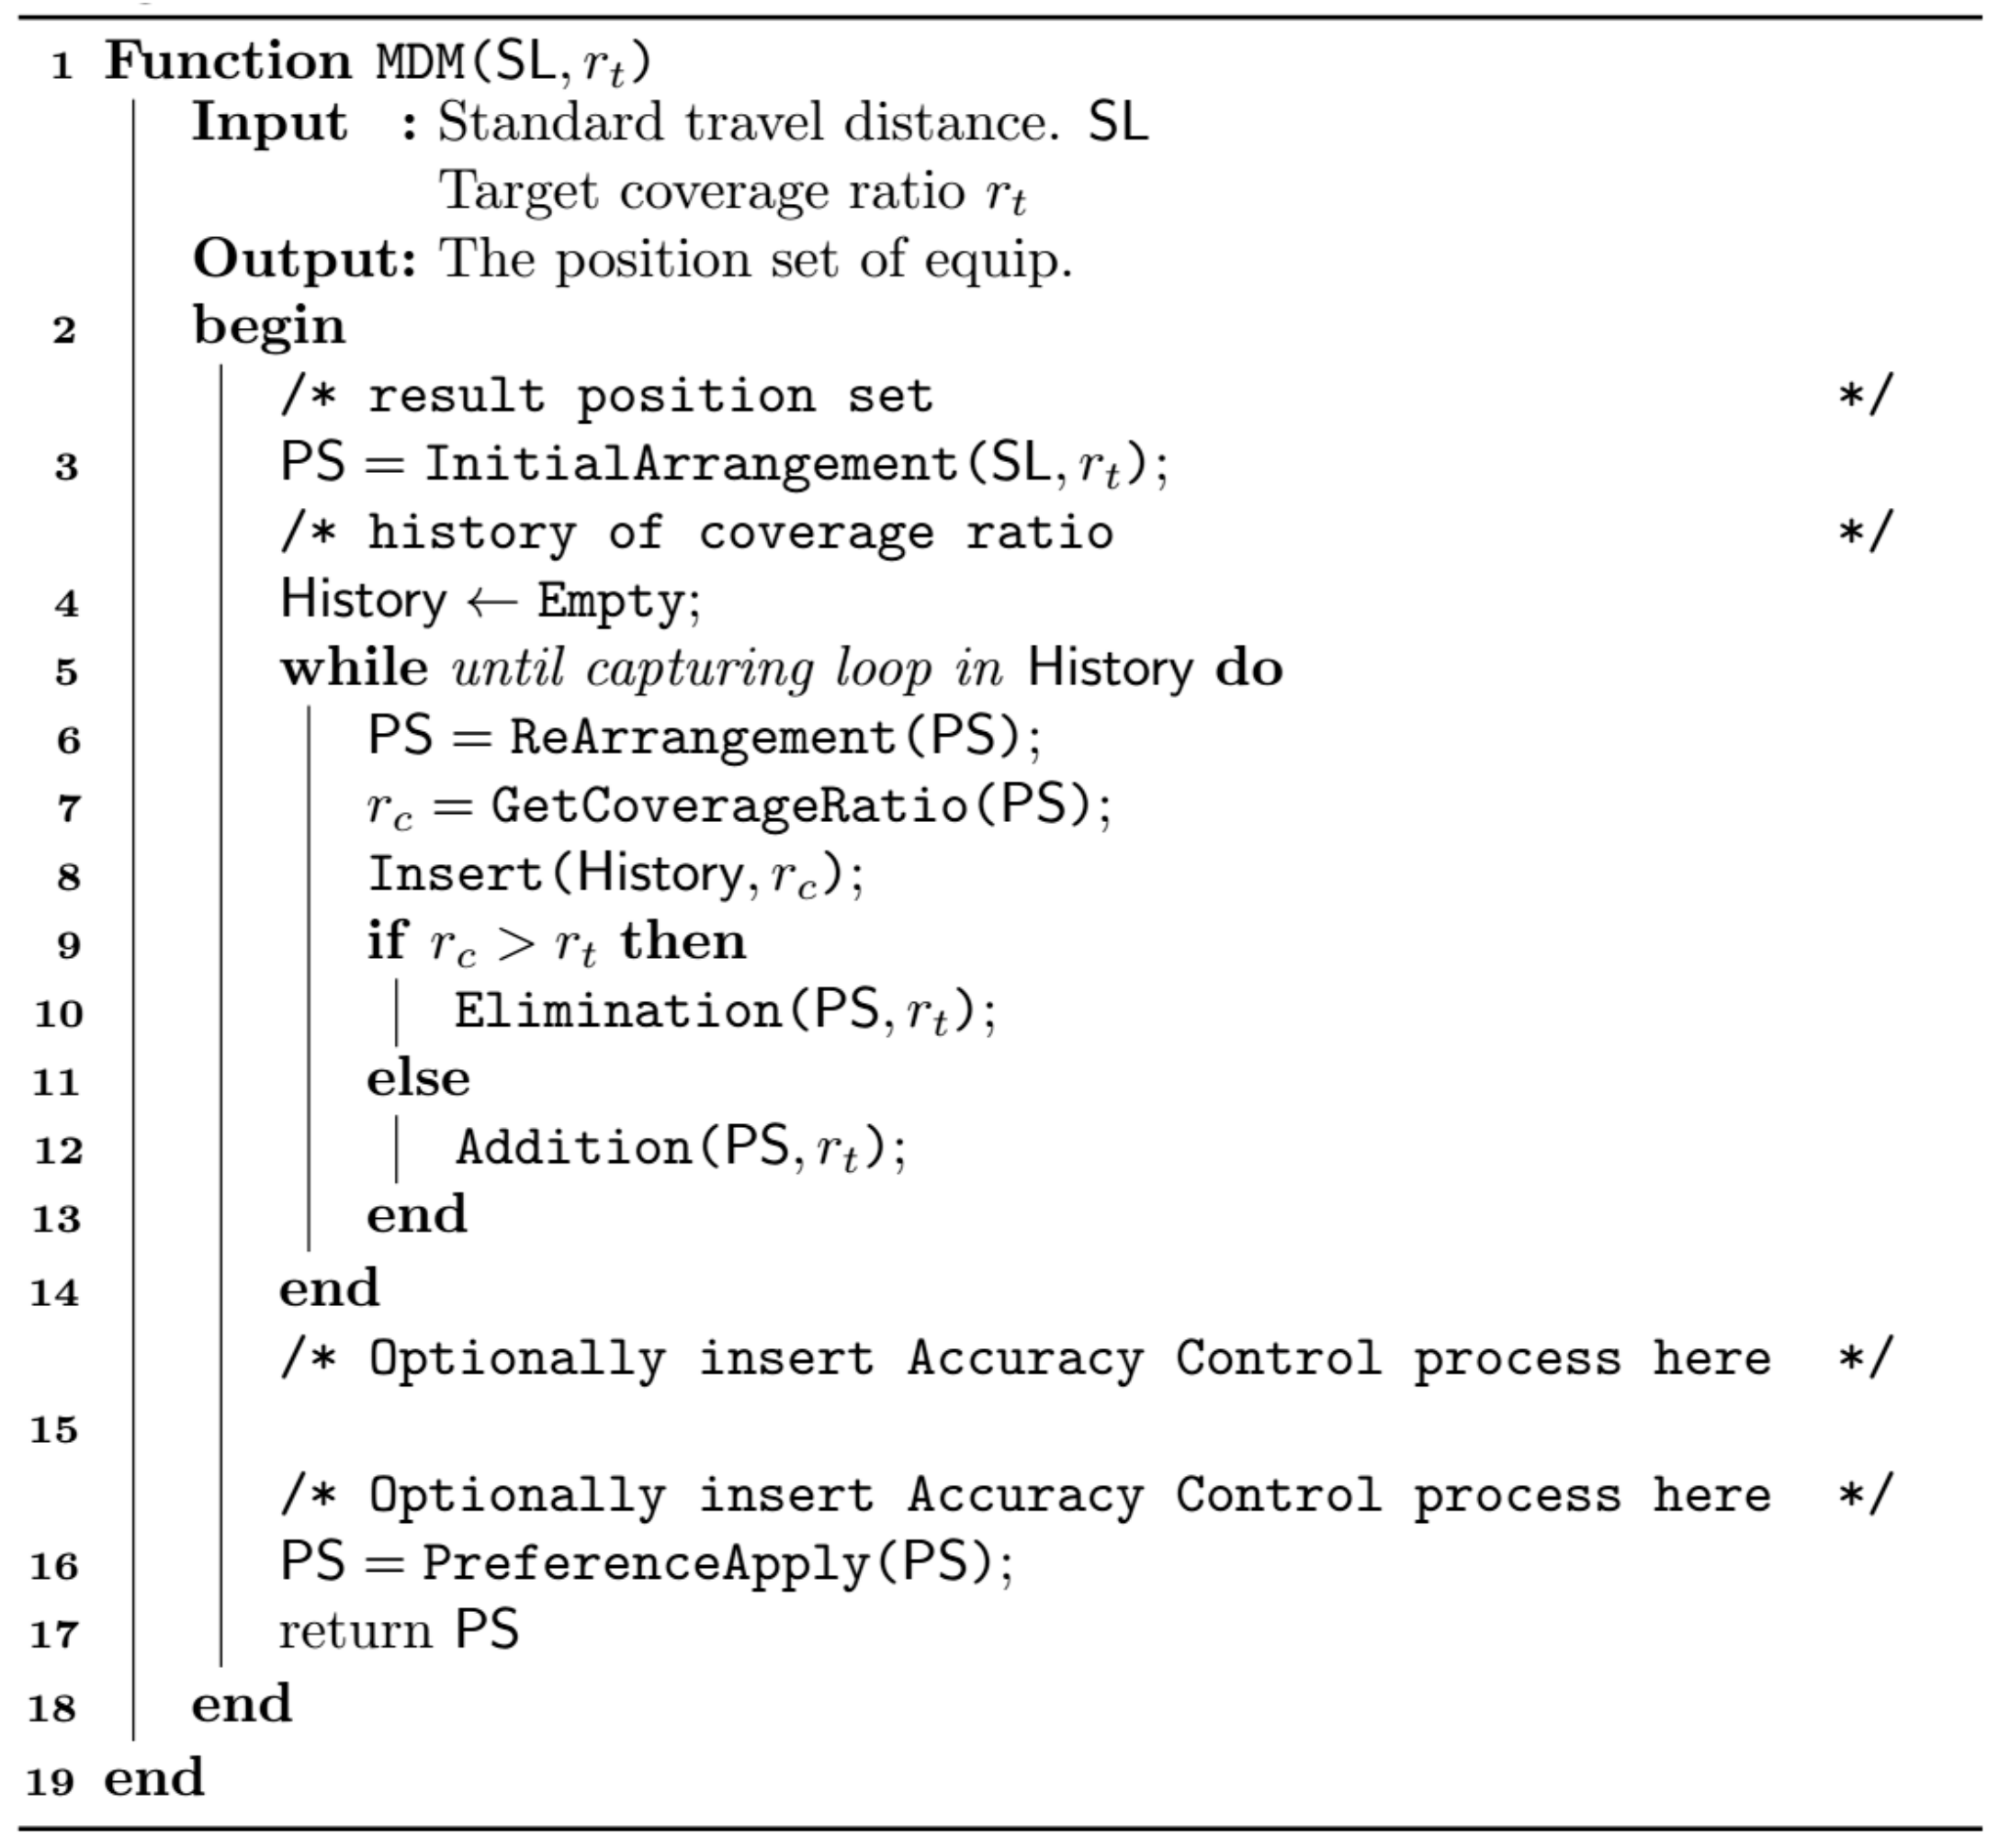
In this chapter, the firefighting equipment layout optimization is performed based on the firefighting area calculation process defined in the previous chapter. As a result of conducting IDAAS on a single firefighting system, the firefighting area is considered a subset of the power set of the entire design space, and the process of deploying the firefighting equipment at optimal cost is described. The overall process is shown in
Figure 9, while
Figure 10 is a pseudo-code representation of
Figure 9.
4.1. Arrangement Method
The firefighting equipment arrangements are divided into option 1 and option 2 as follows. Each feature is summarized in
Table 1.
Option 1 is for portable equipment such as fire extinguishers, or for the conservative placement of fire hydrants. It is considered that the spray distance of the fire extinguisher is negligible, and the water stream is not included in the coverage area, and it is useful when arranging a fire hydrant in cases in which the injection pressure is lowered for some reason. Considering mobility, it is not necessary to cover 100% of the passable area. Therefore, if a certain level of target coverage is presented, optimal placement is performed in a line that is not insufficient.
Option 2 is an arrangement that takes into account the general fire safety guidelines [
8,
9,
10,
11,
12]. If the main fire pump becomes inoperable, fire hydrants composed of other fire pumps can perform all fire extinguishing work. In other words, the double-cover condition must be satisfied as shown in
Figure 11b.
4.2. Initial Arrangement
To shorten the execution time of the algorithm, an appropriate initial arrangement that is not too far from the optimal solution is required. In the process of obtaining this initial batch, the greedy method is used. The greedy method considers the resulting local optimum as an approximate optimal solution, but the greater the degree of freedom, the higher the probability that the solution obtained by the greedy method is less accurate. Feige (1998) found that the maximum approximation ratio of the greedy method is
[
19]. In other words, no matter how elaborately the greedy cost is configured, only a 63.2% accuracy is shown in the general multi-degree of freedom problem unless it is changed to a more suitable greedy cost in the middle. However, because the local optimum obtained by the greedy method acts as a relatively good initial arrangement in the combination optimization problem using such particles (firefighting equipment), the greedy method was adopted in this paper. The process is as follows:
- (1)
Divide the design space evenly at regular intervals;
- (2)
Perform IDAAS on the location of firefighting equipment (feasible region) and remember the coverage;
- (3)
Place the first piece of firefighting equipment at the most-covered point;
- (4)
Place the firefighting equipment to be deployed later at the point where the additional cover is the highest, overlapping with other firefighting equipment;
- (5)
If the additional coverage is the same, place it at a point where less overlap occurs;
- (6)
Repeat until target coverage is met.
4.3. Rearrangement
According to the above initial arrangement method, the overall coverage rate will increase significantly at the beginning, and then the coverage rate will decrease gradually as the coverable area becomes narrower. Eventually, it will converge to 100%.
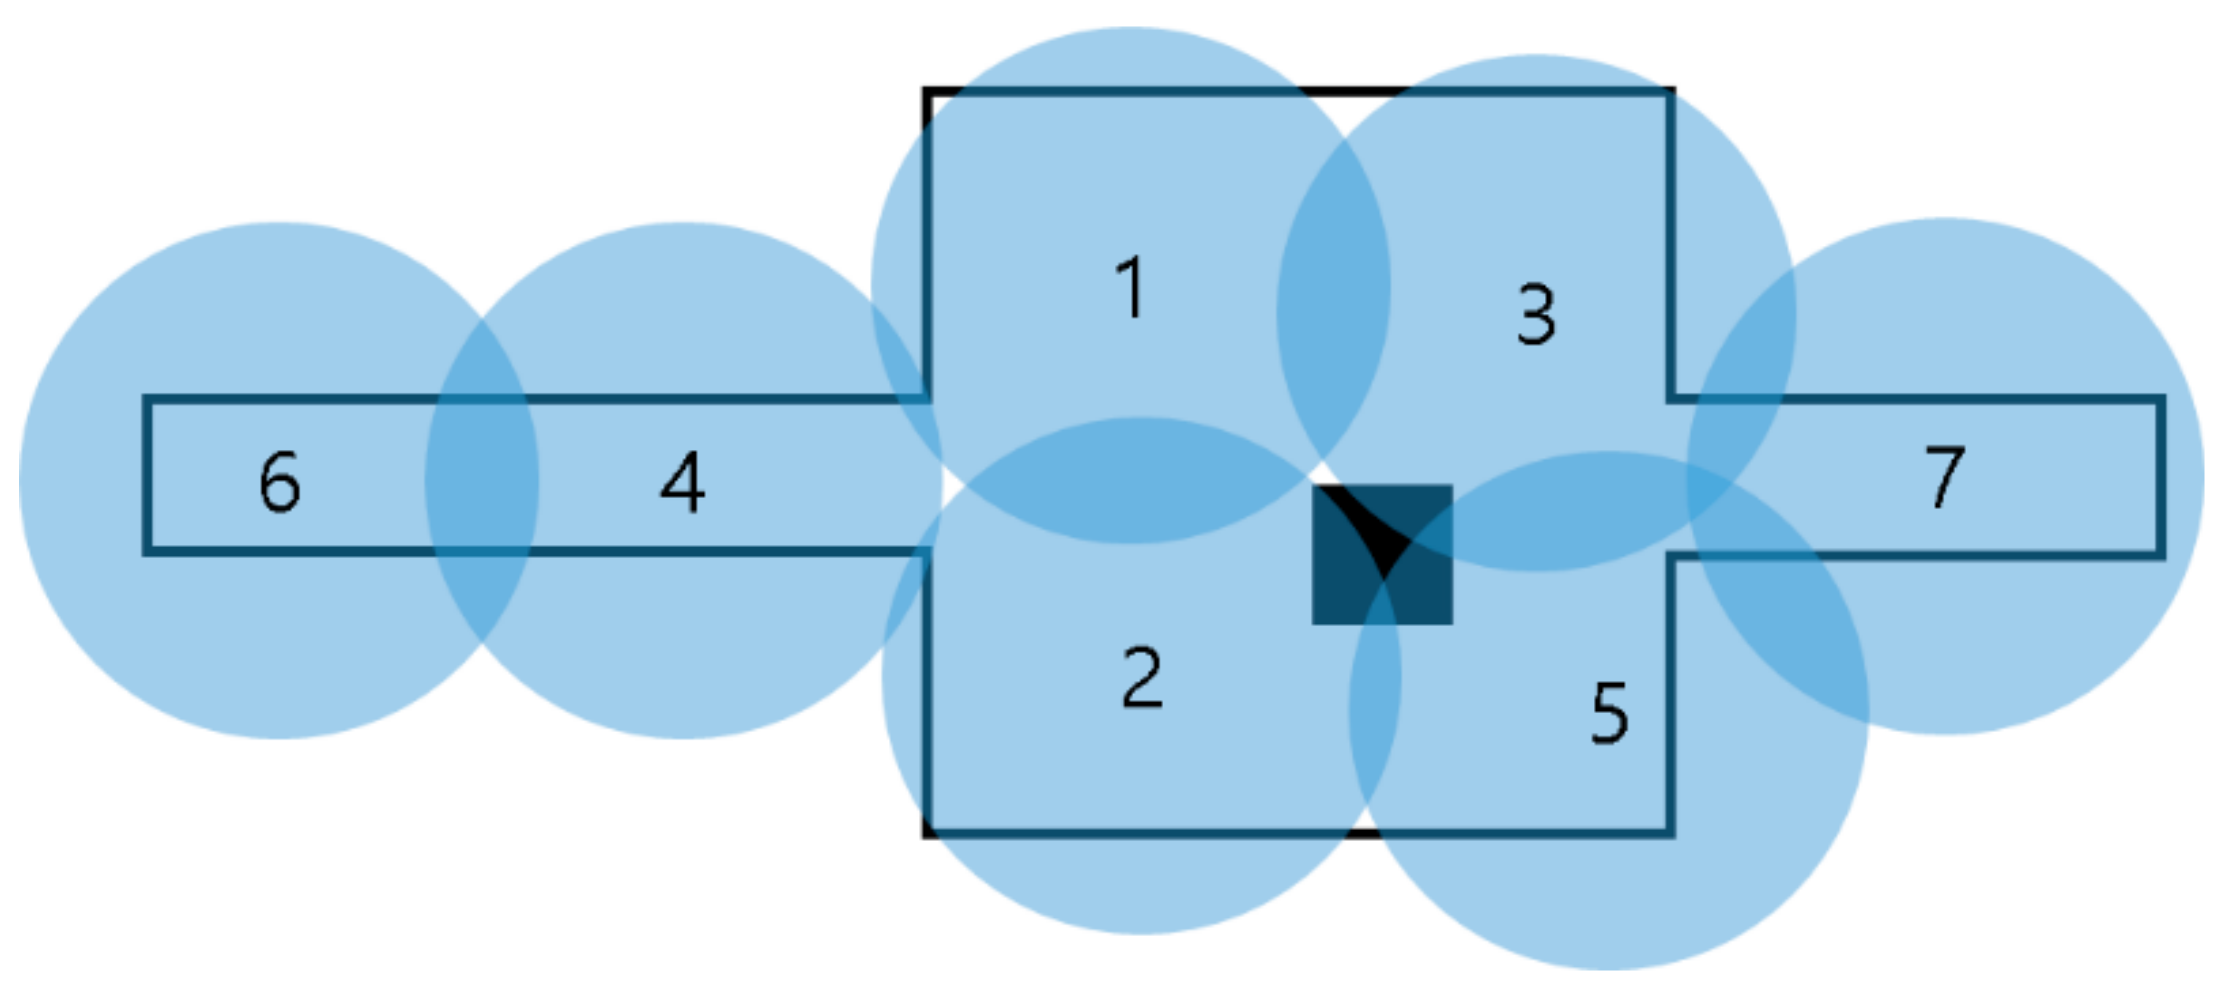
Another feature is that the later-deployed fire hydrants are likely to be located at the corner of the drawing. When several circles with the same radius are filled inside the boundary surrounded by black lines, such as in
Figure 12, the most additional coverage area, such as the initial placement method, will be filled in the same order as shown. At this time, the circle to be placed first is located in the wide center, and no. 6 and no. 7, to be placed later, are located in the corner. The characteristics of this corner are as follows:
- (1)
The direction of movement is limited;
- (2)
The location of firefighting equipment that can be arranged to cover the corners is limited;
- (3)
Fire hydrants deployed later tend to be located at the corners.
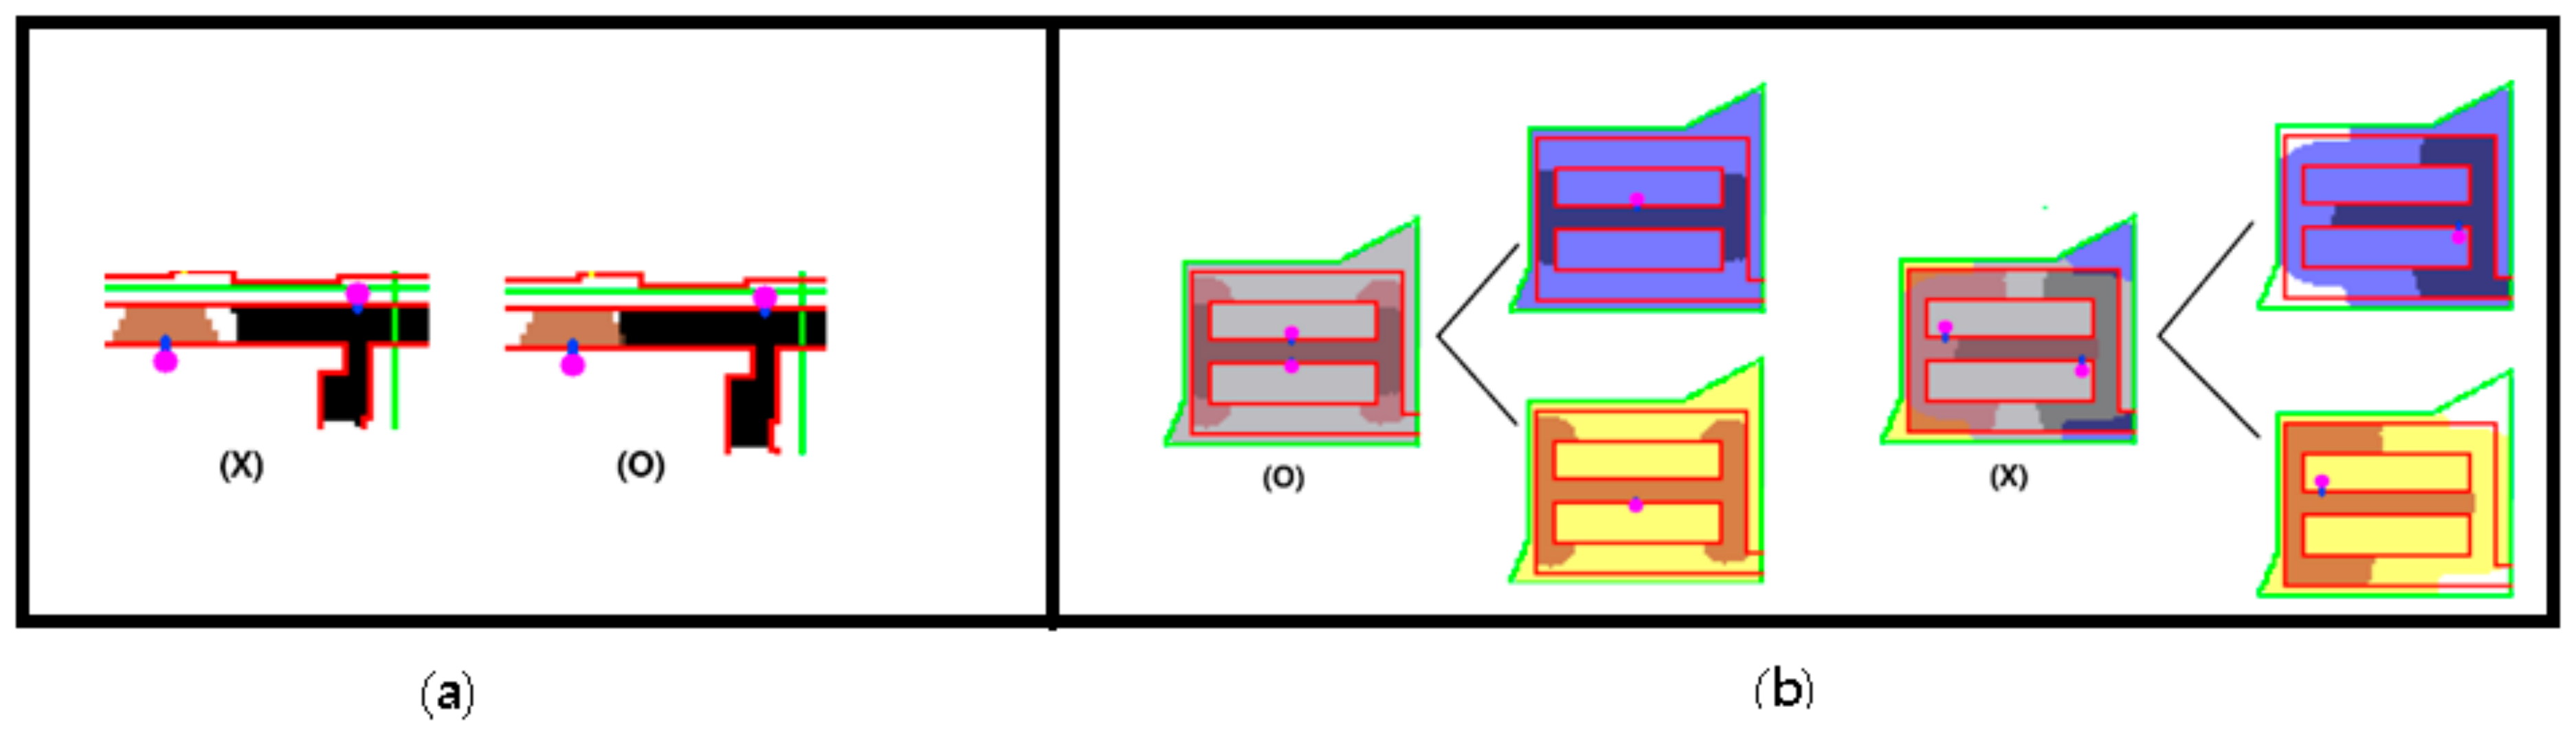
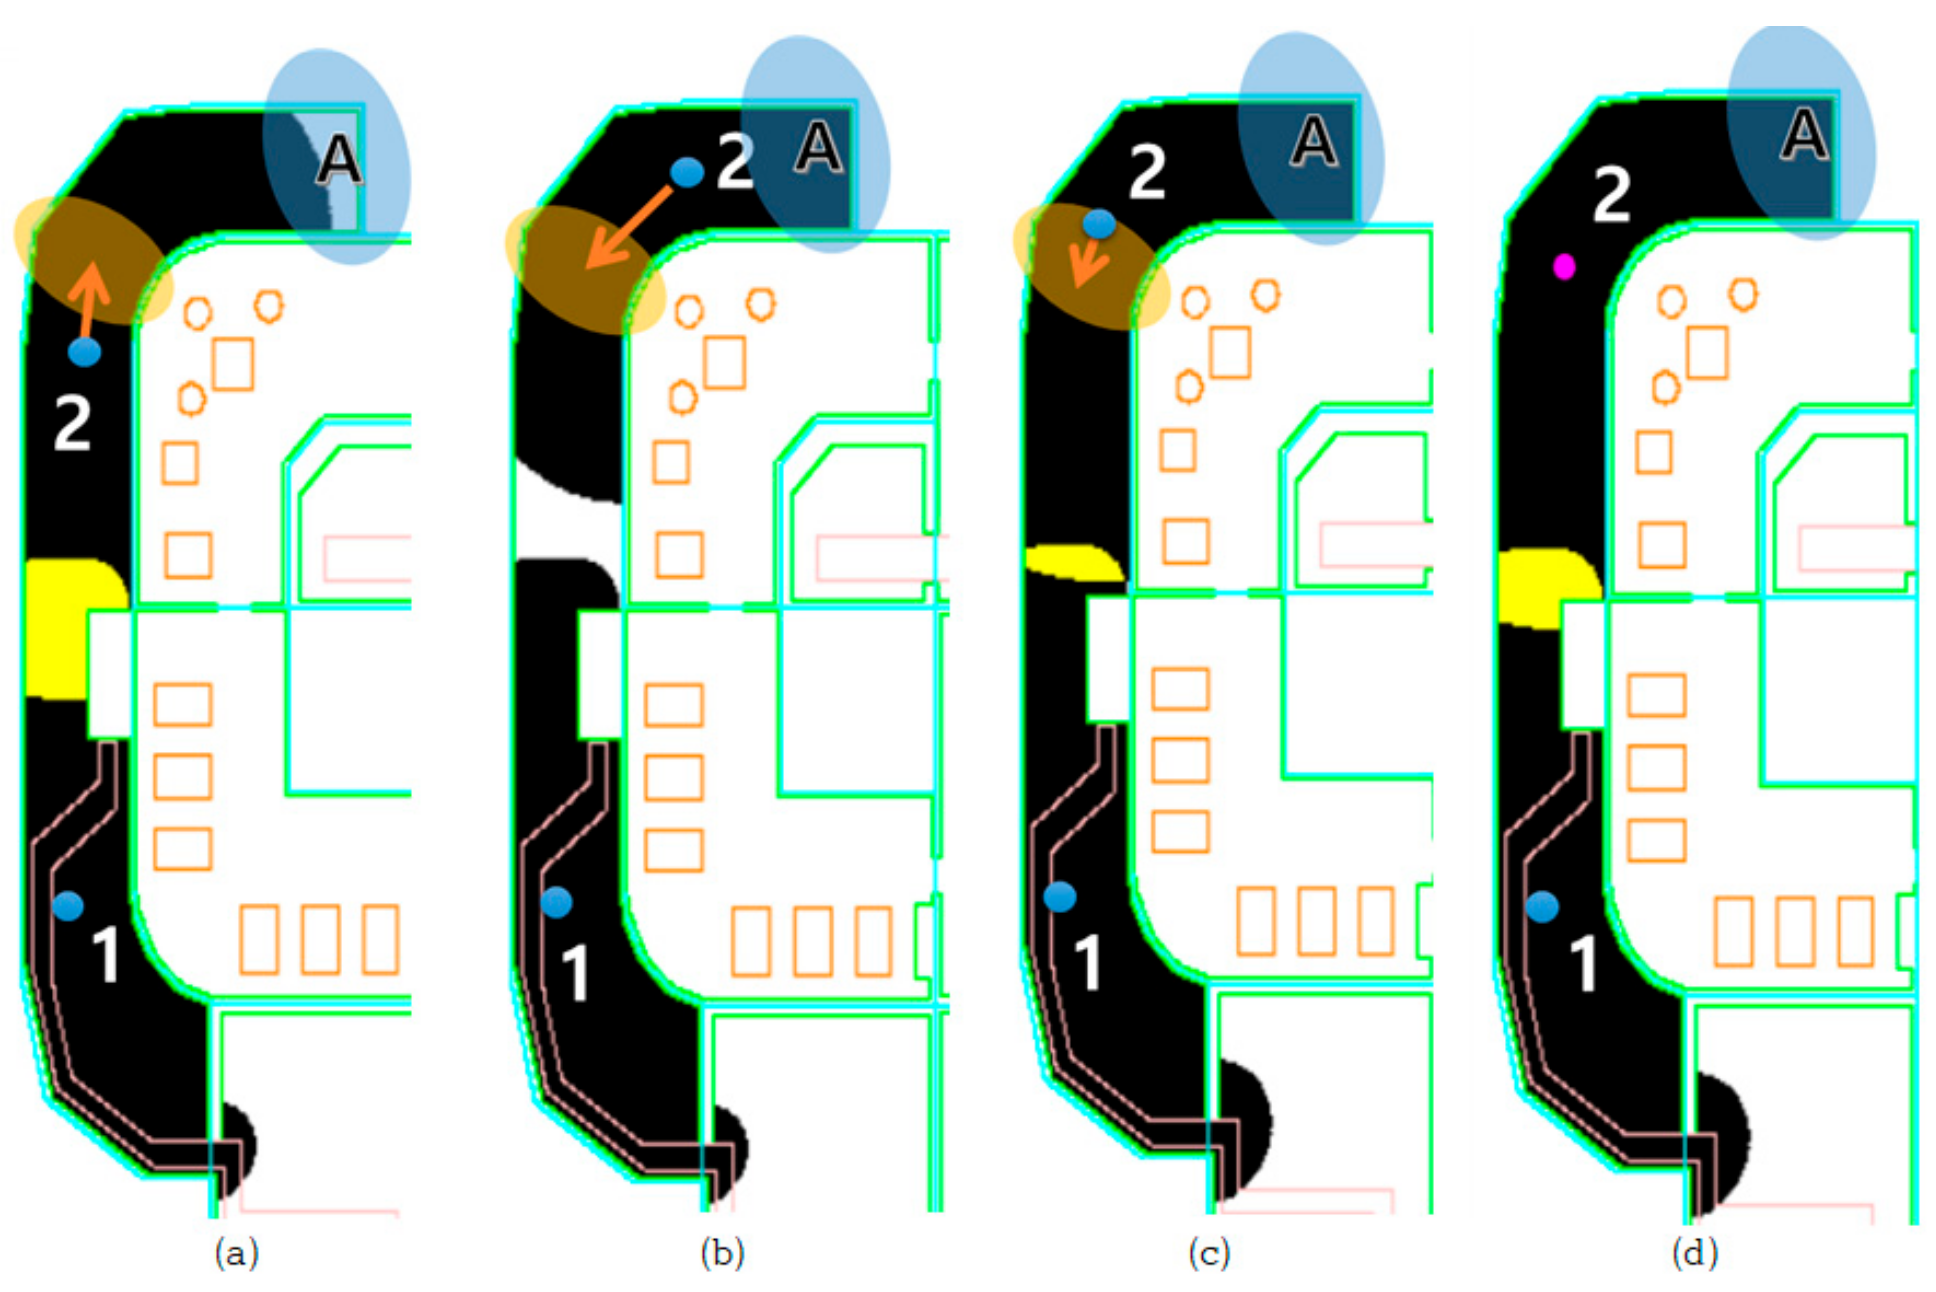
Assuming that the number of pieces of firefighting equipment in
Figure 13 is an index according to the order of placement, firefighting equipment #2 is placed after equipment #1 and is located at the corner. According to (1) and (2), the only way to cover part A in
Figure 13a is to push the #1 fire hydrant into the orange part. In this case, it is appropriate to push the hydrant in so it can purely increase the entire cover area. In case (b), firefighting equipment #2 is located too far inside the corner. The cover of A is guaranteed even if #2 is pulled out a little, so it is good to induce it to move outward. In the case of (c), movement in either direction does not affect the entire coverage area right away, but movement in the direction overlapping the #1 fire hydrant covers A, and firefighting equipment can be arranged wider and less. As a result, as shown in (d), the case where A is most closely covered is the most ideal location of firefighting equipment #2.
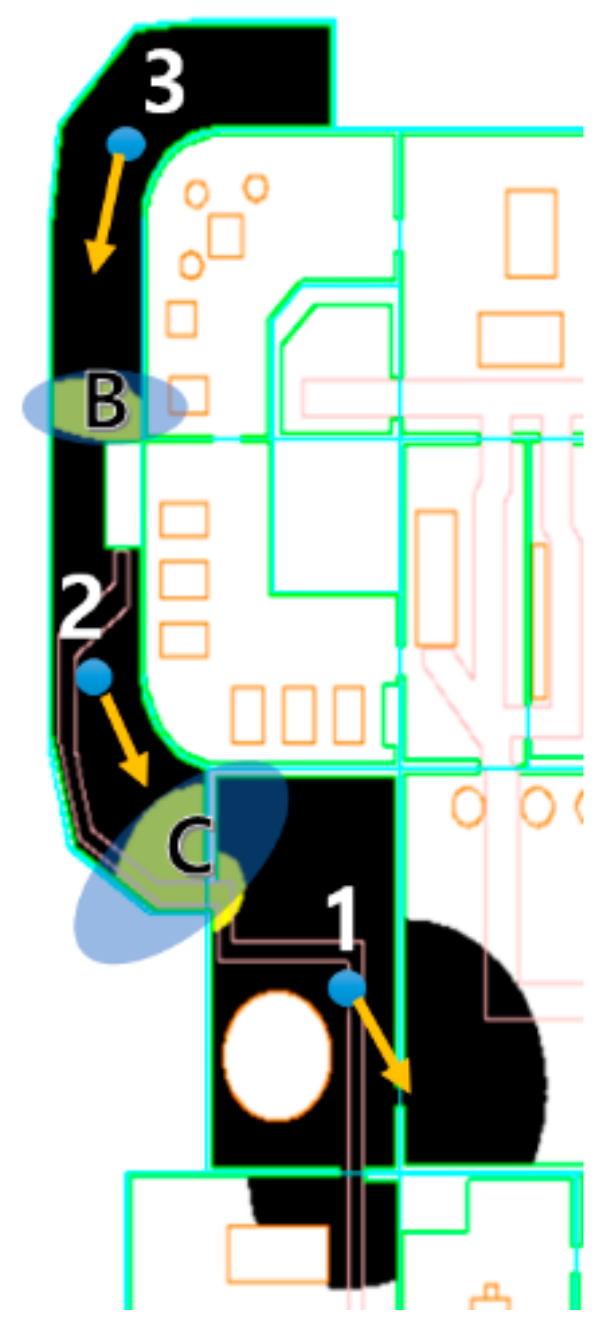
Figure 14 shows the behavior upon rearrangement when three pieces of firefighting equipment are placed. Firefighting equipment #3 moves in the direction away from the corner from the line that guarantees the cover of the corner, and in the direction of increasing the overlap area B of #3 and #2, while firefighting equipment #2 moves with #3, whose index is behind itself. It moves in the direction of decreasing the overlapping area B and in the direction of increasing the overlapping area C with #1, whose index is the front. Firefighting equipment #1 moves in the direction of reducing the overlapping area with both #2 and #3, but because it does not overlap with #3, the equipment should be moved in the direction of reducing overlapping area C with #2.
The rearrangement process based on this concept is as follows:
- (1)
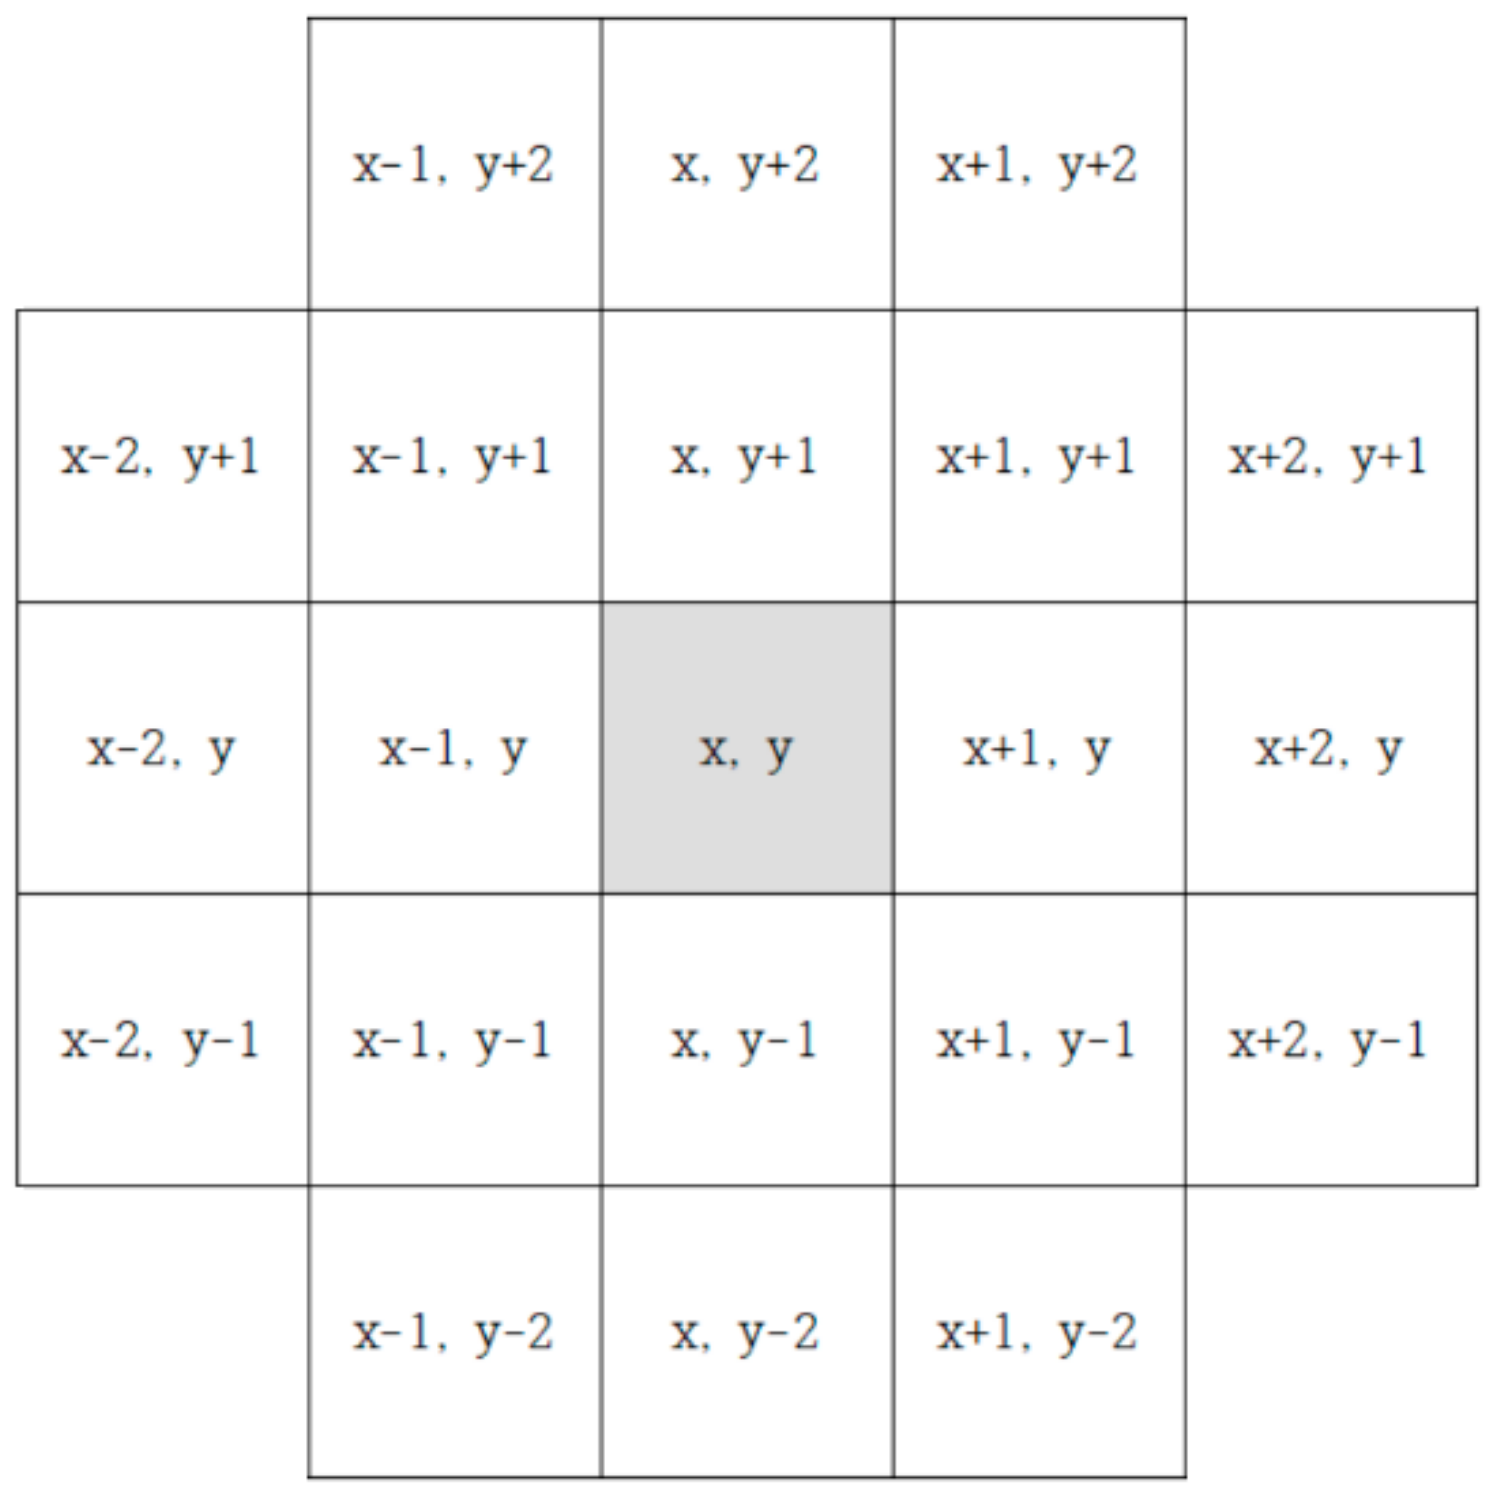
Select from the highest index among deployed firefighting equipment;
- (2)
Calculate the change in the IDAAS firefighting area assuming that it has moved in 20 directions (
Figure 15) including 8 adjacent vertices around the firefighting equipment;
- (3)
Move according to the priority below by the concept of corners. If the values are the same, it moves to the next priority;
The pure cover area (area without overlap) is the largest direction;
Direction of increasing overlap with firefighting equipment with a lower index than itself;
Direction of decreasing overlap with firefighting equipment with a higher index than itself;
- (4)
Lower the index and repeat for all firefighting equipment;
- (5)
When the index reaches 0, it cycles again from the highest index;
- (6)
If no change occurs during one cycle of the index cycle, the relocation process ends.
4.4. Addition and Deletion of Firefighting Equipment
The relocation process finds the optimal layout only with the number of pieces of firefighting equipment set for the initial deployment. If the current number of pieces of firefighting equipment is insufficient, there is a possibility that the optimal deployment plan will not cover the entire area. This section determines whether the number of pieces of firefighting equipment is sufficient or insufficient after fine-tuning, and proposes algorithms to add or remove equipment as needed. The process is as follows:
- (1)
Check the coverage rate immediately after the rearrangement process converges;
If it is higher than the target coverage rate, remove the firefighting equipment with the largest (own cover area)/(area overlapping with other firefighting equipment);
If it is lower than the target coverage, firefighting equipment is added according to the criteria of the initial deployment;
- (2)
If a loop is detected, the algorithm is terminated. Otherwise, rearrangement is performed.
Loop detection refers to detecting that the same operation is repeated due to insertion/deletion when the coverage rate is stored in a queue whenever the rearrangement process converges, and when a coverage rate of the same value is entered in the queue. For example, if the coverage rate for the first relocation is 98.97%, 96.22% for the second rearrangement after addition/deletion, 99.22% for the third, 97.25% for the fourth, and 99.22% for the fifth, the queue will have data as shown in
Figure 16. Basically, the rearrangement is performed in the direction of increasing the coverage, so it can be considered that firefighting equipment was added once and then deleted during the third to fifth rearrangements. In other words, in such a case, even if one piece of firefighting equipment is deleted and re-arranged, it can be judged as if it were returned to its original state after reviewing whether it could achieve more than the target coverage rate and confirming that it was impossible. So, it considers this as a loop and ends the process of adding/deleting and rearrangement.
4.5. Post Processing
The modified greedy algorithm ends at the previous point. However, the batch preference mentioned in
Table 1 has not been reflected so far, though this study reflects this through post-processing. Placement preferences are given in the following ways near aisles or doors:
: maximum placement preference in the aisle;
: rate of reduction in placement preference in aisles per meter;
: maximum placement preference at the door;
: decrease rate of placement preference at the door per meter.
The placement preference at the point
[m] away from the passage is as follows:
Likewise, the preference for placement at a point
[m] away from the door is as follows:
This placement preference does not fall below 1, and the placement preference of all points other than near doors and passages is set to 1. The post-processing process using the defined preference is as follows:
- (1)
Select arranged firefighting equipment from the lowest index;
- (2)
Investigate the vertices corresponding to the fire zone of the selected firefighting equipment;
- (3)
Among the vertices, extract those with a higher preference than the current location;
- (4)
From the peaks with the highest preference, calculate the coverage rate for the total, assuming that the firefighting equipment has been moved to the location;
- (5)
Move the firefighting equipment to the place with the highest coverage rate if the preference is the highest, and the same preference is not lowered below the target coverage rate;
- (6)
Increase the index and repeat for all firefighting equipment. When the end of the index is reached, returns to 0;
- (7)
If no movement occurs during one cycle of the index cycle, the post-processing process ends.
The reason for circulating from a low index in this process is that firefighting equipment with a high index has a high probability of being located at a point that barely covers a corner. This is because firefighting areas often overlap, and even if they move slightly, the overall coverage is less affected.
5. Case Studies
In this chapter, an optimal layout simulation was performed for the two options mentioned in
Table 1 using the design drawings of an actual offshore plant.
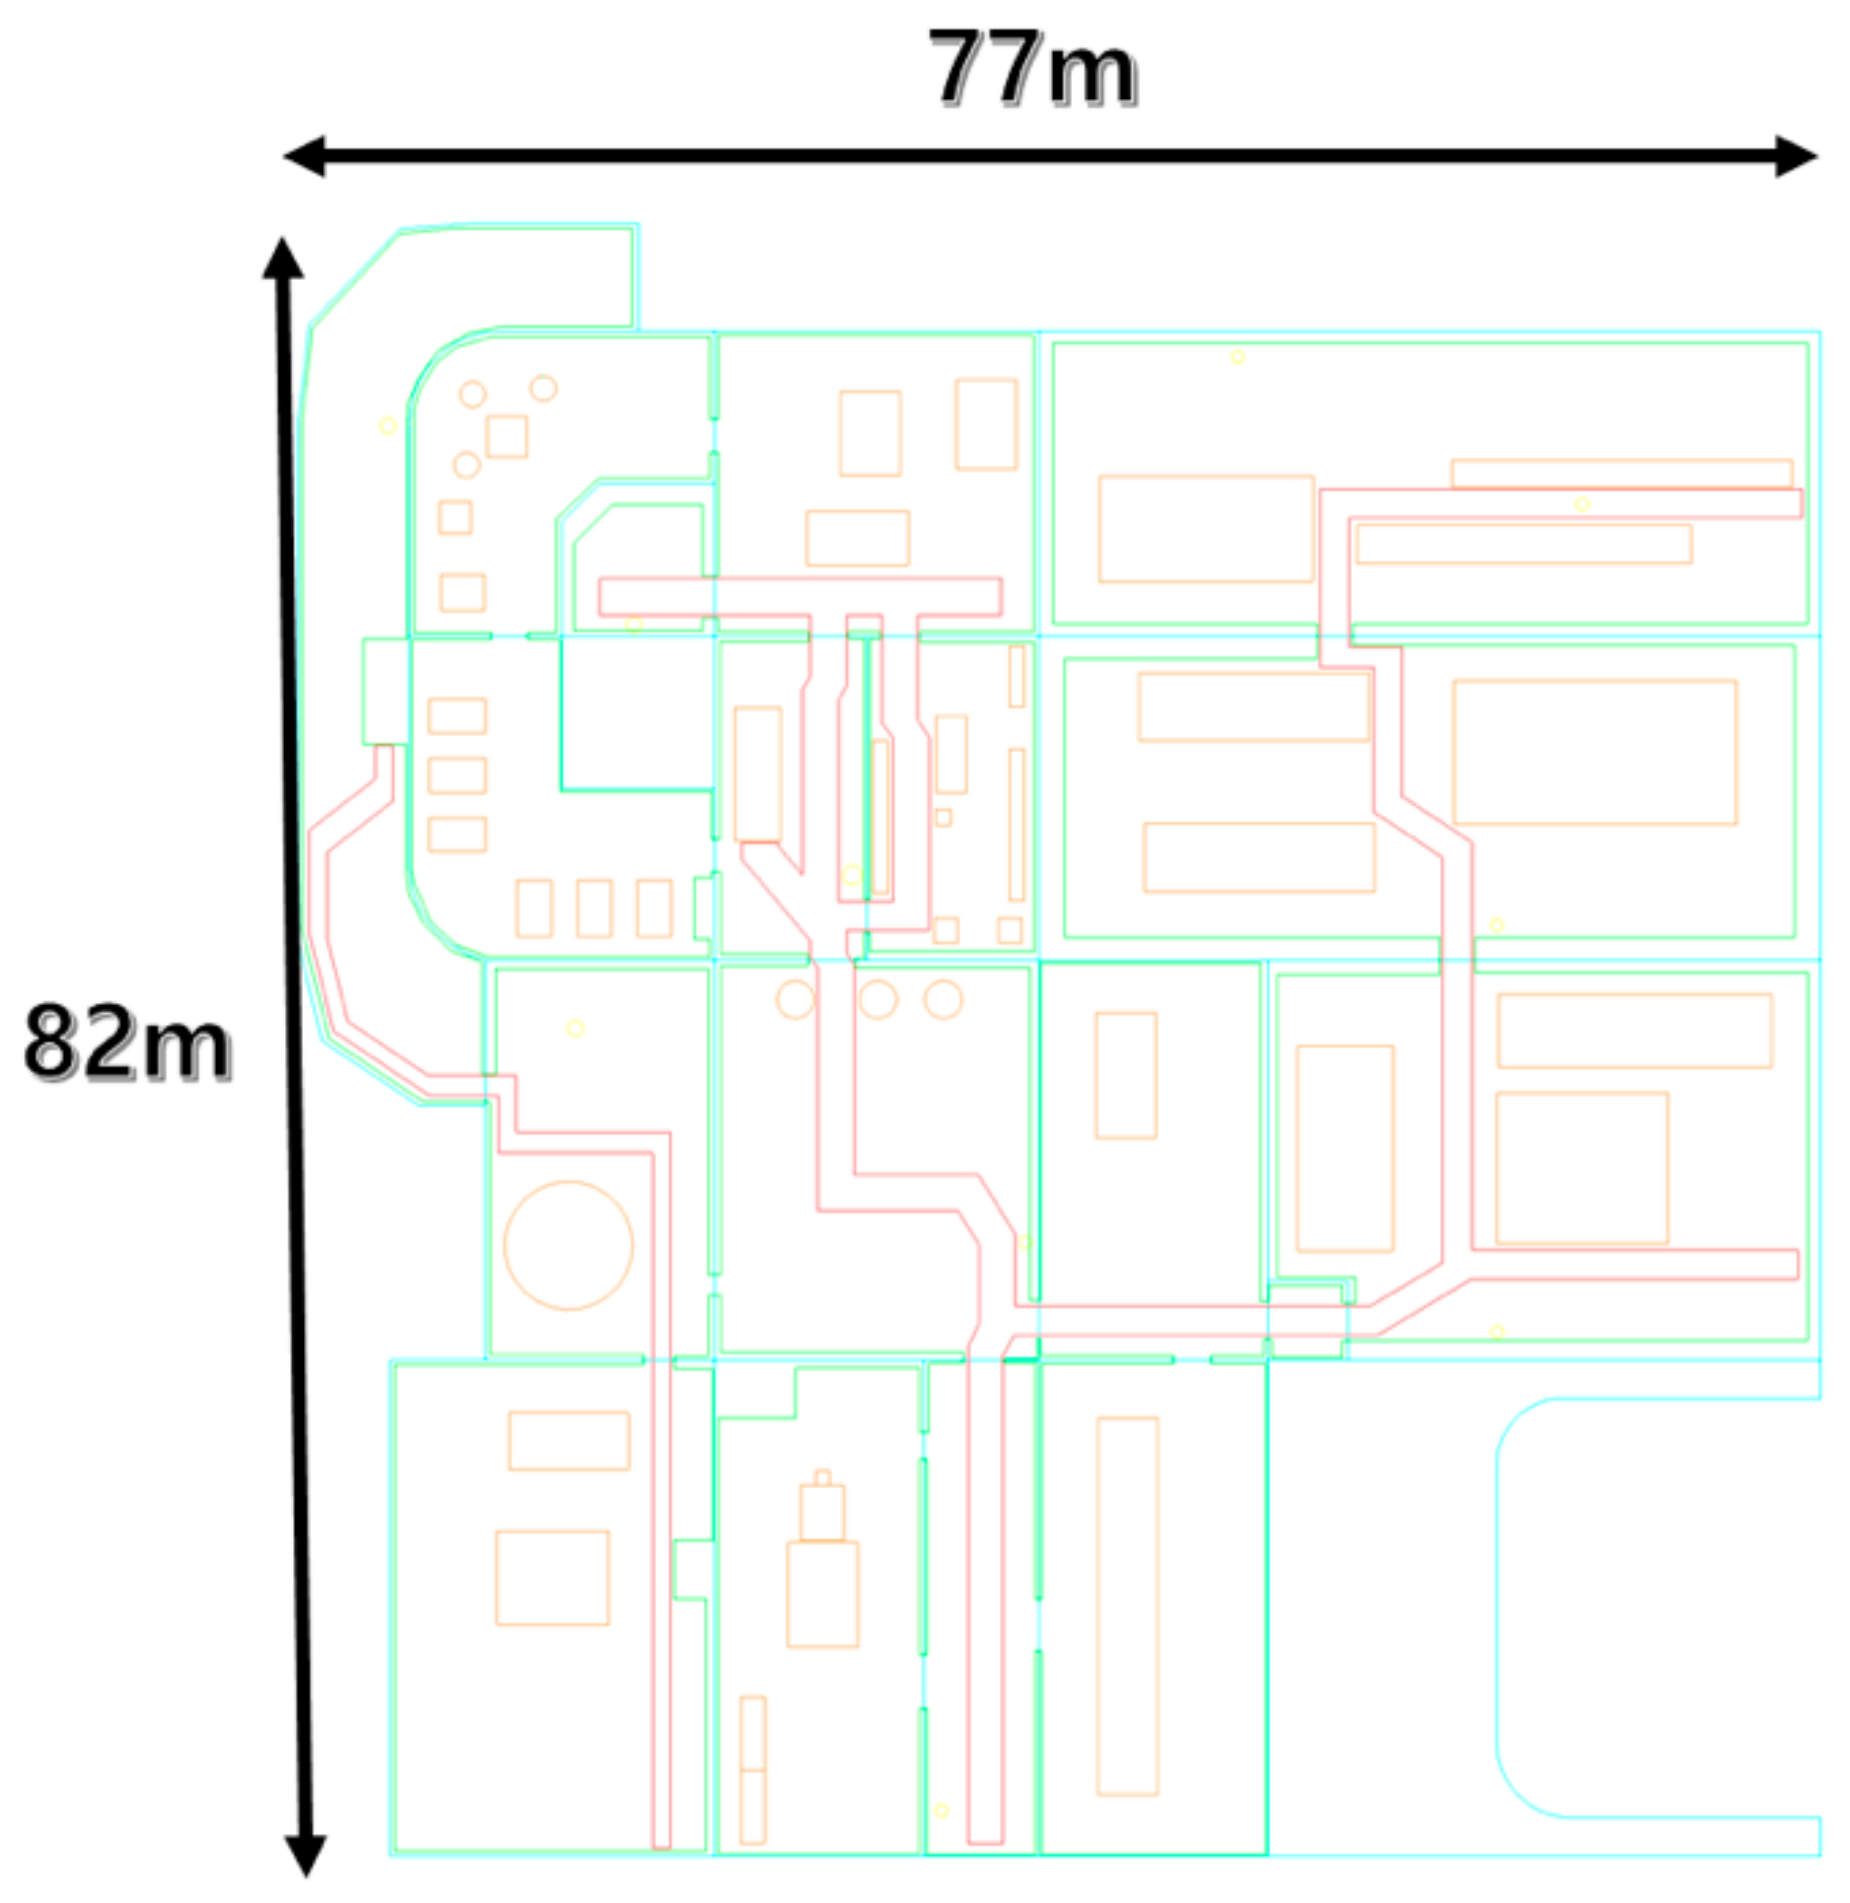
Figure 17 is a plan view of an offshore plant to be used for the simulation. The drawing represents an area that is 77 m wide and 82 m long, and the resolution of the file is 1771 × 1831 pixels.
Table 2 shows the characteristics of each element.
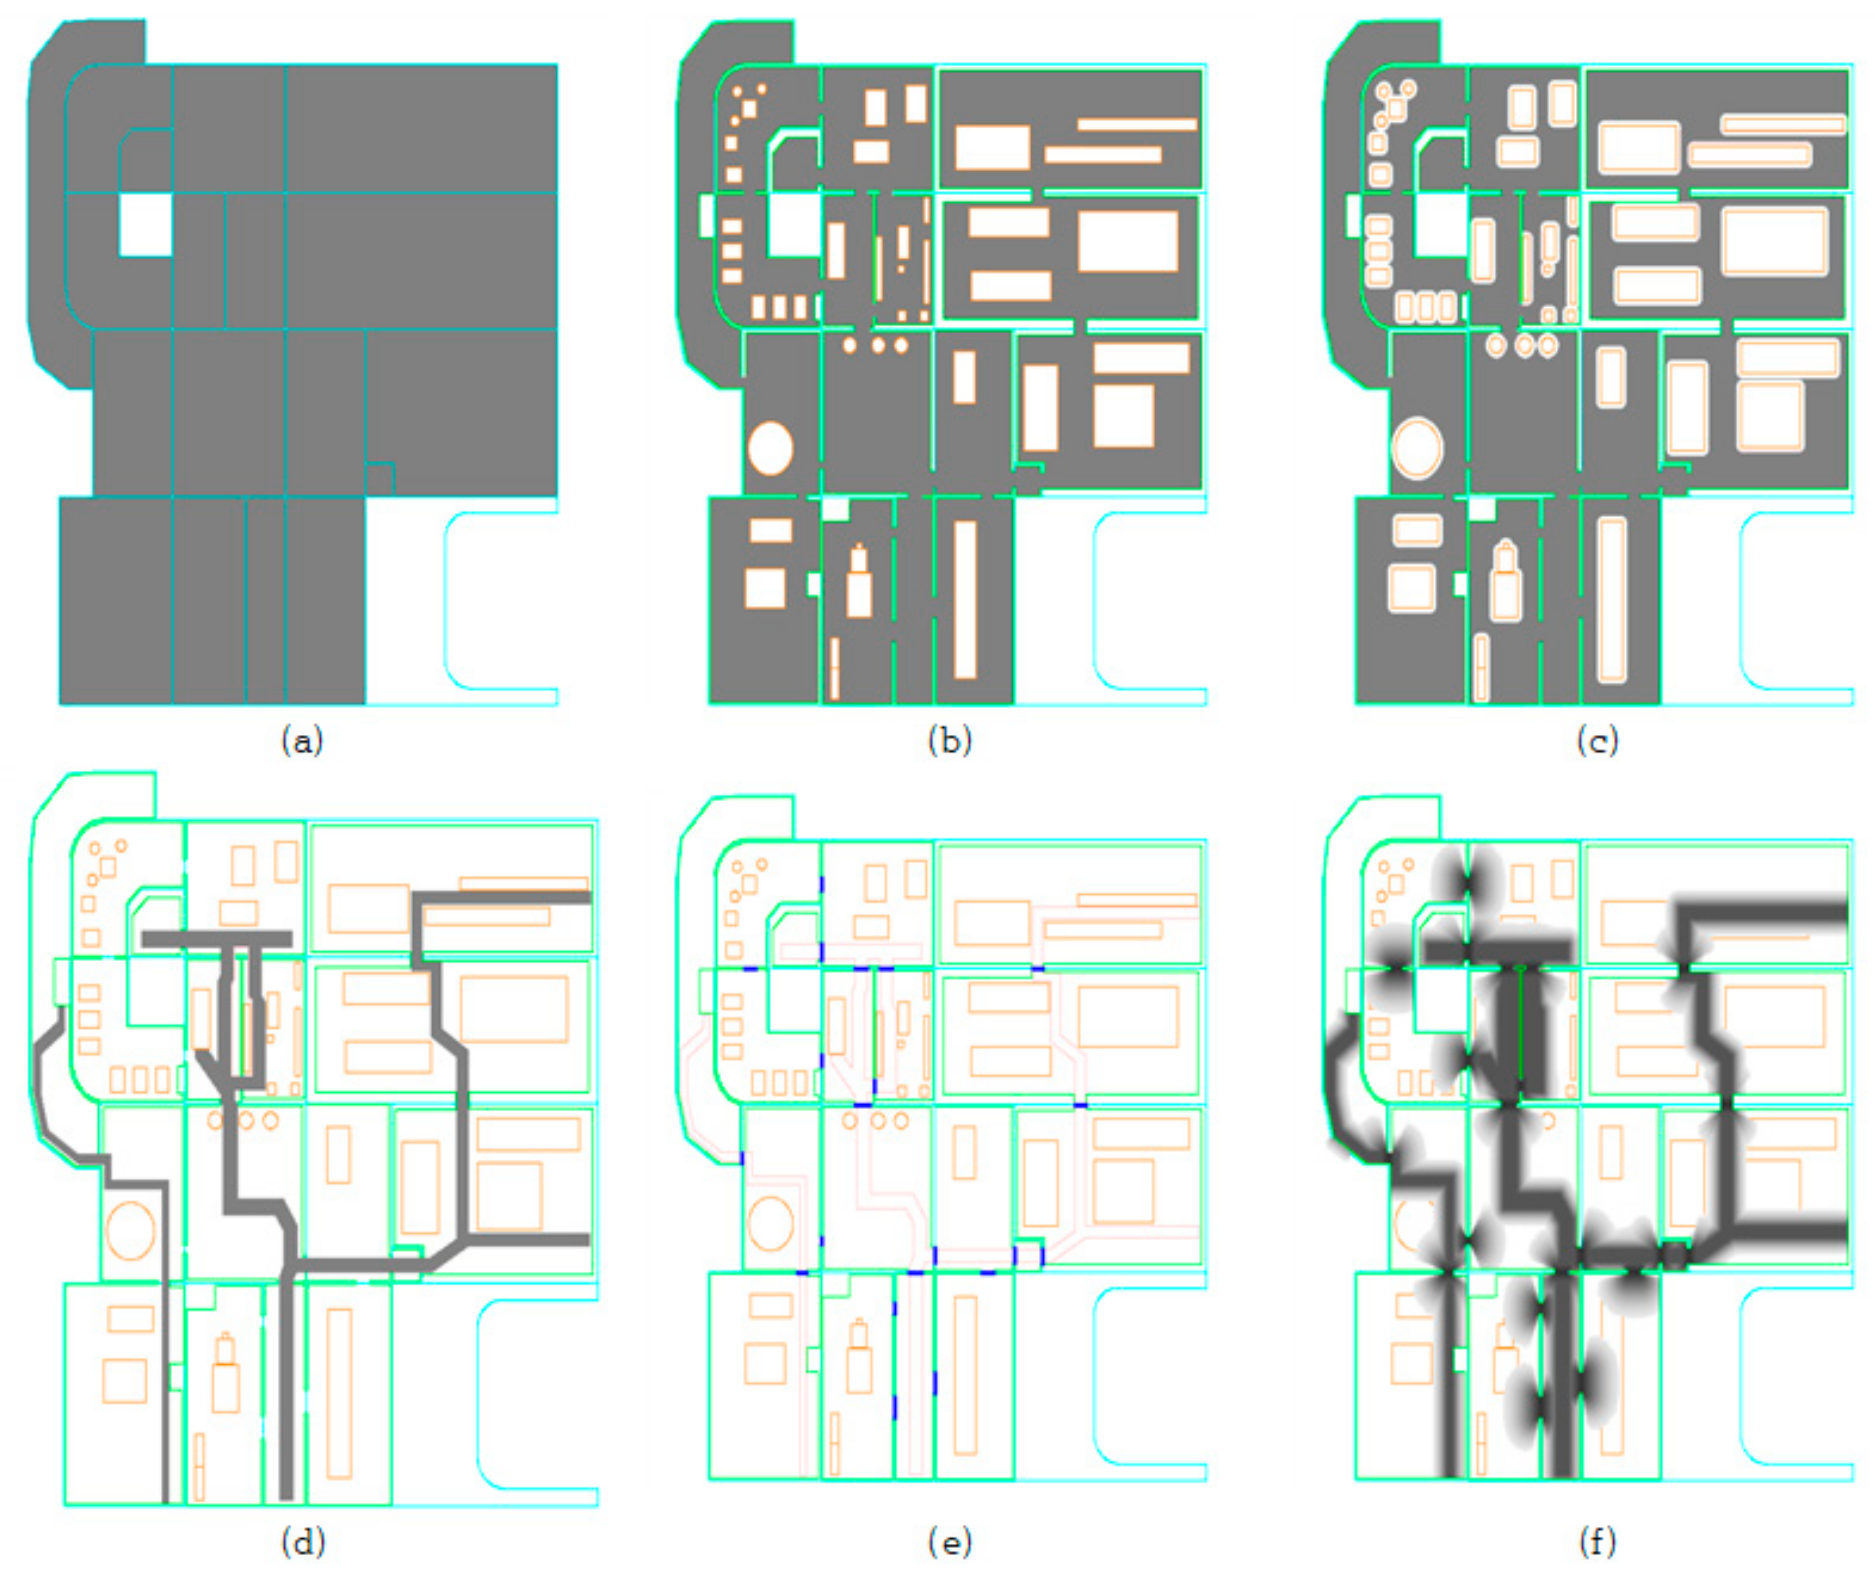
Figure 18 shows each recognition area in the drawing.
5.1. Case 1
In the option 1 batch optimization simulation, the following parameters were reflected, as shown in
Table 3.
Table 4 shows the results of the option 1 execution. In the initial arrangement process, the set maximum of 14 was arranged, showing an achievement rate of 94.43%, and in the first relocation, the central part was further covered and increased to 97.05%. Because the coverage rate has not yet reached the target of 98%, firefighting equipment was added to the upper part, and firefighting equipment originally located at the upper part was pushed down by the corner principle, and the overlapping part in the center increased. In this process, the coverage rate reached 99.75%, exceeding the target value, so the firefighting equipment that overlapped most in the center was removed. After that, additions and deletions occurred, and in the fourth relocation, the loop was detected and moved to the next step.
Based on the layout obtained up to this point, use this as the initial layout and perform rearrangement again with higher accuracy—that is, perform full deepening. In this process, the achievement rate increased from 98.94% to 99.59% due to improved accuracy, the loop was detected, and the algorithm was terminated without any change due to addition/deletion. In the final post-treatment process, as about 6 pieces of firefighting equipment in the low-preference area moved to the aisle or door, the coverage rate decreased from 99.59% to 98.09%.
The preference score is a value set for evaluation of the arrangement result. We define that the lower this value is, the better the result is to match the placement preference. Preference score is calculated as follows:
where
is the number of firefighting equipment placed, and
is the preference value of the point where each firefighting equipment is located. See Equations (1) and (2) for the preference distribution.
Table 5 shows the result of simulations obtained by repeating the test 5 times under the option 1 conditions. In option 1 simulation, there is almost no randomness.
5.2. Case 2
The option 2 optimal layout simulation reflected the following parameters, as shown in
Table 6.
Table 7 shows the results of option 2. Considering the water stream, the extinguishing area for a single piece of fire extinguishing equipment is larger than that of option 1. In the initial deployment process, a total of 4 fire hydrants were deployed, showing an achievement rate of 93.97%. After that, addition and relocation were repeated, and in the fourth relocation step, a total of 7 fire hydrants were distributed to have 100% coverage. Afterward, despite the reduction in the number of fire hydrants by one, 100% coverage was satisfied through relocation. After that, the loop was detected and terminated, and after reflecting the preference, 4 positions out of 7 fire hydrants were moved to the higher preference point without loss of coverage.
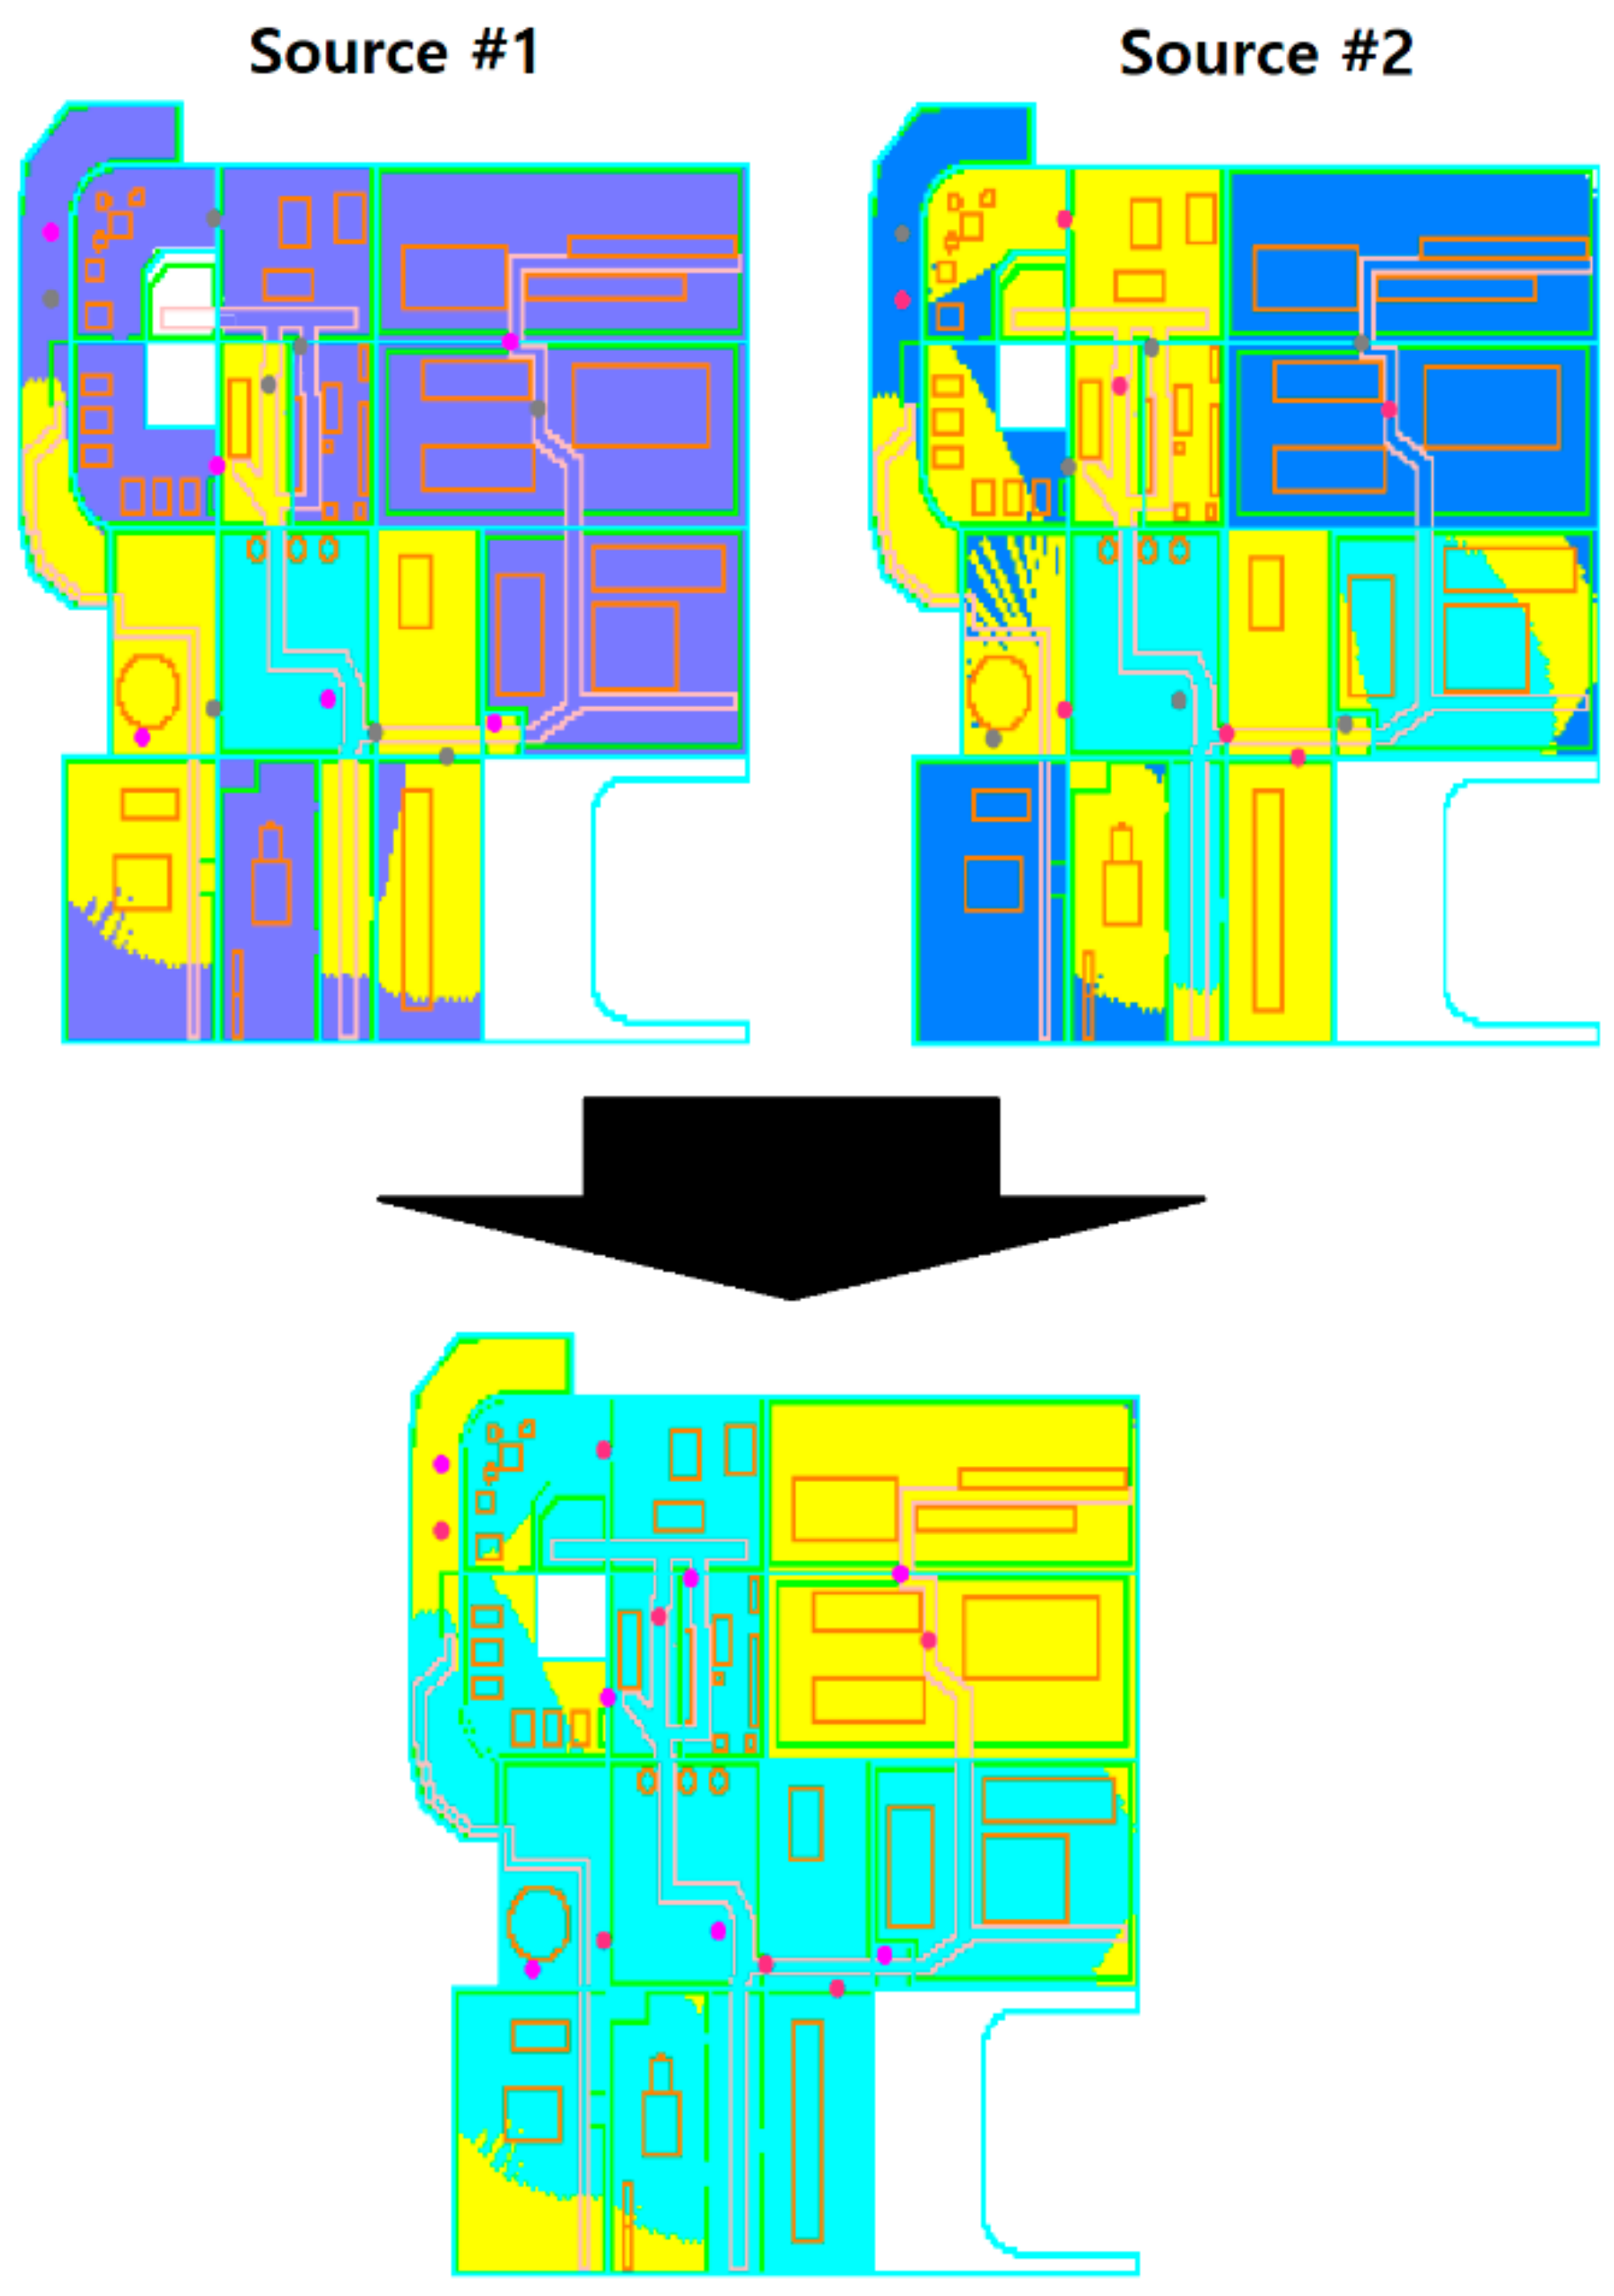
At this point, the deployment for source #1 is completed, and the hydrants corresponding to #1 have an unplaceable range of 5 m. The initial batch for source #2 was then performed. Afterward, a total of 7 fire hydrants were deployed to satisfy the 100% coverage area through a total of 7 relocations. The individual coverage areas for sources #1 and #2 are shown in
Figure 19.
Table 8 shows the result of simulations obtained by repeating the test 5 times under the option 2 conditions. Although some randomness in detailed arrangement and preference score, note that the number of firefighting equipment does not fluctuate.
6. Optional Simulation
The simulation tool of firefighting equipment arrangement optimization additionally supports the following options:
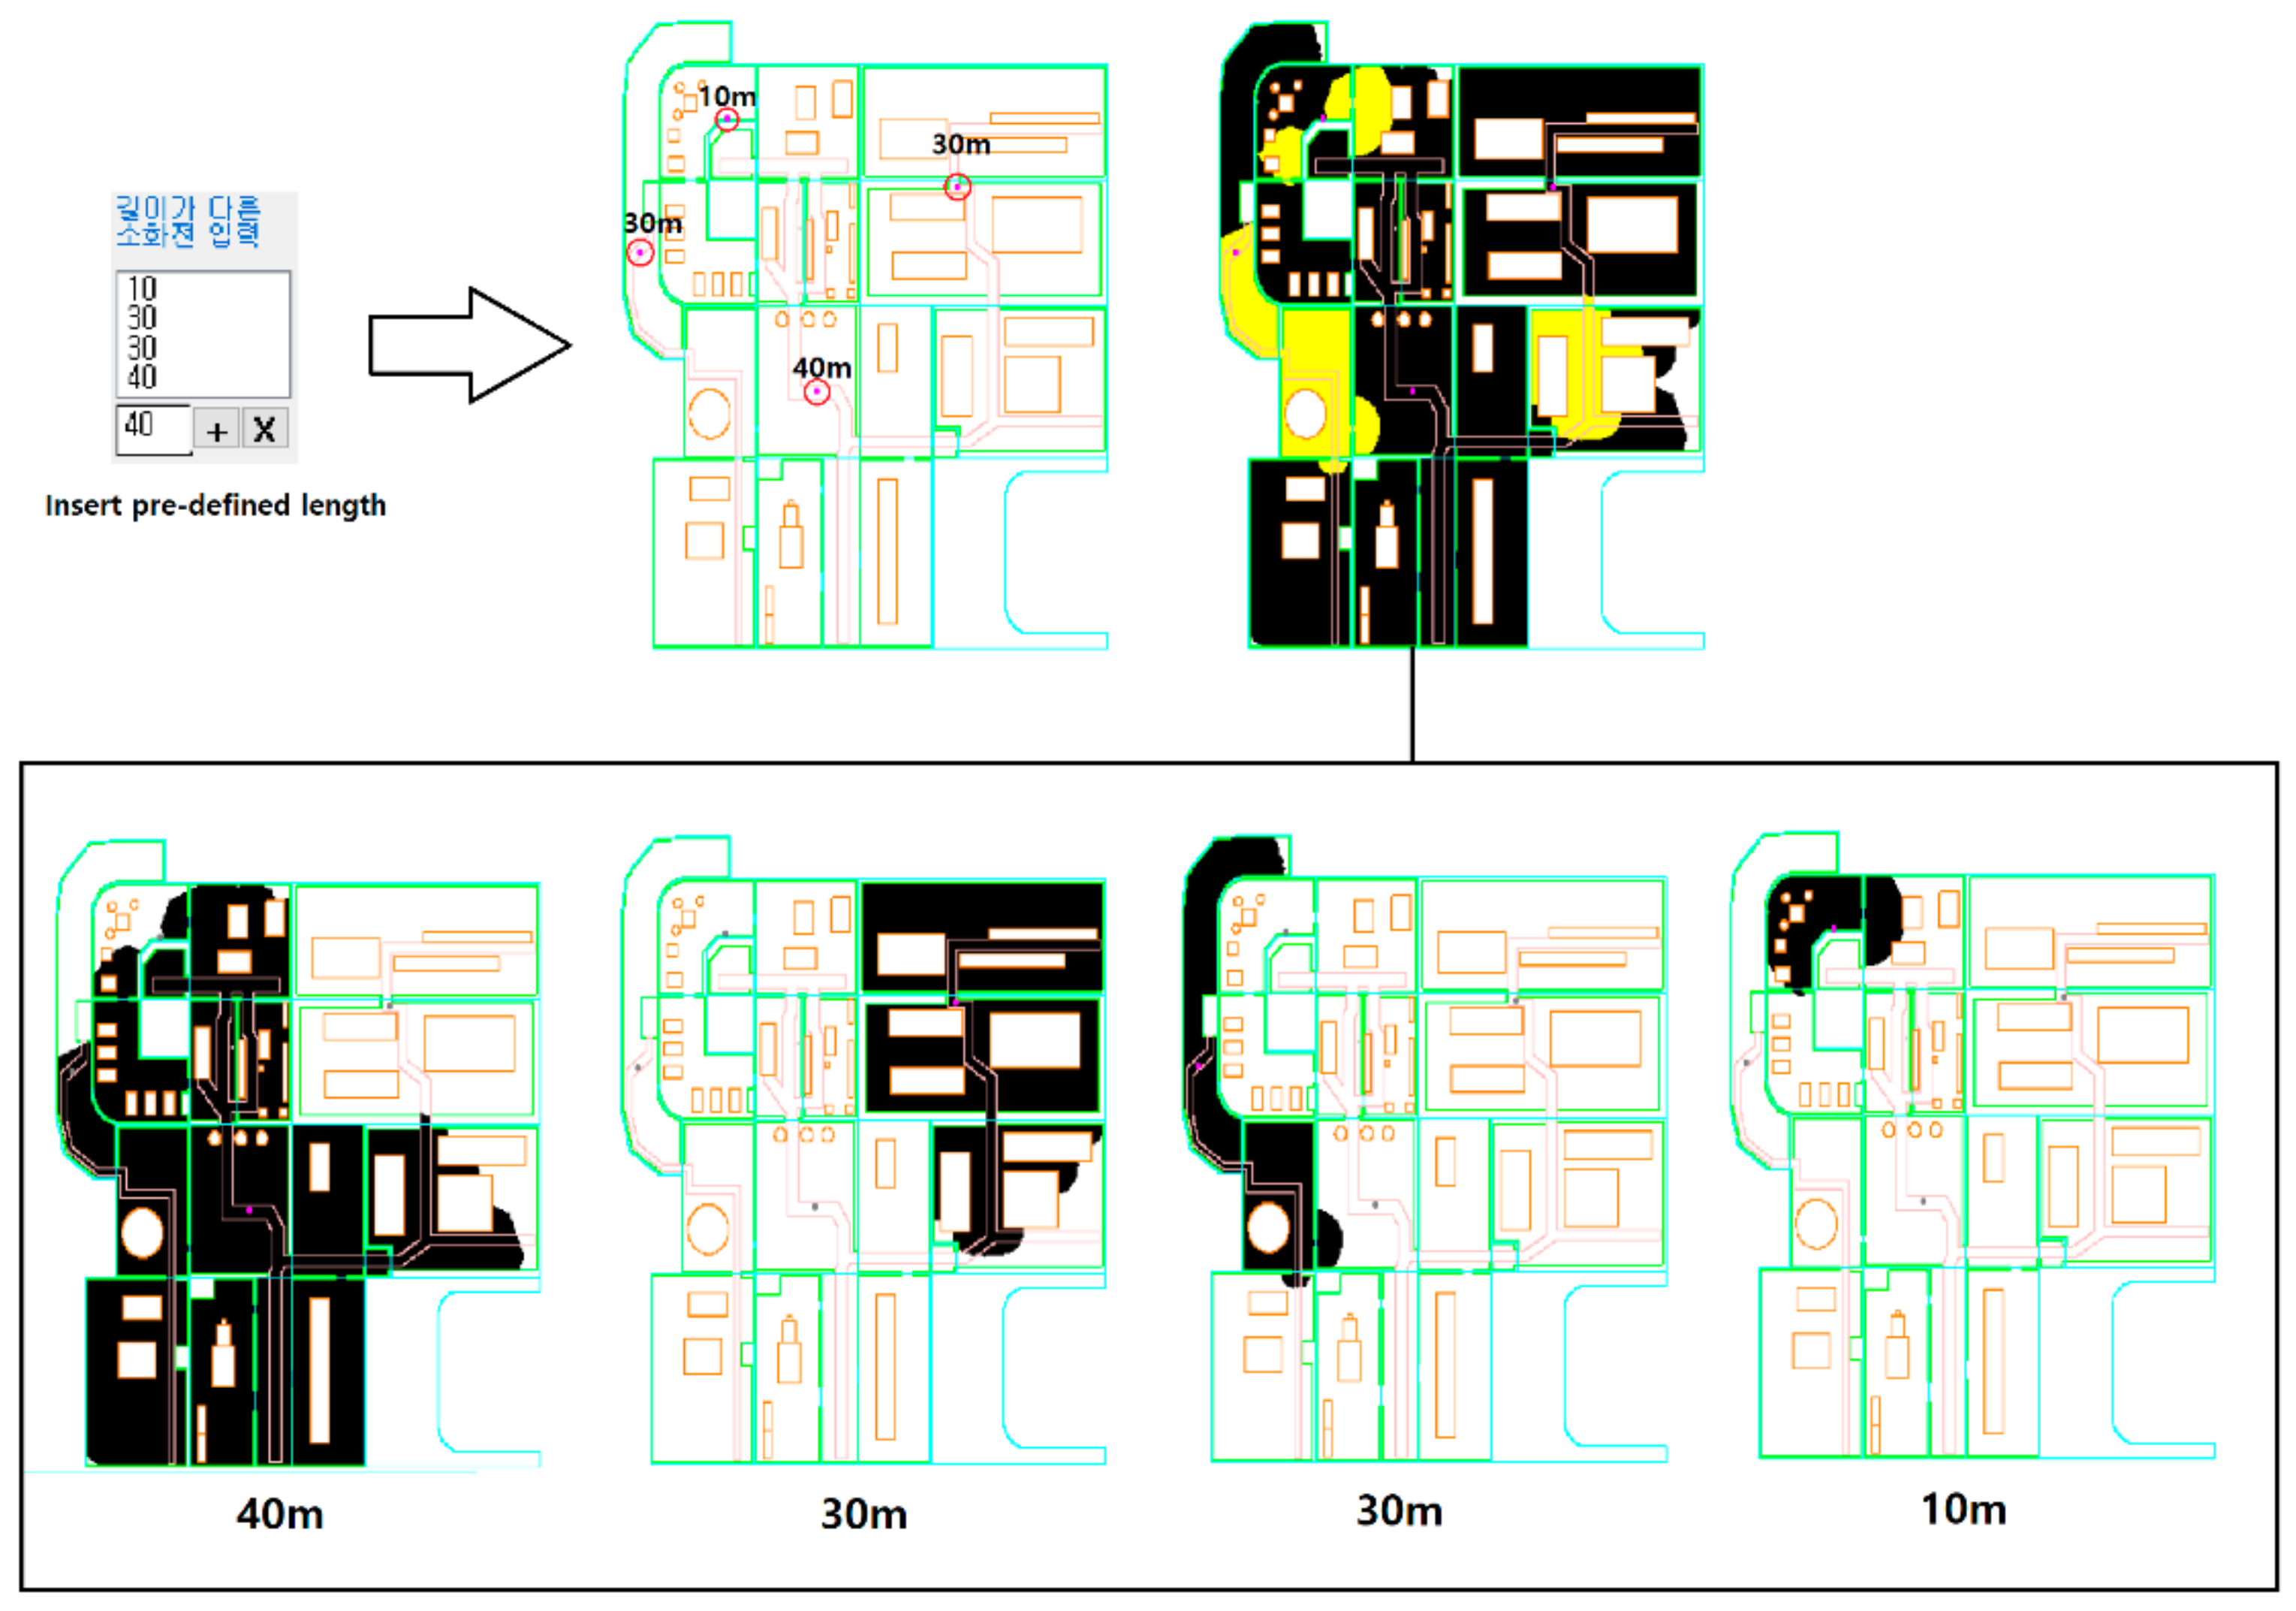
For the former, input the pre-defined hose length in the S/W UI provided. As shown in
Figure 20, place the pre-defined equipment first and fill the remaining area with a hydrant with the default hose length. The latter can also set the location and parameters of fixed equipment through S/W UI or text format input file.
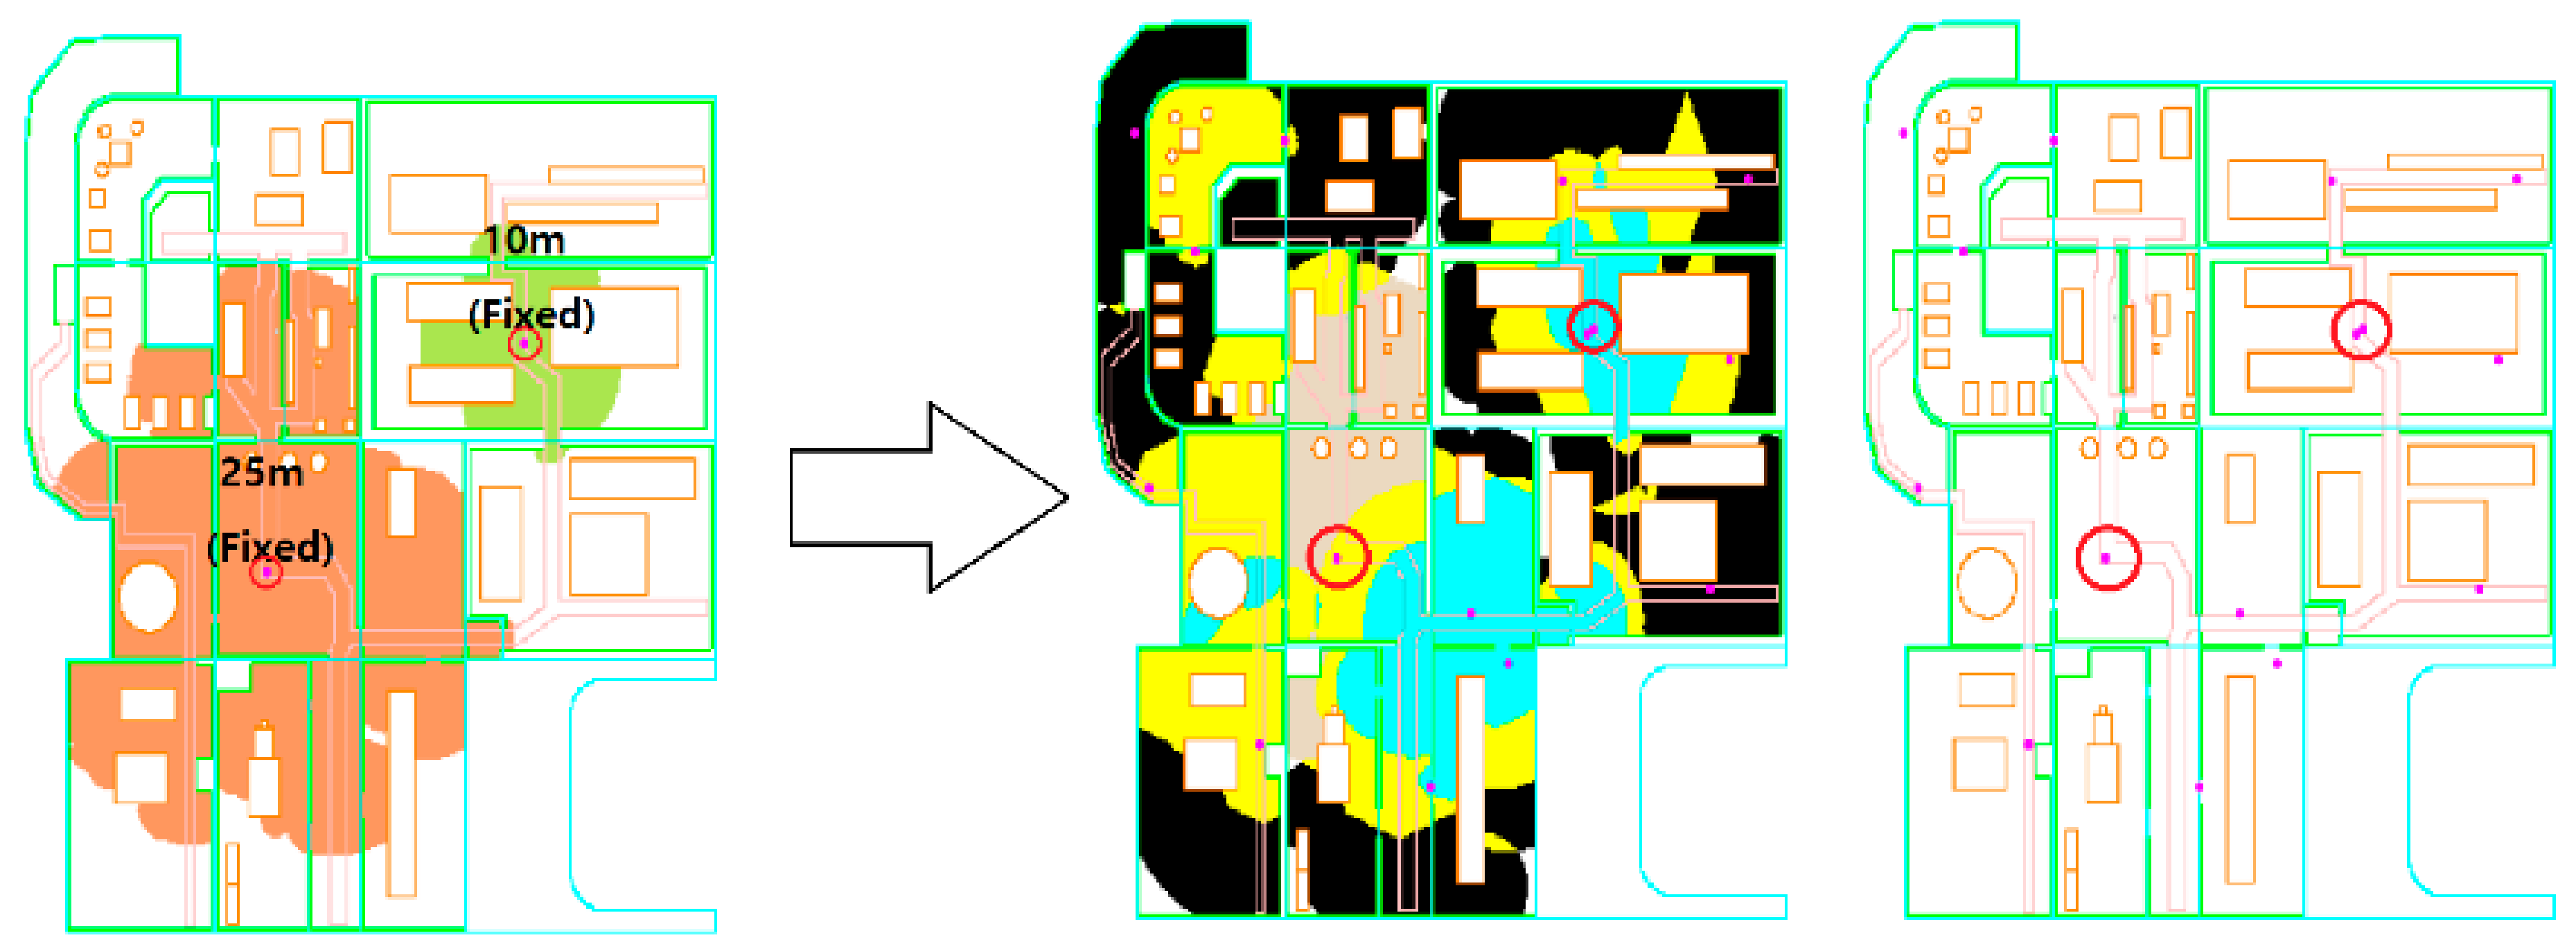
Figure 21 is an example of layout optimization in consideration of two fire hydrants fixed to the layout. Due to the preference application algorithm, another hydrant was located very close to the 10-m hose-length hydrant. To prevent this problem, future research will need to improve the objective function so that the travel distance between firefighting equipment can be uniformed.
7. Conclusions
This study deals with the methodology of the optimal arrangement of fire hydrants/equipment for the initial suppression of fire in offshore platforms. First, prior to the optimization, a study was conducted to acquire a search area to derive a firefighting area that a single piece of firefighting equipment can cover.
In the process, to reflect the characteristics of people who can move in any direction in the problem of facility location, which is a similar field of existing research, instead of the road network defined as a design space graph, the design space is defined in an equal grid method. A modified iterative depth increase search (IDAAS) method that combines acquisition and iterative depth increase is proposed. In addition, IDAAS can be used to compare and analyze the accuracy and time performance of the IDAAS method, according to various parameters such as obstacle distribution of fire targets, the definition of adjacent trunk lines of the grid, resolution, and deepening order; in this process, it can be used to obtain a cover area reflecting movement in any direction. It is more intuitive than other algorithms that exist, and it has been verified that the results are stably derived without special exceptions. The speed performance is also excellent. Also, the most appropriate parameters to be used for IDAAS are presented.
Next, we proposed a modified greedy method that performs an efficient layout by combining the results of IDAAS execution for various coordinates and utilizing geometric features, such as continuity of the cover area and processing at corners. In MGM, the design basis for each process was validated by simulation through simple drawings. Finally, by performing an optimal placement simulation on the actual offshore platform design drawing, we obtained the approximate optimal placement for two placement options, revealing that this study is useful for actual firefighting plans beyond the test drawing level.
This series of processes can be applied not only to marine and firefighting-related fields, but also to most of the problems similar to facility location if it is configured in a grid environment; these problems include the deployment of public goods in various buildings and the case of game programming mentioned in the introduction.
Author Contributions
Conceptualization, H.C.; Methodology, B.C.L.; Software, B.C.L.; Validation, Y.C., B.C.L., and H.C.; Formal Analysis, H.C. and B.C.L.; Investigation, H.C. and B.C.L.; Data curation, Y.C.; Writing—original draft preparation, B.C.L., and H.C.; Writing—review and editing, H.C., B.C.L., and Y.C.; Supervision, H.C.; Project administration, Y.C. and H.C. All authors have read and agreed to the published version of the manuscript.
Funding
This research was financially supported by the Institute of Civil Military Technology Cooperation, an institute funded by the Defense Acquisition Program Administration and Ministry of Trade, Industry and Energy of Korean government under grant no. UM19304RD3, and by the research fund of Chungnam National University.
Institutional Review Board Statement
Not applicable.
Informed Consent Statement
Not applicable.
Data Availability Statement
Conflicts of Interest
The funders had no role in the design of the study; in the collection, analyses, or interpretation of data; in the writing of the manuscript, or in the decision to publish the results.
References
- Robertson, G.G. Composite Materials for Offshore Operations; Imist: Kent, UK, 1993; p. 83. [Google Scholar]
- Anderson, J. Qatar Offshore Rig Catches Fire 6 Workers Injured; Sostre News Report: Los Angeles, CA, USA, 2016. [Google Scholar]
- National Fire Protection Association. Standard NFPA 10: Standard for Portable Fire Extinguishers; National Fire Protection Association: Quincy, MA, USA, 2013. [Google Scholar]
- State of Oregon. Oregon Fire Code; ICC International Code Council: Country Club Hills, IL, USA, 2007; pp. 407–408. [Google Scholar]
- Ministry of the Interior and Safety. National Fire Safety Code 101 (NSFC 1010); Ministry of the Interior and Safety: Seoul, Korea, 2017. (In Korean) [Google Scholar]
- Ministry of Oceans and Fisheries. Ship Firefighting Equipment Standards; Ministry of Oceans and Fisheries: Seoul, Korea, 2016. (In Korean) [Google Scholar]
- Det Norske Veritas. DNV-OS-D301: Fire Protection—Rules and Standards; DNV: Høvik, Norway, 2013. [Google Scholar]
- Owen, S.H.; Daskin, M.S. Strategic facility location: A review. Eur. J. Oper. Res. 1998, 111, 423–447. [Google Scholar] [CrossRef]
- Farahani, R.Z.; Asgari, N.; Heidari, N.; Hosseininia, M.; Goh, M. Covering problems in facility location: A review. Comput. Ind. Eng. 2012, 62, 368–407. [Google Scholar] [CrossRef]
- Huang, B.; Liu, N.; Chandramouli, M. A GIS supported Ant algorithm for the linear feature covering problem with distance constraints. Decis. Support Syst. 2006, 42, 1063–1075. [Google Scholar] [CrossRef]
- Dantrakul, S.; Likasiri, C.; Pongvuthithum, R. Applied p-median and p-center algorithms for facility location problems. Expert Syst. Appl. 2014, 41, 3596–3604. [Google Scholar] [CrossRef]
- Aneja, Y.P.; Parlar, M. Algorithms for Weber facility location in the presence of forbidden regions and/or barriers to travel. Transp. Sci. 1994, 28, 70–76. [Google Scholar] [CrossRef][Green Version]
- Available online: http://1nsane.info/map/maptest.html (accessed on 3 December 2020).
- Dijkstra, E.W. A note on Two Problems in Connexion with Graphs. Numer. Math. 1959, 1, 269–271. [Google Scholar] [CrossRef]
- Daniel, K.; Nash, A.; Koenig, S.; Felner, A. Theta*: Any-Angle Path Planning on Grids. J. Artif. Intell. Res. 2010, 39, 533–579. [Google Scholar] [CrossRef]
- Thorpe, C.; Matthies, L. Path relaxation: Path planning for a mobile robot. In Proceedings of the OCEANS 1984, Washington, DC, USA, 10–12 September 1984; IEEE: New York, NY, USA, 1984; pp. 576–581. [Google Scholar]
- Yap, P.; Burch, N.; Holte, R.C.; Schaeffer, J. Block A*: Database-Driven Search with Applications in Any-Angle Path-Planning. In Proceedings of the Twenty-Fifth AAAI Conference on Artificial Intelligence, San Francisco, CA, USA, 7–11 August 2011. [Google Scholar]
- Ferguson, D.; Stentz, A. Using interpolation to improve path planning: The Field D* algorithm. J. Field Robot. 2006, 23, 79–101. [Google Scholar] [CrossRef]
- Feige, U. A threshold of ln n for approximating set cover. J. ACM 1998, 45, 634–652. [Google Scholar] [CrossRef]
- Dobson, G. Worst-case analysis of greedy heuristics for integer programming with nonnegative data. Math. Oper. Res. 1982, 7, 515–531. [Google Scholar] [CrossRef]
Figure 1.
I/O definition.
Figure 1.
I/O definition.
Figure 2.
Design Space Definition.
Figure 2.
Design Space Definition.
Figure 3.
Concept of iterative-deepening search.
Figure 3.
Concept of iterative-deepening search.
Figure 4.
Overall process of IDAAS.
Figure 4.
Overall process of IDAAS.
Figure 5.
Process of iterative-deepening any-angle search (IDAAS). (a) Dijkstra result; (b) obtaining path of a single outermost point; (c) the shortest distance in any-angle search; (d) and (f) results of any-angle search; (e) 1st deepening; (g) 2nd deepening; and (h) final coverage.
Figure 5.
Process of iterative-deepening any-angle search (IDAAS). (a) Dijkstra result; (b) obtaining path of a single outermost point; (c) the shortest distance in any-angle search; (d) and (f) results of any-angle search; (e) 1st deepening; (g) 2nd deepening; and (h) final coverage.
Figure 6.
Selective depth-increasing properties.
Figure 6.
Selective depth-increasing properties.
Figure 7.
Pseudo-code of IDAAS.
Figure 7.
Pseudo-code of IDAAS.
Figure 8.
Coverage of fire hydrant considering water stream.
Figure 8.
Coverage of fire hydrant considering water stream.
Figure 9.
Overall process of arrangement optimization.
Figure 9.
Overall process of arrangement optimization.
Figure 10.
Pseudo-code of arrangement optimization.
Figure 10.
Pseudo-code of arrangement optimization.
Figure 11.
(a) overlap condition, and (b) double-covered condition.
Figure 11.
(a) overlap condition, and (b) double-covered condition.
Figure 12.
Simple arrangement optimization using the greedy method.
Figure 12.
Simple arrangement optimization using the greedy method.
Figure 13.
Corner characteristic of arrangement algorithm: (a) fire hydrant #1 is pushed into the orange area, (b) fire hydrant #2 is located too far inside the corner, (c) fire hydrant movement does not change the coverage area, and (d) the ideal location of fire hydrant #2.
Figure 13.
Corner characteristic of arrangement algorithm: (a) fire hydrant #1 is pushed into the orange area, (b) fire hydrant #2 is located too far inside the corner, (c) fire hydrant movement does not change the coverage area, and (d) the ideal location of fire hydrant #2.
Figure 14.
Movement of firefighting equipment during rearrangement.
Figure 14.
Movement of firefighting equipment during rearrangement.
Figure 15.
20 directions adjacent.
Figure 15.
20 directions adjacent.
Figure 16.
Coverage rate queue.
Figure 16.
Coverage rate queue.
Figure 17.
The drawing of an offshore plant to be used for case study.
Figure 17.
The drawing of an offshore plant to be used for case study.
Figure 18.
Area definition. (a) Coverable area by water stream; (b) coverable area by firefighting equipment; (c) placeable area; (d) path; (e) doors; and (f) preference map.
Figure 18.
Area definition. (a) Coverable area by water stream; (b) coverable area by firefighting equipment; (c) placeable area; (d) path; (e) doors; and (f) preference map.
Figure 19.
The coverage for each source.
Figure 19.
The coverage for each source.
Figure 20.
Option 1 arrangement optimization with pre-defined hose lengths.
Figure 20.
Option 1 arrangement optimization with pre-defined hose lengths.
Figure 21.
Option 1 arrangement optimization with two fixed firefighting equipment.
Figure 21.
Option 1 arrangement optimization with two fixed firefighting equipment.
Table 1.
Options in firefighting equipment arrangement optimization.
Table 1.
Options in firefighting equipment arrangement optimization.
| Option 1 | Option 2 |
|---|
Do not consider the water stream (water spray length = 0). The coverage area of firefighting equipment must overlap the area of other firefighting equipment ( Figure 11a). The goal is to satisfy the target coverage rate with the smallest number of pieces of firefighting equipment. The entire firefighting area is defined as all routes that can be carried by humans. Preference points are given to places where placement preference is high, such as doors or passages. This does not take precedence over minimizing the number of pieces of firefighting equipment.
| Consider spraying water (water spray length ≠ 0). Sources of fire extinguishing water, i.e., main and emergency fire pumps, do not affect each other. Both sources must cover 100% of the target coverage area ( Figure 11b). There is a minimum arrangement distance between firefighting equipment with different sources. Assume that all points where water can reach are the entire coverage area. Preference points are given to places where placement preference is high, such as doors or passages. This does not take precedence over minimizing the number of pieces of firefighting equipment.
|
Table 2.
Properties of components of the drawing.
Table 2.
Properties of components of the drawing.
| Component | Color | Passable
for People | Passable for
Water Stream | Preference |
|---|
| Equipment | Orange | X | O | X |
| Wall | Sky Blue | O | X | X |
| Obstacle | Green | X | O | X |
| Path | Red | O | O | O |
| Door | - | O | O | O |
Table 3.
Parameters of option 1 arrangement optimization simulation.
Table 3.
Parameters of option 1 arrangement optimization simulation.
| Travel Distance | 15 m |
| Water stream length | 0 m |
| Grid size | 5 |
| Initial deepening order | 2 |
Path preference
Reduction rate per meter | 2
0.2 |
Door preference
Reduction rate per meter | 4
0.5 |
| Target rate of coverage | 98% |
Maximum # of
initial firefighting equipment | 14 |
Table 4.
Simulation results of option 1.
Table 5.
Option 1 iterative simulation result.
Table 5.
Option 1 iterative simulation result.
| | # of Trial | Mean | Standard
Deviation |
|---|
| 1 | 2 | 3 | 4 | 5 |
|---|
Result
Figure |  | | |
| # of equipment placed | 14 | 14 | 0 |
| PreferenceScore | 6.055 | 6.055 | 0 |
| Final coverage rate | 98.09% | 98.09% | 0 |
Table 6.
Parameters of option 2 arrangement optimization simulation.
Table 6.
Parameters of option 2 arrangement optimization simulation.
| Travel Distance | 15 m |
| Water stream length | 15 m |
| Grid size | 9 |
| Initial deepening order | 1 |
Path preference
Reduction rate per meter | 2
0.2 |
Door preference
Reduction rate per meter | 4
0.5 |
| Target rate of coverage | 100% |
Maximum # of
firefighting equipment | 14 |
| Minimum distance between firefighting equipment with different sources | 5 m |
Table 7.
Simulation results of option 2.
Table 8.
Option 2 iterative simulation result.
| Publisher’s Note: MDPI stays neutral with regard to jurisdictional claims in published maps and institutional affiliations. |
© 2021 by the authors. Licensee MDPI, Basel, Switzerland. This article is an open access article distributed under the terms and conditions of the Creative Commons Attribution (CC BY) license (https://creativecommons.org/licenses/by/4.0/).


