Abstract
This study presents the full-scale resistance and seakeeping performance of an awarded Double-M craft designed as a 15 m next-generation Emergency Response and Rescue Vessel (ERRV). For this purpose, the Double-M craft is designed by comprising the benchmark Delft 372 catamaran with an additional center and two side hulls. First, the resistance and seakeeping analyses of Delft 372 catamaran are simulated on the model scale to verify and compare the numerical setup for Fr = 0.7. Second, the seakeeping performance of the full-scale Double-M craft is examined at Fr = 0.7 in regular head waves (λ/L = 1 to 2.5) for added resistance and 2-DOF motion responses. The turbulent flow is simulated by the unsteady RANS method with the Realizable Two-Layer k-ε scheme. The calm water is represented by the flat VOF (Volume of Fluid) wave, while the incident long waves are represented by the fifth-order Stokes wave. The residual resistance of the Double-M craft is improved by 2.45% compared to that of the Delft 372 catamaran. In the case of maximum improvement (at λ/L = 1.50), the relative added resistance of the Double-M craft is 10.34% lower than the Delft 372 catamaran; moreover, the heave and pitch motion responses were 72.5% and 35.5% less, respectively.
1. Introduction
There is a great interest in multi-hull ships in the design orientations preferred as the new generation. Multi-hull vessels provide an alternative design feature compared to their single-hull counterparts due to their greater transverse stability, larger deck area, greater payload, and improved seakeeping characteristics. For this reason, the next generation multi-hull vessels are a hot topic with different hull numbers and interference configurations considering the desired design criteria.
Most of the studies on multi-hull vessels in the past consist of studies in which the benchmark Delft catamaran model 372 is preferred. Van’t Veer [1] provided comprehensive validation data of the Delft 372 catamaran hull. In the study, a series of experiments were conducted in the Delft Ship Hydrodynamics Laboratory, assessing calm water resistance for 0.18 ≤ Fr ≤ 0.75, in addition, to heave and pitch motions in regular waves for 0.3 ≤ Fr ≤ 0.75. Interference effect on resistance, trim, and sinkage characteristics is examined by He et al. [2], results have shown that for the range of Fr = 0.45–0.65, the Delft 372 catamaran has a higher resistance coefficient with respect to the monohull; however, outside this range, the effect of hull spacing on resistance, sinkage or trim can be neglected. Castiglione et al. [3] performed numerical analyses on the Delft 372 hull to determine the capability of URANS (Unsteady Reynolds Averaged Navier–Stokes) in the prediction of seakeeping characteristics of the fast catamaran and concluded that the URANS method is successful in estimating ship motion with great accuracy. Bouscasse et al. [4] experimentally examined the seakeeping performance of a high-speed Delft 372 catamaran advancing in transient, regular, and irregular waves in the CNR-INSEAN towing tank. The response amplitude operator features with the seakeeping transient test, the effect of the wave steepness on the added resistance with regular wave tests, the seakeeping properties of the vessels in real scenarios with the irregular wave are examined. He et al. [5] performed ship motion analyses as well as total and added resistance calculations for Fr = 0.5 at sea state six in head waves. The paper proposed some approaches for stochastic analysis of forces, motions, and slamming loads in irregular and regular waves. In the study of Dogrul et al. [6], interference factor through total and added resistance of Delft 372 catamaran hull was examined by the unsteady RANS method at Fr = 0.3 in regular head wave conditions.
For multi-hull vessels, there is a huge gap in hydrodynamics and seakeeping issues to be examined. Especially, available analytical and potential methods may be insufficient to clarify the effect of increasing the number of hulls on flow characteristics, so experimental fluid dynamics (EFD) and computational fluid dynamics (CFD) methods are frequently preferred. It is difficult and expensive to experimentally examine multi-hull vessels due to the occurs of wall effects when the total beam length increases, and the flow dissimilarities occur when the beam length is reduced. For this reason, the CFD method is preferred as a convenient way to predict the seakeeping performance of multi-hull vessels due to its increased computational power and capability. In the past, Li et al. [7] numerically studied the hydrodynamic characteristics and longitudinal motions of a trimaran vessel in regular head waves with varying wave slopes. The nonlinear effects of wave slopes on the hydrodynamic coefficients and vertical motion of the trimaran are also discussed in the study. Nowruzi et al. [8] investigated the motion responses in various head seas conditions of a high-speed trimaran model using the unsteady RANS method. It is emphasized that the CFD method is more accurate in predicting the motions of trimaran at high speeds since it also considered the effect of the breaking waves compared to the methods based on the strip theory. Duan et al. [9] examined the 2.5D method on estimation of added resistance along with trimaran motion in head waves and reported that the 2.5D method provides adequate estimations of both vertical motions and added resistance for a Froude number range of 0.353–0.471. Gong et al. [10] studied added resistance and the performance in seakeeping of a trimaran in oblique waves using various wave steepness, wavelengths, wave angles, and Froude numbers. They deducted that added resistance and ship motion is impacted by the wave steepness and incident wave angle substantially as the difference of added resistance between smallest and largest wave steepness appeared to be around 30%. Sun et al. [11] studied the effects of tunnels and demi-hulls on the performance of a planning trimaran. They found out that the presence of tunnels and demi-hulls decreases the drag force on the trimaran and enhances longitudinal stability of ship motions, increasing the length of the demi-hulls would decrease the resistance however it would also decrease motion stability. Ghadimi et al. [12] also conducted a numerical study on a trimaran motions in regular and irregular waves. The CFD results validated with both experimental and 3D panel method data. Nazemian and Ghadimi [13] proposed a surrogate model to figure out hydrodynamic and seakeeping performances of a trimaran by considering various vertical, longitudinal and transversal positions of side hulls. A decrease of 6.9% was achieved for the total resistance, while an improvement of 4.7% was achieved in ship motions. In another study, Nazemian and Ghadimi [14] developed an optimization process for different geometrical parameters of a trimaran which shortens the optimization process and provides considerable resistance reduction. Yildiz et al. [15] highlighted the CFD method as a robust tool for the estimation of resistance characteristics of a trimaran by performing experiments using several different outrigger configurations and comparing the results to numerical ones. Caprio et al. [16] carried out an experimental study on the feasibility of a staggered catamaran in different length to displacement ratios for Froude numbers below 0.5. A numerical study, using Rankine source-based, linear, and 3D Boundary Element Method (BEM) has been carried out by Vernengo et al [17] investigating added resistance of a catamaran in regular waves and a seaway via varying static trim, encounter angle, hull separation, and forward speed.
CFD methods have also provided a great facility in the physical process of seakeeping predictions, especially in both linear and non-linear wave conditions. There are also some fundamental studies on seakeeping and added resistance of monohull vessels which helped to advance this study. Guo et al. [18] studied ship motions and effects of ship motions on added resistance for KRISO Very Large Crude Carrier (KVLCC2) form, they concluded that motion-induced resistance can be neglected for λ < 0.6 LBP and RANS is a better method than strip theory for added resistance calculations whereas ship motions can be predicted precisely for both methods. Tezdogan et al. [19] examined both ship motions and added resistance of the KRISO Container Ship (KCS) by the URANS method and predicting an increase in effective power as well as fuel consumption. Sadat-Hosseini et al. [20] also worked on KVLCC2 form numerically in head waves to evaluate added resistance due to ship motions. Huang, Jiao and Chen [21] presented that bi-directional waves cause greater ship motions than the uni-directional waves by running sea keeping analyses for S175 hull form with various speeds and heading angles.
Available studies and applications on Double-M craft and five-hulled vessel, which are unconventional hull types, are very few. M Ship Company in the USA developed an extreme application on the tunneled planning hull with two tunnels (single-M hull) and four tunnels (double-M hull) prototypes, called the next generation hull type [22]. In the study of Mao et al. [23], the pitch and heave motions of the Double-M craft in the head waves are examined at different Fr numbers with the CFD method. The study emphasized that the Double-M craft had better seakeeping performance compared to a conventional planing hull with the same displacement. Most of the studies carried out on five-hull vessels are on the resistance and the separation and staggered hull variation. Waskito et al. [24], also studied interference effects on calm water resistance performance of pentamaran using experiments for Fr = 0.3–0.9 and noted that to produce meaningful changes in resistance, hull separation values should also be increased significantly. Sulistyawati and Pamitran [25] applied Michell’s thin ship theory on several different hull arrangements for the resistance optimization and the numerical results are compared with experimental ones. In addition to the fundamental studies in the literature about Double-M craft and pentamaran hulls, the resistance and seakeeping analyses will be carried out on a new, transversely arranged Double-M craft multi-hull of an award-winning Emergency Response and Rescue Vessel (ERRV) design to determine its feasibility under various wave condition and forward speeds. Results will provide insight into the resistance and seakeeping capabilities of this new multi-hull design.
This study exposes, in two main parts, the seakeeping responses and the added resistance prediction of a full-scale Double-M craft in regular waves using the CFD-URANS approach. The first part includes the investigation of the Delft 372 catamaran model advancing in calm water and regular waves to validate the present CFD approaches. The seakeeping simulations are carried out in head sea wave conditions with fifth-order Stokes wave with 2-DOF hull motions. The motion responses and added resistance results obtained from the computations carried out under identical conditions with the experimental studies performed in the literature were validated and showed an encouraging agreement with the available EFD. In the second part, the full-scale Double-M craft is investigated for the performances in regular wave conditions within the added resistance and 2-DOF motion responses. Furthermore, spatial convergence studies are conducted with Grid Convergence Index (GCI) to assess the uncertainty of the numerical resistance and seakeeping simulations for both Delft 372 catamaran and the full-scale Double-M craft. The effect of the increase in the number of hulls on these parameters was investigated by comparing the non-dimensional added resistance coefficient and motions obtained from two different multi-hull vessels.
Section 2 includes the design criteria and main dimensions of the Double-M craft, the main hull of which is an Emergency Response and Rescue Ship (ERRV) designed using the Delft 372 catamaran hull. The test conditions are also given in this section. The details of the numerical methodology for both calm water and in-waves situations are presented in Section 3. Section 5 includes validation and verification study both Delft 372 catamaran and full-scale Double-M craft. Whilst Section 6 presents the calm water results, Section 6 includes the motion responses, added resistance prediction of the full-scale Double-M craft, and speed loss evaluation. The conclusions and discussion of the paper are presented in Section 7.
2. Double-M Craft Design and Test Conditions
Ship forms, especially the high-speed vessels tend to have higher L/B ratios to get better hydrodynamic performances. One of the ways to increase the L/B ratio is to prefer multi-hull structures in ship design, leading to a reduction in resistance and a significant increase in deck area, payload, and operational capability. In addition, an improvement can be expected in terms of hydrodynamic performance, especially in terms of seakeeping considering the design criteria. The Double-M craft form, which is the subject of this article, is a preliminary design awarded in 2020 in the design competition organized by the Turkish Chamber of Shipping to develop the R&D and innovation culture in the maritime sector. The main idea behind the design is to produce a versatile vessel that could be used as the next generation of naval or research vessels. To realize this goal, important design parameters were identified as working in several sea conditions, high-speed operation capability, reasonable stability, and functionality with modular and flexible payload area.
The Double-M craft hull used in this study has a total of five hulls with four tunnels, consisting of two main (demi) hulls, two side hulls, and a center hull, in a transversely arranged form providing a larger deck area. The main hull is configured to planing feature, and other hulls have a geometry close to a flat plate while providing a small extent lift capability. The internal geometry of the tunnel is of conical form to increase the dynamic lift force and reduce the wetted area. The side hulls of the Double-M craft are the longitudinal half of the center hull. One of the ways to increase the reliability of the numerical solution in examining the chaotic flow around the five hulls and the interference of the hulls with each other is to establish the fundamental of the study on the benchmark model and its results. For this purpose, the main hulls of the prototype Double-M craft were chosen as the benchmark Delft 372 catamaran hull due to the existence of many numerical and experimental studies on the seakeeping performance [3,4,5,6]. The Delft 372 catamaran hull is designed by the Delft University of Technology as a fast catamaran, detailed information can be found in [1,26]. In this study, the resistance and seakeeping characteristics of the Delft 372 hull were successfully validated with those of EFD results. Then the hydrodynamic and seakeeping performance of the Double-M craft form were investigated. The lines plan of the Double-M craft, which was given design support using the Delft 372 catamaran hull as the main hull, is given in Figure 1. The hull definitions and arrangements of Double-M craft are illustrated in Figure 2 and the key properties of both Delft 372 catamaran and Double-M craft are also presented in Table 1. The distance between the main (demi) hulls in the Double-M craft form is the same as the L/B = 12.5 value of the Delft 372 catamaran, and the scale ratio of the full-scale Double-M craft is five. Due to the increase in the number of hulls, both 24% more rectangular deck area was gained and the payload capacity was increased.
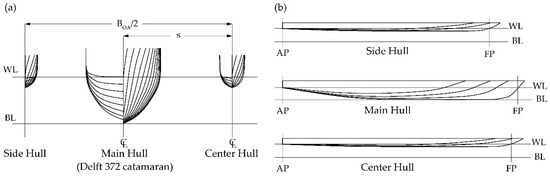
Figure 1.
Lines plan of Double-M craft (a) Body plan (b) Sheer plan.
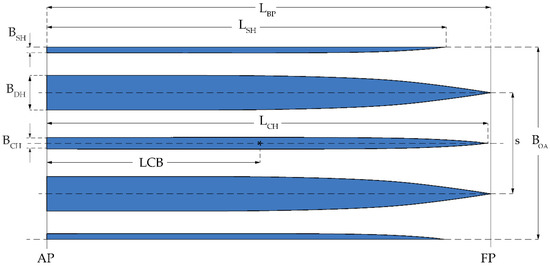
Figure 2.
Definitions of the center hull and side hulls arrangement.

Table 1.
Key features of the benchmark Delft catamaran model 372 and prototype full-scale Double-M craft design.
Within the scope of the study, regular wave computations of Delft 372 catamaran were performed with a constant Froude number (Fr = 0.7) and three different wave/ship length conditions. The wave/ship length ratios (λ/L) were selected as 1.00, 1.50, and 2.00 under identical conditions with the EFD results in the study of [4]. The main particulars of the Delft 372 catamaran seakeeping simulations are given in Table 2. The full-scale Double-M craft was examined at the same Froude number (Fr = 0.7), and λ/L ratios were selected in a wide long-wave range between 1.00 and 2.50. The value, where A is the wave amplitude, k is the wave number and calculated as , is constant and equal to 0.052. The test matrix of Double-M craft’s regular wave computations is also presented in Table 3.
Table 2.
Regular wave computations of Delft 372 catamaran: test matrix.
Table 3.
Regular wave computations of Double-M craft: test matrix.
3. Numerical Methodology for Seakeeping Tests
The methods and approximations applied in the CFD simulations are intended to reduce the numerical complexity of the computation and increase the convergence speed of the solution without compromising the accuracy. Therefore, in this section, the solution strategy of the governing equations, physical modeling of numerical wave tank, the properties, and grid structures of the computational domain are mentioned in detail, respectively.
3.1. Governing Equations
Continuity and RANS equations are used as governing equations which can be expressed as follows:
where is the pressure, is the fluid density, is the kinematic viscosity, and depict average velocity components while and represent fluctuating components in and direction.
In this study, the fundamental features of the flow field are 3-D, incompressible, unsteady, and fully turbulent. The governing equations used in solving transient simulations must be discretized in both space and time. In the discretization process, the Finite Volume Method (FVM), which transforms the mathematical model into an algebraic equation system [27] and is widely used in 3-D complex geometries, was preferred. Using the FVM, the computational domain is divided by a grid into small sub-control volumes (cells). Since the control volume balance does not limit the cell shape, the integral conservation is fully satisfied on the control volumes formed by the unstructured grid [28]. The resulting linear equations are then solved with an algebraic multiple solver. The nonlinear terms in the integral conservation equations of mass and momentum are solved sequentially and iteratively with the segregated flow solvers. The SIMPLE pressure-velocity coupling algorithm is employed to solve the pressure correction equation of the mass conservation constraint in the velocity field in the segregated flow solver [27,29]. In this study, the fully implicit unsteady scheme, which works stable in high time step size, was preferred in the temporal discretization of the governing equations. In temporal discretization performed iteratively at each time step before moving to the next time step, a second-order time integration was chosen. In spatial discretization, the second-order upwind scheme, which is one of the popular numerical schemes for convection, was preferred due to its superiority in terms of accuracy and stability [27]. The computations were performed by the commercial CFD code Siemens PLM STAR-CCM+ (v. 15.04.010-R8).
3.2. Physical Modeling
In the present study, there are two different kinds of fluid phases around the hull: freshwater was chosen as the heavy-fluid and air as the light-fluid. The fluids’ properties (density and viscosity) at 15 °C are taken from the ITTC recommended procedure [30]. The Volume of Fluid (VOF) method developed by Hirt and Nichols [31] for immiscible fluids was chosen to capture the phase separation surface between heavy and light fluids. This method ensures the gravity-induced surface waves to be tracked accurately and robustly in each time step [32]. The convective term in the transport of volume fraction equation was discretized using a special High-Resolution Interface-Capturing (HRIC) scheme to achieve a sharp interface between fluids [33]. The turbulent flow around the hulls is modeled with the Realizable Two-Layer k-ε scheme. This model combines the Realizable k-ε model with the two-layer approach. The variables in the models are the same, but the model gains the flexibility of an all y+ wall treatment [27]. It is also emphasized in [34,35] that it provides superior performance for flows involving rotation, boundary layers under strong pressure gradients, separation, and recirculation. The two-layer all-y+ wall treatment applies a hybrid approach in the viscous sublayer region that emulates the low-y+ wall treatment for fine meshes and the high-y+ wall treatment for coarse meshes [36,37].
The Dynamic Fluid Body Interaction (DFBI) module was chosen to simulate the ship motions. The advanced velocity and the motion feature is assigned to the region with the hull. The incident waves were generated by zero velocities and volume fraction of a fifth-order Stokes wave at the velocity inlet boundary. The progressive waves encounter a numerical forcing zone surrounding the solution domain. In the simulations with a wave treatment, a forcing coefficient can be adapted to the transport equations by the source term [38]. According to [39], chosen damping/forcing length improves the damping quality, and that choice may lead the user to change the domain sizes. Therefore, implementing the forcing zone at the boundaries will reduce the computational effort by preventing the wave reflections from the boundaries and facilitating the solution of the wave in this zone.
It is recommended that the Courant–Friedrichs–Lewy number (CFL) should be less than or equal to 0.5 on the free surface for the stability of time-dependent numerical methods [39]. Consequently, the time step of temporal discretization should be between 160 and 320 per encounter period in the presence of propagating wave [27]. In the study, the time step for a stable VOF wave model simulation was chosen as , where is the encounter period, which is lower than the recommended value of for regular waves in ITTC [40]. On the other hand, the time step for the standard pseudo-transient resistance computations was taken as , where U is the velocity, within the time step range recommended by the ITTC [40].
3.3. Numerical Wave Tank
The computational domain was divided into two regions: the background and the overset region, and the relation between the two regions is determined with the linear overset mesh interpolation scheme. Figure 3 shows the solution domain, a 3-D deep water wave tank in which the origin of the coordinate system is set in the fore perpendicular of the Double-M craft for specifying domain dimensions. In many numerical seakeeping studies, the dimensions of the computational domains are determined based on the ship length. However, in case the longitudinal length of the domain is insufficient for wavelengths several times the ship length, it is difficult to capture the hull-induced wave deformations on the ship wake region. Therefore, different from the available studies, the reference length of the domain in seakeeping simulations was selected according to the wavelength, not the ship length. Thus, the same number of waves was generated on the free surface of the computational domain for all cases. The inlet boundary is located 1.2 λ away from the fore perpendicular of the Double-M craft, while the outlet boundary was located 4 λ. The lateral boundary is 1.8 λ away from the centerline of Double-M craft. To provide deep water conditions, the distances of the top and bottom boundaries from the free surface were determined as L and 2 L, respectively, based on the ship length. The overset domain was defined as 6 D in height, 1.27 LBP in length and 0.8 B in width.
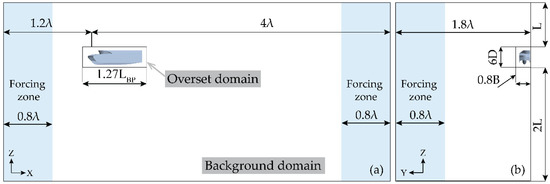
Figure 3.
The dimensions of computational domain: (a) XZ-plane, (b) YZ-plane.
As explained in the previous section the VOF wave forcing was applied to the boundaries and the forcing length xf was scaled proportionally to the wavelength. Eventually, the wave forcing layer is effective in a region of length at the boundaries.
The velocity inlet boundary condition derived from the Dirichlet boundary condition, which is suitable for incompressible flows with a specified velocity profile [41], was applied at the inflow boundary, the lateral boundary, and the top and bottom boundaries of the domain. At the outlet of the field, the pressure outlet boundary condition was applied, which fixes the pressure at the outlet and sets the velocity gradients to zero. This boundary condition is extensively useful where neither the flow rate nor the velocity is known. Since the flow field along the longitudinal centerline of the hull is symmetrical, this plane was defined as the symmetry plane. This boundary condition sets both the normal gradients of all variables and the normal velocity to zero [42]. Thus, computational costs are significantly reduced. In viscous flows, the no-slip wall condition is defined at the impermeable hull surface. In this boundary condition, the normal velocity at the wall is enforced to zero while the tangential velocity on the hull is equal to the wall velocity [41]. The boundary conditions defined in the study are shown in the computational domain in Figure 4.
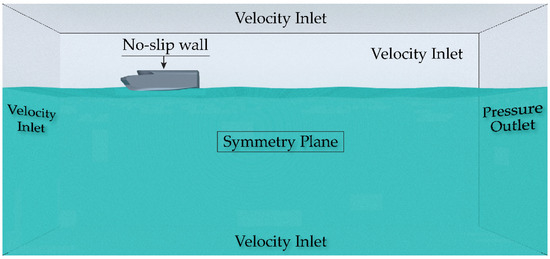
Figure 4.
Boundary conditions of the computational domain.
3.4. Mesh Generation
The region in which the flow phenomenon is to be computed should be discretized into sub-elements and represented with a discrete grid. The hexahedral trimmer mesh was adopted in the whole domain to perform the second-order upwind scheme for spatial derivatives. With adaptive mesh generation, the grid structure of critical regions requiring high accuracy was refined, while a coarser grid size was preferred for regions away from both the hull and free surface, where lower accuracy could be tolerated. Thus, excessive computational costs and solution time were avoided. In the resistance tests, the ship motions become stable towards the equilibrium state, while in the seakeeping tests, the hull has larger amplitudes and time-dependent, harmonic motion characteristics. Therefore, the overset mesh technique was preferred both to minimize the mesh distortion around the hull and to increase the convergence speed of the solution [43,44]. The computational domain includes mainly two mesh components, one for the domain and one for the overset region. The surface nodes of the two parts were connected using the overlap technique, and the full overlap between parts facilitates the convergence of the solution and ensures the continuity of the flow fields. Moreover, the overset model-driven Adaptive Mesh Refinement (AMR) technique was applied in the discrete domain to automatically match the cell sizes during the motion. Implementing AMR to the overset mesh is an effective way to update the grid structure that is distorted around the overlap due to ship motions. [27]. Thus, moving parts were modeled more comprehensively with the functionality of overset mesh feature. The cell numbers of Delft 372 catamaran and Double-M craft calm water simulations are about 3 and 4 M cells, respectively. While the cell number of Delft 372 catamaran used in seakeeping simulations was around 3 to 5 M, this number varied between 3 and 8 M depending on the wave characteristics in the Double-M craft analyses. The grid arrangement for the case λ/L = 1.50 is illustrated in Figure 5.
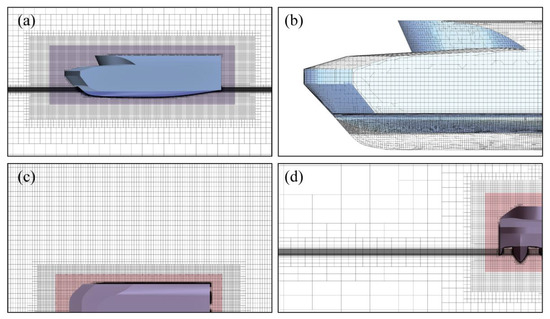
Figure 5.
Grid arrangement around the Double-M craft for λ/L = 1.50: (a) XZ-plane view, (b) Surface mesh view, (c) XY-plane view, (d) YZ-plane view.
Since the study includes the VOF wave model, a local mesh refinement was performed in the vicinity of the free surface. To model the free surface, the refinement region which has a height of 25% higher than the wave height was defined. Note that, the study of [27] recommends using 80–160 cells per wavelength and 16–32 cells per wave height. To well capture severe free surface deformation, a minimum of 80 points per wavelength and a minimum of 16 cells per wave height were defined in the vertical direction. Figure 6 shows the refined grid structure of the free surface adjusted to the wave height with generated wave profile. As emphasized in the study of [45], a coarser grid structure was preferred in the outlet zone to assist in the forcing zone application to prevent wave reflections from the outlet boundary.
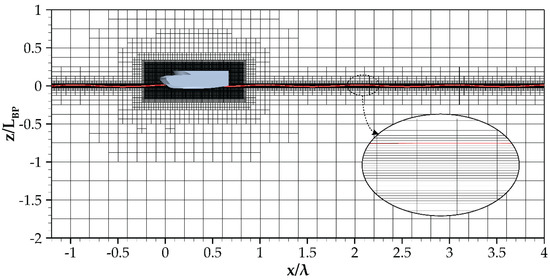
Figure 6.
Discretization of the free surface and generated wave profile on XZ-plane.
4. Comparison and Verification Study
Since many approximations are made in the computations, analyses should be re-simulated by changing the various properties of the simulation to verify that the modeling can be reproduced. On the other hand, the results obtained from the computations must be validated to show that they agree with the corresponding experiments. This section includes the validation of the results obtained from the resistance and seakeeping analyses carried out for the Delft 372 catamaran with those in the literature. Then, the reliability of the numerical models created for both Delft 372 catamaran and Double-M craft is determined by the spatial convergence analysis.
4.1. Comparison Study
Resistance analysis of the benchmark Delft 372 catamaran hull was numerically carried out in calm water. The results of the comparison study with the experimental ones in terms of resistance are given in Table 4. The comparison of the resistance results at Fr = 0.7 shows an encouraging agreement with the available EFD data.
Table 4.
Comparison of resistance tests in calm water for Delft 372 catamaran at Fr = 0.7.
The comparison study of the seakeeping performance of Delft 372 catamaran was performed in a range of λ/L (1.00, 1.50, and 2.00) at Fr = 0.7. Table 5 shows the comparison of numerical non-dimensional added resistance, trim, and sinkage values induced by regular waves with the EFD results of [4]. The Response Amplitude Operator (RAO) of motion responses, added resistance (), and added resistance coefficient (CAW) are described in detail in Section 6. It is noteworthy that the added resistance and motion characteristics of the Delft 372 catamaran, which has a dynamically time-dependent and harmonic motion, were compatible with each other, and the differences between EFD and CFD were at acceptable levels for seakeeping simulations.
Table 5.
Comparison of the seakeeping tests in regular waves for Delft 372 catamaran at Fr = 0.7.
As the λ/L increased, the difference between numerical and experimental results decreased, especially in terms of CAW. The numerical results obtained by the validation study were also compared with the seakeeping performance of the Double-M craft in Figures 13 and 14 and discussed in Section 6.
4.2. Verification Study
The uncertainty quantity on the mathematical model created to solve CFD problems is crucial for the reliability of numerical results. The effect of uncertainties on the numerical model should be investigated by a verification study. One of the main sources of uncertainty occurs from the grid structure. To estimate the uncertainties due to the grid structure, at least three groups of uniformly refined grids, fine, medium, and coarse, should be created to correspond at least to N1, N2, and N3 grid numbers. The numerical uncertainty value can be estimated by the Grid Convergence Index (GCI) method [46] over the relationship between the results of the key parameters obtained from each grid structure. The GCI method is widely used and a conventional method in spatial convergence study as shown in [47,48,49]. It should be noted that the results obtained from each grid structure must converge monotonically for the GCI method to be applied [50]. Detailed information on this method can be found in [46].
This study mainly includes the numerical examination of the resistance and seakeeping performance of Delft 372 catamaran and Double-M craft. Therefore, the discretization uncertainties which had occurred in the resistance and seakeeping simulations were examined in detail. The spatial convergence study was carried out with the GCI method using three different grid structures for each computation. In the verification study, the final results obtained from the analysis were used as key parameters. While the total resistance in the calm water was selected as the key parameter, the total resistance in the waves was selected in the seakeeping analysis.
According to the discretization error components of the spatial convergence study given in Table 6, it was found that the analyses for both the Delft form and the Double-M craft form converged monotonically (0 < R < 1). Finally, in the analyses simulated for two hulls, the discretization errors of fine-grid structures were found to be less than 1.59%.
Table 6.
Discretization error components of the spatial convergence study for Delft 372 catamaran and Double-M craft at Fr = 0.7.
5. Calm Water Resistance
In this section, the hydrodynamic characteristics (resistance and motion), which are in the first steps of the design spiral and give important details on the fundamental performance characteristics of the full-scale Double-M craft, were examined in detail. Moreover, resistance characteristics in the calm water are crucial as they are used in data reduction equations of the added resistance. Under these purposes, the full-scale preliminary design Double-M craft was tested for resistance in calm water starting from low speeds up to design speed. In resistance tests, the force acting on the hull, ship motions (heave and pitch) signals were stored in a wide time period in the region where the ship motion converges to values with a certain accuracy after a certain simulation time. The mean total resistance (RT) is expressed in non-dimensional form as follows:
Here, is the density of freshwater determined by the temperature of fluid according to [51]. S is the wetted surface area and U is the velocity of the hull model.
The total resistance in CFD consists of two parts: viscous force, pressure force. The viscous resistance coefficient (CV) is due to the shear stresses on the hull while the pressure resistance coefficient (CP) is comprised of residual resistance components which are essentially non-frictional, including the wave-making resistance, eddy-making resistance, and hull interaction resistance. Considering the resistance tests extrapolation procedure of High-Speed Marine Vehicles [52], also known as the 1957 ITTC method, the residual resistance characteristics (CR or CP) of both the model Delft 372 catamaran and the full-scale Double-M craft were compared each other for F = 0.70 in Table 7. The sinkage quantity () of the hull is given in Table 7 as non-dimensionalized by the ship length. A negative sinkage represents the downward direction of the hull relative to the free surface, while a positive trim () represents the upward movement of the bow. Here, it was determined that the Double-M craft has a relatively low residual resistance of 2.45% compared to the Delft catamaran. It should be noted that it is not possible to compare and evaluate CV and CT values since the Re numbers of the model scale Delft and the full-scale Double-M craft are different.
Table 7.
Resistance components of Delft 372 catamaran and Double-M craft for Fr = 0.7.
The calm water resistance characteristics of the Double-M craft are given in Table 8 and shown in Figure 7 with the motion characteristics. The total resistance coefficient (CT) increases until the Fr number is around 0.5 and then decreases with the effect of the lift force on the hull. In addition, friction resistance and hull interaction resistance due to the multi-hulls are factors that increase the total resistance. The full-scale Double-M craft has the highest sinkage in the region where CT reaches its peak value. Subsequently, as the Fr number increases, the lift force on the hull increases, and the sinkage quantity decreases. The trim values change from negative to positive trim and reach the peak value around Fr = 0.6. Afterwards, the trim value decreases and reaches the appropriate trim value at the design speed. It is seen in Figure 7 that the full-scale hull shows the semi-planing feature with the side hulls.
Table 8.
Calm water resistance and motion results of the full-scale Double-M craft.
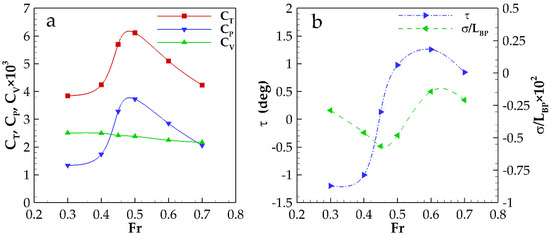
Figure 7.
The resistance components (a) and motion characteristics (b) of the full-scale Double-M craft in calm water.
Free surface deformations in the hydrodynamically pre-planing region, transition region, and planing region are given in Figure 8. As can be seen in Figure 8, the free surface deformations are well captured in each Fr numbers. As expected, as the Fr number increased, the wavelengths created by the hull increased. The CT curve is shown in Figure 7a, and the wave elevations given in Figure 8 indicate that the peak wave resistance was observed around Fr = 0.5 in line with each other.
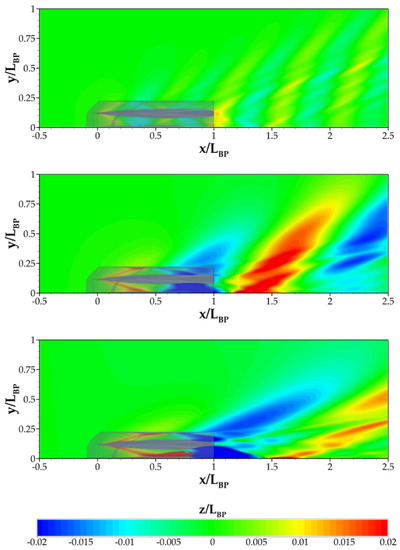
Figure 8.
Free surface deformations of the Double-M craft body in calm water, from top to bottom Fr = 0.3, Fr = 0.5 and Fr = 0.7, respectively.
In addition, in Figure 9, the air–water distribution on the tunnel flow through the Double-M craft is examined by analyzing the VOF view on different YZ sections. It can be observed that the side hulls, even though they do not directly generate hull lift, can assist in blocking the outward propagation of wave-making of the main hulls. Hence, the tunnels can absorb the internal wave energy to provide additional hull lift. On the other hand, the shielding effect of the side hulls can also reduce the airflow from escaping to the outside, which can partially help in increasing the aerodynamic lift inside the tunnels.
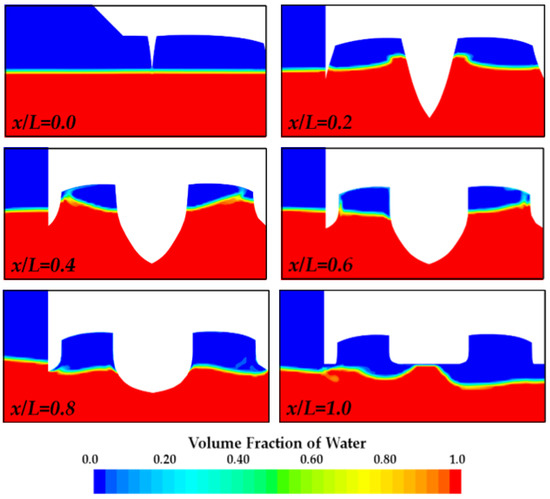
Figure 9.
The air-water distribution through the tunnels of the Double-M craft at each YZ section (Fr = 0.7).
6. Added Resistance and Motions in Waves
This section will outline the computation results of Double-M craft seakeeping simulations and will also provide some comparisons with EFD and CFD results of Delft 372 catamaran. The consistency between the wave defined theoretically and the wave generated in the domain was investigated firstly. A gauge measuring the wave height was placed at 0.8 λ from the fore perpendicular of the Double-M craft (Figure 10b).
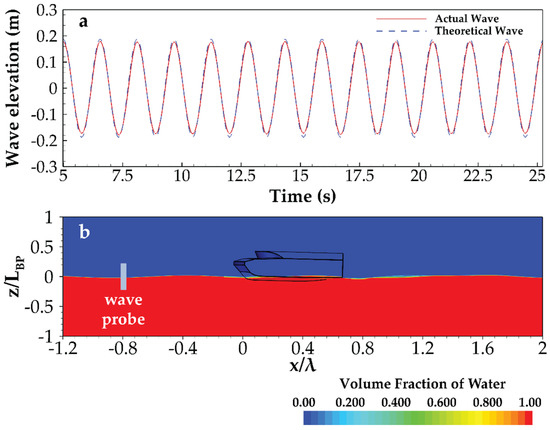
Figure 10.
Wave height measurement at x = −0.8 λ: (a) Comparison of the real wave with the theoretical wave. (b) The Volume Fraction of Water, λ/L = 1.50.
6.1. Seakeeping Performance Assessment
Figure 10a shows the time-dependent wave heights signal advancing towards the Double-M craft body. It was observed that the generated wave is nearly identical to the theoretical wave, and the wavelength and wave period are quite compatible with the theoretical wave ones. The average wave amplitude at this location was obtained by taking the root mean square of the time-dependent signal and calculating the peak value. The mean of numerical wave amplitude was calculated as 0.1756 m for the λ/L = 1.50, which underestimates the theoretical wave amplitude (A = 0.1875 m). While the deviation in wave height is around 5% in all simulations, the wavelengths are highly consistent with targeted wave characteristics. So, the fifth-order Stokes waves propagation featuring the forcing method is successfully modeled.
A full-scale Double-M craft model advancing in regular head waves of amplitude varies from 0.250 to 0.312 m and the wavelength varies from 15.00 to 37.50 m with a constant velocity corresponding to Froude number 0.7 were simulated. To achieve the added resistance in waves, the resistance in calm water is calculated and subtracted from the mean total resistance, i.e. resistance in waves. The time histories of computed heave and pitch motions for the Double-M craft in regular head waves are presented in Figure 11. The dashed blue line represents the mean values of the related motion response while the black line shows the peak value calculated by taking times the RMS (root mean square) value of the corresponding signal. Moreover, Figure 12 presents time histories and mean values of computed resistance in waves and its components, pressure, and friction forces. The mean value of the resistance in waves is shown with a dashed black line and the resistance in calm water is expressed with the other straight one. The added resistance, detailed later, is defined by the difference between the two values.
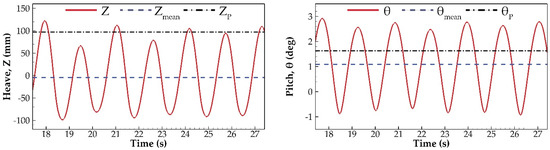
Figure 11.
Time histories of heave and pitch motions, λ/L = 1.50.
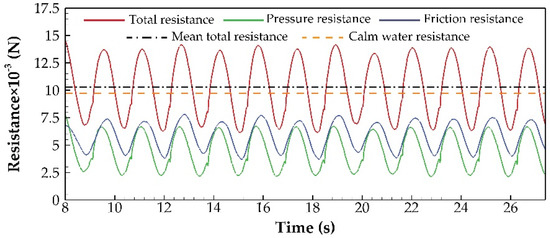
Figure 12.
Time histories of resistance in waves, λ/L = 1.50.
The radiating waves and the reflection or diffraction of progressive waves lead to the added resistance. The radiating waves are directly related to the vertical motions. In other words, as the ship’s motion increase, the radiation-induced resistance also increases [53].
The contribution of the second component, which is dependent on wave reflection (diffraction), to the added resistance, is less in long waves: increased ship motion due to longer waves increases the effect of the first component. In the presence of the short waves (λ/L < 0.5) according to the asymptotic formula given by [54], the effects of ship motions are the negligible component in added resistance.
From the above-mentioned application range, the wave radiation effect is expected to be the prevailing influence on the added resistance in the present study, and therefore the estimation of ship motions becomes a substantial issue. To figure out the effect of motion response, the resonance region and the relation between wavelength and ship length are the crucial parameters. Firstly, the encounter frequency of the Double-M craft for each wavelength is shown in Table 3. The encounter wave frequency for head seas, , is calculated by with gravitational acceleration g, wave length λ, and velocity U. The decoupled natural frequencies for heave and pitch are respectively described by the following equations [55]:
where is the restoring heave force and is the pitch moment. Here the frequency is calculated by and it is assumed that and . Among the expressions in the above equations, represents the density, is gravitational acceleration, is the moment of inertia in the y-axis and is the transverse second moment of area (or moment of inertia) of the waterplane. In the case of the full-scale Double-M craft where = 221,374.3 kg/m3, = 1039 m4, and = 63.983 m2, heave and pitch natural frequencies are estimated as 0.831 Hz and 0.763 Hz, respectively.
After all this preliminary information, it is known that the motion obtained in regions where the encounter frequency is equal to or close to the natural frequency is expected to be higher. Moreover, it is seen in the results of the studies conducted by some researchers on added resistance that maximum exciting forces were obtained when the λ/L ratio was around 1.33 [3,4,56,57].
The motion results were presented in non-dimensional form, and the data obtained were evaluated in the light of the information presented above. The pitch RAO is expressed as [58],
and the heave RAO can be calculated from the equation:
in which, is the mean pitch amplitude, is the mean wave amplitude, λ is the wavelength, and is the mean heave amplitude. Table 9 shows the heave and pitch RAO’s in a range of λ/L.
Table 9.
The response amplitude operators of motion responses for the Double-M craft.
Figure 13 depicts the response amplitudes including heave and pitch motions of the Delft 372 catamaran and full-scale Double-M craft to λ/L. The comparison showed that the motion responses obtained from the Double-M craft in all wave conditions were lower than that of the Delft 372 catamaran. In cases where only the ship length is equal to the wavelength, an almost similar response was obtained in the motion of both models.
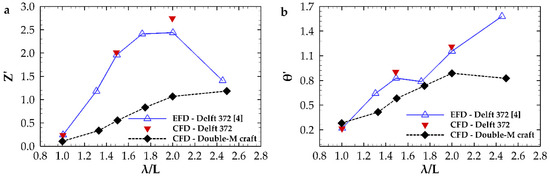
Figure 13.
Heave and pitch motion responses of Delft 372 catamaran and Double-M craft with Fr = 0.7 in head sea waves: (a) Heave RAO. (b) Pitch RAO.
In the studied range, the maximum heave motion was observed when the wavelength was 2.5 times the ship length. The study [20] indicated that the maximum heave motion is computed far from the point of λ/L = 1.33. Generally, studies indicate that the maximum response occurs when is achieved. However, this value was encountered in almost half of the natural frequency in this study. This λ/L range does not provide information about the direction in which heave motion will trend in long waves.
On the other hand, the maximum pitch motion was seen in the λ/L = 2 condition, with the corresponding encounter frequency of 0.511. As Simonsen et al. [57] stated, this result occurred in a region lower than the natural frequency ( = 0.76).
The total resistance in waves can be expressed as:
Here stands for the added resistance in waves; thus, it can be found by subtracting the calm water resistance, , from the total resistance in waves. Therefore, non-dimensional added resistance in waves is computed as:
where is the fluid density, is the gravitational acceleration, is the quadratic mean wave amplitude, B is the overall beam and LBP is the length between perpendiculars. An important point to note here is that the non-dimensional added resistance in waves for Delft 372 catamaran was calculated in the literature by taking into account the twice the demi-hull beam () instead of the overall beam (B). Similarly, the B value for the Double-M craft was calculated as follows to take into account the effects of all hulls:
The total resistance and non-dimensional added resistance characteristics of the Delft 372 catamaran hull, which were studied in three cases as λ/L = 1.00, 1.50, and 2.00 in Section 4.1, were found to be compatible with the EFD results.
In this section, the full-scale CFD analysis of Double-M craft seakeeping performance was compared with both the present CFD results and the EFD results in [4] of the Delft 372 catamaran hull. The present numerical results for the Double-M craft showed that the relative added resistance and the added resistance coefficients () were predicted smaller in all wave conditions as illustrated in Figure 14. In long waves, the effects of heave and pitch motions on added resistance are dominant. The decrease in the added resistance is consistent with the relatively lower motion responses of the Double-M craft. Figure 14a depicts the added resistance relative to the calm water resistance for Delft catamaran and Double-M craft. The relative added resistance of Double-M craft has a peak of about 7.54% at λ/L = 1.75. The added resistance coefficient computations are illustrated in Figure 14b. The maximum added resistance coefficient for Double-M craft was obtained at λ/L = 1.33. This point also corresponds to where the natural frequency is close to the encounter frequency . Other researches also stated that the added resistance reaches the peak when the λ/L is equal to 1.33 [3,59].
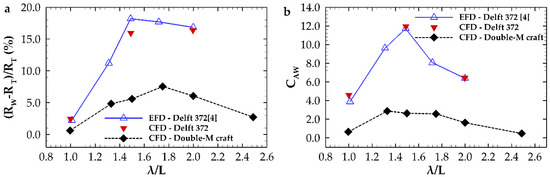
Figure 14.
Comparison of the total resistance and the added resistance coefficients of the Delft 372 catamaran and Double-M craft with Fr = 0.7 in head sea waves: (a) Added resistance relative to calm water resistance, (b) Added resistance coefficient.
6.2. Speed Loss Evaluation
In addition to estimating the added resistance of a ship, the determination of wind and wave-induced loss of speed is primarily required for energy efficiency measures. The speed loss for the Double-M craft was estimated under some assumptions at a certain head sea condition. Observing the available data in the literature seems that the propulsion system largely tested for the Delft 372 catamaran is the waterjet system [60,61], which can be also useful for the present ERRV design.
Note that the exposed estimation of the speed loss is carried out based on some assumptions. Specifically, the calculation assuming that the Delft catamaran and the Double-M ship have the same propulsion efficiency. Chen et al. [61] presented the performance of the Delft 372 catamaran with waterjet in terms of system efficiency. The overall performance coefficient () can be evaluated accordingly with the following formula.
where is the thrust deduction coefficient, is the jet efficiency, and is the duct efficiency. In the present study, the speed loss was evaluated at Fr = 0.7, so the thrust deduction coefficient has been modified accordingly with the available data on Kandasamy et al. [62]. This means that the overall performance coefficient for the Double-M craft in calm water at Fr = 0.7 is assumed to be 0.65.
The effective power () and the required brake power () for the Double-M craft in calm water were presented in Table 10. Instead, the required brake power in the head waves condition can be calculated by
where and are respectively the total resistance in waves and the speed in waves [63]. The speed loss evaluation is performed for the case λ/L=1.75 where the maximum total resistance is reached. Then, the speed in waves is estimated as m/s according to the relation . The speed loss can be defined as the difference between the speed in calm water and waves (). Finally, the speed loss is estimated as 1.156 Kn for the Double-M craft in the regular head wave where λ/L = 1.75.
Table 10.
Speed loss evaluation of the Double-M craft.
6.3. Free Surface Deformation Analysis in Waves
Figure 15 illustrates the free surface deformations caused by the Double-M craft advancing in head waves for different λ/L conditions at . Since the axes of Figure 15 are non-dimensionalized by the wavelength, there are the same numbers of the wave in the contour area, and the ship length becomes smaller as the wavelength increases. Furthermore, the generated wave (length and height) maintain their characteristics along the free water surface within the selected region. Preferred grid refinements and physical modeling to represent the wave characteristics have proven to be effective.
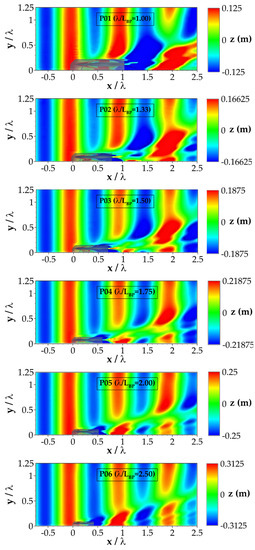
Figure 15.
The free surface deformations of the Double-M craft in head wave conditions at .
The wave deformations at the wake region (Figure 15) and the Volume of Fraction views on the YZ cross-section into the tunnels (Figure 16) show a relationship between the wave condition, the tunnel shape, and the seakeeping performance of the Double-M craft. The wave deformations in the ship wake region decreased, as can be seen in Figure 15. The divergent wave reaches the side hulls close to the fore perpendiculars (Figure 16), while in calm water the divergent wave reaches towards the midship (Figure 9). Furthermore, it can be noted that the diffraction waves increase the wave height in the tunnels at = 0.4 cross-sections and this could be related to the effect of the side hulls.
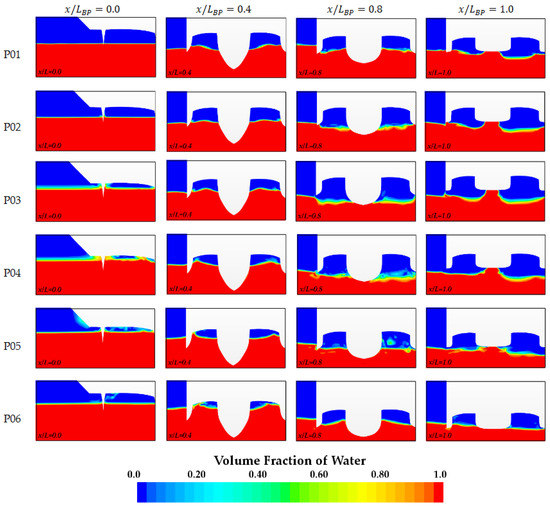
Figure 16.
The air-water distribution through the tunnels of the Double-M craft at each YZ section for the different regular wave conditions.
7. Conclusions and Future Work
This study is on both the resistance characteristics over a wide speed range and the seakeeping performance in long wave conditions of a preliminary design Emergency Response and Rescue Vessel (ERRV) hull at full-scale. The Double-M craft, which was designed as a semi-planning hull, was consist of two main hulls, one center hull, and two side hulls. The main hulls were chosen as the benchmark Delft 372 catamaran hull due to the existence of many numerical and experimental studies on seakeeping performance. The geometries of two side and one center hulls were designed to support the planing feature of the Double-M craft. The phenomenon of turbulent flow around the hull was simulated with the Realizable Two Layer k-ε scheme using the URANS method. In all numerical analyses, the hulls had two freedom of motion (pitch and heave).
The calm water was represented by the flat VOF wave, while the incident long waves were represented by the fifth-order Stokes wave. As a result of the calm water resistance tests in the wide range of Fr numbers (0.3 to 0.7), the service Fr number of the Double-M craft was determined as Fr = 0.7 and seakeeping simulations were performed in this Fr number. Both resistance simulations in calm water and seakeeping simulations in three different λ/L conditions of the Delft 372 catamaran were successfully verified and compared with available EFD results.
Seakeeping simulations of the Double-M craft were tested over a wide range of λ/L from 1.00 to 2.50 and at constant wave steepness (1/60). The Double-M craft, designed to achieve high L/B values, resulted in a significant reduction in added resistance and improvement in both pitch and heave values. The main impact of Double-M craft design on the added resistance is expressed by calculating the difference between relative added resistances of the CFD results of Delft 372 catamaran and Double M-craft. The obtained results showed that the relative added resistance change was small at λ/L =1, with a value of 1.98%. As the wavelength increased, the differences increased to 10.34% for λ/L = 1.5 and 10.33% for λ/L = 2. Moreover, 61.94%, 72.54%, and 60.54% reductions in non-dimensional heave amplitudes were achieved, respectively. In addition, the close result in pitch motion was observed in the region where the wavelength is equal to the ship length. The improvement of non-dimensional pitch amplitude for Double-M craft is observed; that is, 35.53% reduction at λ/L = 1.5 and 26.83% at λ/L = 2. Thus, it was concluded that the Double-M craft form, designed as a high-speed ERRV, will have a higher operational capability in waves with lower added resistance (and consequently speed loss), and will be more suitable for passenger and crew health thanks to the reduced motion responses.
It can be said that the preferred methods for estimating the seakeeping performance of multi-hull vessels with similar design characteristics are successful. Furthermore, the results conclude that the added resistance and motion responses show great potential in developing an effective design for an Emergency Response and Rescue Vessel (ERRV) with five hulls.
The maneuvering characteristics of the Double-M craft will be examined as a future study.
Author Contributions
Conceptualization, C.D. and D.O.; methodology, C.D., D.O., and S.M.; software, C.D., D.O., and S.M.; validation, C.D., D.O., and S.M.; formal analysis, C.D. and D.O.; investigation, C.D. and M.O.S.; resources, C.D.; data curation, D.O.; writing—original draft preparation, C.D., D.O., M.O.S., and T.H.; writing—review and editing, C.D., D.O., and S.M.; visualization, C.D., D.O., and M.O.S.; supervision, C.D. and S.M.; All authors have read and agreed to the published version of the manuscript.
Funding
This research received no external funding.
Institutional Review Board Statement
Not applicable.
Informed Consent Statement
Not applicable.
Data Availability Statement
Not applicable.
Acknowledgments
The authors are appreciative to the Turkish Chamber of Shipping for their interest and support for the designed Emergency Response and Rescue Vessel (ERRV). The authors are grateful to Kadir Sariöz for his assistance in the design process of a next-generation ship.
Conflicts of Interest
The authors declare no conflict of interest.
Nomenclatures and Abbreviations
| (x,y,z) | Non-inertial ship-fixed coordinates |
| 3-D | Three dimensional |
| A | Wave amplitude |
| BCH | Beam center hull (m) |
| BDH | Beam demihull/main hull (m) |
| BOA | Beam overall (m) |
| BSH | Beam side hull (m) |
| C33 | Restoring heave force (N/m) |
| C55 | Pitch moment (Nm) |
| CAW | Added resistance coefficient (-) |
| CB | Block coefficient (-) |
| CFD | Computational Fluid Dynamics |
| CFL | Courant–Friedrichs–Lewy |
| CL | Centerline |
| CP | Pressure resistance coefficient (-) |
| CV | Viscous resistance coefficient (-) |
| CT | Total resistance coefficient (-) |
| DFBI | Dynamic Fluid Body Interaction |
| DOF | Degree of Freedom |
| ea21 | Approximate relative error (%) |
| EERV | Emergency Response and Rescue Vessel |
| eext21 | Extrapolated relative error (%) |
| EFD | Experimental Fluid Dynamics |
| fe | Encounter frequency (Hz) |
| fext21 | Extrapolated values (-) |
| Fr | Froude number (-) |
| Fr∇ | Volumetric Fr number |
| FVM | Finite Volume Method |
| g | Gravity constant (m/s2) |
| GCI | Grid Convergence Index |
| H | Wave height (m) |
| h | Tunnel height (m) |
| HRIC | High-Resolution Interface-Capturing |
| I55 | Moment of inertia in y-axis (kg/m3) |
| IT | Transverse second moment of area of the waterplane (m4) |
| ITTC | International Towing Tank Conference |
| k | Wave number |
| KG | Vertical center of gravity (m) |
| L, LBP | Length between perpendiculars (m) |
| LCB | Longitudinal Center of Buoyancy (aft of FP, m) |
| LCH | Length waterline of center hull (m) |
| LSH | Length waterline of side hulls (m) |
| N1, N2, N3 | Fine, medium, and coarse grid (-) |
| PB | Break power (W) |
| PE | Effective power (W) |
| Pest | Estimated order of accuracy (-) |
| R | Convergence ratio (-) |
| R&D | Research and Development |
| RMS | Root mean square |
| (U)RANS | (Unsteady) Reynolds Averaged Navier-Stokes |
| RAO | Response amplitude operator |
| Raw | Added resistance |
| Rcw | Calm water resistance |
| Re | Reynolds number (-) |
| ri+1, i | Refinement factor (-) |
| RT | Total resistance in calm water (N) |
| RW | Total resistance in waves (N) |
| S | Ship wetted surface (m2) |
| s | Distance between the demihull centers (m) |
| SIMPLE | Semi-Implicit Method for Pressure-Linked Equations |
| T | Design draft (m) |
| t | Thrust deduction factor (-) |
| Te | Encounter period (s) |
| U | Free-stream velocity (m/s) |
| VOF | Volume of Fluid |
| xf | Forcing length (m) |
| y+ | Non-dimensional wall distance (-) |
| Z | Mean heave amplitude [mm] |
| Z′ | Heave RAO (-) |
| Δ | Displacement [kg] |
| ΔRwave | Added resistance in waves (N) |
| Δt | Physical time step (s) |
| ε | Turbulence dissipation rate (m2/s2) |
| ζA | Mean wave amplitude (mm) |
| ηduct | Ducting efficiency (-) |
| ηjet | Jet efficiency (-) |
| ηT | Overall performance efficiency (-) |
| θ | Mean pitch amplitude [deg] |
| θ′ | Pitch RAO (-) |
| λ | Wavelength (m) |
| ν | Kinematic viscosity (m2/s) |
| ρ | Fluid density (kg/m3) |
| σ | Sinkage in calm water (mm) |
| τ | Trim in calm water (deg) |
References
- vant Veer, R. Experimental Results of Motions, Hydrodynamic Coefficients and Wave Loads on the 372 Catamaran Model; Delft University of Technology: Wageningen, The Netherlands, 1998. [Google Scholar]
- He, W.; Castiglione, T.; Kandasamy, M.; Stern, F. Numerical analysis of the interference effects on resistance, sinkage and trim of a fast catamaran. J. Mar. Sci. Technol. 2014, 20, 292–308. [Google Scholar] [CrossRef]
- Castiglione, T.; Stern, F.; Bova, S.; Kandasamy, M. Numerical investigation of the seakeeping behavior of a catamaran ad-vancing in regular head waves. Ocean Eng. 2011, 38, 1806–1822. [Google Scholar] [CrossRef]
- Bouscasse, B.; Broglia, R.; Stern, F. Experimental investigation of a fast catamaran in head waves. Ocean Eng. 2013, 72, 318–330. [Google Scholar] [CrossRef]
- He, W.; Diez, M.; Zou, Z.; Campana, E.F.; Stern, F. URANS study of Delft catamaran total/added resistance, motions and slamming loads in head sea including irregular wave and uncertainty quantification for variable regular wave and geometry. Ocean Eng. 2013, 74, 189–217. [Google Scholar] [CrossRef]
- Doğrul, A.; Kahramanoğlu, E.; Çakıcı, F. Numerical prediction of interference factor in motions and added resistance for Delft catamaran 372. Ocean Eng. 2021, 223, 108687. [Google Scholar] [CrossRef]
- Li, A.; Li, Y.; Zhang, D.; Fu, Z. Numerical study on hydrodynamic coefficients and longitudinal motions of trimaran in head seas for various wave slopes. J. Braz. Soc. Mech. Sci. Eng. 2020, 42, 1–14. [Google Scholar] [CrossRef]
- Nowruzi, L.; Enshaei, H.; Lavroff, J.; Kianejad, S.S.; Davis, M.R. CFD Simulation of Motion Response of a Trimaran in Regular Head Waves. Int. J. Marit. Eng. 2020, 162, 91. [Google Scholar] [CrossRef]
- Duan, W.; Wang, S.; Ma, S. Verification of application of the 2.5D method in high-speed trimaran vertical motion and added resistance prediction. Ocean Eng. 2019, 187, 106177. [Google Scholar] [CrossRef]
- Gong, J.; Yan, S.; Ma, Q.; Li, Y. Added resistance and seakeeping performance of trimarans in oblique waves. Ocean Eng. 2020, 216, 107721. [Google Scholar] [CrossRef]
- Sun, H.; Zou, J.; Sun, Z.; Lu, S. Numerical Investigations on the Resistance and Longitudinal Motion Stability of a High-Speed Planing Trimaran. J. Mar. Sci. Eng. 2020, 8, 830. [Google Scholar] [CrossRef]
- Ghadimi, P.; Nazemian, A.; Karam, S. Numerical simulation of the seakeeping of a military trimaran hull by a novel overset mesh method in regular and irregular waves. Sci. J. Marit. Univ. Szczec. 2021, 65, 38–50. [Google Scholar]
- Nazemian, A.; Ghadimi, P. Multi-objective optimization of trimaran sidehull arrangement via surrogate-based approach for reducing resistance and improving the seakeeping performance. Proc. Inst. Mech. Eng. Part M J. Eng. Marit. Environ. 2020, 1475090220980275. [Google Scholar] [CrossRef]
- Nazemian, A.; Ghadimi, P. Global optimization of trimaran hull form to get minimum resistance by slender body method. J. Braz. Soc. Mech. Sci. Eng. 2021, 43, 1–20. [Google Scholar] [CrossRef]
- Yildiz, B.; Sener, B.; Duman, S.; Datla, R. A numerical and experimental study on the outrigger positioning of a trimaran hull in terms of resistance. Ocean Eng. 2020, 198, 106938. [Google Scholar] [CrossRef]
- Caprio, F.; Migali, A.; Pensa, C. Staggered Catamarans: Experimental data and feasibility study for environment friendly service. In Proceedings of the 12 International Congress of the International Maritime Association of the Mediterranean (Imam 2005), Lisboa, Portugal, 26–30 September 2005. [Google Scholar]
- Vernengo, G.; Villa, D.; Bruzzone, D.; Bonfiglio, L. A study on the added resistance of a catamaran advancing in waves considering variations of both operating and geometric parameters. Ships Offshore Struct. 2021, 16, 334–352. [Google Scholar] [CrossRef]
- Guo, B.; Steen, S.; Deng, G. Seakeeping prediction of KVLCC2 in head waves with RANS. Appl. Ocean Res. 2012, 35, 56–67. [Google Scholar] [CrossRef]
- Tezdogan, T.; Demirel, Y.K.; Kellett, P.; Khorasanchi, M.; Incecik, A.; Turan, O. Full-scale unsteady RANS CFD simulations of ship behaviour and performance in head seas due to slow steaming. Ocean Eng. 2015, 97, 186–206. [Google Scholar] [CrossRef]
- Sadat-Hosseini, H.; Wu, P.-C.; Carrica, P.M.; Kim, H.; Toda, Y.; Stern, F. CFD verification and validation of added resistance and motions of KVLCC2 with fixed and free surge in short and long head waves. Ocean Eng. 2013, 59, 240–273. [Google Scholar] [CrossRef]
- Huang, S.; Jiao, J.; Chen, C. CFD prediction of ship seakeeping behavior in bi-directional cross wave compared with in uni-directional regular wave. Appl. Ocean Res. 2020, 107, 102426. [Google Scholar] [CrossRef]
- M Ship Co. Trials Programme of M80 Starts in California, Fast Ferry International; M Ship Co.: San Diego, CA, USA, 2006. [Google Scholar]
- Mao, X.; Yan, L.; Shen, X.; Yu, Z. Study on the seakeeping of the wave-absorbing double m-craft in waves based on cfd. In Proceedings of the International Offshore and Polar Engineering Conference, Honolulu, HI, USA, 16–21 June 2019; pp. 2887–2895. [Google Scholar]
- Yanuar, I.; Waskito, K.T.; Karim, S.; Ichsan, M. Interference resistance of pentamaran ship model with asymmetric outrigger configurations. J. Mar. Sci. Appl. 2017, 16, 42–47. [Google Scholar] [CrossRef]
- Sulistyawati, W.; Yanuar, P.A.S. Michell’s thin ship theory in optimisation of warp-chine on pentamaran configuration. J. Appl. Fluid Mech. 2020, 13, 909–921. [Google Scholar] [CrossRef]
- Vant Veer, R. Experimental Results of Motions and Structural Loads on the 372 Catamaran Model in Head and Oblique Waves, 1130; TU Delft Rep: Wageningen, The Netherlands, 1998. [Google Scholar]
- CD-Adapco, S. STAR CCM+ User Guide Version 14.02; CD-Adapco: New York, NY, USA, 2017. [Google Scholar]
- Patankar, S.V. Numerical Heat Transfer and Fluid Flow; CRC Press: Boca Raton, FL, USA, 2018. [Google Scholar]
- Bekhit, A.; Lungu, A. URANSE simulation for the Seakeeping of the KVLCC2 Ship Model in Short and Long Regular Head Waves. In Proceedings of the IOP Conference Series: Materials Science and Engineering; IOP Publishing: Bristol, UK, 2019; Volume 591, p. 12102. [Google Scholar]
- ITTC. Fresh Water and Seawater Properties—7.5-02-01-03. In Proceedings of the 26th International Towing Tank Conference, Rio De Janeiro, Brazil, 28 August–3 September 2011. [Google Scholar]
- Hirt, C.; Nichols, B. Volume of fluid (VOF) method for the dynamics of free boundaries. J. Comput. Phys. 1981, 39, 201–225. [Google Scholar] [CrossRef]
- Katopodes, N.D. Volume of Fluid Method. In Free-Surface Flow (ed NDBT-F-SF Katopodes); Butterworth-Heinemann: Oxford, UK, 2019; pp. 766–802. [Google Scholar] [CrossRef]
- Muzaferija, S. A two-fluid Navier-Stokes solver to simulate water entry. In Proceedings of the 22nd Symposium on Naval Archi-tecture; National Academy Press: Washington, DC, USA, 1999; pp. 638–651. [Google Scholar]
- Shih, T.-H.; Liou, W.W.; Shabbir, A.; Yang, Z.; Zhu, J. A new k-ϵ eddy viscosity model for high reynolds number turbulent flows. Comput. Fluids 1995, 24, 227–238. [Google Scholar] [CrossRef]
- ANSYS, I. ANSYS Fluent Theory Guide, Release 19.1; ANSYS Inc: Canonsburg, PA, USA, 2018. [Google Scholar]
- Sezen, S.; Cakici, F. Numerical Prediction of Total Resistance Using Full Similarity Technique. China Ocean Eng. 2019, 33, 493–502. [Google Scholar] [CrossRef]
- Davis, P.L.; Rinehimer, A.T.; Uddin, M. A comparison of RANS-based turbulence modeling for flow over a wall-mounted square cylinder. In Proceedings of the 20th Annual Conference of the CFD Society of Canada, Canmore, AB, Canada, 9–11 May 2012. [Google Scholar]
- Perić, R.; Abdel-Maksoud, M. Analytical prediction of reflection coefficients for wave absorbing layers in flow simulations of regular free-surface waves. Ocean Eng. 2018, 147, 132–147. [Google Scholar] [CrossRef]
- Peric, R.; Abdel-Maksoud, M. Reliable damping of free-surface waves in numerical simulations. Ship Technol. Res. 2016, 63, 1–13. [Google Scholar] [CrossRef]
- ITTC. Practical guidelines for ship CFD applications—7.5-03-02-03. In Proceedings of the 26th International Towing Tank Conference, Rio De Janeiro, Brazil, 28 August–3 September 2011. [Google Scholar]
- Moukalled, F.; Mangani, L.; Darwish, M. The Finite Volume Method in Computational Fluid Dynamics; Springer Science and Business Media LLC: Berlin, Germany, 2016. [Google Scholar]
- Delen, C.; Can, U.; Bal, S. Prediction of Resistance and Self-Propulsion Characteristics of a Full-Scale Naval Ship by CFD-Based GEOSIM Method. J. Ship Res. 2020, 1–16. [Google Scholar] [CrossRef]
- Cakici, F.; Sukas, O.F.; Kinaci, O.K.; Alkan, A.D. Prediction of the Vertical Motions of Dtmb 5415 Ship Using Different Numerical Approaches. Brodogradnja 2017, 68, 29–44. [Google Scholar] [CrossRef]
- Cakici, F.; Kahramanoglu, E.; Duman, S.; Alkan, A.D. A new URANS based approach on the prediction of vertical motions of a surface combatant in head waves. Ocean Eng. 2018, 162, 21–33. [Google Scholar] [CrossRef]
- Ozturk, D. Performance of a Magnus effect-based cylindrical roll stabilizer on a full-scale Motor-yacht. Ocean Eng. 2020, 218, 108247. [Google Scholar] [CrossRef]
- Celik, I.B.; Ghia, U.; Roache, P.J.; Freitas, C.J.; Coleman, H.; Raad, P.E. Procedure for Estimation and Reporting of Uncertainty Due to Discretization in CFD Applications. J. Fluids Eng. 2008, 130, 78001–78004. [Google Scholar] [CrossRef]
- Soydan, A.; Bal, S. An investigation of scale effects on marine propeller under cavitating and non-cavitating conditions. Ship Technol. Res. 2021, 1–13. [Google Scholar] [CrossRef]
- Uzun, D.; Sezen, S.; Ozyurt, R.; Atlar, M.; Turan, O. A CFD study: Influence of biofouling on a full-scale submarine. Appl. Ocean Res. 2021, 109, 102561. [Google Scholar] [CrossRef]
- De Luca, F.; Mancini, S.; Miranda, S.; Pensa, C. An Extended Verification and Validation Study of CFD Simulations for Planing Hulls. J. Ship Res. 2016, 60, 101–118. [Google Scholar] [CrossRef]
- Stern, F.; Wilson, R.V.; Coleman, H.W.; Paterson, E.G. Comprehensive Approach to Verification and Validation of CFD Simulations—Part 1: Methodology and Procedures. J. Fluids Eng. 2001, 123, 793–802. [Google Scholar] [CrossRef]
- ITTC. Fresh Water and Seawater Properties—7.5-02-02-01.02. In Proceedings of the 26th International Towing Tank Conference, Rio Janeiro, Brazil, 28 August–3 September 2011. [Google Scholar]
- ITTC. High-Speed Marine Vehicles Resistance Test—7.5-02-05-01. In Proceedings of the 28th International Towing Tank Conference, Wuxi, China, 17–22 September 2017; pp. 1–19. [Google Scholar]
- El Moctar, O.; Sigmund, S.; Ley, J.; Schellin, T.E. Numerical and experimental analysis of added resistance of ships in waves. J. Offshore Mech. Arct. Eng. 2017, 139. [Google Scholar] [CrossRef]
- Faltinsen, O.M.; Minsaas, K.J.; Liapis, N.; Skjordal, S.O. Prediction of Resistance and Propulsion of a Ship in a Seaway. In Proceedings of the 13th symposium on naval hydrodynamics, Tokyo, Japan, 6–10 October 1980; pp. 505–529. [Google Scholar]
- Lewis, E.V. Principles of Naval Architecture Second Revision Volume III Motions in Waves and Controllability; Society of Naval Architects and Marine Engineers (SNAME): Alexandria, VA, USA, 1989. [Google Scholar]
- Fonseca, N.; Soares, C.G. Experimental Investigation of the Nonlinear Effects on the Vertical Motions and Loads of a Containership in Regular Waves. J. Ship Res. 2004, 48, 118–147. [Google Scholar] [CrossRef]
- Simonsen, C.D.; Otzen, J.F.; Joncquez, S.; Stern, F. EFD and CFD for KCS heaving and pitching in regular head waves. J. Mar. Sci. Technol. 2013, 18, 435–459. [Google Scholar] [CrossRef]
- ITTC. Seakeeping Experiments -7.5-02-07-02.01. In Proceedings of the 28th International Towing Tank Conference, Wuxi, China, 17–22 September 2017; China Ocean Press: Beijing, China, 2017. [Google Scholar]
- Stern, F.; Carrica, P.; Kandasamy, M.; Ooi, S. Computational hydrodynamic tools for high-speed sealift: Phase II final report. IIHR Tech. Rep. 2008. Available online: https://www.semanticscholar.org/paper/Computational-Hydrodynamic-Tools-for-High-Speed-II-Stern-Carrica/15bcac9d7c14a6cea822ad851d29fd9ab457f0e4#citing-papers (accessed on 13 April 2021).
- Kandasamy, M.; Peri, D.; Tahara, Y.; Wilson, W.; Miozzi, M.; Georgiev, S.; Milanov, E.; Campana, E.F.; Stern, F. Simulation based design optimization of waterjet propelled Delft catamaran. Int. Shipbuild. Prog. 2013, 60, 277–308. [Google Scholar]
- Chen, X.; Diez, M.; Kandasamy, M.; Campana, E.F.; Stern, F. Design optimization of the waterjet-propelled Delft Catamaran in calm water using URANS, design of experiments, metamodels and swarm intelligence. In Proceedings of the 12th International Conference on Fast Sea Transportation (FAST2013), Amsterdam, The Netherlands, 2–5 December 2013. [Google Scholar]
- Kandasamy, M.; Georgiev, S.; Milanov, E.; Stern, F. 2011 Numerical and experimental evaluation of waterjet propelled delft catamarans. In Proceedings of the 11th International Conference on Fast Sea Transportation FAST, Honolulu, HI, USA, 26–29 September 2011. [Google Scholar]
- Kim, M.; Hizir, O.; Turan, O.; Day, S.; Incecik, A. Estimation of added resistance and ship speed loss in a seaway. Ocean Eng. 2017, 141, 465–476. [Google Scholar] [CrossRef]
Publisher’s Note: MDPI stays neutral with regard to jurisdictional claims in published maps and institutional affiliations. |
© 2021 by the authors. Licensee MDPI, Basel, Switzerland. This article is an open access article distributed under the terms and conditions of the Creative Commons Attribution (CC BY) license (https://creativecommons.org/licenses/by/4.0/).